Embed Size (px)
Citation preview
1
Weekly Newsletter September 14, 2012 www.desjardins.com/economics
NOTE TO READERS: The letters k, M and B are used in texts and tables to refer to thousands, millions and billions respectively.IMPORTANT: This document is based on public information and may under no circumstances be used or construed as a commitment by Desjardins Group. While the information provided has been determined on the basis of data obtainedfrom sources that are deemed to be reliable, Desjardins Group in no way warrants that the information is accurate or complete. The document is provided solely for information purposes and does not constitute an offer or solicitation forpurchase or sale. Desjardins Group takes no responsibility for the consequences of any decision whatsoever made on the basis of the data contained herein and does not hereby undertake to provide any advice, notably in the area ofinvestment services. The data on prices or margins are provided for information purposes and may be modified at any time, based on such factors as market conditions. The past performances and projections expressed herein are noguarantee of future performance. The opinions and forecasts contained herein are, unless otherwise indicated, those of the document's authors and do not represent the opinions of any other person or the official position of DesjardinsGroup. Copyright © 2012, Desjardins Group. All rights reserved.
September 14, 2012
Federal Reserve launches QE3
CONTENTS
Key statistics of the week ............................................... 2United StatesCanada
Financial markets ........................................................... 3A look ahead ................................................................... 4Economic indicators of the week ................................... 6Statistical appendix
Economic and financial indicators ............................. 8Bond markets ............................................................ 12Currency market ....................................................... 14Stock markets ........................................................... 16
HIGHLIGHTS• The Fed launches a new round of quantitative easing and pushes back its outlook for an initial interest rate hike to 2015.• United States: Industrial production plummets, and retail sales excluding gasoline slow considerably.• Rising gas prices boost inflation in the United States.• U.S. consumer confidence rallies in September, according to the University of Michigan.• Canada: A surprising rebound in housing starts.• Canada: Manufacturing sales lose ground in July.
A LOOK AHEAD• United States: Housing starts and sales of existing homes should report increases in August.• A slight dip in the U.S. leading indicator is anticipated.• Canada: The total annual inflation rate could remain at 1.3%.
FINANCIAL MARKETS• The Federal Reserve reinvigorates markets with the announcement of new asset purchases.• Sharp correction in long-term U.S. bonds.• U.S. dollar jettisoned.
514-281-2336 or 1 866 866-7000, ext. 2336E-mail: [email protected]
François Dupuis Yves St-MauriceVice-President and Chief Economist Senior Director and Deputy Chief Economist
Mathieu D’Anjou Benoit P. Durocher Francis Généreux Jimmy Jean Hendrix VachonSenior Economist Senior Economist Senior Economist Senior Economist Senior Economist
Sources: Bloomberg and Desjardins, Economic Studies
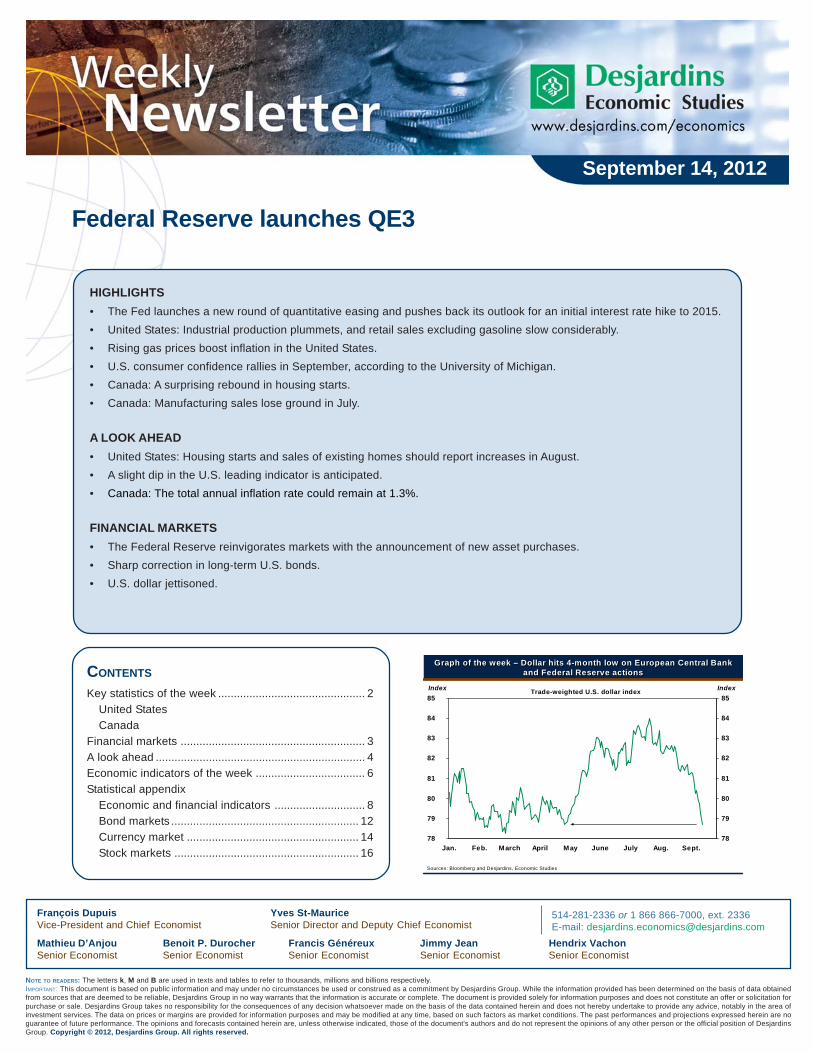
Graph of the week – Dollar hits 4-month low on European Central Bank and Federal Reserve actions
Graph of the week – Dollar hits 4-month low on European Central Bank and Federal Reserve actions
78
79
80
81
82
83
84
85
Jan. Feb. March April May June July Aug. Sept.78
79
80
81
82
83
84
85 Index IndexTrade-weighted U.S. dollar index
2
Weekly Newsletter September 14, 2012 www.desjardins.com/economics
KEY STATISTICS OF THE WEEK
UNITED STATES
• Retail sales rose 0.9% in August, the biggest increase sinceFebruary. July’s gain was 0.6%. Motor vehicle sales rose1.3%. With automobiles excluded, sales are up 0.8%, as inJuly. August’s solid performance by retail sales is mislead-ing. Two thirds of the 0.9% gain can be entirely chalked upto the rise in gas prices which inflated service-station sales.Sales by other types of retailers are much more modest.
• Consumer confidence seems to have improved in Septem-ber, probably thanks to the strong performance by the stockmarkets, which offset the negative effect of rising gas prices.Consequently, the preliminary version of the University ofMichigan confidence index is up, from 74.3 to 79.2. It wasthe expectations component that gained the most ground inSeptember.
• Industrial production tumbled 1.2% in August after gaining0.5% in July. Manufacturing production retreated by 0.7%.Mining activity dropped 1.8%, while energy production con-tracted by 3.6%. The 1.2% tumble by industrial production isastonishing even though the ISM manufacturing index hadpointed towards some softening. Nearly all of the segmentsof the manufacturing industry are on the decline, but the big-gest bite comes from the auto sector, where production fell4.0%. It is also astounding to see energy production thisweak, as August was fairly hot, but Hurricane Issac inter-rupted some activity at the end of the month.
• The consumer price index (CPI) advanced 0.6% in Augustfollowing two months of stagnation. The rise comes fromenergy prices, which jumped 5.6%, the biggest increase sinceJune 2009. The core index, which excludes food and en-ergy, ticked up 0.1% in August. The annual change to thetotal CPI accelerated from 1.4% to 1.7%. Core inflationslowed from 2.1% to 1.9%.
• Consumer credit was disappointing in July, contracting byUS$3.3B after a US$9.8B gain in June. The strong perfor-mance by retail sales and the start of the upswing in gasprices at the end of the month had suggested a better num-ber. The weakness came entirely from revolving credit (cardsand lines of credit), while term loans rose slightly.
• The U.S. trade balance held steady in July: the deficit camein at US$42.0B, after reaching US$41.9B in June. After asharp gain of 1.5%, nominal exports fell by 1.0%. Importsshowed their fourth straight decline, this time a drop of 0.8%.This latest slump comes mainly from crude oil (-6.5%).
Francis GénéreuxSenior Economist
CANADA
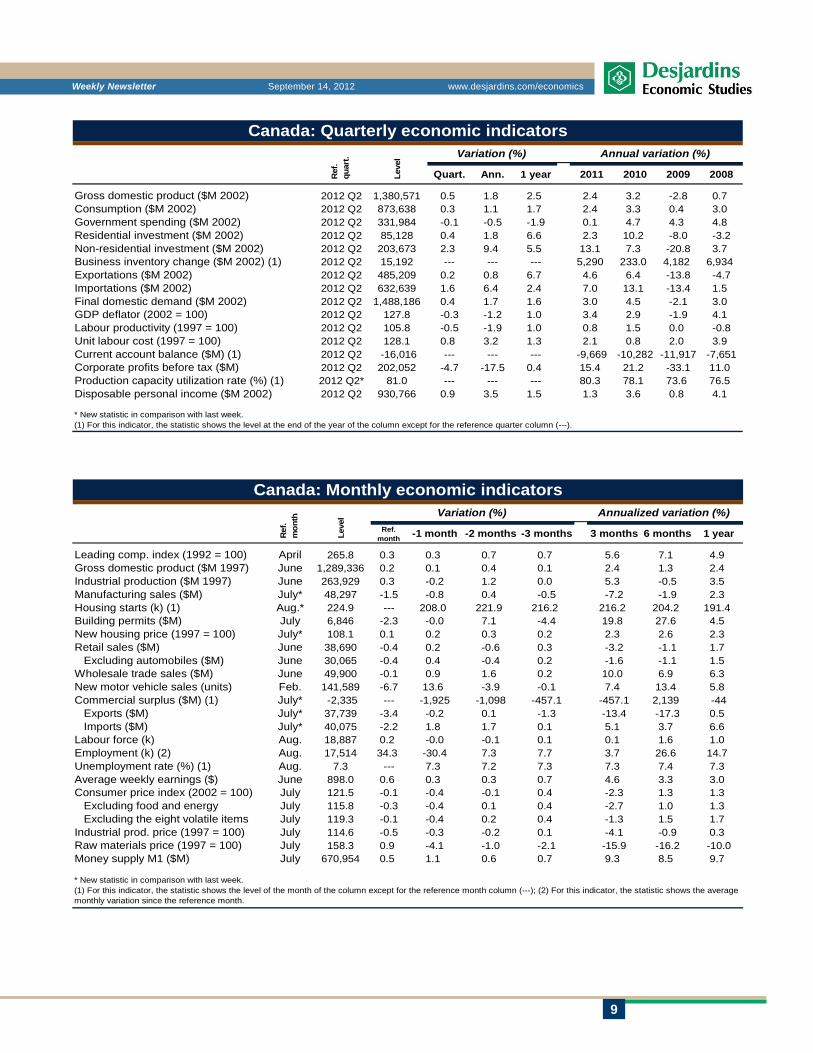
• Once again, new construction was stronger than anticipatedin Canada. Housing starts rose to 224,900 units from 208,000units in July. According to the Canada Mortgage and HousingCorporation, starts on a number of major projects in theGreater Toronto Area made a big contribution to last month’ssurge by housing starts. Housing activity was also robust inthe country’s major regions, except for Québec, which posteda decline. The high level of Canadian housing starts, whichwould normally be viewed favourably, is instead raising somedoubt as to the housing sector’s ability to make a soft landing.
• Merchandise exports fell by 3.4% in July due to significantreductions in energy products, machinery and equipment,and automotive products. Clearly, the vicissitudes of globaldemand are still making themselves felt on Canada’sinternational trade. Since imports retreated less drastically(-2.2%), the trade balance deteriorated further, by $410M.
• Manufacturing sales fell by 1.5% in July, a greater slumpthan was anticipated. After June’s 0.8% slump in manufac-turing sales, the significant contraction in July provides atelling reminder that Canada is not immune to the turmoil ofthe global economy.
• Despite the major non-residential investments made in thiscountry, the industrial capacity utilization rate improvedslightly, edging up from 80.5% in the first quarter of 2012 to81.0% last spring. The increase is especially large inconstruction and in oil and gas extraction. In fact, theutilization rate at oil and gas extraction sites has reached itshighest level in 10 years. Obviously, this is good news forfuture investment in this industry.
Benoit P. DurocherSenior Economist
3
Weekly Newsletter September 14, 2012 www.desjardins.com/economics
FINANCIAL MARKETSAfter the Draghi effect, the Bernanke effect
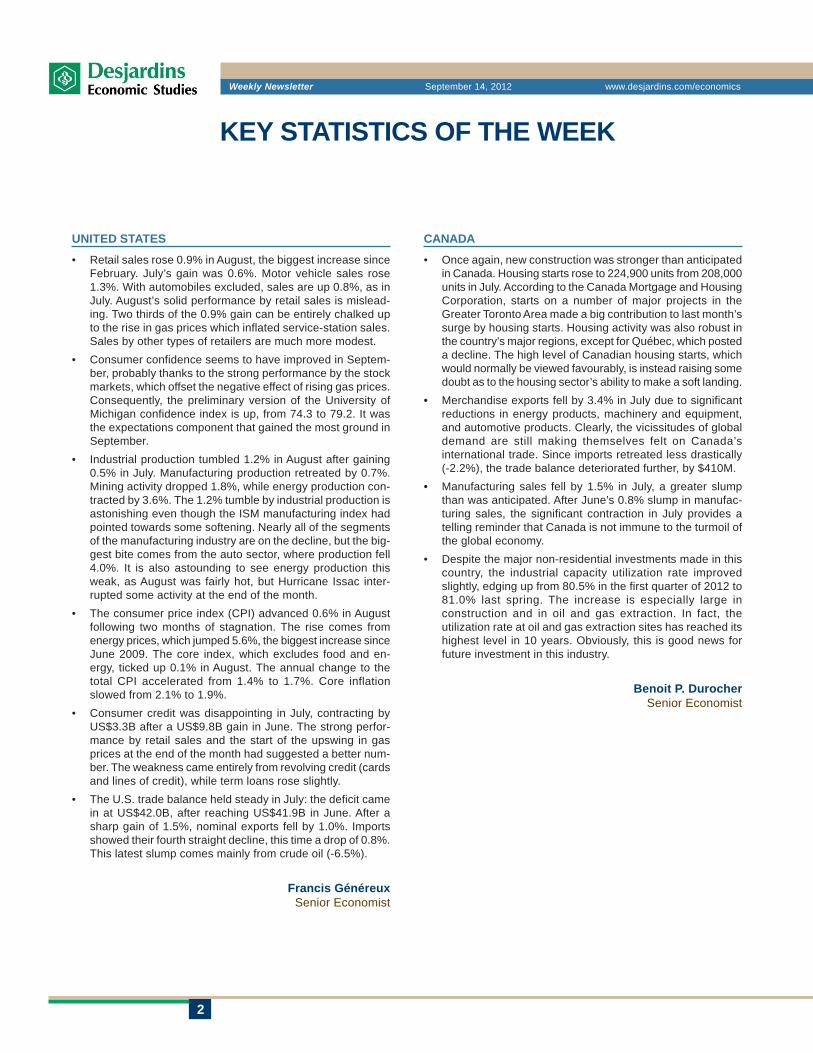
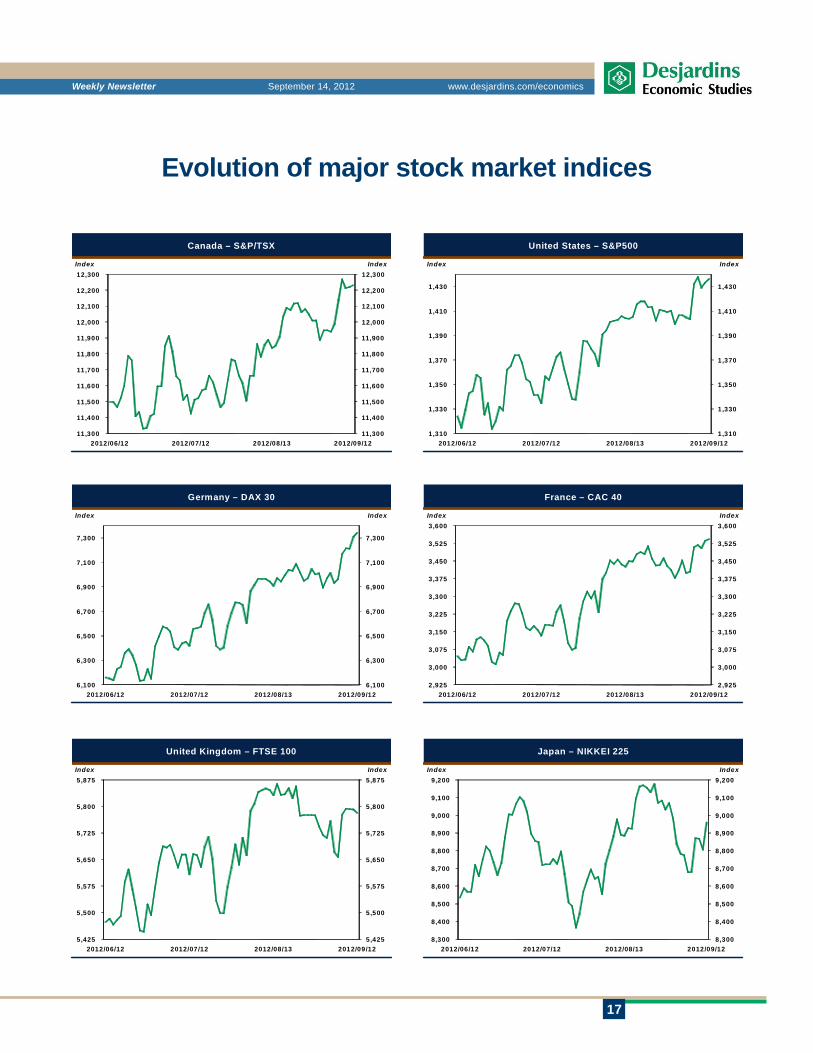
Good news kept coming in the markets this week. First, onWednesday, the German constitutional court approved theGerman president’s ratification of the treaty governing theEuropean Stability Mechanism. On Thursday, the FederalReserve (Fed) weighed in by announcing a third round ofquantitative easing, which galvanized investor sentiment. TheS&P 500 has posted a 4.2% rise in September alone. As forthe S&P/TSX, the increase stands at 4.5%. Commoditieswere stimulated, and the price of WTI oil briefly went overUS$100. With the Fed appearing to be more tolerant towardsinflation, the price of gold spiked by nearly $40, to US$1,770.
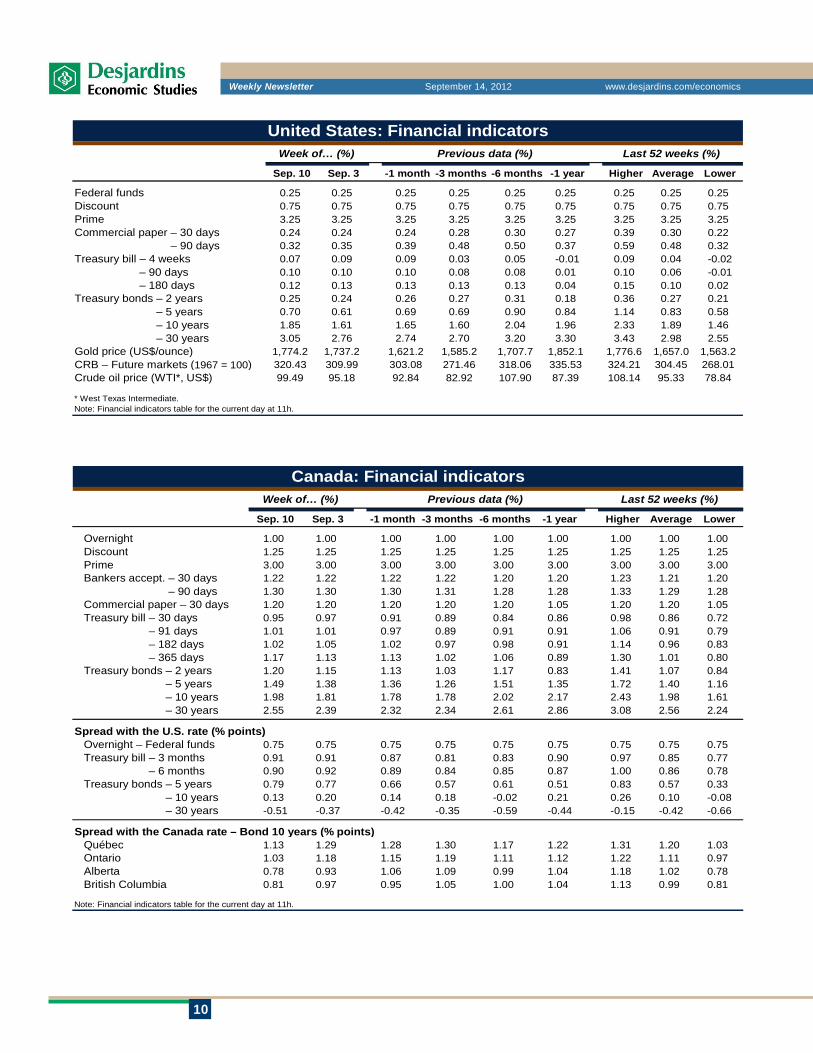
Long-term U.S. bonds suffered a severe correction in thewake of the Fed’s decision. Inflation expectations took off:the implicit expected inflation rate, derived from real yields,reached 2.6%, its highest level since April 2011. The30-year yield shattered the 3% bar for the first time in fourmonths, standing at close to 3.10% at time of writing, a43 basis point increase since the beginning of September. Inthe 10-year sector, the increase is 34 basis points, to a yieldof 1.88%, also a peak since last May. In Canada, long-termyields rose following the Fed’s announcement, but not asmuch as in the United States. The 10-year yield spreadnarrowed just shy of 12 basis points, after maintaining anaverage of 15 basis points since May. For the 30-year term,the (negative) spread widened even further, to 54 basis points.
The U.S. dollar paid the price for the surge in inflation ex-pectations in the United States; its weighted index hadtumbled to 78.7 at time of writing, lowest point since lastFebruary. The euro was the big winner of the sharp drop inrisk aversion; it even managed to break through the US$1.30mark on Friday. The pound sterling also benefited from re-newed enthusiasm in the markets, reaching US$1.625 onFriday. The decline of the U.S. dollar alleviated the pressureon the yen, which slipped to ¥78.30/US$, after appreciatingto a height of ¥77.10/US$. The Canadian dollar continuedits ascent, nearing US$1.04, but then retreated to US$1.03.
Mathieu D’Anjou Jimmy JeanSenior Economist Senior Economist
Stock markets
11,600
11,800
12,000
12,200
12,400
12,600
1,390
1,400
1,410
1,420
1,430
1,440
1,450
1,460
1,470
2012/08/03 2012/08/13 2012/08/21 2012/08/29 2012/09/06 2012/09/14
IndexIndex
S&P 500 (left) S&P/TSX (right)
Treasury bond – 10-year yield
1.5
1.6
1.7
1.8
1.9
2.0
0.10
0.12
0.14
0.16
0.18
0.20
0.22
0.24
2012/08/03 2012/08/13 2012/08/21 2012/08/29 2012/09/06 2012/09/14
In %In % points
Spread (left) Canada (right) United States (right)
Currency markets
1.22
1.23
1.24
1.25
1.26
1.27
1.28
1.29
1.30
1.31
1.32
0.99
1.00
1.01
1.02
1.03
1.04
2012/08/03 2012/08/13 2012/08/21 2012/08/29 2012/09/06 2012/09/14
US$/euroUS$/CAN$
Canadian dollar (left) Euro (right)
4
Weekly Newsletter September 14, 2012 www.desjardins.com/economics
A LOOK AHEAD
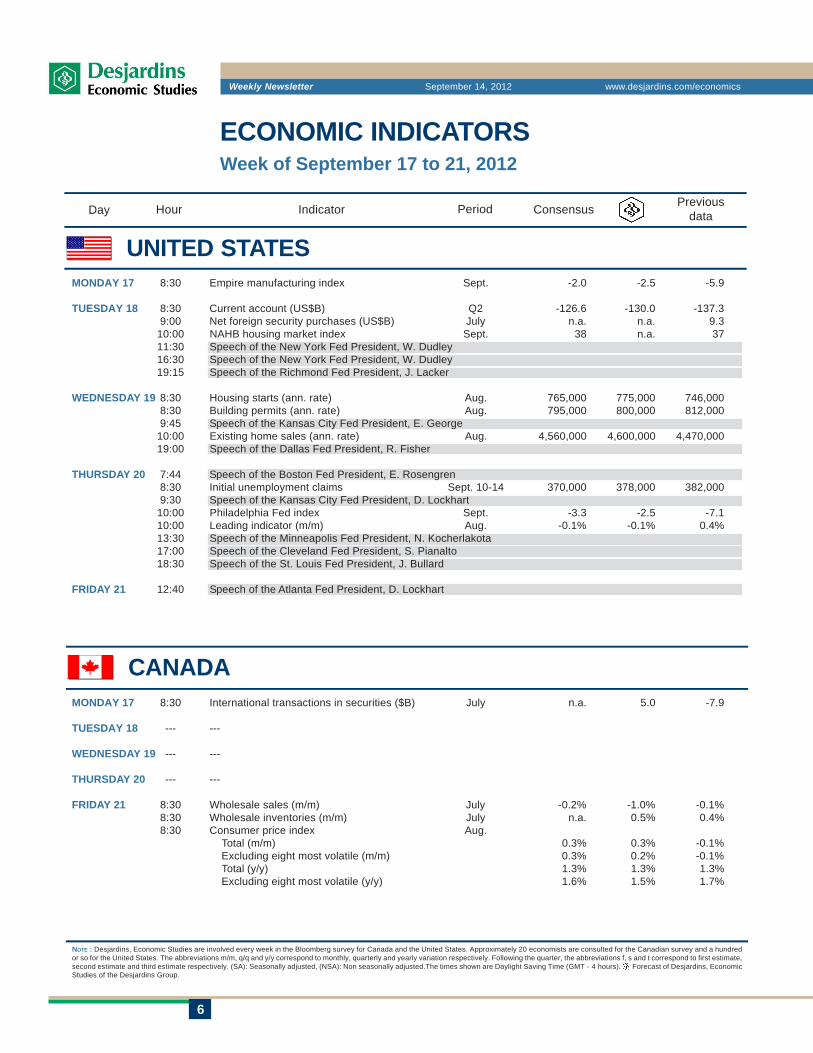
Housing starts (August) – Housing starts in July were disappointing, showing contraction of1.1%. Fortunately, the 6.7% surge in building permits issued in that same month made the bitterpill easier to swallow. It is this performance by building permits that allows us to anticipate astrong rally in housing for the month of August. These two indicators tend not to diverge for a longperiod of time. New job losses in the homebuilding sector in August keep our expectations incheck, however, and it would be surprising to see housing starts of more than 800,000 units.Instead, we expect them to climb to 775,000 units.
Existing home sales (August) – After stagnation in May and a 5.4% drop in June, sales of exist-ing homes rose by 2.3% in July. Since the start of this year, the upward trend in resales has beenmodest—2.0%—compared with 9.7% growth in new houses. We expect healthy growth in Au-gust, since the recent upturn in pending existing home sales points in that direction. Mortgage loanapplications in advance of a purchase are down, though, thwarting hopes of a strong rebound. Weexpect existing home sales to increase to 4,600,000 units at an annualized pace.
Leading indicator (August) – In July, the leading indicator put in its best growth performancesince the month of February. An upturn in building permits and a drop in unemployment insuranceapplications contributed a good deal to that gain. However, both of those components are likely tomake negative contributions to the August figure. Hours worked, the ISM index and consumerconfidence will probably also weigh heavily on the leading indicator; it is likely to decline by0.1%.
Consumer price index (August) – According to weekly surveys of prices at the pump, the aver-age price of regular gas rose by 2.9% in August. That increase alone is likely to generate a monthlyincrease of 0.17% in the total consumer price index (CPI). But we must bear in mind that negativeseasonal effects have a habit of pulling the total CPI down in August, especially the food andtransportation components. All things considered, we expect a monthly uptick of 0.3% in the totalCPI. The total annual inflation rate should stay put at 1.3%. The core index (CPIX) may edge up by0.2% during the month. Its annual change will probably dip from 1.7% to 1.5%.
Wholesale trade (July) – Merchandise exports lost ground last July, with significant declines inmachinery and equipment and automotive products. Under these circumstances, we should expectwholesale sales to have also slumped during the month. Wholesale inventories could expand forthe eighth straight month.
UNITED STATES
CANADA
Mercredi 19 sept. - 8:30Août
Consensus 765 000Desjardins 775 000
Juillet 746 000
Mercredi 19 sept. - 10:00Août taux ann.
Consensus 4 560 000Desjardins 4 600 000
Juillet 4 470 000
Jeudi 20 sept. - 10:00Août m/m
Consensus -0,1 %Desjardins -0,1 %
Juillet 0,4 %
Vendredi 21 sept. - 8:30Août m/m
Consensus 0,3 %Desjardins 0,3 %
Juillet -0,1 %
Vendredi 21 sept. - 8:30Juillet m/m
Consensus -0,2 %Desjardins -1,0 %
Juin -0,1 %

5
Weekly Newsletter September 14, 2012 www.desjardins.com/economics
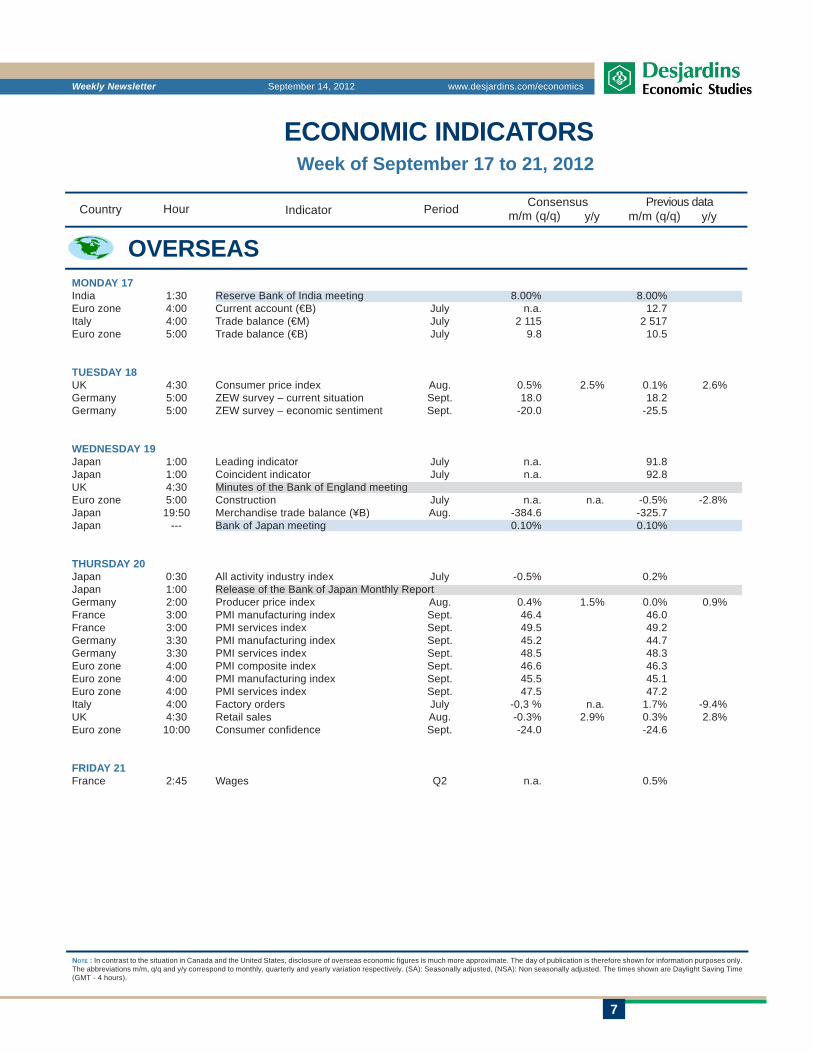
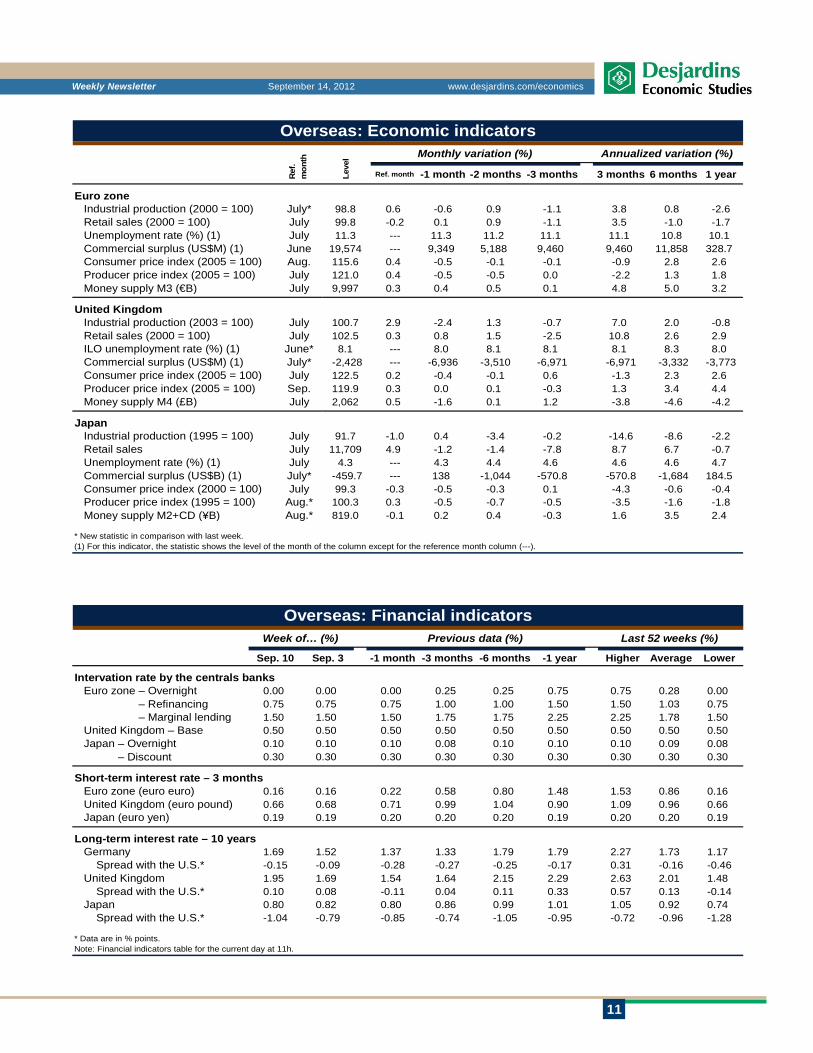
Euro zone: PMI index (September) – The euro zone’s PMI indexes are no longer sliding assteeply as they were doing last spring, but they are still a source of concern. The level of thecomposite index in August (46.3) is still fully compatible with significant contractions in realGDP. A further downturn in September would only confirm that we should expect the recession topersist in the fall. Several other indicators will be released this week, including the euro zone’strade balance, on Monday morning, and the ZEW index of German investor confidence, on Tuesday.
OVERSEAS
Jeudi 20 sept. - 4:00Septembre indice
Consensus 46,6Août 46,3
6
Weekly Newsletter September 14, 2012 www.desjardins.com/economics
ECONOMIC INDICATORSWeek of September 17 to 21, 2012
NOTE : Desjardins, Economic Studies are involved every week in the Bloomberg survey for Canada and the United States. Approximately 20 economists are consulted for the Canadian survey and a hundredor so for the United States. The abbreviations m/m, q/q and y/y correspond to monthly, quarterly and yearly variation respectively. Following the quarter, the abbreviations f, s and t correspond to first estimate,second estimate and third estimate respectively. (SA): Seasonally adjusted, (NSA): Non seasonally adjusted.The times shown are Daylight Saving Time (GMT - 4 hours). Forecast of Desjardins, EconomicStudies of the Desjardins Group.
Day Hour Indicator PreviousdataPeriod Consensus
UNITED STATES
CANADA
MONDAY 17 8:30 Empire manufacturing index Sept. -2.0 -2.5 -5.9
TUESDAY 18 8:30 Current account (US$B) Q2 -126.6 -130.0 -137.39:00 Net foreign security purchases (US$B) July n.a. n.a. 9.3
10:00 NAHB housing market index Sept. 38 n.a. 3711:30 Speech of the New York Fed President, W. Dudley16:30 Speech of the New York Fed President, W. Dudley19:15 Speech of the Richmond Fed President, J. Lacker
WEDNESDAY 19 8:30 Housing starts (ann. rate) Aug. 765,000 775,000 746,0008:30 Building permits (ann. rate) Aug. 795,000 800,000 812,0009:45 Speech of the Kansas City Fed President, E. George
10:00 Existing home sales (ann. rate) Aug. 4,560,000 4,600,000 4,470,00019:00 Speech of the Dallas Fed President, R. Fisher
THURSDAY 20 7:44 Speech of the Boston Fed President, E. Rosengren8:30 Initial unemployment claims Sept. 10-14 370,000 378,000 382,0009:30 Speech of the Kansas City Fed President, D. Lockhart
10:00 Philadelphia Fed index Sept. -3.3 -2.5 -7.110:00 Leading indicator (m/m) Aug. -0.1% -0.1% 0.4%13:30 Speech of the Minneapolis Fed President, N. Kocherlakota17:00 Speech of the Cleveland Fed President, S. Pianalto18:30 Speech of the St. Louis Fed President, J. Bullard
FRIDAY 21 12:40 Speech of the Atlanta Fed President, D. Lockhart
MONDAY 17 8:30 International transactions in securities ($B) July n.a. 5.0 -7.9
TUESDAY 18 --- ---
WEDNESDAY 19 --- ---
THURSDAY 20 --- ---
FRIDAY 21 8:30 Wholesale sales (m/m) July -0.2% -1.0% -0.1%8:30 Wholesale inventories (m/m) July n.a. 0.5% 0.4%8:30 Consumer price index Aug.
Total (m/m) 0.3% 0.3% -0.1%Excluding eight most volatile (m/m) 0.3% 0.2% -0.1%Total (y/y) 1.3% 1.3% 1.3%Excluding eight most volatile (y/y) 1.6% 1.5% 1.7%
7
Weekly Newsletter September 14, 2012 www.desjardins.com/economics
NOTE : In contrast to the situation in Canada and the United States, disclosure of overseas economic figures is much more approximate. The day of publication is therefore shown for information purposes only.The abbreviations m/m, q/q and y/y correspond to monthly, quarterly and yearly variation respectively. (SA): Seasonally adjusted, (NSA): Non seasonally adjusted. The times shown are Daylight Saving Time(GMT - 4 hours).
Previous dataConsensusm/m (q/q) y/yCountry Hour Indicator Period m/m (q/q) y/y
OVERSEAS
ECONOMIC INDICATORSWeek of September 17 to 21, 2012
MONDAY 17India 1:30 Reserve Bank of India meeting 8.00% 8.00%Euro zone 4:00 Current account (€B) July n.a. 12.7Italy 4:00 Trade balance (€M) July 2 115 2 517Euro zone 5:00 Trade balance (€B) July 9.8 10.5
TUESDAY 18UK 4:30 Consumer price index Aug. 0.5% 2.5% 0.1% 2.6%Germany 5:00 ZEW survey – current situation Sept. 18.0 18.2Germany 5:00 ZEW survey – economic sentiment Sept. -20.0 -25.5
WEDNESDAY 19Japan 1:00 Leading indicator July n.a. 91.8Japan 1:00 Coincident indicator July n.a. 92.8UK 4:30 Minutes of the Bank of England meetingEuro zone 5:00 Construction July n.a. n.a. -0.5% -2.8%Japan 19:50 Merchandise trade balance (¥B) Aug. -384.6 -325.7Japan --- Bank of Japan meeting 0.10% 0.10%
THURSDAY 20Japan 0:30 All activity industry index July -0.5% 0.2%Japan 1:00 Release of the Bank of Japan Monthly ReportGermany 2:00 Producer price index Aug. 0.4% 1.5% 0.0% 0.9%France 3:00 PMI manufacturing index Sept. 46.4 46.0France 3:00 PMI services index Sept. 49.5 49.2Germany 3:30 PMI manufacturing index Sept. 45.2 44.7Germany 3:30 PMI services index Sept. 48.5 48.3Euro zone 4:00 PMI composite index Sept. 46.6 46.3Euro zone 4:00 PMI manufacturing index Sept. 45.5 45.1Euro zone 4:00 PMI services index Sept. 47.5 47.2Italy 4:00 Factory orders July -0,3 % n.a. 1.7% -9.4%UK 4:30 Retail sales Aug. -0.3% 2.9% 0.3% 2.8%Euro zone 10:00 Consumer confidence Sept. -24.0 -24.6
FRIDAY 21France 2:45 Wages Q2 n.a. 0.5%
8
Weekly Newsletter September 14, 2012 www.desjardins.com/economics
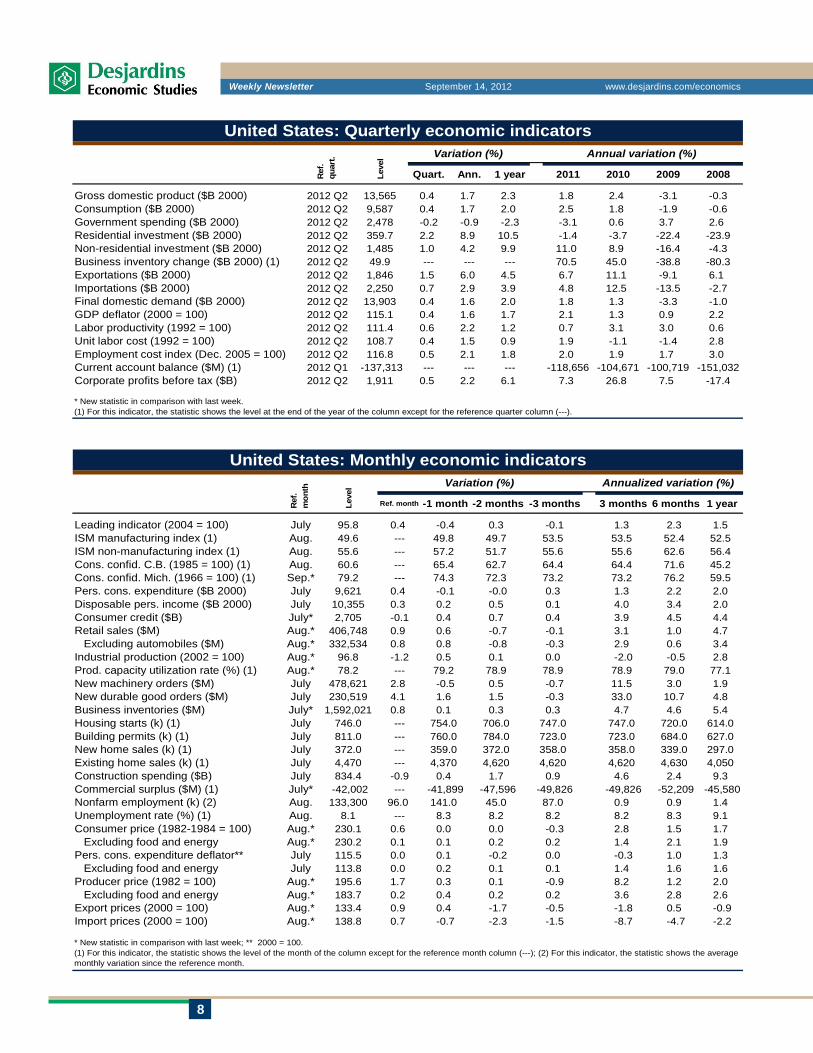
Gross domestic product ($B 2000) 2012 Q2 13,565 0.4 1.7 2.3 1.8 2.4 -3.1 -0.3Consumption ($B 2000) 2012 Q2 9,587 0.4 1.7 2.0 2.5 1.8 -1.9 -0.6Government spending ($B 2000) 2012 Q2 2,478 -0.2 -0.9 -2.3 -3.1 0.6 3.7 2.6Residential investment ($B 2000) 2012 Q2 359.7 2.2 8.9 10.5 -1.4 -3.7 -22.4 -23.9Non-residential investment ($B 2000) 2012 Q2 1,485 1.0 4.2 9.9 11.0 8.9 -16.4 -4.3Business inventory change ($B 2000) (1) 2012 Q2 49.9 --- --- --- 70.5 45.0 -38.8 -80.3Exportations ($B 2000) 2012 Q2 1,846 1.5 6.0 4.5 6.7 11.1 -9.1 6.1Importations ($B 2000) 2012 Q2 2,250 0.7 2.9 3.9 4.8 12.5 -13.5 -2.7Final domestic demand ($B 2000) 2012 Q2 13,903 0.4 1.6 2.0 1.8 1.3 -3.3 -1.0GDP deflator (2000 = 100) 2012 Q2 115.1 0.4 1.6 1.7 2.1 1.3 0.9 2.2Labor productivity (1992 = 100) 2012 Q2 111.4 0.6 2.2 1.2 0.7 3.1 3.0 0.6Unit labor cost (1992 = 100) 2012 Q2 108.7 0.4 1.5 0.9 1.9 -1.1 -1.4 2.8Employment cost index (Dec. 2005 = 100) 2012 Q2 116.8 0.5 2.1 1.8 2.0 1.9 1.7 3.0Current account balance ($M) (1) 2012 Q1 -137,313 --- --- --- -118,656 -104,671 -100,719 -151,032Corporate profits before tax ($B) 2012 Q2 1,911 0.5 2.2 6.1 7.3 26.8 7.5 -17.4
2008
* New statistic in comparison with last week.(1) For this indicator, the statistic shows the level at the end of the year of the column except for the reference quarter column (---).
2010
United States: Quarterly economic indicatorsVariation (%) Annual variation (%)
Leve
l
Ref
. qu
art.
Quart. Ann. 1 year 2011 2009
Leading indicator (2004 = 100) July 95.8 0.4 -0.4 0.3 -0.1 1.3 2.3 1.5ISM manufacturing index (1) Aug. 49.6 --- 49.8 49.7 53.5 53.5 52.4 52.5ISM non-manufacturing index (1) Aug. 55.6 --- 57.2 51.7 55.6 55.6 62.6 56.4Cons. confid. C.B. (1985 = 100) (1) Aug. 60.6 --- 65.4 62.7 64.4 64.4 71.6 45.2Cons. confid. Mich. (1966 = 100) (1) Sep.* 79.2 --- 74.3 72.3 73.2 73.2 76.2 59.5Pers. cons. expenditure ($B 2000) July 9,621 0.4 -0.1 -0.0 0.3 1.3 2.2 2.0Disposable pers. income ($B 2000) July 10,355 0.3 0.2 0.5 0.1 4.0 3.4 2.0Consumer credit ($B) July* 2,705 -0.1 0.4 0.7 0.4 3.9 4.5 4.4Retail sales ($M) Aug.* 406,748 0.9 0.6 -0.7 -0.1 3.1 1.0 4.7 Excluding automobiles ($M) Aug.* 332,534 0.8 0.8 -0.8 -0.3 2.9 0.6 3.4Industrial production (2002 = 100) Aug.* 96.8 -1.2 0.5 0.1 0.0 -2.0 -0.5 2.8Prod. capacity utilization rate (%) (1) Aug.* 78.2 --- 79.2 78.9 78.9 78.9 79.0 77.1New machinery orders ($M) July 478,621 2.8 -0.5 0.5 -0.7 11.5 3.0 1.9New durable good orders ($M) July 230,519 4.1 1.6 1.5 -0.3 33.0 10.7 4.8Business inventories ($M) July* 1,592,021 0.8 0.1 0.3 0.3 4.7 4.6 5.4Housing starts (k) (1) July 746.0 --- 754.0 706.0 747.0 747.0 720.0 614.0Building permits (k) (1) July 811.0 --- 760.0 784.0 723.0 723.0 684.0 627.0New home sales (k) (1) July 372.0 --- 359.0 372.0 358.0 358.0 339.0 297.0Existing home sales (k) (1) July 4,470 --- 4,370 4,620 4,620 4,620 4,630 4,050Construction spending ($B) July 834.4 -0.9 0.4 1.7 0.9 4.6 2.4 9.3Commercial surplus ($M) (1) July* -42,002 --- -41,899 -47,596 -49,826 -49,826 -52,209 -45,580Nonfarm employment (k) (2) Aug. 133,300 96.0 141.0 45.0 87.0 0.9 0.9 1.4Unemployment rate (%) (1) Aug. 8.1 --- 8.3 8.2 8.2 8.2 8.3 9.1Consumer price (1982-1984 = 100) Aug.* 230.1 0.6 0.0 0.0 -0.3 2.8 1.5 1.7 Excluding food and energy Aug.* 230.2 0.1 0.1 0.2 0.2 1.4 2.1 1.9Pers. cons. expenditure deflator** July 115.5 0.0 0.1 -0.2 0.0 -0.3 1.0 1.3 Excluding food and energy July 113.8 0.0 0.2 0.1 0.1 1.4 1.6 1.6Producer price (1982 = 100) Aug.* 195.6 1.7 0.3 0.1 -0.9 8.2 1.2 2.0 Excluding food and energy Aug.* 183.7 0.2 0.4 0.2 0.2 3.6 2.8 2.6Export prices (2000 = 100) Aug.* 133.4 0.9 0.4 -1.7 -0.5 -1.8 0.5 -0.9Import prices (2000 = 100) Aug.* 138.8 0.7 -0.7 -2.3 -1.5 -8.7 -4.7 -2.2
* New statistic in comparison with last week; ** 2000 = 100.(1) For this indicator, the statistic shows the level of the month of the column except for the reference month column (---); (2) For this indicator, the statistic shows the average monthly variation since the reference month.
United States: Monthly economic indicatorsVariation (%) Annualized variation (%)
Leve
l
Ref
. m
onth
Ref. month -1 month -2 months -3 months 3 months 6 months 1 year
9
Weekly Newsletter September 14, 2012 www.desjardins.com/economics
Gross domestic product ($M 2002) 2012 Q2 1,380,571 0.5 1.8 2.5 2.4 3.2 -2.8 0.7Consumption ($M 2002) 2012 Q2 873,638 0.3 1.1 1.7 2.4 3.3 0.4 3.0Government spending ($M 2002) 2012 Q2 331,984 -0.1 -0.5 -1.9 0.1 4.7 4.3 4.8Residential investment ($M 2002) 2012 Q2 85,128 0.4 1.8 6.6 2.3 10.2 -8.0 -3.2Non-residential investment ($M 2002) 2012 Q2 203,673 2.3 9.4 5.5 13.1 7.3 -20.8 3.7Business inventory change ($M 2002) (1) 2012 Q2 15,192 --- --- --- 5,290 233.0 4,182 6,934Exportations ($M 2002) 2012 Q2 485,209 0.2 0.8 6.7 4.6 6.4 -13.8 -4.7Importations ($M 2002) 2012 Q2 632,639 1.6 6.4 2.4 7.0 13.1 -13.4 1.5Final domestic demand ($M 2002) 2012 Q2 1,488,186 0.4 1.7 1.6 3.0 4.5 -2.1 3.0GDP deflator (2002 = 100) 2012 Q2 127.8 -0.3 -1.2 1.0 3.4 2.9 -1.9 4.1Labour productivity (1997 = 100) 2012 Q2 105.8 -0.5 -1.9 1.0 0.8 1.5 0.0 -0.8Unit labour cost (1997 = 100) 2012 Q2 128.1 0.8 3.2 1.3 2.1 0.8 2.0 3.9Current account balance ($M) (1) 2012 Q2 -16,016 --- --- --- -9,669 -10,282 -11,917 -7,651Corporate profits before tax ($M) 2012 Q2 202,052 -4.7 -17.5 0.4 15.4 21.2 -33.1 11.0Production capacity utilization rate (%) (1) 2012 Q2* 81.0 --- --- --- 80.3 78.1 73.6 76.5Disposable personal income ($M 2002) 2012 Q2 930,766 0.9 3.5 1.5 1.3 3.6 0.8 4.1
2008
* New statistic in comparison with last week.(1) For this indicator, the statistic shows the level at the end of the year of the column except for the reference quarter column (---).
2010
Canada: Quarterly economic indicatorsVariation (%) Annual variation (%)
Leve
l
Ref
. qu
art.
Quart. Ann. 1 year 2011 2009
Leading comp. index (1992 = 100) April 265.8 0.3 0.3 0.7 0.7 5.6 7.1 4.9Gross domestic product ($M 1997) June 1,289,336 0.2 0.1 0.4 0.1 2.4 1.3 2.4Industrial production ($M 1997) June 263,929 0.3 -0.2 1.2 0.0 5.3 -0.5 3.5Manufacturing sales ($M) July* 48,297 -1.5 -0.8 0.4 -0.5 -7.2 -1.9 2.3Housing starts (k) (1) Aug.* 224.9 --- 208.0 221.9 216.2 216.2 204.2 191.4Building permits ($M) July 6,846 -2.3 -0.0 7.1 -4.4 19.8 27.6 4.5New housing price (1997 = 100) July* 108.1 0.1 0.2 0.3 0.2 2.3 2.6 2.3Retail sales ($M) June 38,690 -0.4 0.2 -0.6 0.3 -3.2 -1.1 1.7 Excluding automobiles ($M) June 30,065 -0.4 0.4 -0.4 0.2 -1.6 -1.1 1.5Wholesale trade sales ($M) June 49,900 -0.1 0.9 1.6 0.2 10.0 6.9 6.3New motor vehicle sales (units) Feb. 141,589 -6.7 13.6 -3.9 -0.1 7.4 13.4 5.8Commercial surplus ($M) (1) July* -2,335 --- -1,925 -1,098 -457.1 -457.1 2,139 -44 Exports ($M) July* 37,739 -3.4 -0.2 0.1 -1.3 -13.4 -17.3 0.5 Imports ($M) July* 40,075 -2.2 1.8 1.7 0.1 5.1 3.7 6.6Labour force (k) Aug. 18,887 0.2 -0.0 -0.1 0.1 0.1 1.6 1.0Employment (k) (2) Aug. 17,514 34.3 -30.4 7.3 7.7 3.7 26.6 14.7Unemployment rate (%) (1) Aug. 7.3 --- 7.3 7.2 7.3 7.3 7.4 7.3Average weekly earnings ($) June 898.0 0.6 0.3 0.3 0.7 4.6 3.3 3.0Consumer price index (2002 = 100) July 121.5 -0.1 -0.4 -0.1 0.4 -2.3 1.3 1.3 Excluding food and energy July 115.8 -0.3 -0.4 0.1 0.4 -2.7 1.0 1.3 Excluding the eight volatile items July 119.3 -0.1 -0.4 0.2 0.4 -1.3 1.5 1.7Industrial prod. price (1997 = 100) July 114.6 -0.5 -0.3 -0.2 0.1 -4.1 -0.9 0.3Raw materials price (1997 = 100) July 158.3 0.9 -4.1 -1.0 -2.1 -15.9 -16.2 -10.0Money supply M1 ($M) July 670,954 0.5 1.1 0.6 0.7 9.3 8.5 9.7
6 months 1 year
* New statistic in comparison with last week.(1) For this indicator, the statistic shows the level of the month of the column except for the reference month column (---); (2) For this indicator, the statistic shows the average monthly variation since the reference month.
Canada: Monthly economic indicatorsVariation (%) Annualized variation (%)
Leve
l
Ref
. m
onth
Ref.month -1 month -2 months -3 months 3 months
10
Weekly Newsletter September 14, 2012 www.desjardins.com/economics
Sep. 10 Sep. 3 -1 month -3 months -6 months -1 year Higher Average Lower
Overnight 1.00 1.00 1.00 1.00 1.00 1.00 1.00 1.00 1.00 Discount 1.25 1.25 1.25 1.25 1.25 1.25 1.25 1.25 1.25 Prime 3.00 3.00 3.00 3.00 3.00 3.00 3.00 3.00 3.00 Bankers accept. – 30 days 1.22 1.22 1.22 1.22 1.20 1.20 1.23 1.21 1.20 Bankers accept. – 90 days 1.30 1.30 1.30 1.31 1.28 1.28 1.33 1.29 1.28 Commercial paper – 30 days 1.20 1.20 1.20 1.20 1.20 1.05 1.20 1.20 1.05 Treasury bill – 30 days 0.95 0.97 0.91 0.89 0.84 0.86 0.98 0.86 0.72 Treasury bill – 91 days 1.01 1.01 0.97 0.89 0.91 0.91 1.06 0.91 0.79 Treasury bill – 182 days 1.02 1.05 1.02 0.97 0.98 0.91 1.14 0.96 0.83 Treasury bill – 365 days 1.17 1.13 1.13 1.02 1.06 0.89 1.30 1.01 0.80 Treasury bonds – 2 years 1.20 1.15 1.13 1.03 1.17 0.83 1.41 1.07 0.84 Treasury bonds – 5 years 1.49 1.38 1.36 1.26 1.51 1.35 1.72 1.40 1.16 Treasury bonds – 10 years 1.98 1.81 1.78 1.78 2.02 2.17 2.43 1.98 1.61 Treasury bonds – 30 years 2.55 2.39 2.32 2.34 2.61 2.86 3.08 2.56 2.24
Spread with the U.S. rate (% points) Overnight – Federal funds 0.75 0.75 0.75 0.75 0.75 0.75 0.75 0.75 0.75 Treasury bill – 3 months 0.91 0.91 0.87 0.81 0.83 0.90 0.97 0.85 0.77 Treasury bill – 6 months 0.90 0.92 0.89 0.84 0.85 0.87 1.00 0.86 0.78 Treasury bonds – 5 years 0.79 0.77 0.66 0.57 0.61 0.51 0.83 0.57 0.33 Treasury bonds – 10 years 0.13 0.20 0.14 0.18 -0.02 0.21 0.26 0.10 -0.08 Treasury bonds – 30 years -0.51 -0.37 -0.42 -0.35 -0.59 -0.44 -0.15 -0.42 -0.66
Spread with the Canada rate – Bond 10 years (% points) Québec 1.13 1.29 1.28 1.30 1.17 1.22 1.31 1.20 1.03 Ontario 1.03 1.18 1.15 1.19 1.11 1.12 1.22 1.11 0.97 Alberta 0.78 0.93 1.06 1.09 0.99 1.04 1.18 1.02 0.78 British Columbia 0.81 0.97 0.95 1.05 1.00 1.04 1.13 0.99 0.81
Note: Financial indicators table for the current day at 11h.
Canada: Financial indicatorsWeek of… (%) Previous data (%) Last 52 weeks (%)
Sep. 10 Sep. 3 -1 month -3 months -6 months -1 year Higher Average Lower
Federal funds 0.25 0.25 0.25 0.25 0.25 0.25 0.25 0.25 0.25Discount 0.75 0.75 0.75 0.75 0.75 0.75 0.75 0.75 0.75Prime 3.25 3.25 3.25 3.25 3.25 3.25 3.25 3.25 3.25Commercial paper – 30 days 0.24 0.24 0.24 0.28 0.30 0.27 0.39 0.30 0.22Commercial paper – 90 days 0.32 0.35 0.39 0.48 0.50 0.37 0.59 0.48 0.32Treasury bill – 4 weeks 0.07 0.09 0.09 0.03 0.05 -0.01 0.09 0.04 -0.02Treasury bill – 90 days 0.10 0.10 0.10 0.08 0.08 0.01 0.10 0.06 -0.01Treasury bill – 180 days 0.12 0.13 0.13 0.13 0.13 0.04 0.15 0.10 0.02Treasury bonds – 2 years 0.25 0.24 0.26 0.27 0.31 0.18 0.36 0.27 0.21Treasury bonds – 5 years 0.70 0.61 0.69 0.69 0.90 0.84 1.14 0.83 0.58Treasury bonds – 10 years 1.85 1.61 1.65 1.60 2.04 1.96 2.33 1.89 1.46Treasury bonds – 30 years 3.05 2.76 2.74 2.70 3.20 3.30 3.43 2.98 2.55Gold price (US$/ounce) 1,774.2 1,737.2 1,621.2 1,585.2 1,707.7 1,852.1 1,776.6 1,657.0 1,563.2CRB – Future markets (1967 = 100) 320.43 309.99 303.08 271.46 318.06 335.53 324.21 304.45 268.01Crude oil price (WTI*, US$) 99.49 95.18 92.84 82.92 107.90 87.39 108.14 95.33 78.84
* West Texas Intermediate.Note: Financial indicators table for the current day at 11h.
United States: Financial indicatorsWeek of… (%) Previous data (%) Last 52 weeks (%)
11
Weekly Newsletter September 14, 2012 www.desjardins.com/economics
Euro zone Industrial production (2000 = 100) July* 98.8 0.6 -0.6 0.9 -1.1 3.8 0.8 -2.6 Retail sales (2000 = 100) July 99.8 -0.2 0.1 0.9 -1.1 3.5 -1.0 -1.7 Unemployment rate (%) (1) July 11.3 --- 11.3 11.2 11.1 11.1 10.8 10.1 Commercial surplus (US$M) (1) June 19,574 --- 9,349 5,188 9,460 9,460 11,858 328.7 Consumer price index (2005 = 100) Aug. 115.6 0.4 -0.5 -0.1 -0.1 -0.9 2.8 2.6 Producer price index (2005 = 100) July 121.0 0.4 -0.5 -0.5 0.0 -2.2 1.3 1.8 Money supply M3 (€B) July 9,997 0.3 0.4 0.5 0.1 4.8 5.0 3.2
United Kingdom Industrial production (2003 = 100) July 100.7 2.9 -2.4 1.3 -0.7 7.0 2.0 -0.8 Retail sales (2000 = 100) July 102.5 0.3 0.8 1.5 -2.5 10.8 2.6 2.9 ILO unemployment rate (%) (1) June* 8.1 --- 8.0 8.1 8.1 8.1 8.3 8.0 Commercial surplus (US$M) (1) July* -2,428 --- -6,936 -3,510 -6,971 -6,971 -3,332 -3,773 Consumer price index (2005 = 100) July 122.5 0.2 -0.4 -0.1 0.6 -1.3 2.3 2.6 Producer price index (2005 = 100) Sep. 119.9 0.3 0.0 0.1 -0.3 1.3 3.4 4.4 Money supply M4 (£B) July 2,062 0.5 -1.6 0.1 1.2 -3.8 -4.6 -4.2
Japan Industrial production (1995 = 100) July 91.7 -1.0 0.4 -3.4 -0.2 -14.6 -8.6 -2.2 Retail sales July 11,709 4.9 -1.2 -1.4 -7.8 8.7 6.7 -0.7 Unemployment rate (%) (1) July 4.3 --- 4.3 4.4 4.6 4.6 4.6 4.7 Commercial surplus (US$B) (1) July* -459.7 --- 138 -1,044 -570.8 -570.8 -1,684 184.5 Consumer price index (2000 = 100) July 99.3 -0.3 -0.5 -0.3 0.1 -4.3 -0.6 -0.4 Producer price index (1995 = 100) Aug.* 100.3 0.3 -0.5 -0.7 -0.5 -3.5 -1.6 -1.8 Money supply M2+CD (¥B) Aug.* 819.0 -0.1 0.2 0.4 -0.3 1.6 3.5 2.4
1 year
* New statistic in comparison with last week.(1) For this indicator, the statistic shows the level of the month of the column except for the reference month column (---).
Overseas: Economic indicatorsMonthly variation (%) Annualized variation (%)
Leve
l
Ref
. m
onth
Ref. month -1 month -2 months -3 months 3 months 6 months
Sep. 10 Sep. 3 -1 month -3 months -6 months -1 year Higher Average Lower
Intervation rate by the centrals banks Euro zone – Overnight 0.00 0.00 0.00 0.25 0.25 0.75 0.75 0.28 0.00 Euro zone – Refinancing 0.75 0.75 0.75 1.00 1.00 1.50 1.50 1.03 0.75 Euro zone – Marginal lending 1.50 1.50 1.50 1.75 1.75 2.25 2.25 1.78 1.50 United Kingdom – Base 0.50 0.50 0.50 0.50 0.50 0.50 0.50 0.50 0.50 Japan – Overnight 0.10 0.10 0.10 0.08 0.10 0.10 0.10 0.09 0.08 Japan – Discount 0.30 0.30 0.30 0.30 0.30 0.30 0.30 0.30 0.30
Short-term interest rate – 3 months Euro zone (euro euro) 0.16 0.16 0.22 0.58 0.80 1.48 1.53 0.86 0.16 United Kingdom (euro pound) 0.66 0.68 0.71 0.99 1.04 0.90 1.09 0.96 0.66 Japan (euro yen) 0.19 0.19 0.20 0.20 0.20 0.19 0.20 0.20 0.19
Long-term interest rate – 10 years Germany 1.69 1.52 1.37 1.33 1.79 1.79 2.27 1.73 1.17 Spread with the U.S.* -0.15 -0.09 -0.28 -0.27 -0.25 -0.17 0.31 -0.16 -0.46 United Kingdom 1.95 1.69 1.54 1.64 2.15 2.29 2.63 2.01 1.48 Spread with the U.S.* 0.10 0.08 -0.11 0.04 0.11 0.33 0.57 0.13 -0.14 Japan 0.80 0.82 0.80 0.86 0.99 1.01 1.05 0.92 0.74 Spread with the U.S.* -1.04 -0.79 -0.85 -0.74 -1.05 -0.95 -0.72 -0.96 -1.28
* Data are in % points.Note: Financial indicators table for the current day at 11h.
Overseas: Financial indicatorsWeek of… (%) Previous data (%) Last 52 weeks (%)
12
Weekly Newsletter September 14, 2012 www.desjardins.com/economics
Sep. 13 -1 month -3 months -6 months -1 year Sep. 13 -1 month -3 months -6 months -1 year
Canada Bond indices Overall universe 2.37 2.34 2.30 2.46 2.44 0.73 0.75 0.79 0.75 0.81 Overall short-term 1.65 1.65 1.58 1.73 1.56 0.33 0.36 0.40 0.37 0.38 Overall medium-term 2.49 2.47 2.43 2.68 2.80 0.65 0.68 0.69 0.71 0.71 Overall long-term 3.40 3.28 3.33 3.46 3.69 0.97 0.99 1.01 0.90 0.92 Federal Overall universe 1.64 1.59 1.50 1.71 1.63 --- --- --- --- --- Overall short-term 1.32 1.29 1.18 1.36 1.18 --- --- --- --- --- Overall medium-term 1.85 1.79 1.74 1.97 2.10 --- --- --- --- --- Overall long-term 2.43 2.29 2.32 2.57 2.77 --- --- --- --- --- Provincial Overall universe 2.80 2.73 2.74 2.86 2.91 1.16 1.15 1.23 1.15 1.29 Overall short-term 1.61 1.57 1.53 1.66 1.47 0.29 0.28 0.35 0.30 0.29 Overall medium-term 2.52 2.48 2.44 2.66 2.72 0.67 0.69 0.70 0.69 0.62 Overall long-term 3.46 3.35 3.38 3.51 3.71 1.03 1.06 1.07 0.95 0.94 Municipal Overall universe 2.79 2.75 2.74 2.87 2.81 1.15 1.17 1.24 1.16 1.18 All corporate universe Overall universe 3.02 3.06 3.11 3.19 3.29 1.38 1.47 1.60 1.48 1.66 Corporate AA 2.18 2.27 2.32 2.41 2.49 0.54 0.68 0.82 0.70 0.86 Corporate A 3.22 3.22 3.29 3.46 3.53 1.58 1.64 1.79 1.75 1.90 Corporate BBB 3.61 3.64 3.69 3.85 4.05 1.98 2.05 2.18 2.14 2.43
United States* Bond indices 1.55 1.64 1.83 1.99 2.07 0.61 0.71 0.88 0.80 0.98 Federal 0.94 0.93 0.95 1.19 1.09 --- --- --- --- --- Municipal 3.34 3.33 3.39 3.47 3.70 2.40 2.40 2.44 2.28 2.61 All corporate universe Corporate AAA 1.67 1.70 1.91 2.04 2.22 0.73 0.77 0.96 0.85 1.13 Corporate AA 2.13 2.16 2.53 2.59 3.02 1.19 1.23 1.58 1.40 1.93 Corporate A 2.61 2.71 3.14 3.23 3.58 1.67 1.78 2.19 2.04 2.49 Corporate BBB 3.65 3.74 4.08 4.11 4.34 2.71 2.80 3.13 2.92 3.25
* American indices are all of “overall universe” form.Note: “Overall universe” indices combine bonds of short-, medium- and long-term maturities.
Yield (%)
North American bond marketsSpread with the Federal Treasury bond
(in % points)
September 13, 2012 Wor
ld
Uni
ted
Stat
es
Can
ada
Euro
zon
e
Ger
man
y
Fran
ce
Uni
ted
Kin
gdom
Japa
n
Aus
tral
ia
World 3.87 --- 2.25 1.82 -0.50 2.31 1.72 1.49 2.76 0.91United States 1.62 -2.25 --- -0.43 -2.75 0.06 -0.53 -0.76 0.51 -1.34Canada 2.06 -1.82 0.43 --- -2.32 0.49 -0.10 -0.32 0.94 -0.91Euro zone 4.38 0.50 2.75 2.32 --- 2.81 2.22 2.00 3.27 1.42Germany 1.57 -2.31 -0.06 -0.49 -2.81 --- -0.59 -0.81 0.45 -1.40France 2.15 -1.72 0.53 0.10 -2.22 0.59 --- -0.23 1.04 -0.81United Kingdom 2.38 -1.49 0.76 0.32 -2.00 0.81 0.23 --- 1.27 -0.58Japan 1.11 -2.76 -0.51 -0.94 -3.27 -0.45 -1.04 -1.27 --- -1.85Australia 2.96 -0.91 1.34 0.91 -1.42 1.40 0.81 0.58 1.85 ---
Note : These local currency indices combine federal bonds with maturities of one year and over.
J.P. Morgan bond indicesSpread against (in % points)
Yiel
d (%
)
13
Weekly Newsletter September 14, 2012 www.desjardins.com/economics
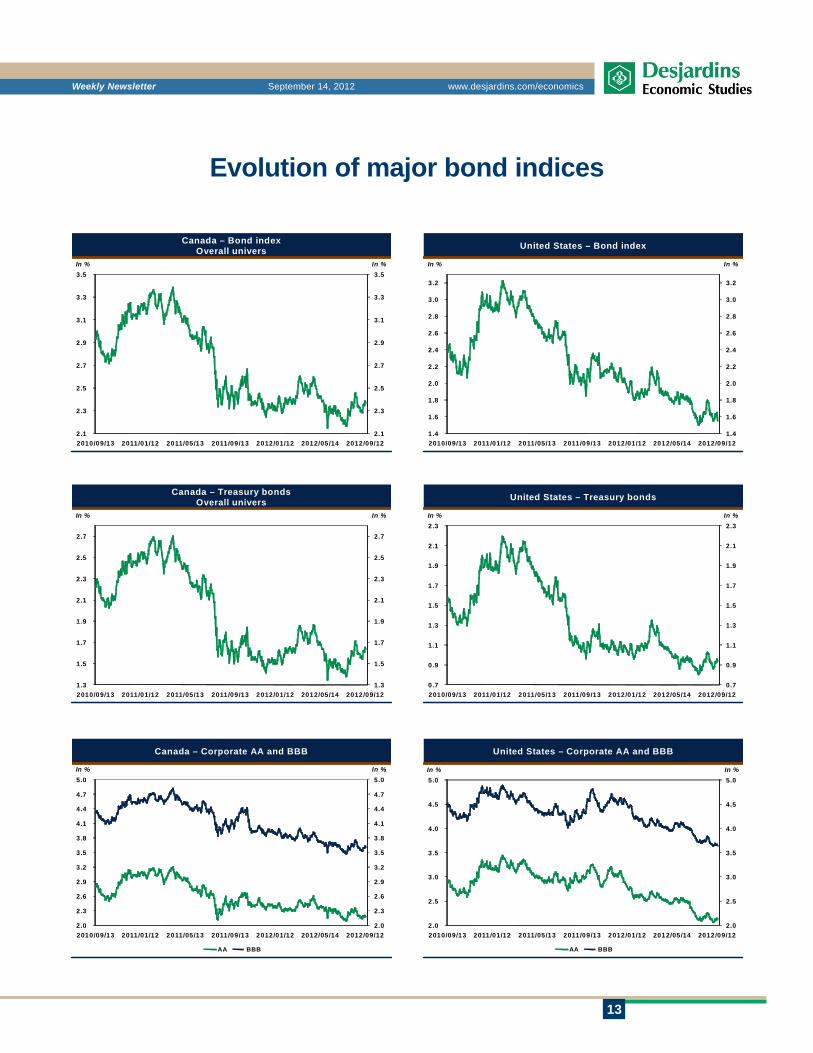
Evolution of major bond indices
Canada – Bond indexOverall univers
2.1
2.3
2.5
2.7
2.9
3.1
3.3
3.5
2.1
2.3
2.5
2.7
2.9
3.1
3.3
3.5
2010/09/13 2011/01/12 2011/05/13 2011/09/13 2012/01/12 2012/05/14 2012/09/12
In %In %
United States – Bond index
1.4
1.6
1.8
2.0
2.2
2.4
2.6
2.8
3.0
3.2
1.4
1.6
1.8
2.0
2.2
2.4
2.6
2.8
3.0
3.2
2010/09/13 2011/01/12 2011/05/13 2011/09/13 2012/01/12 2012/05/14 2012/09/12
In %In %
Canada – Treasury bondsOverall univers
1.3
1.5
1.7
1.9
2.1
2.3
2.5
2.7
1.3
1.5
1.7
1.9
2.1
2.3
2.5
2.7
2010/09/13 2011/01/12 2011/05/13 2011/09/13 2012/01/12 2012/05/14 2012/09/12
In %In %
United States – Treasury bonds
0.7
0.9
1.1
1.3
1.5
1.7
1.9
2.1
2.3
0.7
0.9
1.1
1.3
1.5
1.7
1.9
2.1
2.3
2010/09/13 2011/01/12 2011/05/13 2011/09/13 2012/01/12 2012/05/14 2012/09/12
In %In %
Canada – Corporate AA and BBB
2.0
2.3
2.6
2.9
3.2
3.5
3.8
4.1
4.4
4.7
5.0
2.0
2.3
2.6
2.9
3.2
3.5
3.8
4.1
4.4
4.7
5.0
2010/09/13 2011/01/12 2011/05/13 2011/09/13 2012/01/12 2012/05/14 2012/09/12
In %In %
AA BBB
United States – Corporate AA and BBB
2.0
2.5
3.0
3.5
4.0
4.5
5.0
2.0
2.5
3.0
3.5
4.0
4.5
5.0
2010/09/13 2011/01/12 2011/05/13 2011/09/13 2012/01/12 2012/05/14 2012/09/12
In %In %
AA BBB
14
Weekly Newsletter September 14, 2012 www.desjardins.com/economics
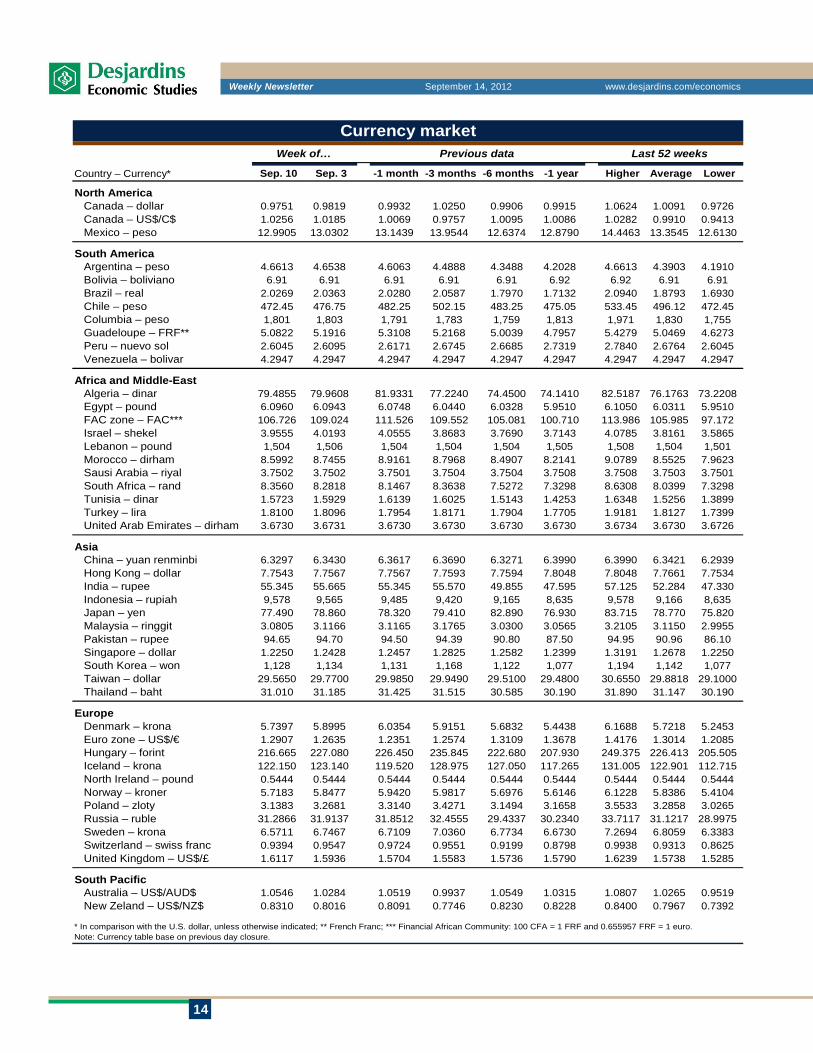
Country – Currency* Sep. 10 Sep. 3 -1 month -3 months -6 months -1 year Higher Average Lower
North America Canada – dollar 0.9751 0.9819 0.9932 1.0250 0.9906 0.9915 1.0624 1.0091 0.9726 Canada – US$/C$ 1.0256 1.0185 1.0069 0.9757 1.0095 1.0086 1.0282 0.9910 0.9413 Mexico – peso 12.9905 13.0302 13.1439 13.9544 12.6374 12.8790 14.4463 13.3545 12.6130
South America Argentina – peso 4.6613 4.6538 4.6063 4.4888 4.3488 4.2028 4.6613 4.3903 4.1910 Bolivia – boliviano 6.91 6.91 6.91 6.91 6.91 6.92 6.92 6.91 6.91 Brazil – real 2.0269 2.0363 2.0280 2.0587 1.7970 1.7132 2.0940 1.8793 1.6930 Chile – peso 472.45 476.75 482.25 502.15 483.25 475.05 533.45 496.12 472.45 Columbia – peso 1,801 1,803 1,791 1,783 1,759 1,813 1,971 1,830 1,755 Guadeloupe – FRF** 5.0822 5.1916 5.3108 5.2168 5.0039 4.7957 5.4279 5.0469 4.6273 Peru – nuevo sol 2.6045 2.6095 2.6171 2.6745 2.6685 2.7319 2.7840 2.6764 2.6045 Venezuela – bolivar 4.2947 4.2947 4.2947 4.2947 4.2947 4.2947 4.2947 4.2947 4.2947
Africa and Middle-East Algeria – dinar 79.4855 79.9608 81.9331 77.2240 74.4500 74.1410 82.5187 76.1763 73.2208 Egypt – pound 6.0960 6.0943 6.0748 6.0440 6.0328 5.9510 6.1050 6.0311 5.9510 FAC zone – FAC*** 106.726 109.024 111.526 109.552 105.081 100.710 113.986 105.985 97.172 Israel – shekel 3.9555 4.0193 4.0555 3.8683 3.7690 3.7143 4.0785 3.8161 3.5865 Lebanon – pound 1,504 1,506 1,504 1,504 1,504 1,505 1,508 1,504 1,501 Morocco – dirham 8.5992 8.7455 8.9161 8.7968 8.4907 8.2141 9.0789 8.5525 7.9623 Sausi Arabia – riyal 3.7502 3.7502 3.7501 3.7504 3.7504 3.7508 3.7508 3.7503 3.7501 South Africa – rand 8.3560 8.2818 8.1467 8.3638 7.5272 7.3298 8.6308 8.0399 7.3298 Tunisia – dinar 1.5723 1.5929 1.6139 1.6025 1.5143 1.4253 1.6348 1.5256 1.3899 Turkey – lira 1.8100 1.8096 1.7954 1.8171 1.7904 1.7705 1.9181 1.8127 1.7399 United Arab Emirates – dirham 3.6730 3.6731 3.6730 3.6730 3.6730 3.6730 3.6734 3.6730 3.6726
Asia China – yuan renminbi 6.3297 6.3430 6.3617 6.3690 6.3271 6.3990 6.3990 6.3421 6.2939 Hong Kong – dollar 7.7543 7.7567 7.7567 7.7593 7.7594 7.8048 7.8048 7.7661 7.7534 India – rupee 55.345 55.665 55.345 55.570 49.855 47.595 57.125 52.284 47.330 Indonesia – rupiah 9,578 9,565 9,485 9,420 9,165 8,635 9,578 9,166 8,635 Japan – yen 77.490 78.860 78.320 79.410 82.890 76.930 83.715 78.770 75.820 Malaysia – ringgit 3.0805 3.1166 3.1165 3.1765 3.0300 3.0565 3.2105 3.1150 2.9955 Pakistan – rupee 94.65 94.70 94.50 94.39 90.80 87.50 94.95 90.96 86.10 Singapore – dollar 1.2250 1.2428 1.2457 1.2825 1.2582 1.2399 1.3191 1.2678 1.2250 South Korea – won 1,128 1,134 1,131 1,168 1,122 1,077 1,194 1,142 1,077 Taiwan – dollar 29.5650 29.7700 29.9850 29.9490 29.5100 29.4800 30.6550 29.8818 29.1000 Thailand – baht 31.010 31.185 31.425 31.515 30.585 30.190 31.890 31.147 30.190
Europe Denmark – krona 5.7397 5.8995 6.0354 5.9151 5.6832 5.4438 6.1688 5.7218 5.2453 Euro zone – US$/€ 1.2907 1.2635 1.2351 1.2574 1.3109 1.3678 1.4176 1.3014 1.2085 Hungary – forint 216.665 227.080 226.450 235.845 222.680 207.930 249.375 226.413 205.505 Iceland – krona 122.150 123.140 119.520 128.975 127.050 117.265 131.005 122.901 112.715 North Ireland – pound 0.5444 0.5444 0.5444 0.5444 0.5444 0.5444 0.5444 0.5444 0.5444 Norway – kroner 5.7183 5.8477 5.9420 5.9817 5.6976 5.6146 6.1228 5.8386 5.4104 Poland – zloty 3.1383 3.2681 3.3140 3.4271 3.1494 3.1658 3.5533 3.2858 3.0265 Russia – ruble 31.2866 31.9137 31.8512 32.4555 29.4337 30.2340 33.7117 31.1217 28.9975 Sweden – krona 6.5711 6.7467 6.7109 7.0360 6.7734 6.6730 7.2694 6.8059 6.3383 Switzerland – swiss franc 0.9394 0.9547 0.9724 0.9551 0.9199 0.8798 0.9938 0.9313 0.8625 United Kingdom – US$/£ 1.6117 1.5936 1.5704 1.5583 1.5736 1.5790 1.6239 1.5738 1.5285
South Pacific Australia – US$/AUD$ 1.0546 1.0284 1.0519 0.9937 1.0549 1.0315 1.0807 1.0265 0.9519 New Zeland – US$/NZ$ 0.8310 0.8016 0.8091 0.7746 0.8230 0.8228 0.8400 0.7967 0.7392
* In comparison with the U.S. dollar, unless otherwise indicated; ** French Franc; *** Financial African Community: 100 CFA = 1 FRF and 0.655957 FRF = 1 euro.Note: Currency table base on previous day closure.
Currency marketWeek of… Previous data Last 52 weeks
15
Weekly Newsletter September 14, 2012 www.desjardins.com/economics
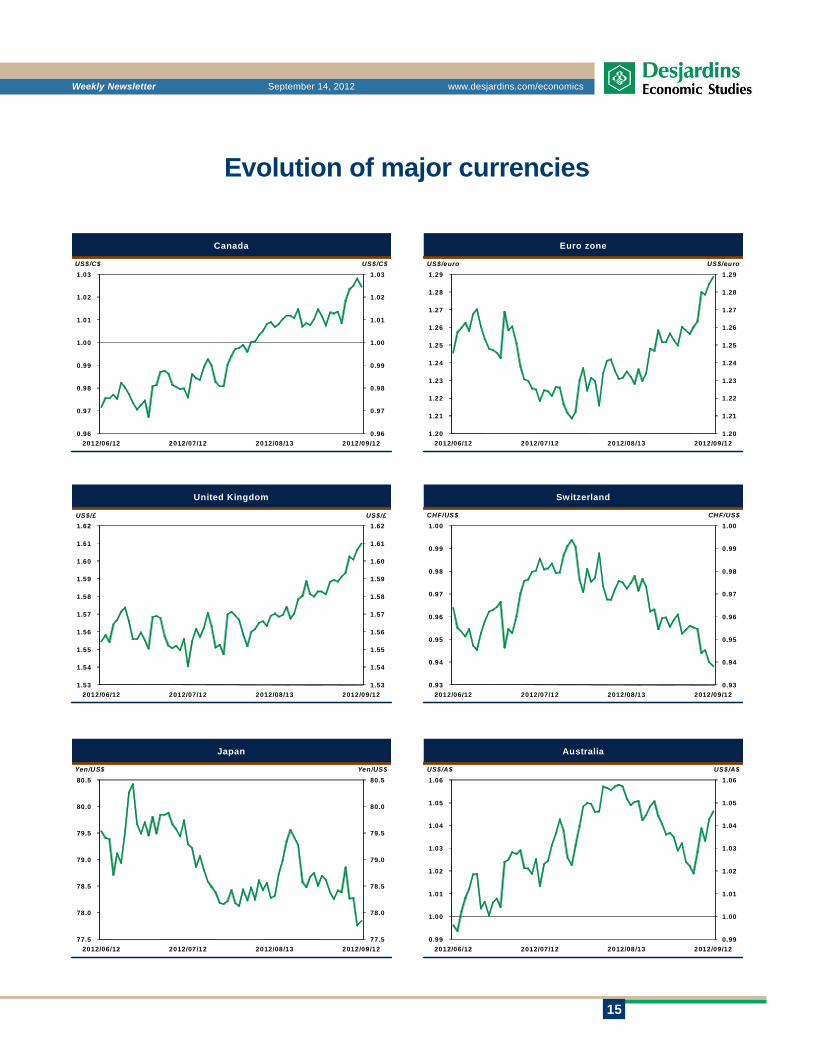
Evolution of major currencies
Canada
0.96
0.97
0.98
0.99
1.00
1.01
1.02
1.03
0.96
0.97
0.98
0.99
1.00
1.01
1.02
1.03
2012/06/12 2012/07/12 2012/08/13 2012/09/12
US$/C$US$/C$
Euro zone
1.20
1.21
1.22
1.23
1.24
1.25
1.26
1.27
1.28
1.29
1.20
1.21
1.22
1.23
1.24
1.25
1.26
1.27
1.28
1.29
2012/06/12 2012/07/12 2012/08/13 2012/09/12
US$/euroUS$/euro
United Kingdom
1.53
1.54
1.55
1.56
1.57
1.58
1.59
1.60
1.61
1.62
1.53
1.54
1.55
1.56
1.57
1.58
1.59
1.60
1.61
1.62
2012/06/12 2012/07/12 2012/08/13 2012/09/12
US$/£US$/£
Switzerland
0.93
0.94
0.95
0.96
0.97
0.98
0.99
1.00
0.93
0.94
0.95
0.96
0.97
0.98
0.99
1.00
2012/06/12 2012/07/12 2012/08/13 2012/09/12
CHF/US$CHF/US$
Japan
77.5
78.0
78.5
79.0
79.5
80.0
80.5
77.5
78.0
78.5
79.0
79.5
80.0
80.5
2012/06/12 2012/07/12 2012/08/13 2012/09/12
Yen/US$Yen/US$
Australia
0.99
1.00
1.01
1.02
1.03
1.04
1.05
1.06
0.99
1.00
1.01
1.02
1.03
1.04
1.05
1.06
2012/06/12 2012/07/12 2012/08/13 2012/09/12
US$/A$US$/A$
16
Weekly Newsletter September 14, 2012 www.desjardins.com/economics
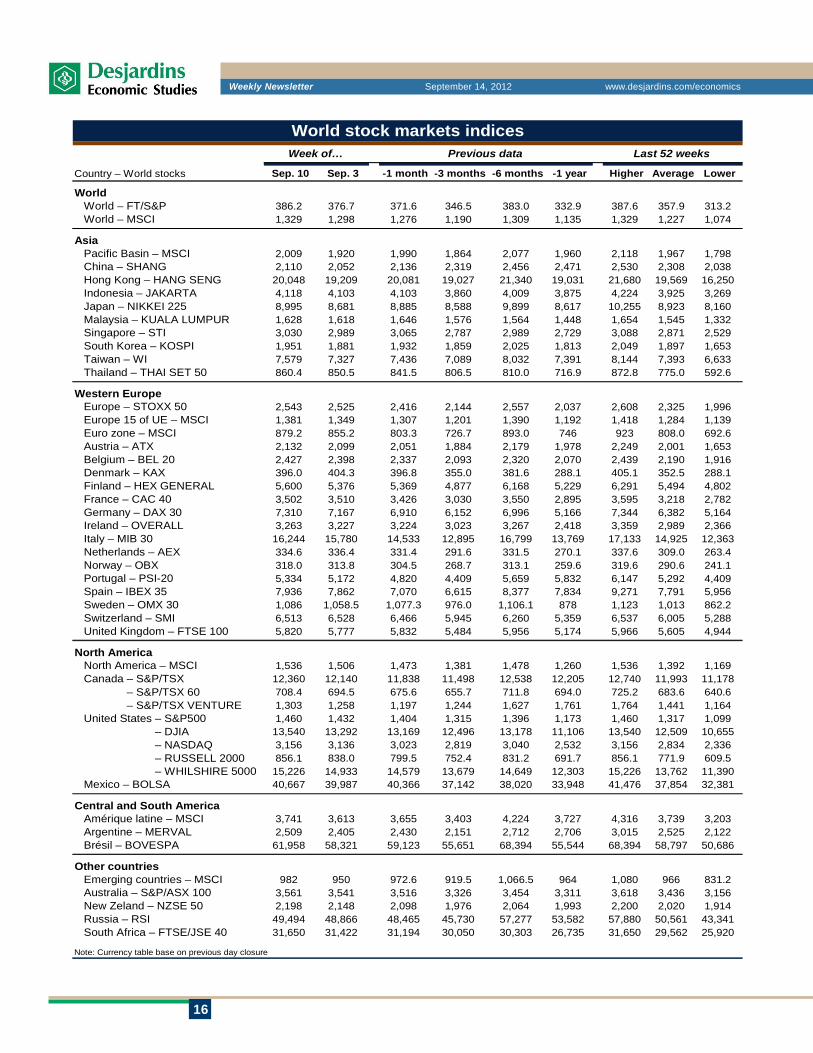
Country – World stocks Sep. 10 Sep. 3 -1 month -3 months -6 months -1 year Higher Average Lower
World World – FT/S&P 386.2 376.7 371.6 346.5 383.0 332.9 387.6 357.9 313.2 World – MSCI 1,329 1,298 1,276 1,190 1,309 1,135 1,329 1,227 1,074
Asia Pacific Basin – MSCI 2,009 1,920 1,990 1,864 2,077 1,960 2,118 1,967 1,798 China – SHANG 2,110 2,052 2,136 2,319 2,456 2,471 2,530 2,308 2,038 Hong Kong – HANG SENG 20,048 19,209 20,081 19,027 21,340 19,031 21,680 19,569 16,250 Indonesia – JAKARTA 4,118 4,103 4,103 3,860 4,009 3,875 4,224 3,925 3,269 Japan – NIKKEI 225 8,995 8,681 8,885 8,588 9,899 8,617 10,255 8,923 8,160 Malaysia – KUALA LUMPUR 1,628 1,618 1,646 1,576 1,564 1,448 1,654 1,545 1,332 Singapore – STI 3,030 2,989 3,065 2,787 2,989 2,729 3,088 2,871 2,529 South Korea – KOSPI 1,951 1,881 1,932 1,859 2,025 1,813 2,049 1,897 1,653 Taiwan – WI 7,579 7,327 7,436 7,089 8,032 7,391 8,144 7,393 6,633 Thailand – THAI SET 50 860.4 850.5 841.5 806.5 810.0 716.9 872.8 775.0 592.6
Western Europe Europe – STOXX 50 2,543 2,525 2,416 2,144 2,557 2,037 2,608 2,325 1,996 Europe 15 of UE – MSCI 1,381 1,349 1,307 1,201 1,390 1,192 1,418 1,284 1,139 Euro zone – MSCI 879.2 855.2 803.3 726.7 893.0 746 923 808.0 692.6 Austria – ATX 2,132 2,099 2,051 1,884 2,179 1,978 2,249 2,001 1,653 Belgium – BEL 20 2,427 2,398 2,337 2,093 2,320 2,070 2,439 2,190 1,916 Denmark – KAX 396.0 404.3 396.8 355.0 381.6 288.1 405.1 352.5 288.1 Finland – HEX GENERAL 5,600 5,376 5,369 4,877 6,168 5,229 6,291 5,494 4,802 France – CAC 40 3,502 3,510 3,426 3,030 3,550 2,895 3,595 3,218 2,782 Germany – DAX 30 7,310 7,167 6,910 6,152 6,996 5,166 7,344 6,382 5,164 Ireland – OVERALL 3,263 3,227 3,224 3,023 3,267 2,418 3,359 2,989 2,366 Italy – MIB 30 16,244 15,780 14,533 12,895 16,799 13,769 17,133 14,925 12,363 Netherlands – AEX 334.6 336.4 331.4 291.6 331.5 270.1 337.6 309.0 263.4 Norway – OBX 318.0 313.8 304.5 268.7 313.1 259.6 319.6 290.6 241.1 Portugal – PSI-20 5,334 5,172 4,820 4,409 5,659 5,832 6,147 5,292 4,409 Spain – IBEX 35 7,936 7,862 7,070 6,615 8,377 7,834 9,271 7,791 5,956 Sweden – OMX 30 1,086 1,058.5 1,077.3 976.0 1,106.1 878 1,123 1,013 862.2 Switzerland – SMI 6,513 6,528 6,466 5,945 6,260 5,359 6,537 6,005 5,288 United Kingdom – FTSE 100 5,820 5,777 5,832 5,484 5,956 5,174 5,966 5,605 4,944
North America North America – MSCI 1,536 1,506 1,473 1,381 1,478 1,260 1,536 1,392 1,169 Canada – S&P/TSX 12,360 12,140 11,838 11,498 12,538 12,205 12,740 11,993 11,178 Canada – S&P/TSX 60 708.4 694.5 675.6 655.7 711.8 694.0 725.2 683.6 640.6 Canada – S&P/TSX VENTURE 1,303 1,258 1,197 1,244 1,627 1,761 1,764 1,441 1,164 United States – S&P500 1,460 1,432 1,404 1,315 1,396 1,173 1,460 1,317 1,099 United States – DJIA 13,540 13,292 13,169 12,496 13,178 11,106 13,540 12,509 10,655 United States – NASDAQ 3,156 3,136 3,023 2,819 3,040 2,532 3,156 2,834 2,336 United States – RUSSELL 2000 856.1 838.0 799.5 752.4 831.2 691.7 856.1 771.9 609.5 United States – WHILSHIRE 5000 15,226 14,933 14,579 13,679 14,649 12,303 15,226 13,762 11,390 Mexico – BOLSA 40,667 39,987 40,366 37,142 38,020 33,948 41,476 37,854 32,381
Central and South America Amérique latine – MSCI 3,741 3,613 3,655 3,403 4,224 3,727 4,316 3,739 3,203 Argentine – MERVAL 2,509 2,405 2,430 2,151 2,712 2,706 3,015 2,525 2,122 Brésil – BOVESPA 61,958 58,321 59,123 55,651 68,394 55,544 68,394 58,797 50,686
Other countries Emerging countries – MSCI 982 950 972.6 919.5 1,066.5 964 1,080 966 831.2 Australia – S&P/ASX 100 3,561 3,541 3,516 3,326 3,454 3,311 3,618 3,436 3,156 New Zeland – NZSE 50 2,198 2,148 2,098 1,976 2,064 1,993 2,200 2,020 1,914 Russia – RSI 49,494 48,866 48,465 45,730 57,277 53,582 57,880 50,561 43,341 South Africa – FTSE/JSE 40 31,650 31,422 31,194 30,050 30,303 26,735 31,650 29,562 25,920
Note: Currency table base on previous day closure
World stock markets indicesWeek of… Previous data Last 52 weeks
17
Weekly Newsletter September 14, 2012 www.desjardins.com/economics
Evolution of major stock market indices
Canada – S&P/TSX
11,300
11,400
11,500
11,600
11,700
11,800
11,900
12,000
12,100
12,200
12,300
11,300
11,400
11,500
11,600
11,700
11,800
11,900
12,000
12,100
12,200
12,300
2012/06/12 2012/07/12 2012/08/13 2012/09/12
IndexIndex
United States – S&P500
1,310
1,330
1,350
1,370
1,390
1,410
1,430
1,310
1,330
1,350
1,370
1,390
1,410
1,430
2012/06/12 2012/07/12 2012/08/13 2012/09/12
IndexIndex
Germany – DAX 30
6,100
6,300
6,500
6,700
6,900
7,100
7,300
6,100
6,300
6,500
6,700
6,900
7,100
7,300
2012/06/12 2012/07/12 2012/08/13 2012/09/12
IndexIndex
France – CAC 40
2,925
3,000
3,075
3,150
3,225
3,300
3,375
3,450
3,525
3,600
2,925
3,000
3,075
3,150
3,225
3,300
3,375
3,450
3,525
3,600
2012/06/12 2012/07/12 2012/08/13 2012/09/12
IndexIndex
United Kingdom – FTSE 100
5,425
5,500
5,575
5,650
5,725
5,800
5,875
5,425
5,500
5,575
5,650
5,725
5,800
5,875
2012/06/12 2012/07/12 2012/08/13 2012/09/12
IndexIndex
Japan – NIKKEI 225
8,300
8,400
8,500
8,600
8,700
8,800
8,900
9,000
9,100
9,200
8,300
8,400
8,500
8,600
8,700
8,800
8,900
9,000
9,100
9,200
2012/06/12 2012/07/12 2012/08/13 2012/09/12
IndexIndex
18
Weekly Newsletter September 14, 2012 www.desjardins.com/economics
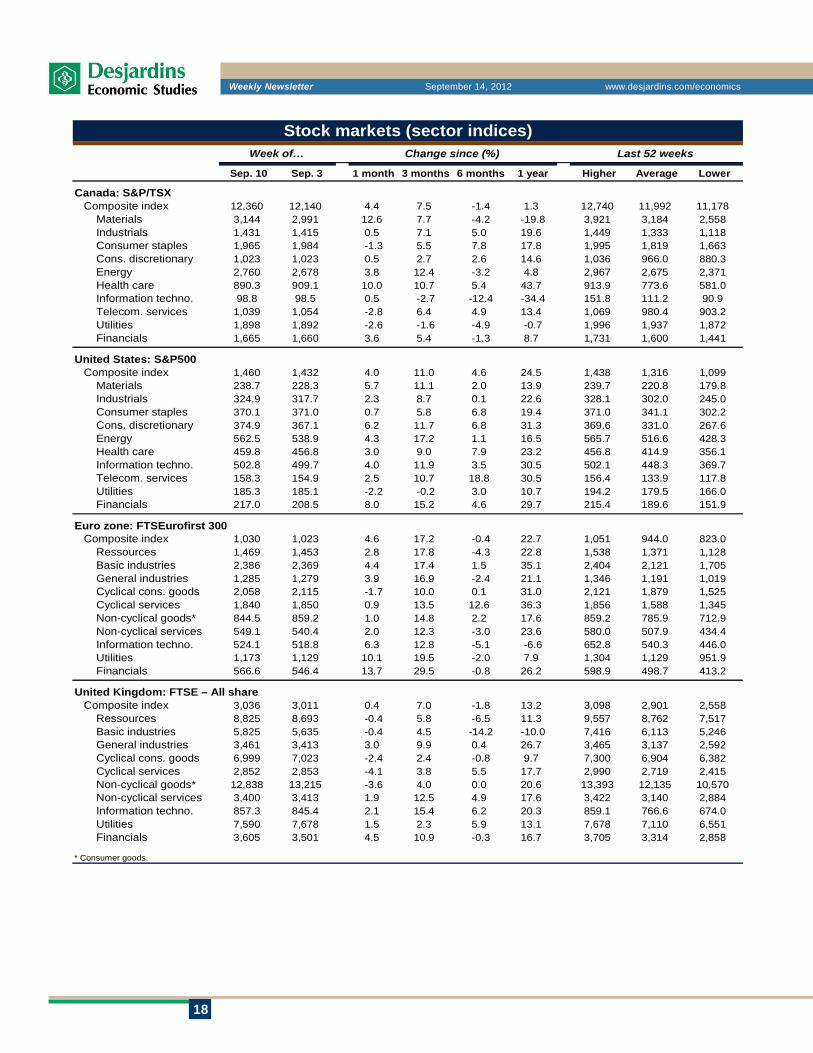
Sep. 10 Sep. 3 1 month 3 months 6 months 1 year Higher Average Lower
Canada: S&P/TSX Composite index 12,360 12,140 4.4 7.5 -1.4 1.3 12,740 11,992 11,178 Materials 3,144 2,991 12.6 7.7 -4.2 -19.8 3,921 3,184 2,558 Industrials 1,431 1,415 0.5 7.1 5.0 19.6 1,449 1,333 1,118 Consumer staples 1,965 1,984 -1.3 5.5 7.8 17.8 1,995 1,819 1,663 Cons. discretionary 1,023 1,023 0.5 2.7 2.6 14.6 1,036 966.0 880.3 Energy 2,760 2,678 3.8 12.4 -3.2 4.8 2,967 2,675 2,371 Health care 890.3 909.1 10.0 10.7 5.4 43.7 913.9 773.6 581.0 Information techno. 98.8 98.5 0.5 -2.7 -12.4 -34.4 151.8 111.2 90.9 Telecom. services 1,039 1,054 -2.8 6.4 4.9 13.4 1,069 980.4 903.2 Utilities 1,898 1,892 -2.6 -1.6 -4.9 -0.7 1,996 1,937 1,872 Financials 1,665 1,660 3.6 5.4 -1.3 8.7 1,731 1,600 1,441
United States: S&P500 Composite index 1,460 1,432 4.0 11.0 4.6 24.5 1,438 1,316 1,099 Materials 238.7 228.3 5.7 11.1 2.0 13.9 239.7 220.8 179.8 Industrials 324.9 317.7 2.3 8.7 0.1 22.6 328.1 302.0 245.0 Consumer staples 370.1 371.0 0.7 5.8 6.8 19.4 371.0 341.1 302.2 Cons. discretionary 374.9 367.1 6.2 11.7 6.8 31.3 369.6 331.0 267.6 Energy 562.5 538.9 4.3 17.2 1.1 16.5 565.7 516.6 428.3 Health care 459.8 456.8 3.0 9.0 7.9 23.2 456.8 414.9 356.1 Information techno. 502.8 499.7 4.0 11.9 3.5 30.5 502.1 448.3 369.7 Telecom. services 158.3 154.9 2.5 10.7 18.8 30.5 156.4 133.9 117.8 Utilities 185.3 185.1 -2.2 -0.2 3.0 10.7 194.2 179.5 166.0 Financials 217.0 208.5 8.0 15.2 4.6 29.7 215.4 189.6 151.9
Euro zone: FTSEurofirst 300 Composite index 1,030 1,023 4.6 17.2 -0.4 22.7 1,051 944.0 823.0 Ressources 1,469 1,453 2.8 17.8 -4.3 22.8 1,538 1,371 1,128 Basic industries 2,386 2,369 4.4 17.4 1.5 35.1 2,404 2,121 1,705 General industries 1,285 1,279 3.9 16.9 -2.4 21.1 1,346 1,191 1,019 Cyclical cons. goods 2,058 2,115 -1.7 10.0 0.1 31.0 2,121 1,879 1,525 Cyclical services 1,840 1,850 0.9 13.5 12.6 36.3 1,856 1,588 1,345 Non-cyclical goods* 844.5 859.2 1.0 14.8 2.2 17.6 859.2 785.9 712.9 Non-cyclical services 549.1 540.4 2.0 12.3 -3.0 23.6 580.0 507.9 434.4 Information techno. 524.1 518.8 6.3 12.8 -5.1 -6.6 652.8 540.3 446.0 Utilities 1,173 1,129 10.1 19.5 -2.0 7.9 1,304 1,129 951.9 Financials 566.6 546.4 13.7 29.5 -0.8 26.2 598.9 498.7 413.2
United Kingdom: FTSE – All share Composite index 3,036 3,011 0.4 7.0 -1.8 13.2 3,098 2,901 2,558 Ressources 8,825 8,693 -0.4 5.8 -6.5 11.3 9,557 8,762 7,517 Basic industries 5,825 5,635 -0.4 4.5 -14.2 -10.0 7,416 6,113 5,246 General industries 3,461 3,413 3.0 9.9 0.4 26.7 3,465 3,137 2,592 Cyclical cons. goods 6,999 7,023 -2.4 2.4 -0.8 9.7 7,300 6,904 6,382 Cyclical services 2,852 2,853 -4.1 3.8 5.5 17.7 2,990 2,719 2,415 Non-cyclical goods* 12,838 13,215 -3.6 4.0 0.0 20.6 13,393 12,135 10,570 Non-cyclical services 3,400 3,413 1.9 12.5 4.9 17.6 3,422 3,140 2,884 Information techno. 857.3 845.4 2.1 15.4 6.2 20.3 859.1 766.6 674.0 Utilities 7,590 7,678 1.5 2.3 5.9 13.1 7,678 7,110 6,551 Financials 3,605 3,501 4.5 10.9 -0.3 16.7 3,705 3,314 2,858
* Consumer goods.
Stock markets (sector indices)Week of… Change since (%) Last 52 weeks