Embed Size (px)
Citation preview
November 10, 2007 AEA Conference at the Sheraton HotelBaltimore, Maryland
Follow-up Monitoring and Outcome Survey for
National R&D Projects at NEDO
Presenters: Hiroyuki Usuda [email protected]
Kazuaki Kohmoto [email protected]
Chairperson: Momoko Okada [email protected]
2
Contents
Introduction of NEDO and Evaluation Practices (10 min.)
Part Ⅰ-Study of the Relation Between Ex-post Evaluation
and Follow-up Monitoring of National R&D (15min.)
Introduction of Follow-up Monitoring and Evaluations
(5min.)
Part Ⅱ-Study of Important Management Factors Based on
Follow-up Monitoring Data (15min.)
Part Ⅲ-An Approach to Understanding Outcomes of National
R&D
in Energy Conservation Project (15min.)

3
What’s NEDO ?
4
New Energy and Industrial Technology Development Organization
Japan’s largest public R&D management organizationJapan’s largest public R&D management organization
5
-Established in October 1980 as a semi-governmental organization under the supervision of METI.
- Original activities : ・ National R&D projects on new energy -Current activities : ・ Support of industrial technology R&D (since 1988), ・ Support of environmental technology R&D (since 1990), ・ Introduction and promotion of new energy and energy
conservation technology (since1993), and ・ Acquisition of Kyoto Mechanism Credits (since 2006).
-NEDO became an Incorporated Administrative Agency in October 2003 as part of the process of overall government reforms.
History of NEDO
6
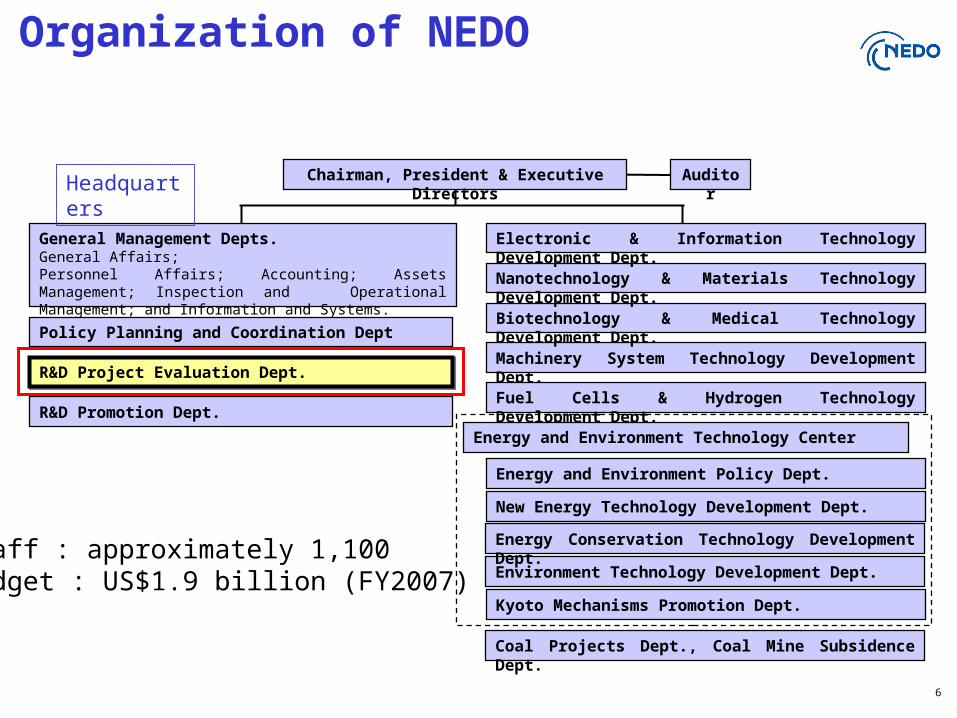
Machinery System Technology Development Dept.
Fuel Cells & Hydrogen Technology Development Dept.
Environment Technology Development Dept.
New Energy Technology Development Dept.
Energy Conservation Technology Development Dept.
Coal Projects Dept., Coal Mine Subsidence Dept.
Biotechnology & Medical Technology Development Dept.
Nanotechnology & Materials Technology Development Dept.
Electronic & Information Technology Development Dept.
R&D Promotion Dept.
R&D Project Evaluation Dept.R&D Project Evaluation Dept.
Policy Planning and Coordination Dept
General Management Depts.General Affairs; Personnel Affairs; Accounting; Assets Management; Inspection and Operational Management; and Information and Systems.
Chairman, President & Executive Directors AuditorHeadquarters
Kyoto Mechanisms Promotion Dept.
Energy and Environment Technology Center
Energy and Environment Policy Dept.
Staff : approximately 1,100 Budget : US$1.9 billion (FY2007)
Organization of NEDO
7
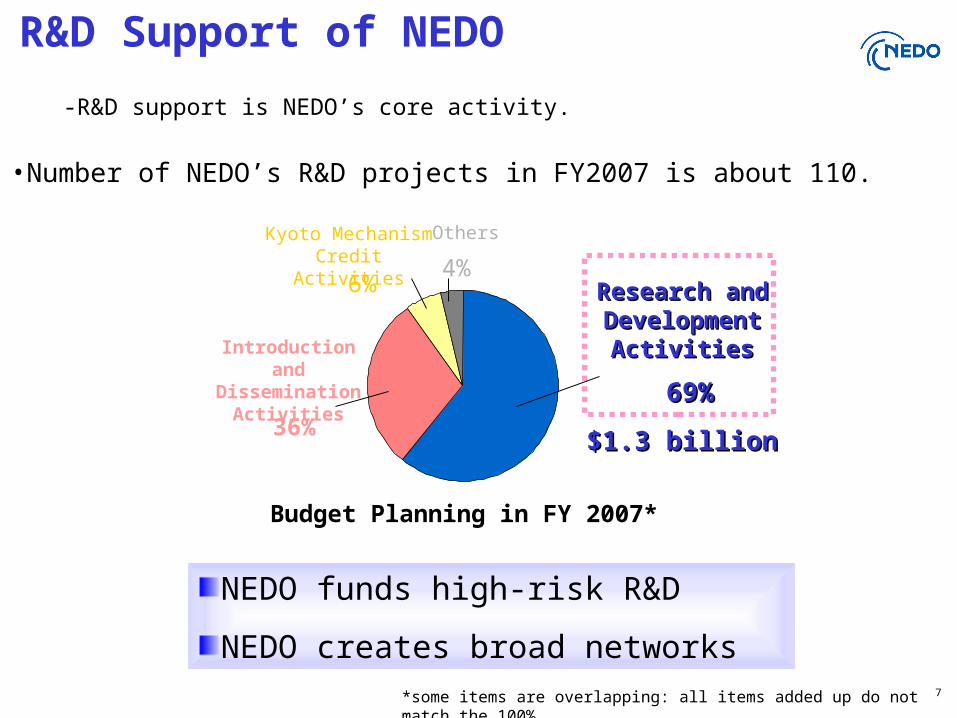
-R&D support is NEDO’s core activity.
R&D Support of NEDO
•Number of NEDO’s R&D projects in FY2007 is about 110.
Budget Planning in FY 2007*
Research and Research and Development Development
ActivitiesActivities
69%69%
$1.3 billion $1.3 billion
Introduction and Dissemination
Activities
36%
Kyoto Mechanism Credit Activities
6%
Others
4%
NEDO funds high-risk R&D
NEDO creates broad networks*some items are overlapping: all items added up do not match the 100%
8
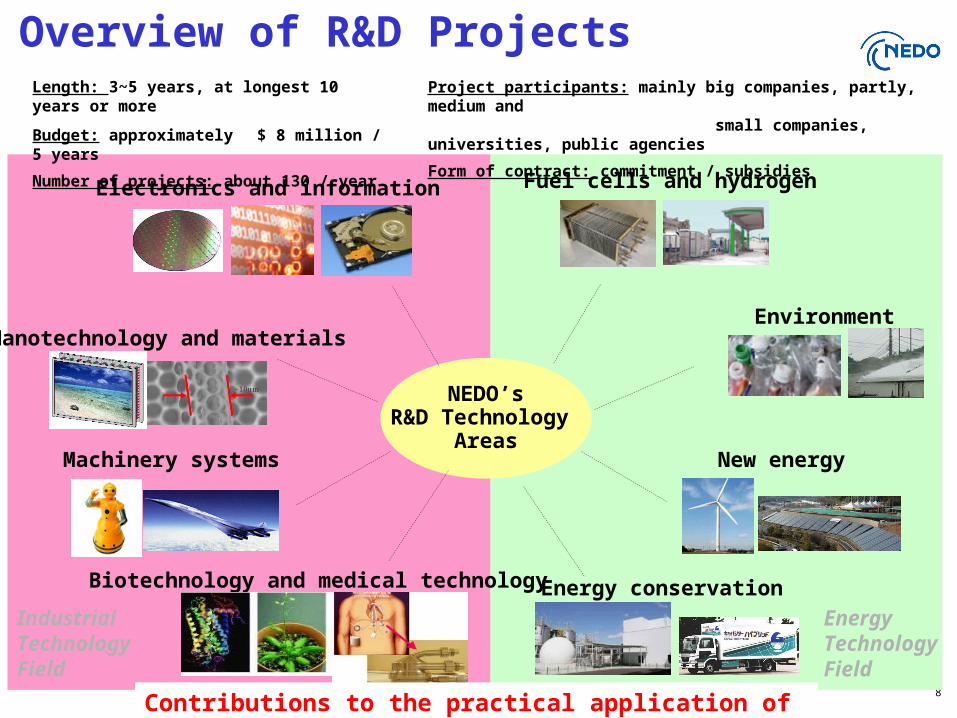
NEDO’sR&D Technology
AreasMachinery systems
Nanotechnology and materials
Electronics and information Fuel cells and hydrogen
Biotechnology and medical technology
Environment
New energy
Energy conservation
Industrial Technology Field
Energy Technology Field
Overview of R&D ProjectsLength: 3~5 years, at longest 10 years or more
Budget: approximately $ 8 million / 5 years
Number of projects: about 130 / year
Project participants: mainly big companies, partly, medium and small companies, universities, public agencies
Form of contract: commitment / subsidies
Contributions to the practical application of technology
9
How Does NEDO Evaluate R&D
Projects ?
10
NEDO’s Successful AchievementsNEDO’s Successful AchievementsAccessible ProjectsAccessible Projects
Easy-to-understand InformationEasy-to-understand Information
NEDO’s Successful AchievementsNEDO’s Successful AchievementsAccessible ProjectsAccessible Projects
Easy-to-understand InformationEasy-to-understand Information PlanPlanning and Assessment
PlanPlanning and Assessment
SeeTechnology Evaluation
SeeTechnology Evaluation
DoProject Management
DoProject Management
Optimal Optimal Project ManagementProject Management
Optimal Optimal Project ManagementProject Management
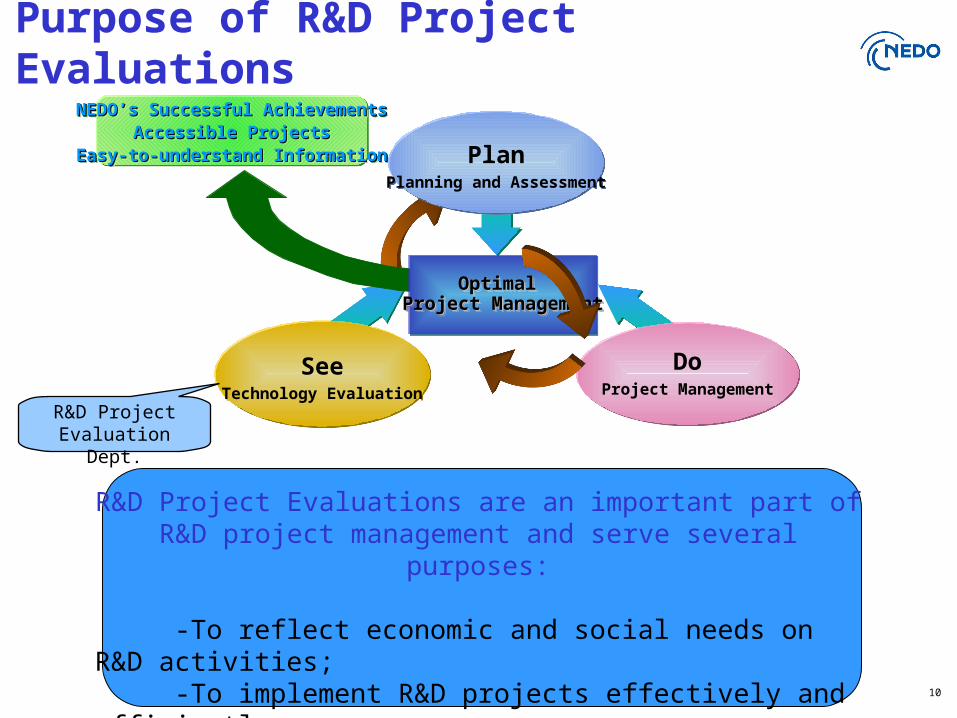
R&D Project Evaluations are an important part of R&D project management and serve several purposes:
-To reflect economic and social needs on R&D activities; -To implement R&D projects effectively and efficiently; -To improve the overall project management.
Purpose of R&D Project Evaluations
R&D Project Evaluation Dept.
11
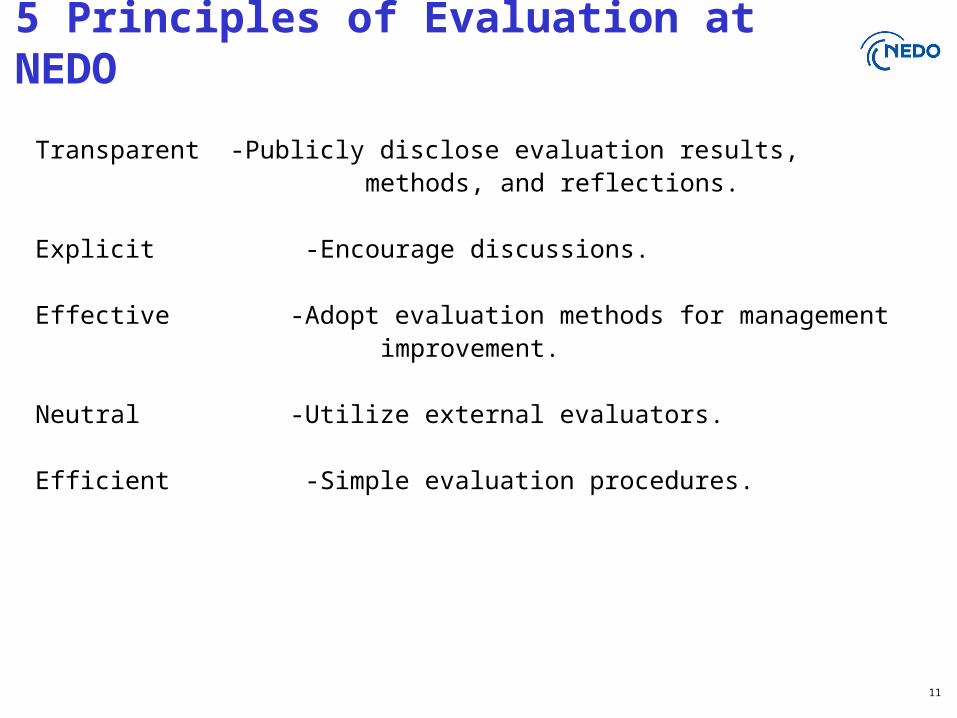
Transparent -Publicly disclose evaluation results, methods, and reflections.
Explicit -Encourage discussions.
Effective -Adopt evaluation methods for management improvement.
Neutral -Utilize external evaluators.
Efficient -Simple evaluation procedures.
5 Principles of Evaluation at NEDO
12
Post-project activityProject implementation
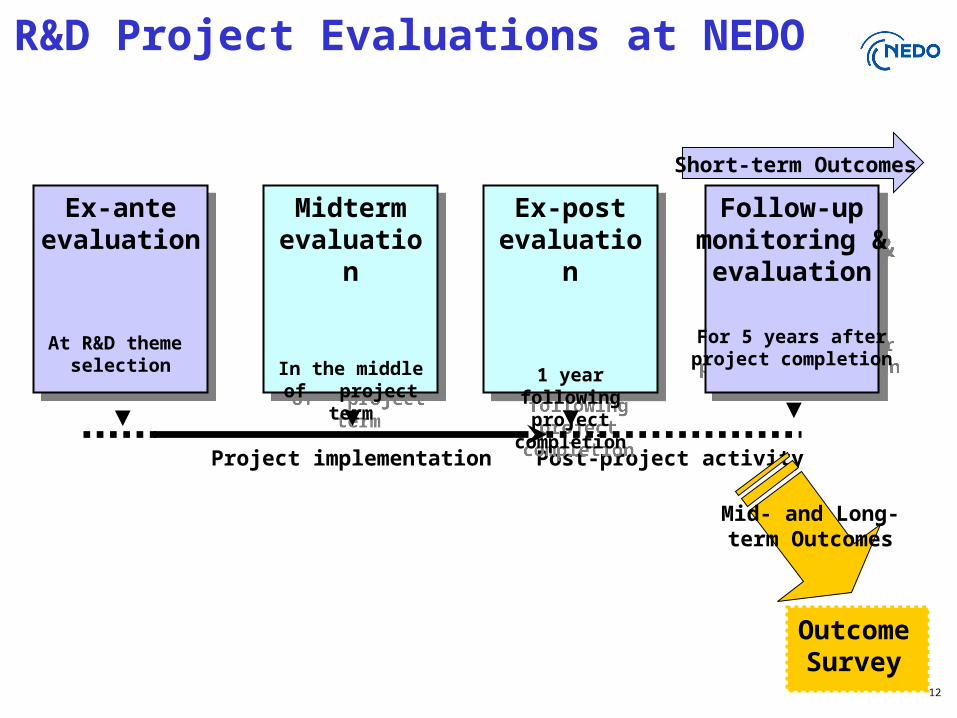
Ex-anteevaluation
At R&D theme selection
Ex-anteevaluation
At R&D theme selection
Midtermevaluation
In the middle of project term
Midtermevaluation
In the middle of project term
Ex-postevaluation
1 year followingproject completion
Ex-postevaluation
1 year followingproject completion
▼ ▼ ▼ ▼
Follow-upmonitoring &
evaluation
For 5 years afterproject completion
Follow-upmonitoring &
evaluation
For 5 years afterproject completion
R&D Project Evaluations at NEDO
Short-term Outcomes
Outcome Survey
Mid- and Long-term Outcomes
Study of the Relation Between Ex-post Evaluation and Follow-up Monitoring of National Research and Development(Part 1)
Hiroyuki USUDANew Energy and Industrial Technology
Development Organization (NEDO)
November 10, 2007AEA Conference
14
OUTLINE
- Results
- R&D EVALUATION SYSTEM AT NEDO (Overview)-EX-POST EVALUATIONS
-FOLLOW-UP MONITORING & EVALUATION
- Objectives of the study
- Data
- Conclusion
15
R&D EVALUATION SYSTEM AT NEDO (Overview)
- EX-POST EVALUATIONS- FOLLOW-UP MONITORING & EVALUATION
16
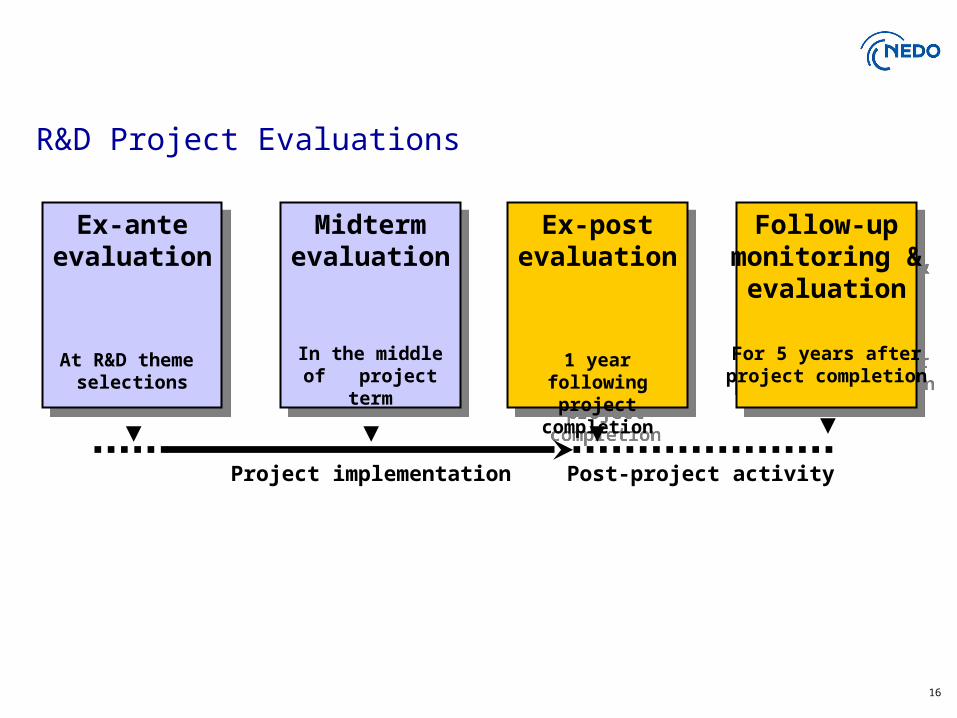
R&D Project Evaluations
Post-project activityProject implementation
Ex-anteevaluation
At R&D theme selections
Ex-anteevaluation
At R&D theme selections
Midtermevaluation
In the middle of project term
Midtermevaluation
In the middle of project term
Ex-postevaluation
1 year followingproject completion
Ex-postevaluation
1 year followingproject completion
▼ ▼ ▼ ▼
Follow-upmonitoring &
evaluation
For 5 years afterproject completion
Follow-upmonitoring &
evaluation
For 5 years afterproject completion
17
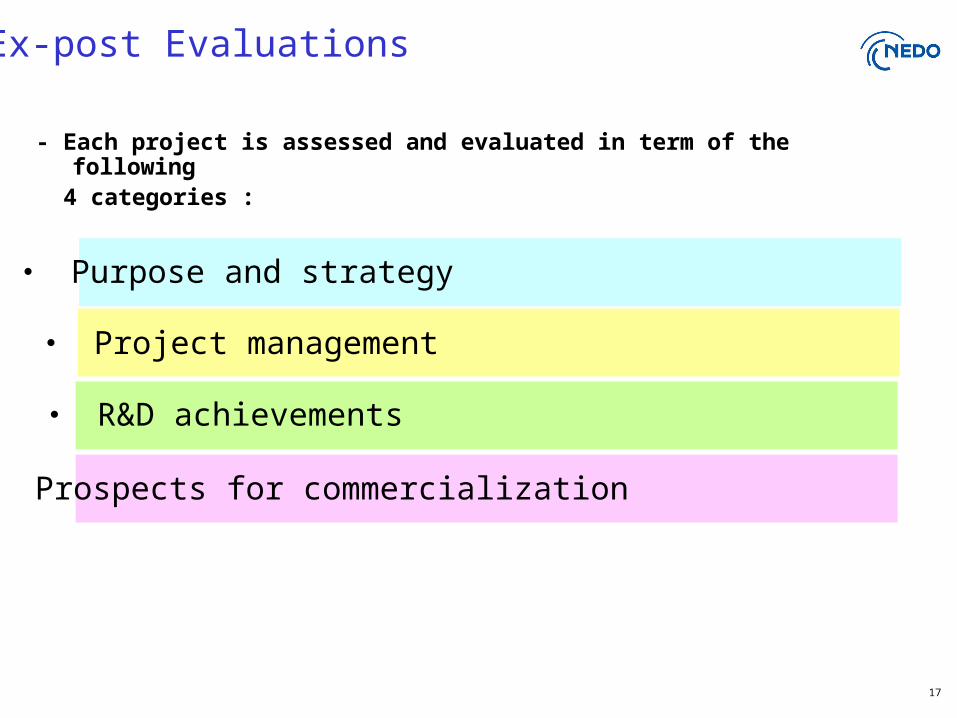
- Each project is assessed and evaluated in term of the following 4 categories :
・ Purpose and strategy
・ Project management
・ R&D achievements
・ Prospects for commercialization
Ex-post Evaluations
18
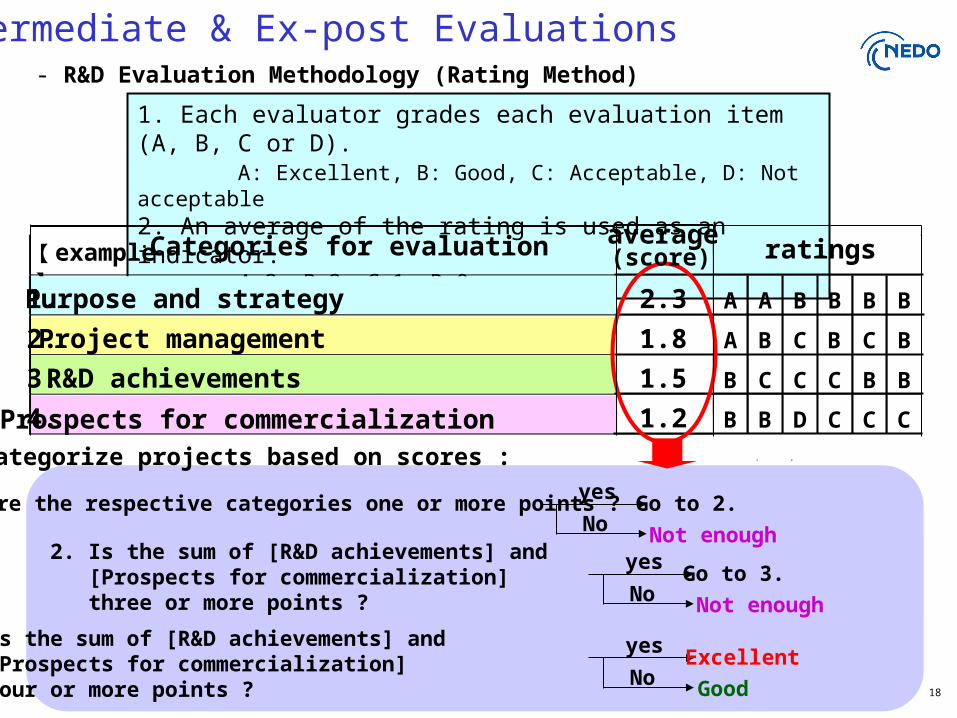
- R&D Evaluation Methodology (Rating Method)
1. Each evaluator grades each evaluation item (A, B, C or D). A: Excellent, B: Good, C: Acceptable, D: Not acceptable2. An average of the rating is used as an indicator. A=3, B=2, C=1, D=0
【 example】
Categorize projects based on scores :
1. Are the respective categories one or more points ?
Not enough
yes
NoGo to 2.
2. Is the sum of [R&D achievements] and [Prospects for commercialization] three or more points ? Not enough
yes
NoGo to 3.
yes3. Is the sum of [R&D achievements] and [Prospects for commercialization] four or more points ? GoodNo
Excellent
Categories for evaluation average
ratings
1. Purpose and strategy 2.3 A A B B B B
2. Project management 1.8 A B C B C B
3. R&D achievements 1.5 B C C C B B
4. Prospects for commercialization 1.2 B B D C C C
(score)
Intermediate & Ex-post Evaluations
19
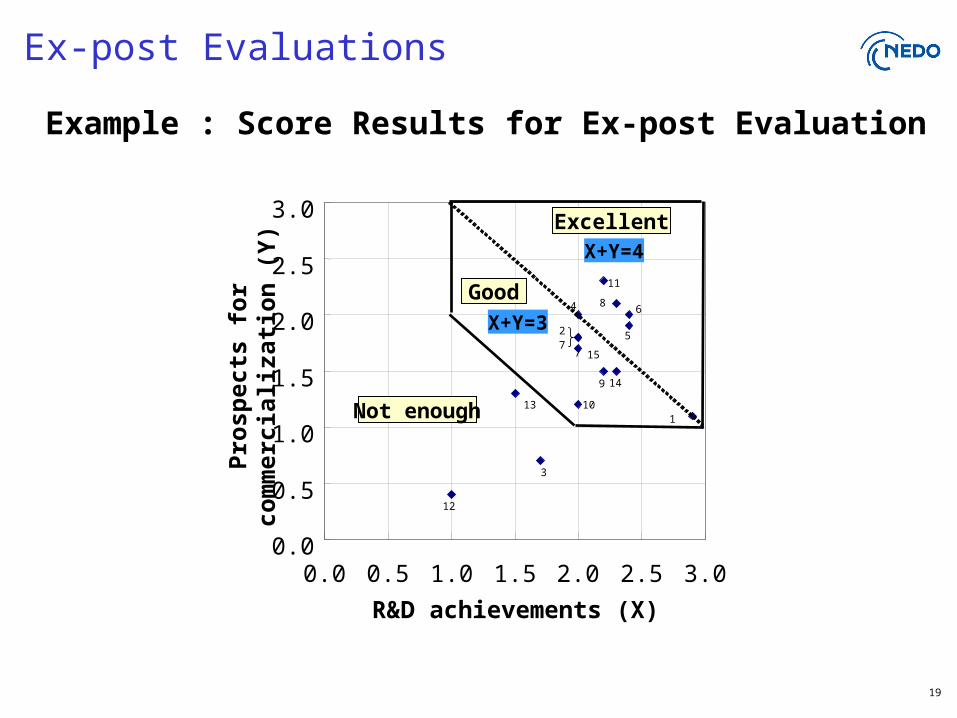
Example : Score Results for Ex-post Evaluation
Pro
spec
ts f
or c
omm
erci
aliz
atio
n (Y
)
R&D achievements (X)
12
14
1
4
2
7
15
9
11
0.0
0.5
1.0
1.5
2.0
2.5
3.0
0.0 0.5 1.0 1.5 2.0 2.5 3.0
X+Y=4
X+Y=3
3
5
6
7
8
1013
Excellent
Good
Ex-post Evaluations
Not enough
20
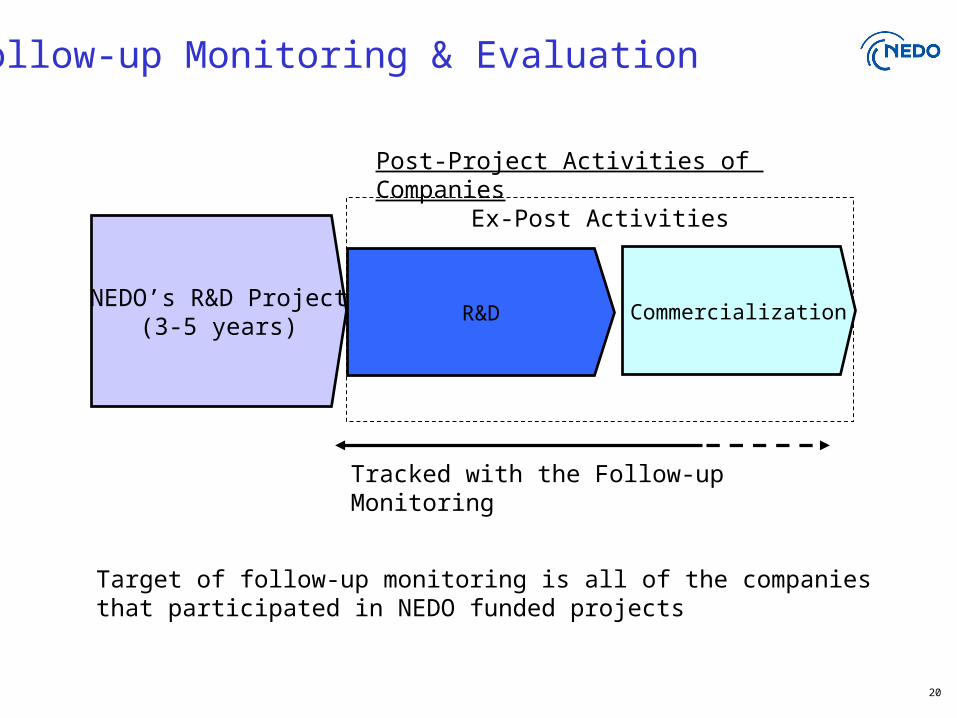
Tracked with the Follow-up Monitoring
Ex-Post Activities
NEDO’s R&D Project(3-5 years)
R&D Commercialization
Post-Project Activities of Companies
Follow-up Monitoring & Evaluation
Target of follow-up monitoring is all of the companies that participated in NEDO funded projects
21
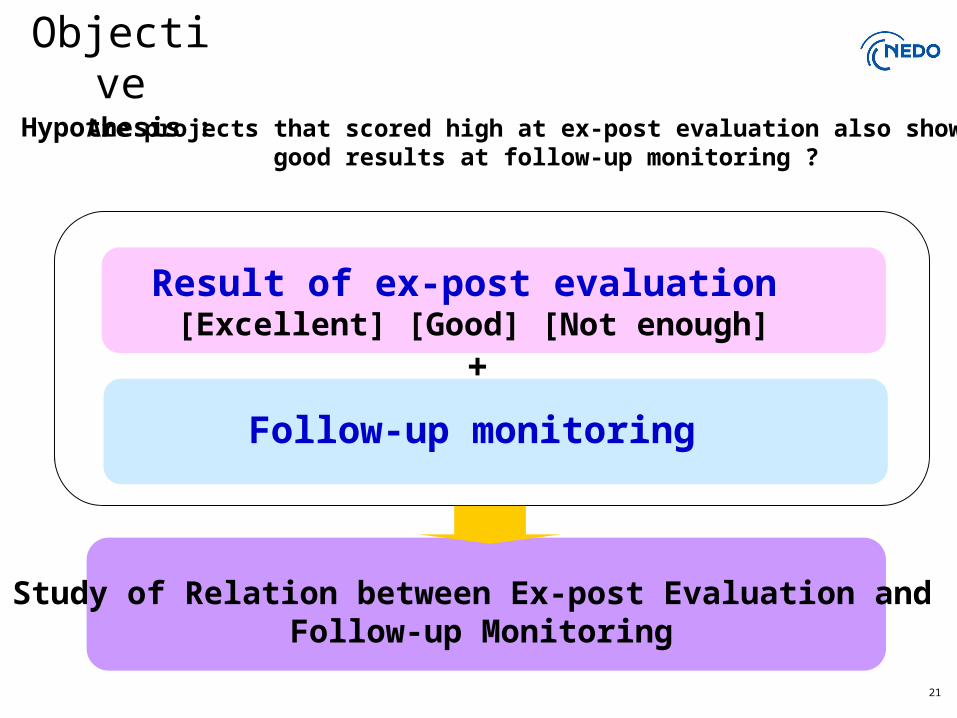
Objective
Result of ex-post evaluation [Excellent] [Good] [Not enough]
Follow-up monitoring
+
Study of Relation between Ex-post Evaluation and Follow-up Monitoring
Hypothesis : Are projects that scored high at ex-post evaluation also showing good results at follow-up monitoring ?
22
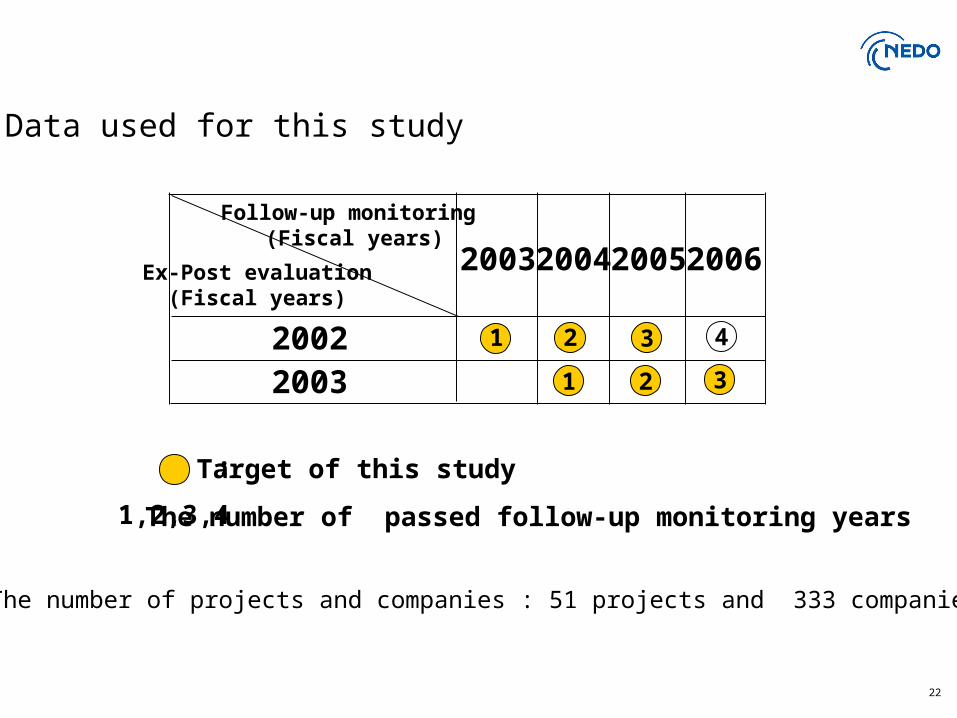
1,2,3,4
: Target of this study
: The number of passed follow-up monitoring years
Data used for this study
The number of projects and companies : 51 projects and 333 companies
Ex-Post evaluation(Fiscal years)
Follow-up monitoring (Fiscal years)
20022003
2003 2004 2005 2006
1 2 3 4
1 2 3
23
0
0.5
1.0
1.5
2.0
2.5
3.0
0 0.5 1.0 1.5 2.0 2.5 3.0
Excellent
R&D achievements (X)
Pro
spec
ts f
or C
omm
erci
aliz
atio
n (
Y)
Good
Not enough
Excellent
Good
Not enough
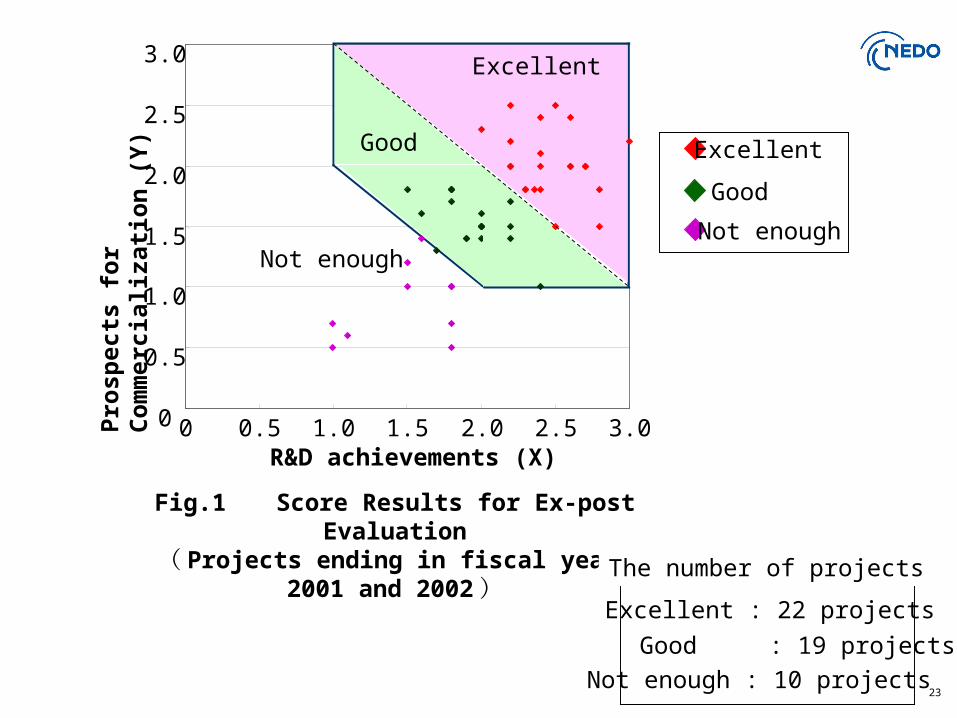
Fig.1 Score Results for Ex-post Evaluation( Projects ending in fiscal years 2001 and 2002 )
Excellent : 22 projects
Good : 19 projects
Not enough : 10 projects
The number of projects
24
0
20
40
60
80
100
1st year 2nd year 3rd year
ExcellentGoodNot enough
Con
tinu
ity
R&
D (
% )
The number of follow-up monitoring years
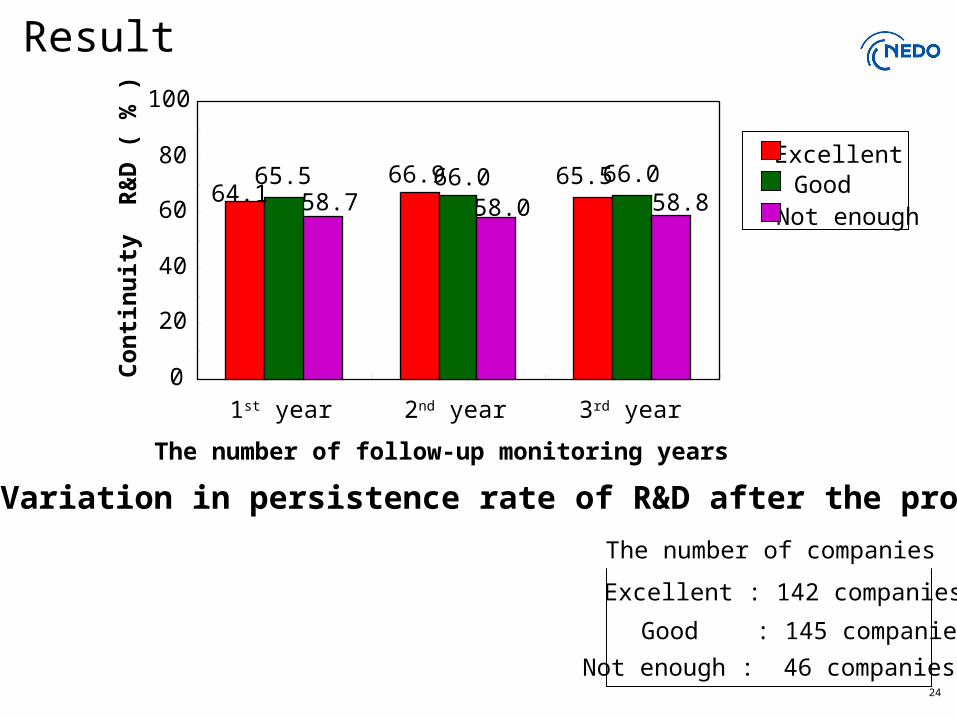
Fig.2 Variation in persistence rate of R&D after the projects
Result
Excellent : 142 companies
Good : 145 companies
Not enough : 46 companies
The number of companies
64.166.9 65.565.5 66.0 66.0
58.7 58.0 58.8
25
02468
101214161820
ExcellentGoodNot enough
Th
e ra
te o
f co
mm
erci
aliz
atio
n (
% )
The number of follow-up monitoring years
1st year 2nd year 3rd year
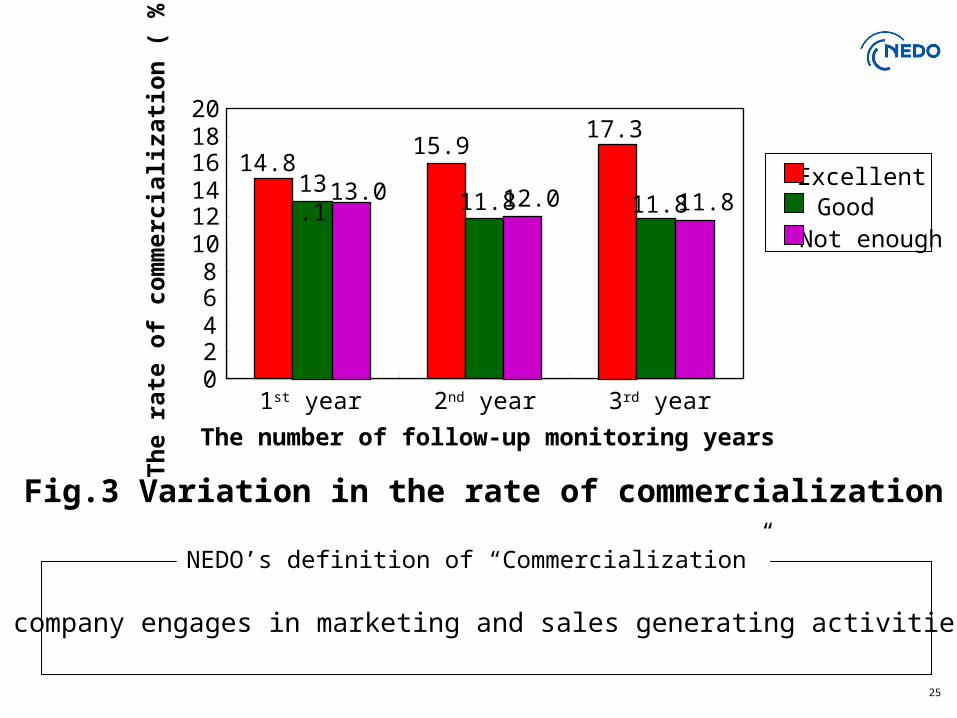
Fig.3 Variation in the rate of commercialization
NEDO’s definition of “Commercialization”
14.815.9
17.3
13.1 11.8 11.813.0 12.0 11.8
A company engages in marketing and sales generating activities.
26
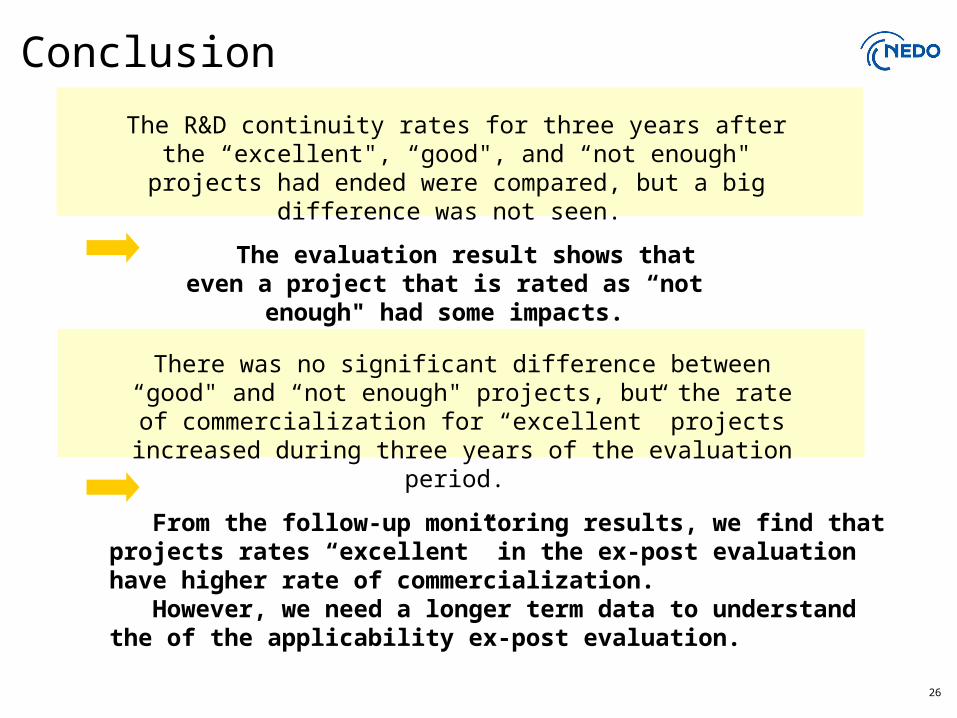
Conclusion
The R&D continuity rates for three years after the “excellent", “good", and “not enough" projects had ended were compared, but a big
difference was not seen.
The evaluation result shows that even a project that is rated as “not enough" had some impacts.
There was no significant difference between “good" and “not enough" projects, but the rate of commercialization for “excellent” projects
increased during three years of the evaluation period.
From the follow-up monitoring results, we find that projects rates “excellent” in the ex-post evaluation have higher rate of commercialization. However, we need a longer term data to understand the of the applicability ex-post evaluation.
27
Thank you for your kind attention.
To be continued….
28
Introduction toFollow-up Monitoring and
Evaluations
29
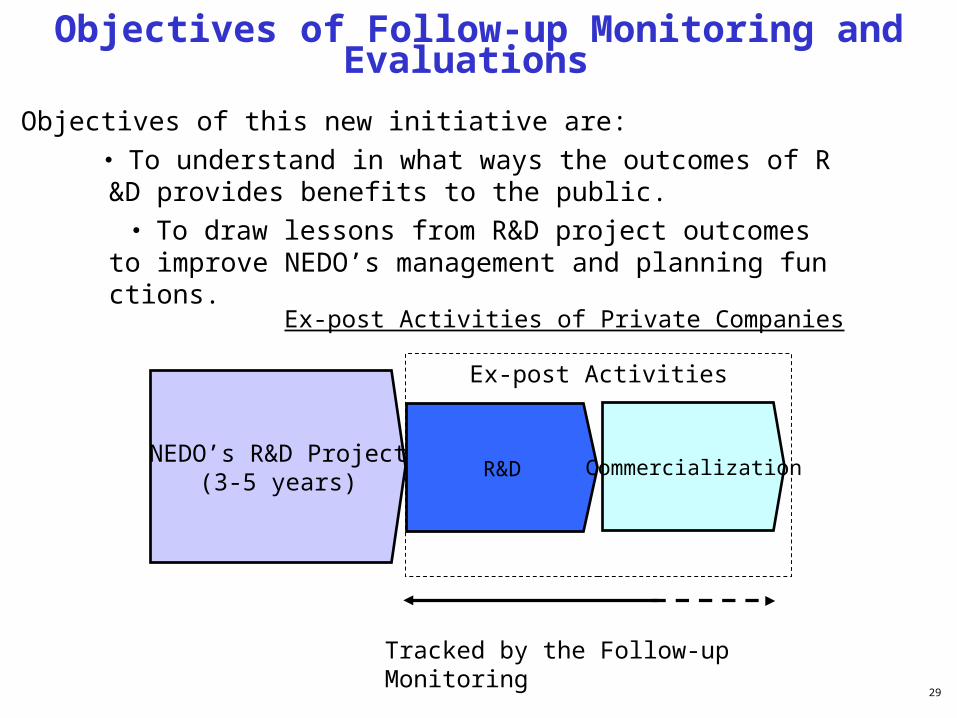
Objectives of this new initiative are:
・ To understand in what ways the outcomes of R&D provides benefits to the public.
・ To draw lessons from R&D project outcomes to improve NEDO’s management and planning functions.
Tracked by the Follow-up Monitoring
Ex-post Activities
NEDO’s R&D Project(3-5 years)
R&D Commercialization
Ex-post Activities of Private Companies
Objectives of Follow-up Monitoring and Evaluations
30
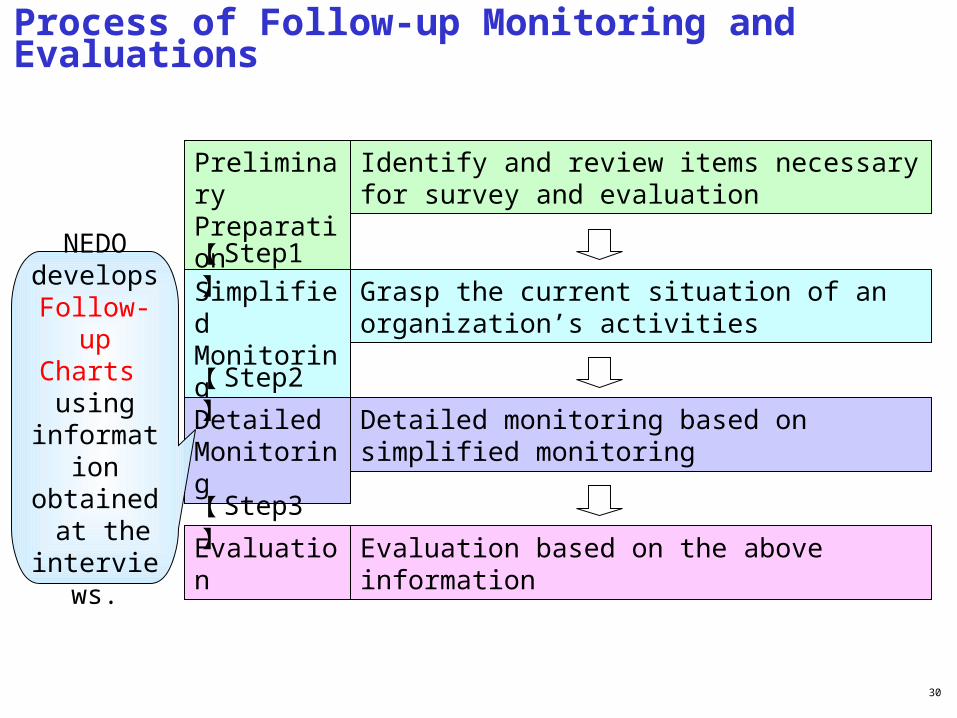
Identify and review items necessary for survey and evaluation
PreliminaryPreparation
Grasp the current situation of an organization’s activities
Simplified Monitoring
Detailed monitoring based on simplified monitoring
Detailed Monitoring
Evaluation based on the above informationEvaluation
【 Step1 】
【 Step2 】
【 Step3 】
NEDO develops Follow-up
Charts using
information obtained at the
interviews.
Process of Follow-up Monitoring and Evaluations
Study of Important Management Factors Based on Follow-Up Monitoring Data
(Part II)
Kazuaki Komoto
New Energy and Industrial Technology Development Organization
32
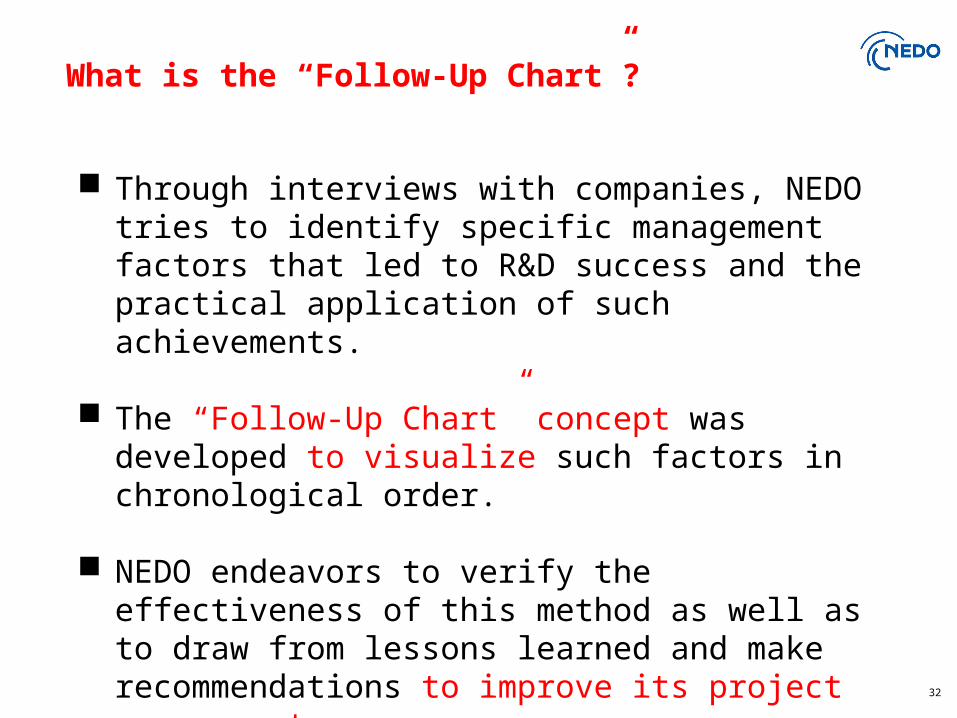
Through interviews with companies, NEDO tries to identify specific management factors that led to R&D success and the practical application of such achievements.
The “Follow-Up Chart” concept was developed to visualize such factors in chronological order.
NEDO endeavors to verify the effectiveness of this method as well as to draw from lessons learned and make recommendations to improve its project management.
What is the “Follow-Up Chart”?
33
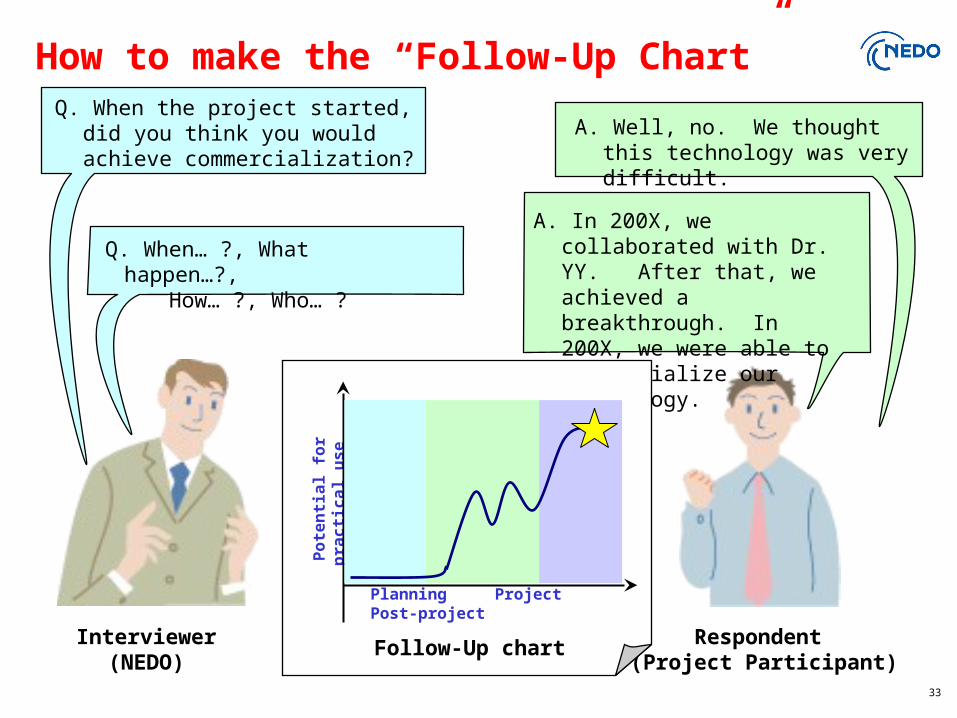
How to make the “Follow-Up Chart”
Interviewer(NEDO)
Respondent (Project Participant)
Q. When the project started, did you think you would achieve commercialization?
A. Well, no. We thought this technology was very difficult.
Q. When… ?, What happen…?, How… ?, Who… ?
A. In 200X, we collaborated with Dr. YY. After that, we achieved a breakthrough. In 200X, we were able to commercialize our technology.
Planning Project Post-project
Po
ten
tia
l fo
r p
rac
tic
al
us
e
Follow-Up chart
34
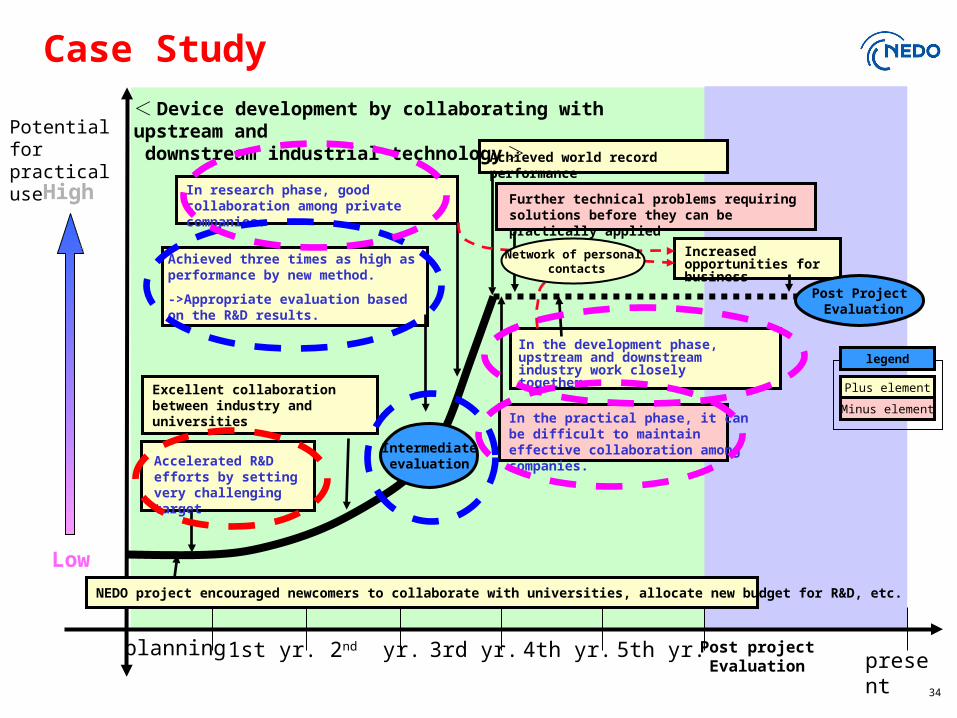
High
Potential for practical use
Low
Achieved three times as high as performance by new method.
->Appropriate evaluation based on the R&D results.
In research phase, good collaboration among private companies.
Accelerated R&D efforts by setting very challenging target
Excellent collaboration between industry and universities
Intermediateevaluation
Achieved world record performance
In the practical phase, it can be difficult to maintain effective collaboration among companies.
Further technical problems requiring solutions before they can be practically applied
In the development phase, upstream and downstream industry work closely together.
Increased opportunities for business
Post Project Evaluation
Plus element
Minus element
legend
Network of personal contacts
NEDO project encouraged newcomers to collaborate with universities, allocate new budget for R&D, etc.
< Device development by collaborating with upstream and downstream industrial technology >
planningpresent1st yr. 2nd yr. 3rd yr. 4th yr. 5th yr. Post project
Evaluation
Case Study
35
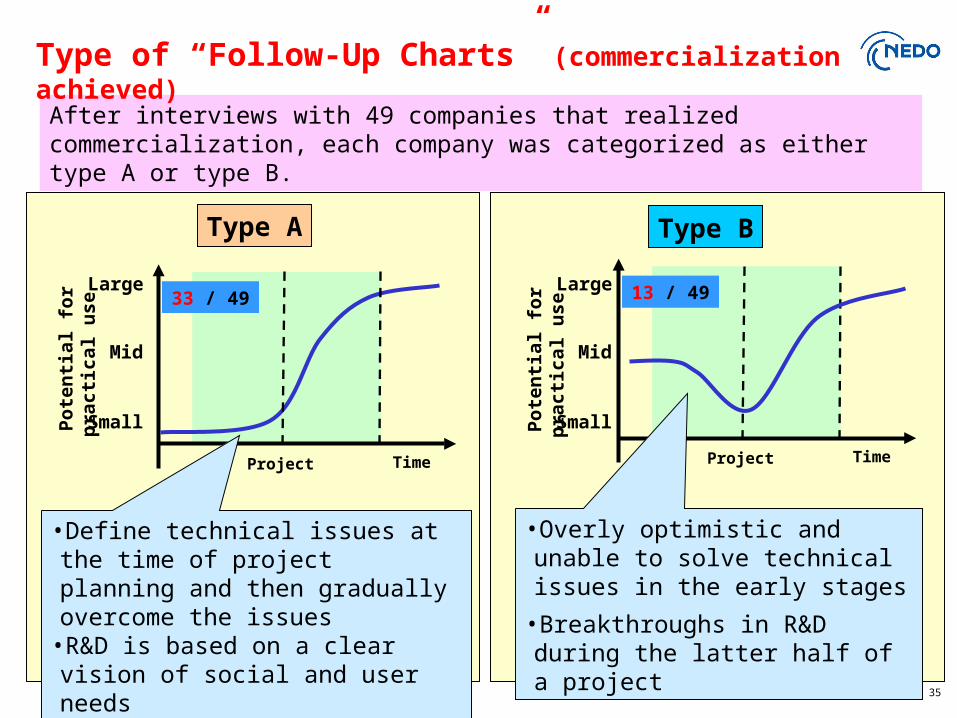
Type A
33 / 49
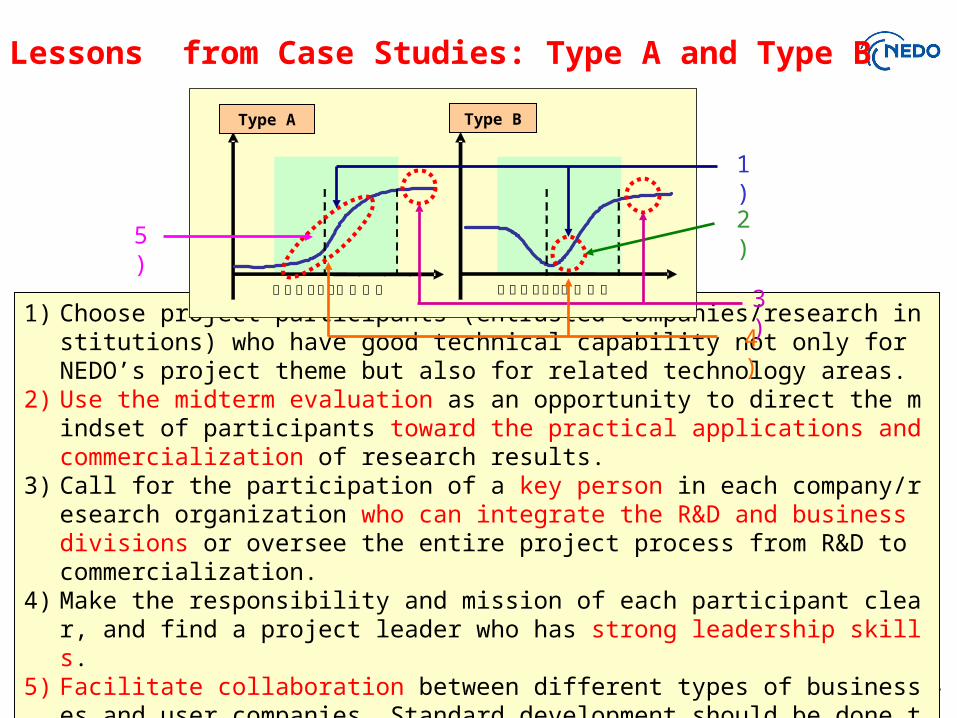
After interviews with 49 companies that realized commercialization, each company was categorized as either type A or type B.
•Define technical issues at the time of project planning and then gradually overcome the issues
•R&D is based on a clear vision of social and user needs
Project Time
Type B
13 / 49
•Overly optimistic and unable to solve technical issues in the early stages
•Breakthroughs in R&D during the latter half of a project
Project Time
Large
Po
ten
tia
l fo
r p
ract
ical
use
Mid
Small
Large
Po
ten
tia
l fo
r p
ract
ical
use
Mid
Small
Type of “Follow-Up Charts” (commercialization achieved)
36
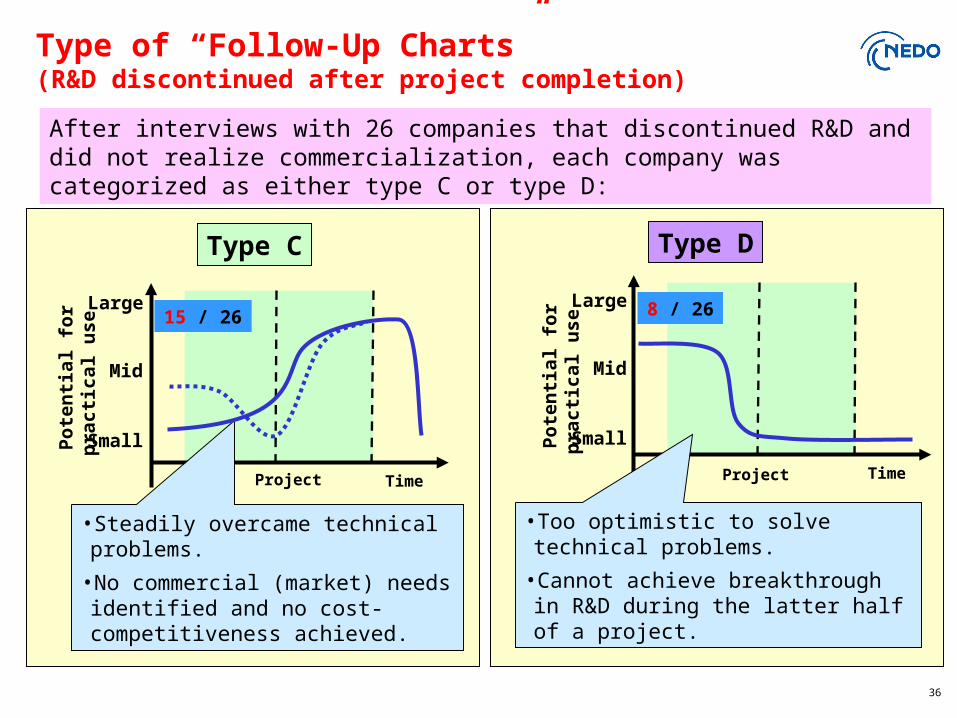
Type C
15 / 26Large
Po
ten
tia
l fo
r p
ract
ical
use
Mid
Small
Project Time
Type D
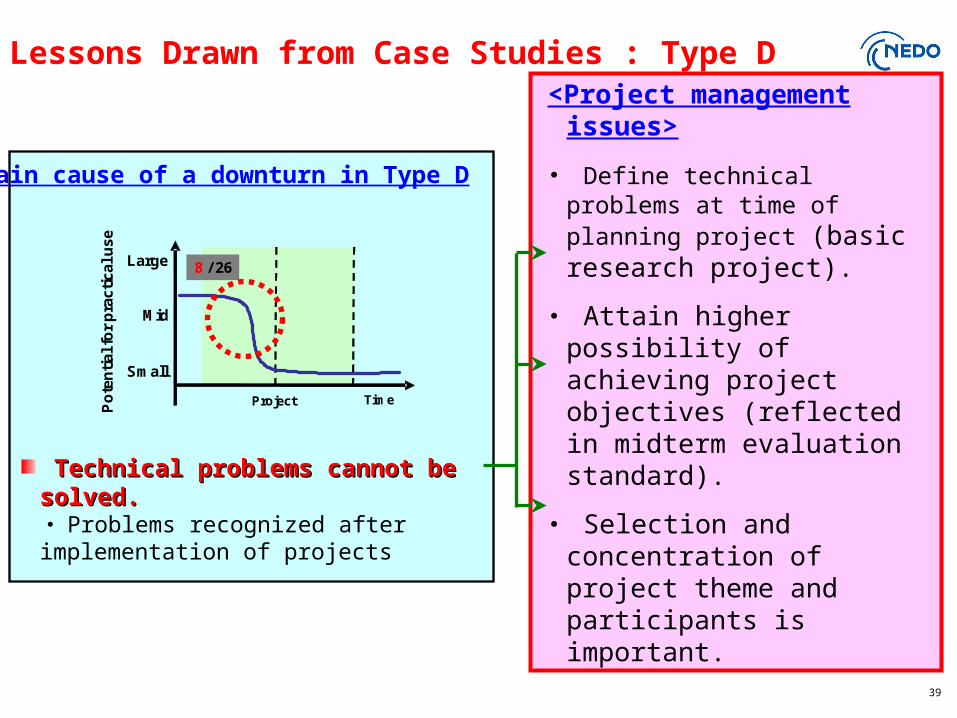
8 / 26
Project Time
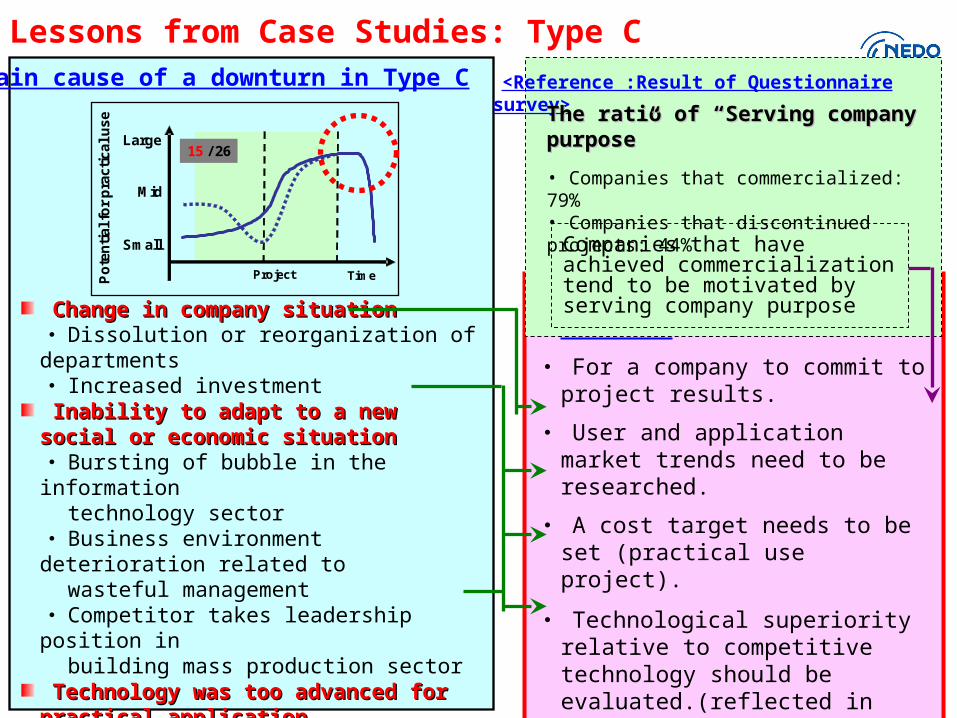
•Too optimistic to solve technical problems.
•Cannot achieve breakthrough in R&D during the latter half of a project.
•Steadily overcame technical problems.
•No commercial (market) needs identified and no cost-competitiveness achieved.
Large
Po
ten
tia
l fo
r p
ract
ical
use
Mid
Small
After interviews with 26 companies that discontinued R&D and did not realize commercialization, each company was categorized as either type C or type D:
Type of “Follow-Up Charts” (R&D discontinued after project completion)
37
1) Choose project participants (entrusted companies/research institutions) who have good technical capability not only for NEDO’s project theme but also for related technology areas.
2) Use the midterm evaluation as an opportunity to direct the mindset of participants toward the practical applications and commercialization of research results.
3) Call for the participation of a key person in each company/research organization who can integrate the R&D and business divisions or oversee the entire project process from R&D to commercialization.
4) Make the responsibility and mission of each participant clear, and find a project leader who has strong leadership skills.
5) Facilitate collaboration between different types of businesses and user companies. Standard development should be done through collaboration among companies in the same industry.
タイプA
実用
化の
見込
み小
中大
プロジェクト実施期間 プロジェクト実施期間
タイプB
5)
4)
3)
2)
1)
Type A Type B
Lessons from Case Studies: Type A and Type B
38
Change in company situationChange in company situation ・ Dissolution or reorganization of
departments ・ Increased investment
Inability to adapt to a new social or Inability to adapt to a new social or economic situationeconomic situation
・ Bursting of bubble in the information technology sector ・ Business environment deterioration related
to wasteful management ・ Competitor takes leadership position in building mass production sector
Technology was too advanced for practical Technology was too advanced for practical applicationapplication
・ New MEMS is too high spec for application ・ Cost reduction problems remain ・ Application of technology is far into future
<Project Management Issues>
・ For a company to commit to project results.
・ User and application market trends need to be researched.
・ A cost target needs to be set (practical use project).
・ Technological superiority relative to competitive technology should be evaluated.(reflected in midterm evaluation standard).
15 / 26Large
Po
ten
tia
l fo
r p
ract
ica
l u
se
Mid
Small
Project Time
Lessons from Case Studies: Type CMain cause of a downturn in Type C <Reference :Result of Questionnaire
survey>The ratio of “Serving company The ratio of “Serving company purpose”purpose”
• Companies that commercialized: 79%• Companies that discontinued projects: 44%
Companies that have achieved commercialization tend to be motivated by serving company purpose
39
Technical problems cannot be solved.Technical problems cannot be solved. ・ Problems recognized after implementation
of projects
<Project management issues>
・ Define technical problems at time of planning project (basic research project).
・ Attain higher possibility of achieving project objectives (reflected in midterm evaluation standard).
・ Selection and concentration of project theme and participants is important.
Lessons Drawn from Case Studies : Type D
8 / 26
Project Time
Large
Po
ten
tial
fo
r p
ract
ical
use
Mid
Small
Main cause of a downturn in Type D
40
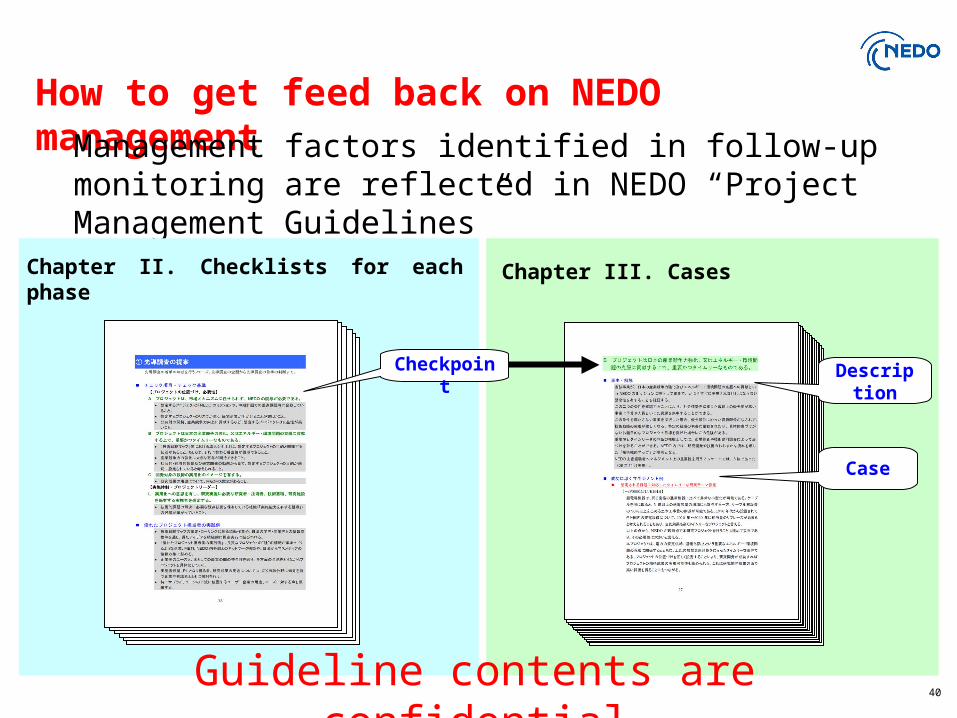
How to get feed back on NEDO managementManagement factors identified in follow-up monitoring are
reflected in NEDO “Project Management Guidelines”
Chapter II. Checklists for each phase
優れたプロジェクト担当者の実践例
Chapter III. Cases
成功に導くマネジメント例
教訓とすべきマネジメント例
Description
Case
Checkpoint
Guideline contents are confidential
41
Conclusion
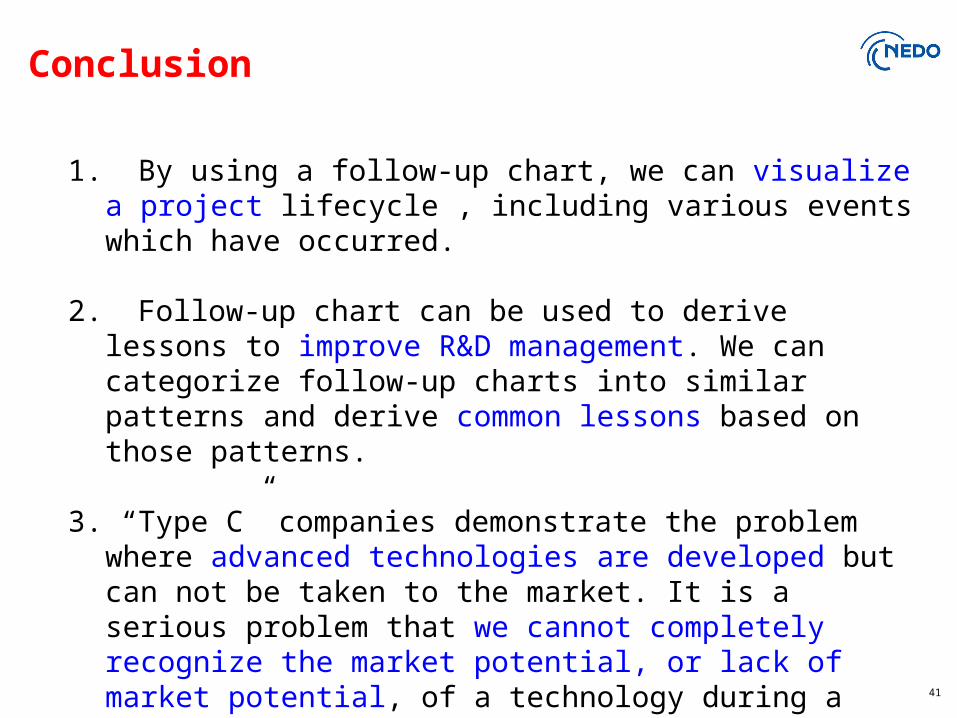
1. By using a follow-up chart, we can visualize a project lifecycle , including various events which have occurred.
2. Follow-up chart can be used to derive lessons to improve R&D management. We can categorize follow-up charts into similar patterns and derive common lessons based on those patterns.
3. “Type C” companies demonstrate the problem where advanced technologies are developed but can not be taken to the market. It is a serious problem that we cannot completely recognize the market potential, or lack of market potential, of a technology during a project’s R&D phase. We have to consider seriously how to avoid “Type C” companies.
42
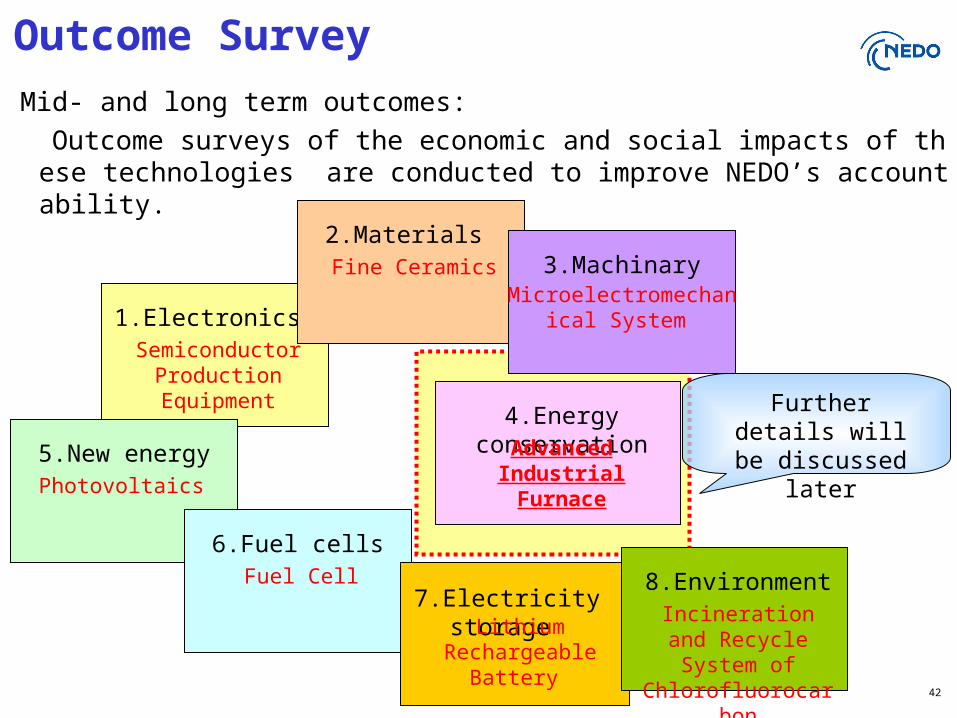
Mid- and long term outcomes:
Outcome surveys of the economic and social impacts of these technologies are conducted to improve NEDO’s accountability.
Outcome Survey
1.Electronics Semiconductor
Production Equipment
2.Materials Fine Ceramics 3.Machinary
Microelectromechanical System
5.New energyPhotovoltaics
6.Fuel cellsFuel Cell
7.Electricity storage Lithium
Rechargeable Battery
8.EnvironmentIncineration and
Recycle System of Chlorofluorocarbon
4.Energy conservationAdvanced Industrial
Furnace
Further details will be discussed later
An Approach to Understanding Outcomes of National R&D in Energy
Conservation Projects (Part III)
Kazuaki Komoto
New Energy and Industrial Technology Development Organization
44
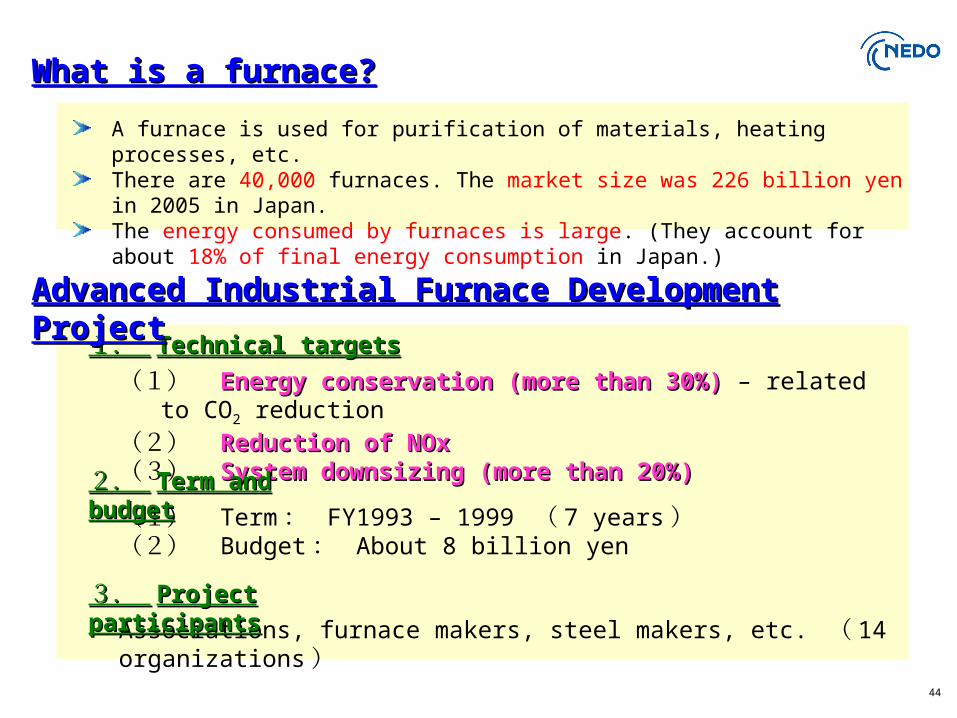
What is a furnace?What is a furnace?
A furnace is used for purification of materials, heating processes, etc. There are 40,000 furnaces. The market size was 226 billion yen in 2005 in Japan.The energy consumed by furnaces is large. (They account for about 18% of final energy consumption in Japan.)
(1) Energy conservation (more than 30%)Energy conservation (more than 30%) – related to CO2 reduction
(2) Reduction of NOxReduction of NOx(3) System downsizing (more than 20%)System downsizing (more than 20%)
1. 1. Technical targetsTechnical targets
(1) Term : FY1993 – 1999 ( 7 years )(2) Budget : About 8 billion yen
2. 2. Term and budgetTerm and budget
Associations, furnace makers, steel makers, etc. ( 14 organizations )3. 3. Project participantsProject participants
Advanced Industrial Furnace Development Advanced Industrial Furnace Development ProjectProject
45
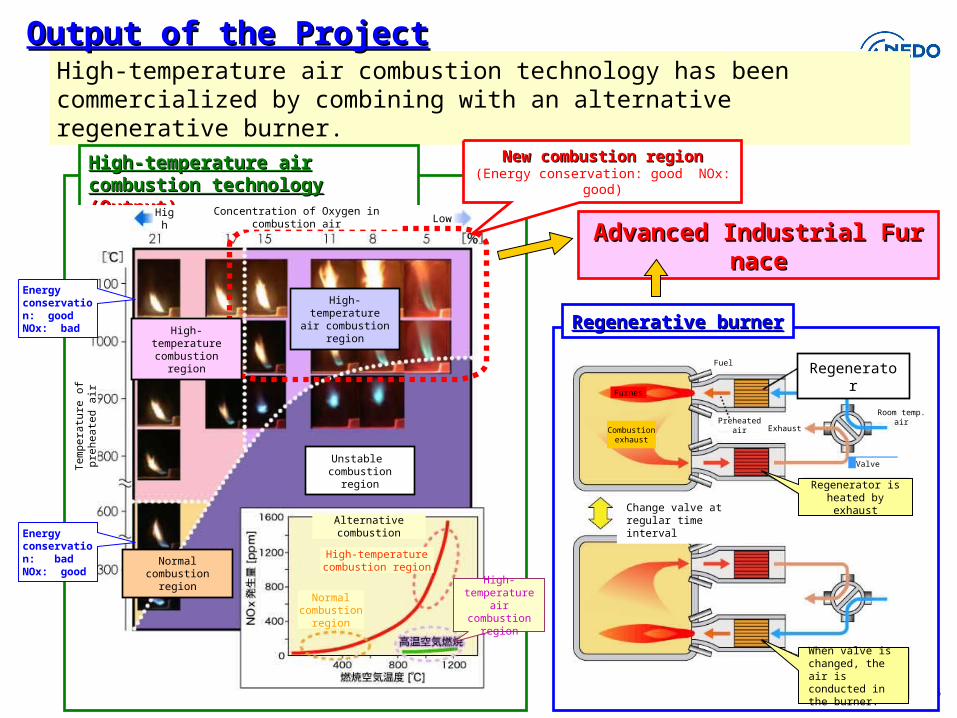
High-temperature air combustion technology has been commercialized by combining with an alternative regenerative burner.
Output of the ProjectOutput of the Project
High-temperature air combustion High-temperature air combustion technology technology (Output)(Output)
Regenerative burnerRegenerative burner
Advanced Industrial FurnaceAdvanced Industrial Furnace
Energy conservation: goodNOx: bad
Energy conservation: badNOx: good
High-temperature combustion region
Normal combustion region
High-temperature air combustion
region
Concentration of Oxygen in combustion air
Tem
pera
ture
of
preh
eate
d ai
r
Unstable combustion region
High Low
New combustion regionNew combustion region(Energy conservation: good NOx: good)
Alternative combustion
High-temperature combustion region
Normal combustion
region
High-temperature
air combustion region
Regenerator
Room temp. air
ValveValve
ExhaustPreheated air
Fuel
Furnes
Combustion exhaust
Regenerator is heated by exhaustChange valve at
regular time interval
When valve is changed, the air is conducted in the burner.
46
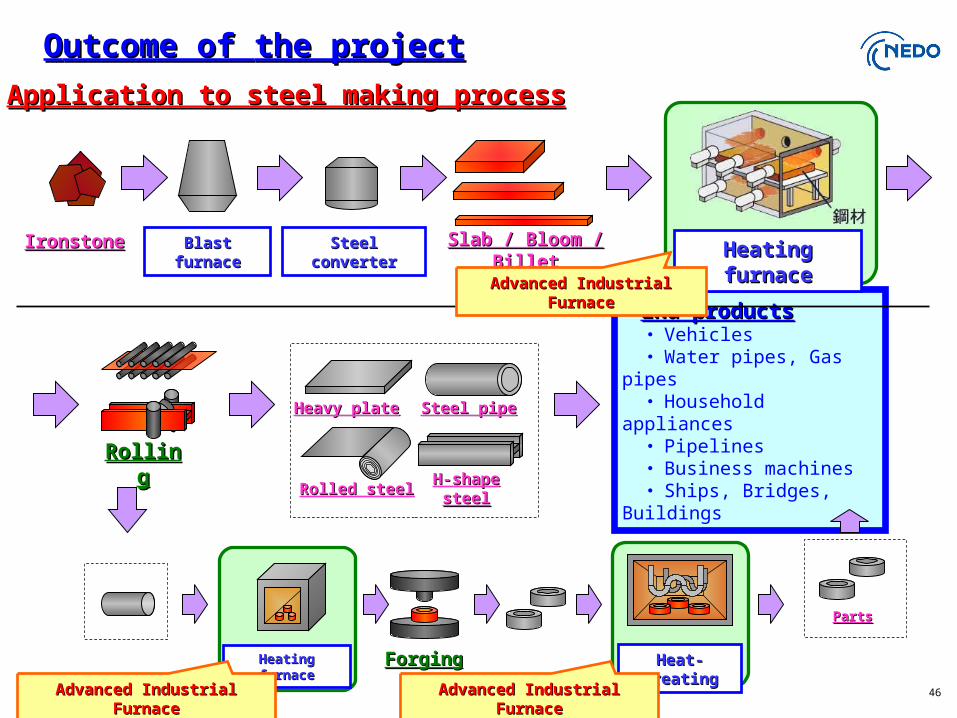
Slab / Bloom / BilletSlab / Bloom / BilletIronstoneIronstone
Rolled steelRolled steel
Steel pipeSteel pipe
H-shape steelH-shape steel
End productsEnd products・ Vehicles・Water pipes, Gas pipes・ Household appliances・ Pipelines・ Business machines・ Ships, Bridges, Buildings
Blast furnaceBlast furnace
ForgingForging
PartsParts
RollingRolling
Heavy plateHeavy plate
Heating furnaceHeating furnaceSteel converterSteel converter
Advanced Industrial FurnaceAdvanced Industrial Furnace
Heating furnaceHeating furnace Heat-treatingHeat-treating
OOutcome of utcome of the projectthe projectApplication to steel making processApplication to steel making process
Advanced Industrial FurnaceAdvanced Industrial Furnace Advanced Industrial FurnaceAdvanced Industrial Furnace
47
0
200
400
600
800
1000
92 93 94 95 96 97 98 99 00 01 02 03 04 05
Year
Cum
ulat
ive
inst
alla
tions
(fu
rnac
es)
* Result of survey questionnaire answered by 79 companies.
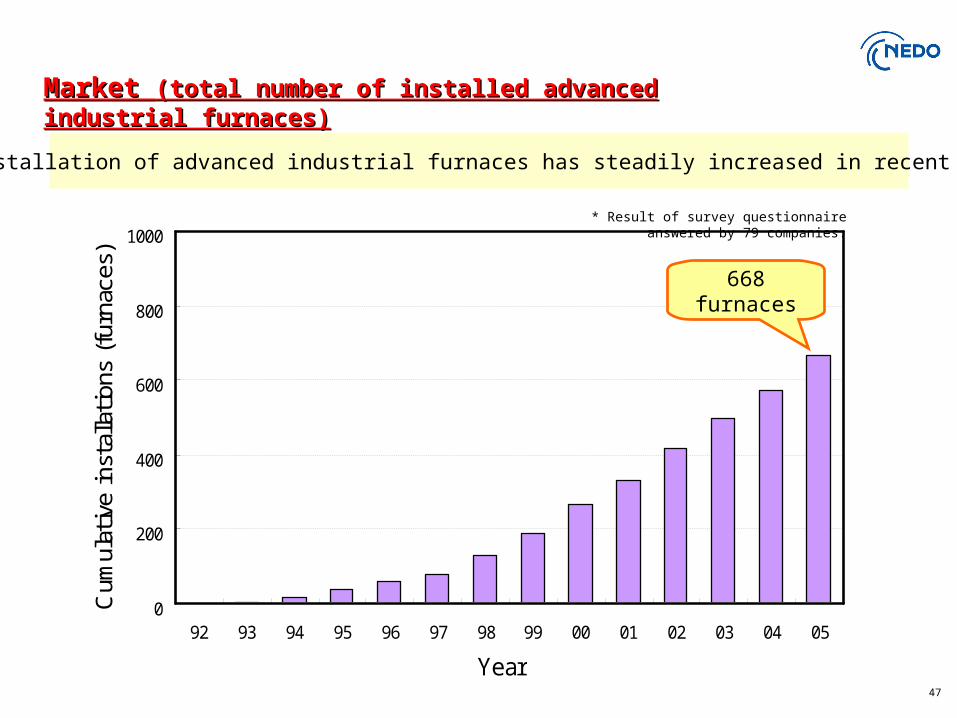
The installation of advanced industrial furnaces has steadily increased in recent years.
Market Market (total number of installed advanced industrial furnaces)(total number of installed advanced industrial furnaces)
668 furnaces
48
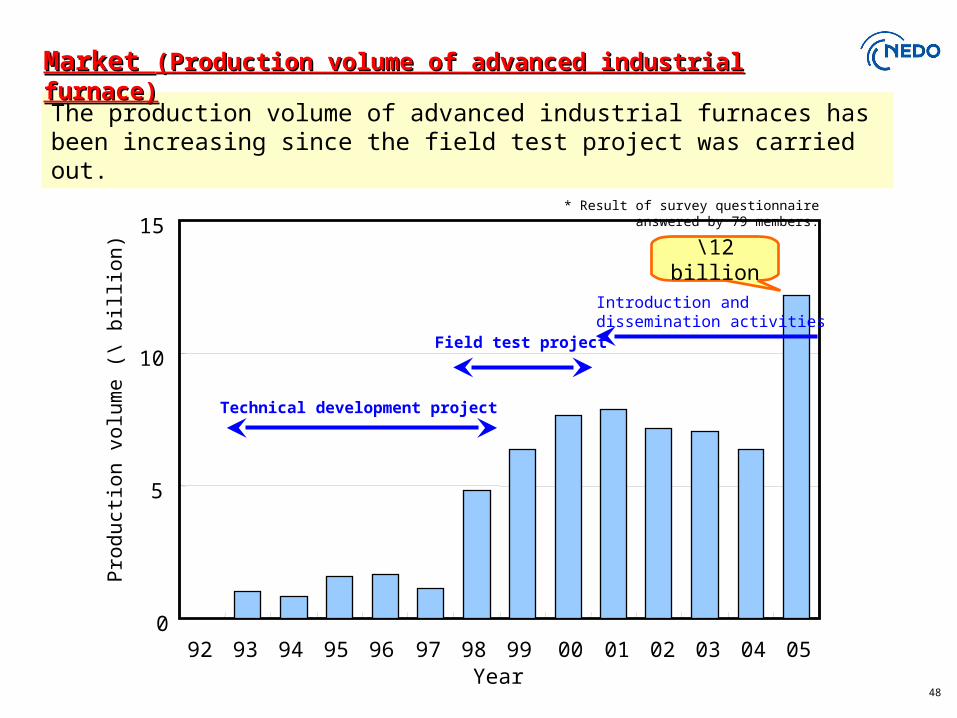
The production volume of advanced industrial furnaces has been increasing since the field test project was carried out.
0
5
10
15
92 93 94 95 96 97 98 99 00 01 02 03 04 05Year
Technical development project
Introduction and dissemination activities
Pro
duct
ion v
olu
me (
\ bill
ion) \12 billion
Field test project
* Result of survey questionnaire answered by 79 members.
Market Market (Production volume of advanced industrial furnace)(Production volume of advanced industrial furnace)
49
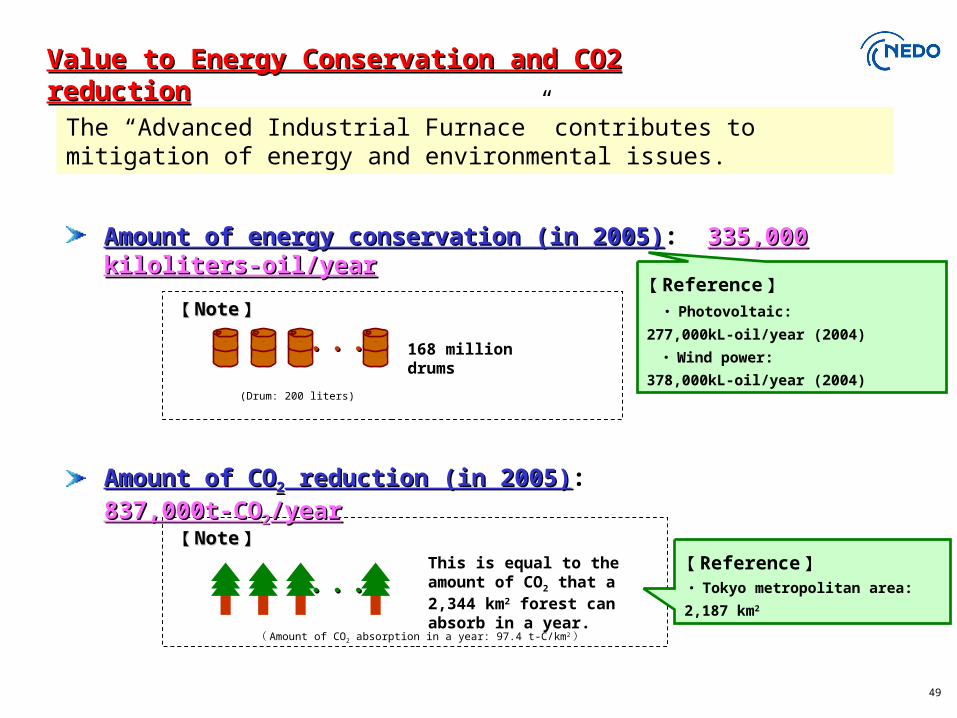
Amount of energy conservation (in 2005)Amount of energy conservation (in 2005): 335,000 kiloliters-oil/year335,000 kiloliters-oil/year
・・・・・・ 168 million drums
・・・・・・This is equal to the amount of CO2 that a 2,344 km2 forest can absorb in a year.
【【 NoteNote 】】
【【 NoteNote 】】
( Amount of CO2 absorption in a year: 97.4 t-C/km2 )
(Drum: 200 liters)
【 Reference 】 ・ Photovoltaic: 277,000kL-oil/year
(2004)
・ Wind power: 378,000kL-oil/year
(2004)
The “Advanced Industrial Furnace” contributes to mitigation of energy and environmental issues.
Value to Energy Conservation and CO2 reductionValue to Energy Conservation and CO2 reduction
Amount of COAmount of CO22 reduction (in 2005) reduction (in 2005): 837,000t-CO837,000t-CO22/year/year
【 Reference 】・ Tokyo metropolitan area: 2,187
km2
50
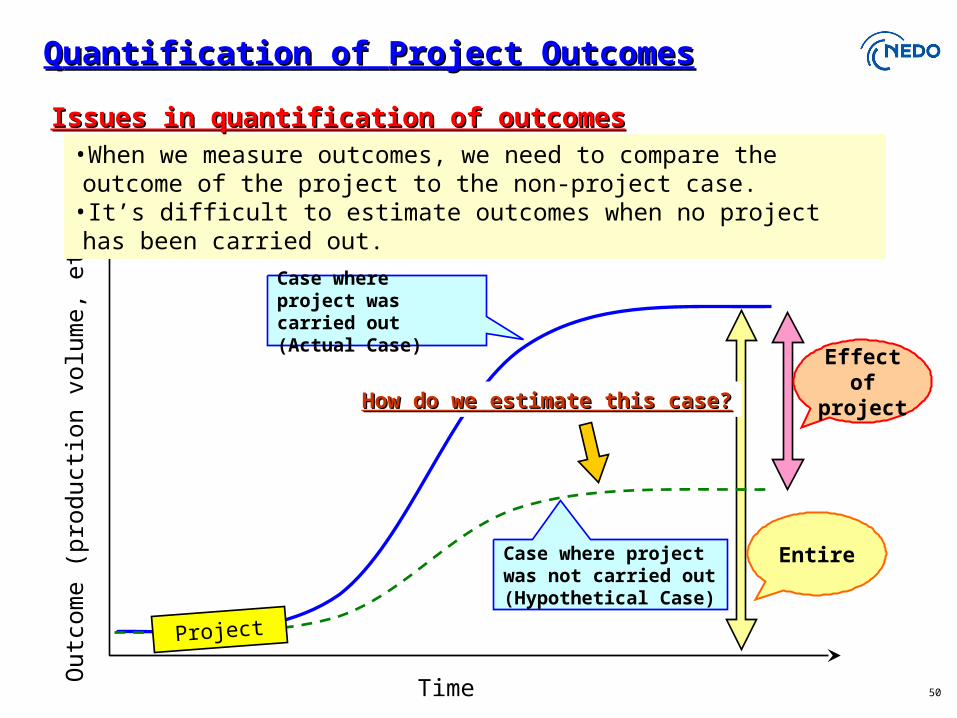
Out
com
e (p
rodu
ctio
n vo
lum
e, e
tc.)
Time
Case where project was carried out(Actual Case)
Entire
Effect of
projectHow do we estimate this case?How do we estimate this case?
•When we measure outcomes, we need to compare the outcome of the project to the non-project case.
•It’s difficult to estimate outcomes when no project has been carried out.
Issues in quantification of outcomesIssues in quantification of outcomes
Case where project was not carried out(Hypothetical Case)
QQuantification of uantification of Project OutcomesProject Outcomes
Project
51
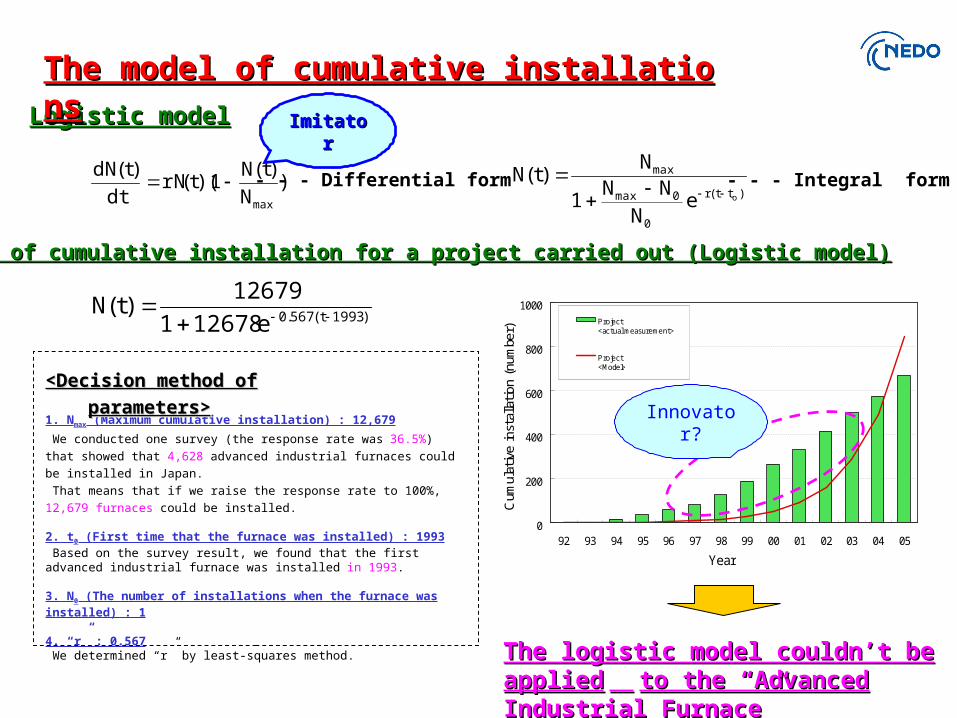
)1993t(567.0e12678112679
)t(N
Model of cumulative installation for a project carried out (Logistic model)Model of cumulative installation for a project carried out (Logistic model)
1. Nmax (Maximum cumulative installation) : 12,679
We conducted one survey (the response rate was 36.5%) that showed that
4,628 advanced industrial furnaces could be installed in Japan.
That means that if we raise the response rate to 100%, 12,679 furnaces could
be installed.
2. t0 (First time that the furnace was installed) : 1993 Based on the survey result, we found that the first advanced industrial furnace was installed in 1993.
3. N0 (The number of installations when the furnace was installed) : 1
4. “r” : 0.567 We determined “r” by least-squares method.
<Decision method of <Decision method of
parameters>parameters>
)N
)t(N1)(t(rN
dt)t(dN
max
)tt(r
0
0max
max
oeN
NN1
N)t(N
Logistic modelLogistic model
- - - Differential form - - - Integral form
0
200
400
600
800
1000
92 93 94 95 96 97 98 99 00 01 02 03 04 05
Year
Cum
ulat
ive
inst
alla
tion
(num
ber)
Project<actual measurement>
Project<Model>
The logistic model couldn’t be The logistic model couldn’t be appliedapplied to the “Advanced Industrial to the “Advanced Industrial Furnace”Furnace”
The model of cumulative installationsThe model of cumulative installations
ImitatorImitator
Innovator?
52
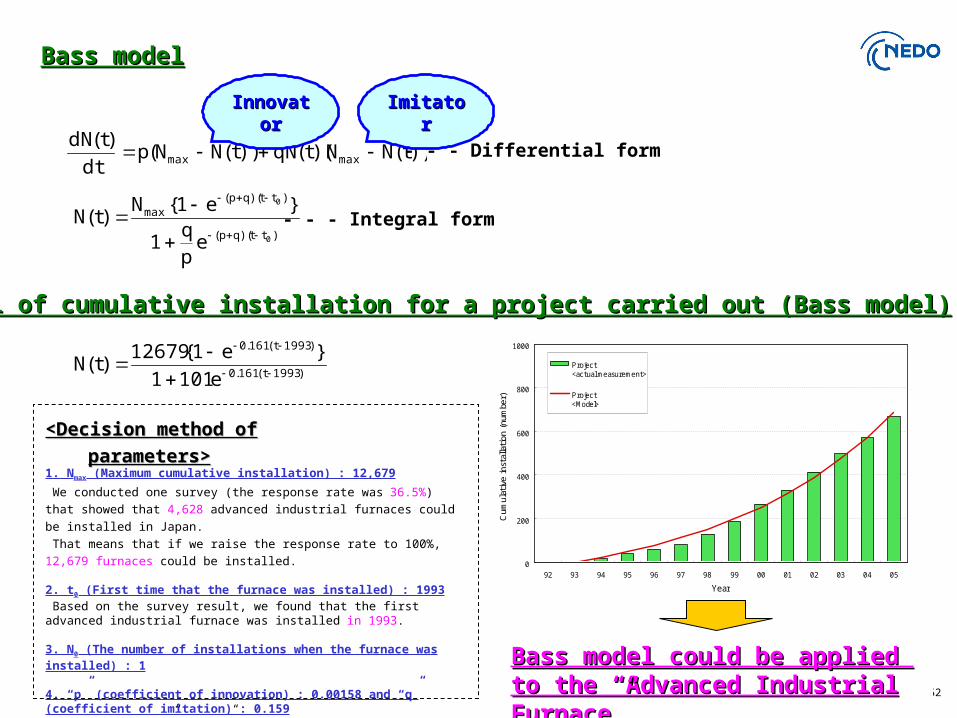
Model of cumulative installation for a project carried out (Bass model)Model of cumulative installation for a project carried out (Bass model)
))t(NN)(t(qN))t(NN(pdt
)t(dNmaxmax
Bass modelBass model
- - - Differential form
Bass model could be applied to the Bass model could be applied to the “Advanced Industrial Furnace”“Advanced Industrial Furnace”
)tt)(qp(
)tt)(qp(max
0
0
epq
1
}e1{N)t(N
- - - Integral form
)1993t(161.0
)1993t(161.0
e1011}e1{12679
)t(N
0
200
400
600
800
1000
92 93 94 95 96 97 98 99 00 01 02 03 04 05
Year
Cum
ulat
ive
inst
alla
tion
(nu
mbe
r)
Project<actual measurement>
Project<Model>
InnovatorInnovator ImitatorImitator
<Decision method of <Decision method of
parameters>parameters>1. Nmax (Maximum cumulative installation) : 12,679
We conducted one survey (the response rate was 36.5%) that showed that
4,628 advanced industrial furnaces could be installed in Japan.
That means that if we raise the response rate to 100%, 12,679 furnaces could
be installed.
2. t0 (First time that the furnace was installed) : 1993 Based on the survey result, we found that the first advanced industrial furnace was installed in 1993.
3. N0 (The number of installations when the furnace was installed) : 1
4. “p” (coefficient of innovation) : 0.00158 and “q” (coefficient of imitation) : 0.159 We determined “p” and “q” by least-square method.
53
Bass ModelBass Model
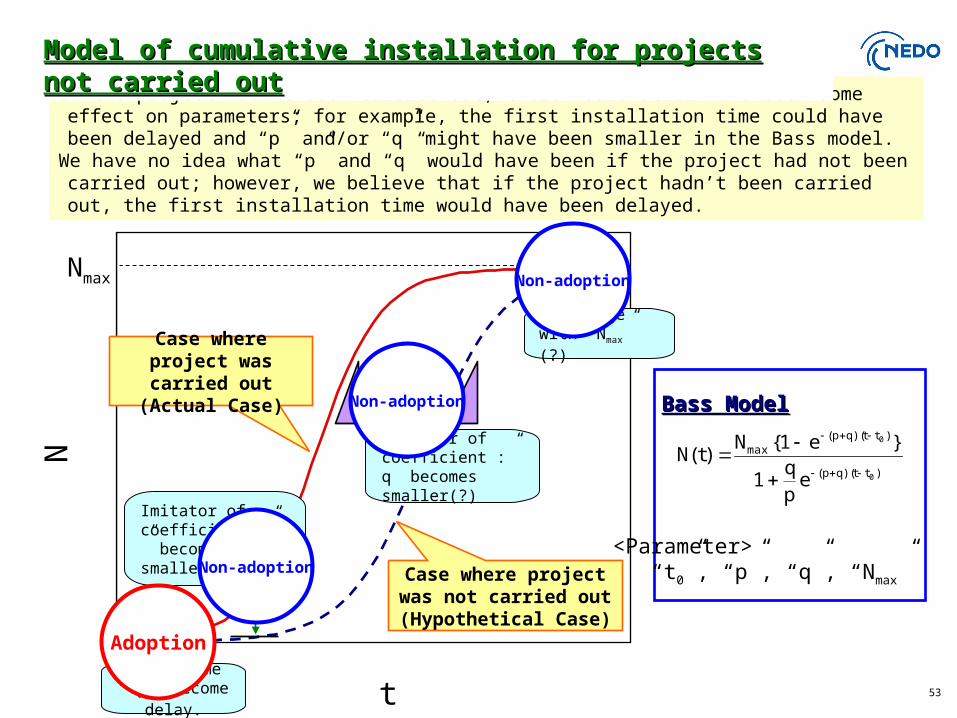
If the project hadn’t been carried out, there would still have been some effect on parameters; for example, the first installation time could have been delayed and “p” and/or “q” might have been smaller in the Bass model.
We have no idea what “p” and “q” would have been if the project had not been carried out; however, we believe that if the project hadn’t been carried out, the first installation time would have been delayed.
Model of cumulative installation for projects not carried outModel of cumulative installation for projects not carried out
<Parameter> “t0”, “p”, “q”, “Nmax”
)tt)(qp(
)tt)(qp(max
0
0
epq
1
}e1{N)t(N
Nmax
t
N
First time “t0” become
delay.
Imitator of coefficient :”p” becomes smaller(?)
Imitator of coefficient :”q” becomes smaller(?)
No change with ”Nmax” (?)
Adoption
Non-adoption
Non-adoption
Non-adoption
Case where project was not carried out
(Hypothetical Case)
Case where project was carried out(Actual Case)
54
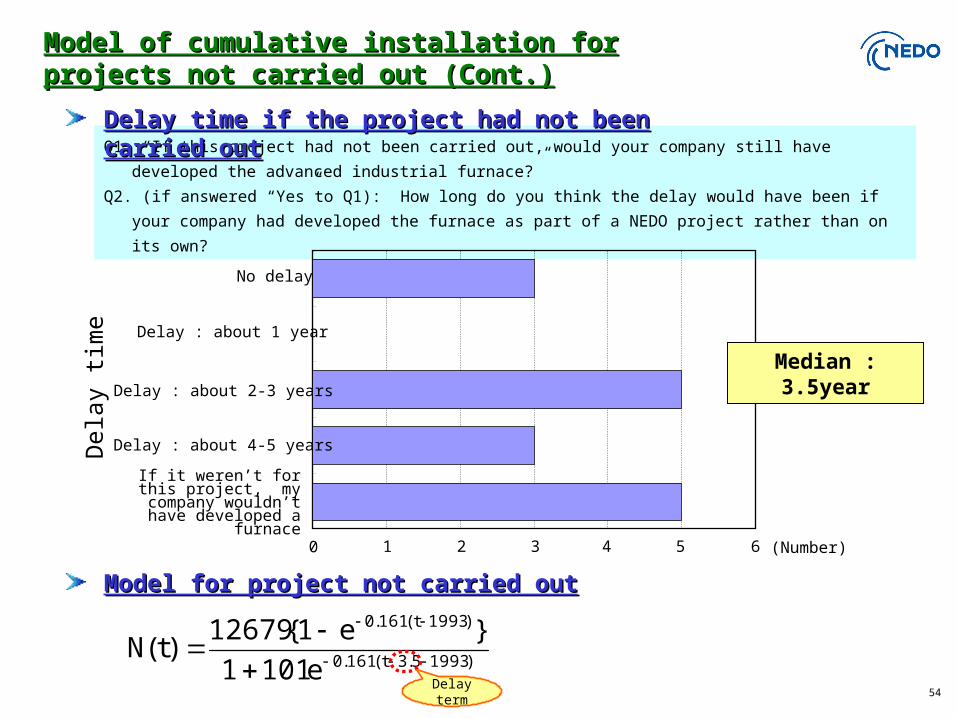
)19935.3t(161.0
)1993t(161.0
e1011}e1{12679
)t(N
Q1. “If this project had not been carried out, would your company still have developed the
advanced industrial furnace?”
Q2. (if answered “Yes”to Q1): How long do you think the delay would have been if your company
had developed the furnace as part of a NEDO project rather than on its own?
0 1 2 3 4 5 6
No delay
Delay : about 1 year
Delay : about 4-5 years
Delay time if the project had not been carried outDelay time if the project had not been carried out
Median : 3.5year
Delay term
Del
ay t
ime
Delay : about 2-3 years
If it weren’t for this project, my company
wouldn’t have developed a furnace
Model of cumulative installation for projects not Model of cumulative installation for projects not carried out (Cont.)carried out (Cont.)
Model for project not carried outModel for project not carried out
(Number)
55
0
200
400
600
800
1000
92 93 94 95 96 97 98 99 00 01 02 03 04 05
Year
Cum
ulat
ive
inst
alla
tion
(num
ber)
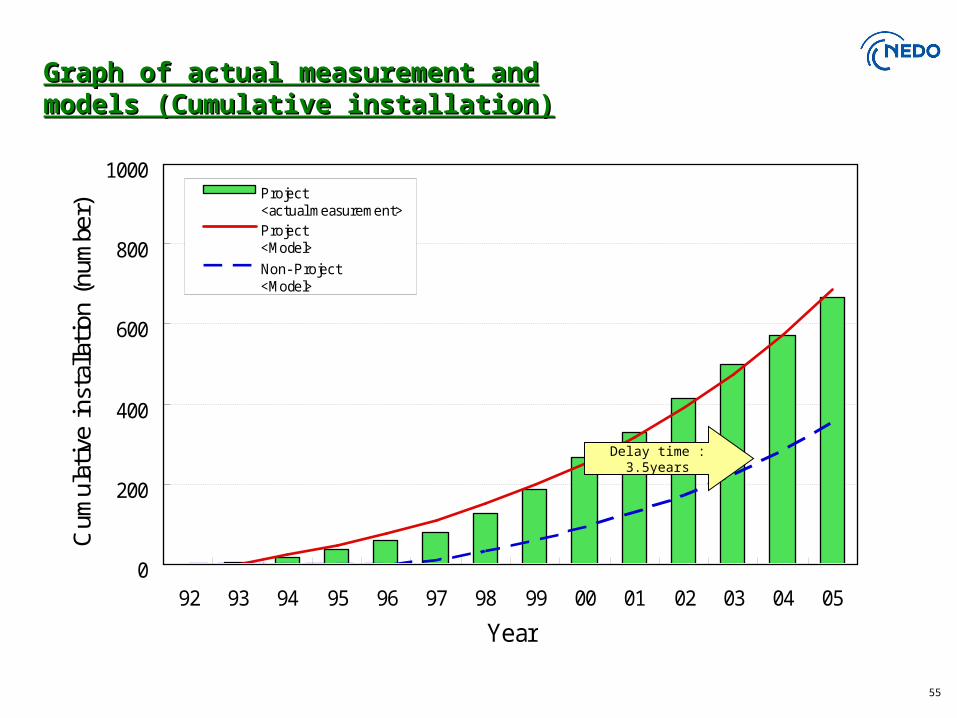
Project<actual measurement>Project<Model>Non- Project<Model>
Delay time : 3.5years
Graph of actual measurement and Graph of actual measurement and models (Cumulative installation)models (Cumulative installation)
56
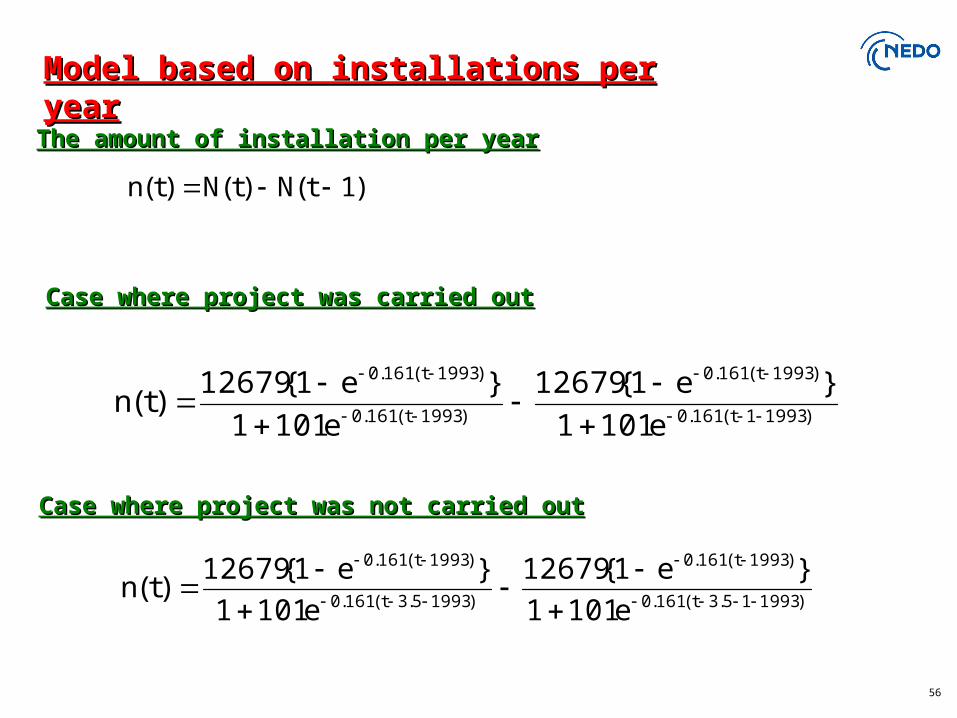
The amount of installation per yearThe amount of installation per year
)1t(N)t(N)t(n
Case where project was carried outCase where project was carried out
Case where project was not carried outCase where project was not carried out
)19931t(161.0
)1993t(161.0
)1993t(161.0
)1993t(161.0
e1011}e1{12679
e1011}e1{12679
)t(n
)199315.3t(161.0
)1993t(161.0
)19935.3t(161.0
)1993t(161.0
e1011}e1{12679
e1011}e1{12679
)t(n
Model based on installations per yearModel based on installations per year
57
0
50
100
150
200
92 93 94 95 96 97 98 99 00 01 02 03 04 05
Year
Inst
alla
tion
per
year
(nu
mbe
r)
Project<actual measurement>
Project<Model>
Non- Project<Model>
Technical development project
Introduction and dissemination activities
Field test project
Delay time : 3.5years
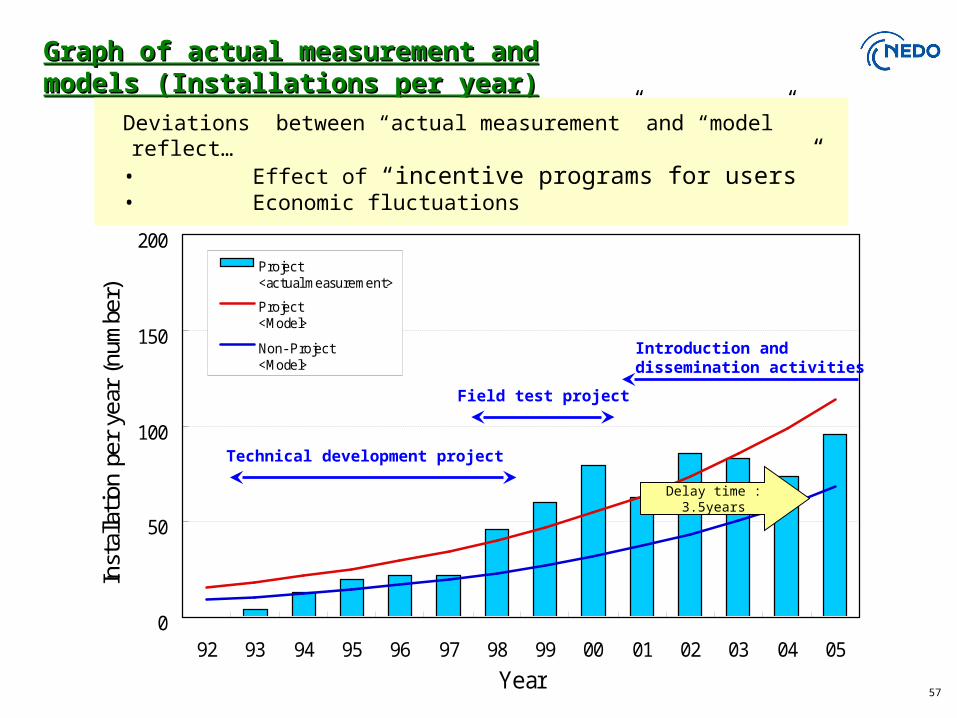
Graph of actual measurement and models Graph of actual measurement and models (Installations per year)(Installations per year)
Deviations between “actual measurement” and “model” reflect…• Effect of “incentive programs for users”• Economic fluctuations
58
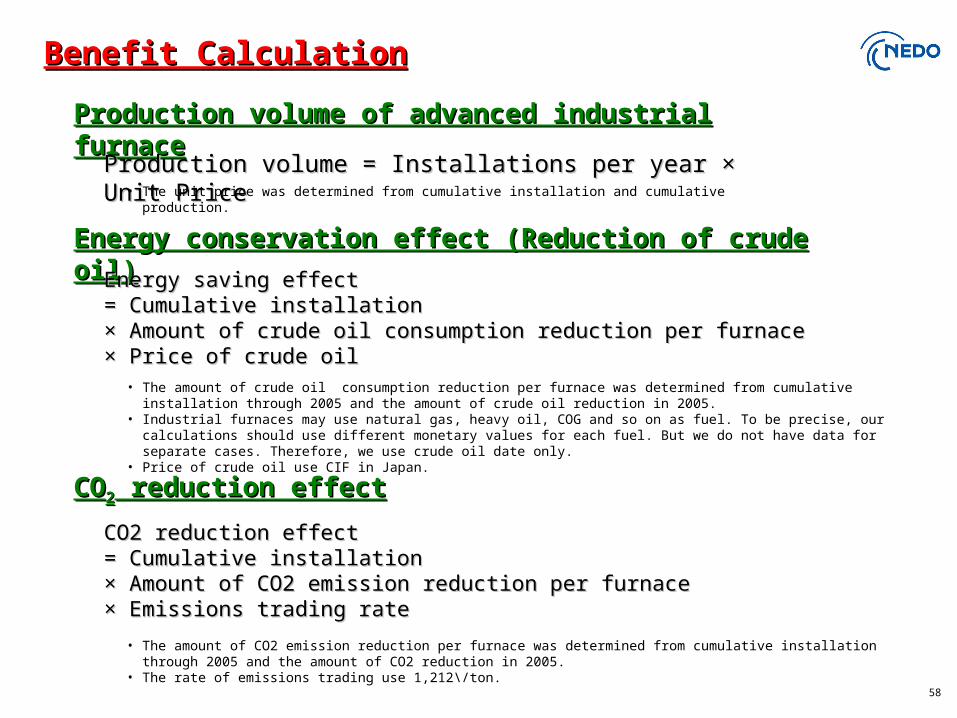
Production volume of advanced industrial furnaceProduction volume of advanced industrial furnace
Production volume = Installations per year × Unit Price Production volume = Installations per year × Unit Price
Energy conservation effect (Reduction of crude oil)Energy conservation effect (Reduction of crude oil)
Energy saving effectEnergy saving effect= Cumulative installation= Cumulative installation× Amount of crude oil consumption reduction per furnace× Amount of crude oil consumption reduction per furnace× Price of crude oil× Price of crude oil
• The amount of crude oil consumption reduction per furnace was determined from cumulative installation through 2005 and the amount of crude oil reduction in 2005.
• Industrial furnaces may use natural gas, heavy oil, COG and so on as fuel. To be precise, our calculations should use different monetary values for each fuel. But we do not have data for separate cases. Therefore, we use crude oil date only.
• Price of crude oil use CIF in Japan.
• The unit price was determined from cumulative installation and cumulative production.
CO2 reduction effectCO2 reduction effect= Cumulative installation= Cumulative installation× Amount of CO2 emission reduction per furnace× Amount of CO2 emission reduction per furnace× Emissions trading rate× Emissions trading rate
COCO22 reduction effect reduction effect
Benefit CalculationBenefit Calculation
• The amount of CO2 emission reduction per furnace was determined from cumulative installation through 2005 and the amount of CO2 reduction in 2005.
• The rate of emissions trading use 1,212\/ton.
59
0
50
100
150
200
250
92 93 94 95 96 97 98 99 00 01 02 03 04 05
Year
Mon
etar
y va
lue
(bill
ion
\)
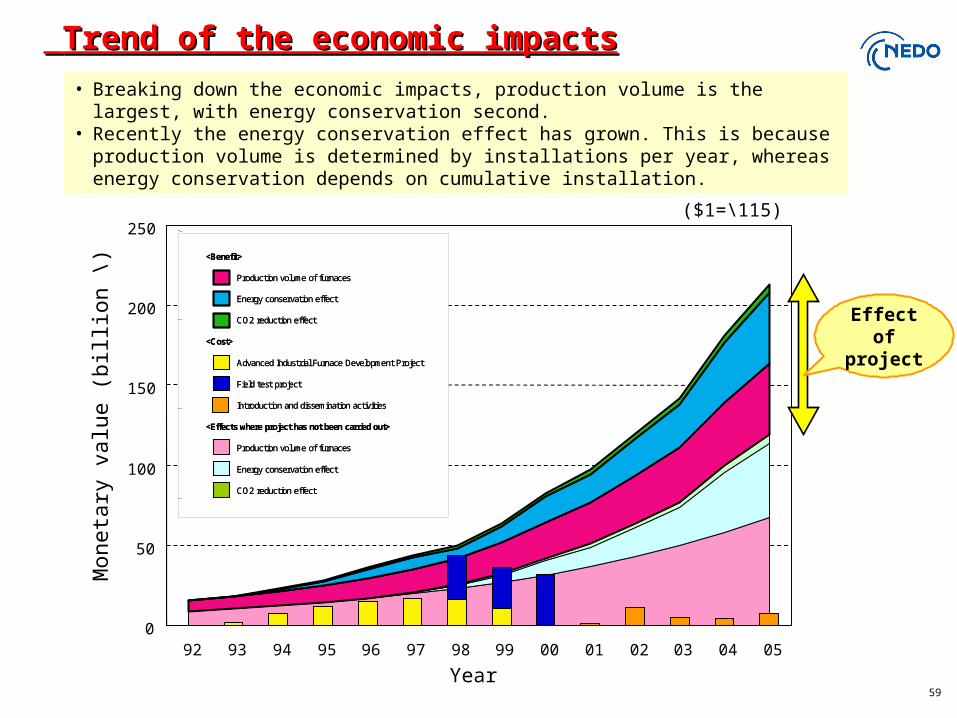
Effect of project
• Breaking down the economic impacts, production volume is the largest, with energy conservation second.
• Recently the energy conservation effect has grown. This is because production volume is determined by installations per year, whereas energy conservation depends on cumulative installation.
Trend of the economic impactsTrend of the economic impacts
($1=\115)
Introduction and dissemination activities
Field test project
Advanced Industrial Furnace Development Project
<Cost>
CO2 reduction effect
Energy conservation effect
Production volume of furnaces
<Effects where project has not been carried out>
CO2 reduction effect
Energy conservation effect
Production volume of furnaces
<Benefit>
60
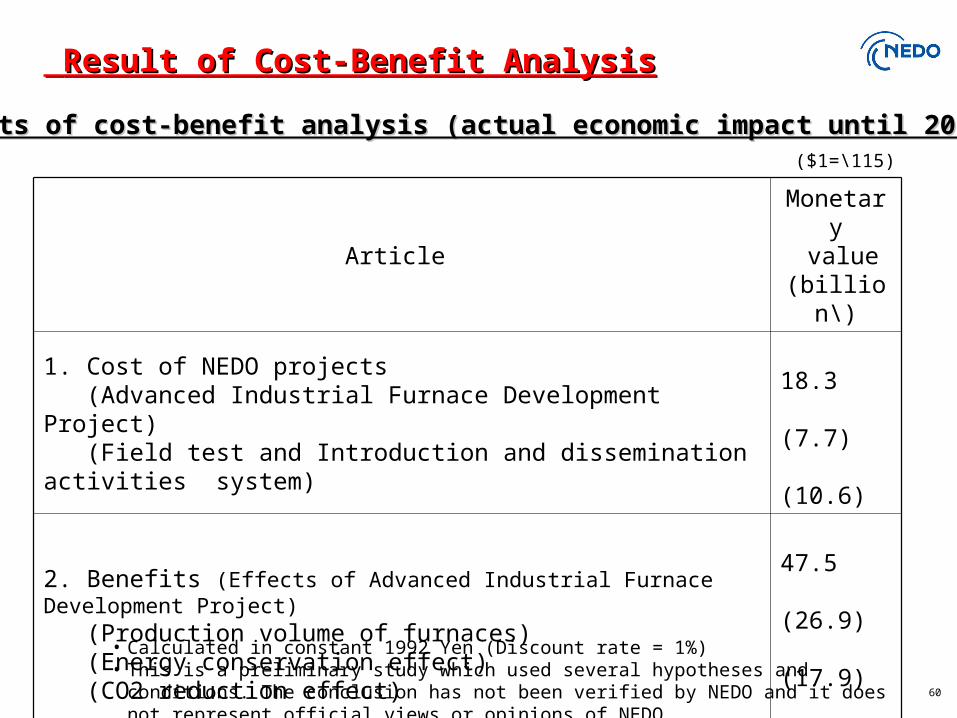
Results of cost-benefit analysis (actual economic impact until 2005)Results of cost-benefit analysis (actual economic impact until 2005)
Article Monetary
value(billion\)
1. Cost of NEDO projects (Advanced Industrial Furnace Development Project) (Field test and Introduction and dissemination activities system)
18.3 (7.7) (10.6)
2. Benefits (Effects of Advanced Industrial Furnace Development Project) (Production volume of furnaces) (Energy conservation effect) (CO2 reduction effect)
47.5 (26.9) (17.9) (2.7)
3. NET Benefit (2.-1.) 29.2
Result of Cost-Benefit AnalysisResult of Cost-Benefit Analysis
• Calculated in constant 1992 Yen (Discount rate = 1%)• This is a preliminary study which used several hypotheses and conditions. The conclusion has
not been verified by NEDO and it does not represent official views or opinions of NEDO.
($1=\115)
61
We have just discussed how the Advanced Industrial Furnace R&D project provided economic benefits. However the economic outcomes were also influenced by the introduction and dissemination activities.
Next StepNext Step
We studied the outcomes of the Advanced Industrial Furnace project, by constructing models for when the project was carried out and when the project was not.
We found that companies would have delayed the development of advanced industrial furnaces significantly if there were no NEDO project. Further, the net benefit from NEDO project is almost 30 billion yen.
We will try to use this method to other technical areas, and we’ll study whether this method is also as meaningful as other method to measure benefit.
ConclusionConclusion

62
Thank you !