Embed Size (px)
Citation preview
RESEARCH ARTICLES
Novel Regions of Acquired Uniparental DisomyDiscovered in Acute Myeloid Leukemia
Manu Gupta,1 Manoj Raghavan,1 Rosemary E. Gale,2 Claude Chelala,3 Christopher Allen,2 Gael Molloy,1
Tracy Chaplin,1 David C. Linch,2 Jean-Baptiste Cazier,1,4 and Bryan D. Young1*
1Cancer Genomics Unit,Medical Oncology Centre,Barts and the London Schoolof Medicine,Charterhouse Square,London EC1M 6BQ,UK2Departmentof Haematology,Royal Free and University College Medical School,LondonWC1E 6HX,UK3Centre for Molecular Oncology,Institute of Cancer & Cancer Research UKClinical Centre,Barts and The London School of Medicine,Charterhouse Square,London EC1M 6BQ,UK4Cancer Research UKBioinformatics & Biostatistics Service,LondonWC2A 3PX,UK
The acquisition of uniparental disomy (aUPD) in acute myeloid leukemia (AML) results in homozygosity for known gene muta-
tions. Uncovering novel regions of aUPD has the potential to identify previously unknown mutational targets. We therefore
aimed to develop a map of the regions of aUPD in AML. Here, we have analyzed a large set of diagnostic AML samples (n 5454) from young adults (age: 15–55 years) using genotype arrays. Acquired UPD was found in 17% of the samples with a non-
random distribution particularly affecting chromosome arms 13q, 11p, and 11q. Novel recurrent regions of aUPD were uncov-
ered at 2p, 17p, 2q, 17q, 1p, and Xq. Overall, aUPDs were observed across all cytogenetic risk groups, although samples with
aUPD13q (5.4% of samples) belonged exclusively to the intermediate-risk group as defined by cytogenetics. All cases with a
high FLT3-ITD level, measured previously, had aUPD13q covering the FLT3 gene. Significantly, none of the samples with FLT3-
ITD-/FLT3-TKD1 mutation exhibited aUPD13q. Of the 119 aUPDs observed, the majority (87%) were due to mitotic recombi-
nation while only 13% were due to nondisjunction. This study demonstrates aUPD is a frequent and significant finding in AML
and pinpoints regions that may contain novel mutational targets. VVC 2008 Wiley-Liss, Inc.
INTRODUCTION
Acute myeloid leukemia (AML) is characterized
by recurrent acquired cytogenetic and genetic
abnormalities. The biological importance of these
is underlined by the prognostic value conferred by
these abnormalities. From UK Medical Research
Council (MRC) trials, AML patients with translo-
cations involving t(8;21), t(15;17), and inv(16) have
been shown to have a favorable risk while those
with a complex karyotype with 5 or more ab-
normalities, 25/del(5q), 27 or abn(3q) have an
adverse risk (Grimwade et al., 1998). The remain-
ing large proportion of samples (about 60%) with
an intermediate risk includes cases with normal
karyotype (about 40% of AML patients). The
patients in this group have heterogeneity in
response to treatment. Mutation analysis has
helped to further stratify the patients and it has
been shown that mutations in genes such as the
fms-like tyrosine kinase 3 (FLT3) and nucleophos-
min 1 (NPM1) are linked to treatment outcome
(Kottaridis et al., 2001; Falini et al., 2005; Baldus et
al., 2007; Mead et al., 2007).
Studies have shown that patients with propor-
tionally high level of FLT3-internal tandem dupli-
cation (ITD) mutant compared with wild-type
FLT3 have a poor outcome (Kottaridis et al., 2001;
Thiede et al., 2002). Additionally, in 10% of
patients with normal karyotype AML, loss of the
wild-type FLT3 allele and ITD mutation in the
remaining FLT3 allele is associated with a worse
outcome (Whitman et al., 2001). Acquired unipar-
ental disomy (aUPD), a recently described somatic
aberration, has been shown to result in homozygos-
ity, and hence can be the basis of increased dosage,
for preexisting mutations in FLT3 and also in genes
such as WT1, RUNX1, and CEBPA (Fitzgibbon et
al., 2005; Raghavan et al., 2005). Acquired UPD
leads to the generation of two daughter cells each
with the reciprocal chromosomal products. The
*Correspondence to: Bryan D. Young, Cancer Genomics Unit,Medical Oncology Centre, Barts and the London School of Medi-cine, Charterhouse Square, London EC1M 6BQ, United Kingdom.E-mail: [email protected]
This article contains Supplementary Material available at http://www.interscience.wiley.com/jpages/1045-2257/suppmat.
Supported by: Leukaemia Research Fund and Cancer Research,UK.
Received 20 February 2008; Accepted 14 April 2008
DOI 10.1002/gcc.20573
Published online 27 May 2008 inWiley InterScience (www.interscience.wiley.com).
VVC 2008 Wiley-Liss, Inc.
GENES, CHROMOSOMES & CANCER 47:729–739 (2008)
homozygosity observed in AML is due to the out-
growth of cells carrying the mutation thus eliminat-
ing or outnumbering the cells with wild-type allele.
The study of aUPD can thus identify regions con-
taining potential mutational targets. Because the
current list of genes known to be mutated in AML
is probably incomplete, it is important to develop a
map of aUPD in AML.
Previous studies in 64 AML samples with
diverse karyotype (Raghavan et al., 2005) and in 32
normal karyotype AML samples (Gorletta et al.,
2005) have shown aUPDs to be present in about
20% of the AML samples. However, since this fre-
quency estimate is based on small cohorts, less fre-
quent aUPDs may have been missed altogether.
To provide a more comprehensive map of the prev-
alence and locations of aUPD in AML, we have
genotyped samples from a large cohort of 454
young adult AML patients with diverse range of
karyotypes typical of the disease.
In common with other reports (Walker et al.,
2006; Fitzgibbon et al., 2007; Gondek et al.,
2007a,b,c; Kloth et al., 2007; Mohamedali et al.,
2007; Pfeifer et al., 2007), LOH and copy number
patterns were analyzed using pooled unrelated
controls. This study has identified novel recurrent
regions of aUPD at 2p, 17p, 2q, 17q, 1p, and Xq. In
addition, expected copy number alterations e.g.,25q, 27/27q, and 18 were reliably detected.
PATIENTS ANDMETHODS
Samples
We genotyped DNA from 463 young adult AML
patients at diagnosis aged between 15 and 55 years
entered into the UK MRC AML10 trial. These
constituted 24% of all of the AML patients entered
into the trial (Hann et al., 1997; Grimwade et al.,
1998). Ethical approval for the trial was obtained
from the Multi-Centre Research Ethics Commit-
tee of Wales and informed consent was provided
according to the Declaration of Helsinki. Four
samples were excluded from the study as the
patients were subsequently rediagnozed as not
AML. Another 4 samples that were either triploid
(n 5 1), tetraploid (n 5 2), or hypodiploid (n 5 1)
were excluded from the analysis (see supplemen-
tary information and supplementary Table 1). Fur-
ther, one sample with low call rate (<75%) was not
considered during analysis. Of the remaining 454
samples, the karyotype was known for 363 of which
55 were favorable risk, 276 intermediate risk
including 190 with a normal karyotype, and 32
adverse risk. The samples set consisted of 224
males and 230 females. Mutation status for FLT3(both ITDs and tyrosine kinase domain [TKD]
mutations) and NPM1 exon 12 mutations was avail-
able for all 454 samples. We also studied paired
remission DNA available from eight patients to
compare with the results from diagnostic samples.
Experiments on 23 samples (5% of the sample set)
were repeated to determine the reproducibility of
our data. Genomic DNA from blood samples of
10 nonleukemic individuals processed at the same
facility was used as control (control set I) to esti-
mate the copy number values.
Mapping 10K 2.0 GeneChip Assay
We used Mapping 10K 2.0 arrays (Affymetrix,
Santa Clara, CA) (Matsuzaki et al., 2004). These
arrays encode 10,204 single nucleotide polymor-
phisms (SNPs) and have a median intermarker dis-
tance of 113 kilobases (Kb). The markers cover all
22 autosomes and the X chromosome. Experi-
ments were performed according to the manufac-
turer’s instructions except that polymerase chain
reaction (PCR) products were purified using an
Ultrafree-MC filtration column (Millipore, Biller-
ica, MA). Signal intensity data were analyzed by
the GeneChip DNA Analysis Software and
GTYPE was used for calling the genotypes. The
signal intensity data were used to calculate DNA
copy number. The primary SNP microarray data
have been deposited in the NCBIs Gene Expres-
sion Omnibus (GEO, http://www.ncbi.nlm.nih.gov/
projects/geo/) and are accessible through GEO
series accession number GSE8721.
Data Analysis
For copy number estimation, the log2 ratio of
the signal intensity from the test sample versus the
pooled signal intensity from 10 unrelated nonleu-
kemic male control samples (control set I) was
used. In addition, for eight cases where paired
remission samples were studied, copy number in
the diagnostic samples was also analyzed as a ratio
of the diagnostic DNA/remission DNA signal in-
tensity. To identify regions with losses, gains or
aUPD, we used software developed in-house
known as Genome Oriented Laboratory File
(GOLF) (Fitzgibbon et al., 2007) (Cazier J-B and
Young BD, manuscript in preparation). A ratio of
signal intensity below 0.75 and above 1.25 on at
least three consecutive SNPs was defined as a loss
and a gain, respectively. The aberrations identified
by the software were confirmed by visual inspec-
tion of the log2 ratio plots of test sample against
control. The software package GOLF along with
Genes, Chromosomes & Cancer DOI 10.1002/gcc
730 GUPTA ETAL.
the guidelines for its use, and the data described in
this article are available for download from http://
bioinformatics.cancerresearchuk.org/cazier01. The
physical positions of markers and genes in this
report are based on the NCBI 35 assembly of the
human genome (May 2004).
Control Samples to Define Criteria for aUPD
In the absence of paired control samples, identi-
fication of aUPD is based on the presence of runs
of consecutive homozygous markers. However, the
human genome is known to harbor large inherited
regions of homozygosity (IRH) due to strong link-
age disequilibrium between the markers (2005). In
addition, areas of low SNP coverage and minor
alleles with a low frequency may appear as IRH.
IRHs may also exist due to consanguinity although
the later is less likely in the current sample set pri-
marily being from Caucasians. To distinguish IRHs
from acquired regions and to evaluate the false
positive rate in our data, we examined data from
the blood of another set of nonleukemic individu-
als (control set II). We defined the criteria for
aUPD in our AML cohort based on the 10K 2.0
data available from 90 independent germ-line sam-
ples (control set II) from the ColoRectal tumor
Gene Identification (CoRGI) Study Consortium
(Kemp et al., 2006).
Criterion for Detection of aUPD
To define a region of aUPD in our cohort of
AML samples, first we determined the number of
homozygous regions observed in CoRGI controls
(control set II) with a continuously increasing
threshold of consecutive homozygous SNPs while
allowing for 0, 1, or 2 heterozygous calls within the
regions to accomodate genotyping errors that may
result from the presence of some normal DNA in
the sample (Supplementary Fig. 1). Analysis was
done considering ‘‘no calls’’ as either homozygous
or heterozygous in separate comparisons. The
number of regions observed in controls reached a
lower plateau at the threshold of 50 consecutive
markers. The difference in the observed number
of regions between the CoRGI and AML sample
sets was greatest when two heterozygotes were
allowed. We further tested the number of homozy-
gous regions observed in controls in the above
fashion but without considering the ‘‘no calls.’’
Allowing two heterozygous calls among 50 SNPs
(abbreviated as 50/2) only three IRHs were
observed in just three samples (3.3%) among the
90 controls, suggesting this to be a stringent crite-
rion. We therefore used 50/2 as our definition of
aUPD with an expected false positive rate of 3.3%
i.e., homozygous regions not related to the disease.
This criterion has recently been used successfully
to define aUPD in a lymphoma study (Fitzgibbon
et al., 2007). Using this definition, the shortest
average length of aUPD regions in our study would
be 5.6 megabases (Mb) given that the median
inter-marker distance on the 10K 2.0 arrays is 113
Kb. The regions of aUPD on the X-chromosome
can only be identified in females. Thus, the num-
ber of aUPDs on the X-chromosome reported in
this article is from 230 females only.
Using the above-defined criteria of 50/2 for
aUPD, we did not observe any IRH in control set
I (n 5 10). Among 8 paired remission samples,
only one showed one IRH on chromosome 19 that
was centered on the centromere, i.e., regions
known to have strong linkage disequilibrium be-
tween markers.
RESULTS
Quality Control of the Data
A number of parameters were monitored during
sample processing to determine the sample quality
and the final quality of the SNP array data. All of
the sample DNAs were first run on 1% agarose gel
to check the DNA quality. Accuracy of the data
were estimated by calculating the frequency of
heterozygous calls on the X-chromosome in male
samples. One male sample with <75% call rate had
58 heterozygous calls on the X-chromosome and
was deleted from the analysis. In the remaining 224
male samples, we observed only eight heterozygous
calls giving an accuracy of >99.999% for genotype
calls. SNP call rate was considered the final arbiter
of data quality: median SNP call rate per array was
98.3%, mean 97.88% and range 88.24%–99.75%.
Experiments were repeated on 23 (5%) samples to
check the reproducibility and validity of the data.
In total 71 calls (range: 0–11) were found to be dis-
cordant among 23 pairs, which means the reproduci-
bility of our genotype calls is 99.96%.
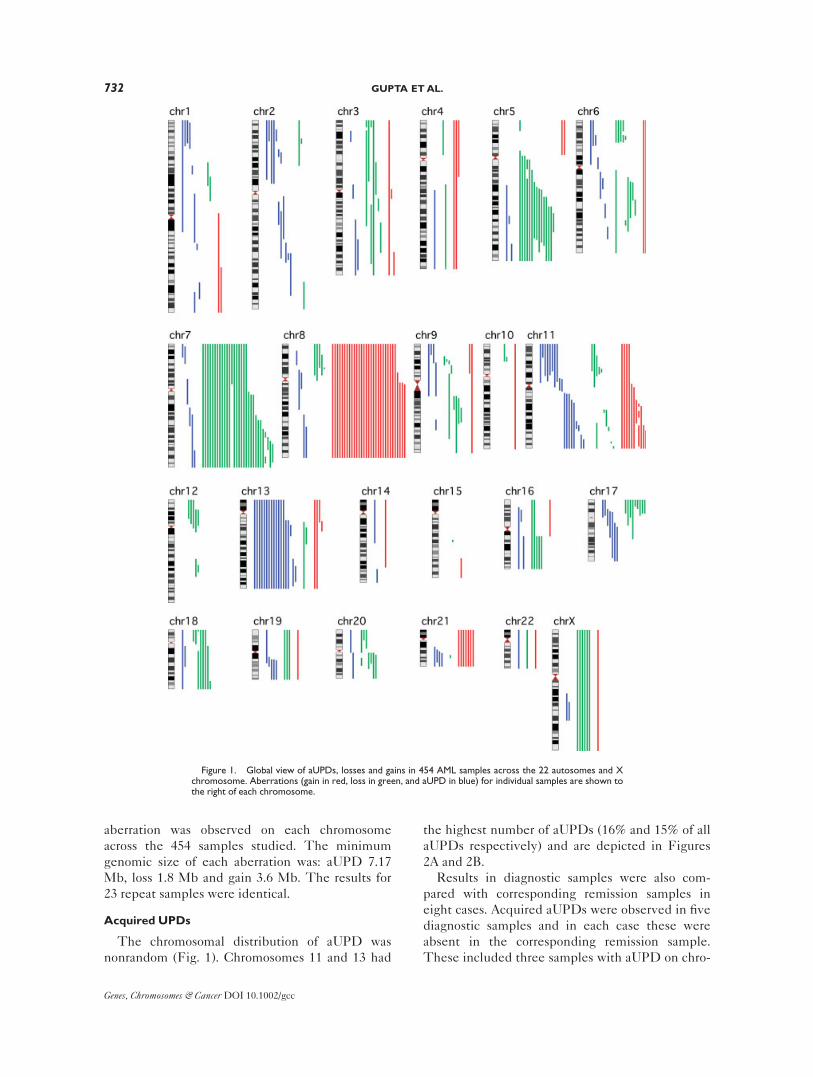
Global View of all of the Aberrations Observed
We detected a total of 351 aberrations (aUPDs,
losses and gains) in 163 (36%) of the 454 samples
(Tables 1 and 2). A global view of the aberrations
detected on each chromosome is depicted in Fig-
ure 1 and details are given in Table 3. Acquired
UPDs were observed in 17% of samples, losses in
15% and gains in 12% of samples (Tables 1 and 2).
In total, 5 samples had more than two aUPDs. No
homozygous losses were observed. At least one
Genes, Chromosomes & Cancer DOI 10.1002/gcc
731ACQUIRED UNIPARENTAL DISOMY IN AML
aberration was observed on each chromosome
across the 454 samples studied. The minimum
genomic size of each aberration was: aUPD 7.17
Mb, loss 1.8 Mb and gain 3.6 Mb. The results for
23 repeat samples were identical.
Acquired UPDs
The chromosomal distribution of aUPD was
nonrandom (Fig. 1). Chromosomes 11 and 13 had
the highest number of aUPDs (16% and 15% of all
aUPDs respectively) and are depicted in Figures
2A and 2B.
Results in diagnostic samples were also com-
pared with corresponding remission samples in
eight cases. Acquired aUPDs were observed in five
diagnostic samples and in each case these were
absent in the corresponding remission sample.
These included three samples with aUPD on chro-
Figure 1. Global view of aUPDs, losses and gains in 454 AML samples across the 22 autosomes and Xchromosome. Aberrations (gain in red, loss in green, and aUPD in blue) for individual samples are shown tothe right of each chromosome.
Genes, Chromosomes & Cancer DOI 10.1002/gcc
732 GUPTA ETAL.
mosome 13, one sample with aUPD on 11p and 1
sample with deletion on 11p in addition to aUPD
on 11q. Absence of these aberrations in remission
samples confirms their somatic origin and corrobo-
rates previous observations (Gorletta et al., 2005;
Raghavan et al., 2005). In general, we did not find
any correlation between aUPDs and the losses,
gains or aUPDs in other regions of the genome or
with chromosomal rearrangements identified
through karyotype analysis.
Chromosome 11
aUPDs were observed on both 11p (n 5 8) and
11q (n 5 9). In two samples aUPDs were observed
across the centromere. Four minimal regions of
aUPD could be delineated: 11pter-11p15.2 (17.4
Mb, n 5 8), 7 of which included the WT1 gene,
11p11.2 (2.8 Mb, n 5 6), 11q22.3 (4.51 Mb, n 5 7)
that includes the ATM gene and 11q24.1-q25 (11.8
Mb, n 5 7) (Fig. 2A; Supplementary Table 2). Six
of the nine samples with 11q aUPD included the
MLL gene.
Chromosome 13
Of the 18 samples with aUPD, 13 involved the
whole chromosome and another 2 had aUPD
resulting from a single breakpoint at 13q12.2 lead-
ing to homozygosity across most of the chromo-
some (Fig. 2B). The aUPDs in these 15 cases all
included the FLT3 gene and mutation analysis
revealed that all of the 15 had FLT3-ITD mutation
while only one had FLT3-TKD mutation. Eleven
of 15 samples had a single high-level ITD mutant
comprising 59–96% of total FLT3 alleles, indicative
of the loss of wild-type (WT) alleles in at least a
proportion of cells. One sample had a high total
FLT3-ITD level (68%) but this was made up of 2
mutants, 51% and 17%, respectively. Among the
remaining three samples, one had 2 ITD mutants
of total 48% (35% and 13%), and two samples each
had single ITD mutants of 39% and 36%, respec-
tively. Three further samples had interstitial
aUPDs between q13.1-q14.2 and q31.1-q33.2 that
did not include the FLT3 gene and all three lacked
TABLE 1. Aberrations Observed in Relation to Cytogenetic Risk Groups in the Total Cohort of 454 Samples
Adverserisk
Favorablerisk NKa
Intermediaterisk minus NKa
Unknownkaryotype Total (%)
Number of samples (% of total) 32 (7) 55 (12) 190 (42) 86 (19) 91 (20) 454Gains, no. (% of gains) 12 (22) 5 (9) 3 (5) 21 (38) 14 (25) 55 (12)Losses, no. (% of losses) 25 (36) 7 (10) 7 (10) 15 (21) 16 (23) 70 (15)aUPDs, no. (% of aUPDs) 8 (10) 6 (8) 37 (47) 9 (12) 18 (23) 78 (17)
aNK indicates normal karyotype.
TABLE 2. Aberrations Stratified by the Number of Breakpoints Involved
No breakpointSingle
breakpointDouble
breakpointTotal aberrations
(% of total)
Gains, no. (% of gains) 50 (66) 20 (26) 6 (8) 76 (21)Losses, no. (% of losses) 34 (22) 67 (43) 55 (35) 156 (44)aUPDs, no. (% of aUPDs) 15 (13) 56 (47) 48 (40) 119 (34)Total, no. (% of total) 99 (28) 143 (41) 109 (31) 351
TABLE 3. Distribution of the Total Number of Gains, Lossesand aUPDs Observed on 22 Autosomes and X Chromosome
Chromosome Gains Losses aUPDs All
1 2 2 9 132 0 3 13 163 3 9 4 164 3 3 1 75 2 17 3 226 2 12 8 227 0 31 6 378 31 5 5 419 2 9 5 16
10 1 2 0 311 13 11 19 4312 0 7 0 713 4 2 18 2414 1 0 2 315 1 1 0 216 1 5 3 917 0 9 7 1618 0 9 2 1119 1 3 5 920 0 8 2 1021 7 1 4 1222 1 1 1 3X 1 6 2 9
Total 76 156 119 351
Genes, Chromosomes & Cancer DOI 10.1002/gcc
733ACQUIRED UNIPARENTAL DISOMY IN AML
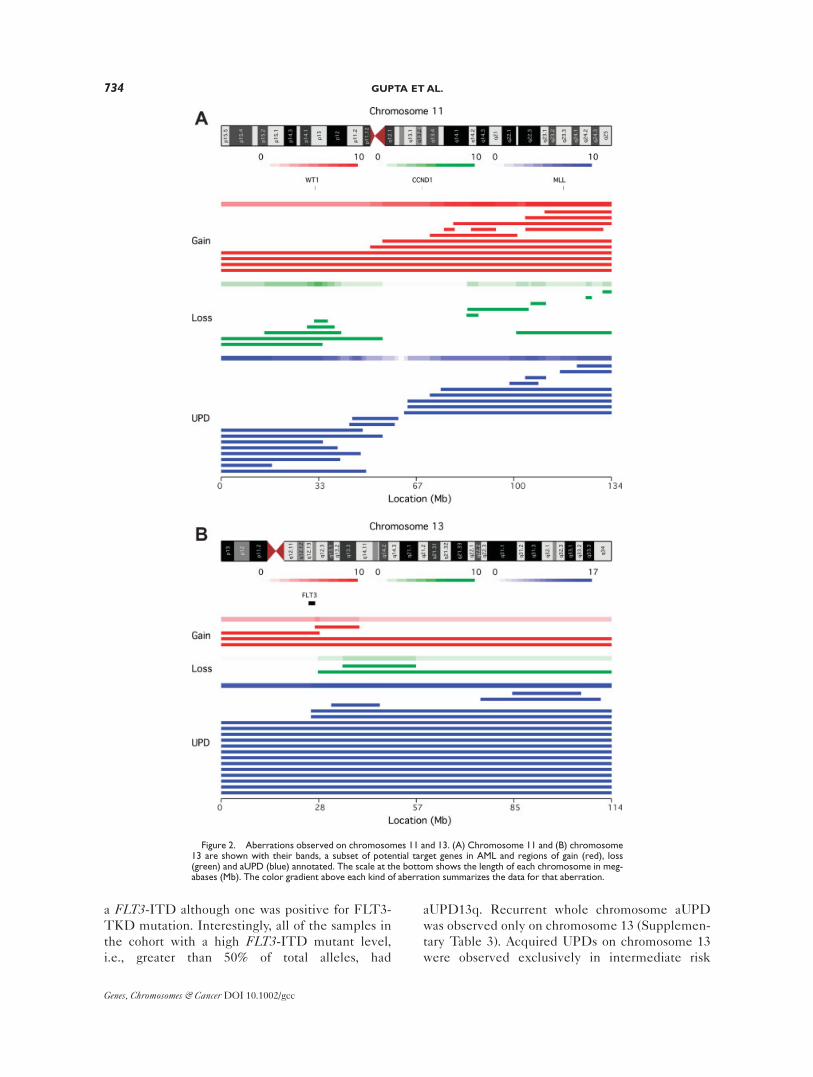
a FLT3-ITD although one was positive for FLT3-
TKD mutation. Interestingly, all of the samples in
the cohort with a high FLT3-ITD mutant level,
i.e., greater than 50% of total alleles, had
aUPD13q. Recurrent whole chromosome aUPD
was observed only on chromosome 13 (Supplemen-
tary Table 3). Acquired UPDs on chromosome 13
were observed exclusively in intermediate risk
Figure 2. Aberrations observed on chromosomes 11 and 13. (A) Chromosome 11 and (B) chromosome13 are shown with their bands, a subset of potential target genes in AML and regions of gain (red), loss(green) and aUPD (blue) annotated. The scale at the bottom shows the length of each chromosome in meg-abases (Mb). The color gradient above each kind of aberration summarizes the data for that aberration.
Genes, Chromosomes & Cancer DOI 10.1002/gcc
734 GUPTA ETAL.
patients (n 5 15, 5% of this group), 13 of whom
had a normal karyotype (Supplementary Table 4).
Novel regions of aUPD
Novel recurrent aUPDs in 3 or more samples
were detected at 2p (n 5 5), 17p (n 5 5), 2q (n 54), 17q (n 5 4), 1p (n 5 4), and Xq (n5 2) (Supple-
mentary Figs. 2A–2U; Supplementary Table 2).
Region of aUPD at 17p included the TP53 gene,
but for the other regions there are no obvious
candidates previously described in AML.
Other regions
Other chromosomes with areas of recurrent
aUPD were 6p, 9p, 19q, and 21q (Supplementary
Figs. 2A–2U). Acquired UPD in these regions has
been reported in earlier studies (Gorletta et al.,
2005; Raghavan et al., 2005). Regions of aUPD on
19q and 21q included CEBPA and RUNX1 genes,
respectively, mutations of which have been associ-
ated with aUPD in earlier studies (Fitzgibbon et
al., 2005; Raghavan et al., 2005).
aUPDs across cytogenetically defined risk groups
Table 1 shows the abnormalities observed in the
samples stratified by cytogenetic risk group. Sam-
ples with adverse risk cytogenetics had highest fre-
quency of all three types of aberration with aUPDs
in 25% of the samples, copy number loss in 78%
and gain in 38%. In samples from patients with
favorable risk cytogenetics, all three types of aber-
ration were present at a relatively lower frequency,
11% had aUPD, 13% had copy number loss, and
9% had copy number gain. In the samples from
patients with intermediate risk cytogenetics,
aUPDs were present at a higher frequency (17% of
samples) than copy number losses (8%) or gains
(9%). Stratifying the samples with intermediate
risk into those with a normal karyotype and the
rest showed that aUPDs were more common in the
normal karyotype group (19% and 10% of samples,
respectively) but the difference did not reach sta-
tistical significance (P 5 0.09, Table 1).
aUPDs detected as sole aberration
Based on SNP array results, aUPD(s) were
detected as the sole aberration in 59 (13%) of the
454 samples, 49 of which had a single aUPD, 6 had
two aUPDs, and 4 had four or more aUPDs (4, 6, 8,
and 14 aUPDs each). Cytogenetic profiles were
available for 48 of these samples; 36 (75%) had a
normal karyotype including the 4 samples with
four or more aUPDs, 6 additional samples had
intermediate risk karyotype, 5 had favorable and 1
had adverse risk karyotype. Fifteen (8%) samples
with a normal karyotype had no evidence of FLT3-ITDs and FLT3-TKDs while 10 (5%) samples
with a normal karyotype had no mutations in FLT3and NPM1.
aUPDs and number of breakpoints
Acquired UPDs resulting from a single break-
point, i.e., continuing from a certain point on the
chromosome to the telomere were the most fre-
quent (47% of all aUPDs). Interstitial aUPDs
resulting from double breakpoint events, i.e., not
reaching to either telomere occurred in 40% and
whole chromosome aUPDs with no evidence of a
breakpoint in 13% of the cases. Overall, 87% of the
aUPDs involved at least one breakpoint (Table 2).
Losses and Gains
The overall pattern of losses and gains is
depicted in Figure 1. As expected, the most fre-
quent losses (monosomies included) detected were
27/del(7q) (n 5 28, 18% of all losses), del(5q) (n 515, 10%), and 17p (n 5 9, 6%). Recurrent gains
(trisomies included) were observed at 8q (n 5 31,
41% of all gains), 11q (n 5 10, 13%), 21q (n 5 7,
9%), and 13q (n 5 4, 5%) in the region of the FLT3gene. None of the four samples with 113q had a
FLT3-ITD or FLT3-TKD. Other regions of gain
and loss are listed in Supplementary Table 5 and 6
(see also Supplementary Figs. 2A–2U). All recur-
rent losses or gains identified were in the regions
that have been reported for AML in the Mitelman
Database (http://cgap.nci.nih.gov/Chromosomes/
Mitelman). Besides del(5q) and del(7q), losses at
20q (13% of adverse risk samples), 18q (13%), 8p
(9%), 16q (9%) and gains on 5p (6%) were
observed exclusively while losses at 12p (9%), 17p
(9%), 3p (6%), and 3q (6%) were observed at
increased frequencies in adverse risk samples
(Supplementary Table 4).
Cytogenetic analysis compared with SNP array analysis
A comparison of the most frequent copy number
changes detected using karyotype analysis and
SNP arrays is listed in Supplementary Table 7. Of
the listed 119 events detected by either method,
56% were concordant, 23% were detected by
karyotype only, and 21% by SNP arrays only (dis-
cussed further in supplementary information). Of
the 190 samples classified as normal by karyotype
analysis, abnormalities associated with an adverse
prognosis were detected by SNP arrays in 3 (1 had
del(5q) and 2 had monosomy 7). Furthermore,
using SNP arrays we were able to evaluate copy
Genes, Chromosomes & Cancer DOI 10.1002/gcc
735ACQUIRED UNIPARENTAL DISOMY IN AML
number changes in 91 cases where the karyotype
was not available [NDS (sample not available) 569, failed 5 15, incomplete information 5 7]; 56
were normal and 35 showed aberrations with a total
of 15 gains, 39 losses, and 20 aUPDs. Six samples
had abnormalities associated with adverse progno-
sis, 4 had del(5q) (2 failed and 2 NDS on karyotype
analysis), and 2 had monosomy 7 (both NDS).
DISCUSSION
In AML, high levels of mutants in genes like
FLT3 have been shown to be related to worse clini-
cal outcome (Kottaridis et al., 2001; Whitman et
al., 2001; Thiede et al., 2002). Acquired UPD is
one of the mechanisms that can lead to increased
levels of mutant by rendering the cells homozy-
gous for preexisting mutations (Fitzgibbon et al.,
2005; Raghavan et al., 2005) and hence could be
related to clinical outcome. Thus, it is important to
know the regions of aUPD to determine novel
underlying molecular aberrations affecting disease
pathogenesis and treatment outcome. Here, we
have developed a comprehensive map of aUPD in
a large cohort of AML samples. We detected
aUPDs in 17% of the 454 samples and have deter-
mined its frequency on different chromosomes,
the most frequent being on 13q, 11p, and 11q,
confirming previous studies (Gorletta et al., 2005;
Raghavan et al., 2005). In addition, we also identi-
fied novel regions of aUPD at 2p, 17p, 2q, 17q, 1p,
and Xq indicating the existence of unknown muta-
tional targets yet to be discovered. Our previous
analysis using both fluorescent in situ hybridization
and direct sequencing has validated the interpreta-
tion of these array data (Fitzgibbon et al., 2005;
Raghavan et al., 2005). Reproducibility of our data
were confirmed by the identical results in 23
samples for which the experiments were repeated.
The frequency of aUPD in our AML samples
(17%) is far more than that seen in control popula-
tion (3%), which strongly suggests that these are
somatically acquired events as shown earlier (Gor-
letta et al., 2005; Raghavan et al., 2005). The pat-
tern of aUPD reported in this article is distinct
from that identified in other hematological and
solid tumor malignancies (White et al., 1998; Hag-
strom and Dryja, 1999; Shearer et al., 1999; Kra-
lovics et al., 2002; Murthy et al., 2002; Baxter et al.,
2005; James et al., 2005; Kralovics et al., 2005; Lev-
ine et al., 2005; Teh et al., 2005; Gaasenbeek et al.,
2006; Fitzgibbon et al., 2007; Karow et al., 2007;
Kratz et al., 2007; Pfeifer et al., 2007; Purdie et al.,
2007; Stark and Hayward, 2007).
The introduction of an area of aUPD may have a
number of possible consequences. Firstly, as stated
above, it may give rise to homozygosity for a
mutated gene that provides a selection advantage
to the cell such as a proliferative drive or increased
chemoresistance. This is very well exemplified by
our data for FLT3 gene where ITD but not TKD
mutations were observed on all of the samples with
UPD13q in the region of FLT3 gene. FLT3-ITDs
are associated with a poor prognosis, and in some
studies this is limited to patients with a high mu-
tant level indicative of the loss of wild-type alleles
(Kottaridis et al., 2001; Whitman et al., 2001;
Thiede et al., 2002). All samples with a high
(>50%) mutant ITD level in our cohort had chro-
mosome 13 aUPD suggesting that in these cases
UPD arose after the acquisition of FLT3-ITD
mutation. aUPD was also observed in 3 samples
with lower (<50%) level of FLT3-ITDs raising the
possibility that the aUPD was acquired prior to the
FLT3-ITD and therefore there may be other
mutated genes on chromosome 13 that are driving
the selection process. The WT1 gene on 11p is also
in an area of recurrent aUPD and homozygous
mutations of functional significance in this gene
have been reported in AML (Fitzgibbon et al.,
2005; Summers et al., 2007). In one of our studies
(Fitzgibbon et al., 2005) it was shown that of the
three samples with aUPD11p in the region of WT1,a homozygous WT1 mutation was detected in 1 of
the 3 samples (Fitzgibbon et al., 2005), again sug-
gesting that mutations might exist in other genes
within the aUPD region. Although two samples
were observed with aUPD5q in the region of the
NPM1 gene, neither had a mutation in this gene.
The reported NPM1 mutations in AML have been
heterozygous, and its putative function being
involved in the nuclear-cytoplasmic shuttling of
proteins and nucleic acids is thought to require
wild-type NPM1 (Grisendi et al., 2006). It would
therefore be an unlikely target for a homozygous
mutation.
A second possible consequence of aUPD may be
its impact on epigenetic changes. Transcriptional
silencing through methylation is a frequent mecha-
nism by which tumor suppressor genes are inacti-
vated in human cancers (Stebbing et al., 2006) and
it is interesting that a report on global assessment
of methylation targets in de novo AML found
methylation to be overrepresented on both the
arms of chromosome 11 (Rush et al., 2001). It is
possible that epigenetic changes are the events
underlying aUPD11p and aUPD11q in at least few
of our samples. Similarly, aUPD could introduce
Genes, Chromosomes & Cancer DOI 10.1002/gcc
736 GUPTA ETAL.
homozygosity for coding polymorphisms (rather
than mutations) with variable functional activity,
such as those in the drug metabolizing enzymes
(Schwahn and Rozen, 2001), or noncoding regula-
tory polymorphisms that result in differential
expression of alleles (Milani et al., 2007) where
acquired homozygosity could lead to haploinsuffi-
ciency or over-expression of critical proteins.
This study also suggests mitotic recombination
to be the major mechanism behind aUPD in AML.
The number of breakpoints through which aUPDs
arise indicates the mechanism that leads to aUPD.
Whole chromosome aUPDs with no breakpoints
may be the result of nondisjunction followed by
duplication or loss during cell division, whereas
those arising from single or double breakpoints
result from mitotic recombination events. Of all of
the 119 aUPDs observed, 87% were due to mitotic
recombination events. The remaining 13% could
be attributed to nondisjunction, 87% of these
being only on chromosome 13.
Copy number loss and aUPD both independ-
ently lead to loss of heterozygosity (LOH) but
result in a difference in gene dosage that may have
different pathological consequences; haploinsuffi-
ciency in the case of copy number loss potentially
coupled with mutation in the remaining allele, and
two copies of a mutant allele in aUPD. In our data,
we observed losses and aUPDs in common regions
at many locations covering genes such as CTNNA1and NPM1 (on chromosome 5), WT1, ATM and
MLL (on chromosome 11), TP53 (on chromosome
17), CEBPA (on chromosome 19), and RUNX1 (on
chromosome 21) (see Supplementary Figs. 2A–
2U). Further work will be required to determine if
LOH per se, at least in few loci, resulting either
from loss or aUPD have same pathological conse-
quences. Studies in chronic lymphocytic leukemia
have shown that homozygous deletions of
MIRN15A/MIRN16-1 at 13q14 are associated with
aUPD13q (Pfeifer et al., 2007; Lehmann et al.,
2008). We did not find any homozygous deletions
at this locus.
For identification of aUPD in a tumor sample,
ideally it should be compared with a germline
DNA obtained from the same individual (matched
reference sample). Matched references allow
unequivocal differentiation of IRH from the
acquired aberrations. A copy-neutral region of
homozygosity observed in the matched reference
indicates an IRH, while such a region when pres-
ent in a tumor sample but missing in matched ref-
erence indicates its acquired nature. In the absence
of matched reference, it is possible that IRHs may
be called as aUPD. In the current study the false
discovery rate for the number of aUPD regions
identified is 3.3%.
The frequency of constitutional UPDs in
healthy individuals is currently not known, apart
from reports of rare sporadic cases (Karanjawala et
al., 2000; O’Keefe et al., 2006; Ting et al., 2006).
The 3.3% of control samples with copy number
neutral IRHs observed could be due to consan-
guinity or linkage disequilibrium of extended hap-
lotypes in these individuals, or may be real aUPD
events. We observed only 5 AML samples, i.e., 1%
of the total cohort, with more than 2 aUPDs.
These multiple aUPDs could be germ-line events
due consanguinity or other reasons defined above,
although, without remission material for compari-
son their acquired nature cannot be excluded.
The incidence of aUPD in this report may be an
underestimate, since we used lower-resolution 10K
arrays. Recently available arrays have 50–200 fold
higher resolution and are capable of identifying
even smaller aberrations. Also, a stringent criterion
of 50/2 (see methods) to define regions of aUPD
could have missed a few smaller regions of aUPD.
In one sample, aUPD on 11q could not be identi-
fied using our criteria of 50/2 but could only be
identified when compared with paired remission
sample. Furthermore, the density of the SNPs on
the arrays used is not uniform across all of the chro-
mosomes and smaller aUPDs in the regions with
low SNP density, for example chromosome 19,
chromosome X or close to centromeres, might not
have been detected. The use of a large set of con-
trols (n 5 90), however, gave us a good estimate of
IRHs in the control population with a similar eth-
nic composition which further gives us confidence
in the regions identified as interstitial aUPDs.
These regions might otherwise have been difficult
to infer in the absence of paired control samples.
In conclusion, our study provides a map of large
aUPDs on a genome-wide basis in a large cohort of
diagnostic AML samples. It confirms and extends
previous studies and shows that aUPDs in AML
are common and nonrandom, the most frequent
being on chromosomes 13, 11p, 11q. Novel regions
of aUPD have been identified at 2p, 17p, 2q, 17q,
1p, and Xq. The aUPDs on 13q and 11p are clearly
associated with underlying mutations as demon-
strated by those in the FLT3 and WT1 (Fitzgibbon
et al., 2005) genes and may, therefore, identify
genes with functional consequences in the hetero-
zygous as well as homozygous state. However, they
do not appear to represent widespread genomic
damage as most were restricted to just one or two
Genes, Chromosomes & Cancer DOI 10.1002/gcc
737ACQUIRED UNIPARENTAL DISOMY IN AML
sites in an individual sample. The future challenge
will be to identify the relevant genes and muta-
tions within these areas of aUPD. Furthermore,
the relatively low frequency of aUPDs on a given
chromosomal region suggests that samples from
even larger cohort of patients may be necessary to
determine their prognostic significance.
ACKNOWLEDGMENTS
The authors thank Ian Tomlinson and Richard
S. Houlston for providing the data on 90 controls
from CORGI study, Christine Harrison and Keith
Wheatley for providing the karyotype data, and
Jude Fitzgibbon and Andrew Lister for reading the
manuscript. The authors also thank the staff of the
Medical Oncology laboratory.
REFERENCES
The International HapMap Consortium. 2005. A haplotype map ofthe human genome. Nature 437:1299–1320.
Baldus CD, Mrozek K, Marcucci G, Bloomfield CD. 2007. Clinicaloutcome of de novo acute myeloid leukaemia patients with nor-mal cytogenetics is affected by molecular genetic alterations:A concise review. Br J Haematol 137:387–400.
Baxter EJ, Scott LM, Campbell PJ, East C, Fourouclas N, SwantonS, Vassiliou GS, Bench AJ, Boyd EM, Curtin N, Scott MA, ErberWN, Green AR. 2005. Acquired mutation of the tyrosine kinaseJAK2 in human myeloproliferative disorders. Lancet 365:1054–1061.
Falini B, Mecucci C, Tiacci E, Alcalay M, Rosati R, Pasqualucci L,La Starza R, Diverio D, Colombo E, Santucci A, Bigerna B, PaciniR, Pucciarini A, Liso A, Vignetti M, Fazi P, Meani N, Pettirossi V,Saglio G, Mandelli F, Lo-Coco F, Pelicci PG, Martelli MF. 2005.Cytoplasmic nucleophosmin in acute myelogenous leukemia witha normal karyotype. N Engl J Med 352:254–266.
Fitzgibbon J, Iqbal S, Davies A, O’Shea D, Carlotti E, Chaplin T,Matthews J, Raghavan M, Norton A, Lister TA, Young BD. 2007.Genome-wide detection of recurring sites of uniparental disomyin follicular and transformed follicular lymphoma. Leukemia21:1514–1520.
Fitzgibbon J, Smith LL, Raghavan M, Smith ML, Debernardi S,Skoulakis S, Lillington D, Lister TA, Young BD. 2005. Associa-tion between acquired uniparental disomy and homozygous genemutation in acute myeloid leukemias. Cancer Res 65:9152–9154.
Gaasenbeek M, Howarth K, Rowan AJ, Gorman PA, Jones A, Chap-lin T, Liu Y, Bicknell D, Davison EJ, Fiegler H, Carter NP, Roy-lance RR, Tomlinson IP. 2006. Combined array-comparativegenomic hybridization and single-nucleotide polymorphism-lossof heterozygosity analysis reveals complex changes and multipleforms of chromosomal instability in colorectal cancers. CancerRes 66:3471–3479.
Gondek LP, Dunbar AJ, Szpurka H, McDevitt MA, Maciejewski JP.2007a. SNP array karyotyping allows for the detection of unipar-ental disomy and cryptic chromosomal abnormalities in MDS/MPD-U and MPD. PLoS ONE 2:e1225.
Gondek LP, Tiu R, Haddad AS, O’Keefe C L, Sekeres MA, TheilKS, Maciejewski JP. 2007b. Single nucleotide polymorphismarrays complement metaphase cytogenetics in detection of newchromosomal lesions in MDS. Leukemia 21:2058–2061.
Gondek LP, Tiu R, O’Keefe CL, Sekeres MA, Theil KS, Maciejew-ski JP. 2007c. Chromosomal lesions and uniparental disomydetected by SNP arrays in MDS, MDS/MPD and MDS-derivedAML. Blood 111:1534–1542.
Gorletta TA, Gasparini P, D’Elios MM, Trubia M, Pelicci PG, DiFiore PP. 2005. Frequent loss of heterozygosity without loss ofgenetic material in acute myeloid leukemia with a normal karyo-type. Genes Chromosomes Cancer 44:334–337.
Grimwade D, Walker H, Oliver F, Wheatley K, Harrison C, HarrisonG, Rees J, Hann I, Stevens R, Burnett A, Goldstone A. 1998. Theimportance of diagnostic cytogenetics on outcome in AML: Anal-ysis of 1,612 patients entered into the MRC AML 10 trial. The
medical research council adult and children’s leukaemia workingparties. Blood 92:2322–2333.
Grisendi S, Mecucci C, Falini B, Pandolfi PP. 2006. Nucleophosminand cancer. Nat Rev Cancer 6:493–505.
Hagstrom SA, Dryja TP. 1999. Mitotic recombination map of 13cen-13q14 derived from an investigation of loss of heterozygosity inretinoblastomas. Proc Natl Acad Sci USA 96:2952–2957.
Hann IM, Stevens RF, Goldstone AH, Rees JK, Wheatley K, GrayRG, Burnett AK. 1997. Randomized comparison of DAT versusADE as induction chemotherapy in children and younger adultswith acute myeloid leukemia. Results of the Medical ResearchCouncil’s 10th AML trial (MRC AML10). Adult and childhoodleukaemia working parties of the medical research council. Blood89:2311–2318.
James C, Ugo V, Le Couedic JP, Staerk J, Delhommeau F, Lacout C,Garcon L, Raslova H, Berger R, Bennaceur-Griscelli A, VillevalJL, Constantinescu SN, Casadevall N, Vainchenker W. 2005. Aunique clonal JAK2 mutation leading to constitutive signallingcauses polycythaemia vera. Nature 434:1144–1148.
Karanjawala ZE, Kaariainen H, Ghosh S, Tannenbaum J, Martin C,Ally D, Tuomilehto J, Valle T, Collins FS. 2000. Complete mater-nal isodisomy of chromosome 8 in an individual with an early-onset ileal carcinoid tumor. Am J Med Genet 93:207–210.
Karow A, Steinemann D, Gohring G, Hasle H, Greiner J, Harila-Saari A, Flotho C, Zenker M, Schlegelberger B, Niemeyer CM,Kratz CP. 2007. Clonal duplication of a germline PTPN11 muta-tion due to acquired uniparental disomy in acute lymphoblasticleukemia blasts from a patient with Noonan syndrome. Leukemia21:1303–1305.
Kemp Z, Carvajal-Carmona L, Spain S, Barclay E, Gorman M, Mar-tin L, Jaeger E, Brooks N, Bishop DT, Thomas H, Tomlinson I,Papaemmanuil E, Webb E, Sellick GS, Wood W, Evans G, Lucas-sen A, Maher ER, Houlston RS. 2006. Evidence for a colorectalcancer susceptibility locus on chromosome 3q21-q24 from a high-density SNP genome-wide linkage scan. Hum Mol Genet15:2903–2910.
Kloth JN, Oosting J, van Wezel T, Szuhai K, Knijnenburg J, GorterA, Kenter GG, Fleuren GJ, Jordanova ES. 2007. Combined array-comparative genomic hybridization and single-nucleotide poly-morphism-loss of heterozygosity analysis reveals complex geneticalterations in cervical cancer. BMC Genom 8:53.
Kottaridis PD, Gale RE, Frew ME, Harrison G, Langabeer SE, Bel-ton AA, Walker H, Wheatley K, Bowen DT, Burnett AK, Gold-stone AH, Linch DC. 2001. The presence of a FLT3 internal tan-dem duplication in patients with acute myeloid leukemia (AML)adds important prognostic information to cytogenetic risk groupand response to the first cycle of chemotherapy: Analysis of 854patients from the United Kingdom medical research councilAML 10 and 12 trials. Blood 98:1752–1759.
Kralovics R, Guan Y, Prchal JT. 2002. Acquired uniparental disomyof chromosome 9p is a frequent stem cell defect in polycythemiavera. Exp Hematol 30:229–236.
Kralovics R, Passamonti F, Buser AS, Teo SS, Tiedt R, Passweg JR,Tichelli A, Cazzola M, Skoda RC. 2005. A gain-of-function muta-tion of JAK2 in myeloproliferative disorders. N Engl J Med352:1779–1790.
Kratz CP, Steinemann D, Niemeyer CM, Schlegelberger B, Kosciel-niak E, Kontny U, Zenker M. 2007. Uniparental disomy at chro-mosome 11p15.5 followed by HRAS mutations in embryonalrhabdomyosarcoma: Lessons from Costello syndrome. Hum MolGenet 16:374–379.
Lehmann S, Ogawa S, Raynaud SD, Sanada M, Nannya Y, TicchioniM, Bastard C, Kawamata N, Koeffler HP. 2008. Molecular allelo-karyotyping of early-stage, untreated chronic lymphocytic leuke-mia. Cancer 112:1296–1305.
Levine RL, Wadleigh M, Cools J, Ebert BL, Wernig G, Huntly BJ,Boggon TJ, Wlodarska I, Clark JJ, Moore S, Adelsperger J, Koo S,Lee JC, Gabriel S, Mercher T, D’Andrea A, Frohling S, DohnerK, Marynen P, Vandenberghe P, Mesa RA, Tefferi A, Griffin JD,Eck MJ, Sellers WR, Meyerson M, Golub TR, Lee SJ, GillilandDG. 2005. Activating mutation in the tyrosine kinase JAK2 in pol-ycythemia vera, essential thrombocythemia, and myeloid meta-plasia with myelofibrosis. Cancer Cells 7:387–397.
Matsuzaki H, Loi H, Dong S, Tsai YY, Fang J, Law J, Di X, LiuWM, Yang G, Liu G, Huang J, Kennedy GC, Ryder TB, MarcusGA, Walsh PS, Shriver MD, Puck JM, Jones KW, Mei R. 2004.Parallel genotyping of over 10,000 SNPs using a one-primer assayon a high-density oligonucleotide array. Genome Res 14:414–425.
Mead AJ, Linch DC, Hills RK, Wheatley K, Burnett AK, Gale RE.2007. FLT3 tyrosine kinase domain mutations are biologically dis-
Genes, Chromosomes & Cancer DOI 10.1002/gcc
738 GUPTA ETAL.
tinct from and have a significantly more favorable prognosis thanFLT3 internal tandem duplications in patients with acute mye-loid leukemia. Blood 110:1262–1270.
Milani L, Gupta M, Andersen M, Dhar S, Fryknas M, Isaksson A,Larsson R, Syvanen AC. 2007. Allelic imbalance in gene expres-sion as a guide to cis-acting regulatory single nucleotide polymor-phisms in cancer cells. Nucleic Acids Res 35:e34.
Mohamedali A, Gaken J, Twine NA, Ingram W, Westwood N, LeaNC, Hayden J, Donaldson N, Aul C, Gattermann N, GiagounidisA, Germing U, List AF, Mufti GJ. 2007. Prevalence and prognos-tic significance of allelic imbalance by single-nucleotide polymor-phism analysis in low-risk myelodysplastic syndromes. Blood110:3365–3373.
Murthy SK, DiFrancesco LM, Ogilvie RT, Demetrick DJ. 2002.Loss of heterozygosity associated with uniparental disomy inbreast carcinoma. Mod Pathol 15:1241–1250.
O’Keefe CL, Gondek LP, Tiu R, Nearman ZP, Wlodarski M, Nan-nya Y, Ogawa S, Maciejewski JP. 2006. Identification of chromo-somal abnormalities in healthy bone marrow using 250K SNParrays. Blood 108:(abstract [2076]).
Pfeifer D, Pantic M, Skatulla I, Rawluk J, Kreutz C, Martens UM,Fisch P, Timmer J, Veelken H. 2007. Genome-wide analysis ofDNA copy number changes and LOH in CLL using high-densitySNP arrays. Blood 109:1202–1210.
Purdie KJ, Lambert SR, Teh MT, Chaplin T, Molloy G, RaghavanM, Kelsell DP, Leigh IM, Harwood CA, Proby CM, Young BD.2007. Allelic imbalances and microdeletions affecting thePTPRD gene in cutaneous squamous cell carcinomas detectedusing single nucleotide polymorphism microarray analysis. GenesChromosomes Cancer 46:661–669.
Raghavan M, Lillington DM, Skoulakis S, Debernardi S, Chaplin T,Foot NJ, Lister TA, Young BD. 2005. Genome-wide single nucle-otide polymorphism analysis reveals frequent partial uniparentaldisomy due to somatic recombination in acute myeloid leuke-mias. Cancer Res 65:375–378.
Rush LJ, Dai Z, Smiraglia DJ, Gao X, Wright FA, Fruhwald M,Costello JF, Held WA, Yu L, Krahe R, Kolitz JE, Bloomfield CD,Caligiuri MA, Plass C. 2001. Novel methylation targets in de novoacute myeloid leukemia with prevalence of chromosome 11 loci.Blood 97:3226–3233.
Schwahn B, Rozen R. 2001. Polymorphisms in the methylenetetra-hydrofolate reductase gene: Clinical consequences. Am J Pharma-cogenomics 1:189–201.
Shearer PD, Valentine MB, Grundy P, DeCou JM, Banavali SD,Komuro H, Green DM, Beckwith JB, Look AT. 1999. Hemizy-
gous deletions of chromosome band 16q24 in Wilms tumor:Detection by fluorescence in situ hybridization. Cancer GenetCytogenet 115:100–105.
Stark M, Hayward N. 2007. Genome-wide loss of heterozygosityand copy number analysis in melanoma using high-density single-nucleotide polymorphism arrays. Cancer Res 67:2632–2642.
Stebbing J, Bower M, Syed N, Smith P, Yu V, Crook T. 2006. Epige-netics: An emerging technology in the diagnosis and treatment ofcancer. Pharmacogenomics 7:747–757.
Summers K, Stevens J, Kakkas I, Smith M, Smith LL, MacdougallF, Cavenagh J, Bonnet D, Young BD, Lister TA, Fitzgibbon J.2007. Wilms’ tumour 1 mutations are associated with FLT3-ITDand failure of standard induction chemotherapy in patients withnormal karyotype AML. Leukemia 21:550–551; author reply 552.
Teh MT, Blaydon D, Chaplin T, Foot NJ, Skoulakis S, RaghavanM, Harwood CA, Proby CM, Philpott MP, Young BD, Kelsell DP.2005. Genomewide single nucleotide polymorphism microarraymapping in basal cell carcinomas unveils uniparental disomy as akey somatic event. Cancer Res 65:8597–8603.
Thiede C, Steudel C, Mohr B, Schaich M, Schakel U, PlatzbeckerU, Wermke M, Bornhauser M, Ritter M, Neubauer A, EhningerG, Illmer T. 2002. Analysis of FLT3-activating mutations in 979patients with acute myelogenous leukemia: association with FABsubtypes and identification of subgroups with poor prognosis.Blood 99:4326–4335.
Ting JC, Ye Y, Thomas GH, Ruczinski I, Pevsner J. 2006. Analysisand visualization of chromosomal abnormalities in SNP data withSNPscan. BMC Bioinformatics 7:25.
Walker BA, Leone PE, Jenner MW, Li C, Gonzalez D, Johnson DC,Ross FM, Davies FE, Morgan GJ. 2006. Integration of globalSNP-based mapping and expression arrays reveals key regions,mechanisms, and genes important in the pathogenesis of multiplemyeloma. Blood 108:1733–1743.
White VA, McNeil BK, Horsman DE. 1998. Acquired homozygosity(isodisomy) of chromosome 3 in uveal melanoma. Cancer GenetCytogenet 102:40–45.
Whitman SP, Archer KJ, Feng L, Baldus C, Becknell B, Carlson BD,Carroll AJ, Mrozek K, Vardiman JW, George SL, Kolitz JE, LarsonRA, Bloomfield CD, Caligiuri MA. 2001. Absence of the wild-type allele predicts poor prognosis in adult de novo acute myeloidleukemia with normal cytogenetics and the internal tandemduplication of FLT3: A cancer and leukemia group B study. Can-cer Res 61:7233–7239.
Genes, Chromosomes & Cancer DOI 10.1002/gcc
739ACQUIRED UNIPARENTAL DISOMY IN AML


![PHYLOGENETIC ANALYSIS OF AVIAN PARENTAL CARE€¦ · types of parental care in bony fishes (i.e. among states of uniparental [male], uniparental [fe- male], biparental, and no parental](https://img.pdfslide.us/doc/110x75/5f0ab0957e708231d42cdb6f/phylogenetic-analysis-of-avian-parental-care-types-of-parental-care-in-bony-fishes.jpg)