Embed Size (px)
Citation preview
University of Birmingham
Novel lightweight concrete containingmanufactured plastic aggregateAlqahtani, Fahad; Ghataora, Gurmel; Khan, Mohammad Iqbal; Dirar, Samir
DOI:10.1016/j.conbuildmat.2017.05.011
License:Creative Commons: Attribution-NonCommercial-NoDerivs (CC BY-NC-ND)
Document VersionPeer reviewed version
Citation for published version (Harvard):Alqahtani, F, Ghataora, G, Khan, MI & Dirar, S 2017, 'Novel lightweight concrete containing manufacturedplastic aggregate', Construction and Building Materials, vol. 148, pp. 386-397.https://doi.org/10.1016/j.conbuildmat.2017.05.011
Link to publication on Research at Birmingham portal
Publisher Rights Statement:Eligibility for repository: Checked on 5/5/2017
General rightsUnless a licence is specified above, all rights (including copyright and moral rights) in this document are retained by the authors and/or thecopyright holders. The express permission of the copyright holder must be obtained for any use of this material other than for purposespermitted by law.
•Users may freely distribute the URL that is used to identify this publication.•Users may download and/or print one copy of the publication from the University of Birmingham research portal for the purpose of privatestudy or non-commercial research.•User may use extracts from the document in line with the concept of ‘fair dealing’ under the Copyright, Designs and Patents Act 1988 (?)•Users may not further distribute the material nor use it for the purposes of commercial gain.
Where a licence is displayed above, please note the terms and conditions of the licence govern your use of this document.
When citing, please reference the published version.
Take down policyWhile the University of Birmingham exercises care and attention in making items available there are rare occasions when an item has beenuploaded in error or has been deemed to be commercially or otherwise sensitive.
If you believe that this is the case for this document, please contact [email protected] providing details and we will remove access tothe work immediately and investigate.
Download date: 06. Dec. 2021
1
Novel Lightweight Concrete Containing Manufactured Plastic Aggregate 1
Fahad K. Alqahtani* 2
Lecturer, Department of Civil Engineering, King Saud University, 3
P. O. Box 800, Riyadh 11421, Saudi Arabia 4
PhD Student at the Department of Civil Engineering, University of Birmingham, 5
Birmingham B15 2TT, United Kingdom 6
*Corresponding Author: Email: [email protected] 7
Gurmel Ghataora 8
Senior Lecturer, Department of Civil Engineering, University of Birmingham, 9
Birmingham B15 2TT, United Kingdom 10
Tel: +44 (0) 121 414 5047 11
Email: [email protected] 12
M. Iqbal Khan 13
Professor of Structural Engineering, Department of Civil Engineering & Managing Director, 14
Center of Excellence for Concrete Research and Testing, College of Engineering, King Saud 15
University, P. O. Box 800, Riyadh 11421, Saudi Arabia 16
Tel: +966 14676920; Fax: +966 14677008 17
Email: [email protected] 18
Samir Dirar 19
Senior Lecturer, Department of Civil Engineering, University of Birmingham, 20
Birmingham B15 2TT, United Kingdom 21
Tel: +44 (0) 121 414 4385 22
Email: [email protected] 23
24
25
2
Novel Lightweight Concrete Containing Manufactured Plastic Aggregate 26
Fahad K. Alqahtani1*, Gurmel Ghataora1, M. Iqbal Khan2 and Samir Dirar1 27
1Department of Civil Engineering, University of Birmingham, UK 28
2Department of Civil Engineering, King Saud University, KSA 29
30
ABSTRACT 31
Plastic waste and its low recycling rate make a significant contribution towards the pollution 32
of the environment. It is therefore essential that plastic waste is utilised in different 33
applications, such as aggregates in concrete. In this paper, an investigation of a manufactured 34
plastic aggregate as a replacement for pumice lightweight aggregate and Lytag aggregate in 35
concrete is presented. The influence of replacement level on the fresh, hardened and 36
microstructure properties of concrete was investigated. The slump, compressive strength, 37
flexural strength, splitting tensile strength and elastic modulus decreased with the increase in 38
replacement level. Neither the fresh density nor the hardened density was significantly affected 39
by replacement level. The Lytag and conventional lightweight concrete mixes had a brittle 40
failure; whereas the concrete mixes incorporating the manufactured plastic aggregate had a 41
ductile post-peak behaviour. The results suggest that the concrete mix containing the 42
manufactured plastic aggregate at a replacement level of 25% can be used in structural and 43
non-structural applications requiring moderate strength and ductility. Predictive models were 44
proposed and demonstrated to be in good agreement with the experimental results for the 45
mechanical properties of the concrete mixes incorporating the manufactured plastic aggregate. 46
Keywords: plastic waste; recycled plastic aggregate; lightweight aggregate; lightweight 47
concrete; mechanical properties; SEM; correlations 48
3
Abbreviations 49
CA Coarse aggregate
Ec Modulus of elasticity
FA Fine aggregate
ITZ Interfacial transition zone
LAC Concrete made using Lytag aggregate
LWA
Conventional pumice volcanic lightweight aggregate
LWC
Concrete made using conventional lightweight aggregate (LWA)
LYA Lytag aggregate
RP2F1A
Recycled plastic aggregate made using 30% LLDPE and 70% red or dune sand
RP2F1C
Concrete made using recycled plastic aggregate (RP2F1A)
RP2F1C25 The concrete mix containing RP2F1A at a replacement level of 25%
RP2F1C50 The concrete mix containing RP2F1A at a replacement level of 50%
RP2F1C75 The concrete mix containing RP2F1A at a replacement level of 75%
RP2F1C100 The concrete mix containing RP2F1A at a replacement level of 100%
RPAs Recycled plastic aggregates
SLA
Synthetic lightweight aggregate
W/C
Water to cement ratio
WPLA
Waste PET lightweight aggregate
fc Cylinder compressive strength
fr Flexural strength
ft Splitting tensile strength
γw Dry density
50
51
52
53
54
55
56
4
1.0 Introduction 57
The use of plastic is consistently growing because of its versatility. The total plastic produced 58
worldwide in 2014 was estimated at 313 million tonnes (Mt) [1]; in 2015 it increased to 322 59
Mt, which is about 3% rise in two years [2]. According to the Plastic Association, the European 60
consumption of plastic in 2014 was 59 Mt, with almost half of this amount (i.e. 25.8 Mt) being 61
disposed of as waste [2]. Unfortunately, the recycling rate is not encouraging, since only 29.7% 62
of the plastic waste was recycled in Europe in 2014 and only 8.8% in the USA in 2012 [2, 3]. 63
The bulk quantity of waste plastic is usually sent to landfill or dumped into the oceans, which 64
are the terminus in the lifecycle of plastic, causing polluting effects over long periods of time. 65
For instance, it has been reported that around 28.95 Mt of plastic waste was disposed of in the 66
USA in 2012 [2, 3]. Moreover, Jambeck et al. [4] reported that every year, from 4.8 to 12.7 67
million metric tonnes of plastic waste are disposed of in the oceans. Alternatively, plastic waste 68
is incinerated; however, this generates a significant amount of carbon and other toxic 69
emissions, as well as the generation of residue which also presents toxicity issues [5]. 70
For these reasons, the possibility of using plastic waste in different industries, such as the 71
construction sector was explored. One of the potential applications is implementing plastic as 72
replacement for aggregates in concrete, since the consumption of aggregates reached 48.3 73
billion metric tonnes in 2015 [6]. Several studies [7-26] were conducted on the effect of 74
replacing coarse (CA) and/or fine aggregate (FA) in concrete with plastic. However, few 75
studies have reported on the influence of manufactured plastic aggregate on the performance 76
of concrete, when it is used as a replacement for aggregate [27-34]. 77
The use of plastic to manufacture plastic aggregate has the potential to mitigate the 78
aforementioned problems and reduce the rapid consumption of non-renewable materials such 79
as natural aggregate. Additionally, it could overcome the drawbacks associated with existing 80
5
lightweight concrete made from either natural or manufactured lightweight aggregates. For 81
example, concrete containing natural lightweight aggregate (i.e. pumice or scoria) has high 82
mining and hauling costs, excessive drying shrinkage and high water absorption. In the same 83
context, incorporating a manufactured aggregate, such as Lytag, in concrete can adversely 84
affect the durability performance due to its high permeability; along with consuming high 85
levels of energy, supplementary materials and chemical additives during its manufacture [27-86
28]. 87
The main findings of the research studies [8, 10, 21-22, 24] conducted on concrete containing 88
shredded or plastic aggregate particles indicate that the concrete workability, density and 89
mechanical properties; such as compressive strength, splitting tensile strength, flexural strength 90
and modulus of elasticity; significantly decrease with the increase in plastic content. For 91
example, the density of concrete and cement mortar was reduced by 7 to 50% due to the 92
increase in the ratio of plastic particles from 20 to 100% [7, 9, 16, 18, 20, 22]. Other researchers 93
[11, 19] observed a marginal decrease in density, varying from 6 to 10%, at high replacement 94
levels (from 75 to 100%) of CA or FA with plastic. Furthermore, studies [8, 9, 11, 18, 20, 22, 95
25] reported a significant reduction, ranging from 34 to 70%, in the 28-day concrete 96
compressive strength when 20 to 100% of the conventional FA was substituted directly with 97
plastic. Similarly, replacing 30 to 80% of the conventional CA directly with plastic resulted in 98
a substantial reduction (ranging from 65 to 78%) in the 28-day concrete compressive strength 99
[14, 16-17, 26]. 100
Other studies [27-34] have showed a similar decreasing trend in the mechanical properties of 101
concrete with an increase in synthetic lightweight aggregate content; while workability 102
increased in some instances and in others it is decreased. For instance, Choi et al. [27, 28] 103
reported that the slump of concrete made with waste PET lightweight aggregate (WPLA), at a 104
75% replacement level of FA, was 46% higher compared to conventional concrete. This 105
6
increase was attributed to the spherical shape and smooth surface texture of the WPLA 106
particles. Conversely, a reduction in slump (ranging from 7 to 28%) was also observed by other 107
researchers [30, 31, 33] when lightweight CA was fully replaced with synthetic lightweight 108
aggregate (SLA). However, the plastic-based aggregates developed in these studies [27-34] 109
were of the same shape and size. Additionally, these aggregates were either a composite made 110
from plastic and fly ash, or plastic coated with either river sand or granulated blast furnace slag 111
(GBFS). Moreover, the extrusion process used for the production of these aggregates restricted 112
the scope of their practical utilization. 113
The extant literature suggests that widely available fillers (e.g. red sand and quarry fines) need 114
to be utilized for the manufacture of well graded plastic-based aggregates. Recently, Alqahtani 115
et al. [34, 35] manufactured recycled plastic aggregates (RPAs) using different types of plastic 116
and fillers by means of a novel technique (compression moulding press). Tests carried out on 117
concrete samples showed that slump, fresh density and 28-day compressive strength results 118
ranging from 40 to 220 mm, 1827 to 2055 kg/m3 and 14 to 18 MPa, respectively, were achieved 119
with the total replacement of CA in concrete. 120
The novel contribution of the present study is to implement one of the previously manufactured 121
RPAs (i.e. RP2F1A) [34, 35] as a replacement for pumice lightweight coarse aggregate (LWA). 122
The effect of various replacement levels (i.e. 25, 50, 75 and 100%), on a volumetric basis, on 123
the fresh, hardened and microstructure properties was investigated. Moreover, the influence of 124
fully replacing Lytag aggregate (LYA) with RP2F1A on the same properties was examined. 125
Furthermore, predictive models were proposed for the mechanical properties of the concrete 126
mixes containing RP2F1A. 127
7
2.0 Materials and methods 128
2.1 Materials 129
Portland cement from a local manufacturer, with a specific gravity of 3.15, was used 130
throughout this study; which satisfied the requirements of ASTM C150/C150M. Various types 131
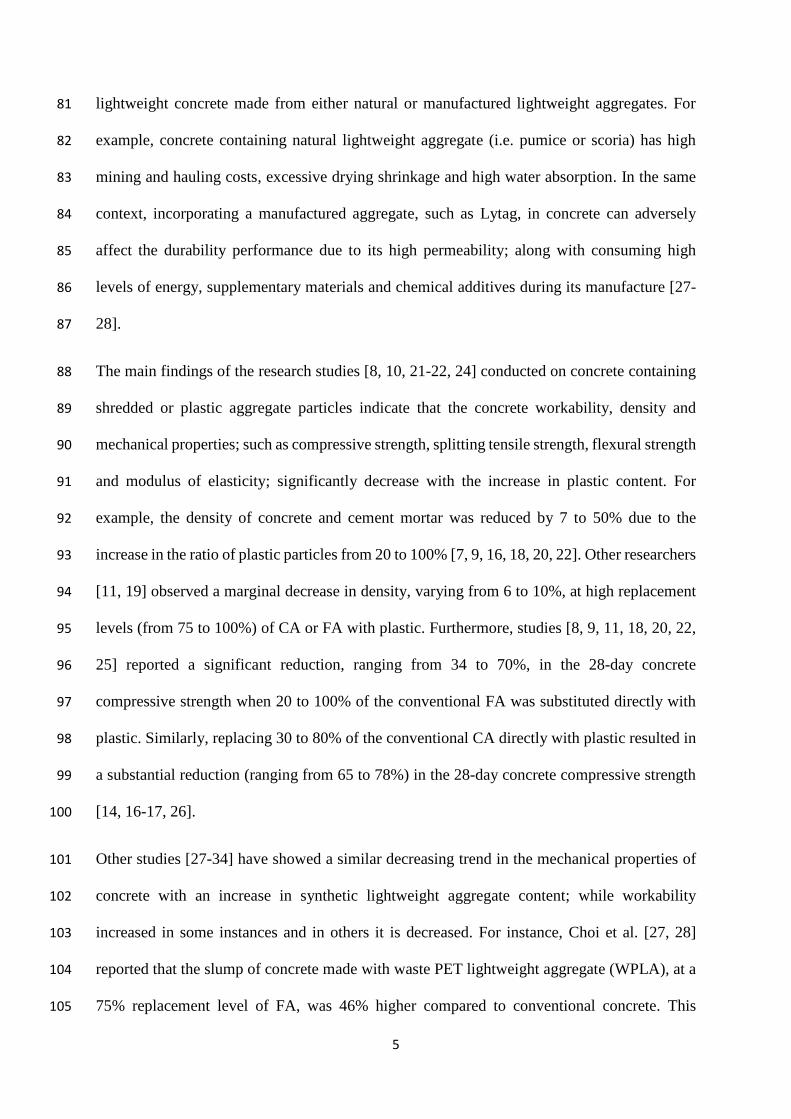
of coarse aggregates; which included RP2F1A, LWA and LYA (see Fig. 1); were used together 132
with normal-weight fine aggregate for the preparation of concrete mixes. In this study, LWA 133
was the locally available, naturally occurring pumice lightweight aggregate. The LYA, a 134
commercially available lightweight aggregate, was supplied by Lytag Limited (manufacturer 135
of LYA in the UK). The RP2F1A, which is the key material in this study, was manufactured 136
by the authors by mixing recycled plastic (LLDPE) and red dune sand filler at proportions of 137
30 and 70%, respectively, to form a homogeneous mix [34, 35]. This was followed by 138
compressing and heating the mix using a compression moulding press technique to turn it into 139
solid sheets or slabs, which were then cooled and finally crushed to form the aggregate. The 140
LWA and LYA were used for the preparation of the control mixes; whereas the RP2F1A was 141
used for investigating the effect of replacement level on concrete performance. 142
RP2F1A
LWA
LYA
Figure 1: Various types of coarse aggregate used in this study (RP2F1A, LWA and LYA) 143
The particle shape and surface texture of RP2F1A, LWA and LYA were qualitatively 144
examined using an optical microscope. The RP2F1A, LWA and LYA had sub-angular, angular 145
8
and rounded particle shapes, respectively; while their textures were partially rough (fibrous), 146
porous and smooth, respectively. 147
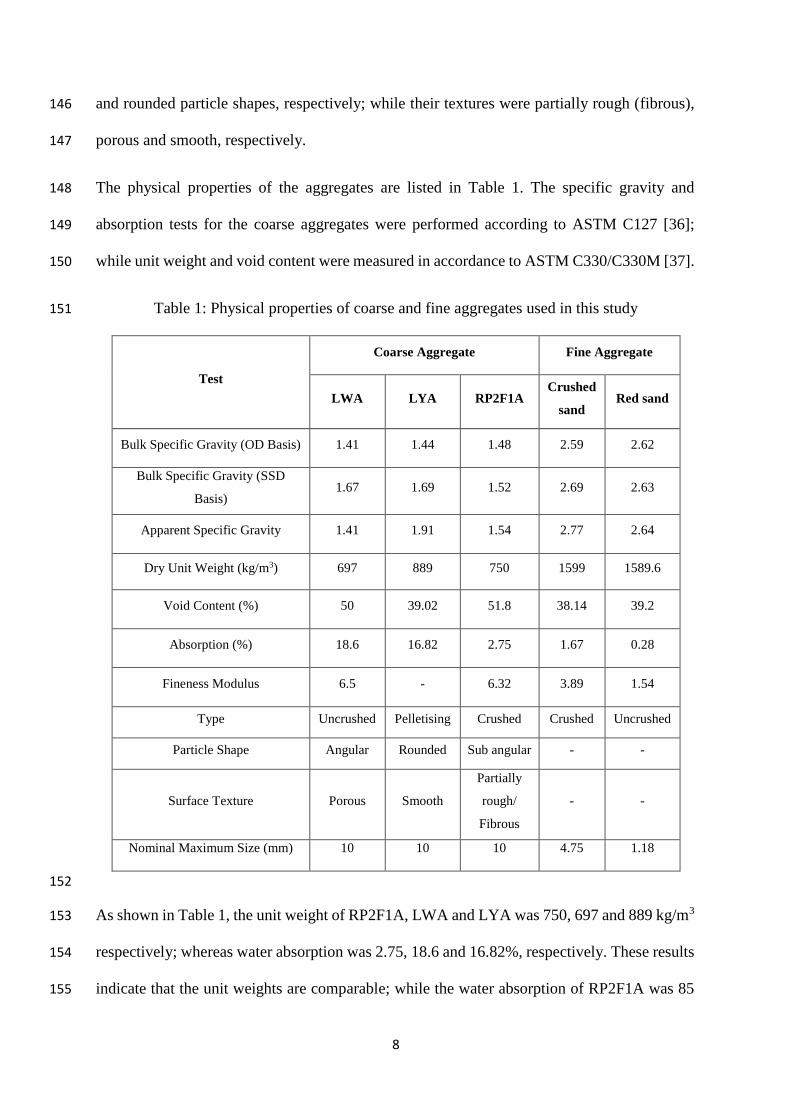
The physical properties of the aggregates are listed in Table 1. The specific gravity and 148
absorption tests for the coarse aggregates were performed according to ASTM C127 [36]; 149
while unit weight and void content were measured in accordance to ASTM C330/C330M [37]. 150
Table 1: Physical properties of coarse and fine aggregates used in this study 151
Test
Coarse Aggregate Fine Aggregate
LWA LYA RP2F1A Crushed
sand Red sand
Bulk Specific Gravity (OD Basis) 1.41 1.44 1.48 2.59 2.62
Bulk Specific Gravity (SSD
Basis) 1.67 1.69 1.52 2.69 2.63
Apparent Specific Gravity 1.41 1.91 1.54 2.77 2.64
Dry Unit Weight (kg/m3) 697 889 750 1599 1589.6
Void Content (%) 50 39.02 51.8 38.14 39.2
Absorption (%) 18.6 16.82 2.75 1.67 0.28
Fineness Modulus 6.5 - 6.32 3.89 1.54
Type Uncrushed Pelletising Crushed Crushed Uncrushed
Particle Shape Angular Rounded Sub angular - -
Surface Texture Porous Smooth
Partially
rough/
Fibrous
- -
Nominal Maximum Size (mm) 10 10 10 4.75 1.18
152
As shown in Table 1, the unit weight of RP2F1A, LWA and LYA was 750, 697 and 889 kg/m3 153
respectively; whereas water absorption was 2.75, 18.6 and 16.82%, respectively. These results 154
indicate that the unit weights are comparable; while the water absorption of RP2F1A was 85 155
9
and 84% lesser compared to those of LWA and LYA, respectively. In the case of the normal-156
weight fine aggregate, the unit weight, specific gravity and water absorption were measured 157
based on ASTM C29/C29M [38] and ASTM C128 [39]. The test results are also presented in 158
Table 1. 159
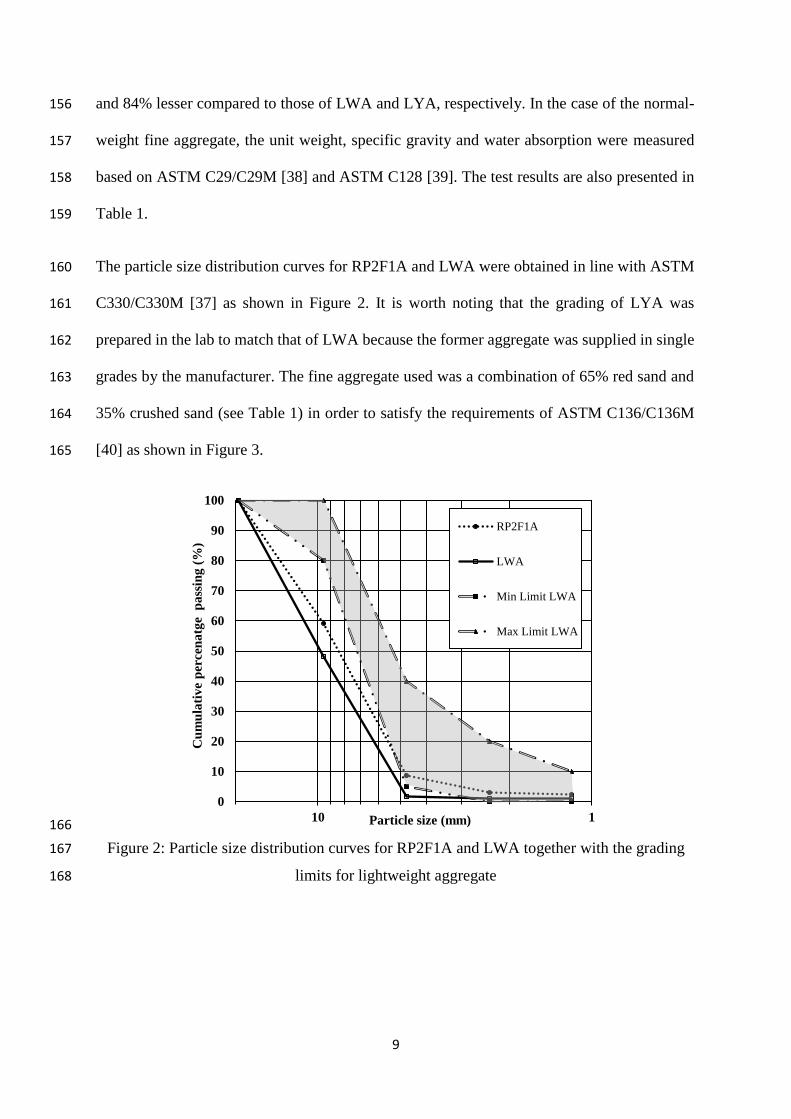
The particle size distribution curves for RP2F1A and LWA were obtained in line with ASTM 160
C330/C330M [37] as shown in Figure 2. It is worth noting that the grading of LYA was 161
prepared in the lab to match that of LWA because the former aggregate was supplied in single 162
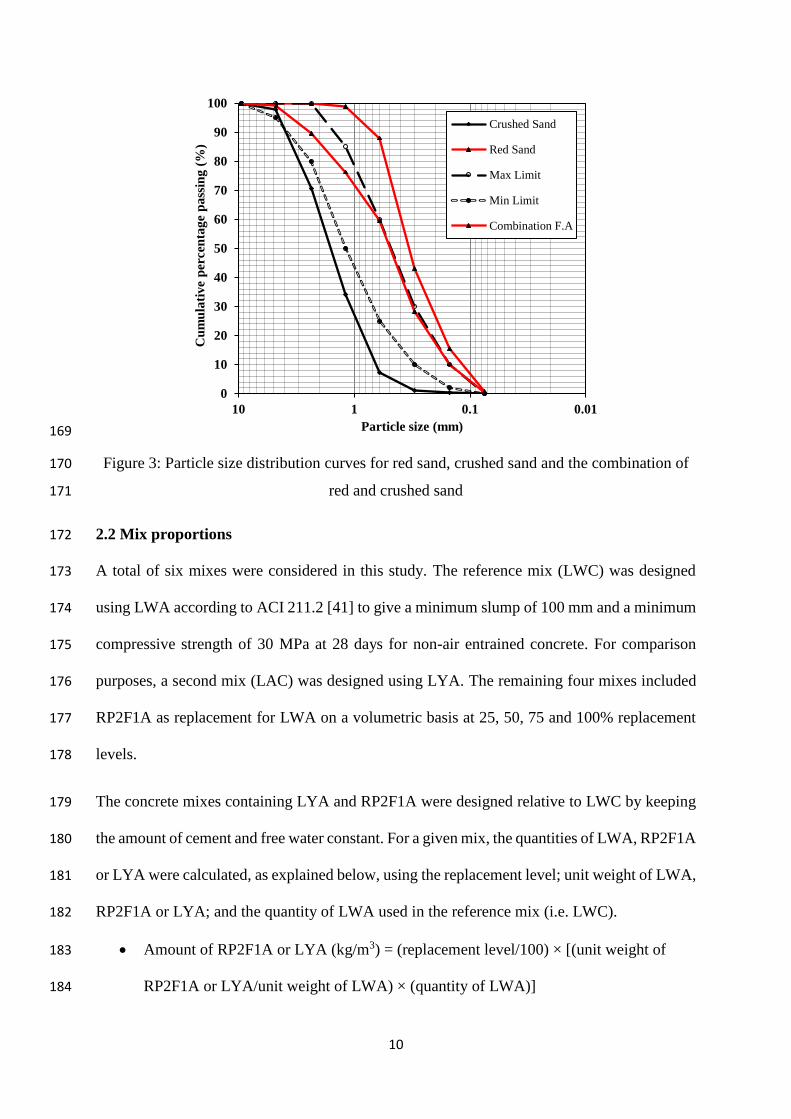
grades by the manufacturer. The fine aggregate used was a combination of 65% red sand and 163
35% crushed sand (see Table 1) in order to satisfy the requirements of ASTM C136/C136M 164
[40] as shown in Figure 3. 165
166
Figure 2: Particle size distribution curves for RP2F1A and LWA together with the grading 167
limits for lightweight aggregate 168
0
10
20
30
40
50
60
70
80
90
100
110
Cu
mu
lati
ve
per
cen
atg
e p
ass
ing
(%
)
Particle size (mm)
RP2F1A
LWA
Min Limit LWA
Max Limit LWA
10
169
Figure 3: Particle size distribution curves for red sand, crushed sand and the combination of 170
red and crushed sand 171
2.2 Mix proportions 172
A total of six mixes were considered in this study. The reference mix (LWC) was designed 173
using LWA according to ACI 211.2 [41] to give a minimum slump of 100 mm and a minimum 174
compressive strength of 30 MPa at 28 days for non-air entrained concrete. For comparison 175
purposes, a second mix (LAC) was designed using LYA. The remaining four mixes included 176
RP2F1A as replacement for LWA on a volumetric basis at 25, 50, 75 and 100% replacement 177
levels. 178
The concrete mixes containing LYA and RP2F1A were designed relative to LWC by keeping 179
the amount of cement and free water constant. For a given mix, the quantities of LWA, RP2F1A 180
or LYA were calculated, as explained below, using the replacement level; unit weight of LWA, 181
RP2F1A or LYA; and the quantity of LWA used in the reference mix (i.e. LWC). 182
Amount of RP2F1A or LYA (kg/m3) = (replacement level/100) × [(unit weight of 183
RP2F1A or LYA/unit weight of LWA) × (quantity of LWA)] 184
0
10
20
30
40
50
60
70
80
90
100
0.010.1110
Cu
mu
lati
ve
per
cen
tag
ep
ass
ing
(%
)
Particle size (mm)
Crushed Sand
Red Sand
Max Limit
Min Limit
Combination F.A
11
Amount of LWA (kg/m3) = [1- (replacement level/100)] × (quantity of LWA) 185
The volume (and subsequently weight) of the normal-weight fine aggregate was calculated by 186
subtracting the total volume of the aforementioned ingredients from 1 m3. Finally, the total 187
water amount was adjusted according to the absorption and moisture content of the aggregates. 188
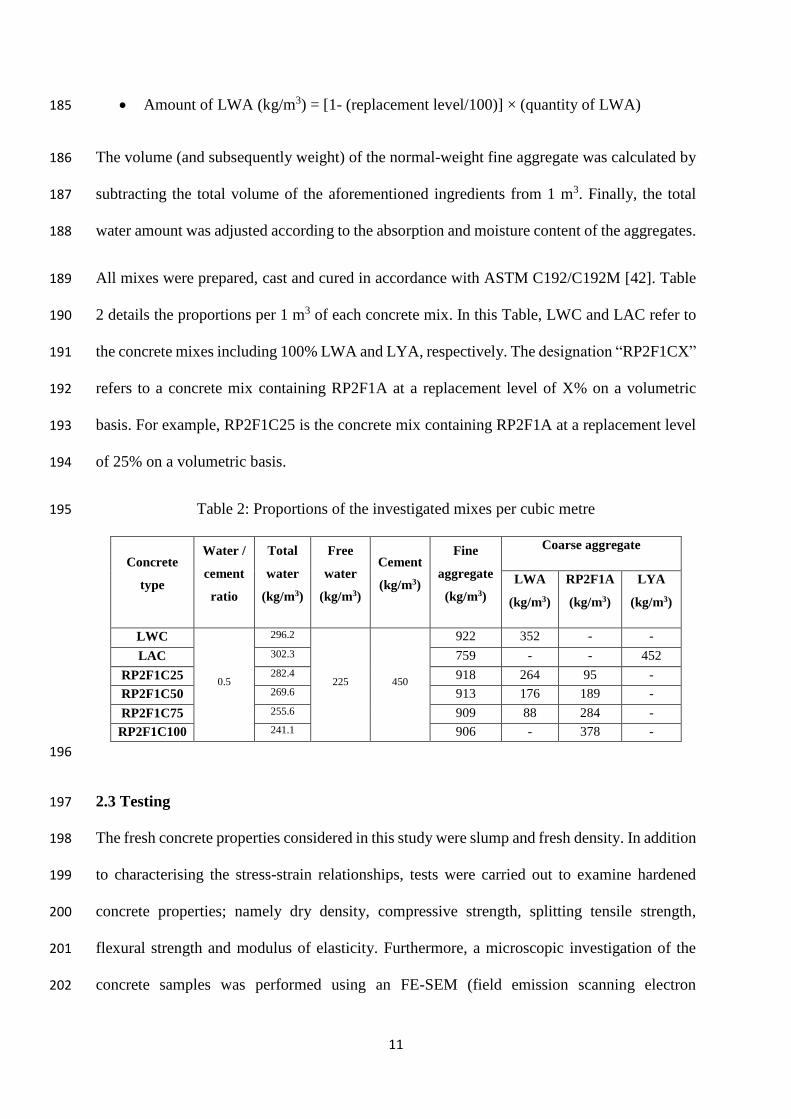
All mixes were prepared, cast and cured in accordance with ASTM C192/C192M [42]. Table 189
2 details the proportions per 1 m3 of each concrete mix. In this Table, LWC and LAC refer to 190
the concrete mixes including 100% LWA and LYA, respectively. The designation “RP2F1CX” 191
refers to a concrete mix containing RP2F1A at a replacement level of X% on a volumetric 192
basis. For example, RP2F1C25 is the concrete mix containing RP2F1A at a replacement level 193
of 25% on a volumetric basis. 194
Table 2: Proportions of the investigated mixes per cubic metre 195
Concrete
type
Water /
cement
ratio
Total
water
(kg/m3)
Free
water
(kg/m3)
Cement
(kg/m3)
Fine
aggregate
(kg/m3)
Coarse aggregate
LWA
(kg/m3)
RP2F1A
(kg/m3)
LYA
(kg/m3)
LWC
0.5
296.2
225 450
922 352 - -
LAC 302.3 759 - - 452
RP2F1C25 282.4 918 264 95 -
RP2F1C50 269.6 913 176 189 -
RP2F1C75 255.6 909 88 284 -
RP2F1C100 241.1 906 - 378 -
196
2.3 Testing 197
The fresh concrete properties considered in this study were slump and fresh density. In addition 198
to characterising the stress-strain relationships, tests were carried out to examine hardened 199
concrete properties; namely dry density, compressive strength, splitting tensile strength, 200
flexural strength and modulus of elasticity. Furthermore, a microscopic investigation of the 201
concrete samples was performed using an FE-SEM (field emission scanning electron 202
12
microscope), Versa 3D, and an optical microscope to explore the microstructure and interfaces 203
between aggregate and cement mortar. 204
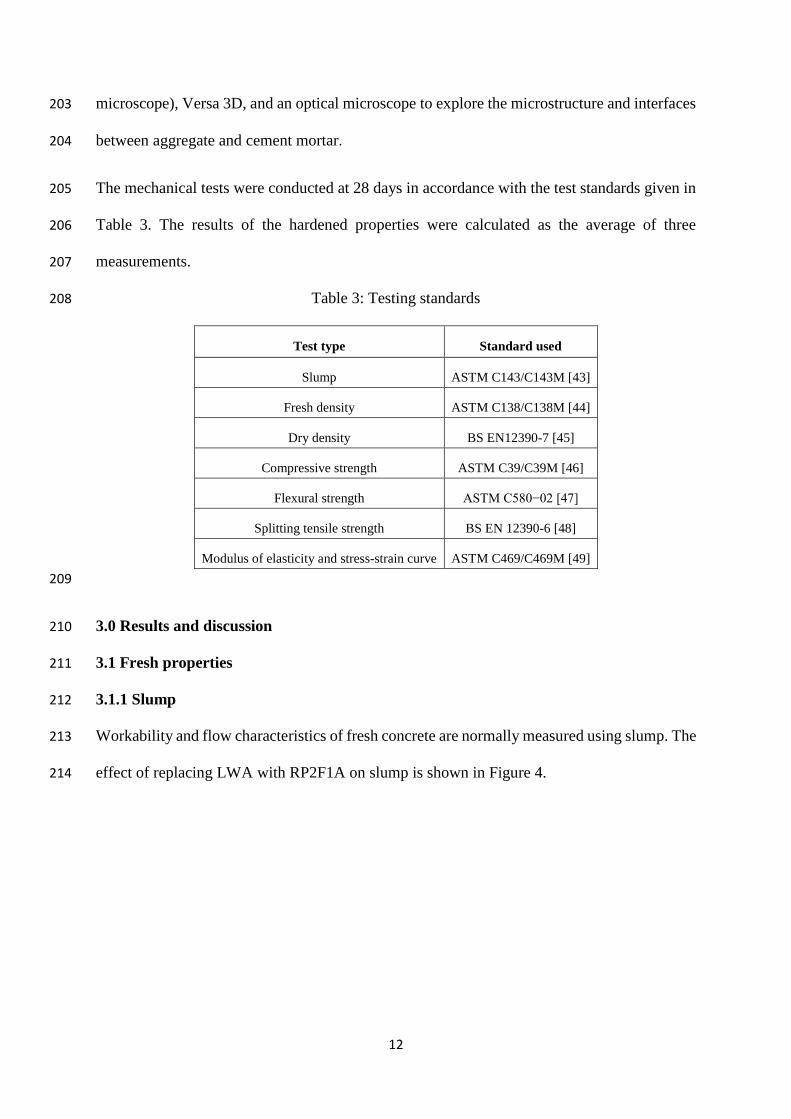
The mechanical tests were conducted at 28 days in accordance with the test standards given in 205
Table 3. The results of the hardened properties were calculated as the average of three 206
measurements. 207
Table 3: Testing standards 208
Test type Standard used
Slump ASTM C143/C143M [43]
Fresh density ASTM C138/C138M [44]
Dry density BS EN12390-7 [45]
Compressive strength ASTM C39/C39M [46]
Flexural strength ASTM C580−02 [47]
Splitting tensile strength BS EN 12390-6 [48]
Modulus of elasticity and stress-strain curve ASTM C469/C469M [49]
209
3.0 Results and discussion 210
3.1 Fresh properties 211
3.1.1 Slump 212
Workability and flow characteristics of fresh concrete are normally measured using slump. The 213
effect of replacing LWA with RP2F1A on slump is shown in Figure 4. 214
13
215
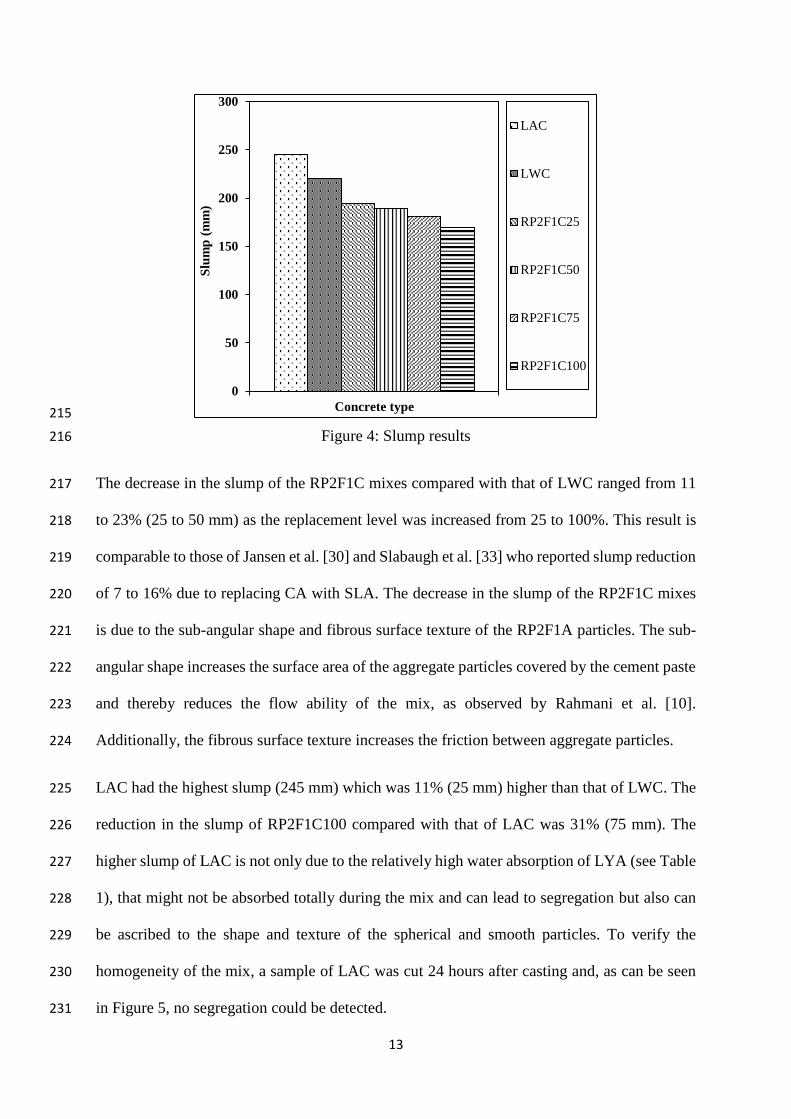
Figure 4: Slump results 216
The decrease in the slump of the RP2F1C mixes compared with that of LWC ranged from 11 217
to 23% (25 to 50 mm) as the replacement level was increased from 25 to 100%. This result is 218
comparable to those of Jansen et al. [30] and Slabaugh et al. [33] who reported slump reduction 219
of 7 to 16% due to replacing CA with SLA. The decrease in the slump of the RP2F1C mixes 220
is due to the sub-angular shape and fibrous surface texture of the RP2F1A particles. The sub-221
angular shape increases the surface area of the aggregate particles covered by the cement paste 222
and thereby reduces the flow ability of the mix, as observed by Rahmani et al. [10]. 223
Additionally, the fibrous surface texture increases the friction between aggregate particles. 224
LAC had the highest slump (245 mm) which was 11% (25 mm) higher than that of LWC. The 225
reduction in the slump of RP2F1C100 compared with that of LAC was 31% (75 mm). The 226
higher slump of LAC is not only due to the relatively high water absorption of LYA (see Table 227
1), that might not be absorbed totally during the mix and can lead to segregation but also can 228
be ascribed to the shape and texture of the spherical and smooth particles. To verify the 229
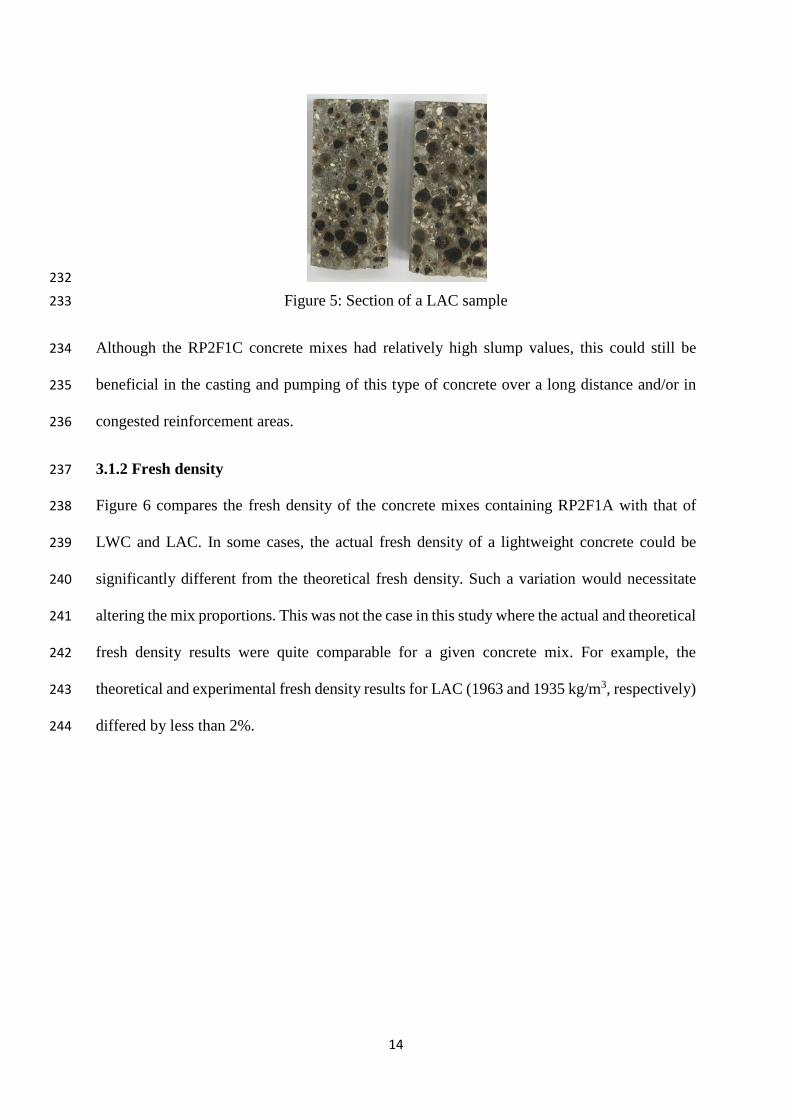
homogeneity of the mix, a sample of LAC was cut 24 hours after casting and, as can be seen 230
in Figure 5, no segregation could be detected. 231
0
50
100
150
200
250
300
Concrete type
Slu
mp
(m
m)
LAC
LWC
RP2F1C25
RP2F1C50
RP2F1C75
RP2F1C100
14
232
Figure 5: Section of a LAC sample 233
Although the RP2F1C concrete mixes had relatively high slump values, this could still be 234
beneficial in the casting and pumping of this type of concrete over a long distance and/or in 235
congested reinforcement areas. 236
3.1.2 Fresh density 237
Figure 6 compares the fresh density of the concrete mixes containing RP2F1A with that of 238
LWC and LAC. In some cases, the actual fresh density of a lightweight concrete could be 239
significantly different from the theoretical fresh density. Such a variation would necessitate 240
altering the mix proportions. This was not the case in this study where the actual and theoretical 241
fresh density results were quite comparable for a given concrete mix. For example, the 242
theoretical and experimental fresh density results for LAC (1963 and 1935 kg/m3, respectively) 243
differed by less than 2%. 244
15
245
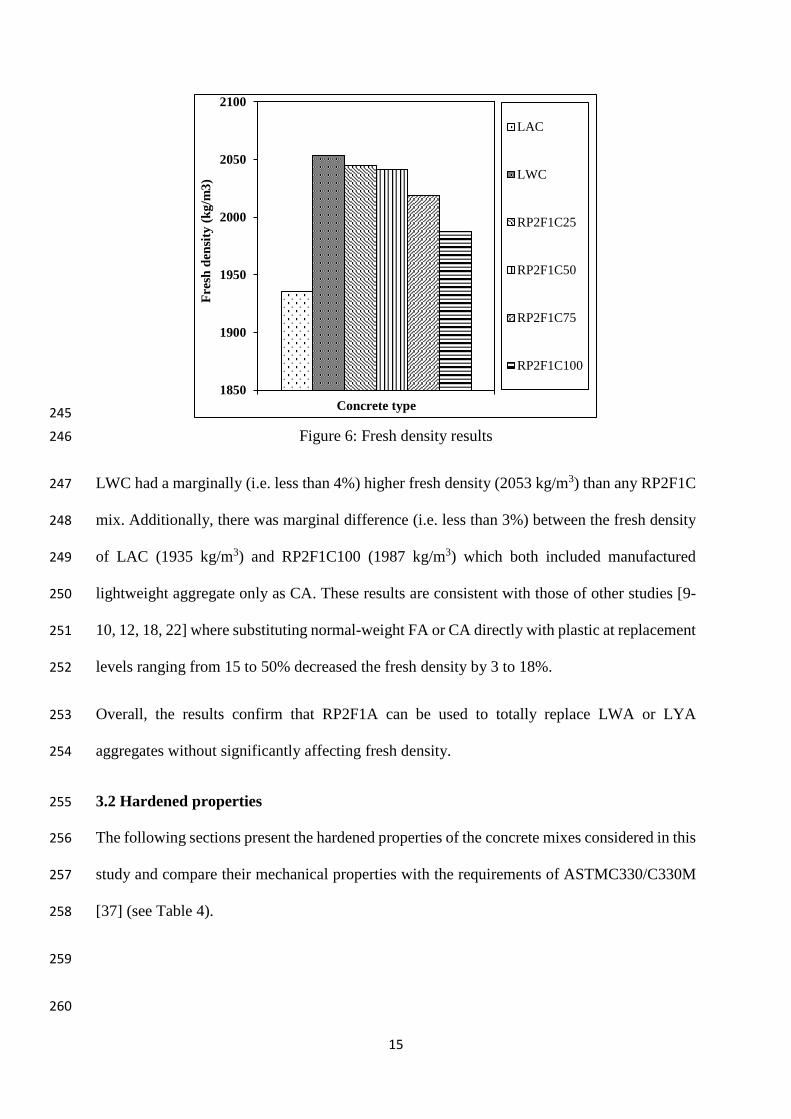
Figure 6: Fresh density results 246
LWC had a marginally (i.e. less than 4%) higher fresh density (2053 kg/m3) than any RP2F1C 247
mix. Additionally, there was marginal difference (i.e. less than 3%) between the fresh density 248
of LAC (1935 kg/m3) and RP2F1C100 (1987 kg/m3) which both included manufactured 249
lightweight aggregate only as CA. These results are consistent with those of other studies [9-250
10, 12, 18, 22] where substituting normal-weight FA or CA directly with plastic at replacement 251
levels ranging from 15 to 50% decreased the fresh density by 3 to 18%. 252
Overall, the results confirm that RP2F1A can be used to totally replace LWA or LYA 253
aggregates without significantly affecting fresh density. 254
3.2 Hardened properties 255
The following sections present the hardened properties of the concrete mixes considered in this 256
study and compare their mechanical properties with the requirements of ASTMC330/C330M 257
[37] (see Table 4). 258
259
260
1850
1900
1950
2000
2050
2100
Concrete type
Fre
sh d
ensi
ty (
kg
/m3
)
LAC
LWC
RP2F1C25
RP2F1C50
RP2F1C75
RP2F1C100
16
Table 4: Lightweight concrete properties according to ASTM C330/C330M [37] 261
Average 28-day density, max
(kg/m3)
Average 28-day splitting tensile
strength, min (MPa)
Average 28-day compressive
strength, min (MPa)
1840 2.3 28
1760 2.1 21
1680 2.1 17
262
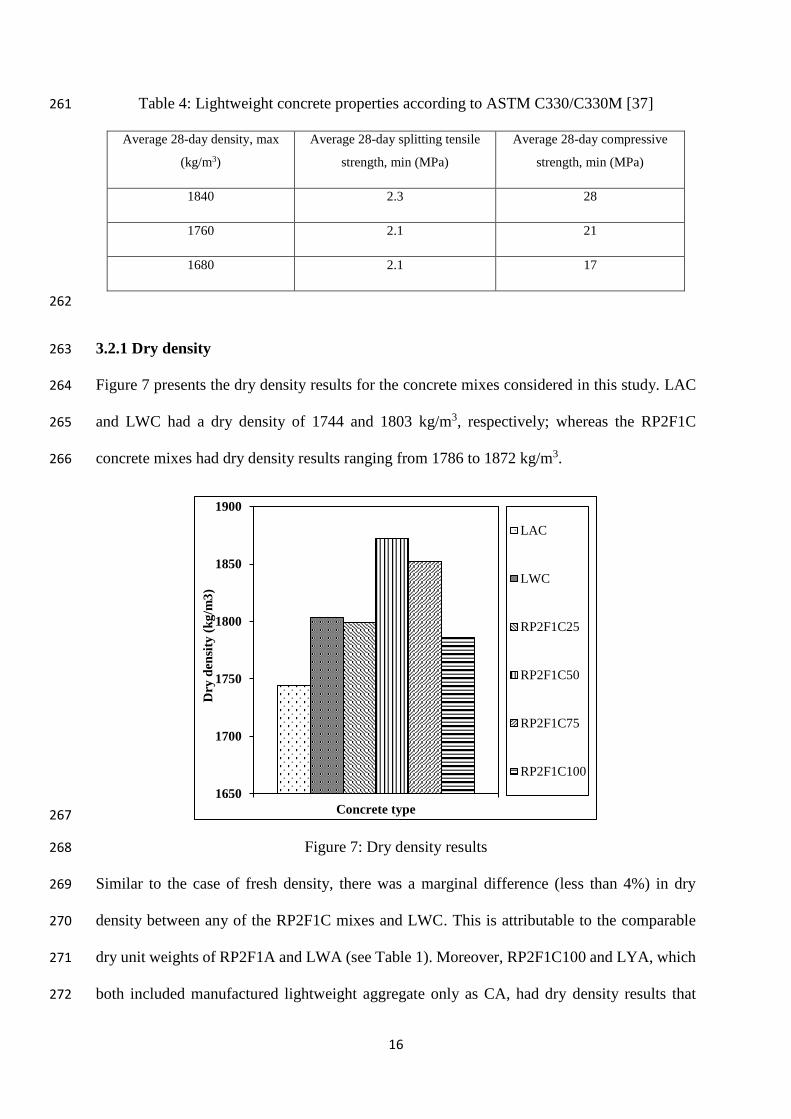
3.2.1 Dry density 263
Figure 7 presents the dry density results for the concrete mixes considered in this study. LAC 264
and LWC had a dry density of 1744 and 1803 kg/m3, respectively; whereas the RP2F1C 265
concrete mixes had dry density results ranging from 1786 to 1872 kg/m3. 266
267
Figure 7: Dry density results 268
Similar to the case of fresh density, there was a marginal difference (less than 4%) in dry 269
density between any of the RP2F1C mixes and LWC. This is attributable to the comparable 270
dry unit weights of RP2F1A and LWA (see Table 1). Moreover, RP2F1C100 and LYA, which 271
both included manufactured lightweight aggregate only as CA, had dry density results that 272
1650
1700
1750
1800
1850
1900
Concrete type
Dry
den
sity
(k
g/m
3)
LAC
LWC
RP2F1C25
RP2F1C50
RP2F1C75
RP2F1C100
17
differed by less than 3%. These findings are in good agreement with studies [11, 19] where 273
high replacement levels (i.e. 75 to 100%) of normal-weight CA or FA with plastic resulted in 274
a marginal decrease (i.e. 6 to 10%) in dry density. On the other hand, the RP2F1C concrete 275
mixes were less sensitive to the reduction in dry density (i.e. 15 to 23%) reported elsewhere 276
[27, 30, 33] due to replacing normal-weight CA or FA with SLA or WPLA at levels varying 277
from 75 to 100%. 278
The dry density results of the PR2F1C concrete mixes were either within or slightly (i.e. less 279
than 2%) higher than the uppermost limit (1840 kg/m3) given by ASTMC330/C330M [37] (see 280
Table 4). This suggests that the produced lightweight concrete mixes, with up to 100% 281
replacement level, could be useful in applications where low density is required. This result is 282
important as the use of lightweight concrete can help reduce element size and consequently 283
reduce the cost of materials, handling and transporting, and ultimately the overall cost. 284
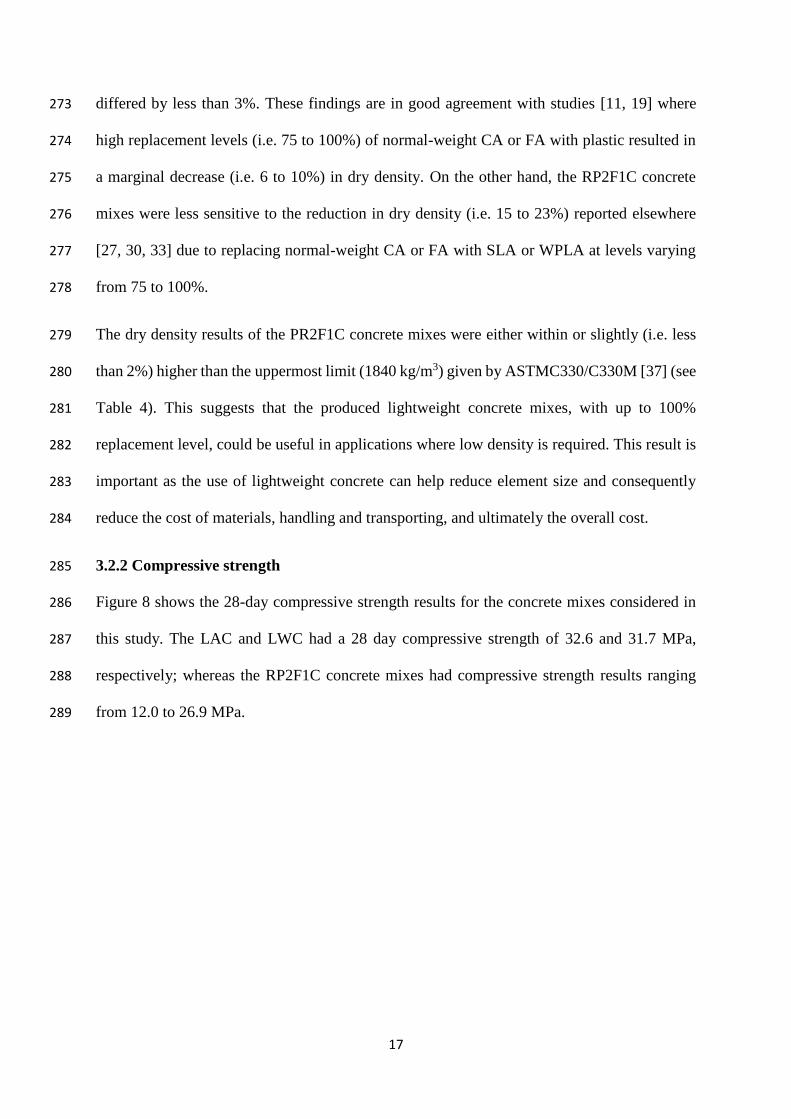
3.2.2 Compressive strength 285
Figure 8 shows the 28-day compressive strength results for the concrete mixes considered in 286
this study. The LAC and LWC had a 28 day compressive strength of 32.6 and 31.7 MPa, 287
respectively; whereas the RP2F1C concrete mixes had compressive strength results ranging 288
from 12.0 to 26.9 MPa. 289
18
290
Figure 8: 28 day compressive strength results 291
The decrease in the compressive strength of the RP2F1C mixes compared with that of LWC 292
ranged from 15 to 62% (4.8 to 19.7 MPa) as the replacement level was increased from 25 to 293
100%. Similarly, RP2F1C100 had a 28 day compressive strength that was 63% (20.6 MPa) 294
less than that of LAC. These results are in agreement with those reductions (ranging from 32 295
to 81%) reported in the literature [27, 29-31, 33] where 75 to 100% of normal-weight CA or 296
FA was replaced with plastic-based aggregates (i.e. SLA or WPLA). 297
The reduction in the compressive strength of the RP2F1C mixes is related to the weak 298
resistance of the interfacial transition zone (ITZ) between the RP2F1A and the cement paste 299
matrix. This weak resistance results from the weak bonding between RP2F1A and the cement 300
matrix as further explained in Section 3.2.7. The deterioration in the compressive strength can 301
also be related to the hydrophobic nature of the plastic existing in the RP2F1A matrix, which 302
prevents good bonding and generates a wall effect as explained in Section 3.2.7. This 303
observation is consistent with those reported elsewhere [18, 22]. 304
0
5
10
15
20
25
30
35
Concrete type
Co
mp
ress
ive
stre
ng
th (
MP
a)
LAC
LWC
RP2F1C25
RP2F1C50
RP2F1C75
RP2F1C100
19
The RP2F1C mixes with 25, 50 and 75% replacement levels had compressive strength results 305
higher than 17 MPa as required by ASTMC330/C330M [37]. However, of these mixes, only 306
RP2F1C25 meets both the density and the compressive strength requirements listed in Table 307
4. Thus, the results suggest that RP2F1C25 could potentially be used in structural applications 308
where low density and moderate strength are required. 309
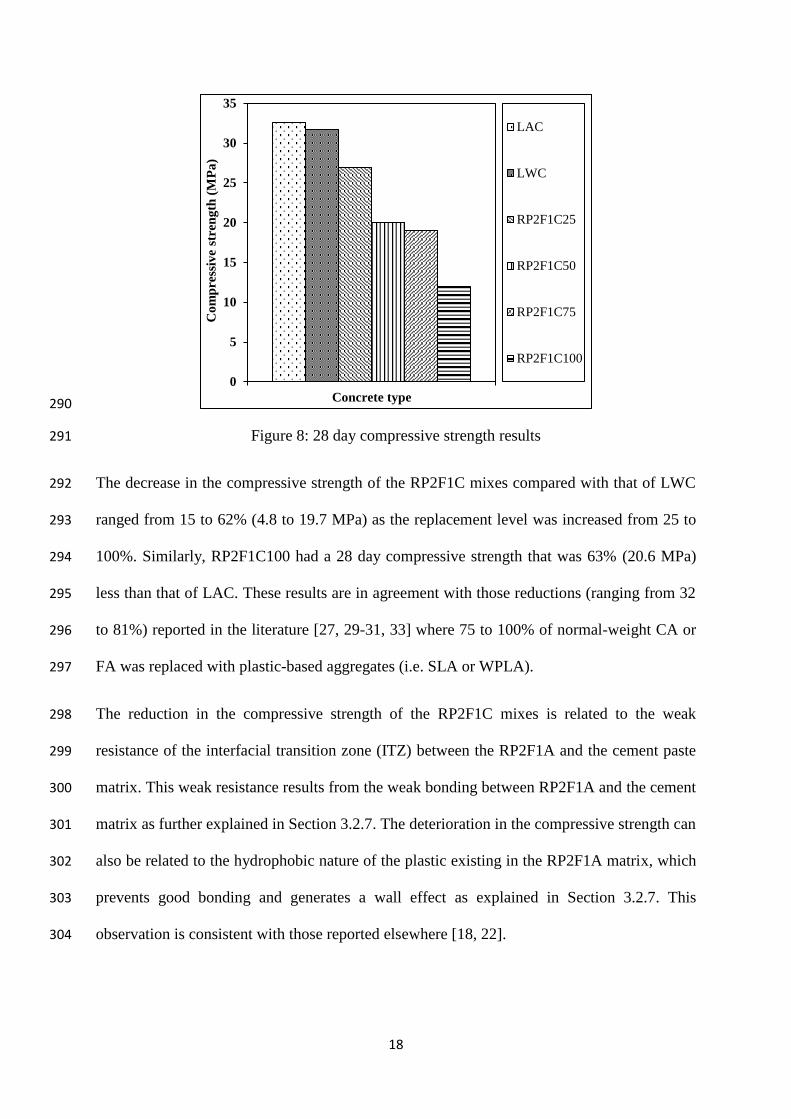
3.2.3 Flexural strength 310
Figure 9 shows the flexural strength results for the concrete mixes considered in this study. 311
LAC and LWC had a flexural strength of 4.8 and 6.2 MPa, respectively; whereas the RP2F1C 312
concrete mixes had flexural strength results ranging from 3.5 to 4.5 MPa. 313
314
Figure 9: Flexural strength results 315
The reduction in the flexural strength of the RP2F1C mixes compared with that of LWC ranged 316
from 27 to 44% (1.7 to 2.7 MPa) as the replacement level was increased from 25 to 100%. 317
Additionally, RP2F1C100 had a flexural strength that was 27% (1.3 MPa) less than that of 318
LAC. These results are in broad agreement with the findings of Saikia and de Brito [12] and 319
0
1
2
3
4
5
6
7
Concrete type
Fle
xu
ral
stre
ng
th (
MP
a)
LAC
LWC
RP2F1C25
RP2F1C50
RP2F1C75
RP2F1C100
20
Rai et al. [24] who observed a reduction of 40 to 50% due to the increase in plastic replacement 320
from 15 to 75%. 321
Similar to the case of compressive strength, the decrease in flexural strength may be explained 322
by the weak adhesion between the RP2F1A and the cement paste due to the hydrophobic nature 323
of plastic [22, 24]. It can also be ascribed to the reduction in the amount of rigid natural 324
aggregate that was replaced by lightweight aggregate [9]. 325
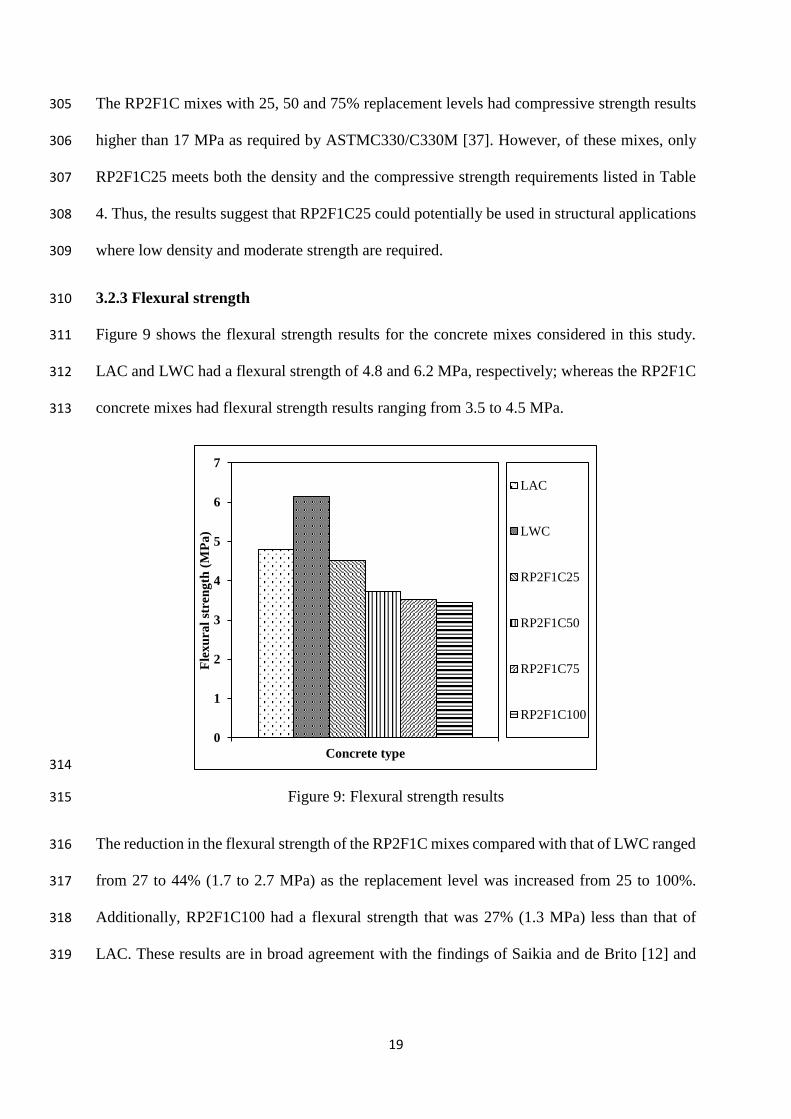
3.2.4 Splitting tensile strength 326
Figure 10 presents the splitting tensile strength results for all concrete mixes. LAC and LWC 327
had a splitting tensile strength of 2.4 and 2.6 MPa, respectively. The splitting tensile strength 328
of the RP2F1C concrete mixes ranged from 1.8 to 2.3 MPa. 329
330
Figure 10: Splitting tensile strength results 331
The decrease in the splitting tensile strength of the RP2F1C mixes compared with that of LWC 332
ranged from 12 to 31% (0.3 to 0.8 MPa) as the replacement level was increased from 25 to 333
100%. Moreover, RP2F1C100 had a splitting tensile strength that was 25% (0.6 MPa) less than 334
that of LAC. These results are in line with the findings of Choi et al. [27] and Jansen et al. [30] 335
0
0.5
1
1.5
2
2.5
3
Concrete type
Sp
litt
ing
ten
sile
str
en
gth
(M
Pa
)
LAC
LWC
RP2F1C25
RP2F1C50
RP2F1C75
RP2F1C100
21
who reported splitting tensile strength reductions of 33 and 26% as a result of substituting 75 336
and 100% of normal-weight CA and FA with synthetic plastic aggregates, respectively. 337
Additionally, the percentage reduction in the splitting tensile strength of the RP2F1C concrete 338
mixes is less than that reported in the extant literature. For example, reductions of 47 and 60% 339
were reported due to replacing 50 and 80% of normal-weight CA with plastic, respectively [16, 340
17]. 341
Similar to the explanation given for the reduction in compressive and flexural strengths, the 342
splitting tensile strength of the RP2F1C concrete mixes decreases due to the weak bond 343
between the RP2F1A and the cement paste. This is supported by the SEM and optical images 344
depicted in Figures 13 and 14, respectively (see Section 3.2.7). 345
The splitting tensile strength of the RP2F1C mixes with 25 and 50% replacement levels was 346
higher than 2.1 MPa as required by ASTMC330/C330M [37]. However, similar to the case of 347
compressive strength, only RP2F1C25 meets both the density and the splitting tensile strength 348
requirements listed in Table 4. This result further confirms the potential of RP2F1C25 as a 349
sustainable lightweight structural concrete mix. 350
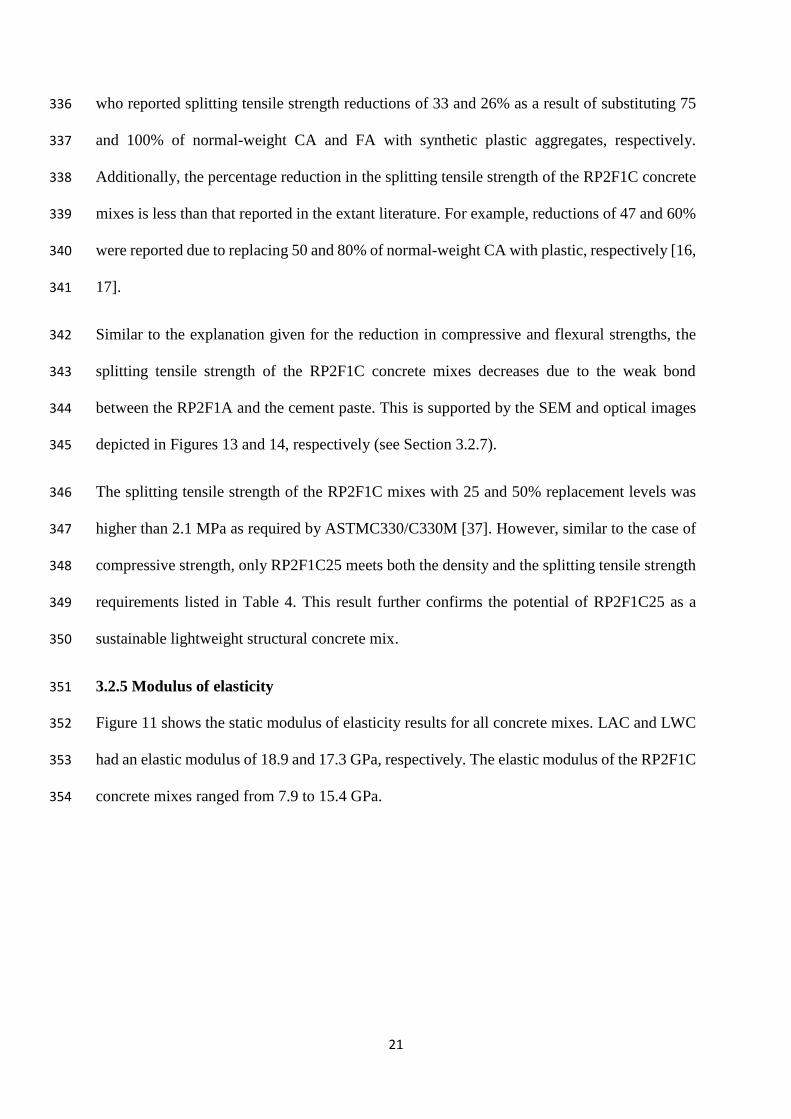
3.2.5 Modulus of elasticity 351
Figure 11 shows the static modulus of elasticity results for all concrete mixes. LAC and LWC 352
had an elastic modulus of 18.9 and 17.3 GPa, respectively. The elastic modulus of the RP2F1C 353
concrete mixes ranged from 7.9 to 15.4 GPa. 354
22
355
Figure 11: Elastic modulus results 356
The addition of RP2F1A negatively impacts the elastic modulus of concrete. The decrease in 357
the elastic modulus of the RP2F1C mixes compared with that of LWC ranged from 11 to 54% 358
(1.9 to 9.4 GPa) as the replacement level was increased from 25 to 100%. Furthermore, 359
RP2F1C100 had an elastic modulus that was 58% (11 GPa) less than that of LAC. Nonetheless, 360
the reduction in the elastic modulus of the RP2F1C concrete mixes is still lower than that 361
reported in previous studies where plastic particles were used as direct replacement for CA. 362
For example, reductions ranging from 57 to 73% were reported as a result of substituting 50 to 363
80% of normal-weight CA with plastic [13, 16, 17]. The reduction in the elastic modulus of 364
the RP2F1C concrete mixes can be explained by the relatively lower elastic modulus of 365
RP2F1A compared to that of LYA and LWA. The low elastic modulus of RP2F1A is attributed 366
to the low modulus of elasticity of the plastic present in its matrix. 367
Of the RP2F1C concrete mixes, RP2F1C25 has potential for use in structural applications. This 368
is based on the relatively small difference in elastic modulus (i.e. 11% (1.9 GPa)) between 369
LWC and RP2F1C25. 370
0
5
10
15
20
Concrete type
Mo
du
lus
of
ela
stic
ity
(G
Pa
)
LAC
LWC
RP2F1C25
RP2F1C50
RP2F1C75
RP2F1C100
23
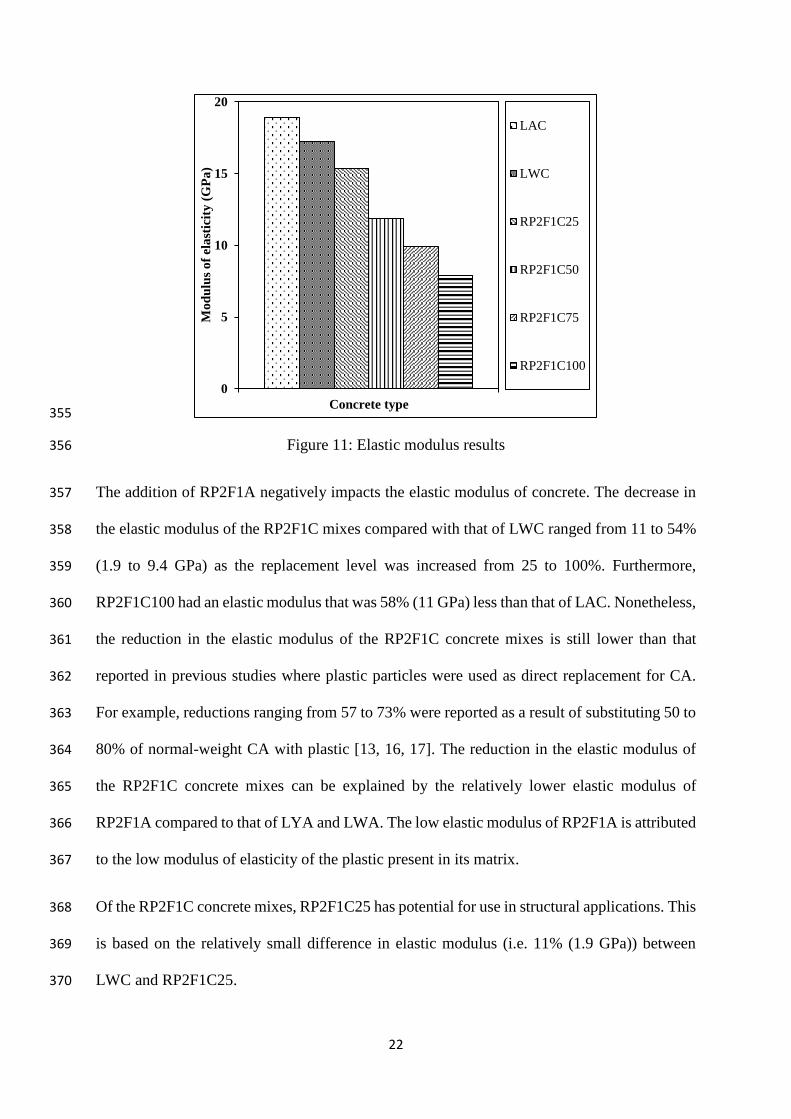
3.2.6 Stress-strain behaviour 371
Figure 12 depicts the stress-strain behaviour of the concrete mixes considered in this study. 372
373
Figure 12: Stress-strain curves 374
It can be seen that both LWC and LAC had comparable behaviour where the stress-axial strain 375
response is quasilinear up to the peak stress. The sharp drop in stress is a characteristic of brittle 376
failure. This behaviour is significantly affected by the addition of RP2F1A. For the RP2F1C 377
mixes, the peak stress decreased whereas the stress-strain response became more ductile as the 378
replacement level was increased from 25 to 100%. This finding is consistent with the results 379
of Babu et al. [15] who observed an increase in the steepness of the stress–strain response with 380
the reduction of plastic replacement in the mix. As can be seen in Figure 12, RP2F1C100 had 381
the most ductile behaviour. A similar finding was reported by Kashi et al. [29], Jansen et al. 382
0
5
10
15
20
25
30
35
-0.008 -0.006 -0.004 -0.002 0 0.002 0.004 0.006 0.008
Str
ess
(MP
a)
Stress Vs Axial Strain -
LAC
Stress Vs Lateral Strain
LAC
Stress Vs Axial Strain-
LWC
Stress Vs Lateral Strain-
LWC
Stress Vs Axial Strain-
RP2F1C25
Stress Vs Lateral Strain -
RP2F1C25
Stress Vs Axial Strain-
RP2F1C50
Stress Vs Lateral Strain-
RP2F1C50
Stress Vs Axial Strain-
RP2F1C75
Stress Vs Lateral Strain-
RP2F1C75
Stress Vs Axial Strain-
RP2F1C100
Stress Vs Lateral Strain-
RP2F1C100
Lateral strain (mm/mm) Axial strain (mm/mm)
24
[30] and Malloy et al. [31]; who all observed that concrete made with SLA kept deforming at 383
the peak load before fully disintegrating. The ductility, or reduced brittleness, of the RP2F1C 384
mixes is a unique feature not shared by conventional lightweight concrete. This feature would 385
prove useful in applications where failure occurs due to dynamic and/or repeated loads, e.g. 386
pavements. 387
3.2.7 Microscopic investigation 388
A detailed analysis of the microstructure of LAC, LWC and RP2F1C100 was performed using 389
SEM imaging and an optical microscope, as shown in Figures 13 and 14 respectively. The 390
microscopic investigation was performed on small thin sections of concrete samples. These 391
samples were taken from the un-fractured side of the flexural strength specimens using a 392
diamond cutter under running water without applying mechanical force. 393
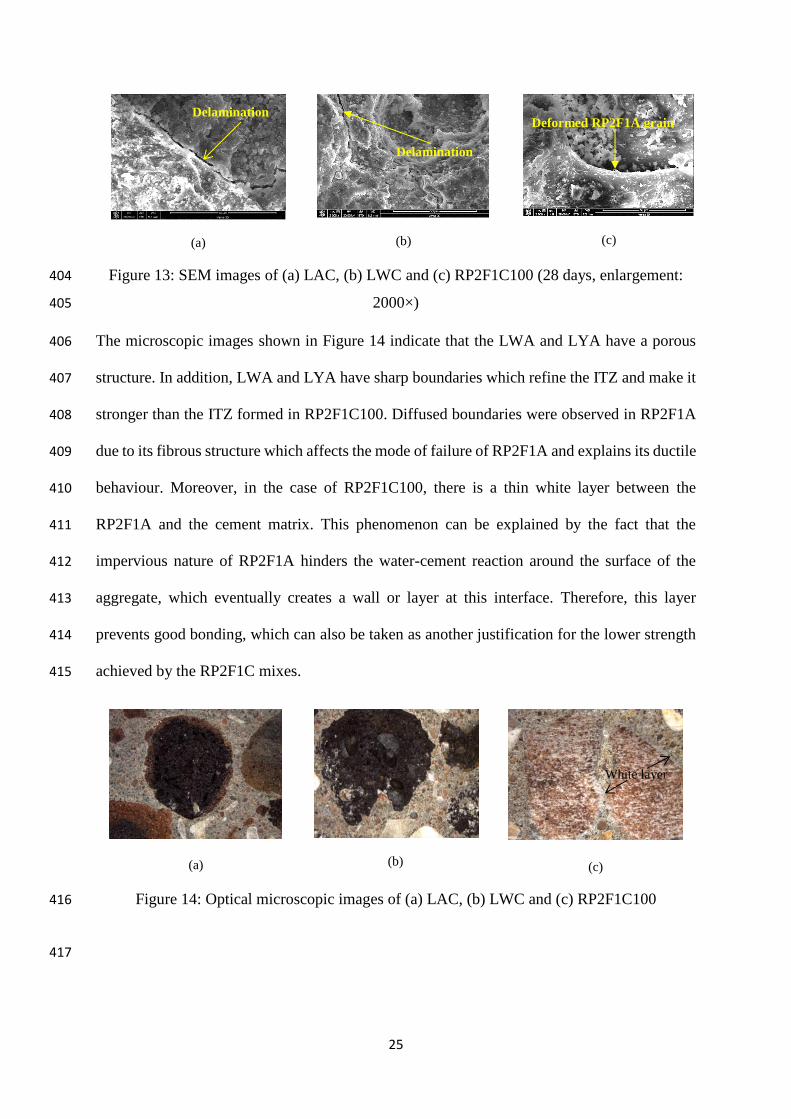
As can be seen in Figure 13, the SEM images show delamination and a major crack formation 394
in LAC and LWC due to a weak interfacial transition zone (ITZ). In the case of RP2F1C100, 395
the fibrous structure of the aggregate surface, which works as cross-linking bridges, changes 396
the mode of failure where any major crack formation disappears due to the relatively high 397
deformability of the RP2F1A particles compared with that of LYA and LWA. Therefore, 398
during load application, stress transfer from the cement matrix to the RP2F1A particles, which 399
have a low modulus of elasticity, results in the relatively higher deformation of the RP2F1A 400
particles. This ultimately leads to the collapse of the RP2F1A composite. This may explain the 401
reason behind the strength deterioration of the RP2F1C mixes compared with that of LWC and 402
LAC. 403
25
(a)
(b)
(c)
Figure 13: SEM images of (a) LAC, (b) LWC and (c) RP2F1C100 (28 days, enlargement: 404
2000×) 405
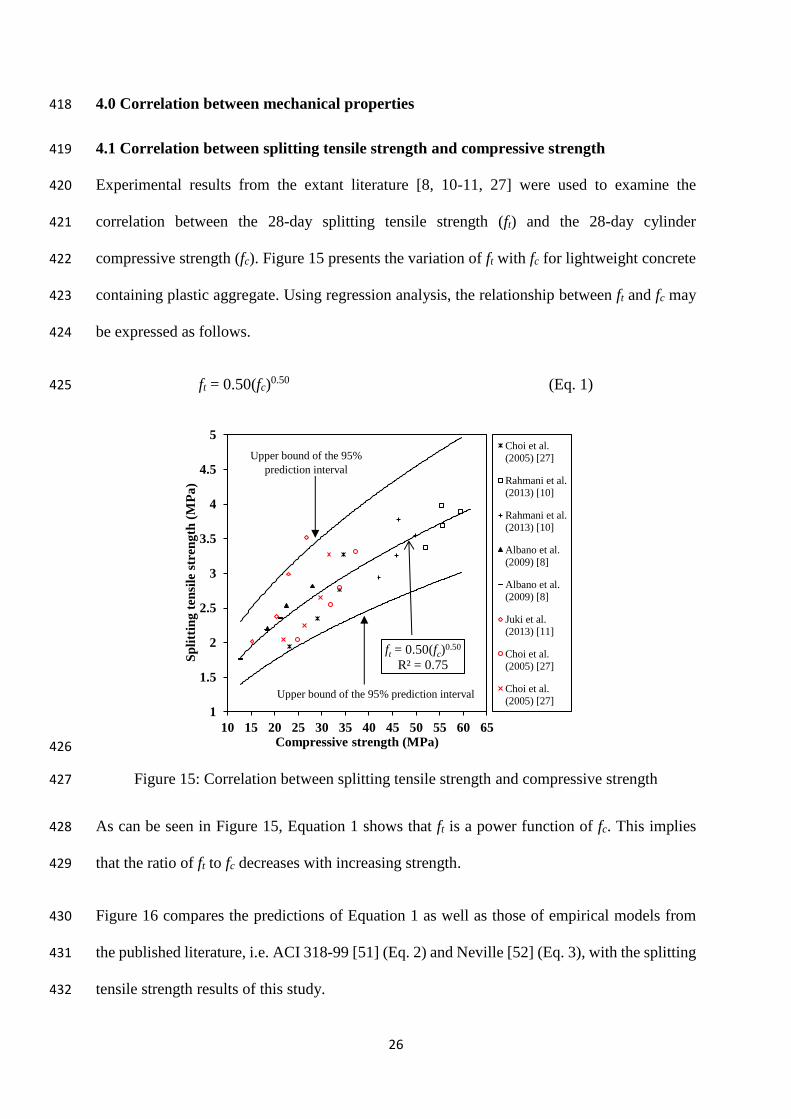
The microscopic images shown in Figure 14 indicate that the LWA and LYA have a porous 406
structure. In addition, LWA and LYA have sharp boundaries which refine the ITZ and make it 407
stronger than the ITZ formed in RP2F1C100. Diffused boundaries were observed in RP2F1A 408
due to its fibrous structure which affects the mode of failure of RP2F1A and explains its ductile 409
behaviour. Moreover, in the case of RP2F1C100, there is a thin white layer between the 410
RP2F1A and the cement matrix. This phenomenon can be explained by the fact that the 411
impervious nature of RP2F1A hinders the water-cement reaction around the surface of the 412
aggregate, which eventually creates a wall or layer at this interface. Therefore, this layer 413
prevents good bonding, which can also be taken as another justification for the lower strength 414
achieved by the RP2F1C mixes. 415
(a)
(b)
(c)
Figure 14: Optical microscopic images of (a) LAC, (b) LWC and (c) RP2F1C100 416
417
Delamination
Delamination
White layer
Deformed RP2F1A grain
zone
26
4.0 Correlation between mechanical properties 418
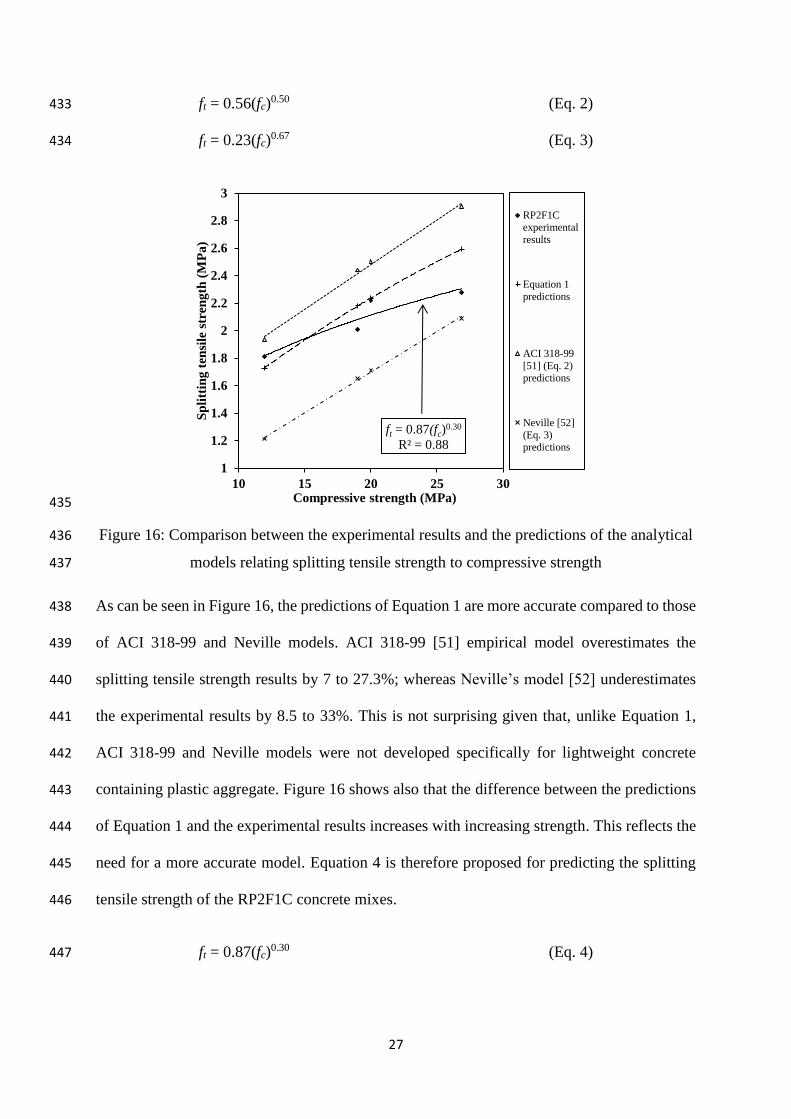
4.1 Correlation between splitting tensile strength and compressive strength 419
Experimental results from the extant literature [8, 10-11, 27] were used to examine the 420
correlation between the 28-day splitting tensile strength (ft) and the 28-day cylinder 421
compressive strength (fc). Figure 15 presents the variation of ft with fc for lightweight concrete 422
containing plastic aggregate. Using regression analysis, the relationship between ft and fc may 423
be expressed as follows. 424
ft = 0.50(fc)0.50 (Eq. 1) 425
426
Figure 15: Correlation between splitting tensile strength and compressive strength 427
As can be seen in Figure 15, Equation 1 shows that ft is a power function of fc. This implies 428
that the ratio of ft to fc decreases with increasing strength. 429
Figure 16 compares the predictions of Equation 1 as well as those of empirical models from 430
the published literature, i.e. ACI 318-99 [51] (Eq. 2) and Neville [52] (Eq. 3), with the splitting 431
tensile strength results of this study. 432
ft = 0.50(fc)0.50
R² = 0.75
1
1.5
2
2.5
3
3.5
4
4.5
5
10 15 20 25 30 35 40 45 50 55 60 65
Sp
litt
ing
ten
sile
str
en
gth
(M
Pa
)
Compressive strength (MPa)
Choi et al.
(2005) [27]
Rahmani et al.
(2013) [10]
Rahmani et al.
(2013) [10]
Albano et al.
(2009) [8]
Albano et al.
(2009) [8]
Juki et al.
(2013) [11]
Choi et al.
(2005) [27]
Choi et al.
(2005) [27]
Upper bound of the 95%
prediction interval
Upper bound of the 95% prediction interval
27
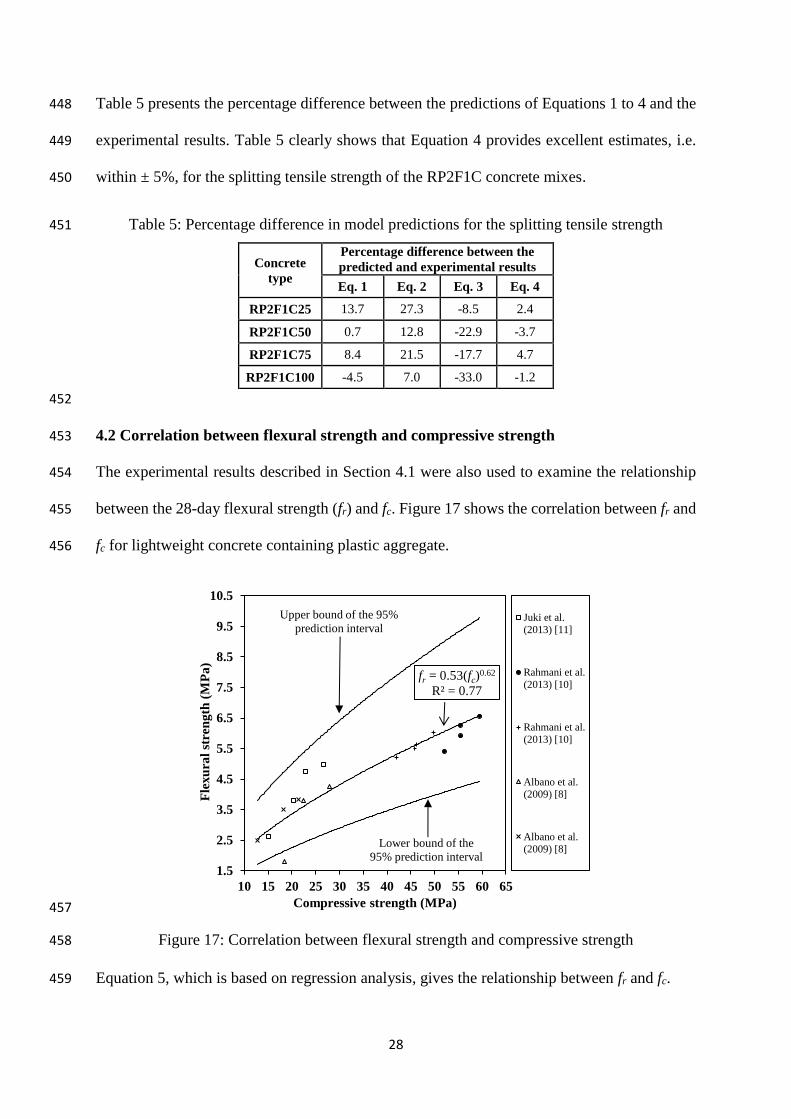
ft = 0.56(fc)0.50 (Eq. 2) 433
ft = 0.23(fc)0.67 (Eq. 3) 434
435
Figure 16: Comparison between the experimental results and the predictions of the analytical 436
models relating splitting tensile strength to compressive strength 437
As can be seen in Figure 16, the predictions of Equation 1 are more accurate compared to those 438
of ACI 318-99 and Neville models. ACI 318-99 [51] empirical model overestimates the 439
splitting tensile strength results by 7 to 27.3%; whereas Neville’s model [52] underestimates 440
the experimental results by 8.5 to 33%. This is not surprising given that, unlike Equation 1, 441
ACI 318-99 and Neville models were not developed specifically for lightweight concrete 442
containing plastic aggregate. Figure 16 shows also that the difference between the predictions 443
of Equation 1 and the experimental results increases with increasing strength. This reflects the 444
need for a more accurate model. Equation 4 is therefore proposed for predicting the splitting 445
tensile strength of the RP2F1C concrete mixes. 446
ft = 0.87(fc)0.30 (Eq. 4) 447
ft = 0.87(fc)0.30
R² = 0.88
1
1.2
1.4
1.6
1.8
2
2.2
2.4
2.6
2.8
3
10 15 20 25 30
Sp
litt
ing
ten
sile
str
en
gth
(M
Pa
)
Compressive strength (MPa)
RP2F1C
experimental
results
Equation 1
predictions
ACI 318-99
[51] (Eq. 2)
predictions
Neville [52]
(Eq. 3)
predictions
28
Table 5 presents the percentage difference between the predictions of Equations 1 to 4 and the 448
experimental results. Table 5 clearly shows that Equation 4 provides excellent estimates, i.e. 449
within ± 5%, for the splitting tensile strength of the RP2F1C concrete mixes. 450
Table 5: Percentage difference in model predictions for the splitting tensile strength 451
Concrete
type
Percentage difference between the
predicted and experimental results
Eq. 1 Eq. 2 Eq. 3 Eq. 4
RP2F1C25 13.7 27.3 -8.5 2.4
RP2F1C50 0.7 12.8 -22.9 -3.7
RP2F1C75 8.4 21.5 -17.7 4.7
RP2F1C100 -4.5 7.0 -33.0 -1.2
452
4.2 Correlation between flexural strength and compressive strength 453
The experimental results described in Section 4.1 were also used to examine the relationship 454
between the 28-day flexural strength (fr) and fc. Figure 17 shows the correlation between fr and 455
fc for lightweight concrete containing plastic aggregate. 456
457
Figure 17: Correlation between flexural strength and compressive strength 458
Equation 5, which is based on regression analysis, gives the relationship between fr and fc. 459
fr = 0.53(fc)0.62
R² = 0.77
1.5
2.5
3.5
4.5
5.5
6.5
7.5
8.5
9.5
10.5
10 15 20 25 30 35 40 45 50 55 60 65
Fle
xu
ral
stre
ng
th (
MP
a)
Compressive strength (MPa)
Juki et al.
(2013) [11]
Rahmani et al.
(2013) [10]
Rahmani et al.
(2013) [10]
Albano et al.
(2009) [8]
Albano et al.
(2009) [8]
Upper bound of the 95%
prediction interval
Lower bound of the
95% prediction interval
29
fr = 0.53(fc)0.62 (Eq. 5) 460
Equation 5 as well as the empirical models proposed by ACI 318-95 [53] (Eq. 6) and Raphael 461
[54] (Eq. 7) were used to predict the flexural strength of the RP2F1C concrete mixes. 462
fr = 0.62(fc)0.50 (Eq. 6) 463
fr = 0.44(fc)0.67 (Eq. 7) 464
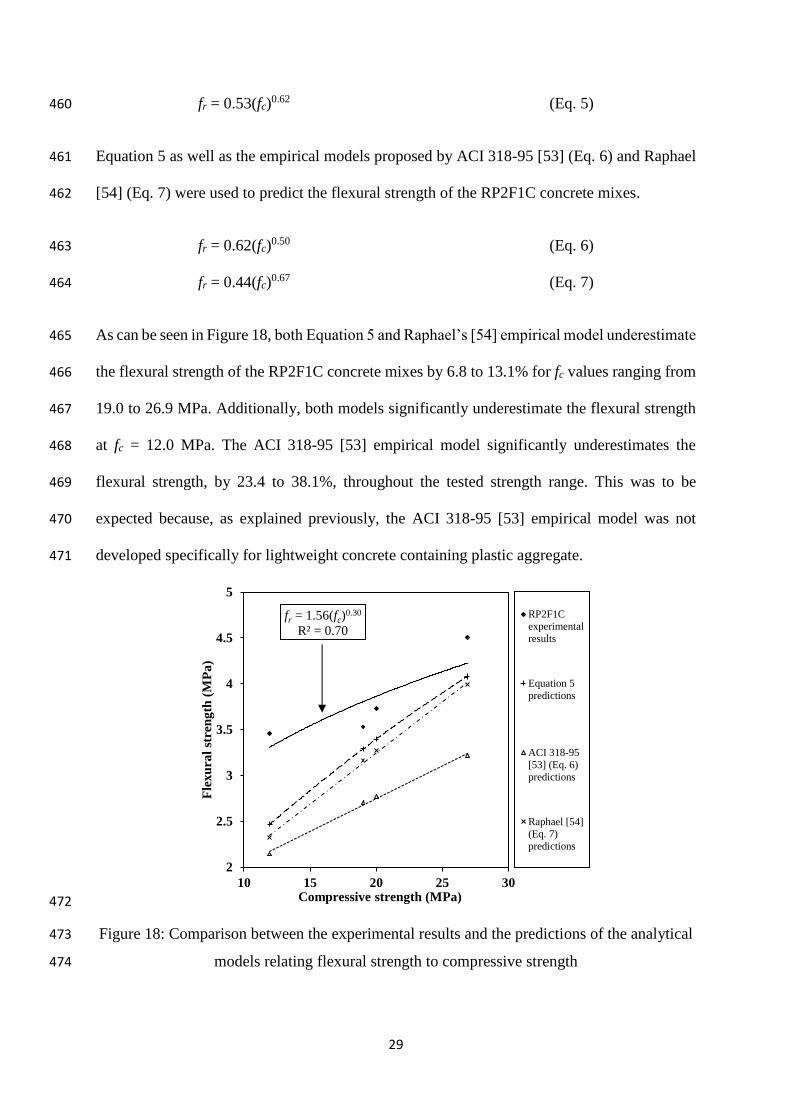
As can be seen in Figure 18, both Equation 5 and Raphael’s [54] empirical model underestimate 465
the flexural strength of the RP2F1C concrete mixes by 6.8 to 13.1% for fc values ranging from 466
19.0 to 26.9 MPa. Additionally, both models significantly underestimate the flexural strength 467
at fc = 12.0 MPa. The ACI 318-95 [53] empirical model significantly underestimates the 468
flexural strength, by 23.4 to 38.1%, throughout the tested strength range. This was to be 469
expected because, as explained previously, the ACI 318-95 [53] empirical model was not 470
developed specifically for lightweight concrete containing plastic aggregate. 471
472
Figure 18: Comparison between the experimental results and the predictions of the analytical 473
models relating flexural strength to compressive strength 474
fr = 1.56(fc)0.30
R² = 0.70
2
2.5
3
3.5
4
4.5
5
10 15 20 25 30
Fle
xu
ral
stre
ng
th (
MP
a)
Compressive strength (MPa)
RP2F1C
experimental
results
Equation 5
predictions
ACI 318-95
[53] (Eq. 6)
predictions
Raphael [54]
(Eq. 7)
predictions
30
The results shown in Figure 18 demonstrate the need for an improved model. Thus, Equation 475
8 is suggested for predicting the flexural strength of the RP2F1C concrete mixes. 476
fr = 1.56(fc)0.30 (Eq. 8) 477
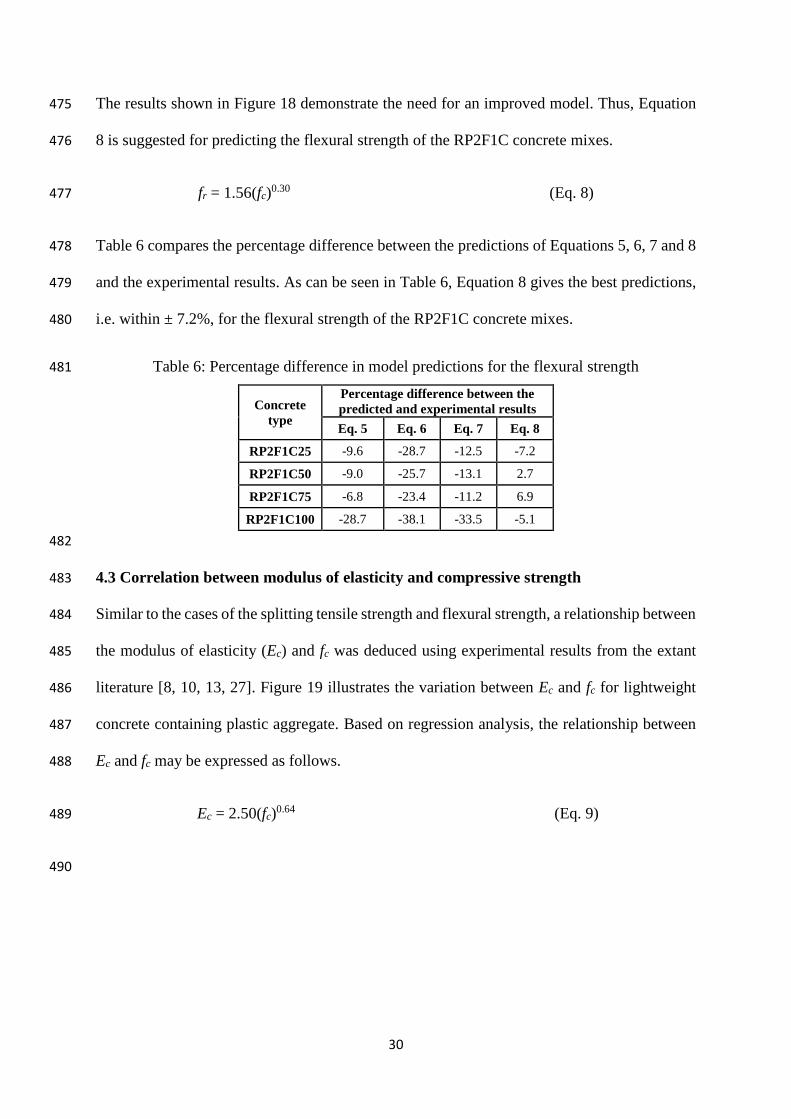
Table 6 compares the percentage difference between the predictions of Equations 5, 6, 7 and 8 478
and the experimental results. As can be seen in Table 6, Equation 8 gives the best predictions, 479
i.e. within ± 7.2%, for the flexural strength of the RP2F1C concrete mixes. 480
Table 6: Percentage difference in model predictions for the flexural strength 481
Concrete
type
Percentage difference between the
predicted and experimental results
Eq. 5 Eq. 6 Eq. 7 Eq. 8
RP2F1C25 -9.6 -28.7 -12.5 -7.2
RP2F1C50 -9.0 -25.7 -13.1 2.7
RP2F1C75 -6.8 -23.4 -11.2 6.9
RP2F1C100 -28.7 -38.1 -33.5 -5.1
482
4.3 Correlation between modulus of elasticity and compressive strength 483
Similar to the cases of the splitting tensile strength and flexural strength, a relationship between 484
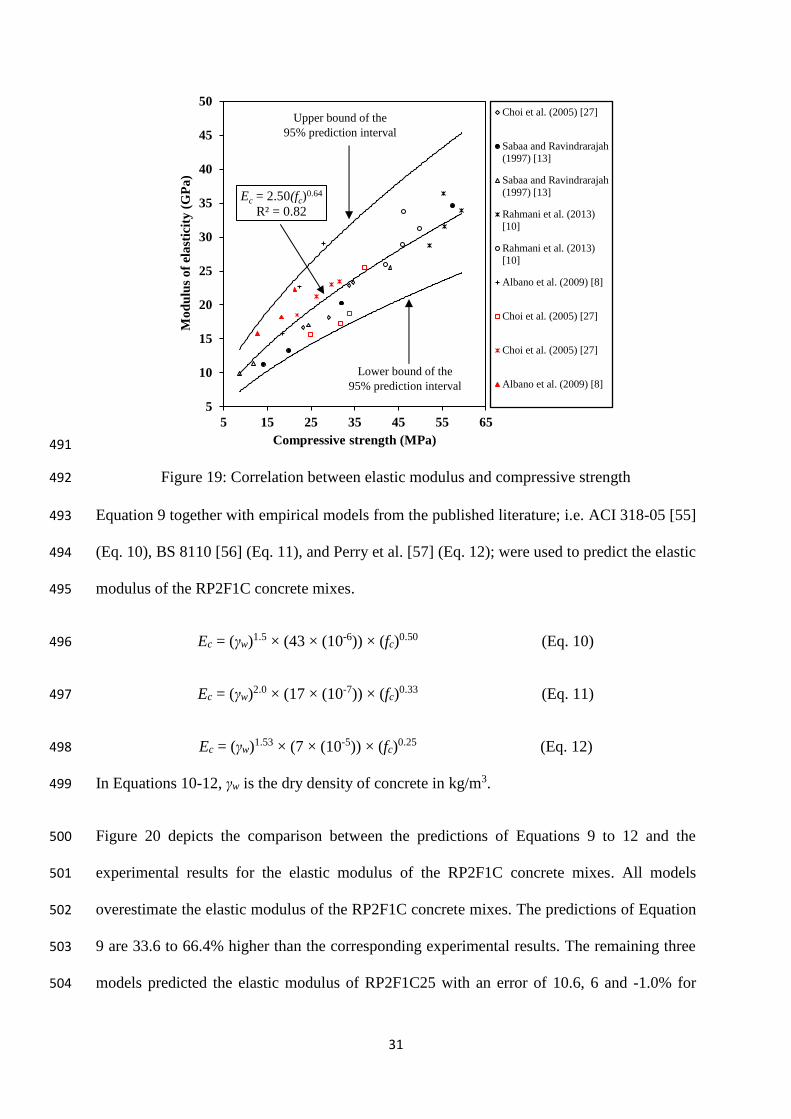
the modulus of elasticity (Ec) and fc was deduced using experimental results from the extant 485
literature [8, 10, 13, 27]. Figure 19 illustrates the variation between Ec and fc for lightweight 486
concrete containing plastic aggregate. Based on regression analysis, the relationship between 487
Ec and fc may be expressed as follows. 488
Ec = 2.50(fc)0.64 (Eq. 9) 489
490
31
491
Figure 19: Correlation between elastic modulus and compressive strength 492
Equation 9 together with empirical models from the published literature; i.e. ACI 318-05 [55] 493
(Eq. 10), BS 8110 [56] (Eq. 11), and Perry et al. [57] (Eq. 12); were used to predict the elastic 494
modulus of the RP2F1C concrete mixes. 495
Ec = (γw)1.5 × (43 × (10-6)) × (fc)0.50 (Eq. 10) 496
Ec = (γw)2.0 × (17 × (10-7)) × (fc)0.33 (Eq. 11) 497
Ec = (γw)1.53 × (7 × (10-5)) × (fc)0.25 (Eq. 12) 498
In Equations 10-12, γw is the dry density of concrete in kg/m3. 499
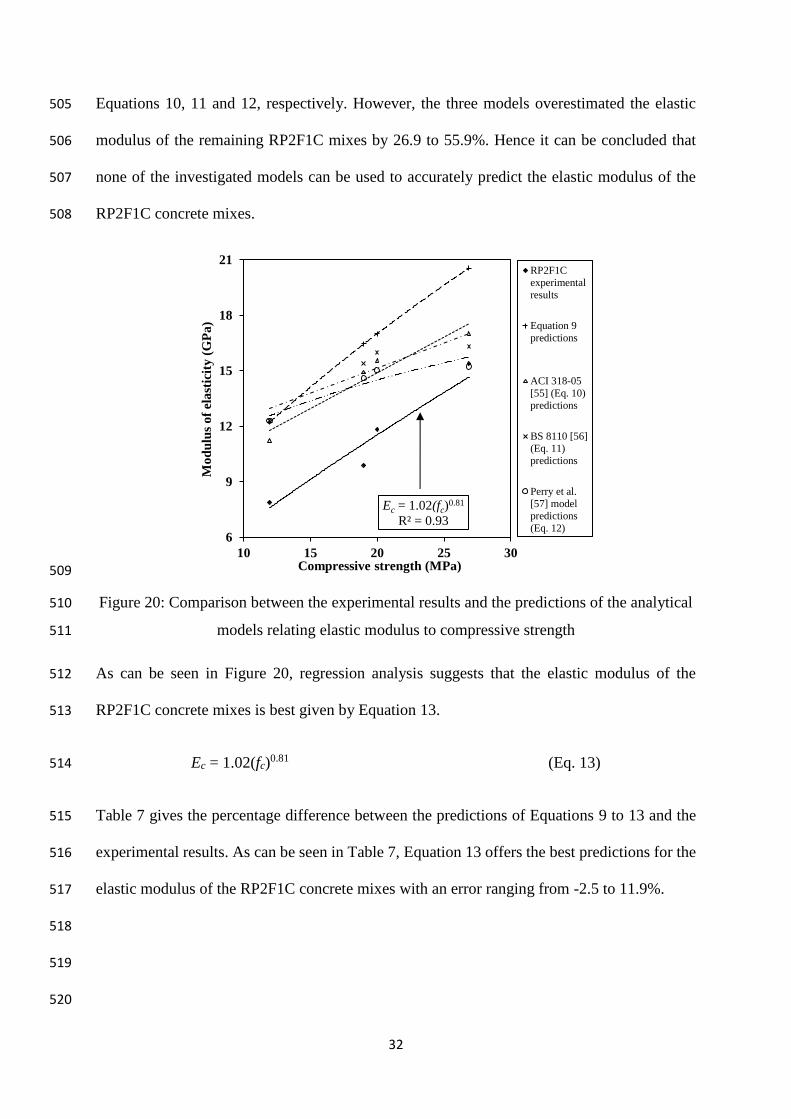
Figure 20 depicts the comparison between the predictions of Equations 9 to 12 and the 500
experimental results for the elastic modulus of the RP2F1C concrete mixes. All models 501
overestimate the elastic modulus of the RP2F1C concrete mixes. The predictions of Equation 502
9 are 33.6 to 66.4% higher than the corresponding experimental results. The remaining three 503
models predicted the elastic modulus of RP2F1C25 with an error of 10.6, 6 and -1.0% for 504
Ec = 2.50(fc)0.64
R² = 0.82
5
10
15
20
25
30
35
40
45
50
5 15 25 35 45 55 65
Mo
du
lus
of
ela
stic
ity
(G
Pa
)
Compressive strength (MPa)
Choi et al. (2005) [27]
Sabaa and Ravindrarajah
(1997) [13]
Sabaa and Ravindrarajah
(1997) [13]
Rahmani et al. (2013)
[10]
Rahmani et al. (2013)
[10]
Albano et al. (2009) [8]
Choi et al. (2005) [27]
Choi et al. (2005) [27]
Albano et al. (2009) [8]
Lower bound of the
95% prediction interval
Upper bound of the
95% prediction interval
32
Equations 10, 11 and 12, respectively. However, the three models overestimated the elastic 505
modulus of the remaining RP2F1C mixes by 26.9 to 55.9%. Hence it can be concluded that 506
none of the investigated models can be used to accurately predict the elastic modulus of the 507
RP2F1C concrete mixes. 508
509
Figure 20: Comparison between the experimental results and the predictions of the analytical 510
models relating elastic modulus to compressive strength 511
As can be seen in Figure 20, regression analysis suggests that the elastic modulus of the 512
RP2F1C concrete mixes is best given by Equation 13. 513
Ec = 1.02(fc)0.81 (Eq. 13) 514
Table 7 gives the percentage difference between the predictions of Equations 9 to 13 and the 515
experimental results. As can be seen in Table 7, Equation 13 offers the best predictions for the 516
elastic modulus of the RP2F1C concrete mixes with an error ranging from -2.5 to 11.9%. 517
518
519
520
Ec = 1.02(fc)0.81
R² = 0.93
6
9
12
15
18
21
10 15 20 25 30
Mo
du
lus
of
ela
stic
ity
(G
Pa
)
Compressive strength (MPa)
RP2F1C
experimental
results
Equation 9
predictions
ACI 318-05
[55] (Eq. 10)
predictions
BS 8110 [56]
(Eq. 11)
predictions
Perry et al.
[57] model
predictions
(Eq. 12)
33
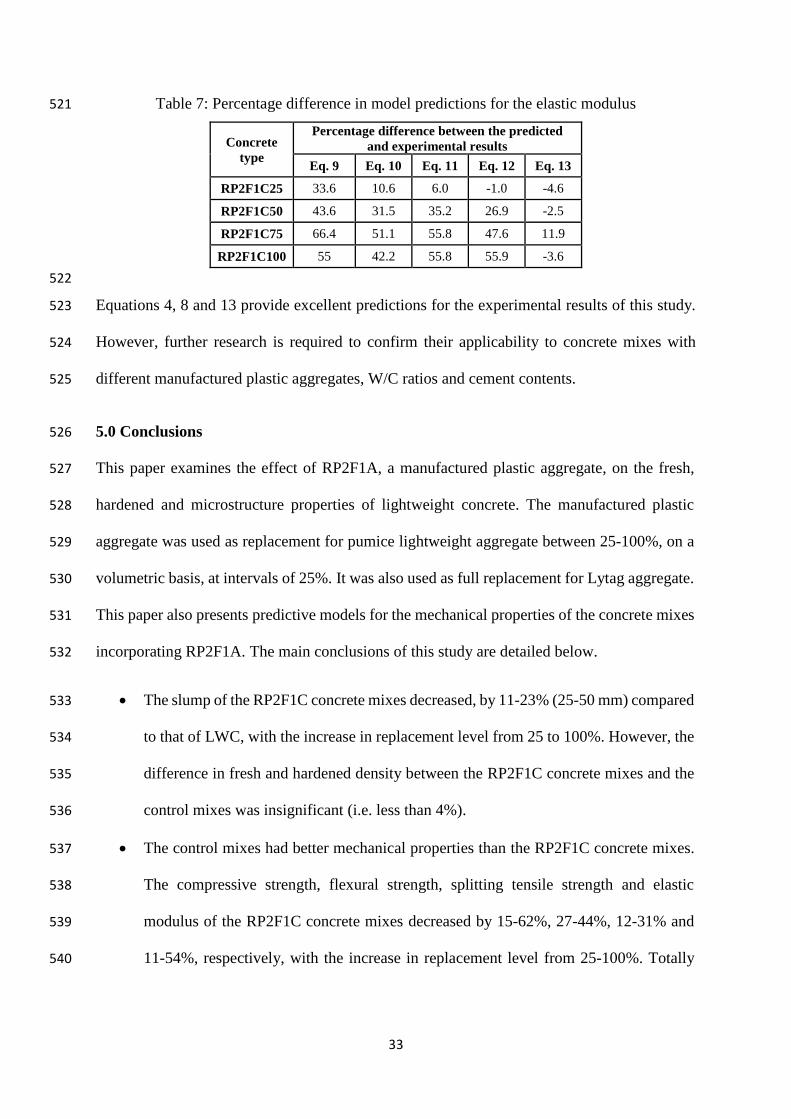
Table 7: Percentage difference in model predictions for the elastic modulus 521
Concrete
type
Percentage difference between the predicted
and experimental results
Eq. 9 Eq. 10 Eq. 11 Eq. 12 Eq. 13
RP2F1C25 33.6 10.6 6.0 -1.0 -4.6
RP2F1C50 43.6 31.5 35.2 26.9 -2.5
RP2F1C75 66.4 51.1 55.8 47.6 11.9
RP2F1C100 55 42.2 55.8 55.9 -3.6
522
Equations 4, 8 and 13 provide excellent predictions for the experimental results of this study. 523
However, further research is required to confirm their applicability to concrete mixes with 524
different manufactured plastic aggregates, W/C ratios and cement contents. 525
5.0 Conclusions 526
This paper examines the effect of RP2F1A, a manufactured plastic aggregate, on the fresh, 527
hardened and microstructure properties of lightweight concrete. The manufactured plastic 528
aggregate was used as replacement for pumice lightweight aggregate between 25-100%, on a 529
volumetric basis, at intervals of 25%. It was also used as full replacement for Lytag aggregate. 530
This paper also presents predictive models for the mechanical properties of the concrete mixes 531
incorporating RP2F1A. The main conclusions of this study are detailed below. 532
The slump of the RP2F1C concrete mixes decreased, by 11-23% (25-50 mm) compared 533
to that of LWC, with the increase in replacement level from 25 to 100%. However, the 534
difference in fresh and hardened density between the RP2F1C concrete mixes and the 535
control mixes was insignificant (i.e. less than 4%). 536
The control mixes had better mechanical properties than the RP2F1C concrete mixes. 537
The compressive strength, flexural strength, splitting tensile strength and elastic 538
modulus of the RP2F1C concrete mixes decreased by 15-62%, 27-44%, 12-31% and 539
11-54%, respectively, with the increase in replacement level from 25-100%. Totally 540
34
replacing LYA with RP2F1A had a similar detrimental effect on the mechanical 541
properties. 542
The results demonstrate that RP2F1C25, the concrete mix containing RP2F1A at a 543
replacement level of 25%, meets the requirements of ASTMC330/C330M; which 544
increases its potential for use as a sustainable lightweight structural concrete mix. 545
The control mixes had a quasilinear stress-strain response up to the peak stress followed 546
by sudden failure. In contrast, the RP2F1C concrete mixes had a ductile post-peak 547
behaviour that was enhanced by the increase in replacement level. Therefore, the 548
RP2F1C mixes can potentially be used in those applications subjected to dynamic 549
and/or repeated loads, such as pavements. 550
SEM images showed that the brittle failure of the control mixes is attributable to a 551
major crack formation due to a weak interfacial transition zone. On the other hand, the 552
ductile failure of RP2F1C100 can be ascribed to the high deformability of the RP2F1A 553
particles. Optical microscope images indicated sharp boundaries between LWA/LYA 554
and the cement matrix, contrary to the diffused boundaries observed between RP2F1A 555
and the cement matrix. 556
The predictions of the proposed models were in good agreement with the experimental 557
results for the mechanical properties of the RP2F1C concrete mixes. Until further 558
research is carried out, the proposed models should only be used for the studied type 559
of concrete at a W/C of 0.50. 560
Acknowledgements 561
The authors are grateful to King Saud University (KSU) for sponsoring and funding this 562
research project and to the University of Birmingham (UOB) for providing academic support. 563
The authors also extend their appreciation to the laboratory staff of KSU and UOB for their 564
full assistance during the experimental work. 565
35
References 566
[1] Statista, 2014. Worldwide plastics production. 567
(http://www.statista.com/statistics/282732/global-production-of plastics-since-1950/) (Mar. 568
29. 2016). 569
[2] PlasticsEurope, E., 2016. Plastics-the Facts 2016. An analysis of European latest plastics 570
production, demand and waste data. 571
(http://www.plasticseurope.org/documents/document/20161014113313-572
plastics_the_facts_2016_final_version.pdf) (Mar. 29. 2016). 573
[3] EPA, 2014. Municipal Solid Waste Generation, Recycling, and Disposal in the United 574
States Detailed Tables and Figures for 2012. US Environmental Protection Agency. 575
(https://www.epa.gov/sites/production/files/201509/documents/2012_msw_dat_tbls.pdf) 576
(Mar. 29. 2016). 577
[4] Jambeck, J.R., Geyer, R., Wilcox, C., Siegler, T.R., Perryman, M., Andrady, A., Narayan, 578
R. and Law, K.L., 2015. Plastic waste inputs from land into the ocean. Science, 347(6223), 579
pp.768-771. 580
(http://science.sciencemag.org/content/347/6223/768) 581
[5] Gu, L. and Ozbakkaloglu, T., 2016. Use of recycled plastics in concrete: A critical review. 582
Waste Management, 51, pp.19-42. 583
(http://www.sciencedirect.com/science/article/pii/S0956053X16300915) 584
[6] Fredonia, 2012. Global Demand for Construction Aggregates in 2015, Demand and Sales 585
Forecasts. 586
(http://www.freedoniagroup.com) (May. 23, 2015). 587
36
[7] Marzouk, O.Y., Dheilly, R.M. and Queneudec, M., 2007. Valorization of post-consumer 588
waste plastic in cementitious concrete composites. Waste management, 27(2), pp.310-318. 589
(http://www.sciencedirect.com/science/article/pii/S0956053X06001048) 590
[8] Albano, C., Camacho, N., Hernandez, M., Matheus, A. and Gutierrez, A., 2009. Influence 591
of content and particle size of waste pet bottles on concrete behavior at different w/c ratios. 592
Waste Management, 29(10), pp.2707-2716. 593
(http://www.sciencedirect.com/science/article/pii/S0956053X09001767) 594
[9] Hannawi, K., Kamali-Bernard, S. and Prince, W., 2010. Physical and mechanical properties 595
of mortars containing PET and PC waste aggregates. Waste Management, 30(11), pp.2312-596
2320. 597
(http://www.sciencedirect.com/science/article/pii/S0956053X10001996) 598
[10] Rahmani, E., Dehestani, M., Beygi, M.H.A., Allahyari, H. and Nikbin, I.M., 2013. On the 599
mechanical properties of concrete containing waste PET particles. Construction and Building 600
Materials, 47, pp.1302-1308. 601
(http://www.sciencedirect.com/science/article/pii/S095006181300559X) 602
[11] Juki, M.I., Awang, M., Annas, M.M.K., Boon, K.H., Othman, N., Roslan, M.A. and 603
Khalid, F.S., 2013. Relationship between compressive, splitting tensile and flexural strength of 604
concrete containing granulated waste Polyethylene Terephthalate (PET) bottles as fine 605
aggregate. In Advanced Materials Research (Vol. 795, pp. 356-359). Trans Tech Publications. 606
(http://eprints.uthm.edu.my/4415/1/Relationship_Between_Compressive,_Splitting_Tensile.p607
df) 608
[12] Saikia, N. and de Brito, J., 2014. Mechanical properties and abrasion behaviour of concrete 609
containing shredded PET bottle waste as a partial substitution of natural aggregate. 610
Construction and building materials, 52, pp.236-244. 611
37
(http://www.sciencedirect.com/science/article/pii/S0950061813010817) 612
[13] Sabaa, B. and Ravindrarajah, R.S., 1997. Engineering properties of lightweight concrete 613
containing crushed expanded polystyrene waste. Adv Mater Cem Compos. 614
(https://www.researchgate.net/profile/Sriravindrarajah_Rasiah/publication/265916085_Engin615
eering_properties_of_lightweight_concrete_containing_crushed_expanded_polystyrene_wast616
e/links/55c8006808aebc967df88031.pdf) 617
[14] Ravindrarajah, R.S., 1999. Bearing strength of concrete containing polystyrene aggregate. 618
In Proc. the RILEM 8th Int Conf Durability of Building Materials and Components, 619
Vancouver, Canada (Vol. 1, pp. 505-514). 620
(http://www.irbnet.de/daten/iconda/CIB1834.pdf) 621
[15] Babu, D.S., Babu, K.G. and Wee, T.H., 2005. Properties of lightweight expanded 622
polystyrene aggregate concretes containing fly ash. Cement and Concrete Research, 35(6), 623
pp.1218-1223. 624
(http://www.sciencedirect.com/science/article/pii/S0008884605000177) 625
[16] Tang, W.C., Lo, Y. and Nadeem, A.B.I.D., 2008. Mechanical and drying shrinkage 626
properties of structural-graded polystyrene aggregate concrete. Cement and Concrete 627
Composites,30(5),pp.403-409. 628
(http://www.sciencedirect.com/science/article/pii/S0958946508000115) 629
[17] Al-Manaseer, A.A. and Dalal, T.R., 1997. Concrete containing plastic aggregates. 630
Concrete International, 19(8), pp.47-52. 631
(https://www.concrete.org/publications/internationalconcreteabstractsportal.aspx?m=details&632
ID=60) 633
38
[18] Kou, S.C., Lee, G., Poon, C.S. and Lai, W.L., 2009. Properties of lightweight aggregate 634
concrete prepared with PVC granules derived from scraped PVC pipes. Waste Management, 635
29(2), pp.621-628. 636
(http://www.sciencedirect.com/science/article/pii/S0956053X08001864) 637
[19] Fraj, A.B., Kismi, M. and Mounanga, P., 2010. Valorization of coarse rigid polyurethane 638
foam waste in lightweight aggregate concrete. Construction and Building Materials, 24(6), 639
pp.1069-1077. 640
(http://www.sciencedirect.com/science/article/pii/S095006180900395X) 641
[20] Wang, R. and Meyer, C., 2012. Performance of cement mortar made with recycled high 642
impact polystyrene. Cement and Concrete Composites, 34(9), pp.975-981. 643
(http://www.sciencedirect.com/science/article/pii/S0958946512001412) 644
[21] Batayneh, M., Marie, I. and Asi, I., 2007. Use of selected waste materials in concrete 645
mixes. Waste management, 27(12), pp.1870-1876. 646
(http://www.sciencedirect.com/science/article/pii/S0956053X06002601) 647
[22] Ismail, Z.Z. and Al-Hashmi, E.A., 2008. Use of waste plastic in concrete mixture as 648
aggregate replacement. Waste Management, 28(11), pp.2041-2047. 649
(http://www.sciencedirect.com/science/article/pii/S0956053X07002784) 650
[23] Rahman, M.M., Islam, M.A. and Ahmed, M., 2012. Recycling of waste polymeric 651
materials as a partial replacement for aggregate in concrete. In International Conference on 652
Chemical, Environmental and Biological Sciences. 653
(http://psrcentre.org/images/extraimages/53.%20212203.pdf) 654
[24] Rai, B., Rushad, S.T., Kr, B. and Duggal, S.K., 2012. Study of waste plastic mix concrete 655
with plasticizer. ISRN Civil Engineering, 2012. 656
(https://www.hindawi.com/journals/isrn/2012/469272/) 657
39
[25] Herki, A.B., Khatib, J.M. and Negim, E.M., 2013. Lightweight concrete made from waste 658
polystyrene and fly ash. World Applied Sciences Journal, 21(9), pp.1356-1360. 659
(http://idosi.org/wasj/wasj21(9)13/14.pdf) 660
[26] Lima, P.R.L., Leite, M.B. and Santiago, E.Q.R., 2010. Recycled lightweight concrete 661
made from footwear industry waste and CDW. Waste management, 30(6), pp.1107-1113. 662
(http://www.sciencedirect.com/science/article/pii/S0956053X10000929) 663
[27] Choi, Y.W., Moon, D.J., Chung, J.S. and Cho, S.K., 2005. Effects of waste PET bottles 664
aggregate on the properties of concrete. Cement and Concrete Research, 35(4), pp.776-781. 665
(http://www.sciencedirect.com/science/article/pii/S0008884604002169) 666
[28] Choi, Y.W., Moon, D.J., Kim, Y.J. and Lachemi, M., 2009. Characteristics of mortar and 667
concrete containing fine aggregate manufactured from recycled waste polyethylene 668
terephthalate bottles. Construction and Building Materials, 23(8), pp.2829-2835. 669
(http://www.sciencedirect.com/science/article/pii/S0950061809000774) 670
[29] Kashi, M.G., Swan, C., Holmstrom, O. and Malloy, R., 1999, January. Innovative 671
lightweight synthetic aggregates developed from coal Fly ash. In 13 th International 672
Symposium on Management and Use of Coal Combustion Products), Orlando FL, American 673
Coal Ash Association, Alexandria, VA, 1, pp. 5-1-5-14. 674
(http://www.geiconsultants.com/stuff/contentmgr/files/0/cfc4cb46e13db113057f76c8379d31675
91/download/innovativelightweightsynthetic.pdf) 676
[30] Jansen, D., Kiggins, M., Swan, C., Malloy, R., Kashi, M., Chan, R., Javdekar, C., Siegal, 677
C. and Weingram, J., 2001. Lightweight fly ash-plastic aggregates in concrete. Transportation 678
Research Record: Journal of the Transportation Research Board, (1775), pp.44-52. 679
(http://trrjournalonline.trb.org/doi/pdf/10.3141/1775-07) 680
40
[31] Malloy, R., Desai, N., Wilson, C., Swan, C., Jansen, D. and Kashi, M., 2001. High Carbon 681
Fly Ash/Mixed Thermoplastic Aggregate for Use in Lightweight Concrete. In technical papers 682
of the annual technical conference-society of plastics engineers incorporated, Dallas, TX, 3, 683
pp. 2743-2752. 684
(http://www.4spe.org/Resources/resource.aspx?ItemNumber=12836) 685
[32] Swan, C.W. and Sacks, A., 2005. Properties of synthetic lightweight aggregates for use in 686
pavement systems. GSP 130 Advances in Pavement Engineering. 687
(http://ascelibrary.org/doi/abs/10.1061/40776(155)9) 688
[33] Slabaugh, S., Swan, C. and Malloy, R., 2007. Development and Properties of Foamed 689
Synthetic Lightweight Aggregates. World of coal ash. 690
(http://infohouse.p2ric.org/ref/45/44870.pdf) 691
[34] Alqahtani, F.K., Khan, M.I., Ghataora, G. and Dirar, S., 2016. Production of Recycled 692
Plastic Aggregates and Its Utilization in Concrete. Journal of Materials in Civil Engineering, 693
p.04016248. 694
(http://ascelibrary.org/doi/abs/10.1061/(ASCE)MT.1943-5533.0001765) 695
[35] Alqahtani, F.K., Khan, M.I. and Ghataora, G., King Saud University, 2014. Synthetic 696
aggregate for use in concrete. U.S. Patent 8,921,463. 697
(https://www.google.com/patents/US8921463) 698
[36] ASTM International, 2015. Standard test method for relative density (specific gravity) and 699
absorption of coarse aggregate. ASTM C127-15, West Conshohocken, PA, USA. 700
(https://compass.astm.org/EDIT/html_annot.cgi?C127+15) 701
[37] ASTM International, 2014. Standard Specification for Lightweight Aggregates for 702
Structural Concrete. ASTM C330/C330M-14, West Conshohocken, PA, USA. 703
(https://compass.astm.org/EDIT/html_annot.cgi?C330+14) 704
41
[38] ASTM International, 2016. Standard Test Method for Bulk Density (Unit Weight) and 705
Voids in Aggregate. ASTM C29/C29M-16, West Conshohocken, PA, USA. 706
(https://compass.astm.org/EDIT/html_annot.cgi?C29+16) 707
[39] ASTM International, 2015. Standard Test Method for Relative (Specific Gravity) and 708
Absorption of Fine Aggregate. ASTM C128-15, West Conshohocken, PA, USA. 709
(https://compass.astm.org/EDIT/html_annot.cgi?C128+15) 710
[40] ASTM International, 2014. Standard Test Method for Sieve Analysis of Fine and Coarse 711
Aggregates. ASTM C136/C136M-14, West Conshohocken, PA, USA. 712
(https://compass.astm.org/EDIT/html_annot.cgi?C136+14) 713
[41] American Concrete Institute (ACI Committee 211), 1998. Standard Practice for Selecting 714
Proportions for Structural Lightweight Concrete. ACI 211.2-98 (Reapproved 2004), 715
Farmington Hills, MI. 716
(http://www.icie.ir/files/filebox/211.2_98.pdf) 717
[42] ASTM International, 2016. Standard Practice for Making and Curing Concrete Test 718
Specimens in the Laboratory. ASTM C192/C192M-16a, West Conshohocken, PA, USA. 719
(https://compass.astm.org/EDIT/html_annot.cgi?C192+16a) 720
[43] ASTM International, 2015. Standard Test Method for Slump of Hydraulic-Cement 721
Concrete. ASTM C143/C143M-15a, West Conshohocken, PA, USA. 722
(https://compass.astm.org/EDIT/html_annot.cgi?C143+15a) 723
[44] ASTM International, 2016. Standard Test Method for Density (Unit Weight), Yield, and 724
Air Content (Gravimetric) of Concrete. ASTM C138/C138M-16a, West Conshohocken, PA, 725
USA. 726
(https://compass.astm.org/EDIT/html_annot.cgi?C138+16a) 727
42
[45] British Standards Institution, 2009. Testing Hardened Concrete: Density of Hardened 728
Concrete. BS EN 12390–7:2009, Milton Keynes, UK. 729
(https://bsolbsigroupcom.ezproxyd.bham.ac.uk/Bibliographic/BibliographicInfoData/000000730
000030164912) 731
[46] ASTM International, 2016. Standard Test Method for Compressive strength of Cylindrical 732
Concrete Specimens. ASTM C39/C39M-16b, West Conshohocken, PA, USA. 733
(https://compass.astm.org/EDIT/html_annot.cgi?C39+16b) 734
[47] ASTM International, 2012. Standard Test Method for Flexural Strength and Modulus of 735
Elasticity of Chemical-Resistant Mortars, Grouts, Monolithic Surfacing and Polymer 736
Concretes. ASTM C580-02, West Conshohocken, PA, USA. 737
(https://compass.astm.org/EDIT/html_annot.cgi?C580+02(2012)) 738
[48] British Standards Institution, 2009. Testing Hardened Concrete: Tensile splitting strength 739
of test specimens. BSEN12390–6:2009, UK. 740
(http://shop.bsigroup.com/ProductDetail/?pid=000000000030200045) 741
[49] ASTM International, 2014. Standard Test Method for Static Modulus of Elasticity and 742
Poisson’s Ratio of Concrete in Compression. ASTM C469/C469M-14, West Conshohocken, 743
PA, USA. 744
(https://compass.astm.org/EDIT/html_annot.cgi?C469+14) 745
[50] American Concrete Institute (ACI Committee 213), 2014. Guide for Structural 746
Lightweight-Aggregate Concrete. ACI 213R-14, Farmington Hills, MI. 747
(https://www.concrete.org/store/productdetail.aspx?ItemID=21314) 748
[51] American Concrete Institute (ACI Committee 318), 1999. Building Code Requirements 749
for Structural Concrete (ACI 318-99) and Commentary (ACI 318R-99). Farmington Hills, MI. 750
(https://www.concrete.org/store/productdetail/itemid/31899.aspx) 751
43
[52] Neville, A.M., 1995. Properties of Concrete, Fourth and Final Edition Standards, United 752
Kingdom, Pearson Prentice Hall, 1995. 753
(https://igitgeotech.files.wordpress.com/2014/10/properties-of-concrete-by-a-m-neville.pdf) 754
[53] American Concrete Institute (ACI Committee 318), 1995. Building Code Requirements 755
for Structural Concrete (ACI 318-95) and Commentary (ACI 318R-95). Farmington Hills, MI. 756
(https://law.resource.org/pub/us/cfr/ibr/001/aci.318.1995.pdf) 757
[54] Raphael, J.M., 1984, March. Tensile strength of concrete. In Journal Proceedings (Vol. 758
81, No. 2, pp. 158-165). 759
(https://www.concrete.org/publications/internationalconcreteabstractsportal.aspx?m=details&760
ID=10653) 761
[55] American Concrete Institute (ACI Committee 318), 2005. Building Code Requirements 762
for Structural Concrete (ACI 318-05) and Commentary (ACI 318R-05). Farmington Hills, MI. 763
(https://www.allbeton.ru/upload/mediawiki/4f1/building-code-requirements-for-structural-764
concrete-_aci-318_05_-and-commentary-_aci-318r_05_.pdf) 765
[56] British Standards Institution, 1997. Structural Use of Concrete: Code of practice for design 766
and construction. BS 8110: part 1:1997, UK. 767
(https://bsolbsigroupcom.ezproxyd.bham.ac.uk/Bibliographic/BibliographicInfoData/000000768
000030161093) 769
[57] Perry, S.H., Bischoff, P.H. and Yamura, K., 1991. Mix details and material behaviour of 770
polystyrene aggregate concrete. Magazine of Concrete Research, 43(154), pp.71-76. 771
(http://www.icevirtuallibrary.com/doi/abs/10.1680/macr.1991.43.154.71) 772