Embed Size (px)
Citation preview

PROFESSIONAL OVERSIGHT BOARD
KEY FACTS AND TRENDS IN THE ACCOUNTANCY PROFESSION
NOVEMBER 2006
Nov 06 FC.qxp 15/11/2006 01:20 Page 1

Nov 06 FC.qxp 15/11/2006 01:20 Page 2
PROFESSIONAL OVERSIGHT BOARD KEY FACTS AND TRENDS IN THE ACCOUNTANCY PROFESSION NOVEMBER 2006

The Financial Reporting Council Aldwych House 71-91 Aldwych London WC2B 4HN Telephone 020 7492 2300 E-mail [email protected]

KEY FACTS AND TRENDS
IN THE ACCOUNTANCY PROFESSION C O N T E N T S Chairman’s Foreword 3 Main Highlights 5 Members of the Six Chartered Accountancy Bodies 7 Students of the Six Chartered Accountancy Bodies 21 Other Information on the Accountancy Bodies 31 Audit Firms 35
1

2
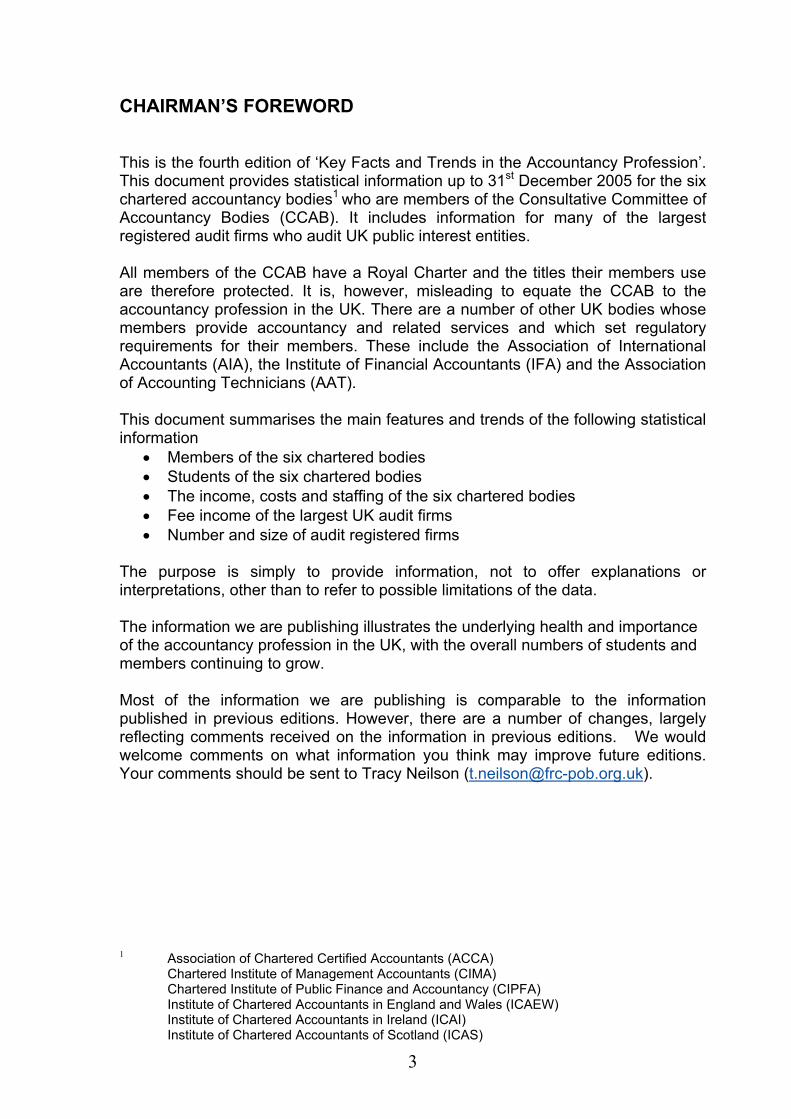
CHAIRMAN’S FOREWORD This is the fourth edition of ‘Key Facts and Trends in the Accountancy Profession’. This document provides statistical information up to 31st December 2005 for the six chartered accountancy bodies1 who are members of the Consultative Committee of Accountancy Bodies (CCAB). It includes information for many of the largest registered audit firms who audit UK public interest entities. All members of the CCAB have a Royal Charter and the titles their members use are therefore protected. It is, however, misleading to equate the CCAB to the accountancy profession in the UK. There are a number of other UK bodies whose members provide accountancy and related services and which set regulatory requirements for their members. These include the Association of International Accountants (AIA), the Institute of Financial Accountants (IFA) and the Association of Accounting Technicians (AAT). This document summarises the main features and trends of the following statistical information
• Members of the six chartered bodies • Students of the six chartered bodies • The income, costs and staffing of the six chartered bodies • Fee income of the largest UK audit firms • Number and size of audit registered firms
The purpose is simply to provide information, not to offer explanations or interpretations, other than to refer to possible limitations of the data. The information we are publishing illustrates the underlying health and importance of the accountancy profession in the UK, with the overall numbers of students and members continuing to grow. Most of the information we are publishing is comparable to the information published in previous editions. However, there are a number of changes, largely reflecting comments received on the information in previous editions. We would welcome comments on what information you think may improve future editions. Your comments should be sent to Tracy Neilson ([email protected]). 1 Association of Chartered Certified Accountants (ACCA) Chartered Institute of Management Accountants (CIMA) Chartered Institute of Public Finance and Accountancy (CIPFA) Institute of Chartered Accountants in England and Wales (ICAEW) Institute of Chartered Accountants in Ireland (ICAI)
Institute of Chartered Accountants of Scotland (ICAS)
3

The Financial Reporting Council (FRC) is the unified independent regulator for the accounting, audit and actuarial profession and for accounting, auditing and actuarial standard setting and enforcement. Within the FRC, the Professional Oversight Board is the operating body responsible for:
• Independent oversight of the regulation of the auditing profession by the recognised supervisory and qualifying bodies
• Monitoring of the quality of the auditing function in relation to economically significant entities
• Independent oversight of the regulation of the accountancy profession by the professional accountancy bodies.
• Independent oversight of the regulation of the actuarial profession by the professional actuarial bodies and promoting high quality actuarial work.
There is more information on the FRC and its operating bodies at www.frc.org.uk . Sir John Bourn Chairman of the Professional Oversight Board November 2006
4
MAIN HIGHLIGHTS
THE SIX CHARTERED ACCOUNTANCY BODIES 2000-2005
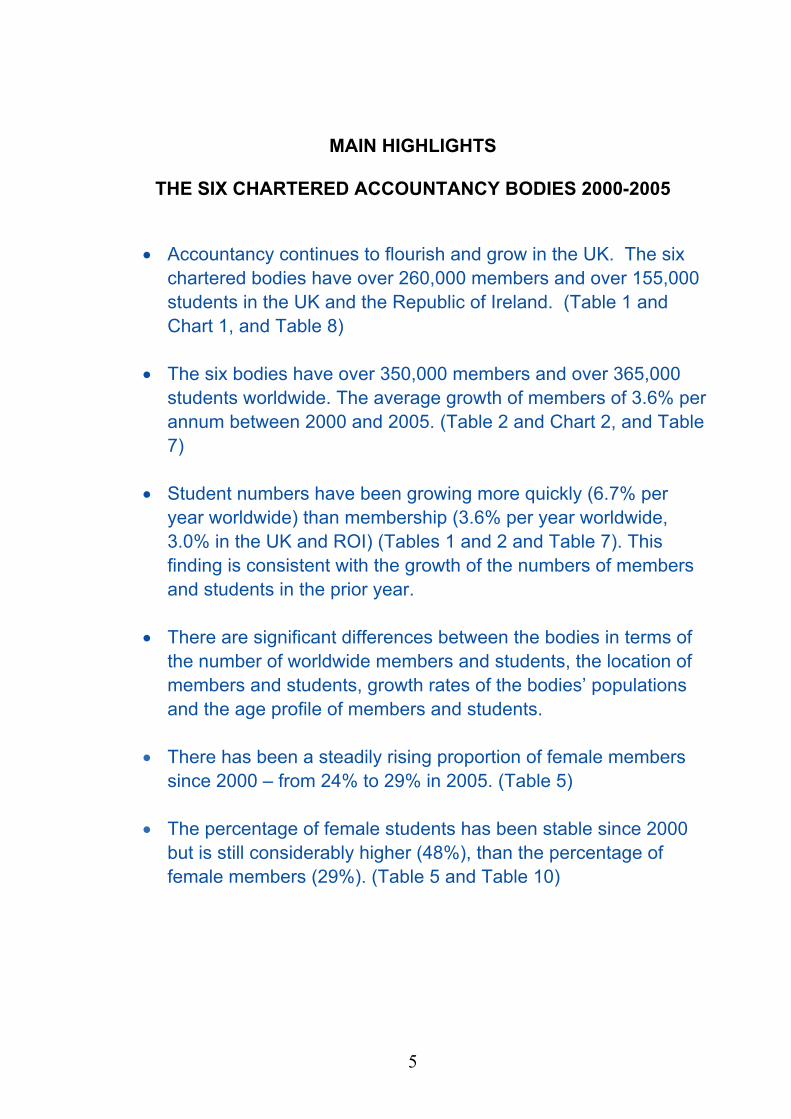
• Accountancy continues to flourish and grow in the UK. The six chartered bodies have over 260,000 members and over 155,000 students in the UK and the Republic of Ireland. (Table 1 and Chart 1, and Table 8)
• The six bodies have over 350,000 members and over 365,000 students worldwide. The average growth of members of 3.6% per annum between 2000 and 2005. (Table 2 and Chart 2, and Table 7)
• Student numbers have been growing more quickly (6.7% per year worldwide) than membership (3.6% per year worldwide, 3.0% in the UK and ROI) (Tables 1 and 2 and Table 7). This finding is consistent with the growth of the numbers of members and students in the prior year.
• There are significant differences between the bodies in terms of the number of worldwide members and students, the location of members and students, growth rates of the bodies’ populations and the age profile of members and students.
• There has been a steadily rising proportion of female members
since 2000 – from 24% to 29% in 2005. (Table 5)
• The percentage of female students has been stable since 2000 but is still considerably higher (48%), than the percentage of female members (29%). (Table 5 and Table 10)
5
THE AUDIT FIRMS
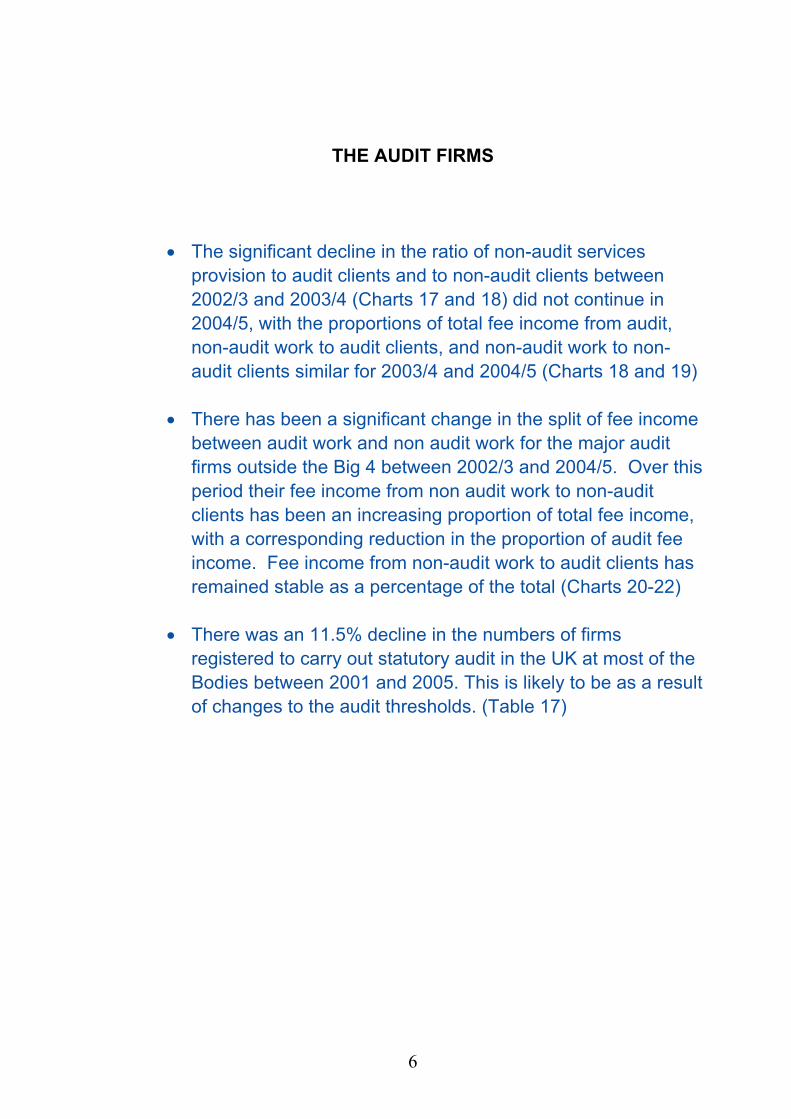
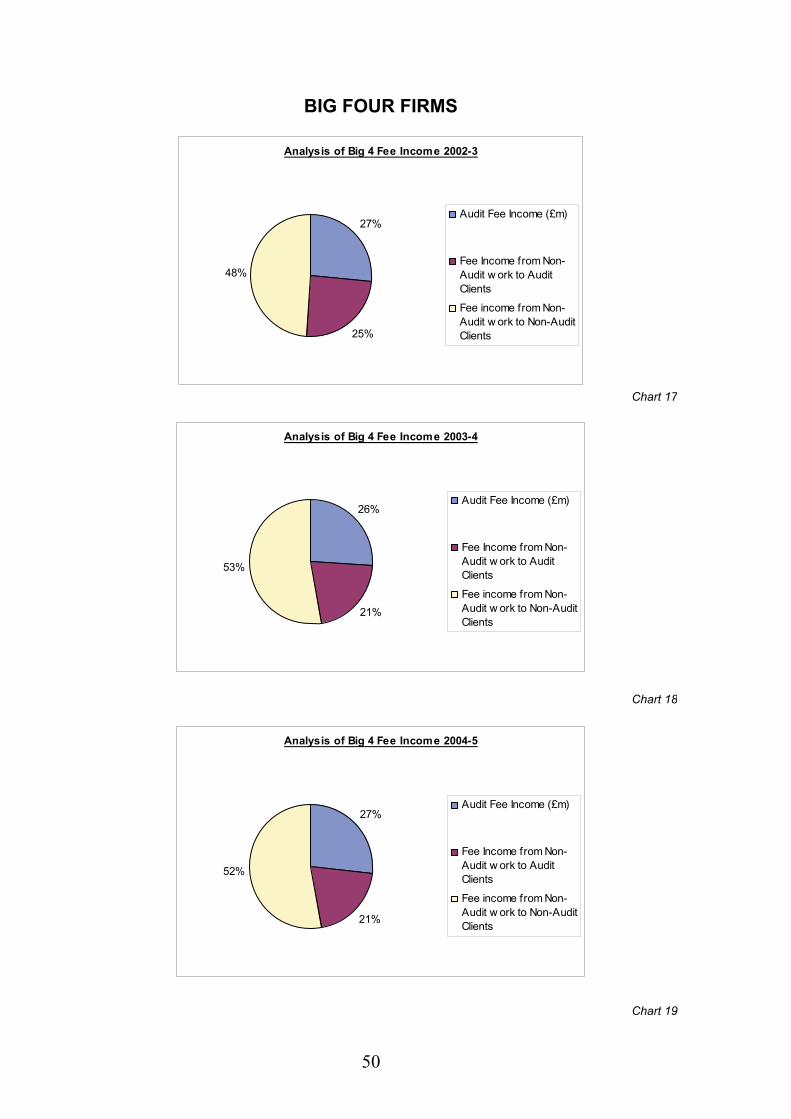
• The significant decline in the ratio of non-audit services provision to audit clients and to non-audit clients between 2002/3 and 2003/4 (Charts 17 and 18) did not continue in 2004/5, with the proportions of total fee income from audit, non-audit work to audit clients, and non-audit work to non-audit clients similar for 2003/4 and 2004/5 (Charts 18 and 19)
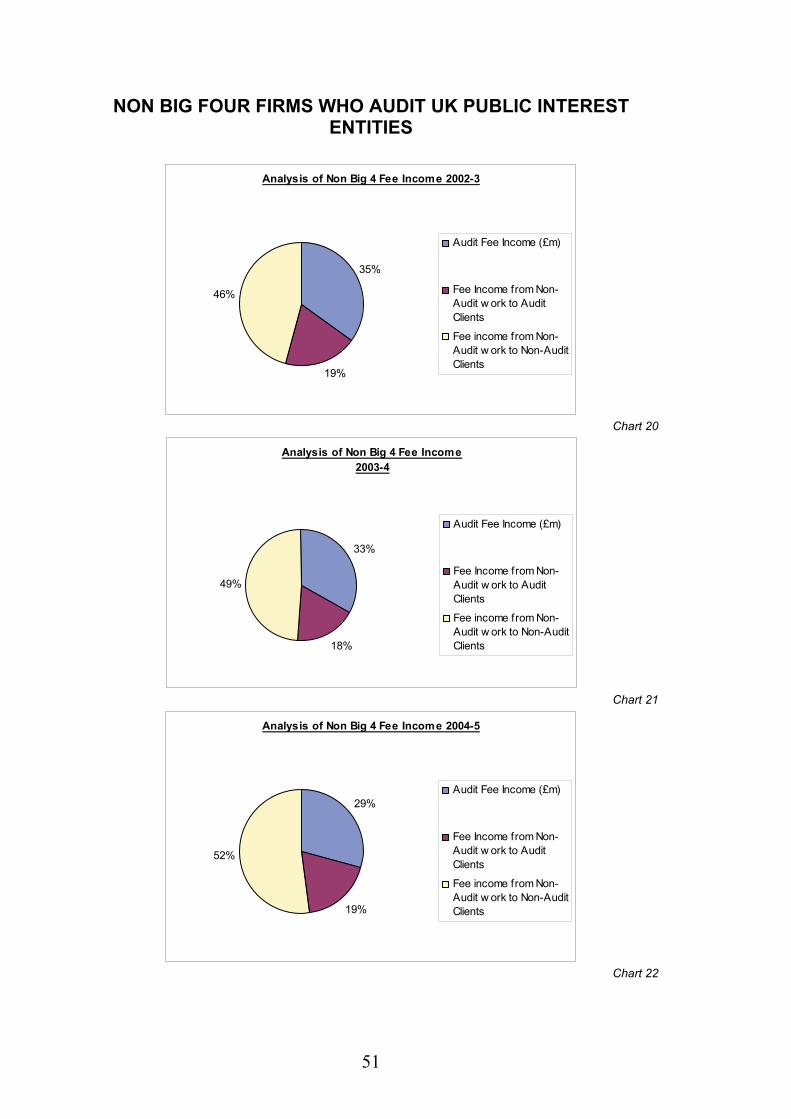
• There has been a significant change in the split of fee income between audit work and non audit work for the major audit firms outside the Big 4 between 2002/3 and 2004/5. Over this period their fee income from non audit work to non-audit clients has been an increasing proportion of total fee income, with a corresponding reduction in the proportion of audit fee income. Fee income from non-audit work to audit clients has remained stable as a percentage of the total (Charts 20-22)
• There was an 11.5% decline in the numbers of firms
registered to carry out statutory audit in the UK at most of the Bodies between 2001 and 2005. This is likely to be as a result of changes to the audit thresholds. (Table 17)
6
MEMBERS OF THE
CHARTERED ACCOUNTANCY BODIES
7
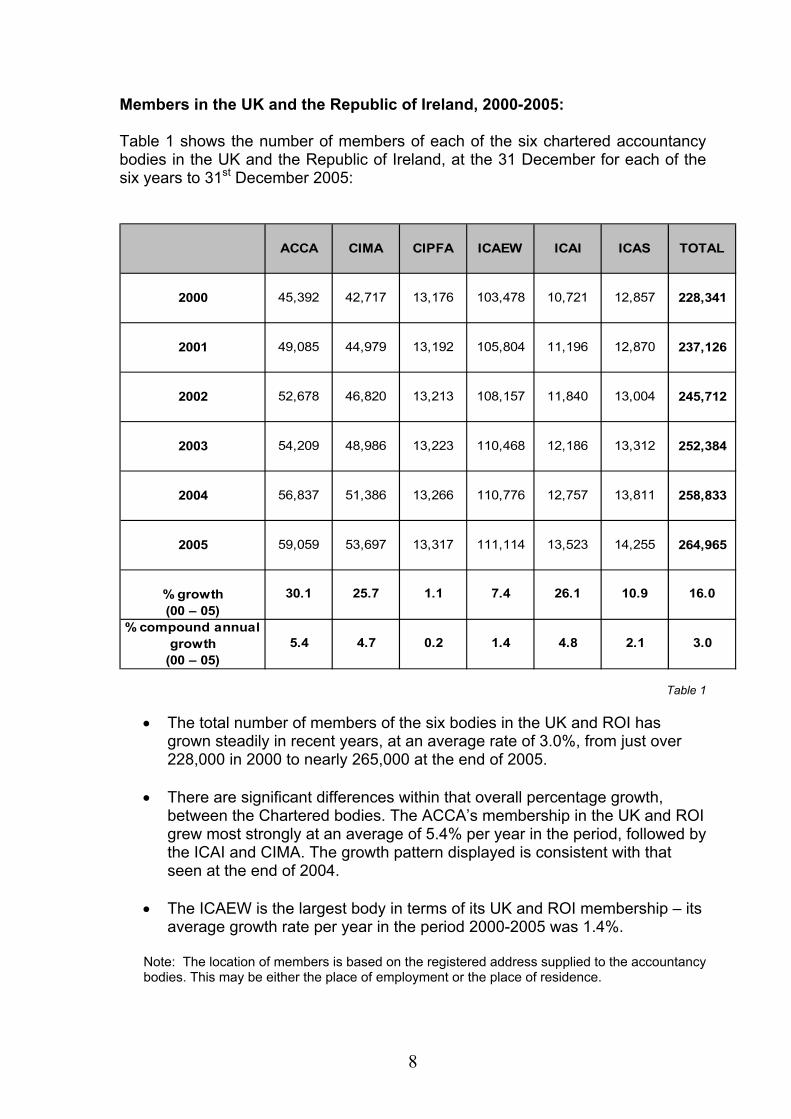
Members in the UK and the Republic of Ireland, 2000-2005: Table 1 shows the number of members of each of the six chartered accountancy bodies in the UK and the Republic of Ireland, at the 31 December for each of the six years to 31st December 2005:
ACCA CIMA CIPFA ICAEW ICAI ICAS TOTAL
2000 45,392 42,717 13,176 103,478 10,721 12,857 228,341
2001 49,085 44,979 13,192 105,804 11,196 12,870 237,126
2002 52,678 46,820 13,213 108,157 11,840 13,004 245,712
2003 54,209 48,986 13,223 110,468 12,186 13,312 252,384
2004 56,837 51,386 13,266 110,776 12,757 13,811 258,833
2005 59,059 53,697 13,317 111,114 13,523 14,255 264,965
% growth(00 – 05)
% compound annualgrowth
(00 – 05)4.8 2.1 3.05.4 4.7 0.2 1.4
7.4 26.1 10.9 16.030.1 25.7 1.1
Table 1
• The total number of members of the six bodies in the UK and ROI has
grown steadily in recent years, at an average rate of 3.0%, from just over 228,000 in 2000 to nearly 265,000 at the end of 2005.
• There are significant differences within that overall percentage growth, between the Chartered bodies. The ACCA’s membership in the UK and ROI grew most strongly at an average of 5.4% per year in the period, followed by the ICAI and CIMA. The growth pattern displayed is consistent with that seen at the end of 2004.
• The ICAEW is the largest body in terms of its UK and ROI membership – its average growth rate per year in the period 2000-2005 was 1.4%.
Note: The location of members is based on the registered address supplied to the accountancy bodies. This may be either the place of employment or the place of residence.
8

Members in the UK and Republic of Ireland 2000-2005
0
20,000
40,000
60,000
80,000
100,000
120,000
ACCA CIMA CIPFA ICAEW ICAI ICAS
Num
ber o
f Mem
bers 2000
2001
20022003
20042005
Chart 1
9
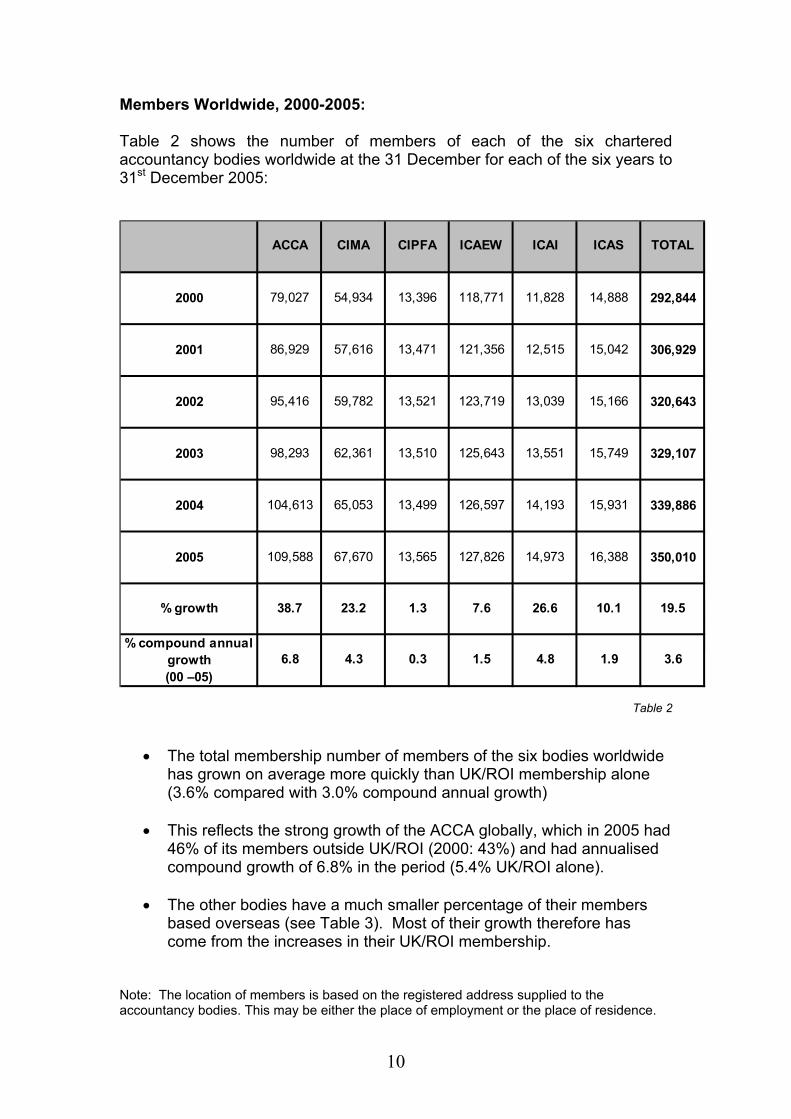
Members Worldwide, 2000-2005: Table 2 shows the number of members of each of the six chartered accountancy bodies worldwide at the 31 December for each of the six years to 31st December 2005:
2000 79,027 54,934 13,396 118,771 11,828 14,888 292,844
2001 86,929 57,616 13,471 121,356 12,515 15,042 306,929
2002 95,416 59,782 13,521 123,719 13,039 15,166 320,643
2003 98,293 62,361 13,510 125,643 13,551 15,749 329,107
2004 104,613 65,053 13,499 126,597 14,193 15,931 339,886
2005 109,588 67,670 13,565 127,826 14,973 16,388 350,010
% growth 38.7 23.2 1.3 7.6 26.6 10.1 19.5
% compound annualgrowth(00 –05)
ICAI ICAS TOTALACCA CIMA CIPFA ICAEW
4.8 1.9 3.66.8 4.3 0.3 1.5
Table 2
• The total membership number of members of the six bodies worldwide has grown on average more quickly than UK/ROI membership alone (3.6% compared with 3.0% compound annual growth)
• This reflects the strong growth of the ACCA globally, which in 2005 had 46% of its members outside UK/ROI (2000: 43%) and had annualised compound growth of 6.8% in the period (5.4% UK/ROI alone).
• The other bodies have a much smaller percentage of their members
based overseas (see Table 3). Most of their growth therefore has come from the increases in their UK/ROI membership.
Note: The location of members is based on the registered address supplied to the accountancy bodies. This may be either the place of employment or the place of residence.
10
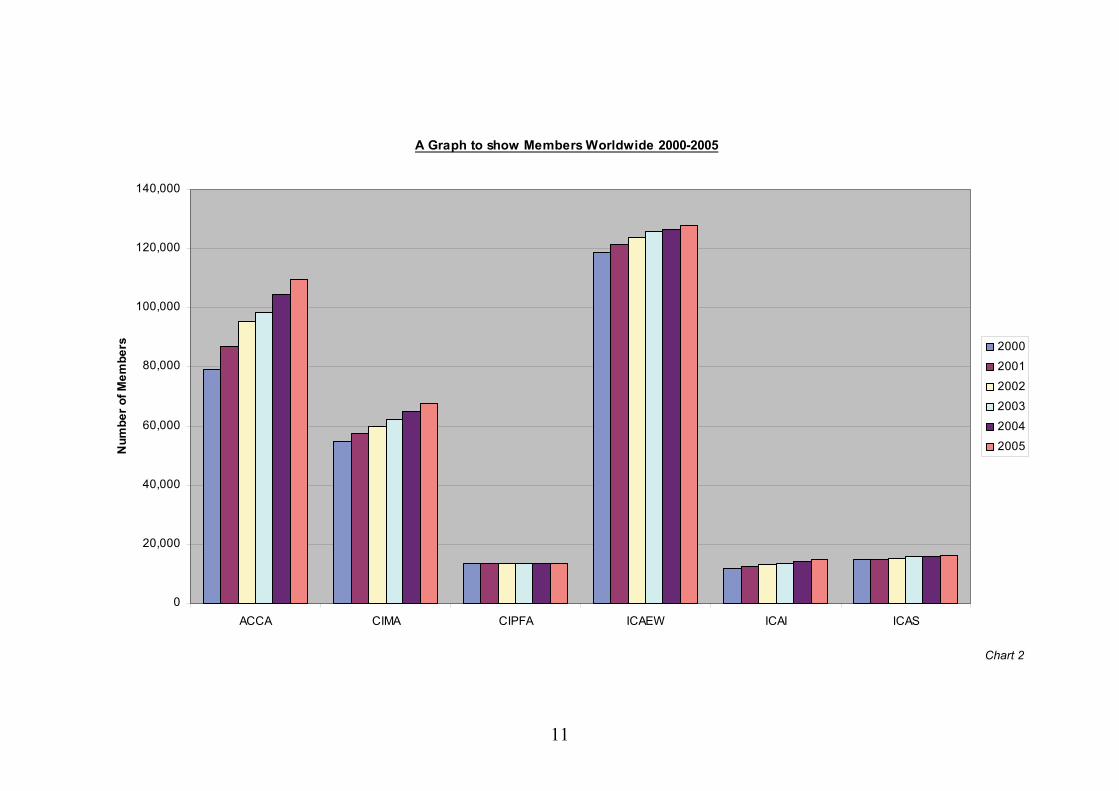
A Graph to show Members Worldwide 2000-2005
0
20,000
40,000
60,000
80,000
100,000
120,000
140,000
ACCA CIMA CIPFA ICAEW ICAI ICAS
Num
ber o
f Mem
bers 2000
2001
20022003
20042005
Chart 2
11
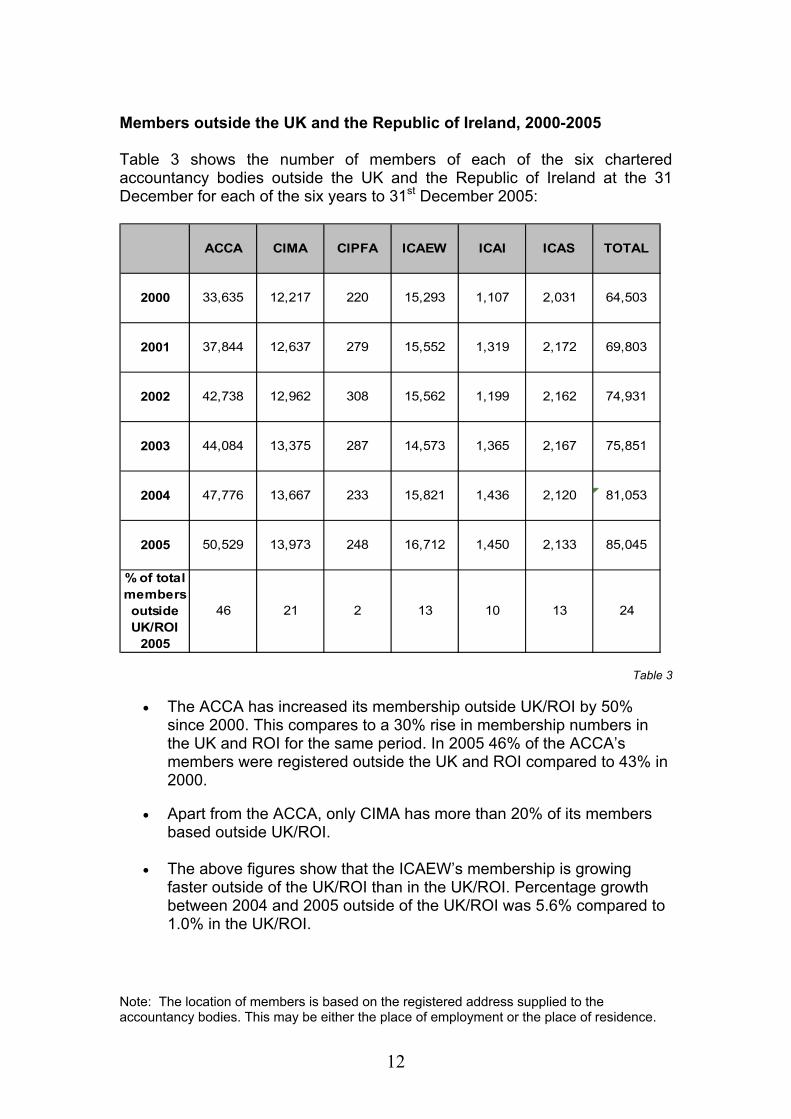
Members outside the UK and the Republic of Ireland, 2000-2005 Table 3 shows the number of members of each of the six chartered accountancy bodies outside the UK and the Republic of Ireland at the 31 December for each of the six years to 31st December 2005:
ACCA CIMA CIPFA ICAEW ICAI ICAS TOTAL
2000 33,635 12,217 220 15,293 1,107 2,031 64,503
2001 37,844 12,637 279 15,552 1,319 2,172 69,803
2002 42,738 12,962 308 15,562 1,199 2,162 74,931
2003 44,084 13,375 287 14,573 1,365 2,167 75,851
2004 47,776 13,667 233 15,821 1,436 2,120 81,053
2005 50,529 13,973 248 16,712 1,450 2,133 85,045
% of totalmembersoutside 46 21 2 13 10 13 24UK/ROI
2005
Table 3 • The ACCA has increased its membership outside UK/ROI by 50%
since 2000. This compares to a 30% rise in membership numbers in the UK and ROI for the same period. In 2005 46% of the ACCA’s members were registered outside the UK and ROI compared to 43% in 2000.
• Apart from the ACCA, only CIMA has more than 20% of its members based outside UK/ROI.
• The above figures show that the ICAEW’s membership is growing
faster outside of the UK/ROI than in the UK/ROI. Percentage growth between 2004 and 2005 outside of the UK/ROI was 5.6% compared to 1.0% in the UK/ROI.
Note: The location of members is based on the registered address supplied to the accountancy bodies. This may be either the place of employment or the place of residence.
12
13
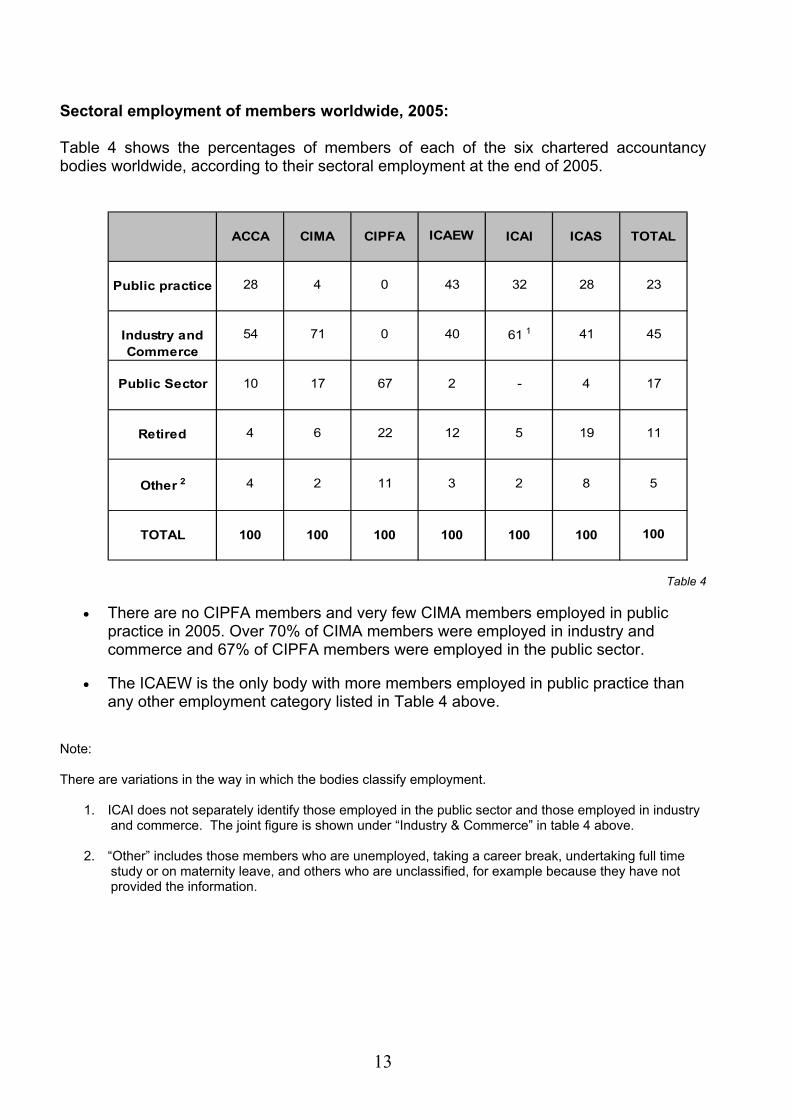
Sectoral employment of members worldwide, 2005: Table 4 shows the percentages of members of each of the six chartered accountancy bodies worldwide, according to their sectoral employment at the end of 2005.
ACCA CIMA CIPFA ICAI ICAS TOTAL
Public practice
Retired
Other 2
TOTAL 100 100 100 100 100 100
ICAEW
28 4 0 43 32 28 23
100
5 19 11
2 8 5
4 6 22 12
4 2 11 3
Industry and Commerce
54 71 0 40 61 1 41 45
Public Sector 10 17 67 2 - 4 17
Table 4
• There are no CIPFA members and very few CIMA members employed in public practice in 2005. Over 70% of CIMA members were employed in industry and commerce and 67% of CIPFA members were employed in the public sector.
• The ICAEW is the only body with more members employed in public practice than any other employment category listed in Table 4 above.
Note: There are variations in the way in which the bodies classify employment.
1. ICAI does not separately identify those employed in the public sector and those employed in industry and commerce. The joint figure is shown under “Industry & Commerce” in table 4 above.
2. “Other” includes those members who are unemployed, taking a career break, undertaking full time
study or on maternity leave, and others who are unclassified, for example because they have not provided the information.

14
Gender of members worldwide, 2000-2005: Table 5 shows the percentage of female members of each of the six chartered accountancy bodies worldwide at the 31 December for each of the six years to 31st December 2005:
2000 33 21 23 19 23 20 24
2001 35 22 24 19 25 21 25
2002 36 23 24 20 24 22 26
2003 38 24 25 21 27 23 27
2004 39 26 26 21 28 24 28
29
TOTALICAEW ICAI ICAS
29 2526 22
ACCA CIMA
2005 40 27
CIPFA
Table 5
• The percentage of female members of all six bodies has been rising in recent years.
• Taking all the bodies together the percentage of female members has risen from 24% in 2000 to 29% as at the end of 2005.
• The ACCA had the greatest percentage growth in female members from 33% in 2000 to 40% in 2005.
15
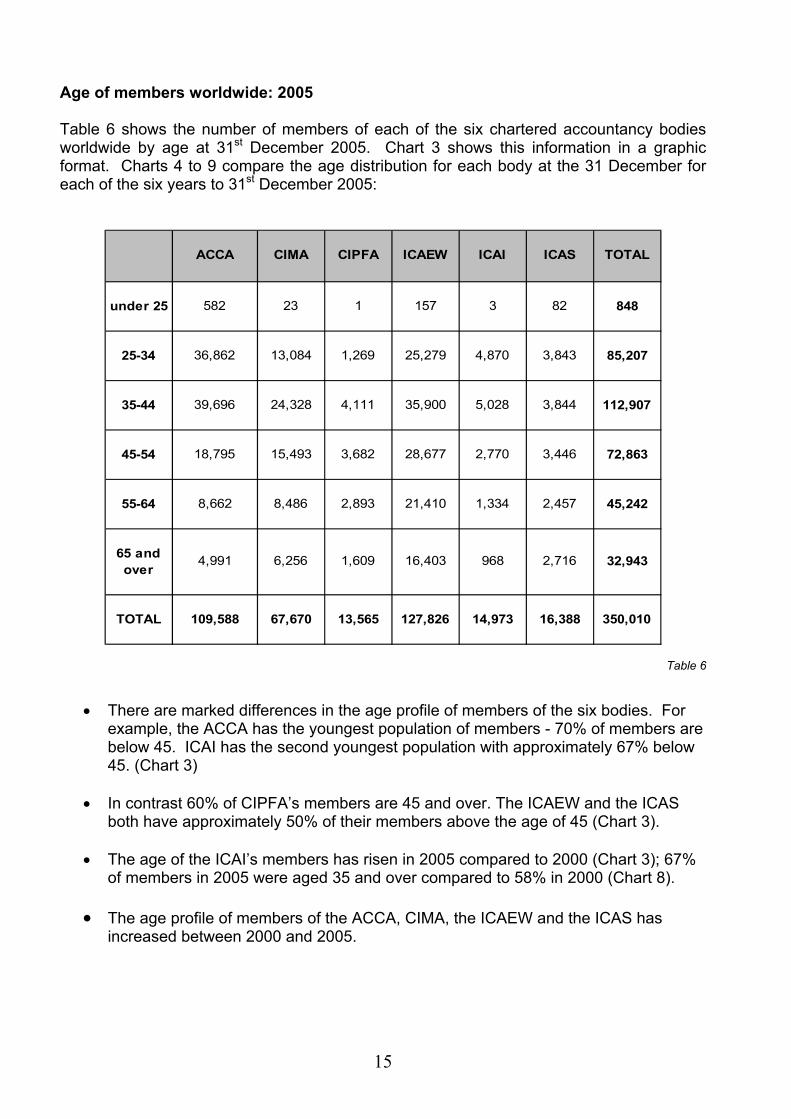
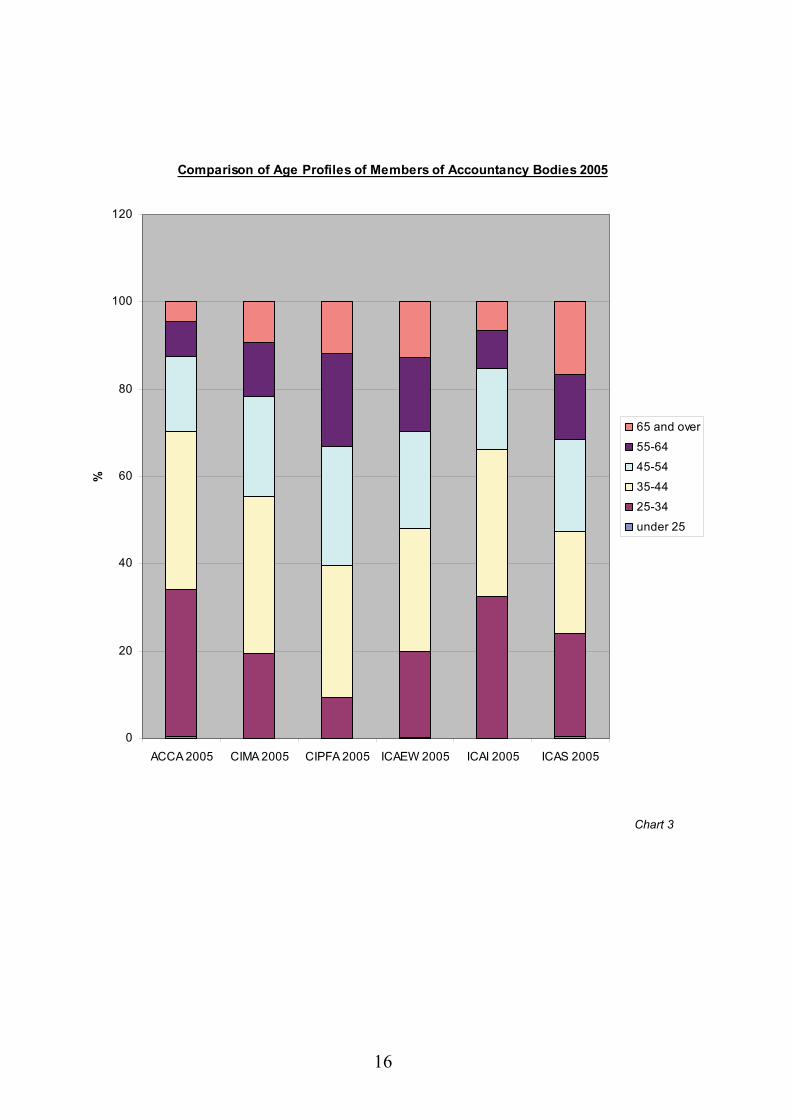
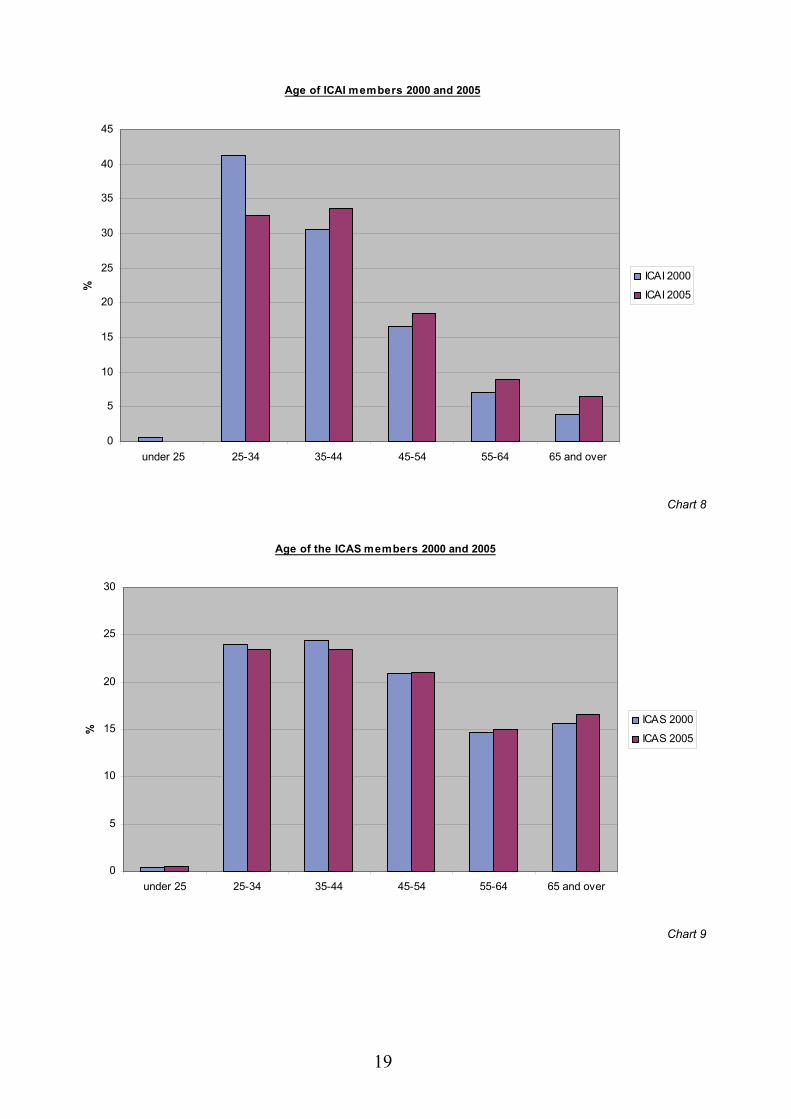
Age of members worldwide: 2005 Table 6 shows the number of members of each of the six chartered accountancy bodies worldwide by age at 31st December 2005. Chart 3 shows this information in a graphic format. Charts 4 to 9 compare the age distribution for each body at the 31 December for each of the six years to 31st December 2005:
under 25 582 23 1 157 3 82 848
25-34 36,862 13,084 1,269 25,279 4,870 3,843 85,207
35-44 39,696 24,328 4,111 35,900 5,028 3,844 112,907
45-54 18,795 15,493 3,682 28,677 2,770 3,446 72,863
55-64 8,662 8,486 2,893 21,410 1,334 2,457 45,242
65 and over
4,991 6,256 1,609 16,403 968 2,716 32,943
TOTAL 109,588 67,670 13,565 127,826 14,973 16,388 350,010
ICAEW ICAI ICAS TOTALACCA CIMA CIPFA
Table 6
• There are marked differences in the age profile of members of the six bodies. For example, the ACCA has the youngest population of members - 70% of members are below 45. ICAI has the second youngest population with approximately 67% below 45. (Chart 3)
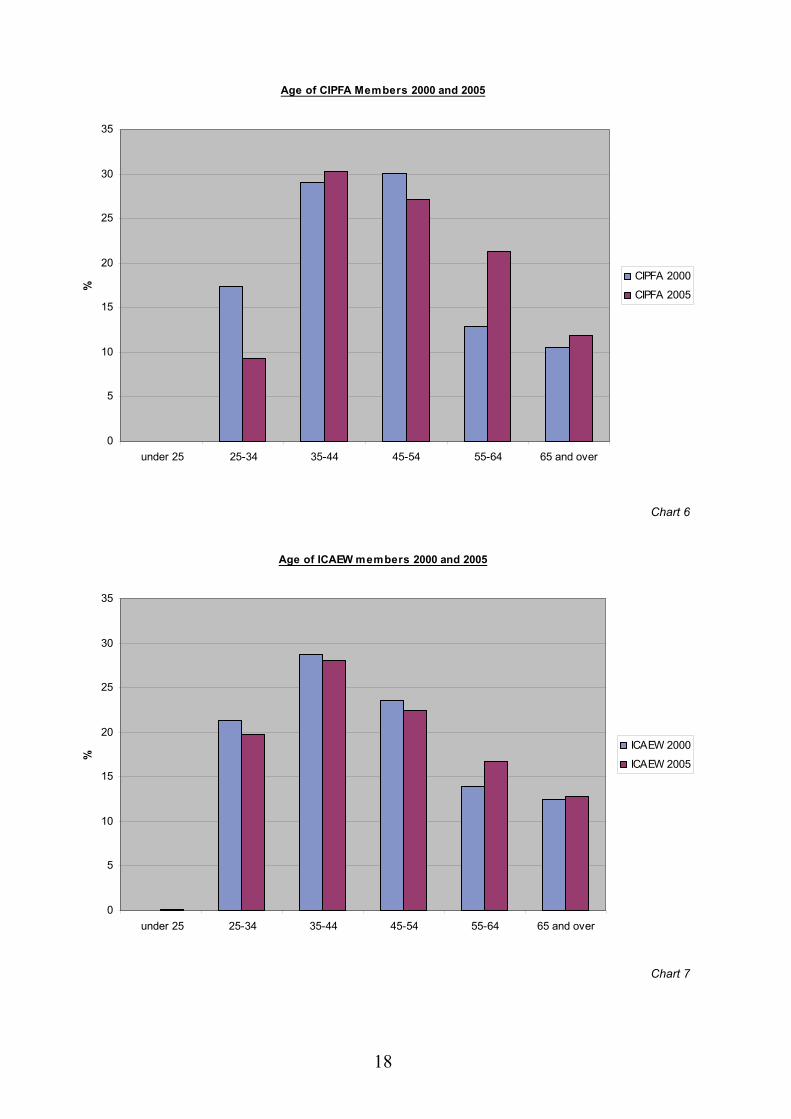
• In contrast 60% of CIPFA’s members are 45 and over. The ICAEW and the ICAS
both have approximately 50% of their members above the age of 45 (Chart 3).
• The age of the ICAI’s members has risen in 2005 compared to 2000 (Chart 3); 67% of members in 2005 were aged 35 and over compared to 58% in 2000 (Chart 8).
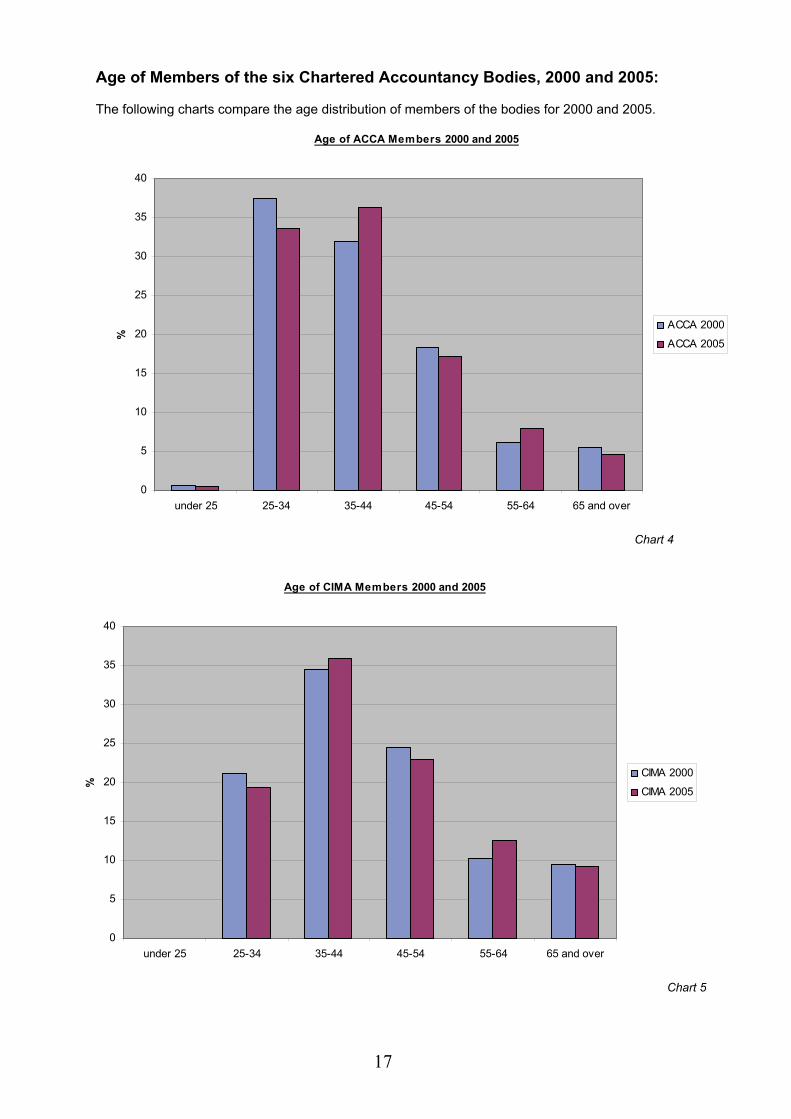
• The age profile of members of the ACCA, CIMA, the ICAEW and the ICAS has
increased between 2000 and 2005.
16
Comparison of Age Profiles of Members of Accountancy Bodies 2005
0
20
40
60
80
100
120
ACCA 2005 CIMA 2005 CIPFA 2005 ICAEW 2005 ICAI 2005 ICAS 2005
%
65 and over
55-6445-54
35-4425-34
under 25
Chart 3
17
Age of Members of the six Chartered Accountancy Bodies, 2000 and 2005:
The following charts compare the age distribution of members of the bodies for 2000 and 2005.
Age of ACCA Members 2000 and 2005
0
5
10
15
20
25
30
35
40
under 25 25-34 35-44 45-54 55-64 65 and over
%
ACCA 2000
ACCA 2005
Chart 4
Age of CIMA Members 2000 and 2005
0
5
10
15
20
25
30
35
40
under 25 25-34 35-44 45-54 55-64 65 and over
%
CIMA 2000
CIMA 2005
Chart 5
18
Age of CIPFA Members 2000 and 2005
0
5
10
15
20
25
30
35
under 25 25-34 35-44 45-54 55-64 65 and over
%
CIPFA 2000
CIPFA 2005
Chart 6
Age of ICAEW members 2000 and 2005
0
5
10
15
20
25
30
35
under 25 25-34 35-44 45-54 55-64 65 and over
%
ICAEW 2000
ICAEW 2005
Chart 7
19
Age of ICAI members 2000 and 2005
0
5
10
15
20
25
30
35
40
45
under 25 25-34 35-44 45-54 55-64 65 and over
%
ICAI 2000
ICAI 2005
Chart 8
Age of the ICAS members 2000 and 2005
0
5
10
15
20
25
30
under 25 25-34 35-44 45-54 55-64 65 and over
%
ICAS 2000
ICAS 2005
Chart 9

20

21
STUDENTS OF THE
ACCOUNTANCY BODIES
22
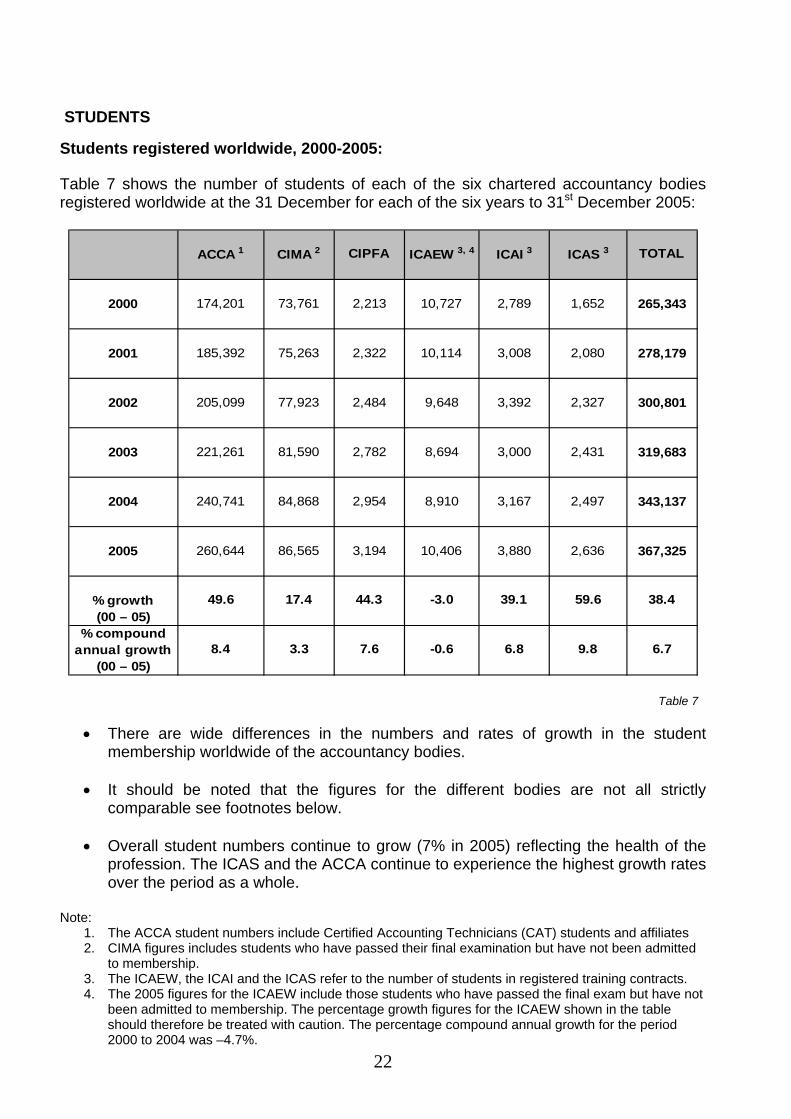
STUDENTS Students registered worldwide, 2000-2005: Table 7 shows the number of students of each of the six chartered accountancy bodies registered worldwide at the 31 December for each of the six years to 31st December 2005:
2000 174,201 73,761 2,213 10,727 2,789 1,652 265,343
2001 185,392 75,263 2,322 10,114 3,008 2,080 278,179
2002 205,099 77,923 2,484 9,648 3,392 2,327 300,801
2003 221,261 81,590 2,782 8,694 3,000 2,431 319,683
2004 240,741 84,868 2,954 8,910 3,167 2,497 343,137
2005 260,644 86,565 3,194 10,406 3,880 2,636 367,325
% growth(00 – 05)
% compoundannual growth
(00 – 05)
ICAEW 3, 4 ICAI 3 ICAS 3 TOTALACCA 1 CIMA 2 CIPFA
39.1 59.6 38.4
8.4 3.3 7.6 -0.6 6.8 9.8 6.7
49.6 17.4 44.3 -3.0
Table 7
• There are wide differences in the numbers and rates of growth in the student membership worldwide of the accountancy bodies.
• It should be noted that the figures for the different bodies are not all strictly
comparable see footnotes below. • Overall student numbers continue to grow (7% in 2005) reflecting the health of the
profession. The ICAS and the ACCA continue to experience the highest growth rates over the period as a whole.
Note:
1. The ACCA student numbers include Certified Accounting Technicians (CAT) students and affiliates 2. CIMA figures includes students who have passed their final examination but have not been admitted
to membership. 3. The ICAEW, the ICAI and the ICAS refer to the number of students in registered training contracts. 4. The 2005 figures for the ICAEW include those students who have passed the final exam but have not
been admitted to membership. The percentage growth figures for the ICAEW shown in the table should therefore be treated with caution. The percentage compound annual growth for the period 2000 to 2004 was –4.7%.
23
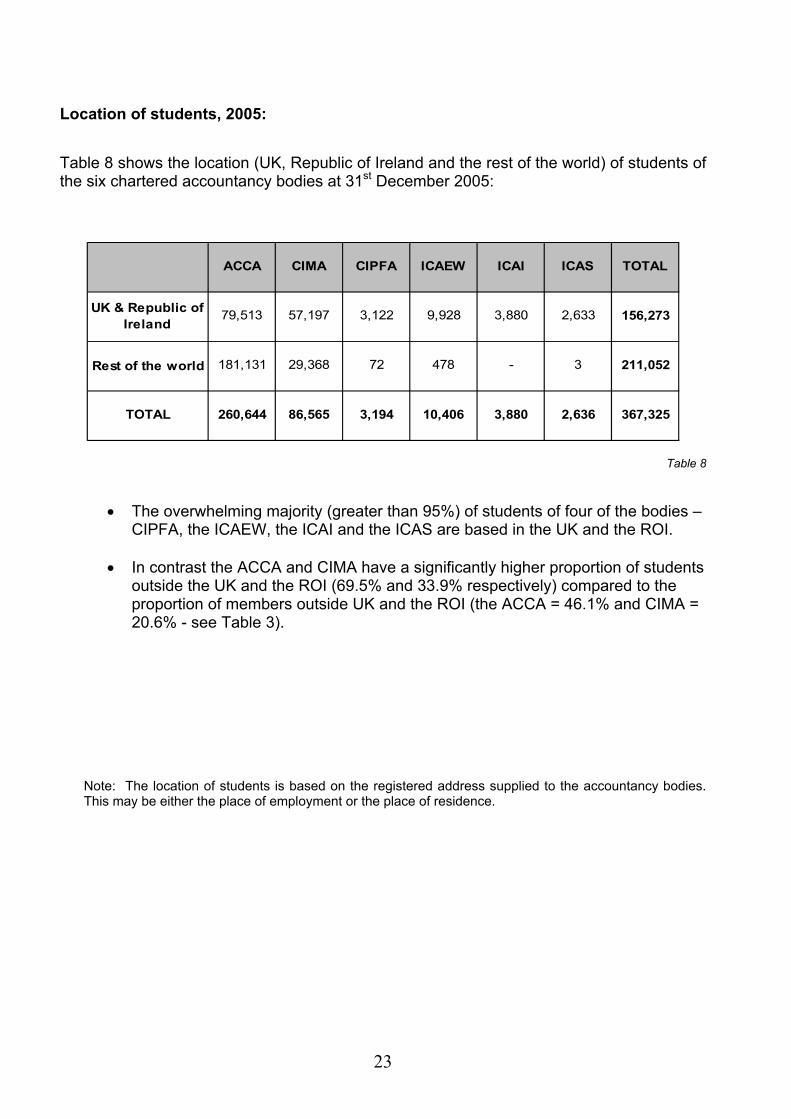
Location of students, 2005: Table 8 shows the location (UK, Republic of Ireland and the rest of the world) of students of the six chartered accountancy bodies at 31st December 2005:
Rest of the world
UK & Republic of Ireland
181,131 29,368
ICAEW ICAI ICAS TOTALACCA CIMA CIPFA
367,325
3,880 2,633 156,273
- 3 211,052
TOTAL 260,644 86,565 3,194 10,406 3,880 2,636
79,513 57,197 3,122 9,928
72 478
Table 8
• The overwhelming majority (greater than 95%) of students of four of the bodies – CIPFA, the ICAEW, the ICAI and the ICAS are based in the UK and the ROI.
• In contrast the ACCA and CIMA have a significantly higher proportion of students outside the UK and the ROI (69.5% and 33.9% respectively) compared to the proportion of members outside UK and the ROI (the ACCA = 46.1% and CIMA = 20.6% - see Table 3).
Note: The location of students is based on the registered address supplied to the accountancy bodies. This may be either the place of employment or the place of residence.
24
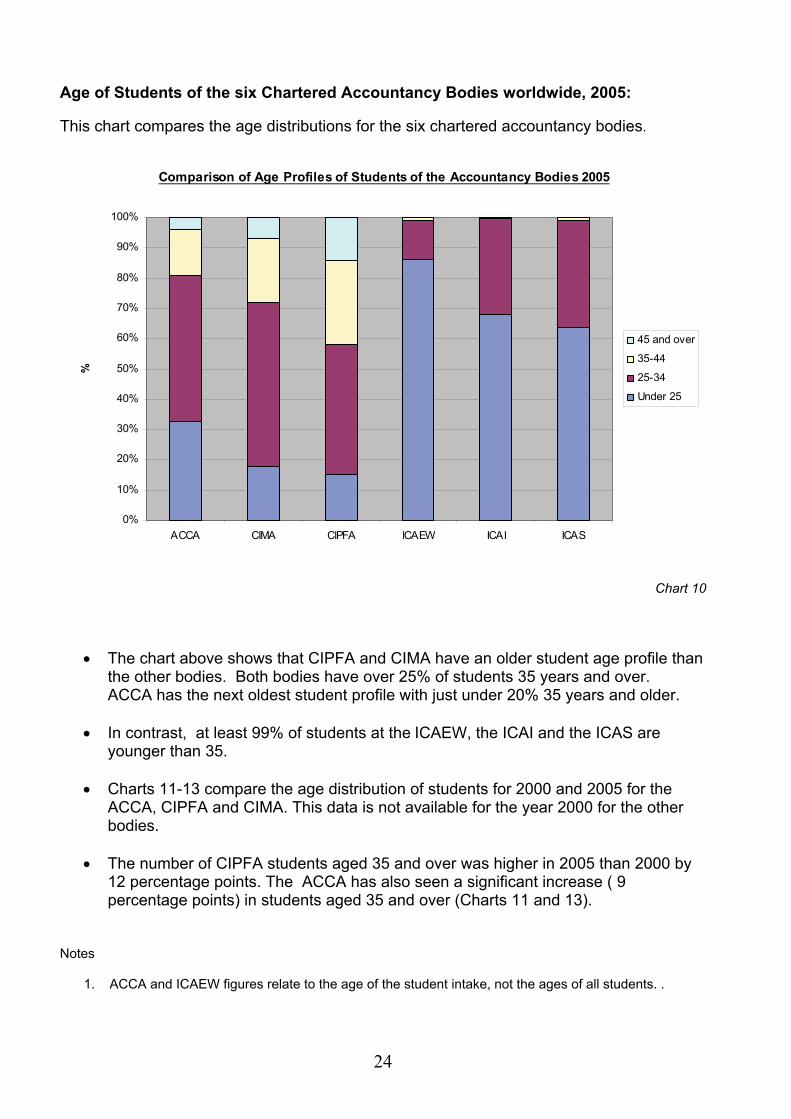
Age of Students of the six Chartered Accountancy Bodies worldwide, 2005: This chart compares the age distributions for the six chartered accountancy bodies.
Comparison of Age Profiles of Students of the Accountancy Bodies 2005
0%
10%
20%
30%
40%
50%
60%
70%
80%
90%
100%
ACCA CIMA CIPFA ICAEW ICAI ICAS
%
45 and over
35-44
25-34
Under 25
Chart 10
• The chart above shows that CIPFA and CIMA have an older student age profile than the other bodies. Both bodies have over 25% of students 35 years and over. ACCA has the next oldest student profile with just under 20% 35 years and older.
• In contrast, at least 99% of students at the ICAEW, the ICAI and the ICAS are
younger than 35.
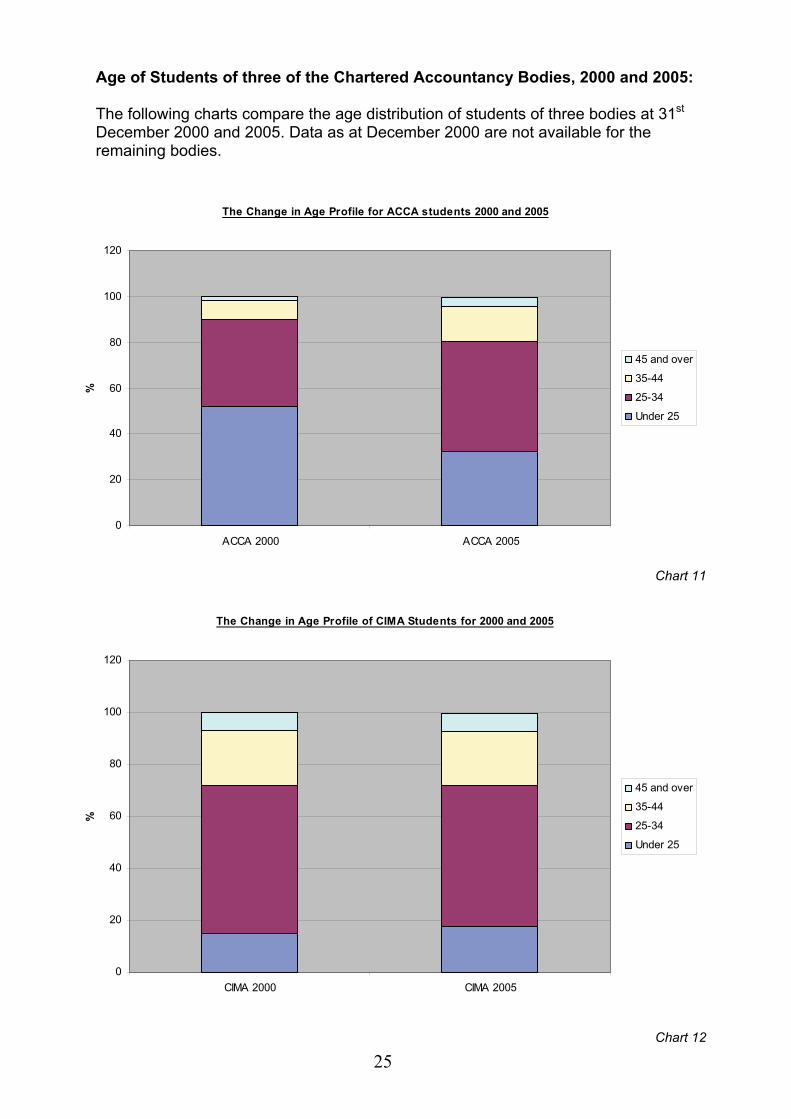
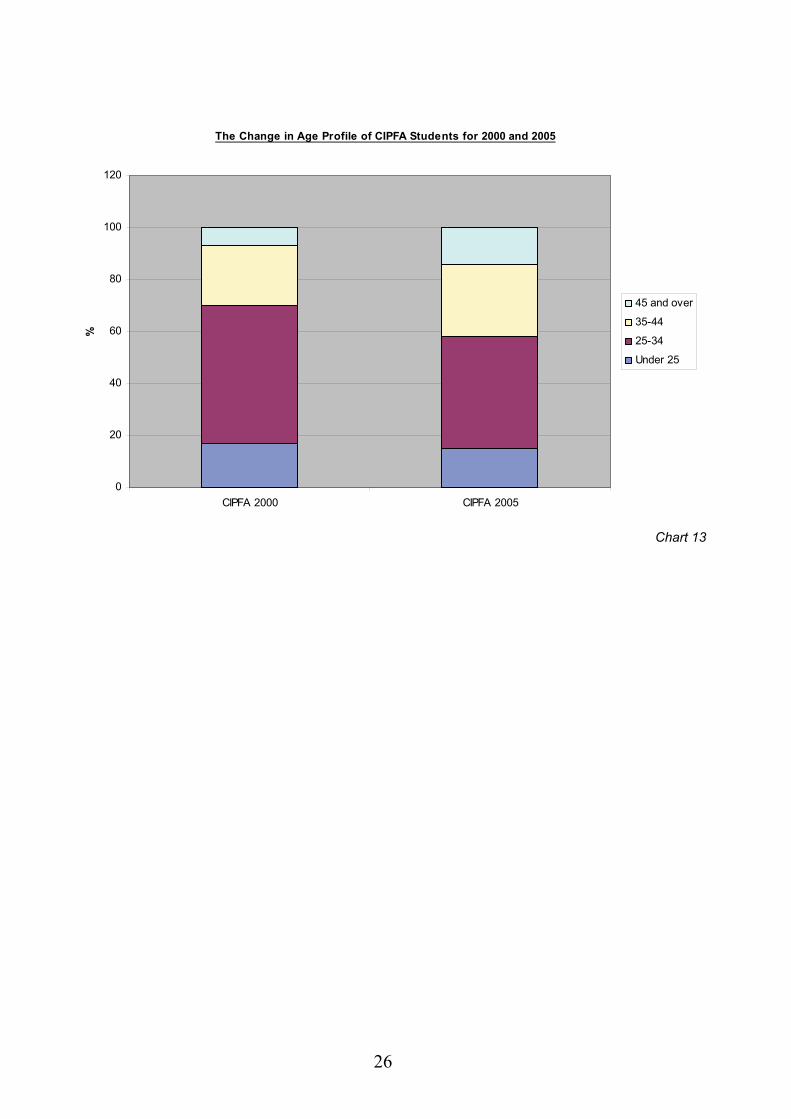
• Charts 11-13 compare the age distribution of students for 2000 and 2005 for the ACCA, CIPFA and CIMA. This data is not available for the year 2000 for the other bodies.
• The number of CIPFA students aged 35 and over was higher in 2005 than 2000 by
12 percentage points. The ACCA has also seen a significant increase ( 9 percentage points) in students aged 35 and over (Charts 11 and 13).
Notes 1. ACCA and ICAEW figures relate to the age of the student intake, not the ages of all students. .
25
Age of Students of three of the Chartered Accountancy Bodies, 2000 and 2005:
The following charts compare the age distribution of students of three bodies at 31st December 2000 and 2005. Data as at December 2000 are not available for the remaining bodies.
The Change in Age Profile for ACCA students 2000 and 2005
0
20
40
60
80
100
120
ACCA 2000 ACCA 2005
%
45 and over
35-44
25-34
Under 25
Chart 11
The Change in Age Profile of CIMA Students for 2000 and 2005
0
20
40
60
80
100
120
CIMA 2000 CIMA 2005
%
45 and over
35-44
25-34
Under 25
Chart 12
26
The Change in Age Profile of CIPFA Students for 2000 and 2005
0
20
40
60
80
100
120
CIPFA 2000 CIPFA 2005
%
45 and over
35-44
25-34
Under 25
Chart 13
27
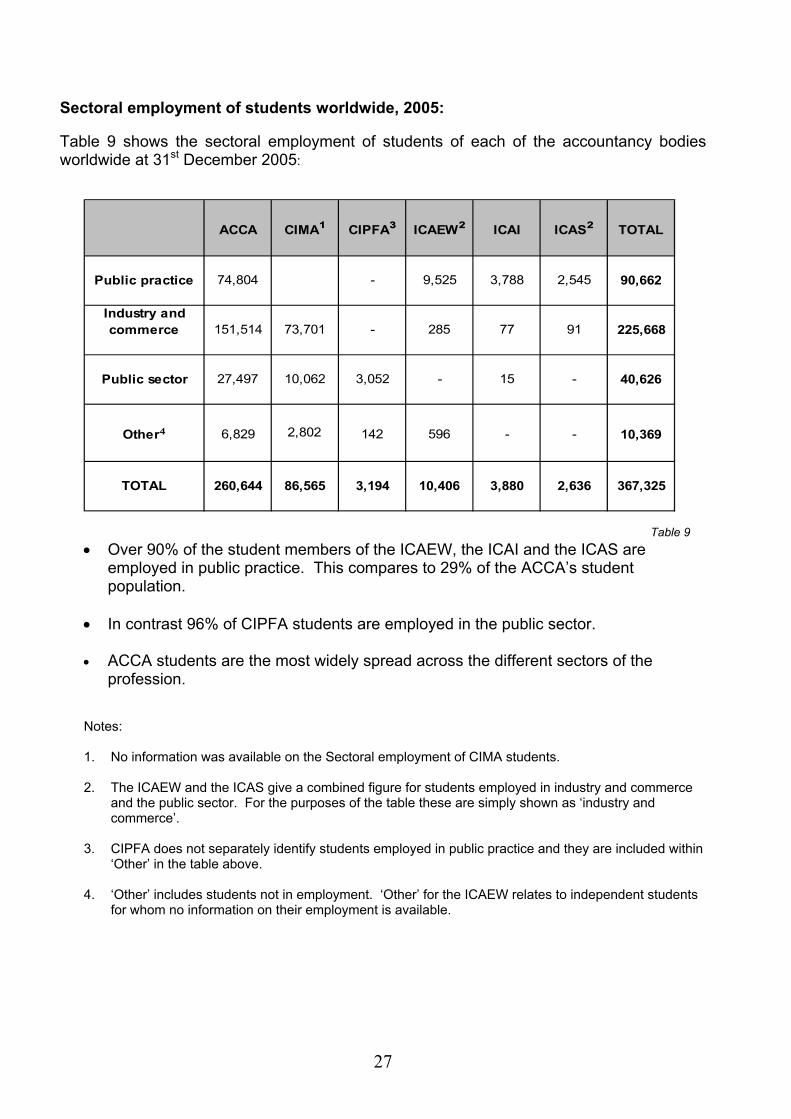
Sectoral employment of students worldwide, 2005: Table 9 shows the sectoral employment of students of each of the accountancy bodies worldwide at 31st December 2005:
ACCA CIMA¹ CIPFA³ ICAEW² ICAI ICAS² TOTAL
Public practice 74,804 - 9,525 3,788 2,545 90,662
Industry andcommerce 151,514 73,701 - 285 77 91 225,668
Public sector 27,497 10,062 3,052 - 15 - 40,626
Other⁴ 6,829 2,802 142 596 - - 10,369
TOTAL 260,644 86,565 3,194 10,406 3,880 2,636 367,325
Table 9
• Over 90% of the student members of the ICAEW, the ICAI and the ICAS are employed in public practice. This compares to 29% of the ACCA’s student population.
• In contrast 96% of CIPFA students are employed in the public sector.
• ACCA students are the most widely spread across the different sectors of the profession.
Notes: 1. No information was available on the Sectoral employment of CIMA students. 2. The ICAEW and the ICAS give a combined figure for students employed in industry and commerce
and the public sector. For the purposes of the table these are simply shown as ‘industry and commerce’.
3. CIPFA does not separately identify students employed in public practice and they are included within
‘Other’ in the table above.
4. ‘Other’ includes students not in employment. ‘Other’ for the ICAEW relates to independent students for whom no information on their employment is available.
28
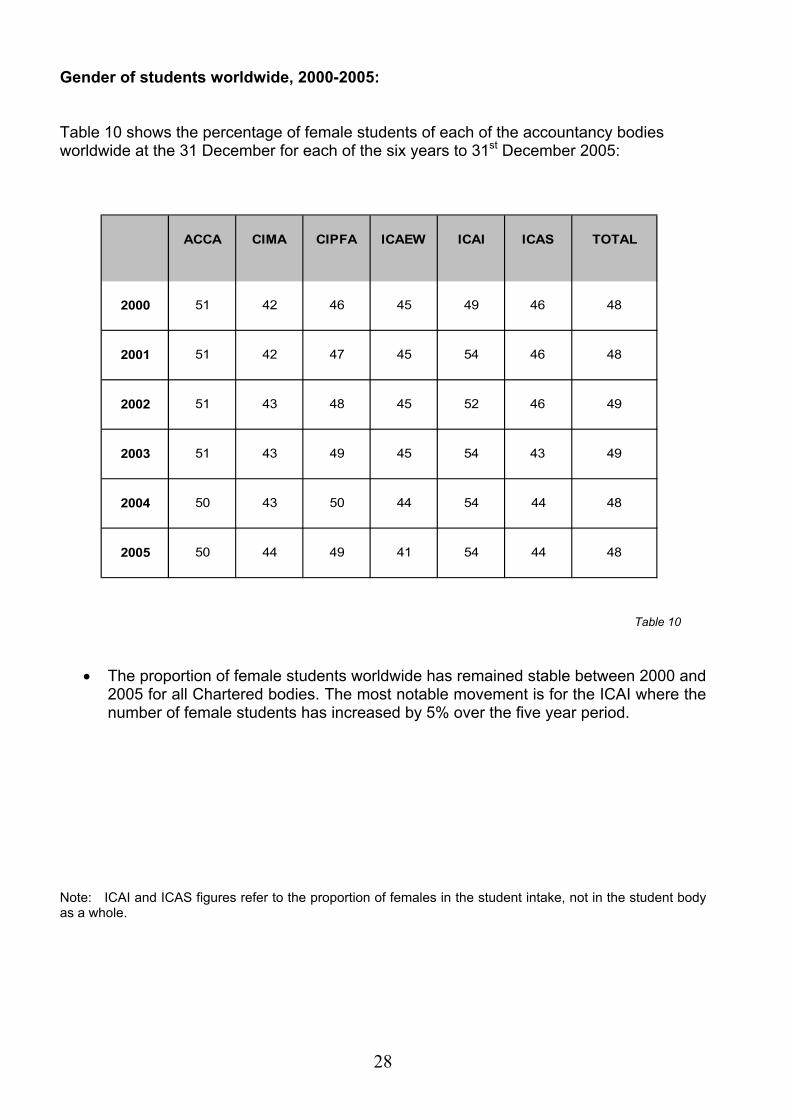
Gender of students worldwide, 2000-2005: Table 10 shows the percentage of female students of each of the accountancy bodies worldwide at the 31 December for each of the six years to 31st December 2005:
ACCA CIMA CIPFA ICAEW ICAI ICAS TOTAL
2000 51 42 46 45 49 46 48
2001 51 42 47 45 54 46 48
2002 51 43 48 45 52 46 49
2003 51 43 49 45 54 43 49
2004 50 43 50 44 54 44 48
2005 50 44 49 41 54 44 48
Table 10
• The proportion of female students worldwide has remained stable between 2000 and 2005 for all Chartered bodies. The most notable movement is for the ICAI where the number of female students has increased by 5% over the five year period.
Note: ICAI and ICAS figures refer to the proportion of females in the student intake, not in the student body as a whole.
29
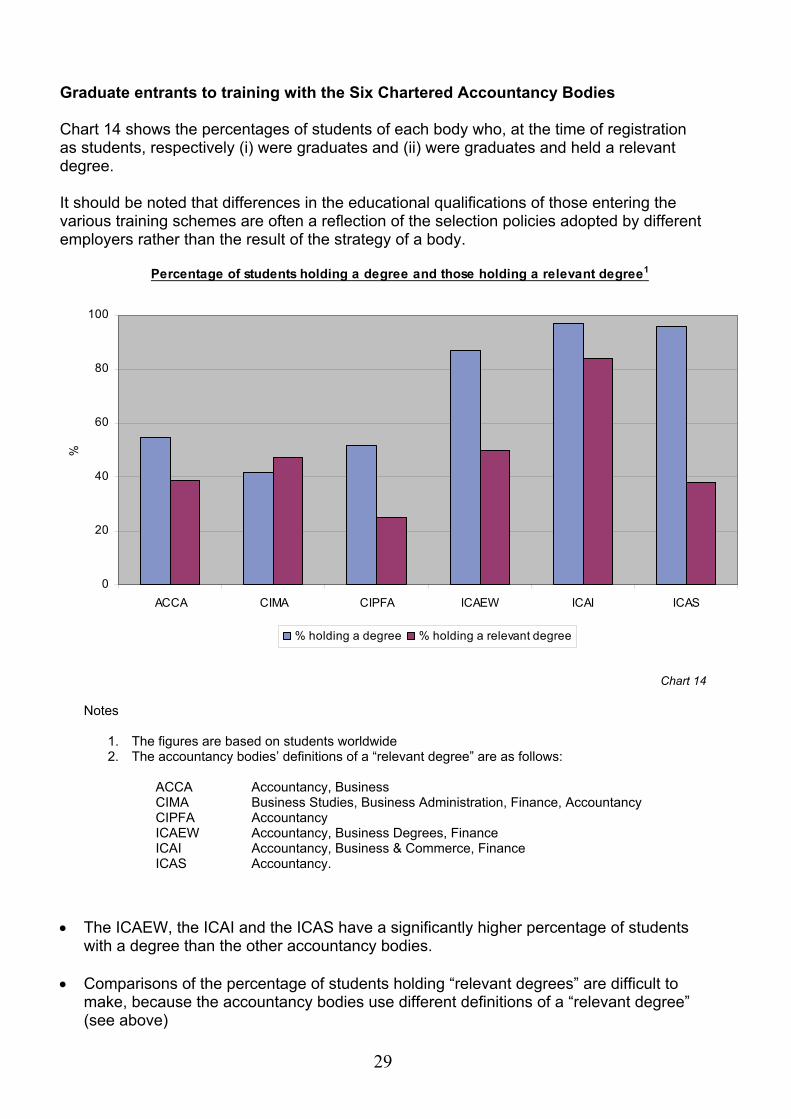
Graduate entrants to training with the Six Chartered Accountancy Bodies Chart 14 shows the percentages of students of each body who, at the time of registration as students, respectively (i) were graduates and (ii) were graduates and held a relevant degree. It should be noted that differences in the educational qualifications of those entering the various training schemes are often a reflection of the selection policies adopted by different employers rather than the result of the strategy of a body.
Percentage of students holding a degree and those holding a relevant degree1
0
20
40
60
80
100
ACCA CIMA CIPFA ICAEW ICAI ICAS
%
% holding a degree % holding a relevant degree
Chart 14
Notes
1. The figures are based on students worldwide 2. The accountancy bodies’ definitions of a “relevant degree” are as follows:
ACCA Accountancy, Business
CIMA Business Studies, Business Administration, Finance, Accountancy CIPFA Accountancy ICAEW Accountancy, Business Degrees, Finance ICAI Accountancy, Business & Commerce, Finance
ICAS Accountancy.
• The ICAEW, the ICAI and the ICAS have a significantly higher percentage of students
with a degree than the other accountancy bodies.
• Comparisons of the percentage of students holding “relevant degrees” are difficult to make, because the accountancy bodies use different definitions of a “relevant degree” (see above)
30
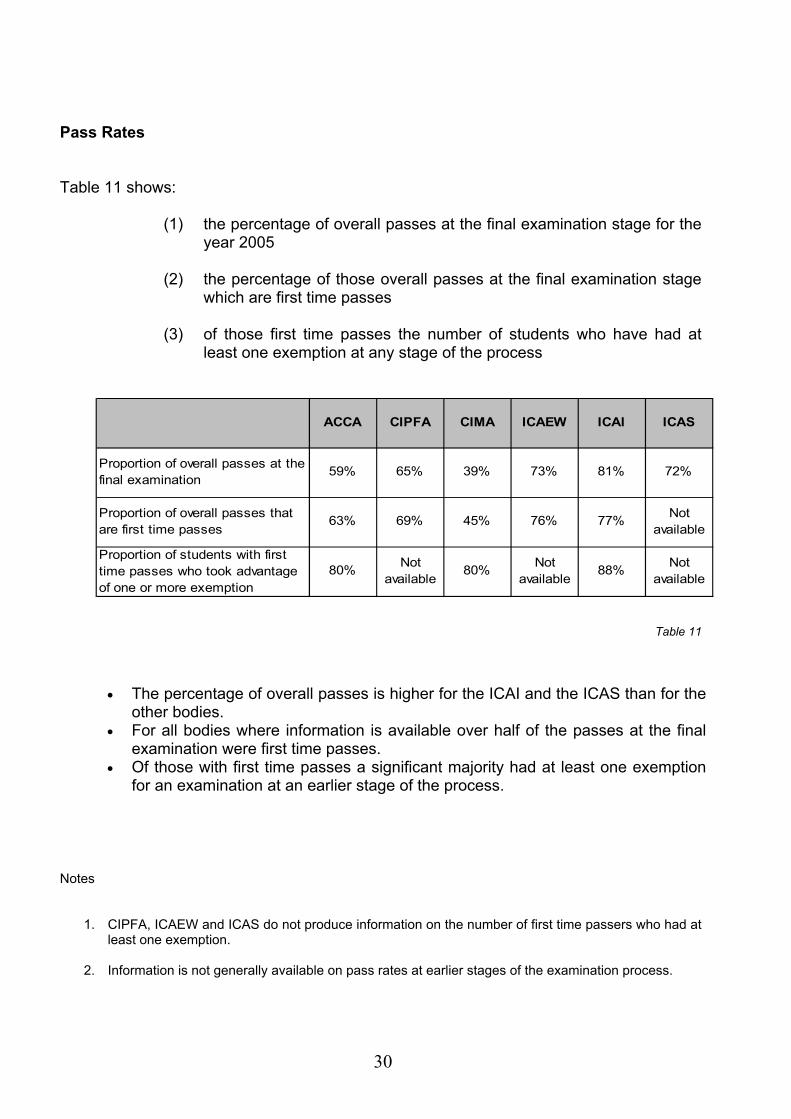
Pass Rates Table 11 shows:
(1) the percentage of overall passes at the final examination stage for the year 2005
(2) the percentage of those overall passes at the final examination stage
which are first time passes
(3) of those first time passes the number of students who have had at least one exemption at any stage of the process
ACCA CIPFA CIMA ICAEW ICAI ICAS
Proportion of overall passes at the final examination
59% 65% 39% 73% 81% 72%
Proportion of overall passes that are first time passes
Proportion of students with first time passes who took advantage of one or more exemption
63%
80%
69%
Not available
45%
80%
Not available
Not available
76%
Not available
77%
88%
Table 11
• The percentage of overall passes is higher for the ICAI and the ICAS than for the other bodies.
• For all bodies where information is available over half of the passes at the final examination were first time passes.
• Of those with first time passes a significant majority had at least one exemption for an examination at an earlier stage of the process.
Notes
1. CIPFA, ICAEW and ICAS do not produce information on the number of first time passers who had at
least one exemption.
2. Information is not generally available on pass rates at earlier stages of the examination process.
31
OTHER INFORMATION ON THE SIX
CHARTERED ACCOUNTANCY BODIES
32
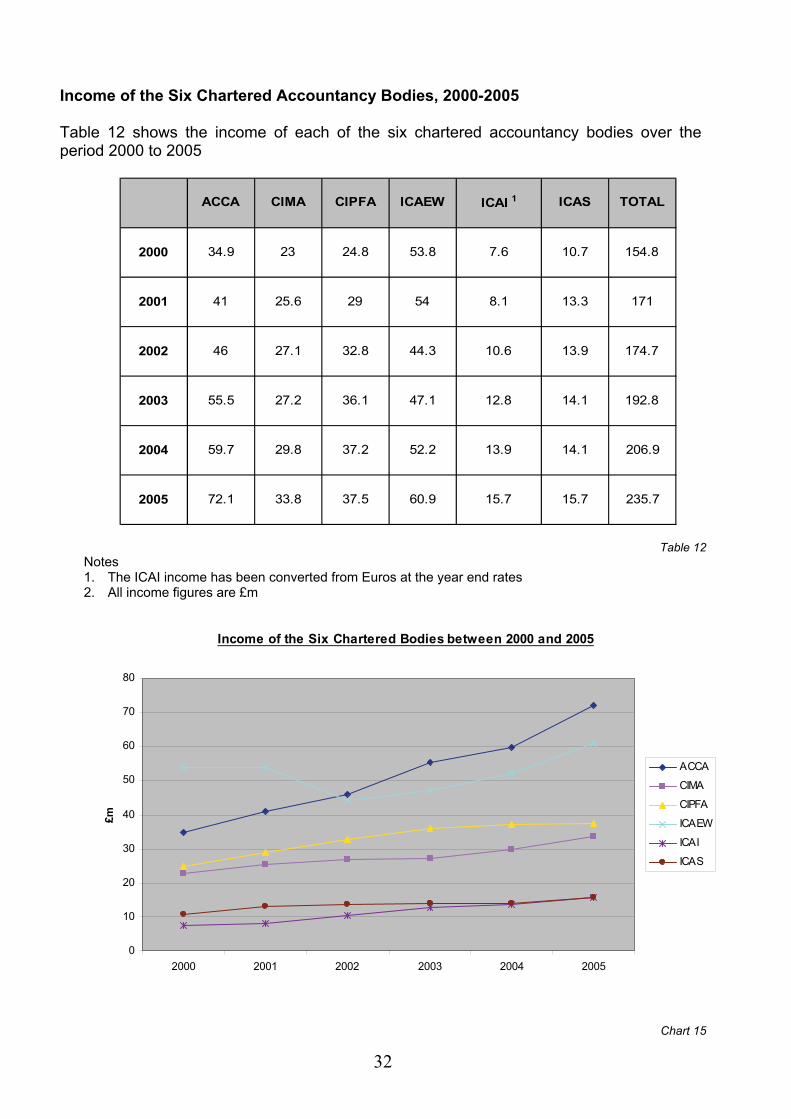
Income of the Six Chartered Accountancy Bodies, 2000-2005 Table 12 shows the income of each of the six chartered accountancy bodies over the period 2000 to 2005
2000 34.9 23 24.8 53.8 7.6 10.7 154.8
2001 41 25.6 29 54 8.1 13.3 171
2002 46 27.1 32.8 44.3 10.6 13.9 174.7
2003 55.5 27.2 36.1 47.1 12.8 14.1 192.8
2004 59.7 29.8 37.2 52.2 13.9 14.1 206.9
2005 72.1 33.8 37.5 60.9 15.7 15.7 235.7
ICAEW ICAI 1 ICAS TOTALACCA CIMA CIPFA
Table 12 Notes 1. The ICAI income has been converted from Euros at the year end rates 2. All income figures are £m
Income of the Six Chartered Bodies between 2000 and 2005
0
10
20
30
40
50
60
70
80
2000 2001 2002 2003 2004 2005
£m
ACCA
CIMA
CIPFA
ICAEW
ICAI
ICAS
Chart 15
33
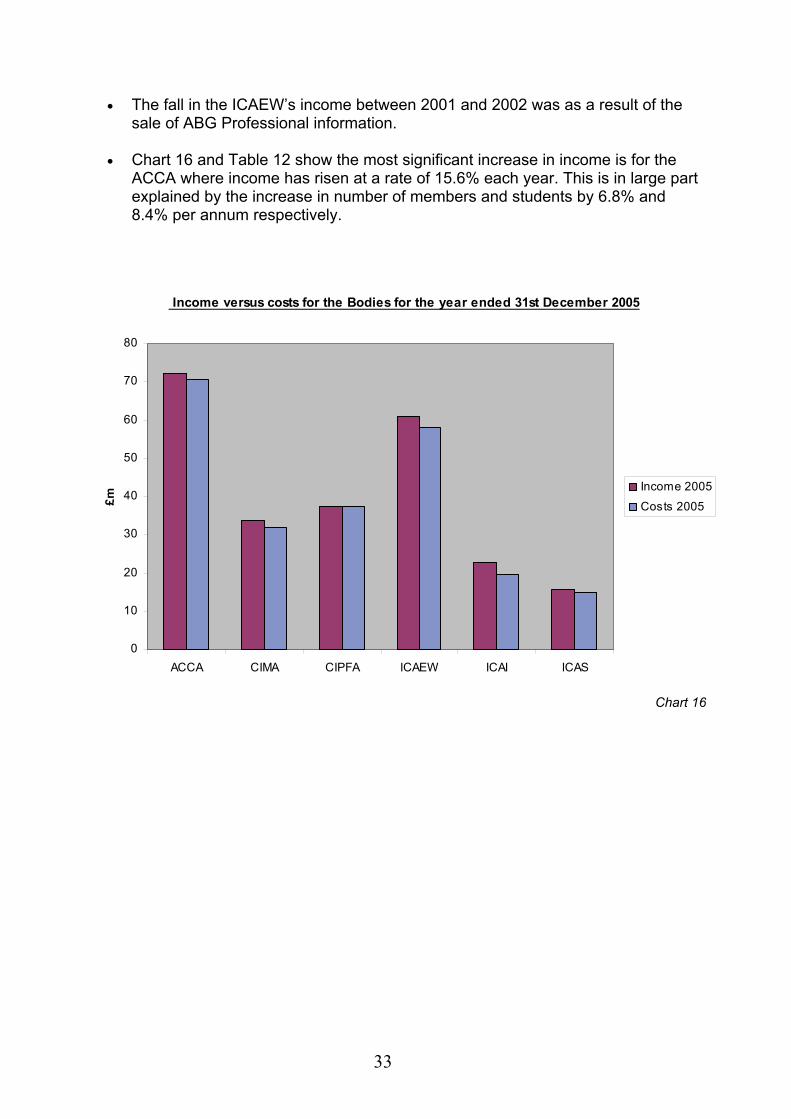
• The fall in the ICAEW’s income between 2001 and 2002 was as a result of the sale of ABG Professional information.
• Chart 16 and Table 12 show the most significant increase in income is for the
ACCA where income has risen at a rate of 15.6% each year. This is in large part explained by the increase in number of members and students by 6.8% and 8.4% per annum respectively.
Income versus costs for the Bodies for the year ended 31st December 2005
0
10
20
30
40
50
60
70
80
ACCA CIMA CIPFA ICAEW ICAI ICAS
£m
Income 2005
Costs 2005
Chart 16
34
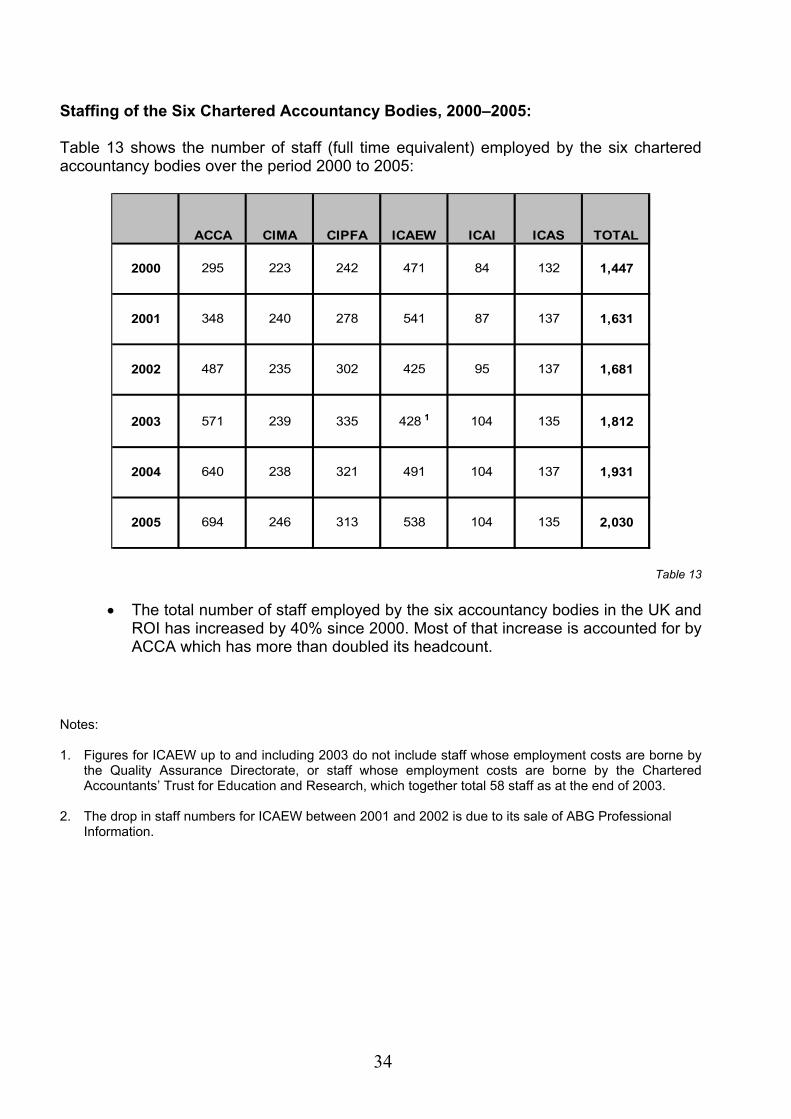
Staffing of the Six Chartered Accountancy Bodies, 2000–2005: Table 13 shows the number of staff (full time equivalent) employed by the six chartered accountancy bodies over the period 2000 to 2005:
2000 295 223 242 471 84 132 1,447
2001 348 240 278 541 87 137 1,631
2002 487 235 302 425 95 137 1,681
2003 571 239 335 428 1 104 135 1,812
2004 640 238 321 491 104 137 1,931
2005 694 246 313 538 104 135 2,030
ICAEW ICAI ICAS TOTALACCA CIMA CIPFA
Table 13
• The total number of staff employed by the six accountancy bodies in the UK and ROI has increased by 40% since 2000. Most of that increase is accounted for by ACCA which has more than doubled its headcount.
Notes: 1. Figures for ICAEW up to and including 2003 do not include staff whose employment costs are borne by
the Quality Assurance Directorate, or staff whose employment costs are borne by the Chartered Accountants’ Trust for Education and Research, which together total 58 staff as at the end of 2003.
2. The drop in staff numbers for ICAEW between 2001 and 2002 is due to its sale of ABG Professional
Information.

35
AUDIT FIRMS
36
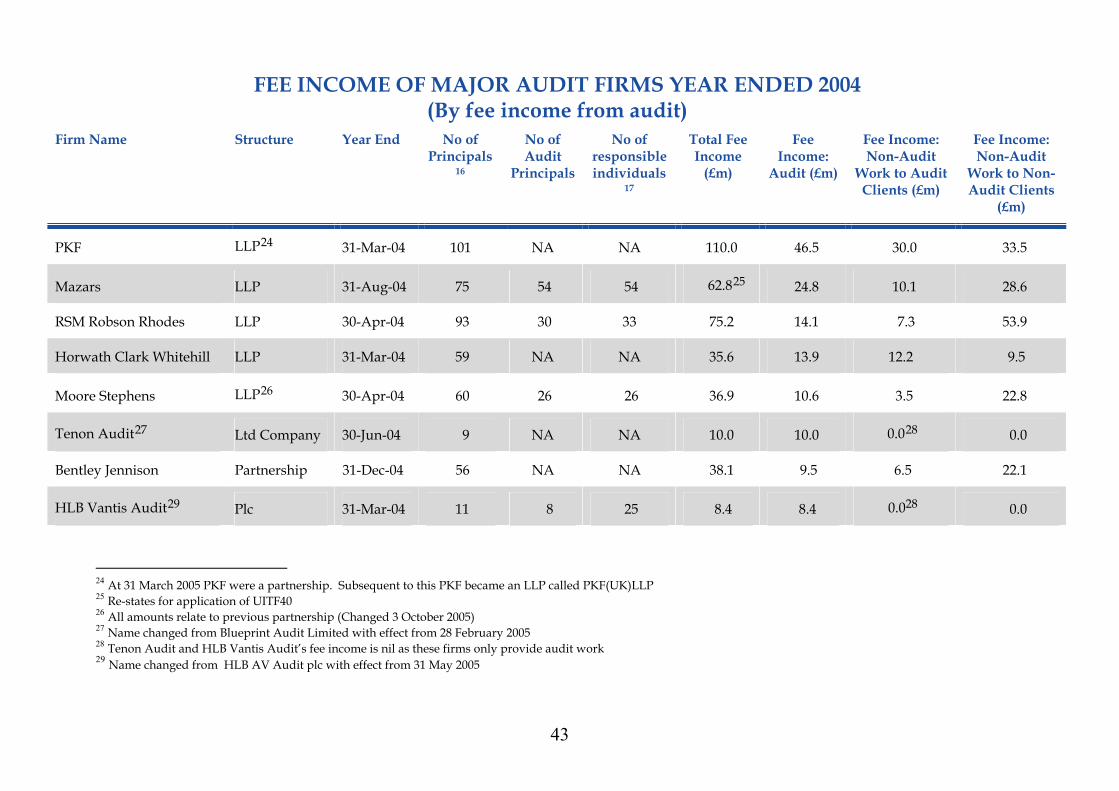
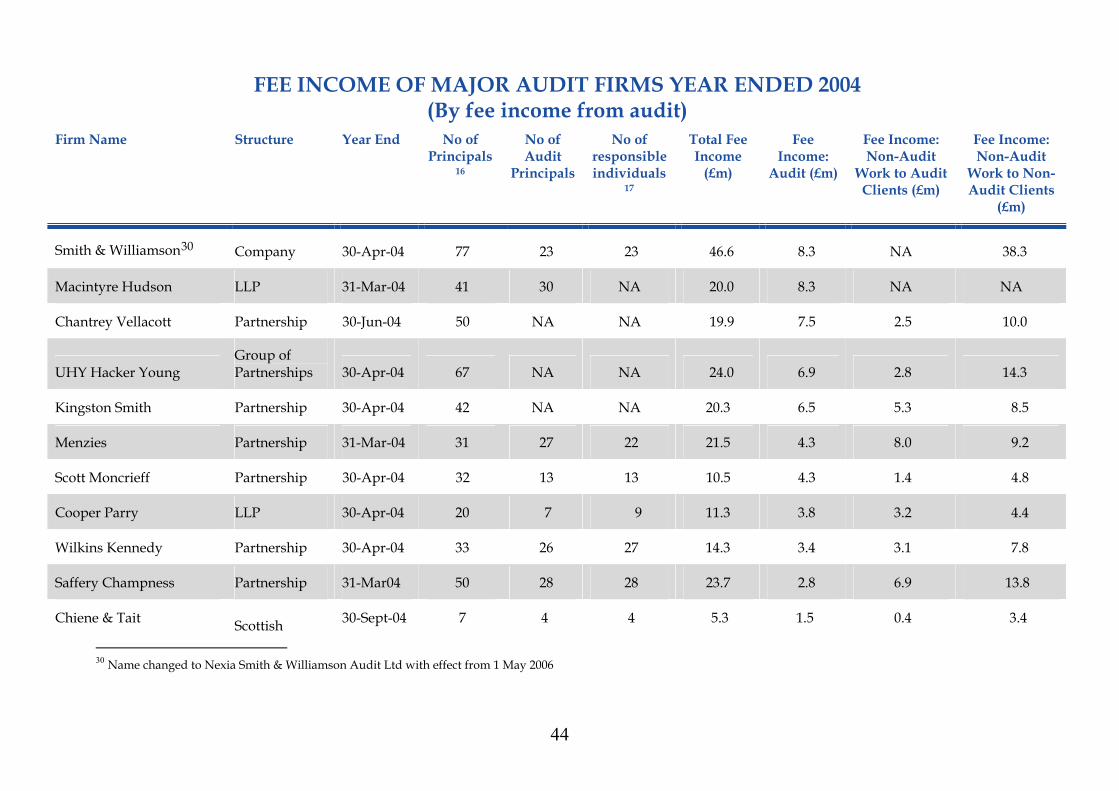
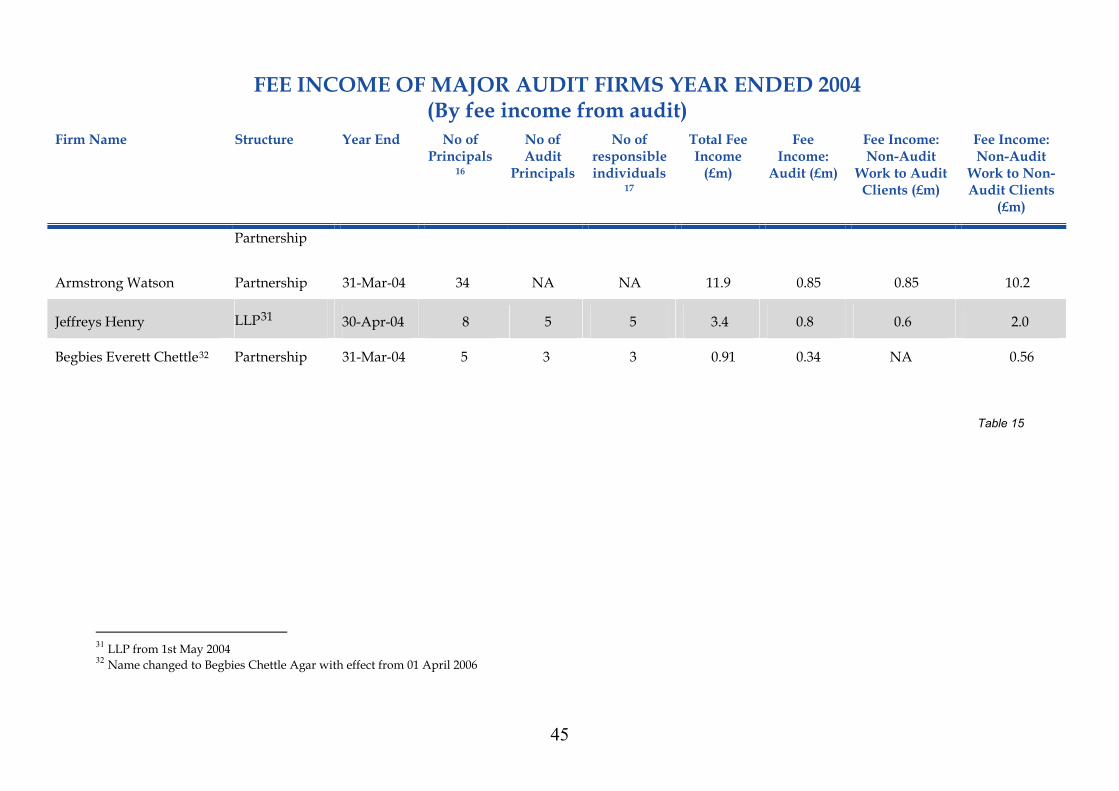
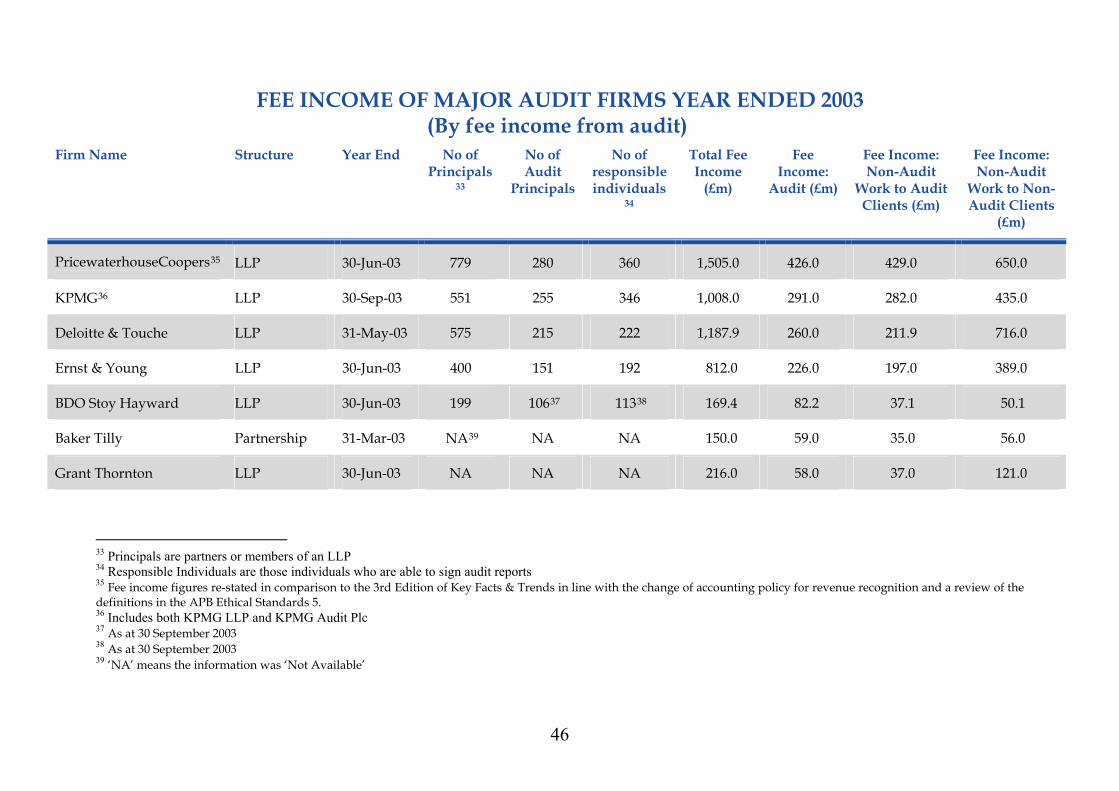
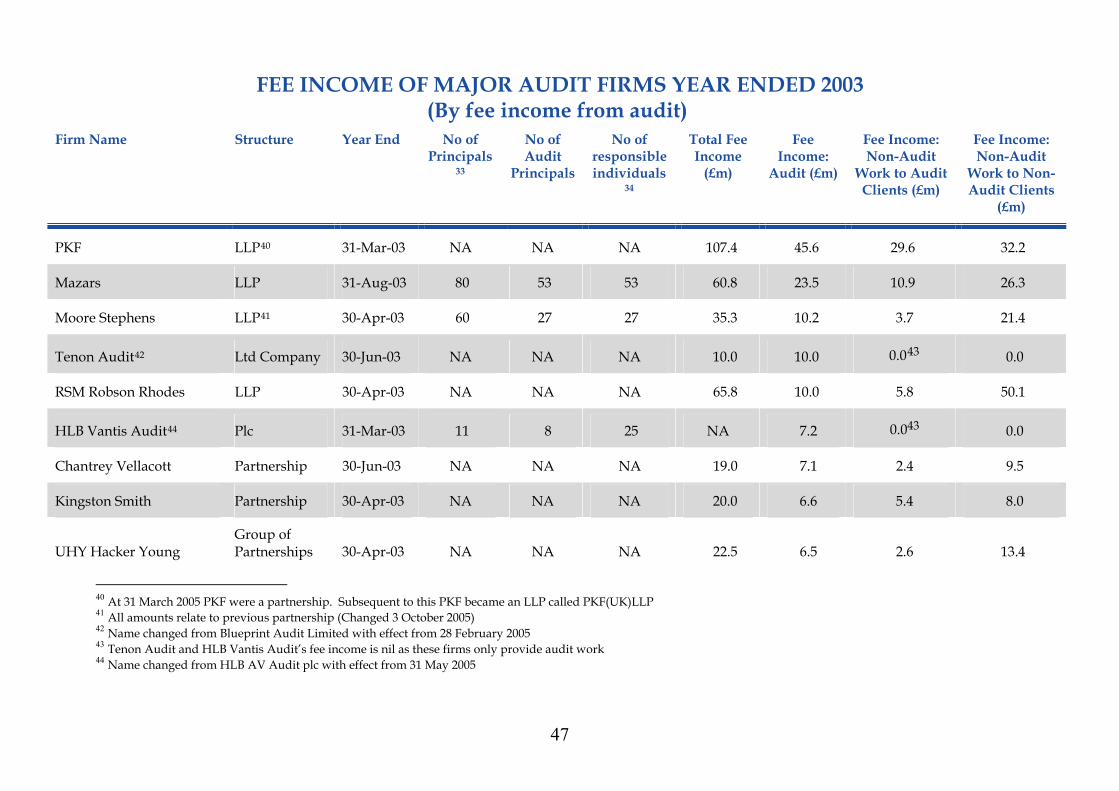
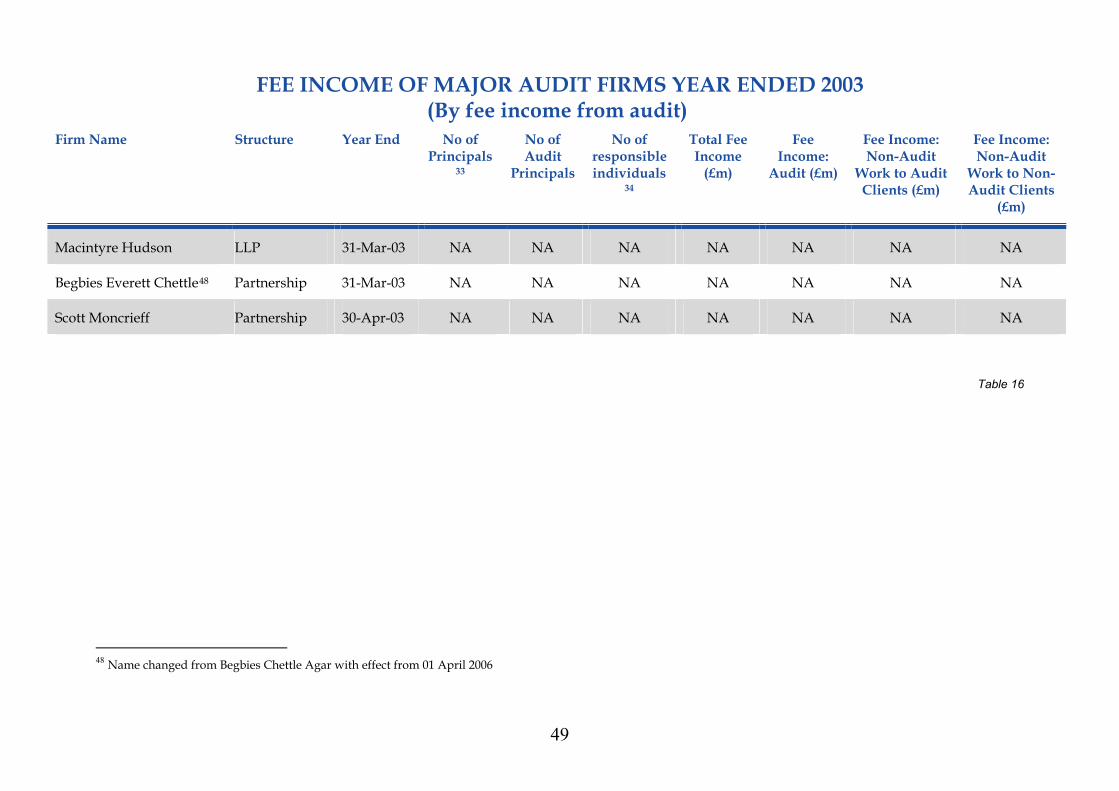
Introductory Note: Major Audit Firms Tables 14 to 16 show fee income for audit and non-audit services for many of the largest registered audit firms with clients who are defined as UK public interest entities. That information is analysed in Charts 17 to 22, differentiating the “Big 4” from the other large audit firms. Firms have been listed in order of fee income from audit, rather than total fee income. The information has been provided on a voluntary basis and we would like to thank all the firms who responded to our requests. Some of this information is otherwise publicly available – for example those firms which have adopted LLP status must publish accounts which meet the requirements of the Limited Liability Partnerships Act 2000. The tables should not be seen as league tables. Not all the firms we approached were willing to disclose information on fee income or considered that they could provide reliable enough information in the desired form. It is likely therefore that there are firms not included in the tables which have a higher audit fee income than some of those which are shown. Also, we have not included accountancy firms which are not registered as statutory auditors. One issue which led to public debate and consideration following the US accountancy scandals of Enron and WorldCom was the provision of non audit services to audit clients. This led to a new ethical standard on non-audit services produced by the Auditing Practices Board and to new guidance for listed companies in the Combined Code on the purchase of non audit services from a company’s auditors. Against that background we think that it is in the public interest to try to provide an analysis of the fee income of the large audit firms into three categories: income from audit, income from the provision of non-audit services to audit clients and income from the provision of non-audit services to non-audit clients. It would be wrong, however, to make detailed comparisons between firms using the information in Tables 14 to 16. Some firms do not analyse their fee income in this manner and have made an informed estimate of the figures. In addition firms may have classified their audit and non-audit income in slightly different ways.
37
Key Points: Major Audit Firms
• Charts 17-19 show the changes in the split of fee income for Big 4 firms for the three years to 2004/5, based on the detailed information in the fee income tables. Charts 20-22 show the equivalent percentages for the major audit firms outside the Big 4.
• There was a significant decline between 2002/3 and 2003/4 for the Big 4 firms in the proportion of their total income from the provision of non-audit services to audit clients. There was a corresponding increase in the proportion derived from the provision of non-audit services to non-audit clients, with audit fee income remaining as a constant proportion. (Charts 17 and 18).
• However, there was not a further shift in 2004/5. The proportions of total fee income for the Big 4 from audit, non-audit work to audit clients, and non-audit work to non-audit clients did not change significantly between 2003/4 and 2004/5 (Charts 18 and 19)
• There was a significant change in the split of fee income between audit work and non audit work for the major audit firms outside the Big 4 between 2002/3 and 2004/5 with the provision of non-audit services to non-audit clients increasing from 46% of total income to 52%. (Charts 20 to 22)
• There was a corresponding reduction in the proportion of total fee income from audit for the major audit firms outside the Big 4, with fee income from non-audit work to audit clients remaining stable as a percentage of the total (Charts 20 to 22).
• The percentage growth of total fee income for the Big 4 was greater between
2004 and 2005 than between 2003 and 2004, reflecting in particular a large percentage growth in Big 4 fee income. (Table 17)
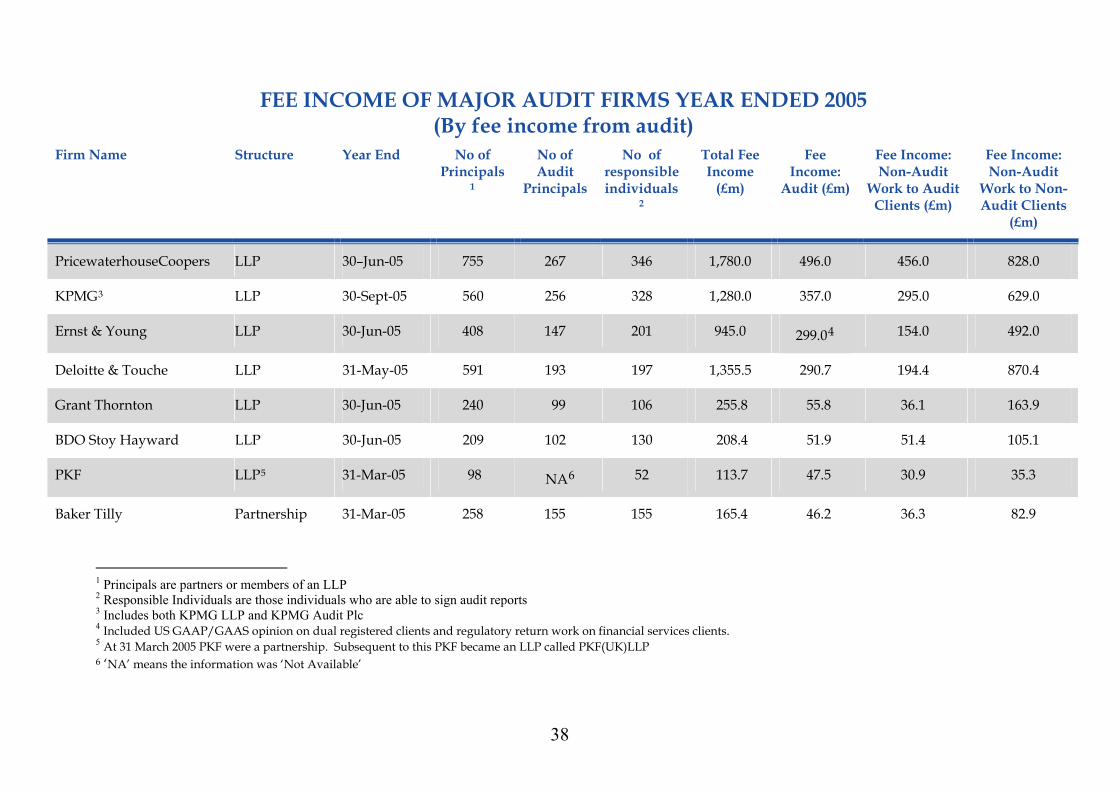
FEE INCOME OF MAJOR AUDIT FIRMS YEAR ENDED 2005 (By fee income from audit)
Firm Name Structure Year End No of Principals
1
No of Audit
Principals
No of responsible individuals
2
Total Fee Income
(£m)
Fee Income:
Audit (£m)
Fee Income: Non-Audit
Work to Audit Clients (£m)
Fee Income: Non-Audit
Work to Non-Audit Clients
(£m)
PricewaterhouseCoopers LLP 30–Jun-05 755 267 346 1,780.0 496.0 456.0 828.0
KPMG3 LLP 30-Sept-05 560 256 328 1,280.0 357.0 295.0 629.0
Ernst & Young LLP 30-Jun-05 408 147 201 945.0 299.04 154.0 492.0
Deloitte & Touche LLP 31-May-05 591 193 197 1,355.5 290.7 194.4 870.4
Grant Thornton LLP 30-Jun-05 240 99 106 255.8 55.8 36.1 163.9
BDO Stoy Hayward LLP 30-Jun-05 209 102 130 208.4 51.9 51.4 105.1
PKF LLP5 31-Mar-05 98 NA6 52 113.7 47.5 30.9 35.3
Baker Tilly Partnership 31-Mar-05 258 155 155 165.4 46.2 36.3 82.9
1 Principals are partners or members of an LLP 2 Responsible Individuals are those individuals who are able to sign audit reports 3 Includes both KPMG LLP and KPMG Audit Plc 4 Included US GAAP/GAAS opinion on dual registered clients and regulatory return work on financial services clients. 5 At 31 March 2005 PKF were a partnership. Subsequent to this PKF became an LLP called PKF(UK)LLP 6 ‘NA’ means the information was ‘Not Available’
38
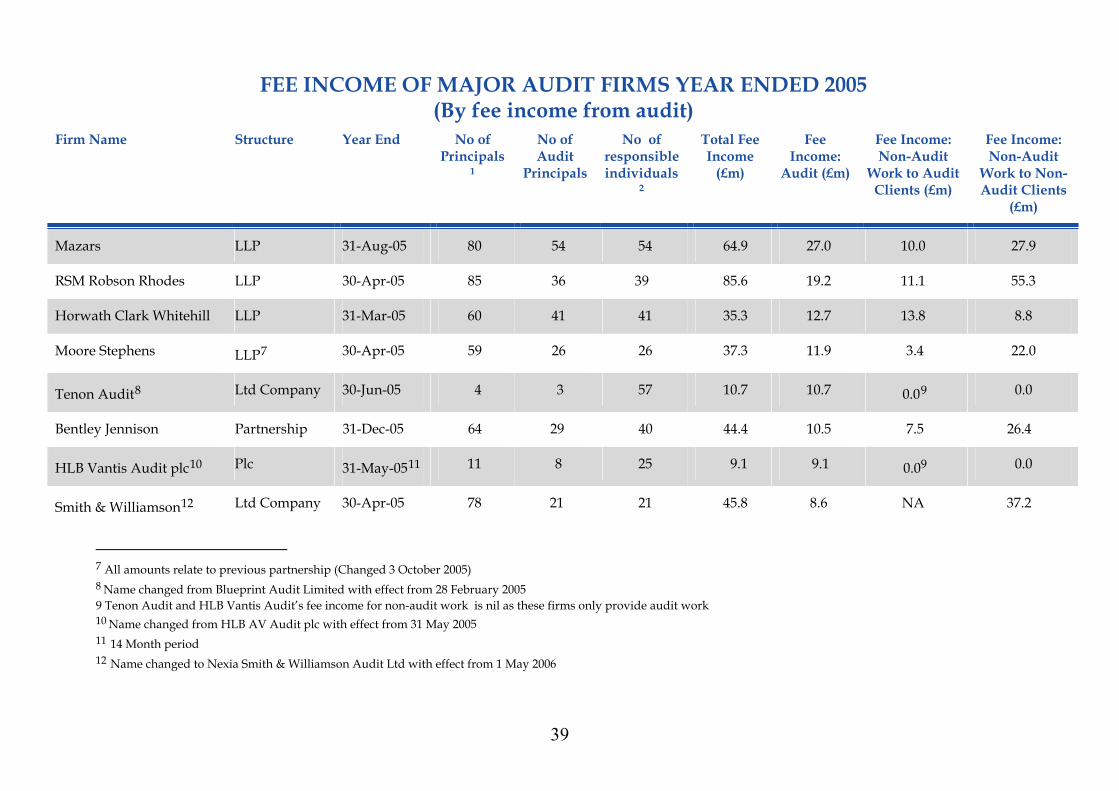
FEE INCOME OF MAJOR AUDIT FIRMS YEAR ENDED 2005
(By fee income from audit)
Firm Name Structure Year End No of Principals
1
No of Audit
Principals
No of responsible individuals
2
Total Fee Income
(£m)
Fee Income:
Audit (£m)
Fee Income: Non-Audit
Work to Audit Clients (£m)
Fee Income: Non-Audit
Work to Non-Audit Clients
(£m)
Mazars LLP 31-Aug-05 80 54 54 64.9 27.0 10.0 27.9
RSM Robson Rhodes LLP 30-Apr-05 85 36 39 85.6 19.2 11.1 55.3
Horwath Clark Whitehill LLP 31-Mar-05 60 41 41 35.3 12.7 13.8 8.8
Moore Stephens LLP7 30-Apr-05 59 26 26 37.3 11.9 3.4 22.0
Tenon Audit8 Ltd Company 30-Jun-05 4 3 57 10.7 10.7 0.09 0.0
Bentley Jennison Partnership 31-Dec-05 64 29 40 44.4 10.5 7.5 26.4
HLB Vantis Audit plc10 Plc 31-May-0511 11 8 25 9.1 9.1 0.09 0.0
Smith & Williamson12 Ltd Company 30-Apr-05 78 21 21 45.8 8.6 NA 37.2
7 All amounts relate to previous partnership (Changed 3 October 2005) 8 Name changed from Blueprint Audit Limited with effect from 28 February 2005 9 Tenon Audit and HLB Vantis Audit’s fee income for non-audit work is nil as these firms only provide audit work 10 Name changed from HLB AV Audit plc with effect from 31 May 2005 11 14 Month period 12 Name changed to Nexia Smith & Williamson Audit Ltd with effect from 1 May 2006
39
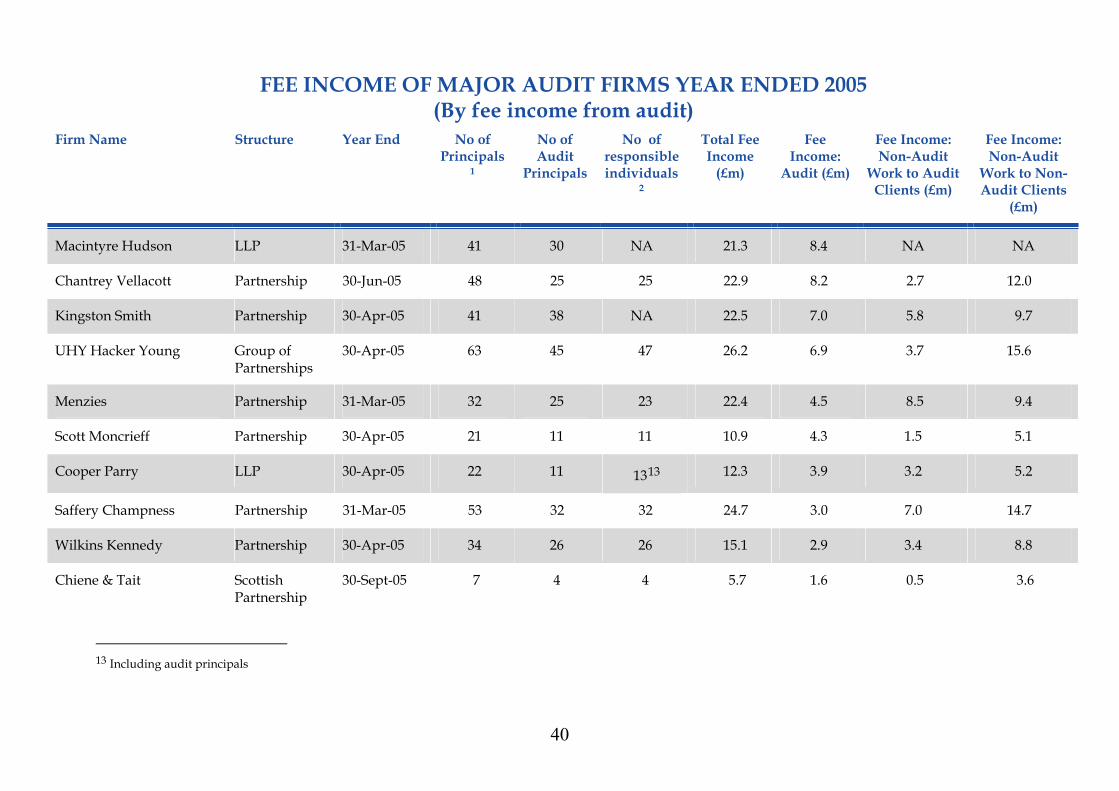
FEE INCOME OF MAJOR AUDIT FIRMS YEAR ENDED 2005
(By fee income from audit)
Firm Name Structure Year End No of Principals
1
No of Audit
Principals
No of responsible individuals
2
Total Fee Income
(£m)
Fee Income:
Audit (£m)
Fee Income: Non-Audit
Work to Audit Clients (£m)
Fee Income: Non-Audit
Work to Non-Audit Clients
(£m)
Macintyre Hudson LLP 31-Mar-05 41 30 NA 21.3 8.4 NA NA
Chantrey Vellacott Partnership 30-Jun-05 48 25 25 22.9 8.2 2.7 12.0
Kingston Smith Partnership 30-Apr-05 41 38 NA 22.5 7.0 5.8 9.7
UHY Hacker Young Group of Partnerships
30-Apr-05 63 45 47 26.2 6.9 3.7 15.6
Menzies Partnership 31-Mar-05 32 25 23 22.4 4.5 8.5 9.4
Scott Moncrieff Partnership 30-Apr-05 21 11 11 10.9 4.3 1.5 5.1
Cooper Parry LLP 30-Apr-05 22 11 1313 12.3 3.9 3.2 5.2
Saffery Champness Partnership 31-Mar-05 53 32 32 24.7 3.0 7.0 14.7
Wilkins Kennedy Partnership 30-Apr-05 34 26 26 15.1 2.9 3.4 8.8
Chiene & Tait Scottish Partnership
30-Sept-05 7 4 4 5.7 1.6 0.5 3.6
13 Including audit principals
40
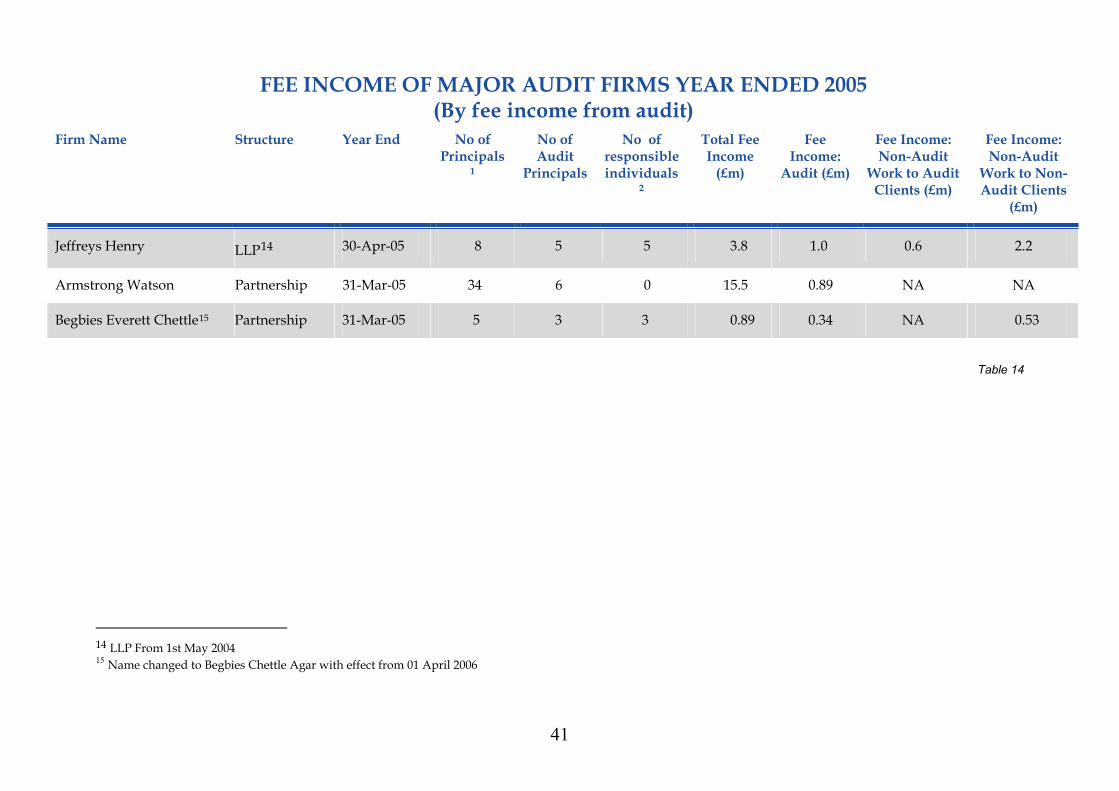
FEE INCOME OF MAJOR AUDIT FIRMS YEAR ENDED 2005
(By fee income from audit)
Firm Name Structure Year End No of Principals
1
No of Audit
Principals
No of responsible individuals
2
Total Fee Income
(£m)
Fee Income:
Audit (£m)
Fee Income: Non-Audit
Work to Audit Clients (£m)
Fee Income: Non-Audit
Work to Non-Audit Clients
(£m)
Jeffreys Henry LLP14 30-Apr-05 8 5 5 3.8 1.0 0.6 2.2
Armstrong Watson Partnership 31-Mar-05 34 6 0 15.5 0.89 NA NA
Begbies Everett Chettle15 Partnership 31-Mar-05 5 3 3 0.89 0.34 NA 0.53
Table 14
14 LLP From 1st May 2004 15 Name changed to Begbies Chettle Agar with effect from 01 April 2006
41

FEE INCOME OF MAJOR AUDIT FIRMS YEAR ENDED 2004 (By fee income from audit)
Firm Name Structure Year End No of Principals
16
No of Audit
Principals
No of responsible individuals
17
Total Fee Income
(£m)
Fee Income:
Audit (£m)
Fee Income: Non-Audit
Work to Audit Clients (£m)
Fee Income: Non-Audit
Work to Non-Audit Clients
(£m)
PricewaterhouseCoopers18 LLP 30-Jun-04 752 269 350 1583.0 438.0 405.0 740.0
KPMG19 LLP 30-Sep-04 549 247 353 1,066.0 306.0 270.0 490.0
Deloitte & Touche LLP 31-May-04 589 201 205 1,246.3 259.0 177.2 810.1
Ernst & Young LLP 30-Jun-04 391 148 195 825.020 241.0 168.0 416.0
BDO Stoy Hayward LLP 30-Jun-04 209 10521 11522 187.9 84.1 33.7 70.1
Grant Thornton LLP 30-Jun-04 241 106 108 234.0 58.0 41.0 135.0
Baker Tilly Partnership 31-Mar-04 261 NA23 NA 160.0 50.0 30.0 80.0
16 Principals are partners or members of an LLP 17 Responsible Individuals are those individuals who are able to sign audit reports 18 Fee income figures re-stated in comparison to the 3rd Edition of Key Facts & Trends in line with the change of accounting policy for revenue recognition and a review of the definitions in the APB Ethical Standards 5. 19 Includes both KPMG LLP and KPMG Audit Plc 20 Fee income figures re-stated in comparison to the 3rd Edition of Key Facts & Trends following a change in accounting policy regarding exclusion of unrealised profit in year end work in progress. 21 As at 30 November 2004 22 As at 30 November 2004 23 ‘NA’ means the information was ‘Not Available’
42
FEE INCOME OF MAJOR AUDIT FIRMS YEAR ENDED 2004
(By fee income from audit)
Firm Name Structure Year End No of Principals
16
No of Audit
Principals
No of responsible individuals
17
Total Fee Income
(£m)
Fee Income:
Audit (£m)
Fee Income: Non-Audit
Work to Audit Clients (£m)
Fee Income: Non-Audit
Work to Non-Audit Clients
(£m)
PKF LLP24 31-Mar-04 101 NA NA 110.0 46.5 30.0 33.5
Mazars LLP 31-Aug-04 75 54 54 62.825 24.8 10.1 28.6
RSM Robson Rhodes LLP 30-Apr-04 93 30 33 75.2 14.1 7.3 53.9
Horwath Clark Whitehill LLP 31-Mar-04 59 NA NA 35.6 13.9 12.2 9.5
Moore Stephens LLP26 30-Apr-04 60 26 26 36.9 10.6 3.5 22.8
Tenon Audit27 Ltd Company 30-Jun-04 9 NA NA 10.0 10.0 0.028 0.0
Bentley Jennison Partnership 31-Dec-04 56 NA NA 38.1 9.5 6.5 22.1
HLB Vantis Audit29 Plc 31-Mar-04 11 8 25 8.4 8.4 0.028 0.0
24 At 31 March 2005 PKF were a partnership. Subsequent to this PKF became an LLP called PKF(UK)LLP 25 Re-states for application of UITF40 26 All amounts relate to previous partnership (Changed 3 October 2005) 27 Name changed from Blueprint Audit Limited with effect from 28 February 2005 28 Tenon Audit and HLB Vantis Audit’s fee income is nil as these firms only provide audit work 29 Name changed from HLB AV Audit plc with effect from 31 May 2005
43
FEE INCOME OF MAJOR AUDIT FIRMS YEAR ENDED 2004
(By fee income from audit)
Firm Name Structure Year End No of Principals
16
No of Audit
Principals
No of responsible individuals
17
Total Fee Income
(£m)
Fee Income:
Audit (£m)
Fee Income: Non-Audit
Work to Audit Clients (£m)
Fee Income: Non-Audit
Work to Non-Audit Clients
(£m)
Smith & Williamson30 Company 30-Apr-04 77 23 23 46.6 8.3 NA 38.3
Macintyre Hudson LLP 31-Mar-04 41 30 NA 20.0 8.3 NA NA
Chantrey Vellacott Partnership 30-Jun-04 50 NA NA 19.9 7.5 2.5 10.0
UHY Hacker Young Group of Partnerships 30-Apr-04 67 NA NA 24.0 6.9 2.8 14.3
Kingston Smith Partnership 30-Apr-04 42 NA NA 20.3 6.5 5.3 8.5
Menzies Partnership 31-Mar-04 31 27 22 21.5 4.3 8.0 9.2
Scott Moncrieff Partnership 30-Apr-04 32 13 13 10.5 4.3 1.4 4.8
Cooper Parry LLP 30-Apr-04 20 7 9 11.3 3.8 3.2 4.4
Wilkins Kennedy Partnership 30-Apr-04 33 26 27 14.3 3.4 3.1 7.8
Saffery Champness Partnership 31-Mar04 50 28 28 23.7 2.8 6.9 13.8
Chiene & Tait Scottish
30-Sept-04 7 4 4 5.3 1.5 0.4 3.4
30 Name changed to Nexia Smith & Williamson Audit Ltd with effect from 1 May 2006
44
FEE INCOME OF MAJOR AUDIT FIRMS YEAR ENDED 2004
(By fee income from audit)
Firm Name Structure Year End No of Principals
16
No of Audit
Principals
No of responsible individuals
17
Total Fee Income
(£m)
Fee Income:
Audit (£m)
Fee Income: Non-Audit
Work to Audit Clients (£m)
Fee Income: Non-Audit
Work to Non-Audit Clients
(£m)
Partnership
Armstrong Watson Partnership 31-Mar-04 34 NA NA 11.9 0.85 0.85 10.2
Jeffreys Henry LLP31 30-Apr-04 8 5 5 3.4 0.8 0.6 2.0
Begbies Everett Chettle32 Partnership 31-Mar-04 5 3 3 0.91 0.34 NA 0.56
Table 15
31 LLP from 1st May 2004 32 Name changed to Begbies Chettle Agar with effect from 01 April 2006
45
FEE INCOME OF MAJOR AUDIT FIRMS YEAR ENDED 2003 (By fee income from audit)
Firm Name Structure Year End No of Principals
33
No of Audit
Principals
No of responsible individuals
34
Total Fee Income
(£m)
Fee Income:
Audit (£m)
Fee Income: Non-Audit
Work to Audit Clients (£m)
Fee Income: Non-Audit
Work to Non-Audit Clients
(£m)
PricewaterhouseCoopers35 LLP 30-Jun-03 779 280 360 1,505.0 426.0 429.0 650.0
KPMG36 LLP 30-Sep-03 551 255 346 1,008.0 291.0 282.0 435.0
Deloitte & Touche LLP 31-May-03 575 215 222 1,187.9 260.0 211.9 716.0
Ernst & Young LLP 30-Jun-03 400 151 192 812.0 226.0 197.0 389.0
BDO Stoy Hayward LLP 30-Jun-03 199 10637 11338 169.4 82.2 37.1 50.1
Baker Tilly Partnership 31-Mar-03 NA39 NA NA 150.0 59.0 35.0 56.0
Grant Thornton LLP 30-Jun-03 NA NA NA 216.0 58.0 37.0 121.0
33 Principals are partners or members of an LLP 34 Responsible Individuals are those individuals who are able to sign audit reports 35 Fee income figures re-stated in comparison to the 3rd Edition of Key Facts & Trends in line with the change of accounting policy for revenue recognition and a review of the definitions in the APB Ethical Standards 5. 36 Includes both KPMG LLP and KPMG Audit Plc 37 As at 30 September 2003 38 As at 30 September 2003 39 ‘NA’ means the information was ‘Not Available’
46
FEE INCOME OF MAJOR AUDIT FIRMS YEAR ENDED 2003
(By fee income from audit)
Firm Name Structure Year End No of Principals
33
No of Audit
Principals
No of responsible individuals
34
Total Fee Income
(£m)
Fee Income:
Audit (£m)
Fee Income: Non-Audit
Work to Audit Clients (£m)
Fee Income: Non-Audit
Work to Non-Audit Clients
(£m)
PKF LLP40 31-Mar-03 NA NA NA 107.4 45.6 29.6 32.2
Mazars LLP 31-Aug-03 80 53 53 60.8 23.5 10.9 26.3
Moore Stephens LLP41 30-Apr-03 60 27 27 35.3 10.2 3.7 21.4
Tenon Audit42 Ltd Company 30-Jun-03 NA NA NA 10.0 10.0 0.043 0.0
RSM Robson Rhodes LLP 30-Apr-03 NA NA NA 65.8 10.0 5.8 50.1
HLB Vantis Audit44 Plc 31-Mar-03 11 8 25 NA 7.2 0.043 0.0
Chantrey Vellacott Partnership 30-Jun-03 NA NA NA 19.0 7.1 2.4 9.5
Kingston Smith Partnership 30-Apr-03 NA NA NA 20.0 6.6 5.4 8.0
UHY Hacker Young Group of Partnerships 30-Apr-03 NA NA NA 22.5 6.5 2.6 13.4
40 At 31 March 2005 PKF were a partnership. Subsequent to this PKF became an LLP called PKF(UK)LLP 41 All amounts relate to previous partnership (Changed 3 October 2005) 42 Name changed from Blueprint Audit Limited with effect from 28 February 2005 43 Tenon Audit and HLB Vantis Audit’s fee income is nil as these firms only provide audit work 44 Name changed from HLB AV Audit plc with effect from 31 May 2005
47

FEE INCOME OF MAJOR AUDIT FIRMS YEAR ENDED 2003
(By fee income from audit)
Firm Name Structure Year End No of Principals
33
No of Audit
Principals
No of responsible individuals
34
Total Fee Income
(£m)
Fee Income:
Audit (£m)
Fee Income: Non-Audit
Work to Audit Clients (£m)
Fee Income: Non-Audit
Work to Non-Audit Clients
(£m)
Bentley Jennison Partnership 31-Dec-03 NA NA NA 27.0 6.0 4.0 17.0
Cooper Parry LLP 30-Apr-03 21 9 1145 10.4 4.0 3.1 3.4
Menzies Partnership 31-Mar-03 31 28 24 18.6 3.9 7.0 7.7
Wilkins Kennedy Partnership 30-Apr-03 30 24 25 12.5 3.6 2.6 6.3
Saffery Champness Partnership 31-Mar-03 48 26 26 23.2 3.5 5.3 13.4
Smith & Williamson46 Company 30-Apr-03 81 25 25 20.2 3.3 NA 16.9
Chiene & Tait Scottish Partnership 30-Sep-03 6 3 3 4.9 1.7 0.4 2.8
Armstrong Watson Partnership 31-Mar-03 NA NA NA 11.6 1.2 1.2 9.1
Jeffreys Henry LLP47 30-Apr-03 10 7 7 3.5 0.8 0.6 2.1
Horwath Clark Whitehill LLP 31-Mar-03 NA NA NA NA NA NA NA
45 Including audit principals 46 Name changed to Nexia Smith & Williamson Audit Ltd with effect from 1 May 2006 47 From 1st May 2004
48
FEE INCOME OF MAJOR AUDIT FIRMS YEAR ENDED 2003
(By fee income from audit)
Firm Name Structure Year End No of Principals
33
No of Audit
Principals
No of responsible individuals
34
Total Fee Income
(£m)
Fee Income:
Audit (£m)
Fee Income: Non-Audit
Work to Audit Clients (£m)
Fee Income: Non-Audit
Work to Non-Audit Clients
(£m)
Macintyre Hudson LLP 31-Mar-03 NA NA NA NA NA NA NA
Begbies Everett Chettle48 Partnership 31-Mar-03 NA NA NA NA NA NA NA
Scott Moncrieff Partnership 30-Apr-03 NA NA NA NA NA NA NA
Table 16
48 Name changed from Begbies Chettle Agar with effect from 01 April 2006
49
BIG FOUR FIRMS
Analysis of Big 4 Fee Income 2002-3
27%
25%
48%
Audit Fee Income (£m)
Fee Income from Non-Audit w ork to AuditClients
Fee income from Non-Audit w ork to Non-AuditClients
Chart 17
Analysis of Big 4 Fee Income 2003-4
26%
21%
53%
Audit Fee Income (£m)
Fee Income from Non-Audit w ork to AuditClients
Fee income from Non-Audit w ork to Non-AuditClients
Chart 18
Analysis of Big 4 Fee Income 2004-5
27%
21%
52%
Audit Fee Income (£m)
Fee Income from Non-Audit w ork to AuditClients
Fee income from Non-Audit w ork to Non-AuditClients
Chart 19
50
NON BIG FOUR FIRMS WHO AUDIT UK PUBLIC INTEREST ENTITIES
Analysis of Non Big 4 Fee Income 2002-3
35%
19%
46%
Audit Fee Income (£m)
Fee Income from Non-Audit w ork to AuditClients
Fee income from Non-Audit w ork to Non-AuditClients
Chart 20
Analysis of Non Big 4 Fee Income2003-4
33%
18%
49%
Audit Fee Income (£m)
Fee Income from Non-Audit w ork to AuditClients
Fee income from Non-Audit w ork to Non-AuditClients
Chart 21
Analysis of Non Big 4 Fee Income 2004-5
29%
19%
52%
Audit Fee Income (£m)
Fee Income from Non-Audit w ork to AuditClients
Fee income from Non-Audit w ork to Non-AuditClients
Chart 22
51
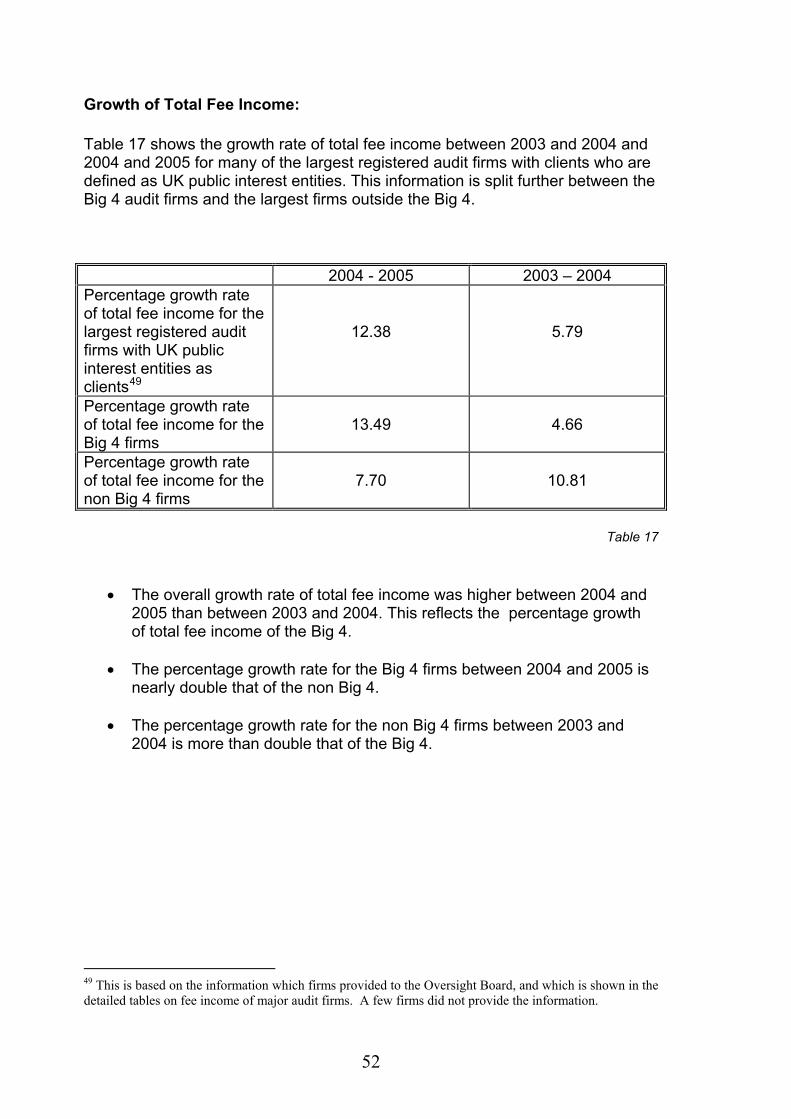
Growth of Total Fee Income:
Table 17 shows the growth rate of total fee income between 2003 and 2004 and 2004 and 2005 for many of the largest registered audit firms with clients who are defined as UK public interest entities. This information is split further between the Big 4 audit firms and the largest firms outside the Big 4. 2004 - 2005 2003 – 2004 Percentage growth rate of total fee income for the largest registered audit firms with UK public interest entities as clients49
12.38
5.79
Percentage growth rate of total fee income for the Big 4 firms
13.49
4.66
Percentage growth rate of total fee income for the non Big 4 firms
7.70
10.81
Table 17
• The overall growth rate of total fee income was higher between 2004 and 2005 than between 2003 and 2004. This reflects the percentage growth of total fee income of the Big 4.
• The percentage growth rate for the Big 4 firms between 2004 and 2005 is
nearly double that of the non Big 4.
• The percentage growth rate for the non Big 4 firms between 2003 and 2004 is more than double that of the Big 4.
49 This is based on the information which firms provided to the Oversight Board, and which is shown in the detailed tables on fee income of major audit firms. A few firms did not provide the information.
52
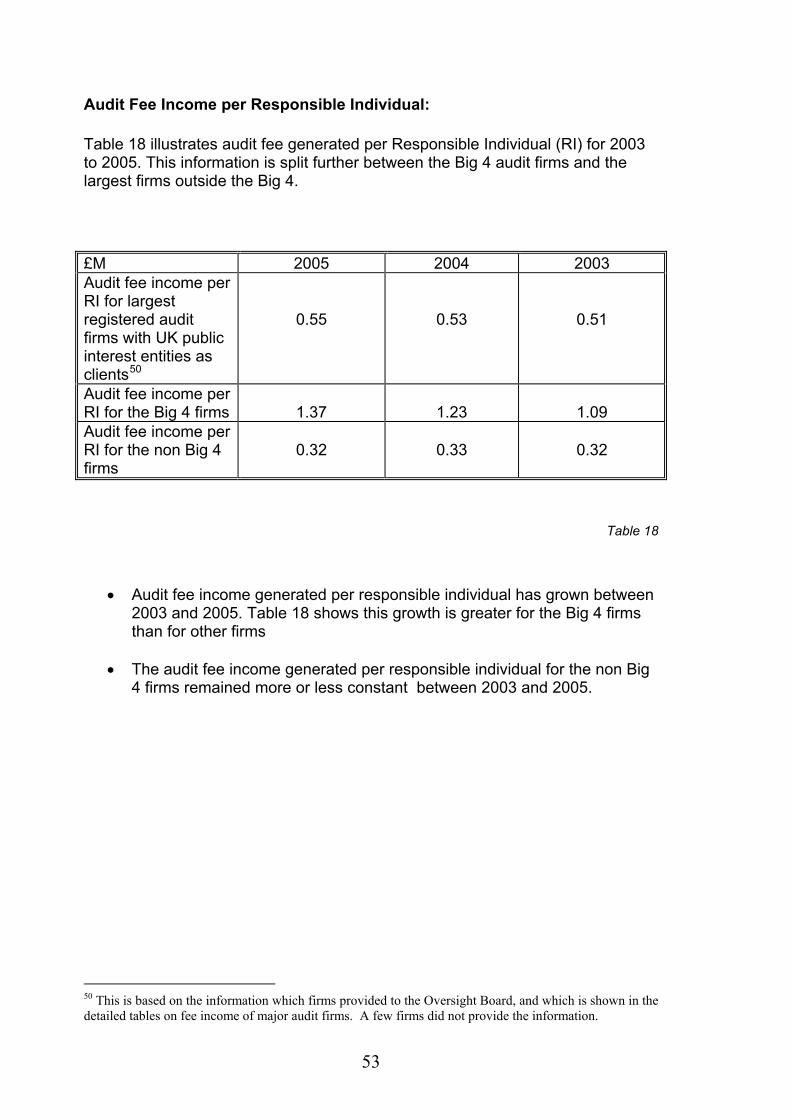
Audit Fee Income per Responsible Individual:
Table 18 illustrates audit fee generated per Responsible Individual (RI) for 2003 to 2005. This information is split further between the Big 4 audit firms and the largest firms outside the Big 4.
£M 2005 2004 2003 Audit fee income per RI for largest registered audit firms with UK public interest entities as clients50
0.55
0.53
0.51
Audit fee income per RI for the Big 4 firms
1.37
1.23
1.09
Audit fee income per RI for the non Big 4 firms
0.32
0.33
0.32
Table 18
• Audit fee income generated per responsible individual has grown between
2003 and 2005. Table 18 shows this growth is greater for the Big 4 firms than for other firms
• The audit fee income generated per responsible individual for the non Big
4 firms remained more or less constant between 2003 and 2005.
50 This is based on the information which firms provided to the Oversight Board, and which is shown in the detailed tables on fee income of major audit firms. A few firms did not provide the information.
53
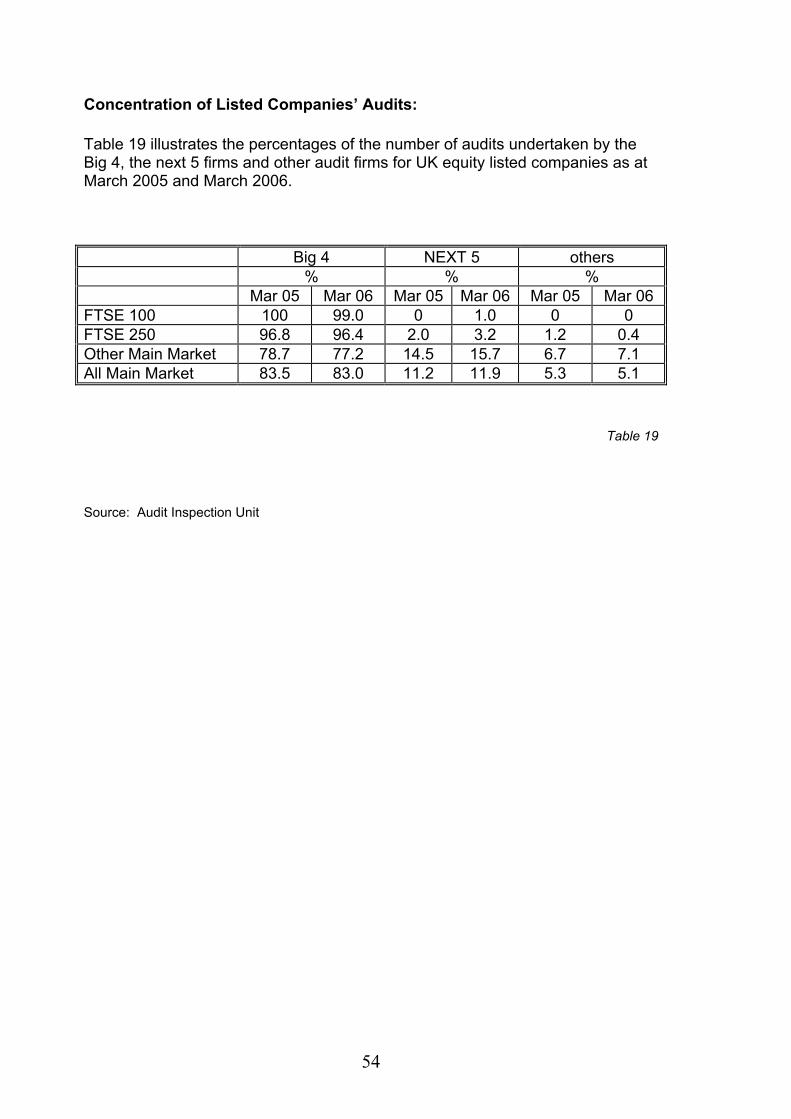
Concentration of Listed Companies’ Audits:
Table 19 illustrates the percentages of the number of audits undertaken by the Big 4, the next 5 firms and other audit firms for UK equity listed companies as at March 2005 and March 2006. Big 4 NEXT 5 others % % % Mar 05 Mar 06 Mar 05 Mar 06 Mar 05 Mar 06 FTSE 100 100 99.0 0 1.0 0 0 FTSE 250 96.8 96.4 2.0 3.2 1.2 0.4 Other Main Market 78.7 77.2 14.5 15.7 6.7 7.1 All Main Market 83.5 83.0 11.2 11.9 5.3 5.1
Table 19
Source: Audit Inspection Unit
54
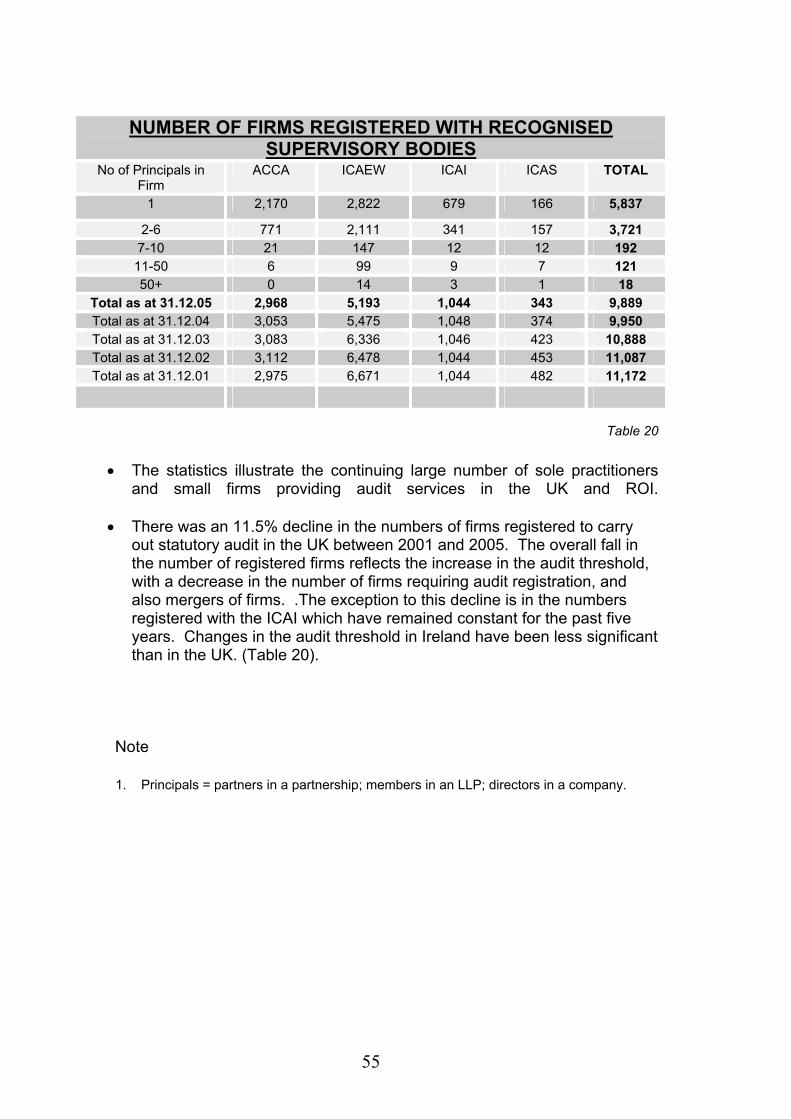
NUMBER OF FIRMS REGISTERED WITH RECOGNISED
SUPERVISORY BODIESNo of Principals in
Firm ACCA ICAEW ICAI ICAS TOTAL
1 2,170 2,822 679 166 5,837
2-6 771 2,111 341 157 3,721 7-10 21 147 12 12 192 11-50 6 99 9 7 121 50+ 0 14 3 1 18
Total as at 31.12.05 2,968 5,193 1,044 343 9,889 Total as at 31.12.04 3,053 5,475 1,048 374 9,950 Total as at 31.12.03 3,083 6,336 1,046 423 10,888 Total as at 31.12.02 3,112 6,478 1,044 453 11,087 Total as at 31.12.01 2,975 6,671 1,044 482 11,172
Table 20
• The statistics illustrate the continuing large number of sole practitioners and small firms providing audit services in the UK and ROI.
• There was an 11.5% decline in the numbers of firms registered to carry out statutory audit in the UK between 2001 and 2005. The overall fall in the number of registered firms reflects the increase in the audit threshold, with a decrease in the number of firms requiring audit registration, and also mergers of firms. .The exception to this decline is in the numbers registered with the ICAI which have remained constant for the past five years. Changes in the audit threshold in Ireland have been less significant than in the UK. (Table 20).
Note
1. Principals = partners in a partnership; members in an LLP; directors in a company.
55
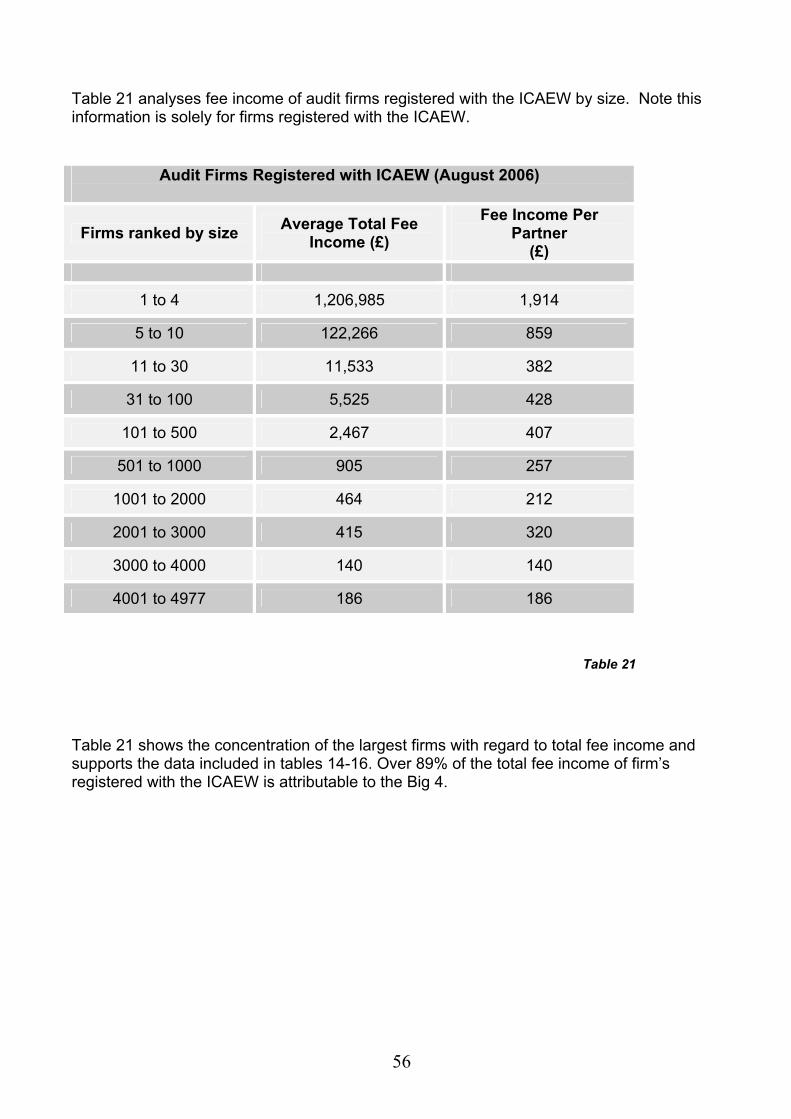
Table 21 analyses fee income of audit firms registered with the ICAEW by size. Note this information is solely for firms registered with the ICAEW.
Audit Firms Registered with ICAEW (August 2006)
Firms ranked by size Average Total Fee Income (£)
Fee Income Per Partner
(£)
1 to 4 1,206,985 1,914
5 to 10 122,266 859
11 to 30 11,533 382
31 to 100 5,525 428
101 to 500 2,467 407
501 to 1000 905 257
1001 to 2000 464 212
2001 to 3000 415 320
3000 to 4000 140 140
4001 to 4977 186 186
Table 21 Table 21 shows the concentration of the largest firms with regard to total fee income and supports the data included in tables 14-16. Over 89% of the total fee income of firm’s registered with the ICAEW is attributable to the Big 4.
56

© The Financial Reporting Council 2006
Nov 06 FC.qxp 15/11/2006 01:20 Page 3
PROFESSIONAL OVERSIGHT BOARD
5TH FLOOR
ALDWYCH HOUSE
71-91 ALDWYCH
LONDON WC2B 4HN
TEL: +44 (0)20 7492 2300
FAX: +44 (0)20 7492 2301
WEBSITE: www.frc.org.uk/pob
Nov 06 FC.qxp 15/11/2006 01:20 Page 4