Embed Size (px)
Citation preview
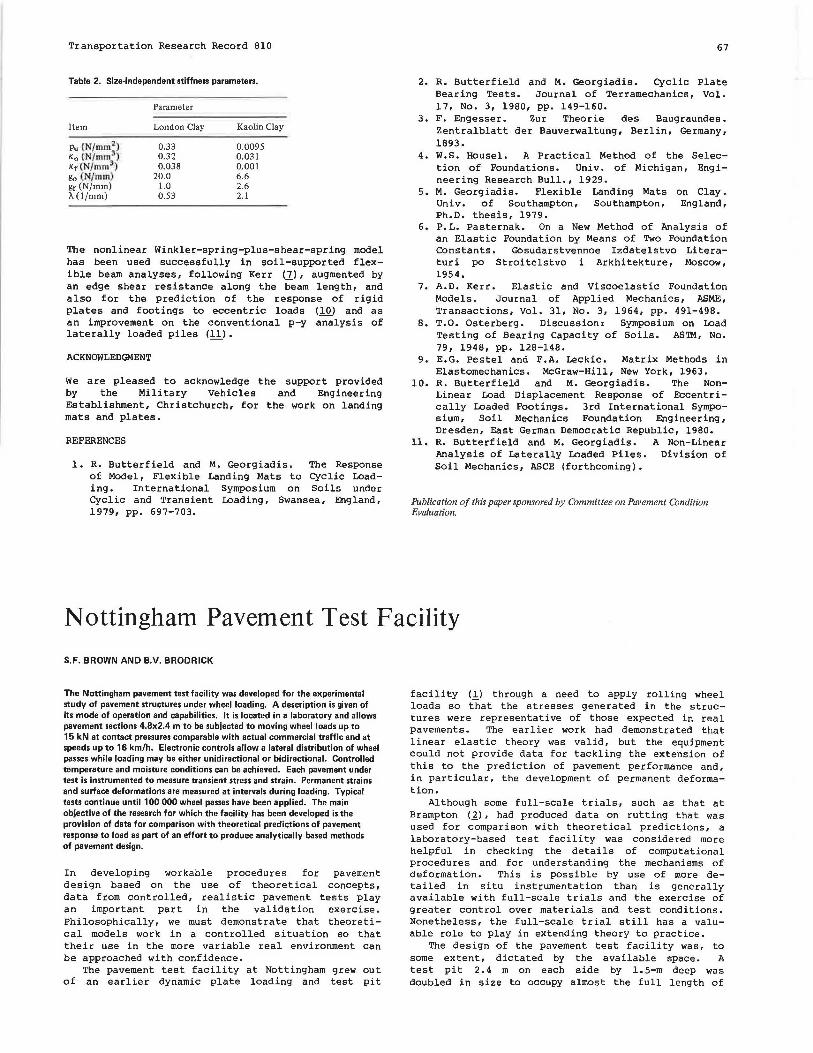
Transportation Research Record 810
Table 2. Size-independent stiffness parameters.
Parameter
Item London Clay Kaolin Clay
Pu (N/mm 2) 0.33 0.0095
K 0 (N/mm3) 0.32 0.031 Kr (N/mm3
) 0.038 0.001 !lo (N/mm) 20.0 6.6 gf (N/mm) 1.0 2.6 X(l/mm) 0.53 2.1
The nonlinear Winkler-spring-plus-shear-spring model has been used successfully in soil-supported flexible beam analyses, following Kerr <llr augmented by an edge shear resistance along the beam length, and also for the prediction of the response of rigid plates and footings to eccentric loads (10) and as an improvement on the conventional p-y analysis of laterally loaded piles (11).
ACKNOWLEDGMENT
We are pleased to acknowledge the support provided by the Military Vehicles and Engineering Establishment, Christchurch, for the work on landing mats and plates.
REFERENCES
1. R. Butterfield and M. Georgiadis. The Response of Model, Flexible Landing Mats to Cyclic Loading. International Symposium on Soils under Cyclic and Transient Loading, Swansea, England, 1979, pp. 697-703.
67
2. R. Butterfield and M. Georgiadis. Cyclic Plate Bearing Tests. Journal of Terramechanics, Vol. 17, No. 3, 1980, pp. 149-160.
3. F. Engesser. Zur Theorie des Baugraundes. Zentralblatt der Bauverwaltung, Berlin, Germany, 1893.
4. w.s. Housel. A Practical Method of the Selec-tion of Foundations. Univ. of Michigan, Engi-neering Research Bull., 1929.
5. M. Georgiadis. Flexible Landing Mats on Clay. Univ. of Southampton, Southampton, England, Ph.D. thesis, 1979.
6. P.L. Pasternak. On a New Method of Analysis of an Elastic Foundation by Means of Two Foundation Constants. Gosudarstvennoe Izdatelstvo Literaturi po Stroitelstvo i Arkhitekture, Moscow, 1954.
7. A.D. Kerr. Elastic and Viscoelastic Foundation Models. Journal of Applied Mechanics, ASME, Transactions, Vol. 31, No. 3, 1964, pp. 491-498.
8. T.O. Osterberg. Discussion: Symposium on Load Testing of Bearing Capacity of Soils. AS'IM, No. 79, 1948, pp. 128-148.
9. E.G. Pestel and F.A. Leckie. Matrix Methods in Elastomechanics. McGraw-Hill, New York, 1963.
10. R. Butterfield and M. Georgiadis. The Non-Linear Load Displacement Response of Eccentr ically Loaded Footings. 3rd International Symposium, Soil Mechanics Foundation Engineering, Dresden, East German Democratic Republic, 1980.
11. R. Butterfield and M. Georgiadis. A Non-Linear Analysis of Laterally Loaded Piles. Division of Soil Mechanics, ASCE (forthcoming).
Publication of this paper sponsored by Committee on Pavement Condition Evaluation.
Nottingham Pavement Test Facility
S.F. BROWN AND B.V. BRODRICK
The Nottingham pavement test facility was developed for the experimental study of pavement structures under wheel loading. A description is given of its mode of operation and capabilities. It is located in a laboratory and allows pavement sections 4.8x2.4 m to be subjected to moving wheel loads up to 15 kN at contact pressures comparable with actual commercial traffic and at speeds up to 16 km/h. Electronic controls allow a lateral distribution of wheel passes while loading may be either unidirectional or bidirectional. Controlled temperature and moisture conditions can be achieved. Each pavement under test is instrumented to measure transient stress and strain. Permanent strains and surface deformations are measured at intervals during loading. Typical tests continue until 100 000 wheel passes have been applied. The main objective of the research for which the facility has been developed is the provision of data for comparison with theoretical predictions of pavement response to load as part of an effort to produce analytically based methods of pavement design.
In developing workable procedures for pavement design based on the use of theoretical concepts, data from controlled, realistic pavement tests play an important part in the validation exercise. Philosophically, we must demonstrate that theoretical models work in a controlled situation so that their use in the more variable real environment can be approached with confidence.
The pavement test facility at Nottingham grew out of an earlier dynamic plate loading and test pit
facility (!.) through a need to apply rolling wheel loads so that the stresses generated in the structures were representative of those expected in real pavements. The earlier work had demonstrated that linear elastic theory was valid, but the equipment could not provide data for tackling the extension of this to the prediction of pavement performance and, in particular, the development of permanent deformation.
Although some full-scale trials, such as that at Brampton (~) , had produced data on rutting that was used for comparison with theoretical predictions, a laboratory-based test facility was considered more helpful in checking the details of computational procedures and for understanding the mechanisms of deformation. This is possible by use of more detailed in situ instrumentation than is generally available with full-scale trials and the exercise of greater control over materials and test conditions. Nonetheless, the full-scale trial still has a valuable role to play in extending theory to practice.
The design of the pavement test facility was, to some extent, dictated by the available space. A test pit 2.4 m on each side by 1.5-m deep was doubled in size to occupy almost the full length of

68
the laboratory. A linear wheel-loading device was the only practical solution, although rapid reversal of direction and quick acceleration to test speed at either end of the travel were needed. These were made possible by use of a hydraulic motor with suitable servocontrols.
A general view of the facility is given in Figure 1. It moves a loaded wheel in a straight line at a constant speed over a semifull scale pavement structure. Each test pavement contains instrumentation to measure stresses and strains and these, together with surface profile data, provide the necessary information for comparison with theoretical predictions. Wheel speed and load, temperature, direction in which the load is applied, and lateral distribution of the wheel path can all be controlled. The facility is contained in a temperature-controlled room that has insulated walls and a low, false insulated ceiling.
PAVEMENT CONSTRUCTION AND INSTRUMENTATION
Pavements may be constructed by using different materials and thicknesses although, to date, all tests have involved a single silty clay subgrade and structures either of full-depth asphalt or thin asphalt surfacing over a granular base. A roller shutter door adjacent to the facility provides access during construction and excavation of pavements.
The rectangular concrete-lined pit shown in _, - -----'-r. .iyure t'..1..U .... V U •t,,.. l l '-
Figure 1. General view of pavement test facility.
Figure 2. Longitudinal section of test pit.
pav•m•nt construction
Transportation Research Record 810
compaction of the subgrade. Provision has not yet been made for control of the level of the water table. Pavement construction is arranged so that the finished surface is level with the laboratory floor. Reference levels along each side are provided by a pair of accurately positioned angle irons, which are used to take measurements uf :;urface deformation.
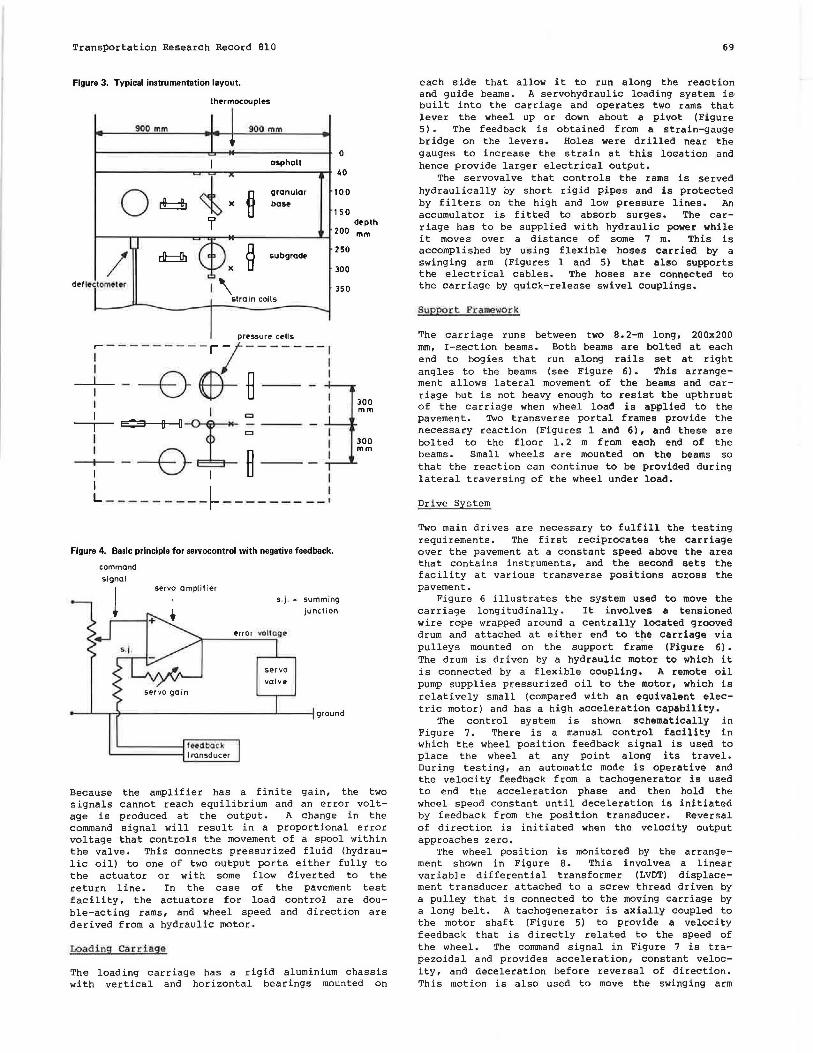
Figure 3 shows a plan view and section through a typical instrument layout for one of the three-layer structures. The instruments are being installed as the pavement is constructed (1_,_~).
Transient stresses are measured with Nottingham pressure cells that operate on the strain-gauged diaphragm principle <2>· Resilient and permanent strains are measured with Bison strain coils that consist of two, free-floating, carefully aligned, wire-wound discs (~) . The spacing between these discs is converted to a voltage related to the strength of their electromagnetic coupling when one coil is energized. Displacement transducers and bonded foil-strain gauges have also been used to supplement the strain coils. Temperatures within the pavement are monitored by using copper constantan thermocouples. An automatic data acquisition system prints out the transient stresses and strains; permanent strains are read manually from the Bison control box and transverse surface profiles are determined with a profilorneter (}).
PAVEMENT TEST FACILITY
The facility can be divided into four major components:
1. A moving carriage that supports the loading wheel,
2. A framework to support and guide the carriage, 3. Drive arrangements for longitudinal and trans
verse movements of the carriage, and 4. Electronic control systP.ms.
Closed-Loop Servocontrol
The load applied by the wheel together with its speed and position are all controlled by using the servohydraulic principle illustrated in Figure 4. A command signal is fed· to the amplifier·, and this causes a positive drive at the control, or servovalve, that operates an actuator (e.g., a ram or motor). The actuator directly or indirectly drives a transducer that supplies a feedback signal that opposes the command signal at the amplifier input.
E ... .:.
Transportation Research Record 810
Figure 3. Typical instrumentation layout.
lh•rmocoupl•s
900 mm 900 mm
asphalt
0 i § granular
~ x bas•
I
/ dl::::::::!b § subgrade
d•f l•clom•ler
pr•ssure c•lls
r ---------17-------1 I I
+ ---B-$- B--: : I c I Te: ~Ta ___ I
~--c./I fl I I I I L----- ----r---- ----- '
Figure 4. Basic principle for servocontral with negative feedback.
command
signal servo amplifier
0
40
100
150
200
250
300
350
s.j . = summing junction
'--------l h•d back "'-------1 1 ransducer
servo
valve
depth
mm
300 mm
300 mm
Because the amplifier has a finite gain, the two signals cannot reach equilibrium and an error voltage is produced at the output. A change in the command signal will result in a proportional error voltage that controls the movement of a spool within the valve. This connects pressurized fluid (hydraulic oil) to one of two output ports either fully to the actuator or with some flow diverted to the return line. In the case of the pavement test facility, the actuators for load control are double-acting rams, and wheel speed and direction are derived from a hydraulic motor.
Loading Carriage
The loading carriage has a rigid aluminium chassis with vertical and horizontal bearings mounted on
69
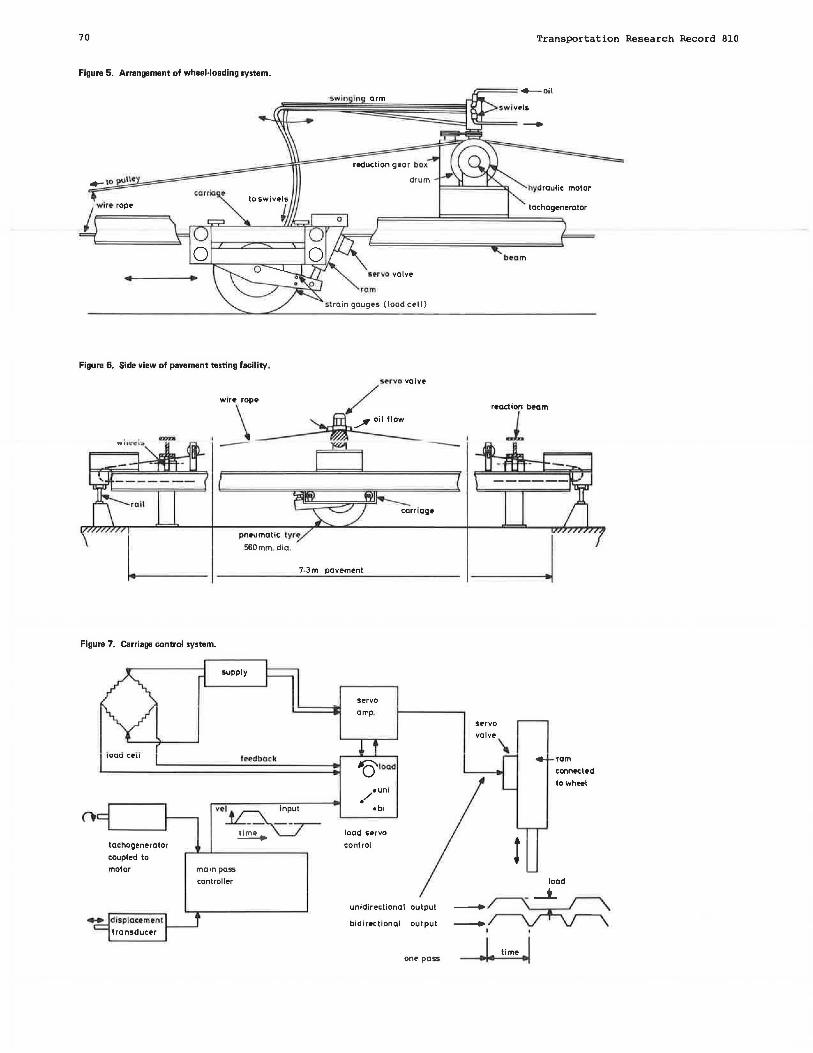
each side that allow it to run along the reaction and guide beams. A servohydraulic loading system is· built into the carriage and operates two rams that lever the wheel up or down about a pivot (Figure 5) . The feedback is obtained from a strain-gauge bridge on the levers. Holes were drilled near the gauges to increase the strain at this location and hence provide larger electrical output.
The servovalve that controls the rams is served hydraulically by short rigid pipes and is protected by filters on the high and low pressure lines. An accumulator is fitted to absorb surges. The carriage has to be supplied with hydraulic power while it moves over a distance of some 7 m. This is accomplished by using flexible hoses carried by a swinging arm (Figures 1 and 5) that also supports the electrical cables. The hoses are connected to the carriage by quick-release swivel couplings.
Support Framework
The carriage runs between two B. 2-m long, 200x200 mm, I-section beams. Both beams are bolted at each end to bogies that run along rails set at right angles to the beams (see Figure 6). This arrangement allows lateral movement of the beams and carriage but is not heavy enough to resist the upthrust of the carriage when wheel load is applied to the pavement. Two transverse portal frames provide the necessary reaction (Figures 1 and 6), and these are bolted to the floor 1. 2 m from each end of the beams. Small wheels are mounted on the beams so that the reaction can continue to be provided during lateral traversing of the wheel under load.
Drive System
Two main drives are necessary to fulfill the testing requirements. The first reciprocates the carriage over the pavement at a constant speed above the area that contains instruments, and the second sets the facility at various transverse positions across the pavement.
Figure 6 illustrates the system used to move the carriage longitudinally. It involves a tensioned wire rope wrapped around a centrally located grooved drum and attached at either end to the carriage via pulleys mounted on the support frame (Figure 6). The drum is driven by a hydraulic motor to which it is connected by a flexible coupling. A remote oil pump supplies pressurized oil to the motor, which is relatively small (compared with an equivalent electric motor) and has a high acceleration capability.
The control system is shown schematically in Figure 7. There is a manual control facility in which the wheel position feedback signal is used to place the wheel at any point along its travel. During testing, an automatic mode is operative and the velocity feedback from a tachogenerator is used to end the acceleration phase and then hold the wheel speed constant until deceleration is initiated by feedback from the position transducer. Reversal of direction is initiated when the velocity output approaches zero.
The wheel position is monitored by the arrangement shown in Figure B. This involves a linear variable differential transformer (LVDT) displacement transducer attached to a screw thread driven by a pulley that is connected to the moving carriage by a long belt. A tachogenerator is axially coupled to the motor shaft (Figure 5) to provide a velocity feedback that is directly related to the speed of the wheel. The command signal in Figure 7 is trapezoidal and provides acceleration, constant velocity, and deceleration before reversal of direction. This motion is also used to move the swinging arm
70
Figure 5. Arrangement of wheel-loading system.
...-10 pu\\fY
carria t
Figure 6. Side view of pavement testing facility.
pneumatic tyre
560mm. dia.
reduction gear bo•
ram
strain gauges (load col I}
L 7.3 m pavement
Figure 7. Carriage control system.
tachogonerator
coupled to
motor
- d sploc .. m&nt transducer
supply
todback
ve~ ~~ui____ -~~
main pass
controller
servo
amp_
't)'load
load servo
control
unidirectional output
bidirectional output
one pass
Transportation Research Record 810
hydraulic motor
tachogenerator
_J
seorvo
valve\
!
ram
connected
to wheel
load
=~ ' '
-~ time J

Transportation Research Record 810
Figure 8. Wheel position feedback transducer.
Figure 9. Swinging arm driven by gearbox coupled to grooved drum.
that carries the hoses and cables to the carriage in synchronization with the carriage movement. This is done by a chain drive and geared connection between the pivot for the arm and the grooved drum, as can be seen in Figure 9.
The main beams and carriage can be moved across the pavement by long stroke rams attached to the end bogies (Figure 10). A similar arrangement to the wheel position feedback transducer is used to convert the lateral position of the assembly to a voltage, but in this case a toothed wheel driven by a fixed chain is used to reduce the lateral movement of the facility to a small displacement. An oil pump was provided for each ram to avoid long lengths of connecting pipe. This results in a positive movement of the rams when the oil pumps are switched on and reduces the risk of skewed movement. When the desired position is reached (as indicated by the position transducer), the pumps are switched off. During testing the lateral movement of the test facility is fully automated and is initiated after a set number of load applications have been completed at any one position.
Electronic Control Systems
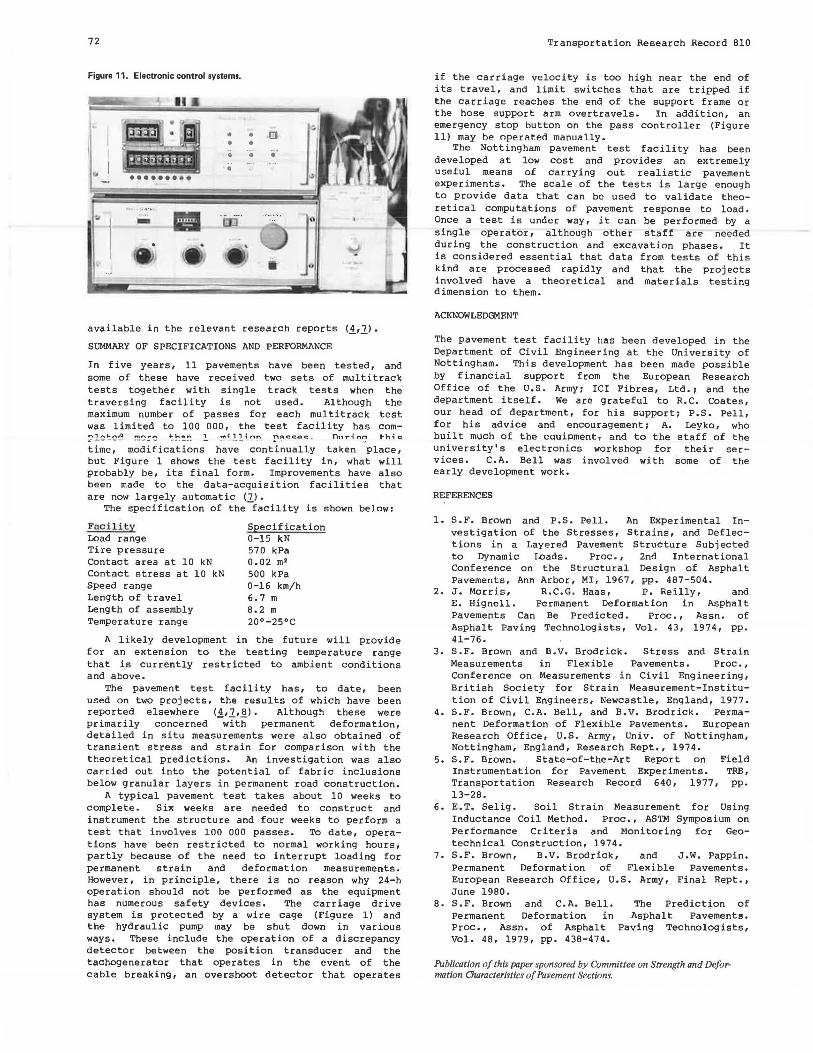
The wheel speed and load and the lateral traversing program are all controlled electronically. Wheel speed is set on a pass controller, which can be operated in either a manual or automatic mode (Figure 11). Under manual control, a position potentiometer controls the location of the wheel in situations that require static loading or when the
Figure 10. Traversing facility.
hydroul k ram·
oil pump
oil pump
valve-
solenoid valve
pavement
solenoid valve
I.
rail
o.s1m trov~I
reaction beam
0
t. ol
loading carriog•
I I I I I I I I I 1 I I I I I I
71
wheel is moved to the end of the track during measurements on the pavement surface. A potentiometer is used to set the velocity level for automatic operation.
The command signal for load control follows the velocity pr.ofile so that the load increases during acceleration, is held constant when the wheel speed is constant, and then decreases during deceleration. Again, a potentiometer (Figure 11), applied under the automatic operation mode, is used to preset the load. If the load is to be applied while the wheel moves only in one direction (as happens on an actual highway), then a switch on the load servocontrol is operated (see Figure 7). This negates the signal for load application in one direction.
A counter on the pass controller is connected to the traverse-control electronic system shown in Figure 11. This unit was designed to control movement of the test facility to preset positions when the count reaches a predetermined number of passes at each of nine positions. These can be selected in any order. The number of passes are dialed into each position by using thumb wheel switches. For the experiments to date, a normal distribution of load applications over a tracking width of 600 mm has been used. Each position ensures a 75-mm overlap of the tire, which has a contact patch of 150 mm width. A complete traverse generally takes 1000 passes. The total number of passes for most tests has been 100 000 and loading has been stopped after 1000, 2000, 5000, 10 000, etc. passes to facilitate permanent strain and surface deformation measurements. Full details of the electronic systems are
72
Figure 11. Electronic control systems.
.. .. • •
• n • • ••
I available in the relevant research reports <i,1>· SUMMARY OF SPECIFICATIONS AND PERFORMANCE
In five years, 11 pavements have been tested, and some of these have received two sets of multitrack tests together with single track tests when the traversing facility is not used. Although the maximum number of passes for each multitrack test was limited to 100 000, the test facility has com-
n11rinn +-hie:
time, modifications have continually taken place, but Figure 1 shows the tes t facility in, what will probably be, its final form. Improvements have also been made to the data-acquisition facilities that are now largely automatic (7).
The specification of the - facility is shown below:
Facility Load range Tire pressure Contact area at 10 kN Contact stress at 10 kN Speed range Length of travel Length of assembly Temperature range
Specification 0-15 kN 570 kPa 0.02 m2
500 kPa 0-16 km/h 6.7 m 8.2 m 20•-25•c
A likely development in the future will provide for an extension to the testing temperature range that is currently restricted to ambient conditions and above.
The pavement test facility has, to date, been used on two projects, the results of which have been reported elsewhere <i,1,J~). Although these were primarily concerned with permanent deformation, detailed in situ measurements were also obtained of transient stress and strain for comparison with the theoretical predictions. An investigation was also carried out into the potential of fabric inclusions below granular layers in permanent road construction.
A typical pavement test takes about 10 weeks to complete. Six weeks are needed to construct and instrument the structure and four weeks to perform a test that involves 100 000 passes. To date, operations have been restricted to normal working hours, partly because of the need to interrupt loading for permanent strain and deformation measurements. However, in principle, there is no reason why 24-h operation should not be performed as the equipment has numerous safety devices. The carriage drive system is protected by a wire cage (Figure 1) and the hydraulic pump may be shut down in various ways. These include the operation of a discrepancy detector between the position transducer and the tachogenerator that operates in the event of the cable breaking, an overshoot detector that operates
Transportation Research Record 810
if the carriage velocity is too high near the end of its travel, and limit switches that are tripped if the carriage reaches the end of the support frame or the hose support arm overtravels. In addition, an emergency stop button on the pass controller (Figure 11) may be operat-.en manually •
The Nottingham pavement test facility has been developed at low cost and provides an extremely useful means of carrying out realistic pavement experiments. The scale of the tests is large enough to provide data that can be used to validate theoretical computations of pavement response to load. Once a test is under way, it c a n be performed by a single operator, although other staff are needed during the construction and excavation phases. It is considered essential that data from tests of this kind are processed rapidly and that the projects involved have a theoretical and materials testing dimension to them.
ACKNOWLEDGMENT
The pavement test facility has been developed in the Department of Civil Engineering at the University of Nottingham. This development has been made possible by financial support from the European Research Off ice of the U.S. Army i ICI Fibres, Ltd. i and the department itself. We are grateful to R.C. Coates, our head of department, for his supporti P.S. Pell, for his advice and encouragementi A. Leyko, who built much of the equipment, and to the staff of the university's electronics workshop for their services. C.A. Bell was involved with some of the early development work.
REFERENCES
1. S.F. Brown and P.S. Pell. An Experimental Investigation of the Stresses, Strains, and Deflections in a Layered Pavement Structure Subjected to Dynamic Loads. Proc., 2nd International Conference on the Structural Design of Asphalt Pavements, Ann Arbor, MI, 1967, pp. 487-504.
2. J. Morris, R.C.G. Haas, P. Reilly, and E. Hignell. Permanent Deformation in Asphalt Pavements Can Be Predicted. Proc., Assn. of Asphalt Paving Technologists, Vol. 43, 1974, pp. 41-76.
3. S . F. Brown and B. V. Brodrick. Stress and Strain Measurements in Flexible Pavements. Proc., Conference on Measurements in Civil Engineering, British Society for Strain Measurement-Institution of Civil Engineers, Newcastle, England, 1977.
4. S . F. Brown, C.A. Bell, and B.V. Brodrick. Permanent Deformation of Flexible Pavements. European Research Office, U.S. Army, Univ. of Nottingham, Nottingham, England, Research Rept., 1974.
5. S.F. Brown. State-of-the-Art Report on Field Instrumentation for Pavement Experiments. TRB, Transportation Research Record 640, 1977, pp. 13-28.
6. E. T. Selig. Soil Strain Measurement for Using Inductance Coil Method. Proc., ASTM Symposium on Performance Criteria and Monitoring for Geotechnical Construction, 1974.
7. S.F. Brown, B.v. Brodrick, and J.W. Pappin. Permanent Deformation of Flexible Pavements. European Research Office, U.S. Army, Final Rept., June 1980.
8. S.F. Brown and C.A. Bell. Permanent Deformation in Proc., Assn. of Asphalt Vol. 48, 1979, pp. 438-474.
The Predict~on of Asphalt Pavements.
Paving Technologists,
Publication of this paper sponsored by Committee on Strength and Deformation Characteristics of Pavement Sections.