Embed Size (px)
Citation preview
1
[For Translation Purposes Only]
May 9, 2016
Nomura Real Estate Master Fund, Inc. Securities Code: 3462
Satoshi Yanagita, Executive Director
Asset Management Company: Nomura Real Estate Asset Management Co., Ltd.
Norio Ambe, President & Chief Executive Officer
Inquiries: Ken Okada
Director and Managing Executive Officer TEL. +81-3-3365-8767 [email protected]
Notice Concerning Property Acquisition and Disposition
Nomura Real Estate Master Fund, Inc. (“Nomura Master Fund” or the “Fund”) announced the decision made today by Nomura Real Estate Asset management Co., Ltd., a licensed investment trust management company retained by the Fund to provide asset management services, that it will acquire and dispose assets (the “Acquisition” and the “Disposition,” respectively; the Acquisition and the Disposition collectively referred to as the “Transaction”), as described below.
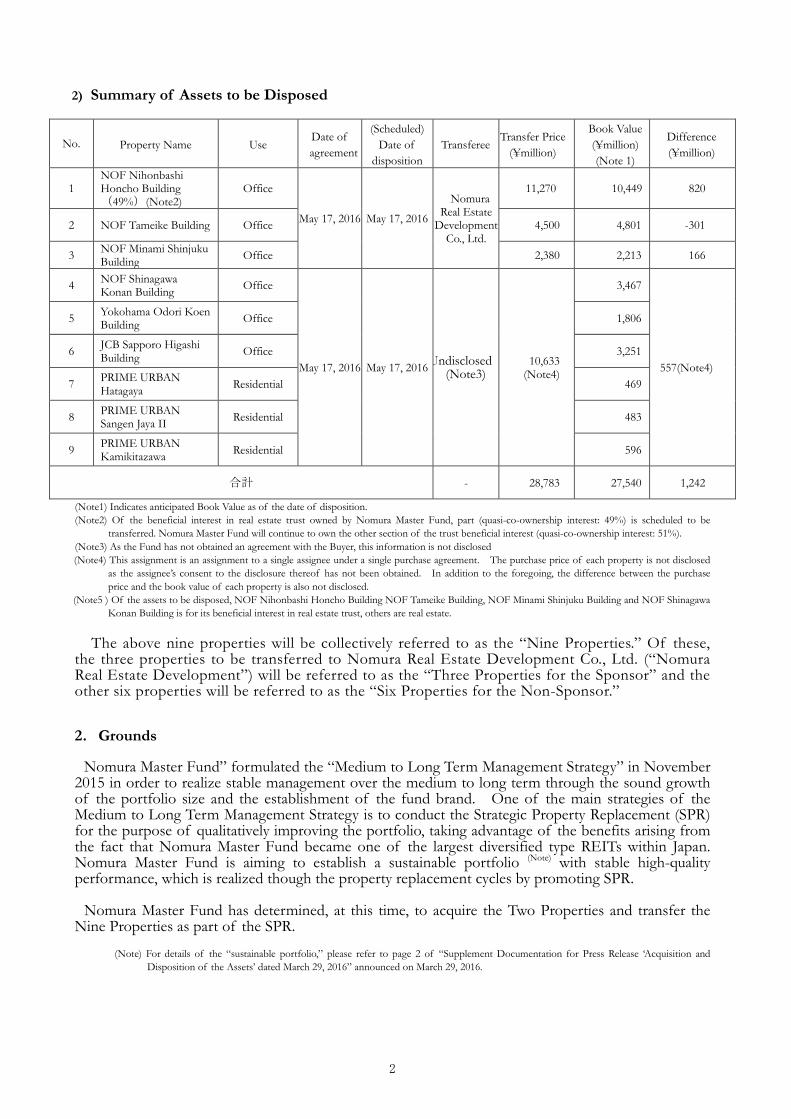
1. Summary of Assets to be Acquired/Disposed 1) Summary of Assets to be Acquired
(Note 1) The amount excluding acquisition related costs, property tax, city planning tax, consumption tax and local consumption tax is stated.
(Note 2) This is the name attached by Nomura Master Fund for this acquisition. (Note 3) “Other” means other use except for logistics, retail, office, and residential. (Note 4) Above two properties to be acquired are real estate. (Note 5) Above two properties are scheduled to acquire using cash on hand and borrowing.
The above two properties will be collectively referred to as the “Two Properties,” hereinafter.
No. Property name Use Date of
agreement
(Scheduled) Date of
acquisition Seller
Acquisition price (¥million)(Note1)
1 Landport Kashiwa Shonan II Logistics May 17, 2016 Sep.1, 2016 Nomura Real Estate Development Co., Ltd. 10,800
2 Ryotokuji University Shin-Urayasu Campus(Land) (Note2)
Other(Note3) (Land)
May 10, 2016 May 26, 2016 Ryotokuji University 4,900
Total 15,700
2
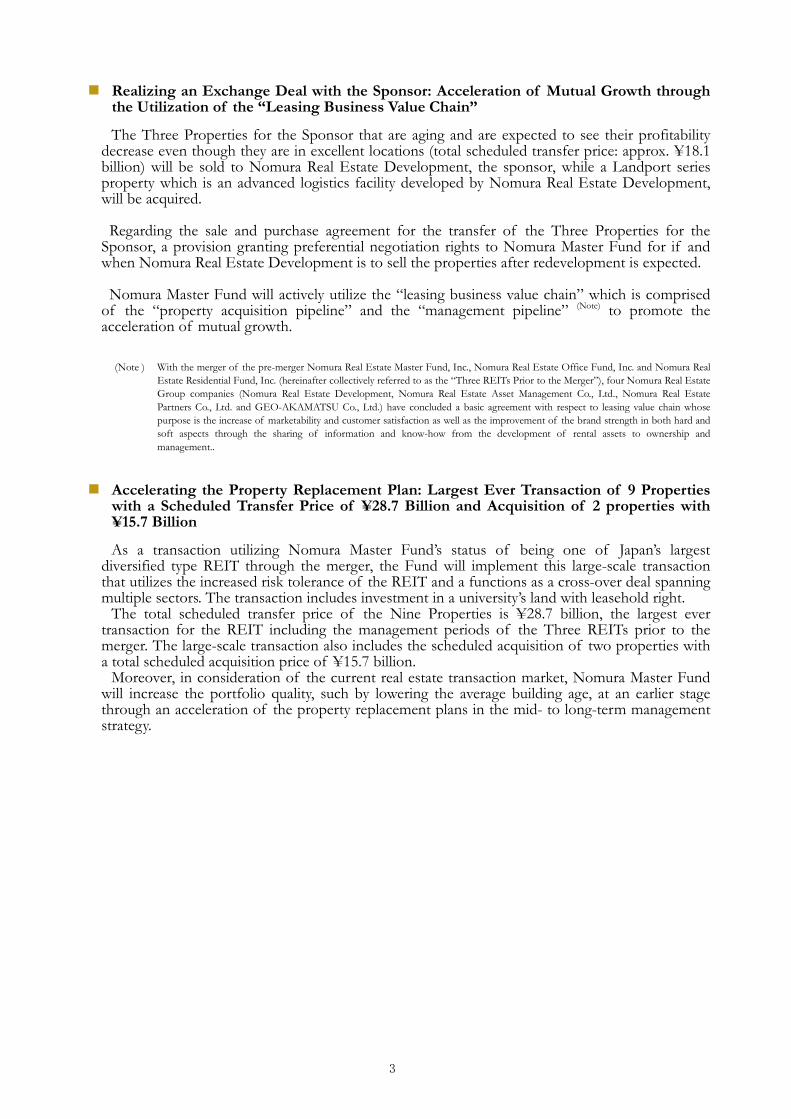
2) Summary of Assets to be Disposed
No. Property Name Use Date of agreement
(Scheduled) Date of
disposition Transferee
Transfer Price (¥million)
Book Value (¥million) (Note 1)
Difference (¥million)
1 NOF Nihonbashi Honcho Building (49%)(Note2)
Office
May 17, 2016 May 17, 2016
Nomura Real Estate
Development Co., Ltd.
11,270 10,449 820
2 NOF Tameike Building Office 4,500 4,801 -301
3 NOF Minami Shinjuku Building Office 2,380 2,213 166
4 NOF Shinagawa Konan Building Office
May 17, 2016 May 17, 2016 Undisclosed (Note3)
10,633 (Note4)
3,467
557(Note4)
5 Yokohama Odori Koen Building Office 1,806
6 JCB Sapporo Higashi Building Office 3,251
7 PRIME URBAN Hatagaya Residential 469
8 PRIME URBAN Sangen Jaya II Residential 483
9 PRIME URBAN Kamikitazawa Residential 596
合計 - 28,783 27,540 1,242
(Note1) Indicates anticipated Book Value as of the date of disposition. (Note2) Of the beneficial interest in real estate trust owned by Nomura Master Fund, part (quasi-co-ownership interest: 49%) is scheduled to be
transferred. Nomura Master Fund will continue to own the other section of the trust beneficial interest (quasi-co-ownership interest: 51%). (Note3) As the Fund has not obtained an agreement with the Buyer, this information is not disclosed (Note4) This assignment is an assignment to a single assignee under a single purchase agreement. The purchase price of each property is not disclosed
as the assignee’s consent to the disclosure thereof has not been obtained. In addition to the foregoing, the difference between the purchase price and the book value of each property is also not disclosed.
(Note5 ) Of the assets to be disposed, NOF Nihonbashi Honcho Building NOF Tameike Building, NOF Minami Shinjuku Building and NOF Shinagawa Konan Building is for its beneficial interest in real estate trust, others are real estate.
The above nine properties will be collectively referred to as the “Nine Properties.” Of these,
the three properties to be transferred to Nomura Real Estate Development Co., Ltd. (“Nomura Real Estate Development”) will be referred to as the “Three Properties for the Sponsor” and the other six properties will be referred to as the “Six Properties for the Non-Sponsor.”
2.Grounds
Nomura Master Fund” formulated the “Medium to Long Term Management Strategy” in November 2015 in order to realize stable management over the medium to long term through the sound growth of the portfolio size and the establishment of the fund brand. One of the main strategies of the Medium to Long Term Management Strategy is to conduct the Strategic Property Replacement (SPR) for the purpose of qualitatively improving the portfolio, taking advantage of the benefits arising from the fact that Nomura Master Fund became one of the largest diversified type REITs within Japan. Nomura Master Fund is aiming to establish a sustainable portfolio (Note) with stable high-quality performance, which is realized though the property replacement cycles by promoting SPR.
Nomura Master Fund has determined, at this time, to acquire the Two Properties and transfer the
Nine Properties as part of the SPR.
(Note) For details of the “sustainable portfolio,” please refer to page 2 of “Supplement Documentation for Press Release ‘Acquisition and Disposition of the Assets’ dated March 29, 2016” announced on March 29, 2016.
3
Realizing an Exchange Deal with the Sponsor: Acceleration of Mutual Growth through the Utilization of the “Leasing Business Value Chain”
The Three Properties for the Sponsor that are aging and are expected to see their profitability decrease even though they are in excellent locations (total scheduled transfer price: approx. ¥18.1 billion) will be sold to Nomura Real Estate Development, the sponsor, while a Landport series property which is an advanced logistics facility developed by Nomura Real Estate Development, will be acquired. Regarding the sale and purchase agreement for the transfer of the Three Properties for the
Sponsor, a provision granting preferential negotiation rights to Nomura Master Fund for if and when Nomura Real Estate Development is to sell the properties after redevelopment is expected. Nomura Master Fund will actively utilize the “leasing business value chain” which is comprised
of the “property acquisition pipeline” and the “management pipeline” (Note) to promote the acceleration of mutual growth.
(Note ) With the merger of the pre-merger Nomura Real Estate Master Fund, Inc., Nomura Real Estate Office Fund, Inc. and Nomura Real
Estate Residential Fund, Inc. (hereinafter collectively referred to as the “Three REITs Prior to the Merger”), four Nomura Real Estate Group companies (Nomura Real Estate Development, Nomura Real Estate Asset Management Co., Ltd., Nomura Real Estate Partners Co., Ltd. and GEO-AKAMATSU Co., Ltd.) have concluded a basic agreement with respect to leasing value chain whose purpose is the increase of marketability and customer satisfaction as well as the improvement of the brand strength in both hard and soft aspects through the sharing of information and know-how from the development of rental assets to ownership and management..
Accelerating the Property Replacement Plan: Largest Ever Transaction of 9 Properties with a Scheduled Transfer Price of ¥28.7 Billion and Acquisition of 2 properties with ¥15.7 Billion
As a transaction utilizing Nomura Master Fund’s status of being one of Japan’s largest diversified type REIT through the merger, the Fund will implement this large-scale transaction that utilizes the increased risk tolerance of the REIT and a functions as a cross-over deal spanning multiple sectors. The transaction includes investment in a university’s land with leasehold right.
The total scheduled transfer price of the Nine Properties is ¥28.7 billion, the largest ever transaction for the REIT including the management periods of the Three REITs prior to the merger. The large-scale transaction also includes the scheduled acquisition of two properties with a total scheduled acquisition price of ¥15.7 billion.
Moreover, in consideration of the current real estate transaction market, Nomura Master Fund will increase the portfolio quality, such by lowering the average building age, at an earlier stage through an acceleration of the property replacement plans in the mid- to long-term management strategy.
4
3.Property Summary
(1) Property Summary of Assets to be Acquired
① Landport Kashiwa Shonan II
<Investment Highlight>
The Landport series advanced and high-functioning logistics facility developed by Nomura Real Estate Development has high brand strengths addressing the detailed needs of tenants.
The Landport series properties owned by Nomura Real Estate including the one to be acquired is now seven properties with approx. 307,000m2 and a total acquisition price of ¥84.61 billion, and high occupancy has been maintained in the last year with an average of 99.8% (Note).
Nomura Real Estate Development is continually advancing the development of the Landport series. The development of seven properties with more than 390,000m2 is underway and continued acquisitions can be expected going forward.
(Note) The average occupancy rate from April 2015 to March 2016. The property is not included, since the completion of the property is April 13, 2016.
A) Location
・ The property is located within 30km from central Tokyo, is approx. 12km from “Kashiwa IC” on the Joban Expressway and is near National Route 16. Access to the Tokyo bay area including the Port of Chiba which boasts the second highest cargo handling volume in Japan (Note) is excellent in addition to major consumption areas in the Tokyo metropolitan area.
(Note) Based on Chiba Prefecture’s 2015 annual report on port statistics.
・ The property is located in an exclusive industrial district thus 24-hour logistics operations are possible.
・ Employment can be secured from a wide area since one of Chiba Prefecture’s leading bed towns is nearby and exclusive shuttle busses operate to and from Abiko Station on the JR Joban Line and Shin-Kamagaya Station on the Hokuso Railway Hokuso Line and other lines, a major transportation network of Chiba Prefecture.
B) Facilities
・ As a slope-type facility, vehicles can connect to first and second floor berths. Moreover, the effective height under beams is 5.5m to 6.5m, an 11m×11m grid is employed for pillar span, floor space can be increased through utilization of the surplus volume ratio and adaptation to seasonal fluctuations of demand and increase of logistics volume after occupancy is possible. As such, the facility has a high functioning capacity and can meet the demands of various tenants.
・ The property has a facility specification that takes the working environment into consideration such as with onsite parking space, office space, excellent cafeteria space, changing rooms, etc.
5
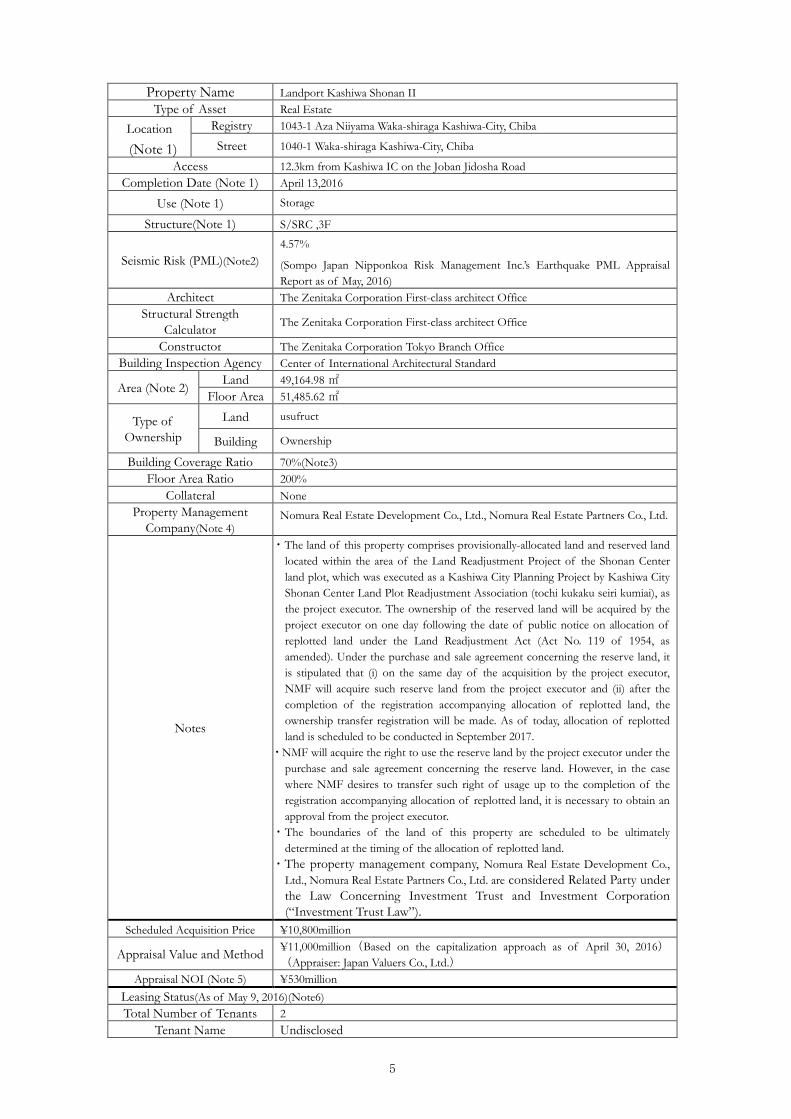
Property Name Landport Kashiwa Shonan II Type of Asset Real Estate
Location (Note 1)
Registry 1043-1 Aza Niiyama Waka-shiraga Kashiwa-City, Chiba
Street 1040-1 Waka-shiraga Kashiwa-City, Chiba
Access 12.3km from Kashiwa IC on the Joban Jidosha Road Completion Date (Note 1) April 13,2016
Use (Note 1) Storage Structure(Note 1) S/SRC ,3F
Seismic Risk (PML)(Note2) 4.57%
(Sompo Japan Nipponkoa Risk Management Inc.’s Earthquake PML Appraisal Report as of May, 2016)
Architect The Zenitaka Corporation First-class architect Office Structural Strength
Calculator The Zenitaka Corporation First-class architect Office
Constructor The Zenitaka Corporation Tokyo Branch Office Building Inspection Agency Center of International Architectural Standard
Area (Note 2) Land 49,164.98 ㎡ Floor Area 51,485.62 ㎡
Type of Ownership
Land usufruct
Building Ownership
Building Coverage Ratio 70%(Note3) Floor Area Ratio 200%
Collateral None Property Management
Company(Note 4) Nomura Real Estate Development Co., Ltd., Nomura Real Estate Partners Co., Ltd.
Notes
・The land of this property comprises provisionally-allocated land and reserved land located within the area of the Land Readjustment Project of the Shonan Center land plot, which was executed as a Kashiwa City Planning Project by Kashiwa City Shonan Center Land Plot Readjustment Association (tochi kukaku seiri kumiai), as the project executor. The ownership of the reserved land will be acquired by the project executor on one day following the date of public notice on allocation of replotted land under the Land Readjustment Act (Act No. 119 of 1954, as amended). Under the purchase and sale agreement concerning the reserve land, it is stipulated that (i) on the same day of the acquisition by the project executor, NMF will acquire such reserve land from the project executor and (ii) after the completion of the registration accompanying allocation of replotted land, the ownership transfer registration will be made. As of today, allocation of replotted land is scheduled to be conducted in September 2017.
・NMF will acquire the right to use the reserve land by the project executor under the purchase and sale agreement concerning the reserve land. However, in the case where NMF desires to transfer such right of usage up to the completion of the registration accompanying allocation of replotted land, it is necessary to obtain an approval from the project executor.
・The boundaries of the land of this property are scheduled to be ultimately determined at the timing of the allocation of replotted land.
・The property management company, Nomura Real Estate Development Co., Ltd., Nomura Real Estate Partners Co., Ltd. are considered Related Party under the Law Concerning Investment Trust and Investment Corporation (“Investment Trust Law”).
Scheduled Acquisition Price ¥10,800million
Appraisal Value and Method ¥11,000million(Based on the capitalization approach as of April 30, 2016) (Appraiser: Japan Valuers Co., Ltd.)
Appraisal NOI (Note 5) ¥530million Leasing Status(As of May 9, 2016)(Note6) Total Number of Tenants 2
Tenant Name Undisclosed
6
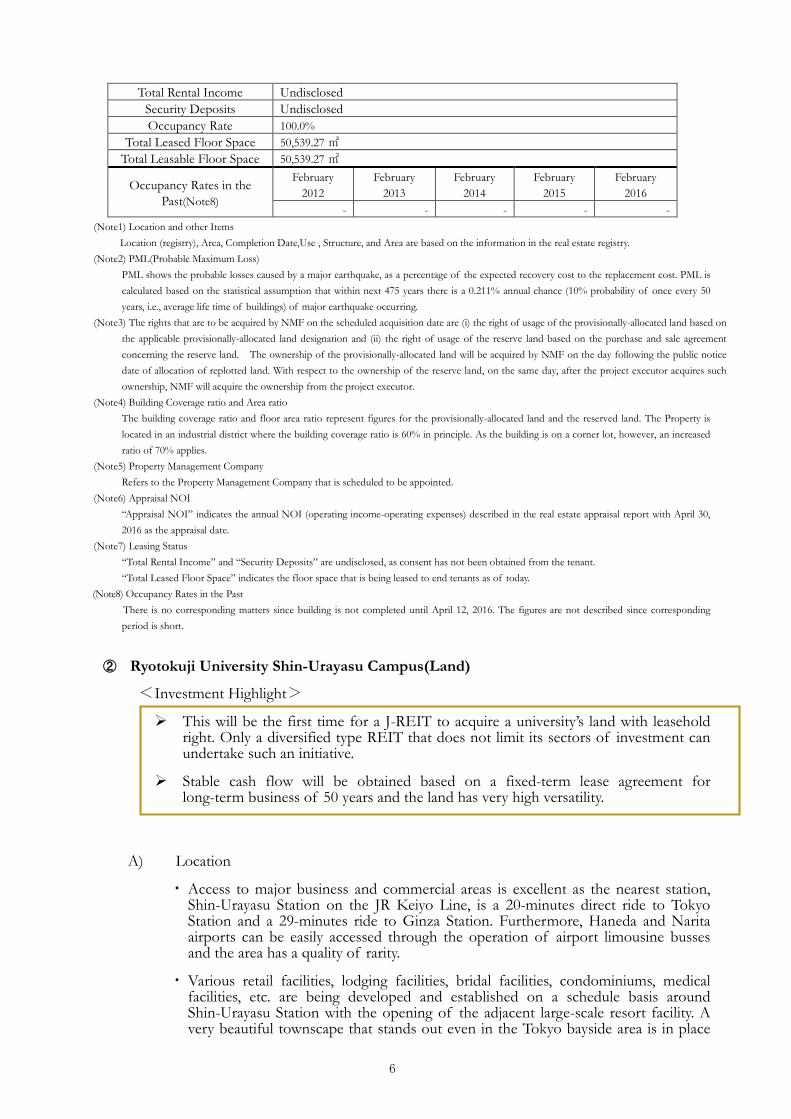
Total Rental Income Undisclosed Security Deposits Undisclosed Occupancy Rate 100.0%
Total Leased Floor Space 50,539.27 ㎡ Total Leasable Floor Space 50,539.27 ㎡
Occupancy Rates in the Past(Note8)
February 2012
February 2013
February 2014
February 2015
February 2016
- - - - - (Note1) Location and other Items
Location (registry), Area, Completion Date,Use , Structure, and Area are based on the information in the real estate registry. (Note2) PML(Probable Maximum Loss)
PML shows the probable losses caused by a major earthquake, as a percentage of the expected recovery cost to the replacement cost. PML is calculated based on the statistical assumption that within next 475 years there is a 0.211% annual chance (10% probability of once every 50 years, i.e., average life time of buildings) of major earthquake occurring.
(Note3) The rights that are to be acquired by NMF on the scheduled acquisition date are (i) the right of usage of the provisionally-allocated land based on the applicable provisionally-allocated land designation and (ii) the right of usage of the reserve land based on the purchase and sale agreement concerning the reserve land. The ownership of the provisionally-allocated land will be acquired by NMF on the day following the public notice date of allocation of replotted land. With respect to the ownership of the reserve land, on the same day, after the project executor acquires such ownership, NMF will acquire the ownership from the project executor.
(Note4) Building Coverage ratio and Area ratio The building coverage ratio and floor area ratio represent figures for the provisionally-allocated land and the reserved land. The Property is located in an industrial district where the building coverage ratio is 60% in principle. As the building is on a corner lot, however, an increased ratio of 70% applies.
(Note5) Property Management Company Refers to the Property Management Company that is scheduled to be appointed.
(Note6) Appraisal NOI “Appraisal NOI” indicates the annual NOI (operating income-operating expenses) described in the real estate appraisal report with April 30, 2016 as the appraisal date.
(Note7) Leasing Status “Total Rental Income” and “Security Deposits” are undisclosed, as consent has not been obtained from the tenant. “Total Leased Floor Space” indicates the floor space that is being leased to end tenants as of today.
(Note8) Occupancy Rates in the Past There is no corresponding matters since building is not completed until April 12, 2016. The figures are not described since corresponding period is short.
② Ryotokuji University Shin-Urayasu Campus(Land) <Investment Highlight>
This will be the first time for a J-REIT to acquire a university’s land with leasehold right. Only a diversified type REIT that does not limit its sectors of investment can undertake such an initiative.
Stable cash flow will be obtained based on a fixed-term lease agreement for long-term business of 50 years and the land has very high versatility.
A) Location
・ Access to major business and commercial areas is excellent as the nearest station, Shin-Urayasu Station on the JR Keiyo Line, is a 20-minutes direct ride to Tokyo Station and a 29-minutes ride to Ginza Station. Furthermore, Haneda and Narita airports can be easily accessed through the operation of airport limousine busses and the area has a quality of rarity.
・ Various retail facilities, lodging facilities, bridal facilities, condominiums, medical facilities, etc. are being developed and established on a schedule basis around Shin-Urayasu Station with the opening of the adjacent large-scale resort facility. A very beautiful townscape that stands out even in the Tokyo bayside area is in place
7
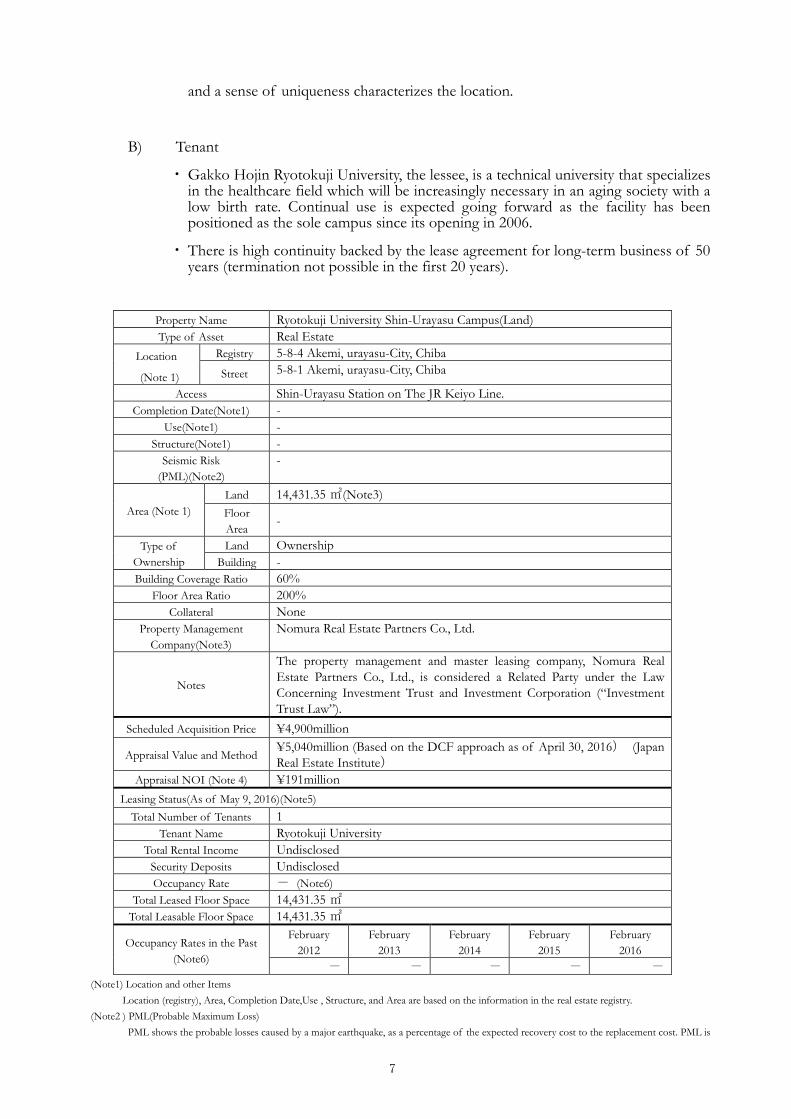
and a sense of uniqueness characterizes the location.
B) Tenant
・ Gakko Hojin Ryotokuji University, the lessee, is a technical university that specializes in the healthcare field which will be increasingly necessary in an aging society with a low birth rate. Continual use is expected going forward as the facility has been positioned as the sole campus since its opening in 2006.
・ There is high continuity backed by the lease agreement for long-term business of 50 years (termination not possible in the first 20 years).
Property Name Ryotokuji University Shin-Urayasu Campus(Land) Type of Asset Real Estate
Location
(Note 1)
Registry 5-8-4 Akemi, urayasu-City, Chiba Street 5-8-1 Akemi, urayasu-City, Chiba
Access Shin-Urayasu Station on The JR Keiyo Line. Completion Date(Note1) -
Use(Note1) - Structure(Note1) -
Seismic Risk (PML)(Note2)
-
Area (Note 1) Land 14,431.35 ㎡(Note3) Floor Area
-
Type of Ownership
Land Ownership Building -
Building Coverage Ratio 60% Floor Area Ratio 200%
Collateral None Property Management
Company(Note3) Nomura Real Estate Partners Co., Ltd.
Notes
The property management and master leasing company, Nomura Real Estate Partners Co., Ltd., is considered a Related Party under the Law Concerning Investment Trust and Investment Corporation (“Investment Trust Law”).
Scheduled Acquisition Price ¥4,900million
Appraisal Value and Method ¥5,040million (Based on the DCF approach as of April 30, 2016) (Japan Real Estate Institute)
Appraisal NOI (Note 4) ¥191million Leasing Status(As of May 9, 2016)(Note5)
Total Number of Tenants 1 Tenant Name Ryotokuji University
Total Rental Income Undisclosed Security Deposits Undisclosed Occupancy Rate - (Note6)
Total Leased Floor Space 14,431.35 ㎡ Total Leasable Floor Space 14,431.35 ㎡
Occupancy Rates in the Past (Note6)
February 2012
February 2013
February 2014
February 2015
February 2016
- - - - - (Note1) Location and other Items
Location (registry), Area, Completion Date,Use , Structure, and Area are based on the information in the real estate registry. (Note2 ) PML(Probable Maximum Loss)
PML shows the probable losses caused by a major earthquake, as a percentage of the expected recovery cost to the replacement cost. PML is
8
calculated based on the statistical assumption that within next 475 years there is a 0.211% annual chance (10% probability of once every 50 years, i.e., average life time of buildings) of major earthquake occurring.
(Note3) Property Management Company Refers to the Property Management Company that is scheduled to be appointed.
(Note4) Appraisal NOI The initial-year net operating income using the DCF approach
(Note5)Leasing Status “Total Rental Income” and “Security Deposits” are undisclosed, as consent has not been obtained from the tenant. “Total Leased Floor Spaced “Security Deposits” are undisclosed, as consent has not been obtained from the tenant. replacement cost. PML is calculated based “Total Leasable Floor Space“Security Deposits” are undisclosed, as consent has
(Note6)Occupancy Rates in the Past The past occupancy rates are not measured as the Property was self-owned.
(2) Property Summary of Assets to be Disposed
① NOF Nihonbashi Honcho Building
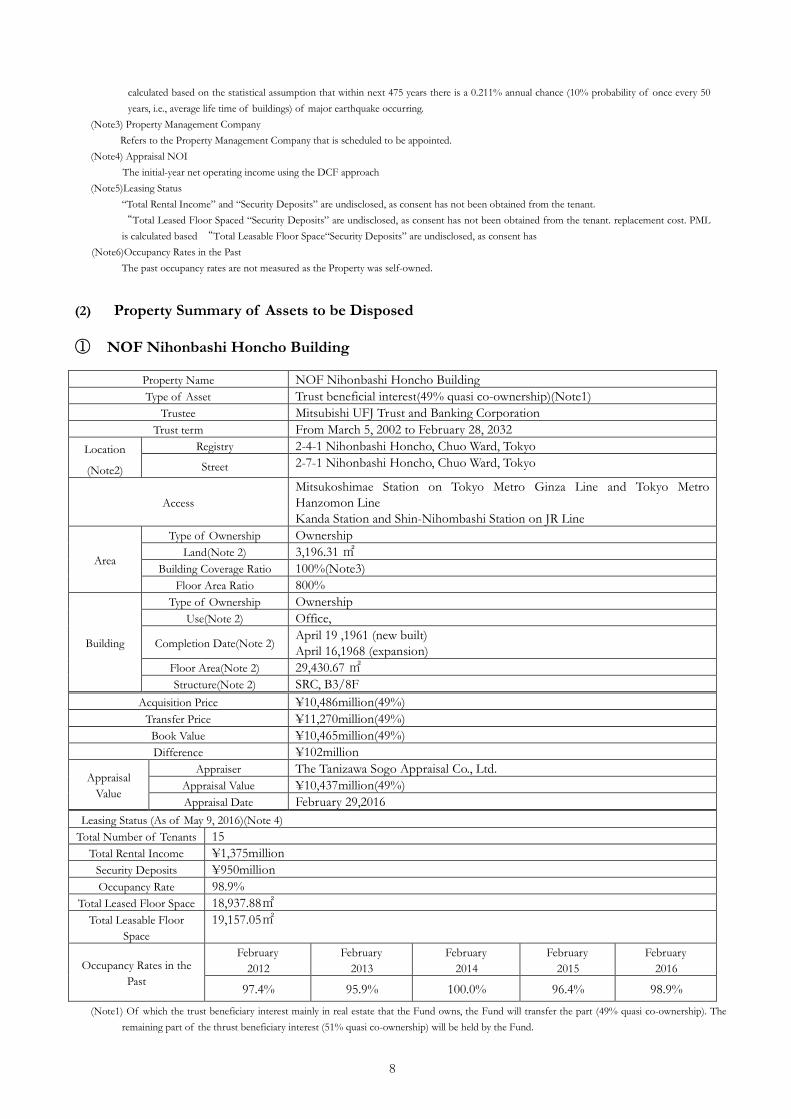
Property Name NOF Nihonbashi Honcho Building Type of Asset Trust beneficial interest(49% quasi co-ownership)(Note1)
Trustee Mitsubishi UFJ Trust and Banking Corporation Trust term From March 5, 2002 to February 28, 2032
Location
(Note2)
Registry 2-4-1 Nihonbashi Honcho, Chuo Ward, Tokyo Street 2-7-1 Nihonbashi Honcho, Chuo Ward, Tokyo
Access Mitsukoshimae Station on Tokyo Metro Ginza Line and Tokyo Metro Hanzomon Line Kanda Station and Shin-Nihombashi Station on JR Line
Area
Type of Ownership Ownership Land(Note 2) 3,196.31 ㎡
Building Coverage Ratio 100%(Note3) Floor Area Ratio 800%
Building
Type of Ownership Ownership Use(Note 2) Office,
Completion Date(Note 2) April 19 ,1961 (new built) April 16,1968 (expansion)
Floor Area(Note 2) 29,430.67 ㎡ Structure(Note 2) SRC, B3/8F
Acquisition Price ¥10,486million(49%) Transfer Price ¥11,270million(49%) Book Value ¥10,465million(49%) Difference ¥102million
Appraisal Value
Appraiser The Tanizawa Sogo Appraisal Co., Ltd. Appraisal Value ¥10,437million(49%) Appraisal Date February 29,2016
Leasing Status (As of May 9, 2016)(Note 4) Total Number of Tenants 15
Total Rental Income ¥1,375million Security Deposits ¥950million Occupancy Rate 98.9%
Total Leased Floor Space 18,937.88㎡ Total Leasable Floor
Space 19,157.05㎡
Occupancy Rates in the Past
February 2012
February 2013
February 2014
February 2015
February 2016
97.4% 95.9% 100.0% 96.4% 98.9% (Note1) Of which the trust beneficiary interest mainly in real estate that the Fund owns, the Fund will transfer the part (49% quasi co-ownership). The
remaining part of the thrust beneficiary interest (51% quasi co-ownership) will be held by the Fund.
9
(Note2) Location and other Items Location (registry), Area, Completion Date,Use , Structure, and Area are based on the information in the real estate registry.
(Note3) Building Coverage As the property is located within a commercial district, the Building Coverage is originally supposed to be 80%; however, the Building Coverage has been increased to 100%, as the property is in a fire prevention zone and certified fireproof.
(Note4) Leasing Status “Total Rent Income” is the amount obtained by multiplying the monthly rent stated the lease agreement with end tenants actually leasing the building of the Property as of today by 12 (rounded down to the nearest million yen). “Security Deposits” indicates the amount of security deposits, etc. stated in the aforementioned lease agreement (rounded down the nearest million yen). “Total Leased Floor Space” indicates the floor space that is being leased to end tenants as of today.
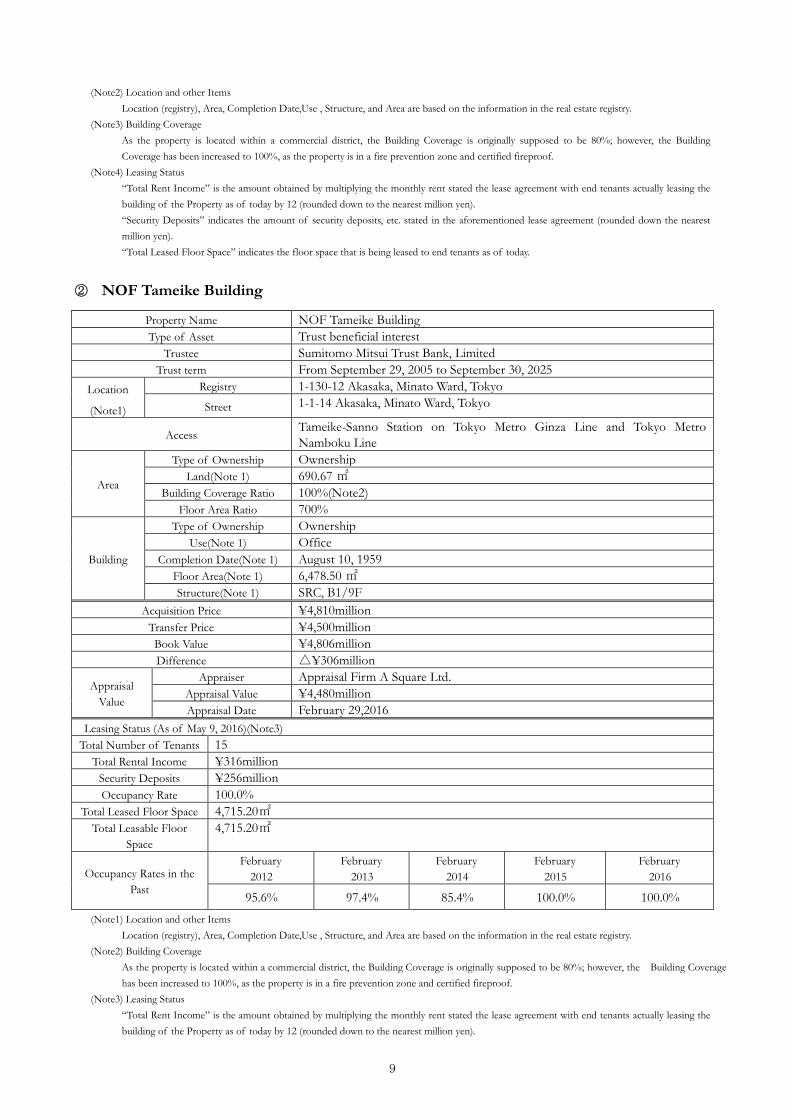
② NOF Tameike Building
Property Name NOF Tameike Building Type of Asset Trust beneficial interest
Trustee Sumitomo Mitsui Trust Bank, Limited Trust term From September 29, 2005 to September 30, 2025
Location
(Note1)
Registry 1-130-12 Akasaka, Minato Ward, Tokyo Street 1-1-14 Akasaka, Minato Ward, Tokyo
Access Tameike-Sanno Station on Tokyo Metro Ginza Line and Tokyo Metro Namboku Line
Area
Type of Ownership Ownership Land(Note 1) 690.67 ㎡
Building Coverage Ratio 100%(Note2) Floor Area Ratio 700%
Building
Type of Ownership Ownership Use(Note 1) Office
Completion Date(Note 1) August 10, 1959 Floor Area(Note 1) 6,478.50 ㎡ Structure(Note 1) SRC, B1/9F
Acquisition Price ¥4,810million Transfer Price ¥4,500million Book Value ¥4,806million Difference △¥306million
Appraisal Value
Appraiser Appraisal Firm A Square Ltd. Appraisal Value ¥4,480million Appraisal Date February 29,2016
Leasing Status (As of May 9, 2016)(Note3) Total Number of Tenants 15
Total Rental Income ¥316million Security Deposits ¥256million Occupancy Rate 100.0%
Total Leased Floor Space 4,715.20㎡ Total Leasable Floor
Space 4,715.20㎡
Occupancy Rates in the Past
February 2012
February 2013
February 2014
February 2015
February 2016
95.6% 97.4% 85.4% 100.0% 100.0% (Note1) Location and other Items
Location (registry), Area, Completion Date,Use , Structure, and Area are based on the information in the real estate registry. (Note2) Building Coverage
As the property is located within a commercial district, the Building Coverage is originally supposed to be 80%; however, the Building Coverage has been increased to 100%, as the property is in a fire prevention zone and certified fireproof.
(Note3) Leasing Status “Total Rent Income” is the amount obtained by multiplying the monthly rent stated the lease agreement with end tenants actually leasing the building of the Property as of today by 12 (rounded down to the nearest million yen).
10
“Security Deposits” indicates the amount of security deposits, etc. stated in the aforementioned lease agreement (rounded down the nearest million yen). “Total Leased Floor Space” indicates the floor space that is being leased to end tenants as of today.
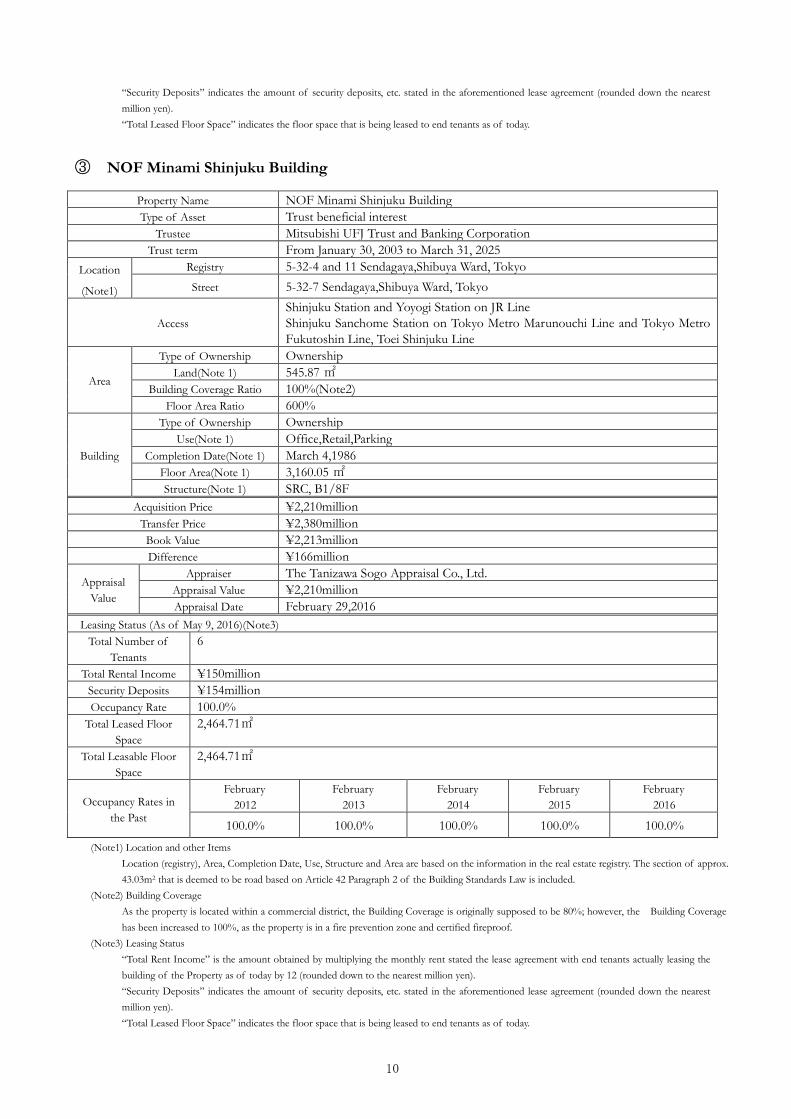
③ NOF Minami Shinjuku Building
Property Name NOF Minami Shinjuku Building Type of Asset Trust beneficial interest
Trustee Mitsubishi UFJ Trust and Banking Corporation Trust term From January 30, 2003 to March 31, 2025
Location
(Note1)
Registry 5-32-4 and 11 Sendagaya,Shibuya Ward, Tokyo Street 5-32-7 Sendagaya,Shibuya Ward, Tokyo
Access Shinjuku Station and Yoyogi Station on JR Line Shinjuku Sanchome Station on Tokyo Metro Marunouchi Line and Tokyo Metro Fukutoshin Line, Toei Shinjuku Line
Area
Type of Ownership Ownership Land(Note 1) 545.87 ㎡
Building Coverage Ratio 100%(Note2) Floor Area Ratio 600%
Building
Type of Ownership Ownership Use(Note 1) Office,Retail,Parking
Completion Date(Note 1) March 4,1986 Floor Area(Note 1) 3,160.05 ㎡ Structure(Note 1) SRC, B1/8F
Acquisition Price ¥2,210million Transfer Price ¥2,380million Book Value ¥2,213million Difference ¥166million
Appraisal Value
Appraiser The Tanizawa Sogo Appraisal Co., Ltd. Appraisal Value ¥2,210million Appraisal Date February 29,2016
Leasing Status (As of May 9, 2016)(Note3) Total Number of
Tenants 6
Total Rental Income ¥150million Security Deposits ¥154million Occupancy Rate 100.0%
Total Leased Floor Space
2,464.71㎡
Total Leasable Floor Space
2,464.71㎡
Occupancy Rates in the Past
February 2012
February 2013
February 2014
February 2015
February 2016
100.0% 100.0% 100.0% 100.0% 100.0% (Note1) Location and other Items
Location (registry), Area, Completion Date, Use, Structure and Area are based on the information in the real estate registry. The section of approx. 43.03m2 that is deemed to be road based on Article 42 Paragraph 2 of the Building Standards Law is included.
(Note2) Building Coverage As the property is located within a commercial district, the Building Coverage is originally supposed to be 80%; however, the Building Coverage has been increased to 100%, as the property is in a fire prevention zone and certified fireproof.
(Note3) Leasing Status “Total Rent Income” is the amount obtained by multiplying the monthly rent stated the lease agreement with end tenants actually leasing the building of the Property as of today by 12 (rounded down to the nearest million yen). “Security Deposits” indicates the amount of security deposits, etc. stated in the aforementioned lease agreement (rounded down the nearest million yen). “Total Leased Floor Space” indicates the floor space that is being leased to end tenants as of today.
11
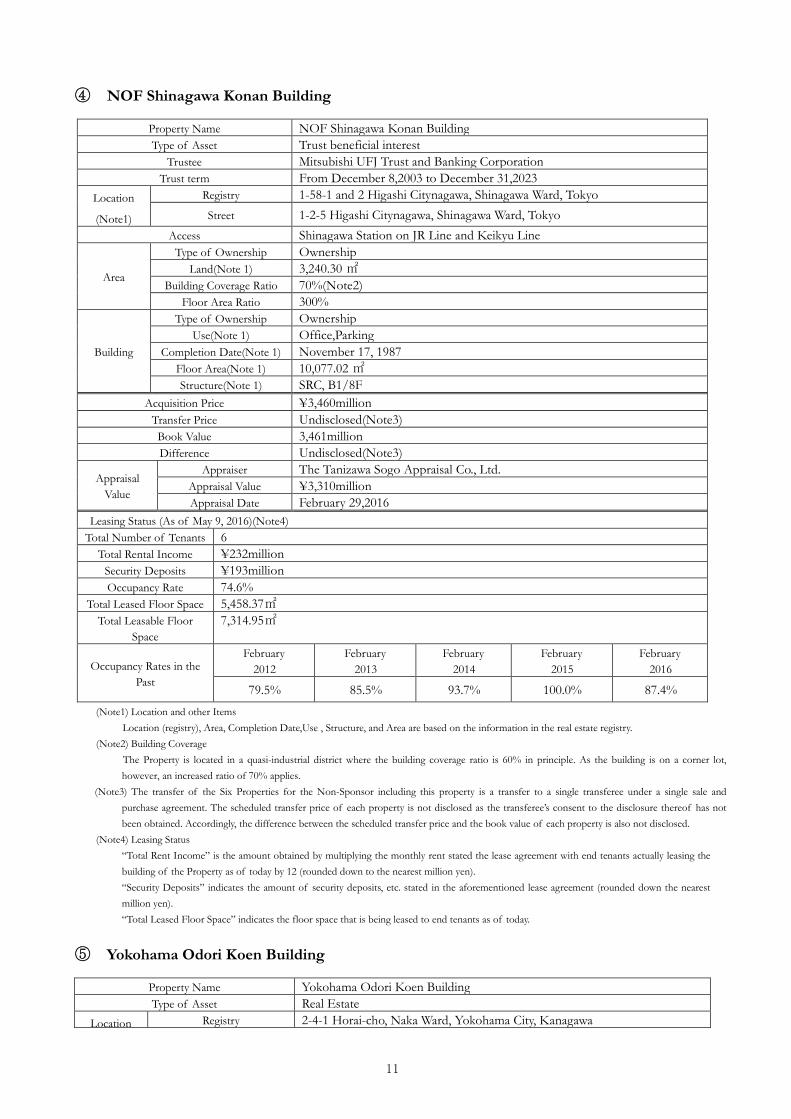
④ NOF Shinagawa Konan Building
Property Name NOF Shinagawa Konan Building Type of Asset Trust beneficial interest
Trustee Mitsubishi UFJ Trust and Banking Corporation Trust term From December 8,2003 to December 31,2023
Location
(Note1)
Registry 1-58-1 and 2 Higashi Citynagawa, Shinagawa Ward, Tokyo Street 1-2-5 Higashi Citynagawa, Shinagawa Ward, Tokyo
Access Shinagawa Station on JR Line and Keikyu Line
Area
Type of Ownership Ownership Land(Note 1) 3,240.30 ㎡
Building Coverage Ratio 70%(Note2) Floor Area Ratio 300%
Building
Type of Ownership Ownership Use(Note 1) Office,Parking
Completion Date(Note 1) November 17, 1987 Floor Area(Note 1) 10,077.02 ㎡ Structure(Note 1) SRC, B1/8F
Acquisition Price ¥3,460million Transfer Price Undisclosed(Note3) Book Value 3,461million Difference Undisclosed(Note3)
Appraisal Value
Appraiser The Tanizawa Sogo Appraisal Co., Ltd. Appraisal Value ¥3,310million Appraisal Date February 29,2016
Leasing Status (As of May 9, 2016)(Note4) Total Number of Tenants 6
Total Rental Income ¥232million Security Deposits ¥193million Occupancy Rate 74.6%
Total Leased Floor Space 5,458.37㎡ Total Leasable Floor
Space 7,314.95㎡
Occupancy Rates in the Past
February 2012
February 2013
February 2014
February 2015
February 2016
79.5% 85.5% 93.7% 100.0% 87.4% (Note1) Location and other Items
Location (registry), Area, Completion Date,Use , Structure, and Area are based on the information in the real estate registry. (Note2) Building Coverage
The Property is located in a quasi-industrial district where the building coverage ratio is 60% in principle. As the building is on a corner lot, however, an increased ratio of 70% applies.
(Note3) The transfer of the Six Properties for the Non-Sponsor including this property is a transfer to a single transferee under a single sale and purchase agreement. The scheduled transfer price of each property is not disclosed as the transferee’s consent to the disclosure thereof has not been obtained. Accordingly, the difference between the scheduled transfer price and the book value of each property is also not disclosed.
(Note4) Leasing Status “Total Rent Income” is the amount obtained by multiplying the monthly rent stated the lease agreement with end tenants actually leasing the building of the Property as of today by 12 (rounded down to the nearest million yen). “Security Deposits” indicates the amount of security deposits, etc. stated in the aforementioned lease agreement (rounded down the nearest million yen). “Total Leased Floor Space” indicates the floor space that is being leased to end tenants as of today.
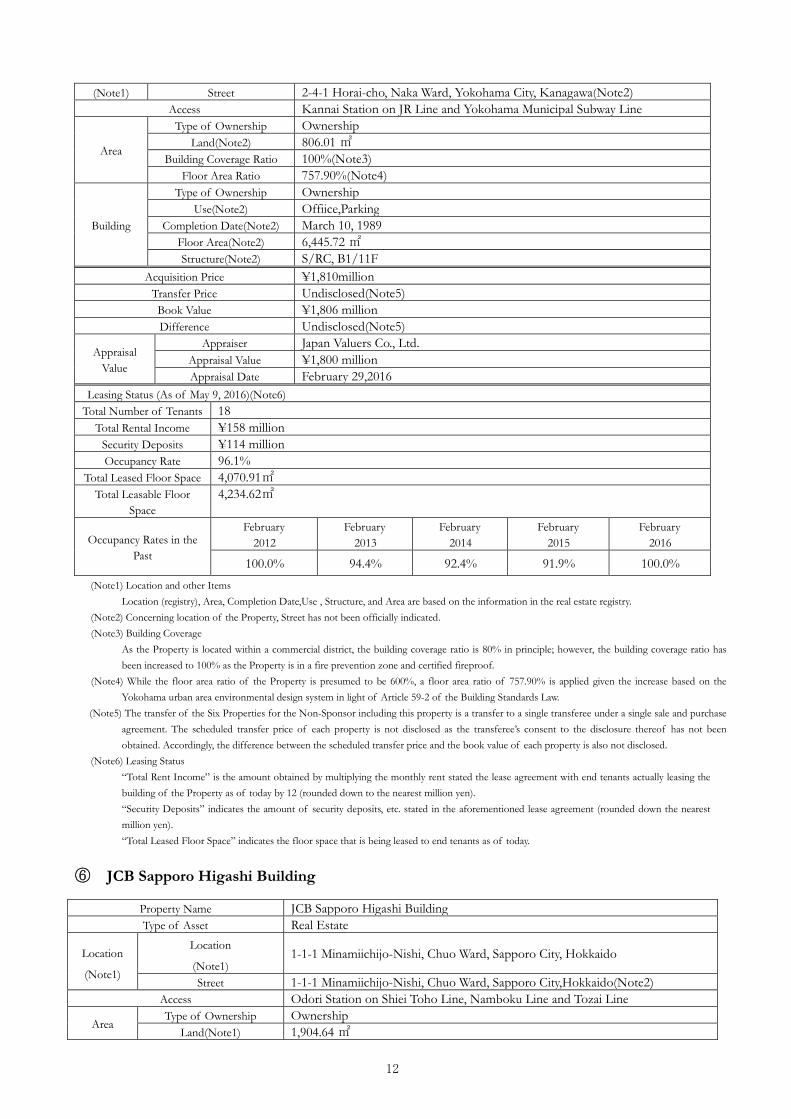
⑤ Yokohama Odori Koen Building
Property Name Yokohama Odori Koen Building Type of Asset Real Estate
Location Registry 2-4-1 Horai-cho, Naka Ward, Yokohama City, Kanagawa
12
(Note1) Street 2-4-1 Horai-cho, Naka Ward, Yokohama City, Kanagawa(Note2) Access Kannai Station on JR Line and Yokohama Municipal Subway Line
Area
Type of Ownership Ownership Land(Note2) 806.01 ㎡
Building Coverage Ratio 100%(Note3) Floor Area Ratio 757.90%(Note4)
Building
Type of Ownership Ownership Use(Note2) Offiice,Parking
Completion Date(Note2) March 10, 1989 Floor Area(Note2) 6,445.72 ㎡ Structure(Note2) S/RC, B1/11F
Acquisition Price ¥1,810million Transfer Price Undisclosed(Note5) Book Value ¥1,806 million Difference Undisclosed(Note5)
Appraisal Value
Appraiser Japan Valuers Co., Ltd. Appraisal Value ¥1,800 million Appraisal Date February 29,2016
Leasing Status (As of May 9, 2016)(Note6) Total Number of Tenants 18
Total Rental Income ¥158 million Security Deposits ¥114 million Occupancy Rate 96.1%
Total Leased Floor Space 4,070.91㎡ Total Leasable Floor
Space 4,234.62㎡
Occupancy Rates in the Past
February 2012
February 2013
February 2014
February 2015
February 2016
100.0% 94.4% 92.4% 91.9% 100.0% (Note1) Location and other Items
Location (registry), Area, Completion Date,Use , Structure, and Area are based on the information in the real estate registry. (Note2) Concerning location of the Property, Street has not been officially indicated. (Note3) Building Coverage
As the Property is located within a commercial district, the building coverage ratio is 80% in principle; however, the building coverage ratio has been increased to 100% as the Property is in a fire prevention zone and certified fireproof.
(Note4) While the floor area ratio of the Property is presumed to be 600%, a floor area ratio of 757.90% is applied given the increase based on the Yokohama urban area environmental design system in light of Article 59-2 of the Building Standards Law.
(Note5) The transfer of the Six Properties for the Non-Sponsor including this property is a transfer to a single transferee under a single sale and purchase agreement. The scheduled transfer price of each property is not disclosed as the transferee’s consent to the disclosure thereof has not been obtained. Accordingly, the difference between the scheduled transfer price and the book value of each property is also not disclosed.
(Note6) Leasing Status “Total Rent Income” is the amount obtained by multiplying the monthly rent stated the lease agreement with end tenants actually leasing the building of the Property as of today by 12 (rounded down to the nearest million yen). “Security Deposits” indicates the amount of security deposits, etc. stated in the aforementioned lease agreement (rounded down the nearest million yen). “Total Leased Floor Space” indicates the floor space that is being leased to end tenants as of today.
⑥ JCB Sapporo Higashi Building
Property Name JCB Sapporo Higashi Building Type of Asset Real Estate
Location
(Note1)
Location
(Note1) 1-1-1 Minamiichijo-Nishi, Chuo Ward, Sapporo City, Hokkaido
Street 1-1-1 Minamiichijo-Nishi, Chuo Ward, Sapporo City,Hokkaido(Note2) Access Odori Station on Shiei Toho Line, Namboku Line and Tozai Line
Area Type of Ownership Ownership
Land(Note1) 1,904.64 ㎡

13
Building Coverage Ratio 100%(Note3) Floor Area Ratio 800%
Building
Type of Ownership Ownership Use(Note1) Office,Retail,Parking
Completion Date(Note1) October 26,1966 Floor Area(Note1) 9,062.04 ㎡ Structure(Note1) SRC, B1/7F
Acquisition Price ¥3,270 million Transfer Price Undisclosed(Note4) Book Value ¥409 million Difference Undisclosed(Note4)
Appraisal Value
Appraiser Japan Real Estate Institute Appraisal Value ¥3,260 million Appraisal Date February 29,2016
Leasing Status (As of May 9, 2016)(Note5) Total Number of Tenants 1
Total Rental Income ¥279 million Security Deposits ¥153 million Occupancy Rate 100.0%
Total Leased Floor Space 9,062.04㎡ Total Leasable Floor
Space 9,062.04㎡
Occupancy Rates in the Past
February 2012
February 2013
February 2014
February 2015
February 2016
100.0% 100.0% 100.0% 100.0% 100.0% (Note1) Location and other Items
Location (registry), Area, Completion Date,Use , Structure, and Area are based on the information in the real estate registry. (Note2) Concerning location of the Property, Street has not been officially indicated. (Note3) Building Coverage
As the Property is located within a commercial district, the building coverage ratio is 80% in principle; however, the building coverage ratio has been increased to 100% as the property is in a fire prevention zone and certified fireproof.
(Note4) The transfer of the Six Properties for the Non-Sponsor including this property is a transfer to a single transferee under a single sale and purchase agreement. The scheduled transfer price of each property is not disclosed as the transfereer a single uilding coverage ratio hf has not been obtained. Accordingly, the difference between the scheduled transfer price and the book value of each property is also not disclosed.
(Note5) Leasing Status “Total Rent Income” is the amount obtained by multiplying the monthly rent stated the lease agreement with end tenants actually leasing the building of the Property as of today by 12 (rounded down to the nearest million yen). “Security Deposits” indicates the amount of security deposits, etc. stated in the aforementioned lease agreement (rounded down the nearest million yen). “Total Leased Floor Space” indicates the floor space that is being leased to end tenants as of today.
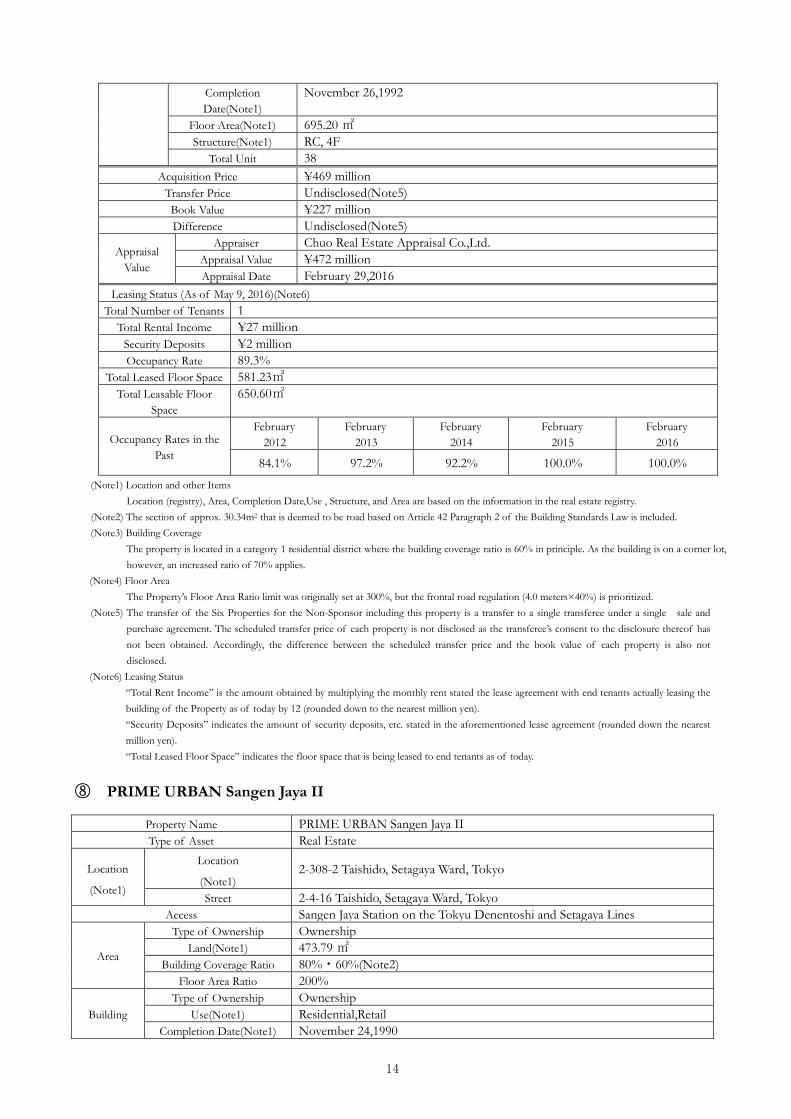
⑦ PRIME URBAN Hatagaya
Property Name PRIME URBAN Hatagaya Type of Asset Real Estate
Location
(Note1)
Location
(Note1) 3-28-6 Hatagaya, Shibuya Ward, Tokyo
Street 3-28-6 Hatagaya, Shibuya Ward, Tokyo Access Hatagaya Station on the Keio New Line
Area
Type of Ownership Ownership Land(Note1) 491.29 ㎡(Note2)
Building Coverage Ratio 70%(Note3) Floor Area Ratio 160%(Note4)
Building Type of Ownership Ownership
Use(Note1) Residential
14
Completion Date(Note1)
November 26,1992
Floor Area(Note1) 695.20 ㎡ Structure(Note1) RC, 4F
Total Unit 38 Acquisition Price ¥469 million
Transfer Price Undisclosed(Note5) Book Value ¥227 million Difference Undisclosed(Note5)
Appraisal Value
Appraiser Chuo Real Estate Appraisal Co.,Ltd. Appraisal Value ¥472 million Appraisal Date February 29,2016
Leasing Status (As of May 9, 2016)(Note6) Total Number of Tenants 1
Total Rental Income ¥27 million Security Deposits ¥2 million Occupancy Rate 89.3%
Total Leased Floor Space 581.23㎡ Total Leasable Floor
Space 650.60㎡
Occupancy Rates in the Past
February 2012
February 2013
February 2014
February 2015
February 2016
84.1% 97.2% 92.2% 100.0% 100.0% (Note1) Location and other Items
Location (registry), Area, Completion Date,Use , Structure, and Area are based on the information in the real estate registry. (Note2) The section of approx. 30.34m2 that is deemed to be road based on Article 42 Paragraph 2 of the Building Standards Law is included. (Note3) Building Coverage
The property is located in a category 1 residential district where the building coverage ratio is 60% in principle. As the building is on a corner lot, however, an increased ratio of 70% applies.
(Note4) Floor Area The Property’s Floor Area Ratio limit was originally set at 300%, but the frontal road regulation (4.0 meters×40%) is prioritized.
(Note5) The transfer of the Six Properties for the Non-Sponsor including this property is a transfer to a single transferee under a single sale and purchase agreement. The scheduled transfer price of each property is not disclosed as the transferee’s consent to the disclosure thereof has not been obtained. Accordingly, the difference between the scheduled transfer price and the book value of each property is also not disclosed.
(Note6) Leasing Status “Total Rent Income” is the amount obtained by multiplying the monthly rent stated the lease agreement with end tenants actually leasing the building of the Property as of today by 12 (rounded down to the nearest million yen). “Security Deposits” indicates the amount of security deposits, etc. stated in the aforementioned lease agreement (rounded down the nearest million yen). “Total Leased Floor Space” indicates the floor space that is being leased to end tenants as of today.
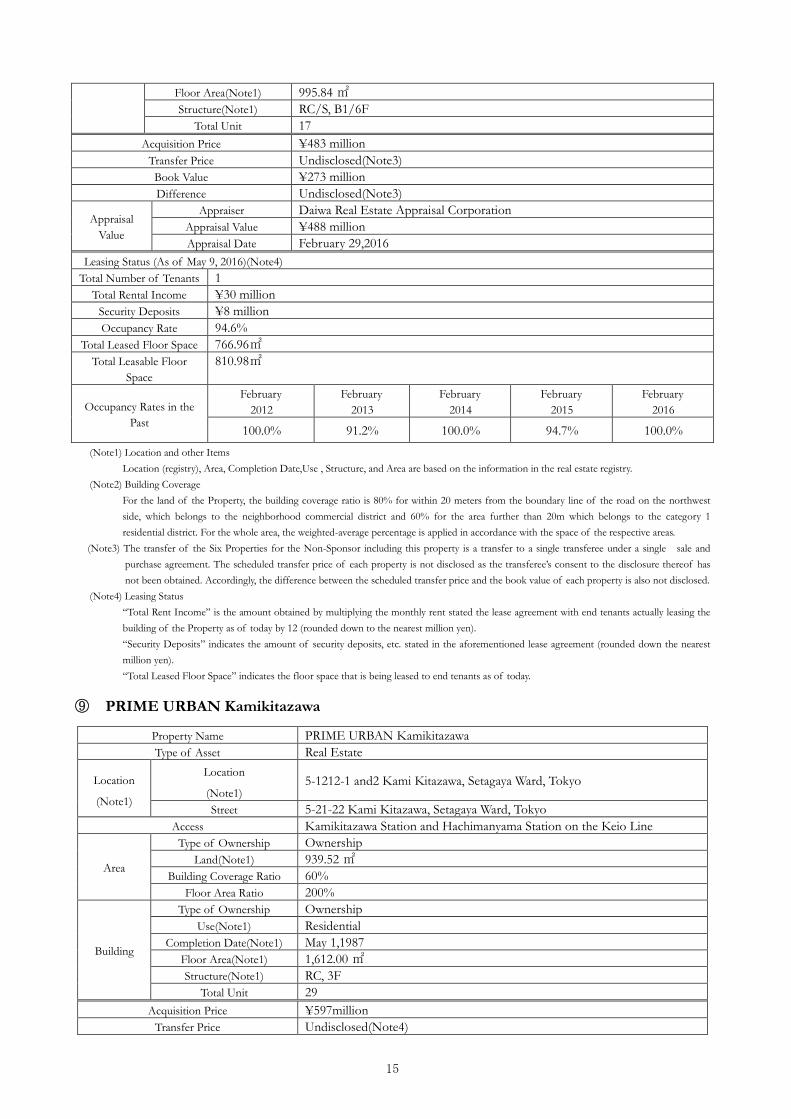
⑧ PRIME URBAN Sangen Jaya II
Property Name PRIME URBAN Sangen Jaya II Type of Asset Real Estate
Location
(Note1)
Location
(Note1) 2-308-2 Taishido, Setagaya Ward, Tokyo
Street 2-4-16 Taishido, Setagaya Ward, Tokyo Access Sangen Jaya Station on the Tokyu Denentoshi and Setagaya Lines
Area
Type of Ownership Ownership Land(Note1) 473.79 ㎡
Building Coverage Ratio 80%・60%(Note2) Floor Area Ratio 200%
Building Type of Ownership Ownership
Use(Note1) Residential,Retail Completion Date(Note1) November 24,1990
15
Floor Area(Note1) 995.84 ㎡ Structure(Note1) RC/S, B1/6F
Total Unit 17 Acquisition Price ¥483 million
Transfer Price Undisclosed(Note3) Book Value ¥273 million Difference Undisclosed(Note3)
Appraisal Value
Appraiser Daiwa Real Estate Appraisal Corporation Appraisal Value ¥488 million Appraisal Date February 29,2016
Leasing Status (As of May 9, 2016)(Note4) Total Number of Tenants 1
Total Rental Income ¥30 million Security Deposits ¥8 million Occupancy Rate 94.6%
Total Leased Floor Space 766.96㎡ Total Leasable Floor
Space 810.98㎡
Occupancy Rates in the Past
February 2012
February 2013
February 2014
February 2015
February 2016
100.0% 91.2% 100.0% 94.7% 100.0% (Note1) Location and other Items
Location (registry), Area, Completion Date,Use , Structure, and Area are based on the information in the real estate registry. (Note2) Building Coverage
For the land of the Property, the building coverage ratio is 80% for within 20 meters from the boundary line of the road on the northwest side, which belongs to the neighborhood commercial district and 60% for the area further than 20m which belongs to the category 1 residential district. For the whole area, the weighted-average percentage is applied in accordance with the space of the respective areas.
(Note3) The transfer of the Six Properties for the Non-Sponsor including this property is a transfer to a single transferee under a single sale and purchase agreement. The scheduled transfer price of each property is not disclosed as the transferee’s consent to the disclosure thereof has not been obtained. Accordingly, the difference between the scheduled transfer price and the book value of each property is also not disclosed.
(Note4) Leasing Status “Total Rent Income” is the amount obtained by multiplying the monthly rent stated the lease agreement with end tenants actually leasing the building of the Property as of today by 12 (rounded down to the nearest million yen). “Security Deposits” indicates the amount of security deposits, etc. stated in the aforementioned lease agreement (rounded down the nearest million yen). “Total Leased Floor Space” indicates the floor space that is being leased to end tenants as of today.
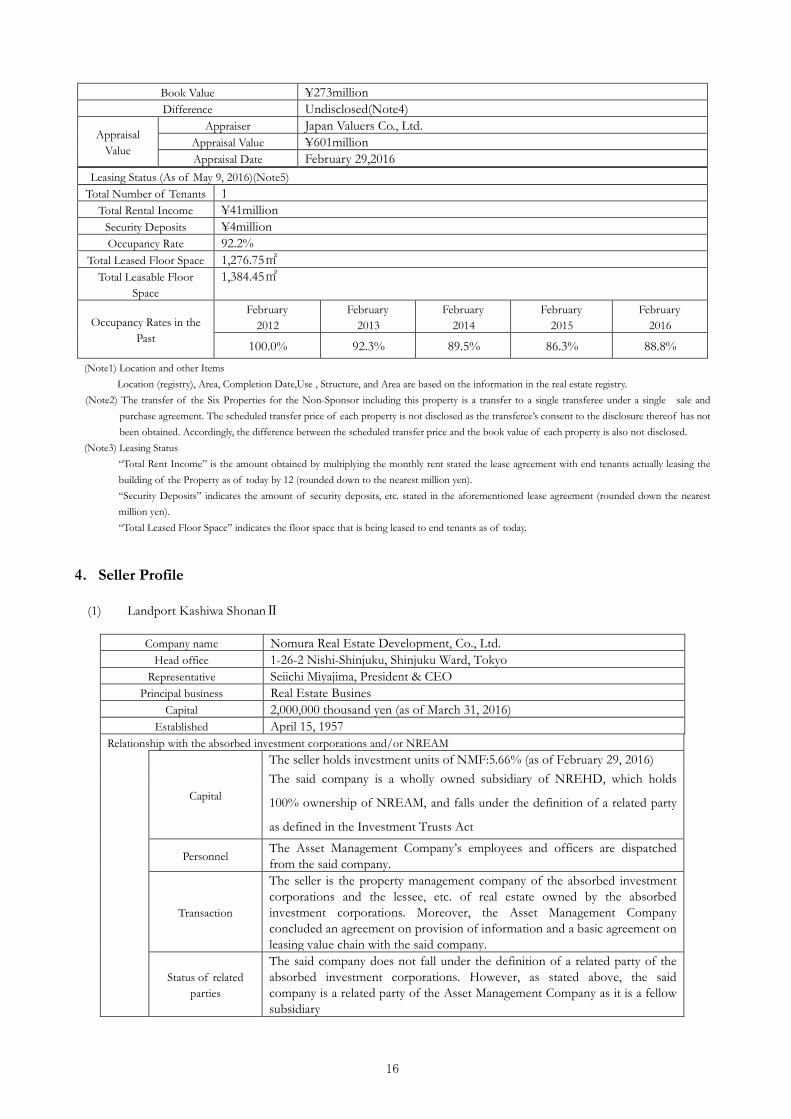
⑨ PRIME URBAN Kamikitazawa
Property Name PRIME URBAN Kamikitazawa Type of Asset Real Estate
Location
(Note1)
Location
(Note1) 5-1212-1 and2 Kami Kitazawa, Setagaya Ward, Tokyo
Street 5-21-22 Kami Kitazawa, Setagaya Ward, Tokyo Access Kamikitazawa Station and Hachimanyama Station on the Keio Line
Area
Type of Ownership Ownership Land(Note1) 939.52 ㎡
Building Coverage Ratio 60% Floor Area Ratio 200%
Building
Type of Ownership Ownership Use(Note1) Residential
Completion Date(Note1) May 1,1987 Floor Area(Note1) 1,612.00 ㎡ Structure(Note1) RC, 3F
Total Unit 29 Acquisition Price ¥597million
Transfer Price Undisclosed(Note4)
16
Book Value ¥273million Difference Undisclosed(Note4)
Appraisal Value
Appraiser Japan Valuers Co., Ltd. Appraisal Value ¥601million Appraisal Date February 29,2016
Leasing Status (As of May 9, 2016)(Note5) Total Number of Tenants 1
Total Rental Income ¥41million Security Deposits ¥4million Occupancy Rate 92.2%
Total Leased Floor Space 1,276.75㎡ Total Leasable Floor
Space 1,384.45㎡
Occupancy Rates in the Past
February 2012
February 2013
February 2014
February 2015
February 2016
100.0% 92.3% 89.5% 86.3% 88.8% (Note1) Location and other Items
Location (registry), Area, Completion Date,Use , Structure, and Area are based on the information in the real estate registry. (Note2) The transfer of the Six Properties for the Non-Sponsor including this property is a transfer to a single transferee under a single sale and
purchase agreement. The scheduled transfer price of each property is not disclosed as the transferee’s consent to the disclosure thereof has not been obtained. Accordingly, the difference between the scheduled transfer price and the book value of each property is also not disclosed.
(Note3) Leasing Status “Total Rent Income” is the amount obtained by multiplying the monthly rent stated the lease agreement with end tenants actually leasing the building of the Property as of today by 12 (rounded down to the nearest million yen). “Security Deposits” indicates the amount of security deposits, etc. stated in the aforementioned lease agreement (rounded down the nearest million yen). “Total Leased Floor Space” indicates the floor space that is being leased to end tenants as of today.
4.Seller Profile
(1) Landport Kashiwa ShonanⅡ
Company name Nomura Real Estate Development, Co., Ltd. Head office 1-26-2 Nishi-Shinjuku, Shinjuku Ward, Tokyo
Representative Seiichi Miyajima, President & CEO Principal business Real Estate Busines
Capital 2,000,000 thousand yen (as of March 31, 2016) Established April 15, 1957
Relationship with the absorbed investment corporations and/or NREAM
Capital
The seller holds investment units of NMF:5.66% (as of February 29, 2016) The said company is a wholly owned subsidiary of NREHD, which holds
100% ownership of NREAM, and falls under the definition of a related party
as defined in the Investment Trusts Act
Personnel The Asset Management Company’s employees and officers are dispatched from the said company.
Transaction
The seller is the property management company of the absorbed investment corporations and the lessee, etc. of real estate owned by the absorbed investment corporations. Moreover, the Asset Management Company concluded an agreement on provision of information and a basic agreement on leasing value chain with the said company.
Status of related
parties
The said company does not fall under the definition of a related party of the absorbed investment corporations. However, as stated above, the said company is a related party of the Asset Management Company as it is a fellow subsidiary
17
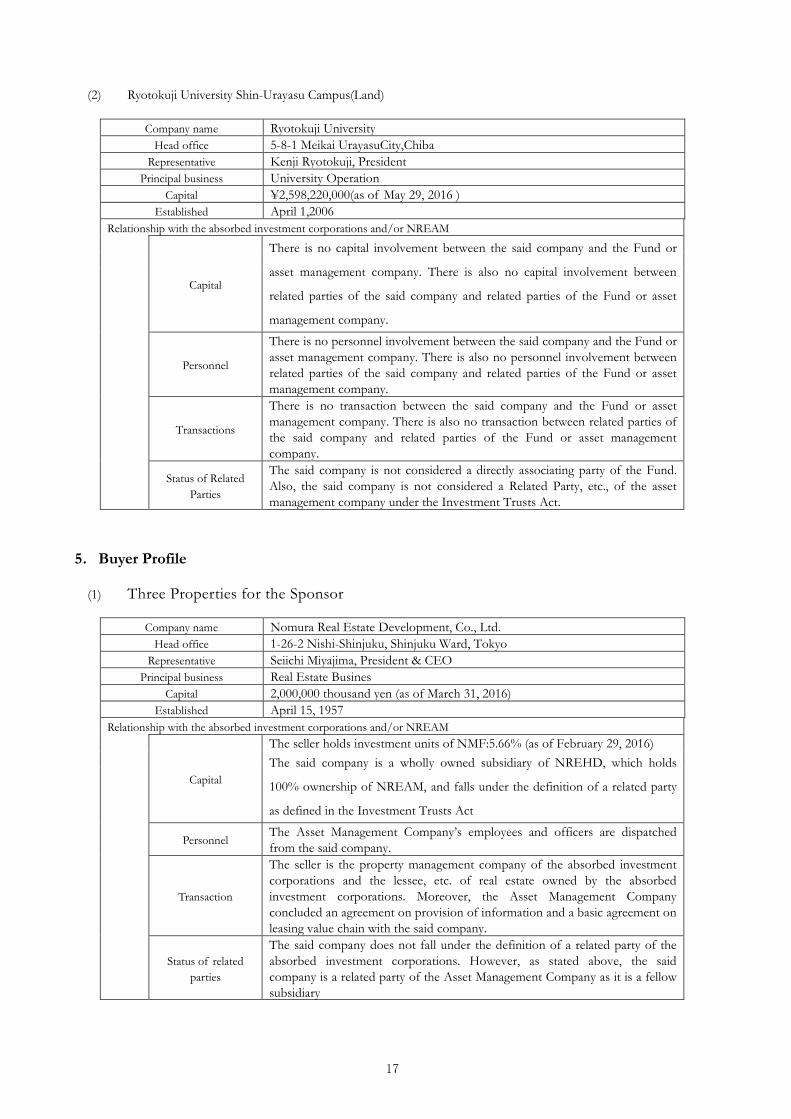
(2) Ryotokuji University Shin-Urayasu Campus(Land)
Company name Ryotokuji University Head office 5-8-1 Meikai UrayasuCity,Chiba
Representative Kenji Ryotokuji, President Principal business University Operation
Capital ¥2,598,220,000(as of May 29, 2016 ) Established April 1,2006
Relationship with the absorbed investment corporations and/or NREAM
Capital
There is no capital involvement between the said company and the Fund or
asset management company. There is also no capital involvement between
related parties of the said company and related parties of the Fund or asset
management company.
Personnel
There is no personnel involvement between the said company and the Fund or asset management company. There is also no personnel involvement between related parties of the said company and related parties of the Fund or asset management company.
Transactions
There is no transaction between the said company and the Fund or asset management company. There is also no transaction between related parties of the said company and related parties of the Fund or asset management company.
Status of Related
Parties
The said company is not considered a directly associating party of the Fund. Also, the said company is not considered a Related Party, etc., of the asset management company under the Investment Trusts Act.
5.Buyer Profile
(1) Three Properties for the Sponsor
Company name Nomura Real Estate Development, Co., Ltd. Head office 1-26-2 Nishi-Shinjuku, Shinjuku Ward, Tokyo
Representative Seiichi Miyajima, President & CEO Principal business Real Estate Busines
Capital 2,000,000 thousand yen (as of March 31, 2016) Established April 15, 1957
Relationship with the absorbed investment corporations and/or NREAM
Capital
The seller holds investment units of NMF:5.66% (as of February 29, 2016) The said company is a wholly owned subsidiary of NREHD, which holds
100% ownership of NREAM, and falls under the definition of a related party
as defined in the Investment Trusts Act
Personnel The Asset Management Company’s employees and officers are dispatched from the said company.
Transaction
The seller is the property management company of the absorbed investment corporations and the lessee, etc. of real estate owned by the absorbed investment corporations. Moreover, the Asset Management Company concluded an agreement on provision of information and a basic agreement on leasing value chain with the said company.
Status of related
parties
The said company does not fall under the definition of a related party of the absorbed investment corporations. However, as stated above, the said company is a related party of the Asset Management Company as it is a fellow subsidiary
18
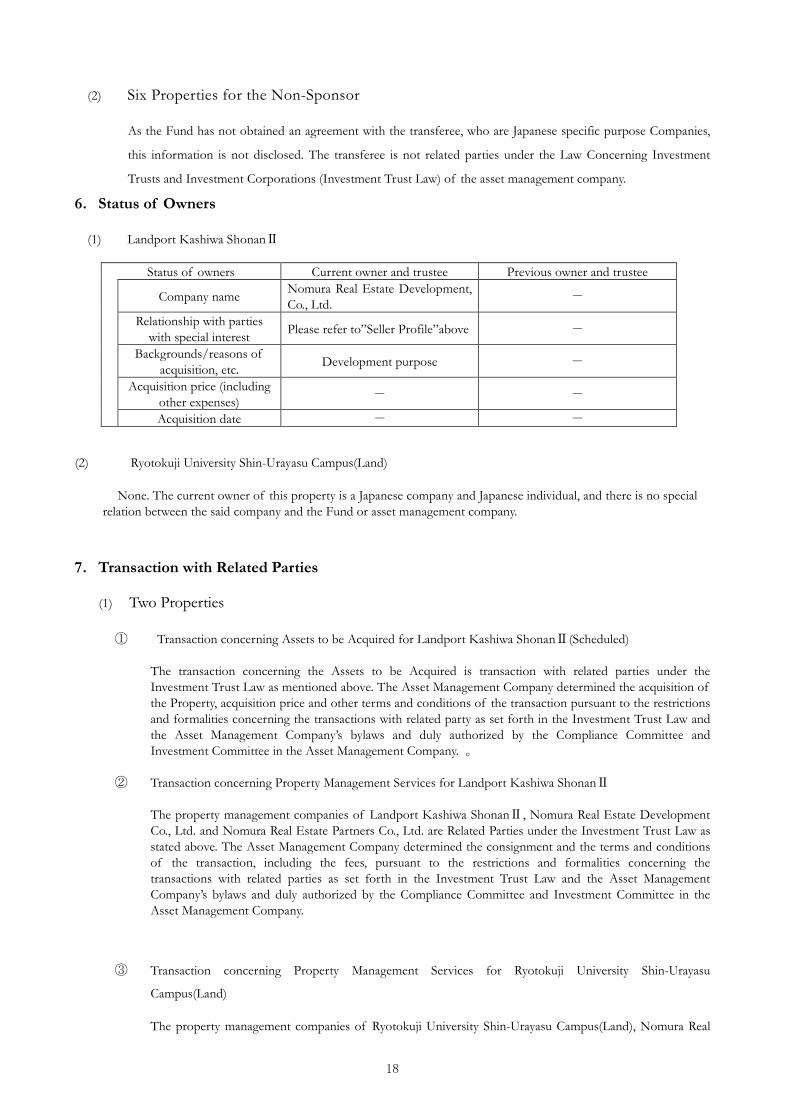
(2) Six Properties for the Non-Sponsor
As the Fund has not obtained an agreement with the transferee, who are Japanese specific purpose Companies,
this information is not disclosed. The transferee is not related parties under the Law Concerning Investment
Trusts and Investment Corporations (Investment Trust Law) of the asset management company.
6.Status of Owners
(1) Landport Kashiwa ShonanⅡ
Status of owners Current owner and trustee Previous owner and trustee
Company name Nomura Real Estate Development, Co., Ltd. -
Relationship with parties with special interest Please refer to”Seller Profile”above -
Backgrounds/reasons of acquisition, etc. Development purpose -
Acquisition price (including other expenses) - -
Acquisition date - -
(2) Ryotokuji University Shin-Urayasu Campus(Land)
None. The current owner of this property is a Japanese company and Japanese individual, and there is no special relation between the said company and the Fund or asset management company.
7.Transaction with Related Parties
(1) Two Properties
① Transaction concerning Assets to be Acquired for Landport Kashiwa ShonanⅡ(Scheduled)
The transaction concerning the Assets to be Acquired is transaction with related parties under the Investment Trust Law as mentioned above. The Asset Management Company determined the acquisition of the Property, acquisition price and other terms and conditions of the transaction pursuant to the restrictions and formalities concerning the transactions with related party as set forth in the Investment Trust Law and the Asset Management Company’s bylaws and duly authorized by the Compliance Committee and Investment Committee in the Asset Management Company. 。
② Transaction concerning Property Management Services for Landport Kashiwa ShonanⅡ
The property management companies of Landport Kashiwa ShonanⅡ, Nomura Real Estate Development Co., Ltd. and Nomura Real Estate Partners Co., Ltd. are Related Parties under the Investment Trust Law as stated above. The Asset Management Company determined the consignment and the terms and conditions of the transaction, including the fees, pursuant to the restrictions and formalities concerning the transactions with related parties as set forth in the Investment Trust Law and the Asset Management Company’s bylaws and duly authorized by the Compliance Committee and Investment Committee in the Asset Management Company.
③ Transaction concerning Property Management Services for Ryotokuji University Shin-Urayasu
Campus(Land)
The property management companies of Ryotokuji University Shin-Urayasu Campus(Land), Nomura Real
19
Estate Partners Co., Ltd. are Related Parties under the Investment Trust Law as stated above. The Asset Management Company determined the consignment and the terms and conditions of the transaction, including the fees, pursuant to the restrictions and formalities concerning the transactions with related parties as set forth in the Investment Trust Law and the Asset Management Company’s bylaws and duly authorized by the Compliance Committee and Investment Committee in the Asset Management Company.
(2) Nine Properties
① Transaction concerning Assets to be Disposed for Three Properties for the Sponsor
The transaction concerning the Assets to be Disposed is transaction with related parties under the Investment Trust Law as mentioned above. The Asset Management Company determined the acquisition of the Property, acquisition price and other terms and conditions of the transaction pursuant to the restrictions and formalities concerning the transactions with related party as set forth in the Investment Trust Law and the Asset Management Company’s bylaws and duly authorized by the Compliance Committee and Investment Committee in the Asset Management Company.
② Transaction concerning Assets to be Disposed for Six Properties for the Non-Sponsor
There is no special relation between the said company and the Fund or asset management company for this transaction.
20
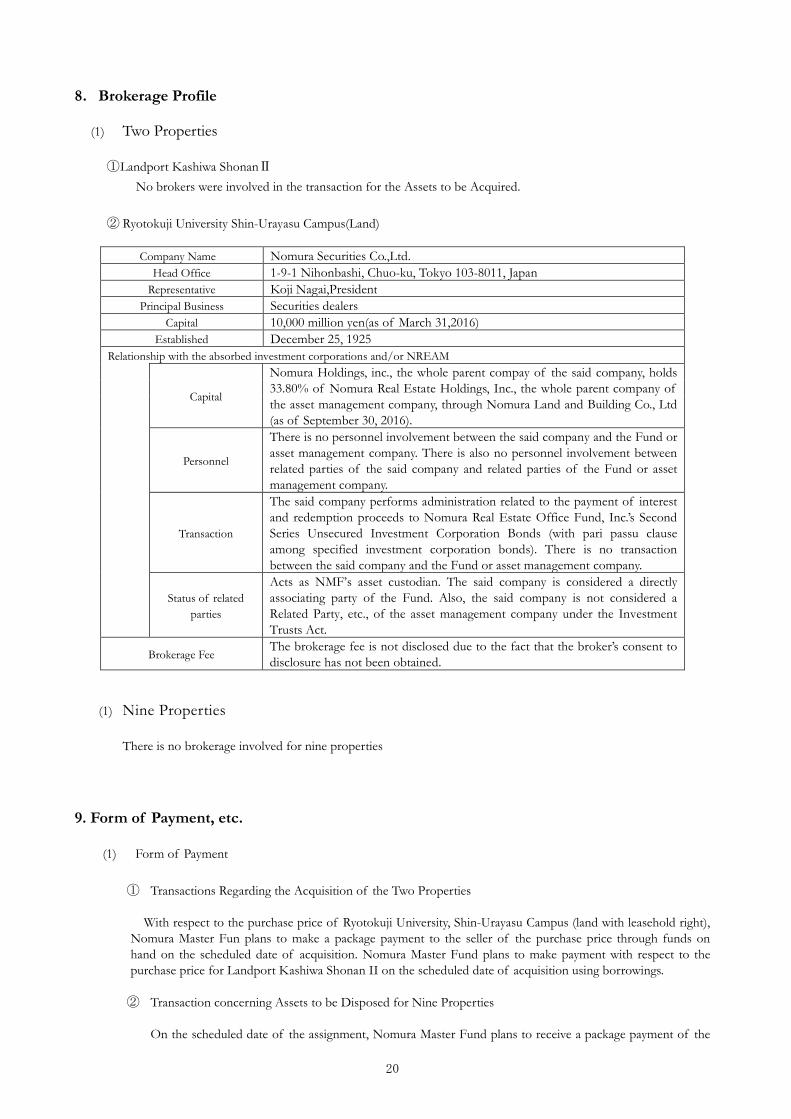
8.Brokerage Profile
(1) Two Properties
① Landport Kashiwa ShonanⅡ No brokers were involved in the transaction for the Assets to be Acquired.
② Ryotokuji University Shin-Urayasu Campus(Land)
Company Name Nomura Securities Co.,Ltd. Head Office 1-9-1 Nihonbashi, Chuo-ku, Tokyo 103-8011, Japan
Representative Koji Nagai,President Principal Business Securities dealers
Capital 10,000 million yen(as of March 31,2016) Established December 25, 1925
Relationship with the absorbed investment corporations and/or NREAM
Capital
Nomura Holdings, inc., the whole parent compay of the said company, holds 33.80% of Nomura Real Estate Holdings, Inc., the whole parent company of the asset management company, through Nomura Land and Building Co., Ltd (as of September 30, 2016).
Personnel
There is no personnel involvement between the said company and the Fund or asset management company. There is also no personnel involvement between related parties of the said company and related parties of the Fund or asset management company.
Transaction
The said company performs administration related to the payment of interest and redemption proceeds to Nomura Real Estate Office Fund, Inc.’s Second Series Unsecured Investment Corporation Bonds (with pari passu clause among specified investment corporation bonds). There is no transaction between the said company and the Fund or asset management company.
Status of related
parties
Acts as NMF’s asset custodian. The said company is considered a directly associating party of the Fund. Also, the said company is not considered a Related Party, etc., of the asset management company under the Investment Trusts Act.
Brokerage Fee The brokerage fee is not disclosed due to the fact that the broker’s consent to disclosure has not been obtained.
(1) Nine Properties
There is no brokerage involved for nine properties
9. Form of Payment, etc.
(1) Form of Payment
① Transactions Regarding the Acquisition of the Two Properties
With respect to the purchase price of Ryotokuji University, Shin-Urayasu Campus (land with leasehold right), Nomura Master Fun plans to make a package payment to the seller of the purchase price through funds on hand on the scheduled date of acquisition. Nomura Master Fund plans to make payment with respect to the purchase price for Landport Kashiwa Shonan II on the scheduled date of acquisition using borrowings.
② Transaction concerning Assets to be Disposed for Nine Properties
On the scheduled date of the assignment, Nomura Master Fund plans to receive a package payment of the
21
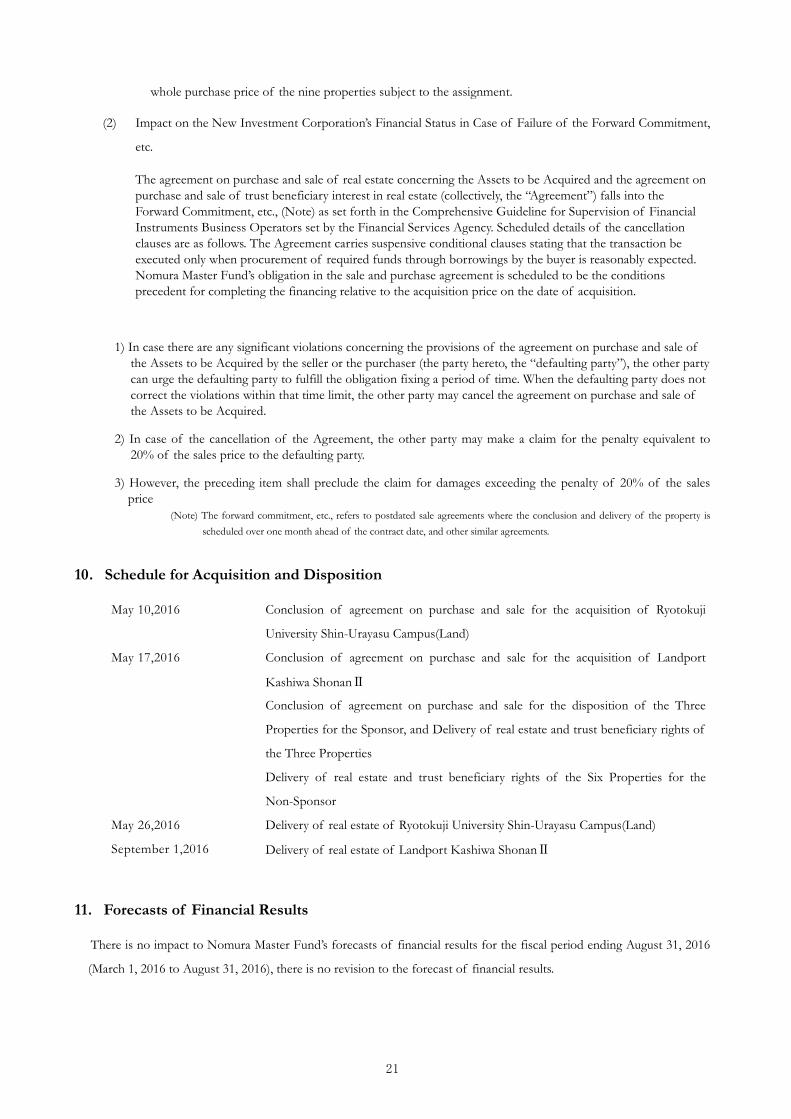
whole purchase price of the nine properties subject to the assignment.
(2) Impact on the New Investment Corporation’s Financial Status in Case of Failure of the Forward Commitment,
etc.
The agreement on purchase and sale of real estate concerning the Assets to be Acquired and the agreement on purchase and sale of trust beneficiary interest in real estate (collectively, the “Agreement”) falls into the Forward Commitment, etc., (Note) as set forth in the Comprehensive Guideline for Supervision of Financial Instruments Business Operators set by the Financial Services Agency. Scheduled details of the cancellation clauses are as follows. The Agreement carries suspensive conditional clauses stating that the transaction be executed only when procurement of required funds through borrowings by the buyer is reasonably expected. Nomura Master Fund’s obligation in the sale and purchase agreement is scheduled to be the conditions precedent for completing the financing relative to the acquisition price on the date of acquisition.
1) In case there are any significant violations concerning the provisions of the agreement on purchase and sale of the Assets to be Acquired by the seller or the purchaser (the party hereto, the “defaulting party”), the other party can urge the defaulting party to fulfill the obligation fixing a period of time. When the defaulting party does not correct the violations within that time limit, the other party may cancel the agreement on purchase and sale of the Assets to be Acquired.
2) In case of the cancellation of the Agreement, the other party may make a claim for the penalty equivalent to 20% of the sales price to the defaulting party.
3) However, the preceding item shall preclude the claim for damages exceeding the penalty of 20% of the sales price
(Note) The forward commitment, etc., refers to postdated sale agreements where the conclusion and delivery of the property is scheduled over one month ahead of the contract date, and other similar agreements.
10.Schedule for Acquisition and Disposition
May 10,2016 Conclusion of agreement on purchase and sale for the acquisition of Ryotokuji
University Shin-Urayasu Campus(Land)
May 17,2016 Conclusion of agreement on purchase and sale for the acquisition of Landport
Kashiwa ShonanⅡ
Conclusion of agreement on purchase and sale for the disposition of the Three
Properties for the Sponsor, and Delivery of real estate and trust beneficiary rights of
the Three Properties
Delivery of real estate and trust beneficiary rights of the Six Properties for the
Non-Sponsor
May 26,2016 Delivery of real estate of Ryotokuji University Shin-Urayasu Campus(Land)
September 1,2016 Delivery of real estate of Landport Kashiwa ShonanⅡ
11.Forecasts of Financial Results
There is no impact to Nomura Master Fund’s forecasts of financial results for the fiscal period ending August 31, 2016
(March 1, 2016 to August 31, 2016), there is no revision to the forecast of financial results.
22
12. Appraisal Summary
(1)Acquisition Two properties
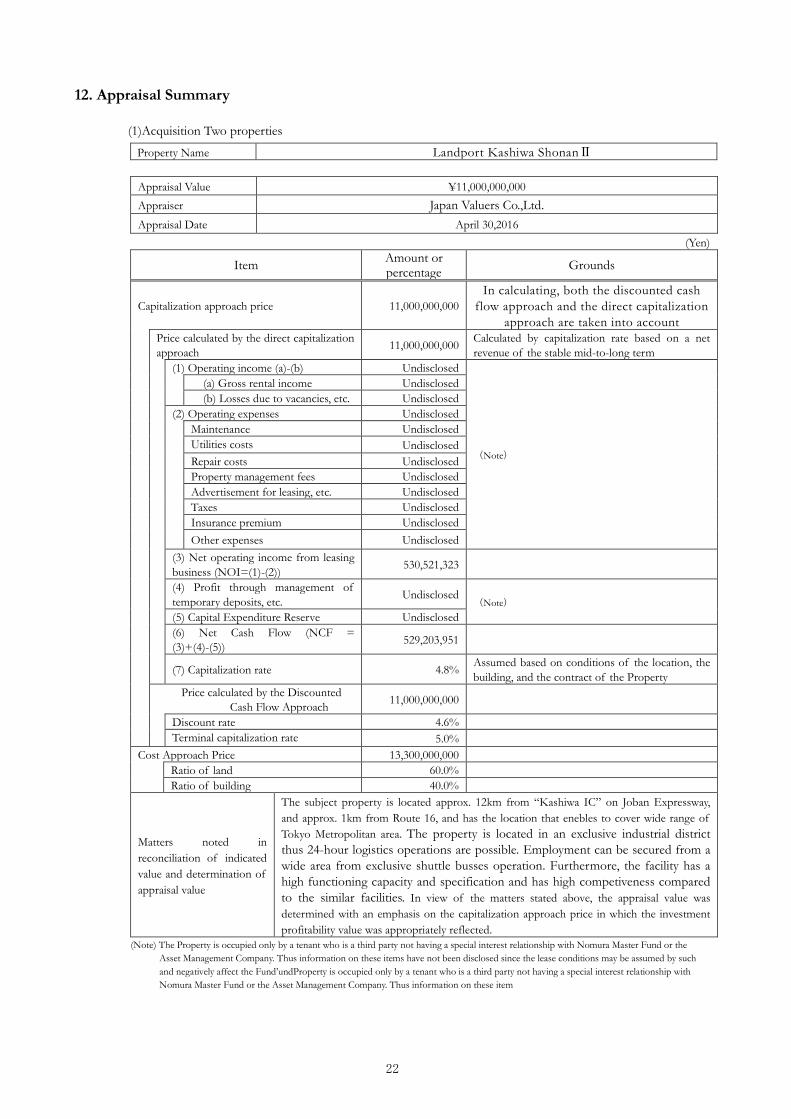
Property Name Landport Kashiwa ShonanⅡ
Appraisal Value ¥11,000,000,000 Appraiser Japan Valuers Co.,Ltd. Appraisal Date April 30,2016
(Yen)
Item Amount or percentage Grounds
Capitalization approach price 11,000,000,000 In calculating, both the discounted cash
flow approach and the direct capitalization approach are taken into account
Price calculated by the direct capitalization approach 11,000,000,000 Calculated by capitalization rate based on a net
revenue of the stable mid-to-long term (1) Operating income (a)-(b) Undisclosed
(Note)
(a) Gross rental income Undisclosed (b) Losses due to vacancies, etc. Undisclosed
(2) Operating expenses Undisclosed Maintenance Undisclosed
Utilities costs Undisclosed Repair costs Undisclosed Property management fees Undisclosed Advertisement for leasing, etc. Undisclosed Taxes Undisclosed Insurance premium Undisclosed Other expenses Undisclosed
(3) Net operating income from leasing business (NOI=(1)-(2)) 530,521,323
(4) Profit through management of temporary deposits, etc. Undisclosed
(Note) (5) Capital Expenditure Reserve Undisclosed (6) Net Cash Flow (NCF = (3)+(4)-(5)) 529,203,951
(7) Capitalization rate 4.8% Assumed based on conditions of the location, the building, and the contract of the Property
Price calculated by the Discounted Cash Flow Approach 11,000,000,000
Discount rate 4.6% Terminal capitalization rate 5.0%
Cost Approach Price 13,300,000,000 Ratio of land 60.0% Ratio of building 40.0%
Matters noted in reconciliation of indicated value and determination of appraisal value
The subject property is located approx. 12km from “Kashiwa IC” on Joban Expressway, and approx. 1km from Route 16, and has the location that enebles to cover wide range of Tokyo Metropolitan area. The property is located in an exclusive industrial district thus 24-hour logistics operations are possible. Employment can be secured from a wide area from exclusive shuttle busses operation. Furthermore, the facility has a high functioning capacity and specification and has high competiveness compared to the similar facilities. In view of the matters stated above, the appraisal value was determined with an emphasis on the capitalization approach price in which the investment profitability value was appropriately reflected.
(Note) The Property is occupied only by a tenant who is a third party not having a special interest relationship with Nomura Master Fund or the Asset Management Company. Thus information on these items have not been disclosed since the lease conditions may be assumed by such and negatively affect the Fund’undProperty is occupied only by a tenant who is a third party not having a special interest relationship with Nomura Master Fund or the Asset Management Company. Thus information on these item
23
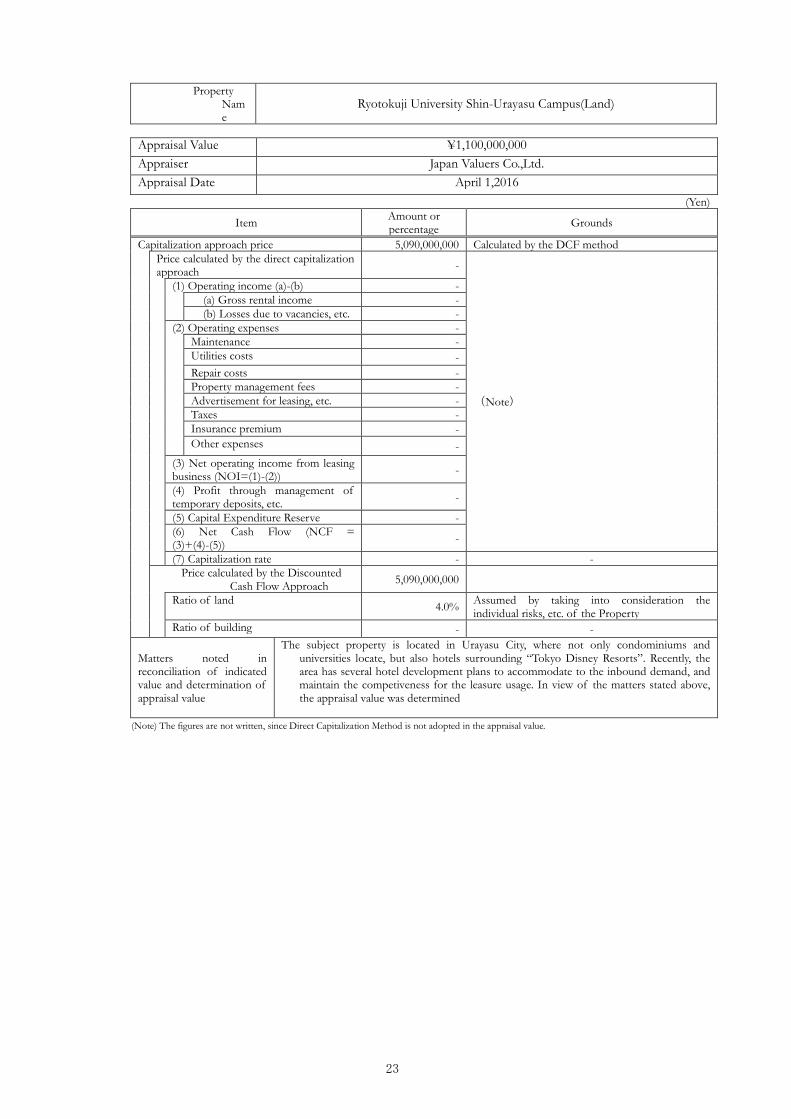
Property Name
Ryotokuji University Shin-Urayasu Campus(Land)
Appraisal Value ¥1,100,000,000 Appraiser Japan Valuers Co.,Ltd. Appraisal Date April 1,2016
(Yen)
Item Amount or percentage Grounds
Capitalization approach price 5,090,000,000 Calculated by the DCF method Price calculated by the direct capitalization
approach -
(Note)
(1) Operating income (a)-(b) - (a) Gross rental income -
(b) Losses due to vacancies, etc. - (2) Operating expenses - Maintenance -
Utilities costs - Repair costs - Property management fees - Advertisement for leasing, etc. - Taxes - Insurance premium - Other expenses -
(3) Net operating income from leasing business (NOI=(1)-(2)) -
(4) Profit through management of temporary deposits, etc. -
(5) Capital Expenditure Reserve - (6) Net Cash Flow (NCF = (3)+(4)-(5)) -
(7) Capitalization rate - - Price calculated by the Discounted
Cash Flow Approach 5,090,000,000
Ratio of land 4.0% Assumed by taking into consideration the individual risks, etc. of the Property
Ratio of building - -
Matters noted in reconciliation of indicated value and determination of appraisal value
The subject property is located in Urayasu City, where not only condominiums and universities locate, but also hotels surrounding “Tokyo Disney Resorts”. Recently, the area has several hotel development plans to accommodate to the inbound demand, and maintain the competiveness for the leasure usage. In view of the matters stated above, the appraisal value was determined
(Note) The figures are not written, since Direct Capitalization Method is not adopted in the appraisal value.
24
(2)Nine Properties
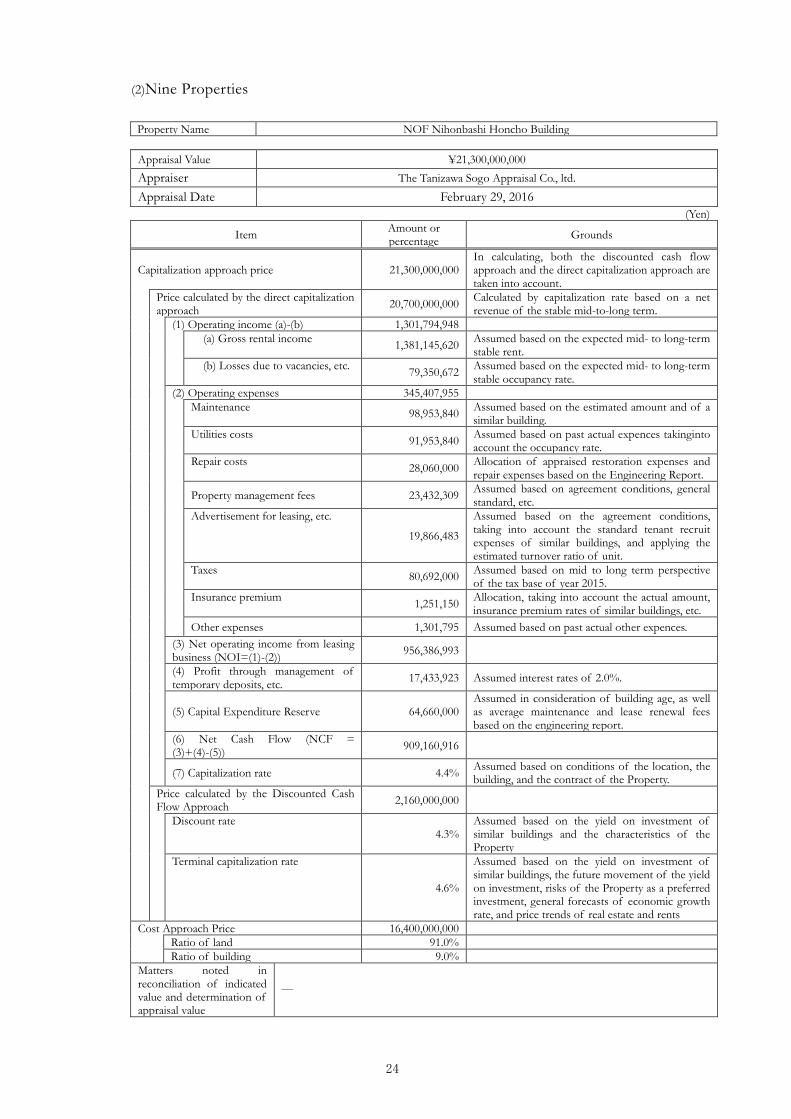
Property Name NOF Nihonbashi Honcho Building
Appraisal Value ¥21,300,000,000 Appraiser The Tanizawa Sogo Appraisal Co., ltd. Appraisal Date February 29, 2016
(Yen)
Item Amount or percentage Grounds
Capitalization approach price 21,300,000,000 In calculating, both the discounted cash flow approach and the direct capitalization approach are taken into account.
Price calculated by the direct capitalization approach 20,700,000,000 Calculated by capitalization rate based on a net
revenue of the stable mid-to-long term. (1) Operating income (a)-(b) 1,301,794,948
(a) Gross rental income 1,381,145,620 Assumed based on the expected mid- to long-term stable rent.
(b) Losses due to vacancies, etc. 79,350,672 Assumed based on the expected mid- to long-term stable occupancy rate.
(2) Operating expenses 345,407,955 Maintenance 98,953,840 Assumed based on the estimated amount and of a
similar building. Utilities costs 91,953,840 Assumed based on past actual expences takinginto
account the occupancy rate. Repair costs 28,060,000 Allocation of appraised restoration expenses and
repair expenses based on the Engineering Report.
Property management fees 23,432,309 Assumed based on agreement conditions, general standard, etc.
Advertisement for leasing, etc.
19,866,483
Assumed based on the agreement conditions, taking into account the standard tenant recruit expenses of similar buildings, and applying the estimated turnover ratio of unit.
Taxes 80,692,000 Assumed based on mid to long term perspective of the tax base of year 2015.
Insurance premium 1,251,150 Allocation, taking into account the actual amount, insurance premium rates of similar buildings, etc.
Other expenses 1,301,795 Assumed based on past actual other expences. (3) Net operating income from leasing business (NOI=(1)-(2)) 956,386,993
(4) Profit through management of temporary deposits, etc. 17,433,923 Assumed interest rates of 2.0%.
(5) Capital Expenditure Reserve 64,660,000 Assumed in consideration of building age, as well as average maintenance and lease renewal fees based on the engineering report.
(6) Net Cash Flow (NCF = (3)+(4)-(5)) 909,160,916
(7) Capitalization rate 4.4% Assumed based on conditions of the location, the building, and the contract of the Property.
Price calculated by the Discounted Cash Flow Approach 2,160,000,000
Discount rate 4.3%
Assumed based on the yield on investment of similar buildings and the characteristics of the Property
Terminal capitalization rate
4.6%
Assumed based on the yield on investment of similar buildings, the future movement of the yield on investment, risks of the Property as a preferred investment, general forecasts of economic growth rate, and price trends of real estate and rents
Cost Approach Price 16,400,000,000 Ratio of land 91.0% Ratio of building 9.0% Matters noted in reconciliation of indicated value and determination of appraisal value
―

25
Property Name NOF Tameike Building
Appraisal Value ¥4,480,000,000 Appraiser Appraisal Firm A Square Ltd. Appraisal Date February 29, 2016
(Yen)
Item Amount or percentage Grounds
Capitalization approach price 4,480,000,000 In calculating, both the discounted cash flow approach and the direct capitalization approach are taken into account.
Price calculated by the direct capitalization approach 4,590,000,000 Calculated by capitalization rate based on a net
revenue of the stable mid-to-long term. (1) Operating income (a)-(b) 331,799,671
(a) Gross rental income 345,609,080 Assumed based on the expected mid- to long-term stable rent.
(b) Losses due to vacancies, etc. 13,809,409 Assumed based on the expected mid- to long-term stable occupancy rate.
(2) Operating expenses 115,362,541 Maintenance 25,037,101 Assumed based on the estimated amount and
of a similar building. Utilities costs 26,629,510 Assumed based on past actual expences
takinginto account the occupancy rate. Repair costs
10,617,000 Allocation of appraised restoration expenses and repair expenses based on the Engineering Report.
Property management fees 7,863,156 Assumed based on agreement conditions, general standard, etc.
Advertisement for leasing, etc.
2,025,979
Assumed based on the agreement conditions, taking into account the standard tenant recruit expenses of similar buildings, and applying the estimated turnover ratio of unit.
Taxes 35,055,000 Assumed based on mid to long term perspective of the tax base of year 2015.
Insurance premium 285,530
Allocation, taking into account the actual amount, insurance premium rates of similar buildings, etc.
Other expenses 7,200,000 Assumed based on past actual other expences.
(3) Net operating income from leasing business (NOI=(1)-(2)) 216,437,130
(4) Profit through management of temporary deposits, etc. 4,483,792 Assumed interest rates of 2.0%.
(5) Capital Expenditure Reserve 14,280,500 Assumed in consideration of building age, as well as average maintenance and lease renewal fees based on the engineering report.
(6) Net Cash Flow (NCF = (3)+(4)-(5)) 206,640,422
(7) Capitalization rate 4.5% Assumed based on conditions of the location, the building, and the contract of the Property.
Price calculated by the Discounted Cash Flow Approach 4,480,000,000
Discount rate 4.2%
Assumed based on the yield on investment of similar buildings and the characteristics of the Property
Terminal capitalization rate
4.8%
Assumed based on the yield on investment of similar buildings, the future movement of the yield on investment, risks of the Property as a preferred investment, general forecasts of economic growth rate, and price trends of real estate and rents
Cost Approach Price 4,900,000,000 Ratio of land 95.0% Ratio of building 5.0% Matters noted in reconciliation of indicated value and determination of appraisal value
―
26
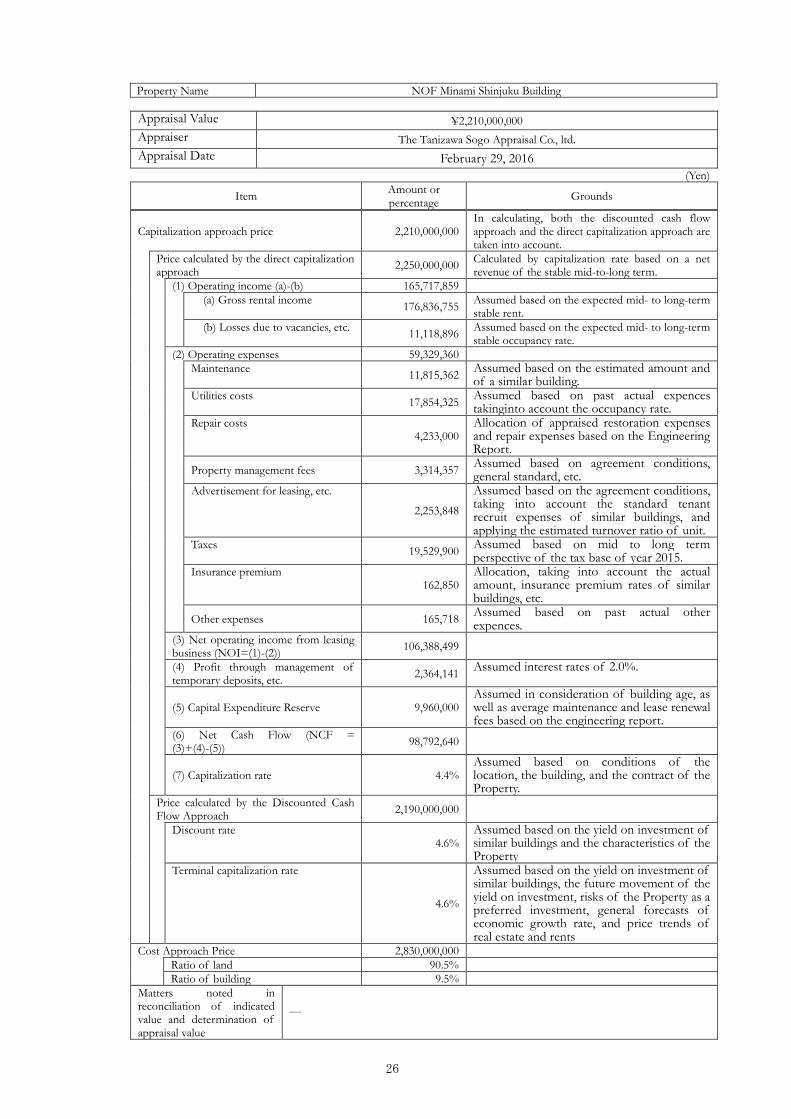
Property Name NOF Minami Shinjuku Building
Appraisal Value ¥2,210,000,000 Appraiser The Tanizawa Sogo Appraisal Co., ltd. Appraisal Date February 29, 2016
(Yen)
Item Amount or percentage Grounds
Capitalization approach price 2,210,000,000 In calculating, both the discounted cash flow approach and the direct capitalization approach are taken into account.
Price calculated by the direct capitalization approach 2,250,000,000 Calculated by capitalization rate based on a net
revenue of the stable mid-to-long term. (1) Operating income (a)-(b) 165,717,859
(a) Gross rental income 176,836,755 Assumed based on the expected mid- to long-term stable rent.
(b) Losses due to vacancies, etc. 11,118,896 Assumed based on the expected mid- to long-term stable occupancy rate.
(2) Operating expenses 59,329,360 Maintenance 11,815,362 Assumed based on the estimated amount and
of a similar building. Utilities costs 17,854,325 Assumed based on past actual expences
takinginto account the occupancy rate. Repair costs
4,233,000 Allocation of appraised restoration expenses and repair expenses based on the Engineering Report.
Property management fees 3,314,357 Assumed based on agreement conditions, general standard, etc.
Advertisement for leasing, etc.
2,253,848
Assumed based on the agreement conditions, taking into account the standard tenant recruit expenses of similar buildings, and applying the estimated turnover ratio of unit.
Taxes 19,529,900 Assumed based on mid to long term perspective of the tax base of year 2015.
Insurance premium 162,850
Allocation, taking into account the actual amount, insurance premium rates of similar buildings, etc.
Other expenses 165,718 Assumed based on past actual other expences.
(3) Net operating income from leasing business (NOI=(1)-(2)) 106,388,499
(4) Profit through management of temporary deposits, etc. 2,364,141 Assumed interest rates of 2.0%.
(5) Capital Expenditure Reserve 9,960,000 Assumed in consideration of building age, as well as average maintenance and lease renewal fees based on the engineering report.
(6) Net Cash Flow (NCF = (3)+(4)-(5)) 98,792,640
(7) Capitalization rate 4.4% Assumed based on conditions of the location, the building, and the contract of the Property.
Price calculated by the Discounted Cash Flow Approach 2,190,000,000
Discount rate 4.6%
Assumed based on the yield on investment of similar buildings and the characteristics of the Property
Terminal capitalization rate
4.6%
Assumed based on the yield on investment of similar buildings, the future movement of the yield on investment, risks of the Property as a preferred investment, general forecasts of economic growth rate, and price trends of real estate and rents
Cost Approach Price 2,830,000,000 Ratio of land 90.5% Ratio of building 9.5% Matters noted in reconciliation of indicated value and determination of appraisal value
―

27
Property Name NOF Shinagawa Konan Building
Appraisal Value ¥3,310,000,000 Appraiser The Tanizawa Sogo Appraisal Co. Appraisal Date February 29, 2016
(Yen)
Item Amount or percentage Grounds
Capitalization approach price 3,310,000,000 In calculating, both the discounted cash flow approach and the direct capitalization approach are taken into account.
Price calculated by the direct capitalization approach 3,320,000,000 Calculated by capitalization rate based on a net
revenue of the stable mid-to-long term. (1) Operating income (a)-(b) 316,057,874
(a) Gross rental income 333,975,897 Assumed based on the expected mid- to long-term stable rent.
(b) Losses due to vacancies, etc. 17,918,023 Assumed based on the expected mid- to long-term stable occupancy rate.
(2) Operating expenses 127,611,747 Maintenance 33,356,172 Assumed based on the estimated amount and
of a similar building. Utilities costs 36,867,348 Assumed based on past actual expences
takinginto account the occupancy rate. Repair costs
16,640,000 Allocation of appraised restoration expenses and repair expenses based on the Engineering Report.
Property management fees 6,321,157 Assumed based on agreement conditions, general standard, etc.
Advertisement for leasing, etc.
3,952,936
Assumed based on the agreement conditions, taking into account the standard tenant recruit expenses of similar buildings, and applying the estimated turnover ratio of unit.
Taxes 29,057,200 Assumed based on mid to long term perspective of the tax base of year 2015.
Insurance premium 468,760
Allocation, taking into account the actual amount, insurance premium rates of similar buildings, etc.
Other expenses 948,174 Assumed based on past actual other expences.
(3) Net operating income from leasing business (NOI=(1)-(2)) 188,446,127
(4) Profit through management of temporary deposits, etc. 4,133,314 Assumed interest rates of 2.0%.
(5) Capital Expenditure Reserve 39,680,000 Assumed in consideration of building age, as well as average maintenance and lease renewal fees based on the engineering report.
(6) Net Cash Flow (NCF = (3)+(4)-(5)) 152,899,441
(7) Capitalization rate 4.6% Assumed based on conditions of the location, the building, and the contract of the Property.
Price calculated by the Discounted Cash Flow Approach 3,300,000,000
Discount rate 4.6%
Assumed based on the yield on investment of similar buildings and the characteristics of the Property
Terminal capitalization rate
4.8%
Assumed based on the yield on investment of similar buildings, the future movement of the yield on investment, risks of the Property as a preferred investment, general forecasts of economic growth rate, and price trends of real estate and rents
Cost Approach Price 3,800,000,000 Ratio of land 80.2% Ratio of building 19.8% Matters noted in reconciliation of indicated value and determination of appraisal value
―
28
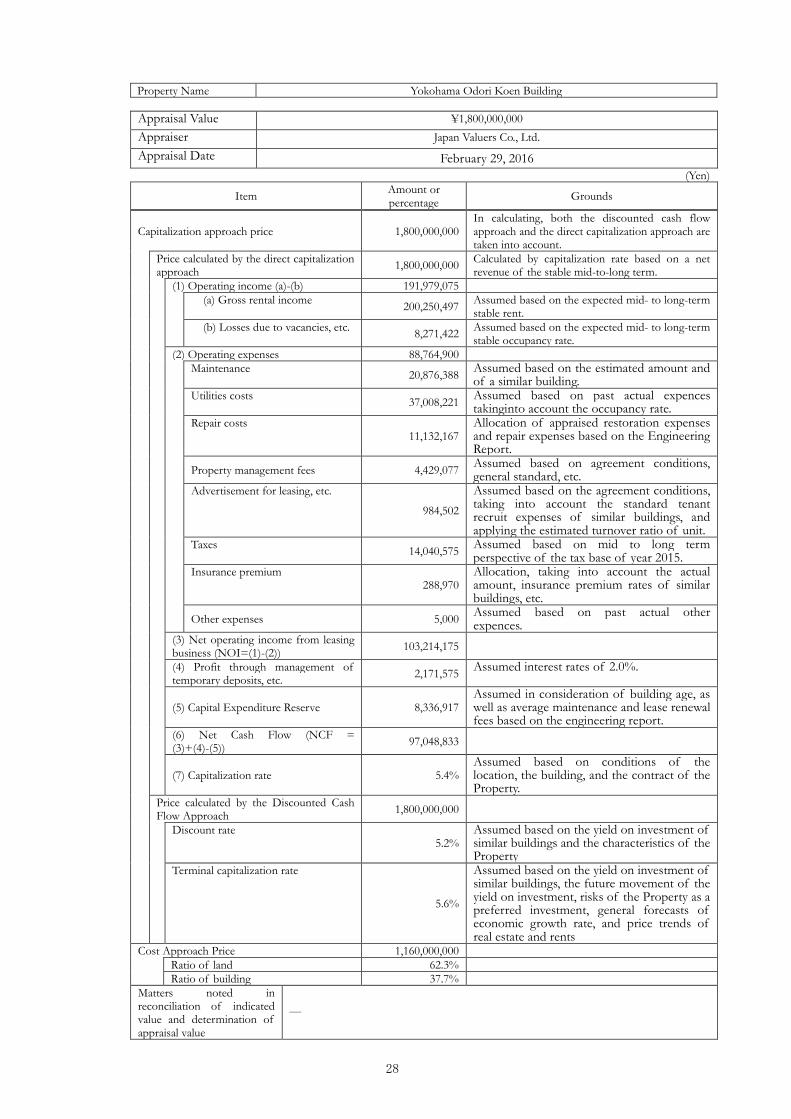
Property Name Yokohama Odori Koen Building
Appraisal Value ¥1,800,000,000 Appraiser Japan Valuers Co., Ltd. Appraisal Date February 29, 2016
(Yen)
Item Amount or percentage Grounds
Capitalization approach price 1,800,000,000 In calculating, both the discounted cash flow approach and the direct capitalization approach are taken into account.
Price calculated by the direct capitalization approach 1,800,000,000 Calculated by capitalization rate based on a net
revenue of the stable mid-to-long term. (1) Operating income (a)-(b) 191,979,075
(a) Gross rental income 200,250,497 Assumed based on the expected mid- to long-term stable rent.
(b) Losses due to vacancies, etc. 8,271,422 Assumed based on the expected mid- to long-term stable occupancy rate.
(2) Operating expenses 88,764,900 Maintenance 20,876,388 Assumed based on the estimated amount and
of a similar building. Utilities costs 37,008,221 Assumed based on past actual expences
takinginto account the occupancy rate. Repair costs
11,132,167 Allocation of appraised restoration expenses and repair expenses based on the Engineering Report.
Property management fees 4,429,077 Assumed based on agreement conditions, general standard, etc.
Advertisement for leasing, etc.
984,502
Assumed based on the agreement conditions, taking into account the standard tenant recruit expenses of similar buildings, and applying the estimated turnover ratio of unit.
Taxes 14,040,575 Assumed based on mid to long term perspective of the tax base of year 2015.
Insurance premium 288,970
Allocation, taking into account the actual amount, insurance premium rates of similar buildings, etc.
Other expenses 5,000 Assumed based on past actual other expences.
(3) Net operating income from leasing business (NOI=(1)-(2)) 103,214,175
(4) Profit through management of temporary deposits, etc. 2,171,575 Assumed interest rates of 2.0%.
(5) Capital Expenditure Reserve 8,336,917 Assumed in consideration of building age, as well as average maintenance and lease renewal fees based on the engineering report.
(6) Net Cash Flow (NCF = (3)+(4)-(5)) 97,048,833
(7) Capitalization rate 5.4% Assumed based on conditions of the location, the building, and the contract of the Property.
Price calculated by the Discounted Cash Flow Approach 1,800,000,000
Discount rate 5.2%
Assumed based on the yield on investment of similar buildings and the characteristics of the Property
Terminal capitalization rate
5.6%
Assumed based on the yield on investment of similar buildings, the future movement of the yield on investment, risks of the Property as a preferred investment, general forecasts of economic growth rate, and price trends of real estate and rents
Cost Approach Price 1,160,000,000 Ratio of land 62.3% Ratio of building 37.7% Matters noted in reconciliation of indicated value and determination of appraisal value
―
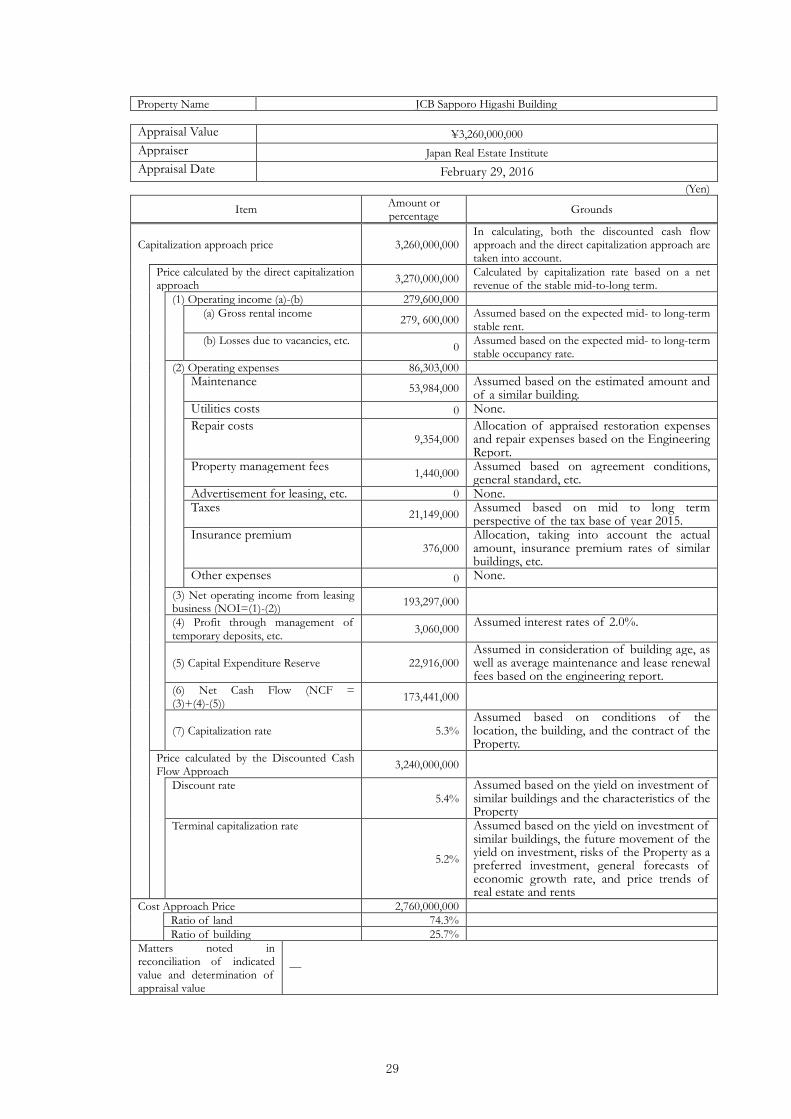
29
Property Name JCB Sapporo Higashi Building
Appraisal Value ¥3,260,000,000 Appraiser Japan Real Estate Institute Appraisal Date February 29, 2016
(Yen)
Item Amount or percentage Grounds
Capitalization approach price 3,260,000,000 In calculating, both the discounted cash flow approach and the direct capitalization approach are taken into account.
Price calculated by the direct capitalization approach 3,270,000,000 Calculated by capitalization rate based on a net
revenue of the stable mid-to-long term. (1) Operating income (a)-(b) 279,600,000
(a) Gross rental income 279, 600,000 Assumed based on the expected mid- to long-term stable rent.
(b) Losses due to vacancies, etc. 0 Assumed based on the expected mid- to long-term stable occupancy rate.
(2) Operating expenses 86,303,000 Maintenance 53,984,000 Assumed based on the estimated amount and
of a similar building. Utilities costs 0 None. Repair costs
9,354,000 Allocation of appraised restoration expenses and repair expenses based on the Engineering Report.
Property management fees 1,440,000 Assumed based on agreement conditions, general standard, etc.
Advertisement for leasing, etc. 0 None. Taxes 21,149,000 Assumed based on mid to long term
perspective of the tax base of year 2015. Insurance premium
376,000 Allocation, taking into account the actual amount, insurance premium rates of similar buildings, etc.
Other expenses 0 None. (3) Net operating income from leasing business (NOI=(1)-(2)) 193,297,000
(4) Profit through management of temporary deposits, etc. 3,060,000 Assumed interest rates of 2.0%.
(5) Capital Expenditure Reserve 22,916,000 Assumed in consideration of building age, as well as average maintenance and lease renewal fees based on the engineering report.
(6) Net Cash Flow (NCF = (3)+(4)-(5)) 173,441,000
(7) Capitalization rate 5.3% Assumed based on conditions of the location, the building, and the contract of the Property.
Price calculated by the Discounted Cash Flow Approach 3,240,000,000
Discount rate 5.4%
Assumed based on the yield on investment of similar buildings and the characteristics of the Property
Terminal capitalization rate
5.2%
Assumed based on the yield on investment of similar buildings, the future movement of the yield on investment, risks of the Property as a preferred investment, general forecasts of economic growth rate, and price trends of real estate and rents
Cost Approach Price 2,760,000,000 Ratio of land 74.3% Ratio of building 25.7% Matters noted in reconciliation of indicated value and determination of appraisal value
―
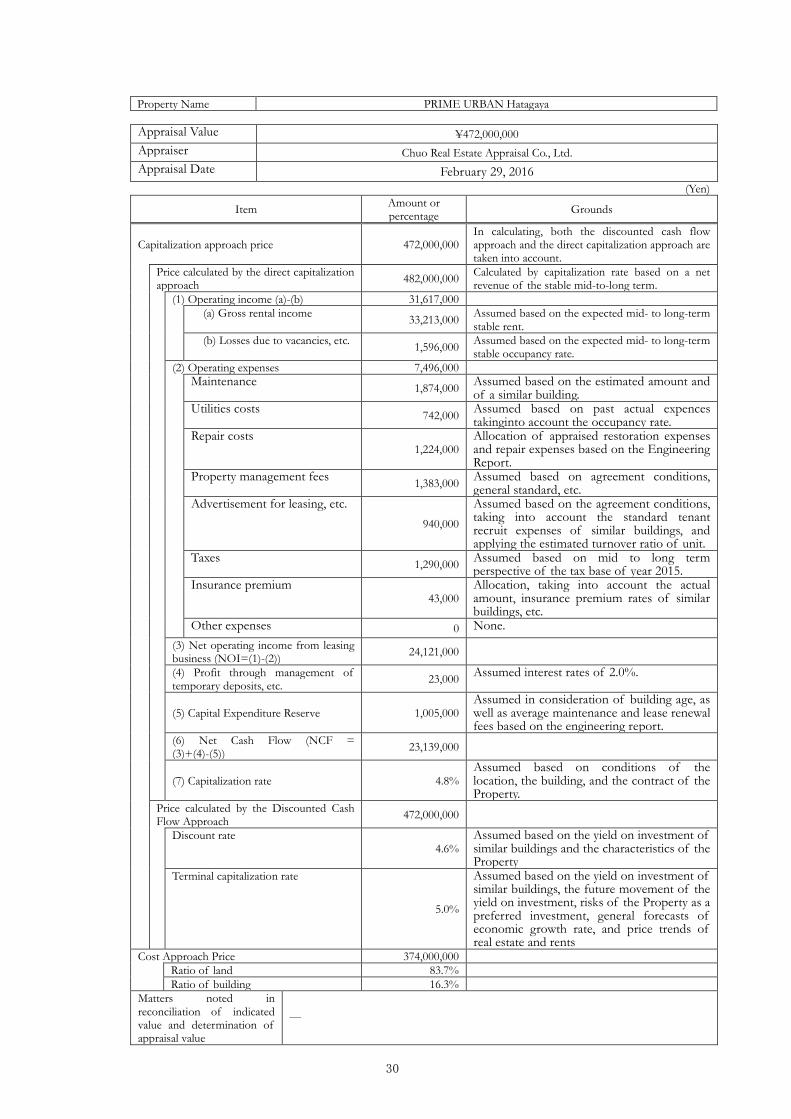
30
Property Name PRIME URBAN Hatagaya
Appraisal Value ¥472,000,000 Appraiser Chuo Real Estate Appraisal Co., Ltd. Appraisal Date February 29, 2016
(Yen)
Item Amount or percentage Grounds
Capitalization approach price 472,000,000 In calculating, both the discounted cash flow approach and the direct capitalization approach are taken into account.
Price calculated by the direct capitalization approach 482,000,000 Calculated by capitalization rate based on a net
revenue of the stable mid-to-long term. (1) Operating income (a)-(b) 31,617,000
(a) Gross rental income 33,213,000 Assumed based on the expected mid- to long-term stable rent.
(b) Losses due to vacancies, etc. 1,596,000 Assumed based on the expected mid- to long-term stable occupancy rate.
(2) Operating expenses 7,496,000 Maintenance 1,874,000 Assumed based on the estimated amount and
of a similar building. Utilities costs 742,000 Assumed based on past actual expences
takinginto account the occupancy rate. Repair costs
1,224,000 Allocation of appraised restoration expenses and repair expenses based on the Engineering Report.
Property management fees 1,383,000 Assumed based on agreement conditions, general standard, etc.
Advertisement for leasing, etc. 940,000
Assumed based on the agreement conditions, taking into account the standard tenant recruit expenses of similar buildings, and applying the estimated turnover ratio of unit.
Taxes 1,290,000 Assumed based on mid to long term perspective of the tax base of year 2015.
Insurance premium 43,000
Allocation, taking into account the actual amount, insurance premium rates of similar buildings, etc.
Other expenses 0 None. (3) Net operating income from leasing business (NOI=(1)-(2)) 24,121,000
(4) Profit through management of temporary deposits, etc. 23,000 Assumed interest rates of 2.0%.
(5) Capital Expenditure Reserve 1,005,000 Assumed in consideration of building age, as well as average maintenance and lease renewal fees based on the engineering report.
(6) Net Cash Flow (NCF = (3)+(4)-(5)) 23,139,000
(7) Capitalization rate 4.8% Assumed based on conditions of the location, the building, and the contract of the Property.
Price calculated by the Discounted Cash Flow Approach 472,000,000
Discount rate 4.6%
Assumed based on the yield on investment of similar buildings and the characteristics of the Property
Terminal capitalization rate
5.0%
Assumed based on the yield on investment of similar buildings, the future movement of the yield on investment, risks of the Property as a preferred investment, general forecasts of economic growth rate, and price trends of real estate and rents
Cost Approach Price 374,000,000 Ratio of land 83.7% Ratio of building 16.3% Matters noted in reconciliation of indicated value and determination of appraisal value
―
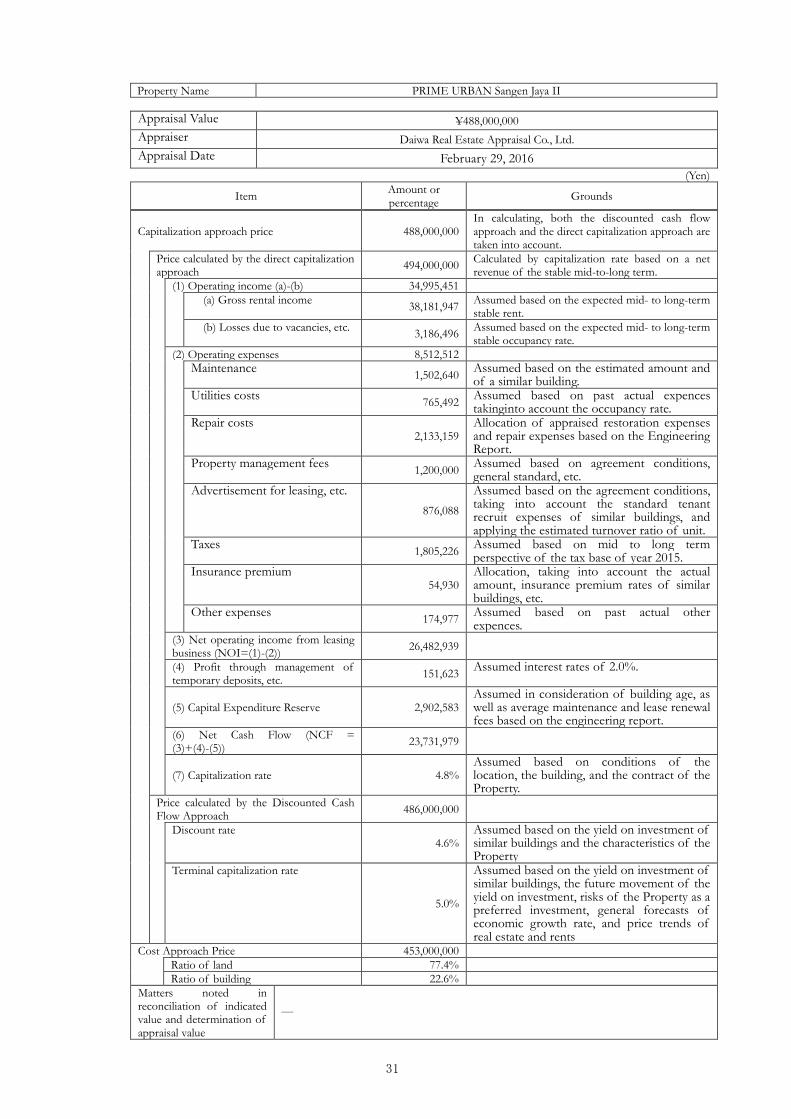
31
Property Name PRIME URBAN Sangen Jaya II
Appraisal Value ¥488,000,000 Appraiser Daiwa Real Estate Appraisal Co., Ltd. Appraisal Date February 29, 2016
(Yen)
Item Amount or percentage Grounds
Capitalization approach price 488,000,000 In calculating, both the discounted cash flow approach and the direct capitalization approach are taken into account.
Price calculated by the direct capitalization approach 494,000,000 Calculated by capitalization rate based on a net
revenue of the stable mid-to-long term. (1) Operating income (a)-(b) 34,995,451
(a) Gross rental income 38,181,947 Assumed based on the expected mid- to long-term stable rent.
(b) Losses due to vacancies, etc. 3,186,496 Assumed based on the expected mid- to long-term stable occupancy rate.
(2) Operating expenses 8,512,512 Maintenance 1,502,640 Assumed based on the estimated amount and
of a similar building. Utilities costs 765,492 Assumed based on past actual expences
takinginto account the occupancy rate. Repair costs
2,133,159 Allocation of appraised restoration expenses and repair expenses based on the Engineering Report.
Property management fees 1,200,000 Assumed based on agreement conditions, general standard, etc.
Advertisement for leasing, etc. 876,088
Assumed based on the agreement conditions, taking into account the standard tenant recruit expenses of similar buildings, and applying the estimated turnover ratio of unit.
Taxes 1,805,226 Assumed based on mid to long term perspective of the tax base of year 2015.
Insurance premium 54,930
Allocation, taking into account the actual amount, insurance premium rates of similar buildings, etc.
Other expenses 174,977 Assumed based on past actual other expences.
(3) Net operating income from leasing business (NOI=(1)-(2)) 26,482,939
(4) Profit through management of temporary deposits, etc. 151,623 Assumed interest rates of 2.0%.
(5) Capital Expenditure Reserve 2,902,583 Assumed in consideration of building age, as well as average maintenance and lease renewal fees based on the engineering report.
(6) Net Cash Flow (NCF = (3)+(4)-(5)) 23,731,979
(7) Capitalization rate 4.8% Assumed based on conditions of the location, the building, and the contract of the Property.
Price calculated by the Discounted Cash Flow Approach 486,000,000
Discount rate 4.6%
Assumed based on the yield on investment of similar buildings and the characteristics of the Property
Terminal capitalization rate
5.0%
Assumed based on the yield on investment of similar buildings, the future movement of the yield on investment, risks of the Property as a preferred investment, general forecasts of economic growth rate, and price trends of real estate and rents
Cost Approach Price 453,000,000 Ratio of land 77.4% Ratio of building 22.6% Matters noted in reconciliation of indicated value and determination of appraisal value
―
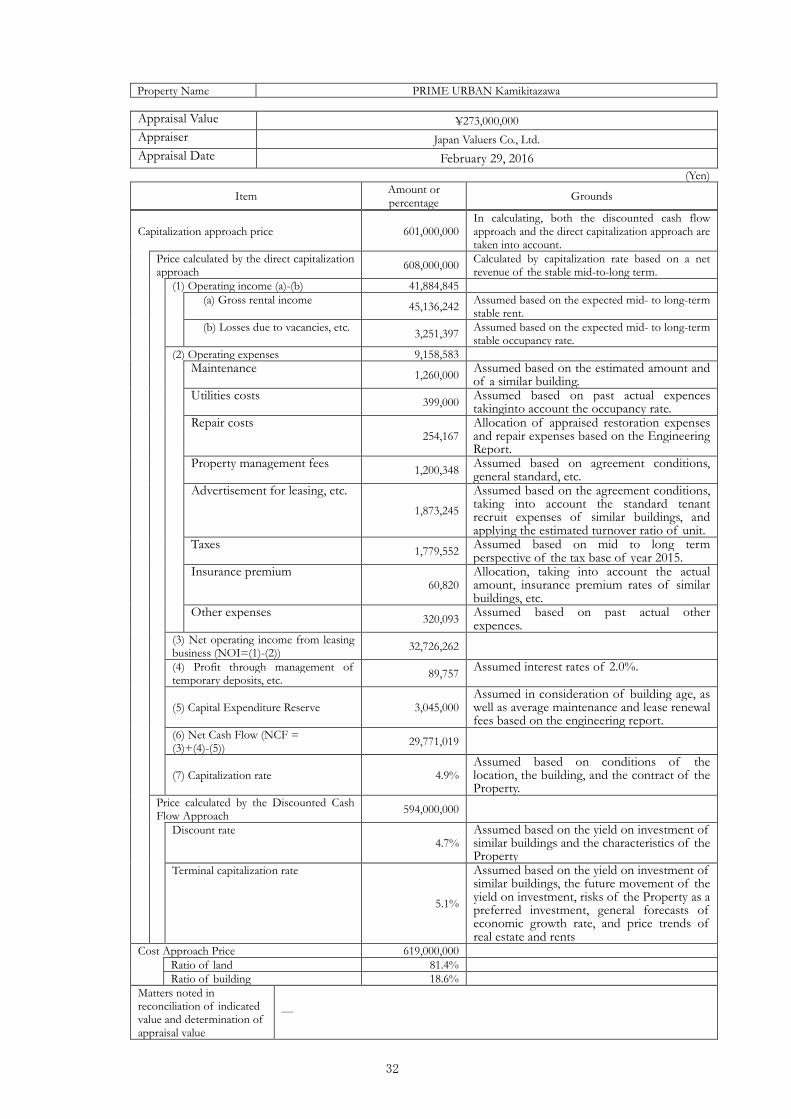
32
Property Name PRIME URBAN Kamikitazawa
Appraisal Value ¥273,000,000 Appraiser Japan Valuers Co., Ltd. Appraisal Date February 29, 2016
(Yen)
Item Amount or percentage Grounds
Capitalization approach price 601,000,000 In calculating, both the discounted cash flow approach and the direct capitalization approach are taken into account.
Price calculated by the direct capitalization approach 608,000,000 Calculated by capitalization rate based on a net
revenue of the stable mid-to-long term. (1) Operating income (a)-(b) 41,884,845
(a) Gross rental income 45,136,242 Assumed based on the expected mid- to long-term stable rent.
(b) Losses due to vacancies, etc. 3,251,397 Assumed based on the expected mid- to long-term stable occupancy rate.
(2) Operating expenses 9,158,583 Maintenance 1,260,000 Assumed based on the estimated amount and
of a similar building. Utilities costs 399,000 Assumed based on past actual expences
takinginto account the occupancy rate. Repair costs
254,167 Allocation of appraised restoration expenses and repair expenses based on the Engineering Report.
Property management fees 1,200,348 Assumed based on agreement conditions, general standard, etc.
Advertisement for leasing, etc. 1,873,245
Assumed based on the agreement conditions, taking into account the standard tenant recruit expenses of similar buildings, and applying the estimated turnover ratio of unit.
Taxes 1,779,552 Assumed based on mid to long term perspective of the tax base of year 2015.
Insurance premium 60,820
Allocation, taking into account the actual amount, insurance premium rates of similar buildings, etc.
Other expenses 320,093 Assumed based on past actual other expences.
(3) Net operating income from leasing business (NOI=(1)-(2)) 32,726,262
(4) Profit through management of temporary deposits, etc. 89,757 Assumed interest rates of 2.0%.
(5) Capital Expenditure Reserve 3,045,000 Assumed in consideration of building age, as well as average maintenance and lease renewal fees based on the engineering report.
(6) Net Cash Flow (NCF = (3)+(4)-(5)) 29,771,019
(7) Capitalization rate 4.9% Assumed based on conditions of the location, the building, and the contract of the Property.
Price calculated by the Discounted Cash Flow Approach 594,000,000
Discount rate 4.7%
Assumed based on the yield on investment of similar buildings and the characteristics of the Property
Terminal capitalization rate
5.1%
Assumed based on the yield on investment of similar buildings, the future movement of the yield on investment, risks of the Property as a preferred investment, general forecasts of economic growth rate, and price trends of real estate and rents
Cost Approach Price 619,000,000 Ratio of land 81.4% Ratio of building 18.6% Matters noted in reconciliation of indicated value and determination of appraisal value
―
33
【Exhibits】
Exhibit 1 Portfolio Over View after Acquisition and Disposition
Exhibit 2 Photos of two Properties
Exhibit 3 Maps of two Properties
*<Nomura Real Estate Master Fund, Inc> URL: http://www.nre-mf.co.jp/en/
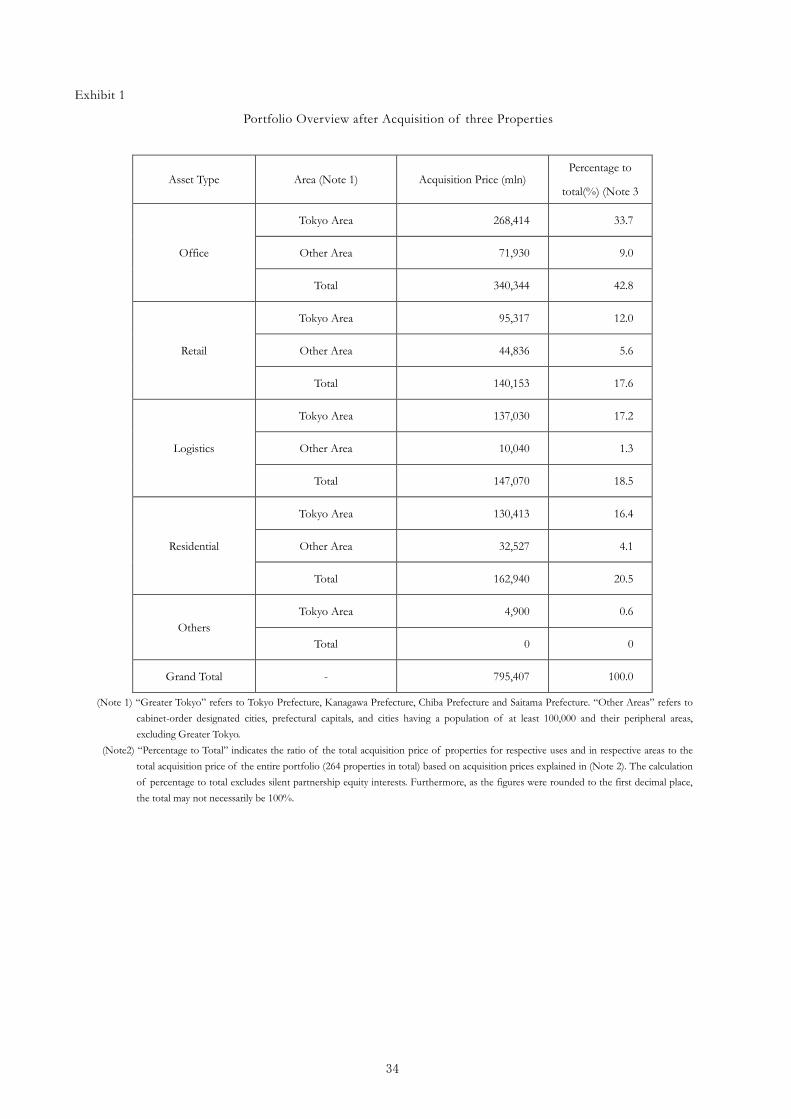
34
Exhibit 1
Portfolio Overview after Acquisition of three Properties
Asset Type Area (Note 1) Acquisition Price (mln) Percentage to
total(%) (Note 3
Office
Tokyo Area 268,414 33.7
Other Area 71,930 9.0
Total 340,344 42.8
Retail
Tokyo Area 95,317 12.0
Other Area 44,836 5.6
Total 140,153 17.6
Logistics
Tokyo Area 137,030 17.2
Other Area 10,040 1.3
Total 147,070 18.5
Residential
Tokyo Area 130,413 16.4
Other Area 32,527 4.1
Total 162,940 20.5
Others Tokyo Area 4,900 0.6
Total 0 0
Grand Total - 795,407 100.0
(Note 1) “Greater Tokyo” refers to Tokyo Prefecture, Kanagawa Prefecture, Chiba Prefecture and Saitama Prefecture. “Other Areas” refers to cabinet-order designated cities, prefectural capitals, and cities having a population of at least 100,000 and their peripheral areas, excluding Greater Tokyo.
(Note2) “Percentage to Total” indicates the ratio of the total acquisition price of properties for respective uses and in respective areas to the total acquisition price of the entire portfolio (264 properties in total) based on acquisition prices explained in (Note 2). The calculation of percentage to total excludes silent partnership equity interests. Furthermore, as the figures were rounded to the first decimal place, the total may not necessarily be 100%.
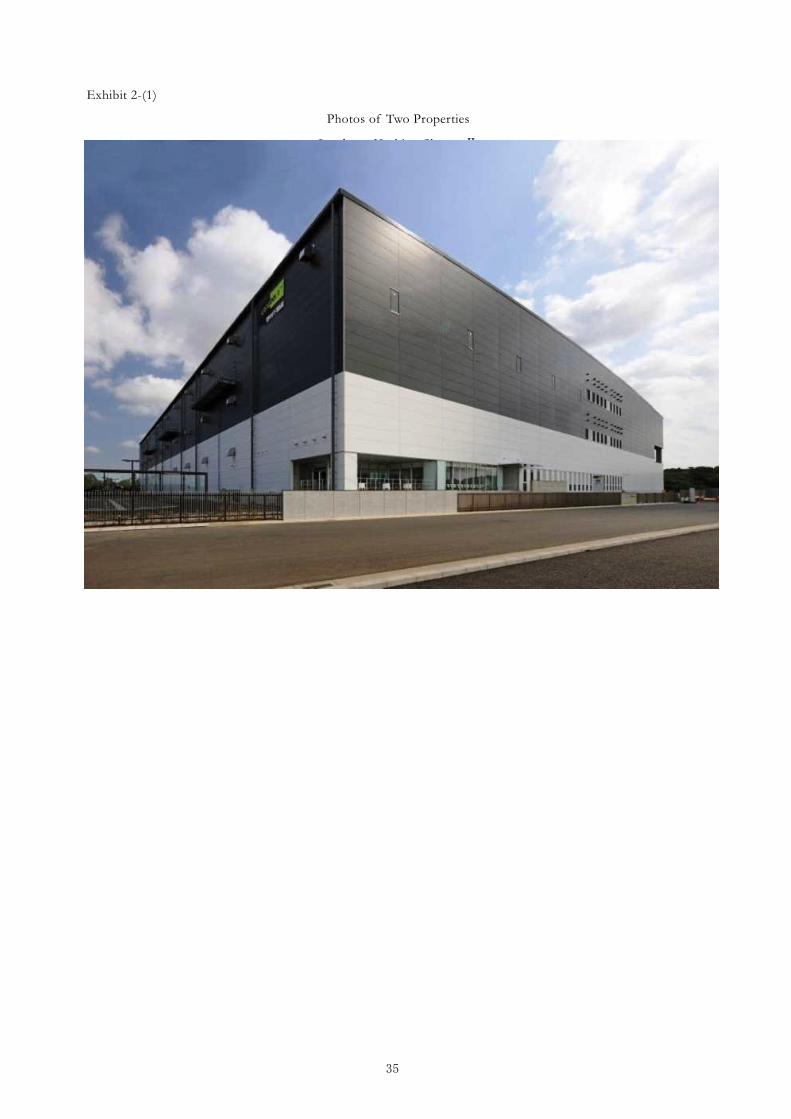
35
Exhibit 2-(1)
Photos of Two Properties
Landport Kashiwa ShonanⅡ
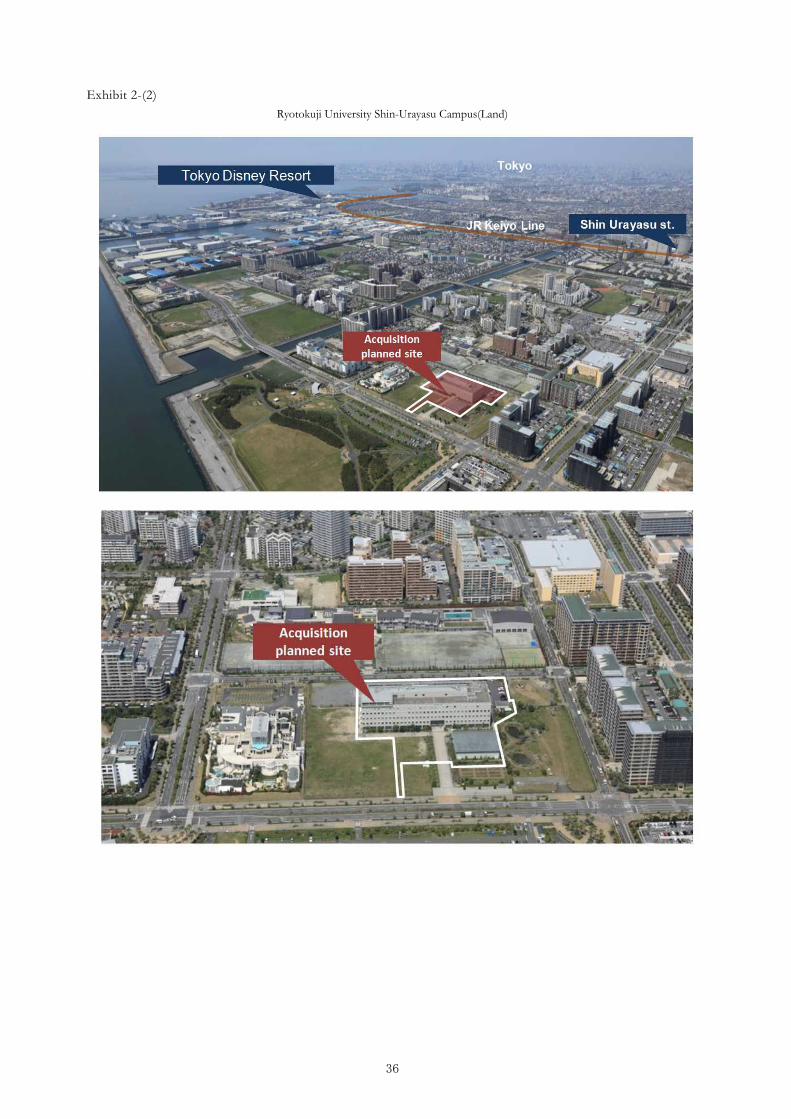
36
Exhibit 2-(2) Ryotokuji University Shin-Urayasu Campus(Land)
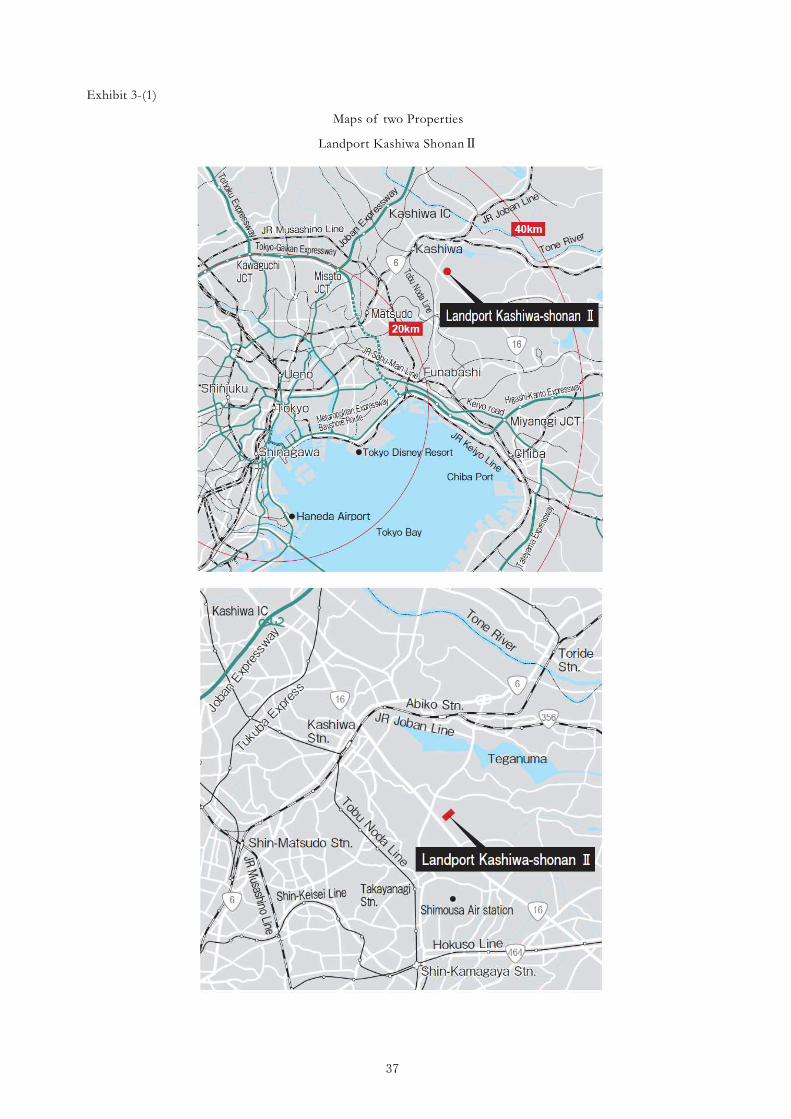
37
Exhibit 3-(1)
Maps of two Properties
Landport Kashiwa ShonanⅡ
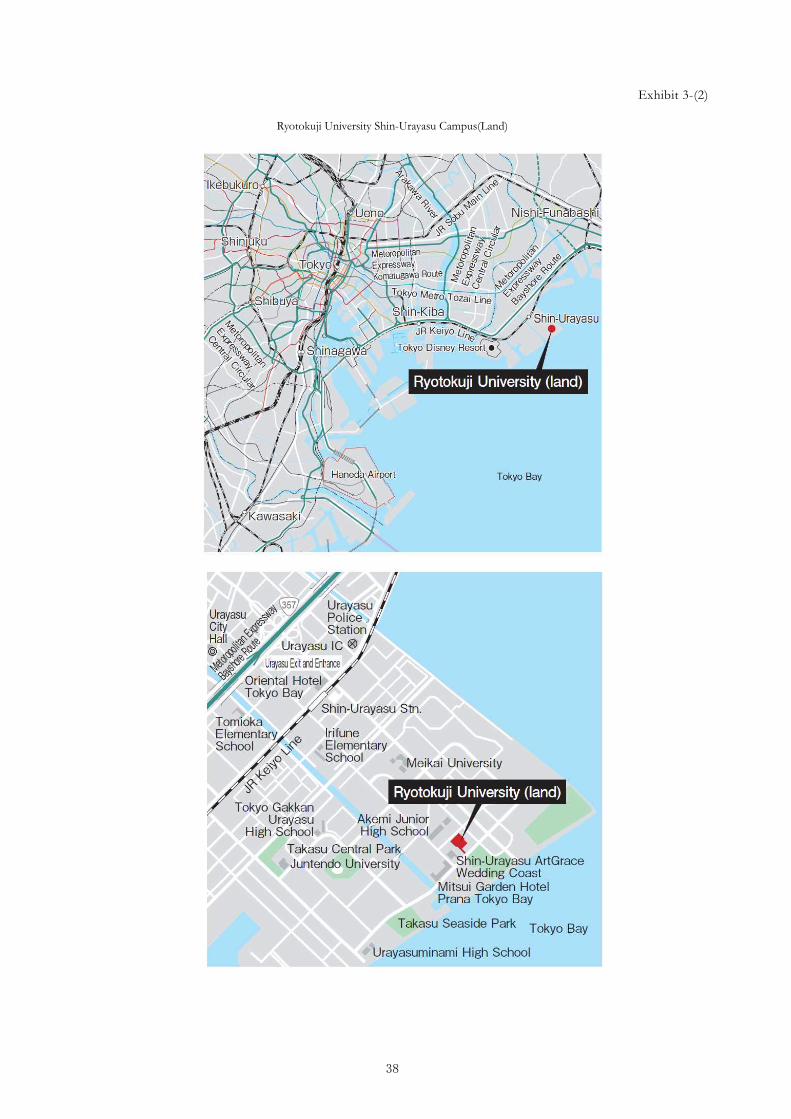
38
Exhibit 3-(2)
Ryotokuji University Shin-Urayasu Campus(Land)