Embed Size (px)
Citation preview

1
Get This Newsletter Every Saturday from Al Kluis Commodities..."Your Markets, Right Now"...AlKluis.com
Saturday, January 12, 2013
Notes from Al The biggest surprise in the big USDA reports Friday was corn stocks. The quarterly Grain Stocks report said that US corn stocks were only 8.030 billion bushels, a substantial 253 million bushels below trade estimates. Why so much lower than expected? The only way I can make the numbers balance is that the USDA may have counted 230 million bushels of 2012 crop harvest as 2011 crop in the September Grain Stocks report. The newest Grain Stocks report corrected that miscount. Meanwhile, the reported soybean and wheat stocks came in very close to our estimates. The main theme in the big Friday reports was bigger crop, larger usage. The reports all were close to our pre-report estimates. The final corn production came in higher than expected, but this was offset by greater-than-expected use. The same pattern held for soybeans: The crop was larger than expected... but offset by larger usage. Wheat production was unchanged... but feed usage was increased. I view all of these reports as positive. Increased usage is a long-term positive factor for prices, total revenue and farm income. To view the original USDA reports go to http://www.nass.usda.gov and http://www.usda.gov/oce/commodity/wasde. Now that the report is over, the grain trade will focus on Chinese demand and crop and weather outlook in South America and the US. China is back in the market buying. With all of the annual and quarterly reports on Friday, no one paid much attention to the huge Chinese purchases Thursday of old crop and new crop soybeans. Overall in 2012, China bought a record 58.38 million tons (2.140 billion bushels) of soybeans, an increase of 11.2% over 2011. (Think of it this way: In 2012, China bought the equivalent of nearly three-quarters of the 2012 US soybean crop. They bought about half of this from the US, and about half from South America.) I predict China will increase soybean purchases by a similar amount in 2013. More attention will now start to focus on US weather and crop prospects. Our favorite weather guy, DT, does not see any change in the pattern that will relieve the major drought in the western Corn Belt this spring.
_______
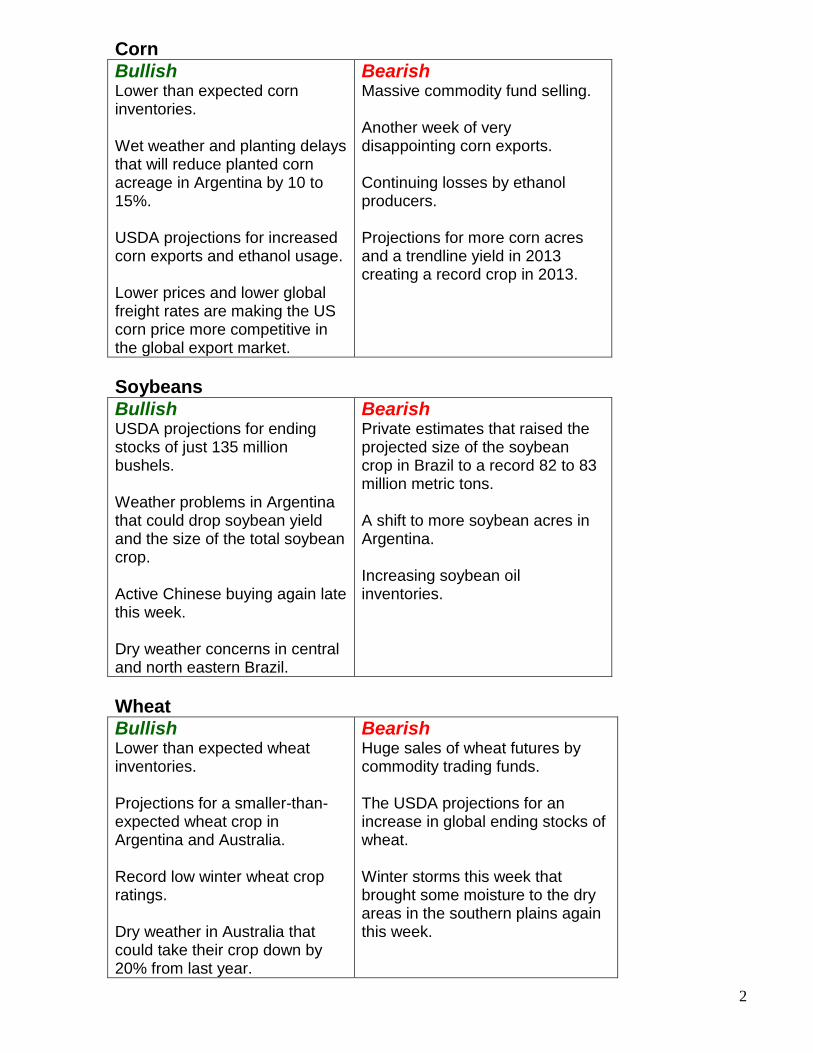
Al’s Market Thermometers
This week grain markets rallied back, gaining back some of the steep losses that have piled up over the last month. Here's the updated set of the most important market factors affecting price now...
2
Corn
Bullish Lower than expected corn inventories. Wet weather and planting delays that will reduce planted corn acreage in Argentina by 10 to 15%. USDA projections for increased corn exports and ethanol usage. Lower prices and lower global freight rates are making the US corn price more competitive in the global export market.
Bearish Massive commodity fund selling. Another week of very disappointing corn exports. Continuing losses by ethanol producers. Projections for more corn acres and a trendline yield in 2013 creating a record crop in 2013.
Soybeans
Bullish USDA projections for ending stocks of just 135 million bushels. Weather problems in Argentina that could drop soybean yield and the size of the total soybean crop. Active Chinese buying again late this week. Dry weather concerns in central and north eastern Brazil.
Bearish Private estimates that raised the projected size of the soybean crop in Brazil to a record 82 to 83 million metric tons. A shift to more soybean acres in Argentina. Increasing soybean oil inventories.
Wheat
Bullish Lower than expected wheat inventories. Projections for a smaller-than-expected wheat crop in Argentina and Australia. Record low winter wheat crop ratings. Dry weather in Australia that could take their crop down by 20% from last year.
Bearish Huge sales of wheat futures by commodity trading funds. The USDA projections for an increase in global ending stocks of wheat. Winter storms this week that brought some moisture to the dry areas in the southern plains again this week.
3
_______
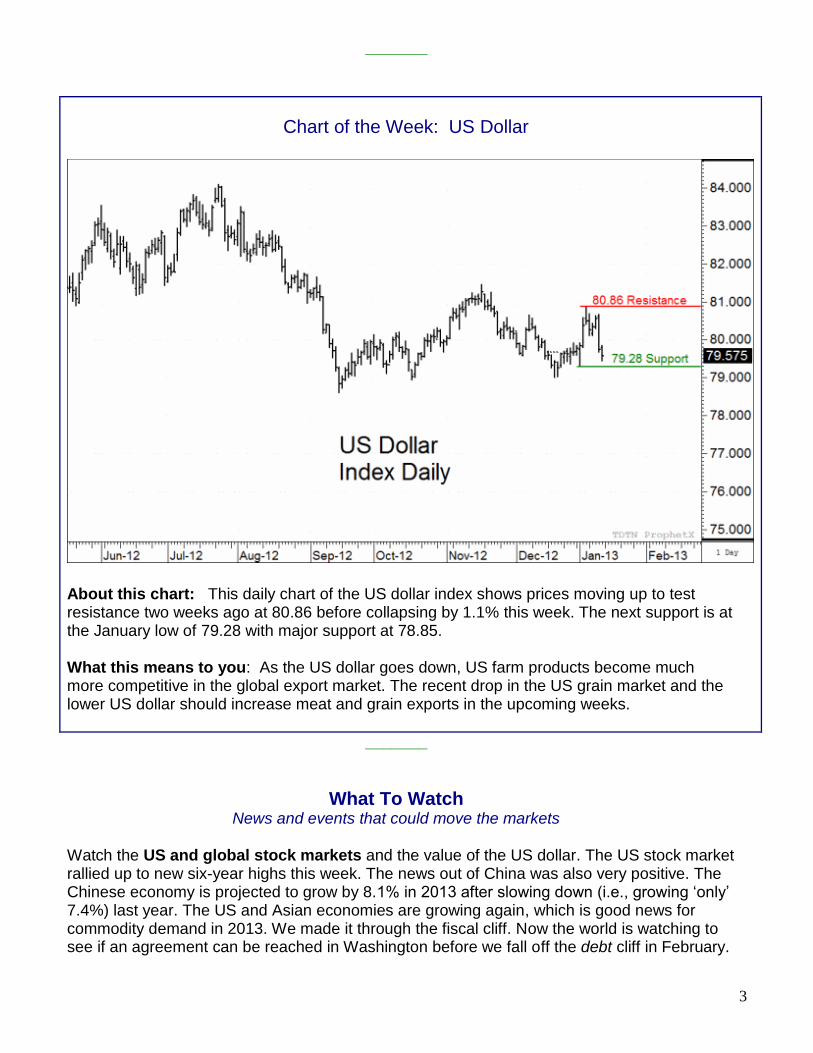
Chart of the Week: US Dollar
About this chart: This daily chart of the US dollar index shows prices moving up to test resistance two weeks ago at 80.86 before collapsing by 1.1% this week. The next support is at the January low of 79.28 with major support at 78.85. What this means to you: As the US dollar goes down, US farm products become much more competitive in the global export market. The recent drop in the US grain market and the lower US dollar should increase meat and grain exports in the upcoming weeks.
_______
What To Watch News and events that could move the markets
Watch the US and global stock markets and the value of the US dollar. The US stock market rallied up to new six-year highs this week. The news out of China was also very positive. The Chinese economy is projected to grow by 8.1% in 2013 after slowing down (i.e., growing ‘only’ 7.4%) last year. The US and Asian economies are growing again, which is good news for commodity demand in 2013. We made it through the fiscal cliff. Now the world is watching to see if an agreement can be reached in Washington before we fall off the debt cliff in February.
4
The soybean-to-corn price ratio has dropped to just 1.93/1. It is very unusual for this ratio to drop below 2/1, and it usually does not stay below 2/1 for very long. This tells me corn is too high, soybeans are too low, or some combination thereof. Be ready to use any additional rally in corn to make more cash corn sales.
_______
What To Do Now
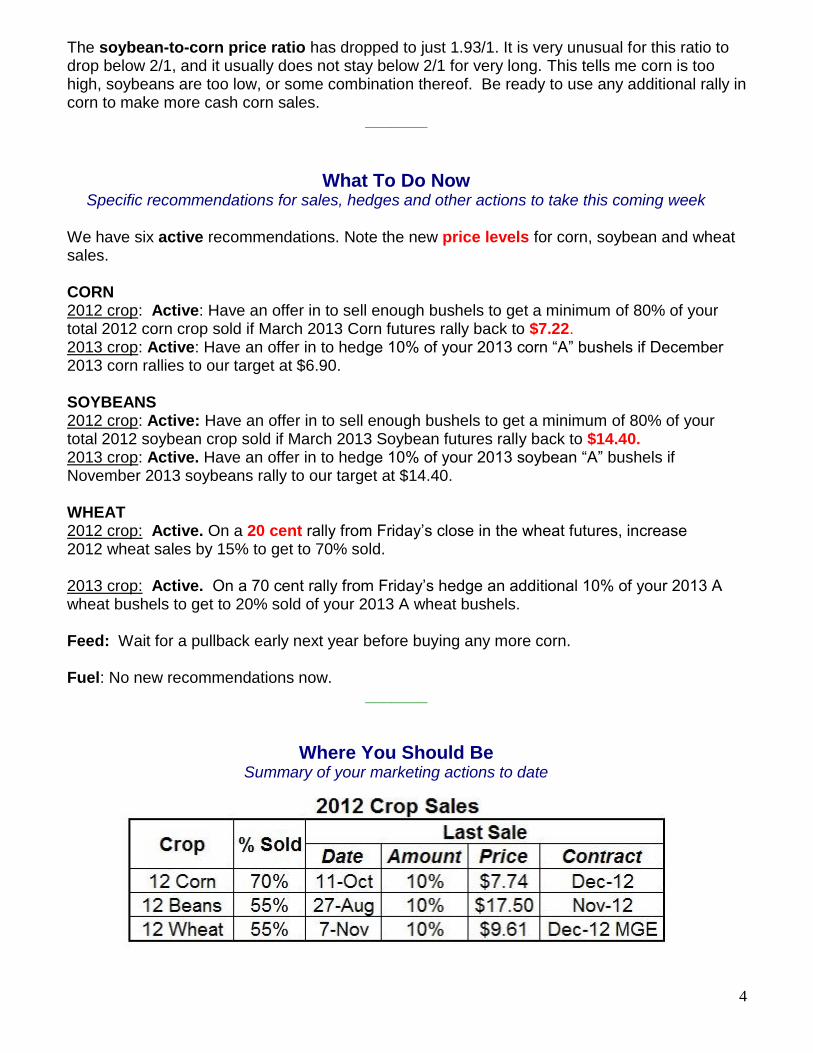
Specific recommendations for sales, hedges and other actions to take this coming week We have six active recommendations. Note the new price levels for corn, soybean and wheat sales. CORN 2012 crop: Active: Have an offer in to sell enough bushels to get a minimum of 80% of your total 2012 corn crop sold if March 2013 Corn futures rally back to $7.22. 2013 crop: Active: Have an offer in to hedge 10% of your 2013 corn “A” bushels if December 2013 corn rallies to our target at $6.90. SOYBEANS 2012 crop: Active: Have an offer in to sell enough bushels to get a minimum of 80% of your total 2012 soybean crop sold if March 2013 Soybean futures rally back to $14.40. 2013 crop: Active. Have an offer in to hedge 10% of your 2013 soybean “A” bushels if November 2013 soybeans rally to our target at $14.40. WHEAT 2012 crop: Active. On a 20 cent rally from Friday’s close in the wheat futures, increase 2012 wheat sales by 15% to get to 70% sold. 2013 crop: Active. On a 70 cent rally from Friday’s hedge an additional 10% of your 2013 A wheat bushels to get to 20% sold of your 2013 A wheat bushels. Feed: Wait for a pullback early next year before buying any more corn. Fuel: No new recommendations now.
_______
Where You Should Be Summary of your marketing actions to date
5
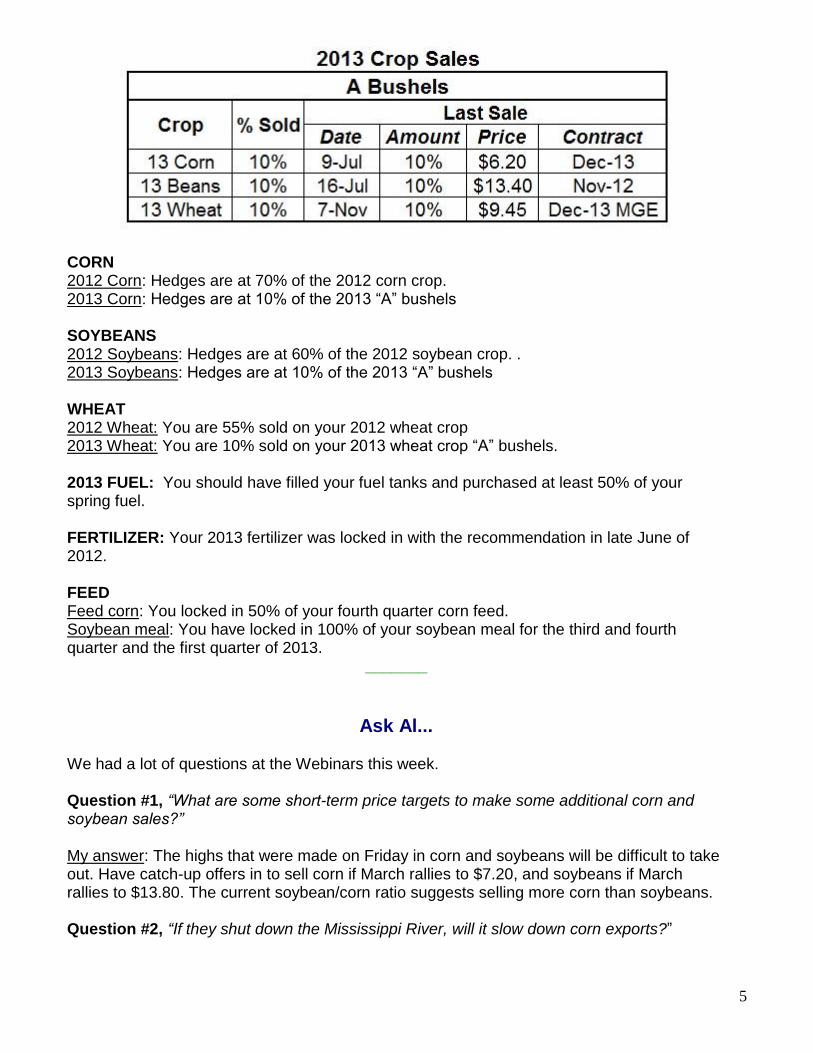
CORN 2012 Corn: Hedges are at 70% of the 2012 corn crop. 2013 Corn: Hedges are at 10% of the 2013 “A” bushels SOYBEANS 2012 Soybeans: Hedges are at 60% of the 2012 soybean crop. . 2013 Soybeans: Hedges are at 10% of the 2013 “A” bushels WHEAT 2012 Wheat: You are 55% sold on your 2012 wheat crop 2013 Wheat: You are 10% sold on your 2013 wheat crop “A” bushels. 2013 FUEL: You should have filled your fuel tanks and purchased at least 50% of your spring fuel. FERTILIZER: Your 2013 fertilizer was locked in with the recommendation in late June of 2012. FEED Feed corn: You locked in 50% of your fourth quarter corn feed. Soybean meal: You have locked in 100% of your soybean meal for the third and fourth quarter and the first quarter of 2013.
_______
Ask Al...
We had a lot of questions at the Webinars this week. Question #1, “What are some short-term price targets to make some additional corn and soybean sales?” My answer: The highs that were made on Friday in corn and soybeans will be difficult to take out. Have catch-up offers in to sell corn if March rallies to $7.20, and soybeans if March rallies to $13.80. The current soybean/corn ratio suggests selling more corn than soybeans. Question #2, “If they shut down the Mississippi River, will it slow down corn exports?”
6
My answer: No, not much if at all. Corn exports have been slow because US corn prices are 50 to 70 cents per bushel higher than corn from Brazil and the Ukraine. I am more concerned with what shutting down the Mississippi would do to fertilizer prices and availability. Do you have a marketing question? Send your questions to Al at [email protected].
_______
Announcements and Other Information Kluis Calendar Basis & Market Update The Wednesday close this week for March 2013 CBOT Corn was $6.94. Cash basis bids were steady to 1 cent better at most locations this week. March soybean futures closed at $13.85 this Wednesday. Cash basis bids were steady this week.
_______
7
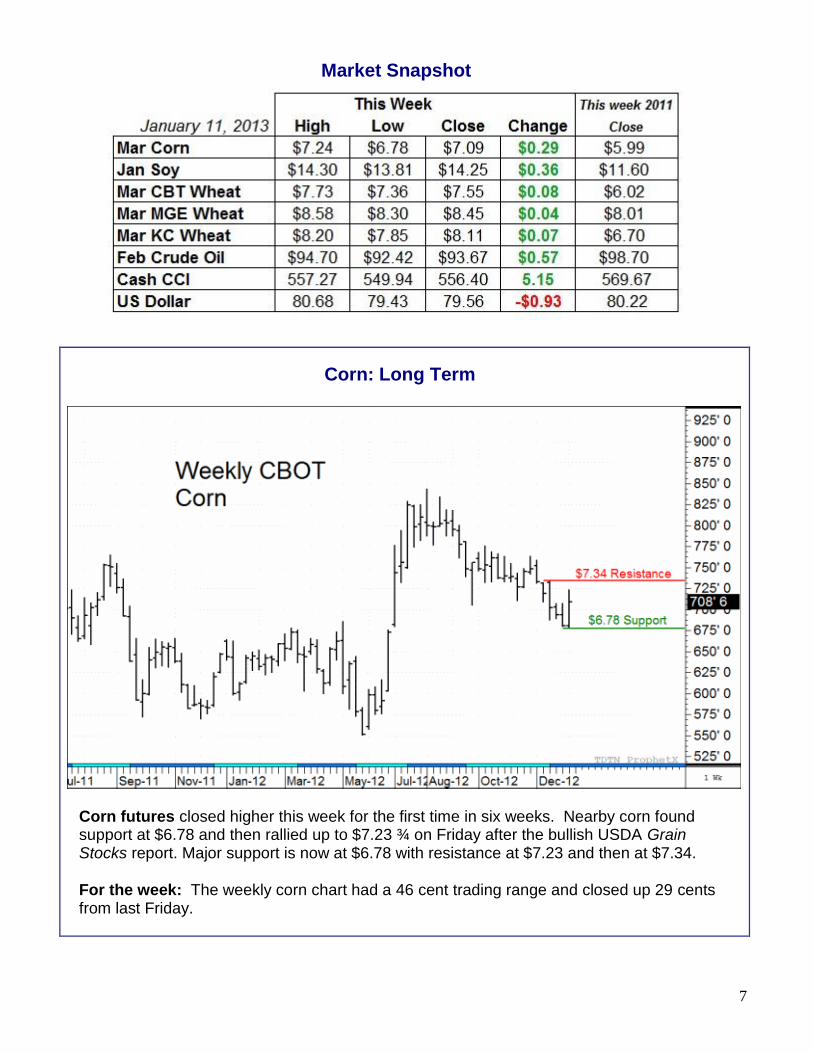
Market Snapshot
Corn: Long Term
Corn futures closed higher this week for the first time in six weeks. Nearby corn found support at $6.78 and then rallied up to $7.23 ¾ on Friday after the bullish USDA Grain Stocks report. Major support is now at $6.78 with resistance at $7.23 and then at $7.34. For the week: The weekly corn chart had a 46 cent trading range and closed up 29 cents from last Friday.

8
Corn: 2012 Crop
March 2013 Corn futures closed higher this week. March Corn futures opened lower on Sunday night but then reversed and closed higher. The Friday low at $6.86 is short term support with resistance at $7.23 and then at $7.34. I look for a trading channel to develop with support at $6.86 and resistance at $7.23. For the week: March corn had a 46 cent trading range and closed up 29 cents from last Friday.
9
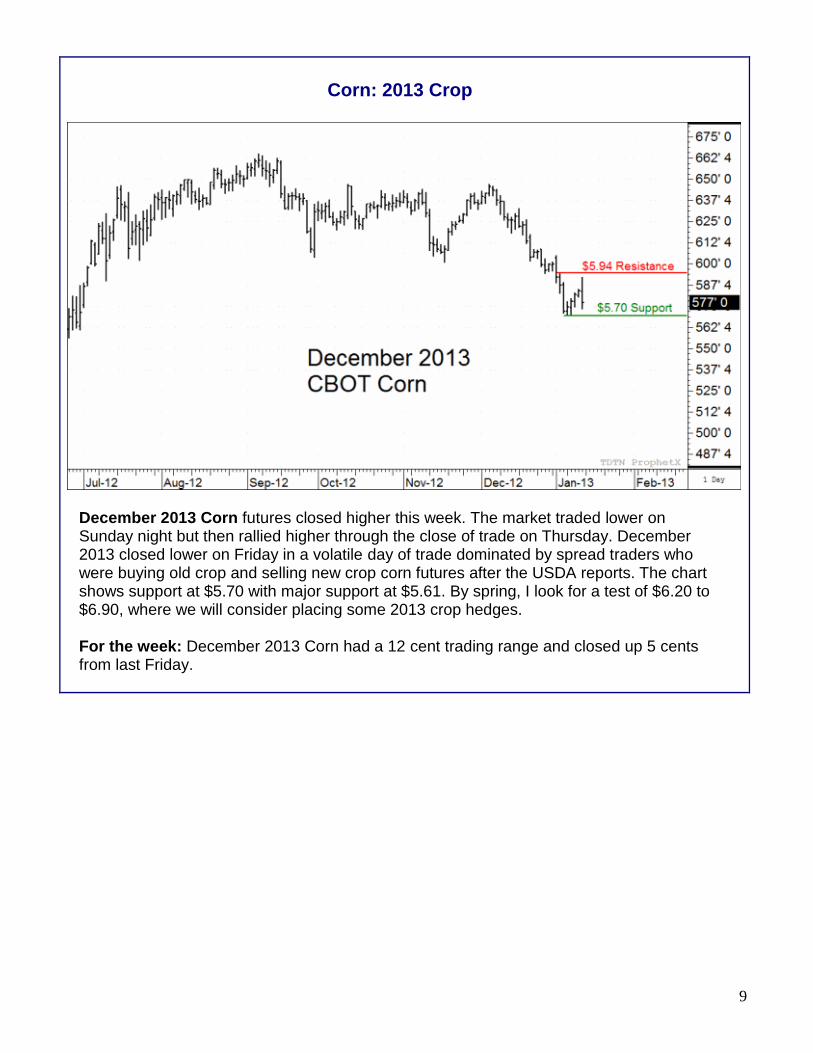
Corn: 2013 Crop
December 2013 Corn futures closed higher this week. The market traded lower on Sunday night but then rallied higher through the close of trade on Thursday. December 2013 closed lower on Friday in a volatile day of trade dominated by spread traders who were buying old crop and selling new crop corn futures after the USDA reports. The chart shows support at $5.70 with major support at $5.61. By spring, I look for a test of $6.20 to $6.90, where we will consider placing some 2013 crop hedges. For the week: December 2013 Corn had a 12 cent trading range and closed up 5 cents from last Friday.
10
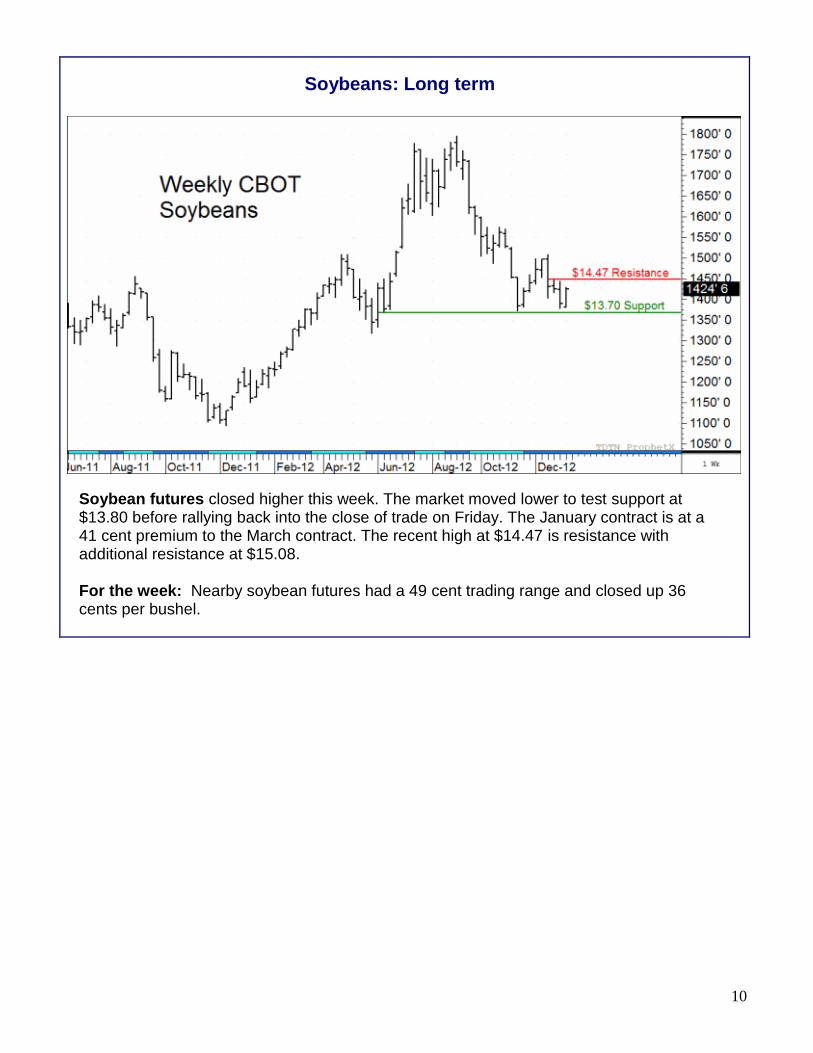
Soybeans: Long term
Soybean futures closed higher this week. The market moved lower to test support at $13.80 before rallying back into the close of trade on Friday. The January contract is at a 41 cent premium to the March contract. The recent high at $14.47 is resistance with additional resistance at $15.08. For the week: Nearby soybean futures had a 49 cent trading range and closed up 36 cents per bushel.
11
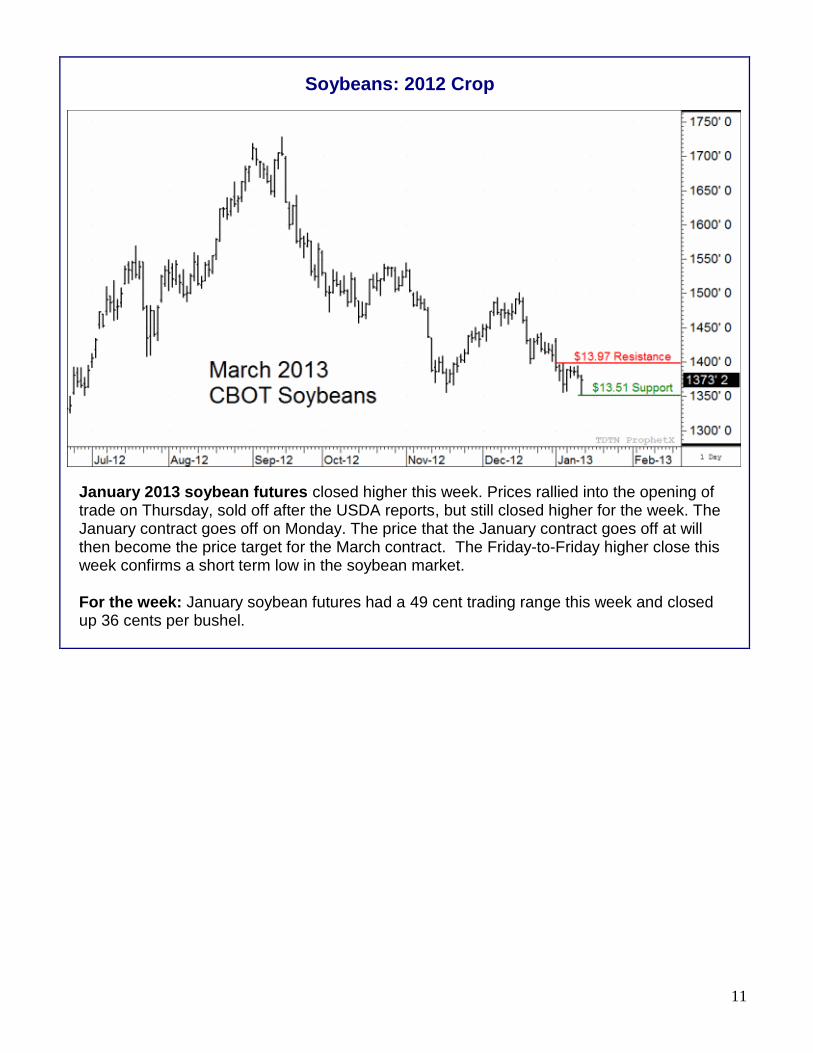
Soybeans: 2012 Crop
January 2013 soybean futures closed higher this week. Prices rallied into the opening of trade on Thursday, sold off after the USDA reports, but still closed higher for the week. The January contract goes off on Monday. The price that the January contract goes off at will then become the price target for the March contract. The Friday-to-Friday higher close this week confirms a short term low in the soybean market. For the week: January soybean futures had a 49 cent trading range this week and closed up 36 cents per bushel.
12
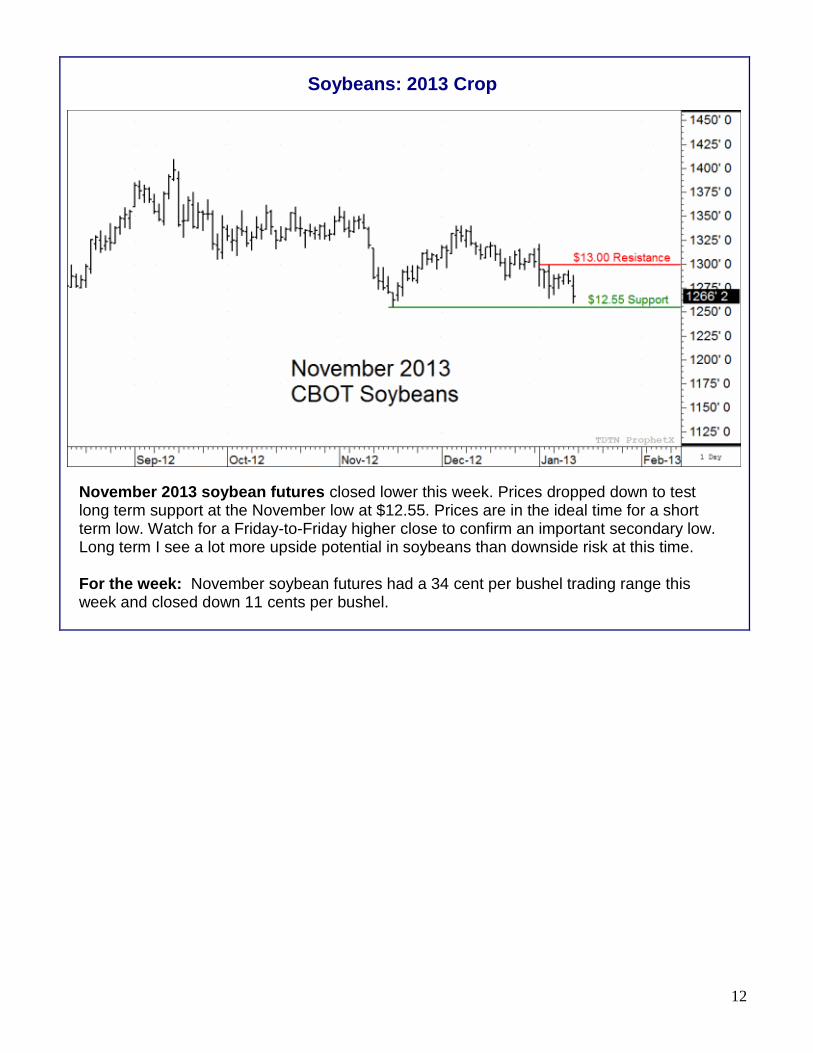
Soybeans: 2013 Crop
November 2013 soybean futures closed lower this week. Prices dropped down to test long term support at the November low at $12.55. Prices are in the ideal time for a short term low. Watch for a Friday-to-Friday higher close to confirm an important secondary low. Long term I see a lot more upside potential in soybeans than downside risk at this time. For the week: November soybean futures had a 34 cent per bushel trading range this week and closed down 11 cents per bushel.
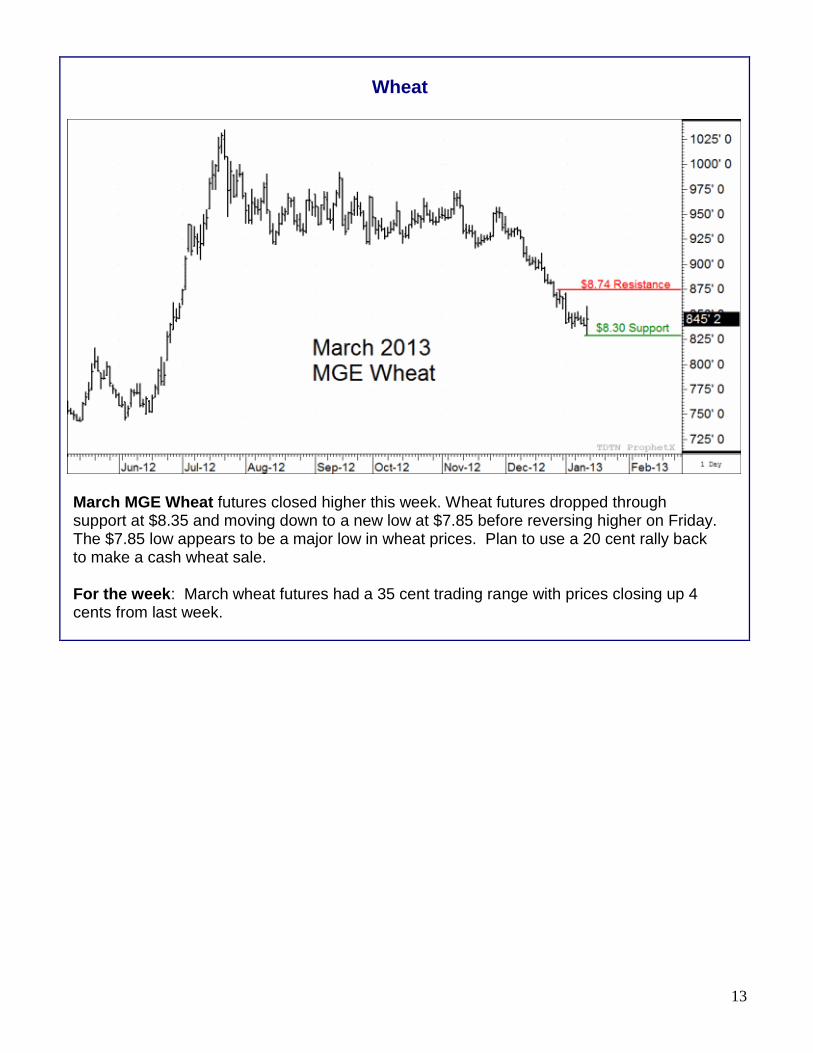
13
Wheat
March MGE Wheat futures closed higher this week. Wheat futures dropped through support at $8.35 and moving down to a new low at $7.85 before reversing higher on Friday. The $7.85 low appears to be a major low in wheat prices. Plan to use a 20 cent rally back to make a cash wheat sale. For the week: March wheat futures had a 35 cent trading range with prices closing up 4 cents from last week.
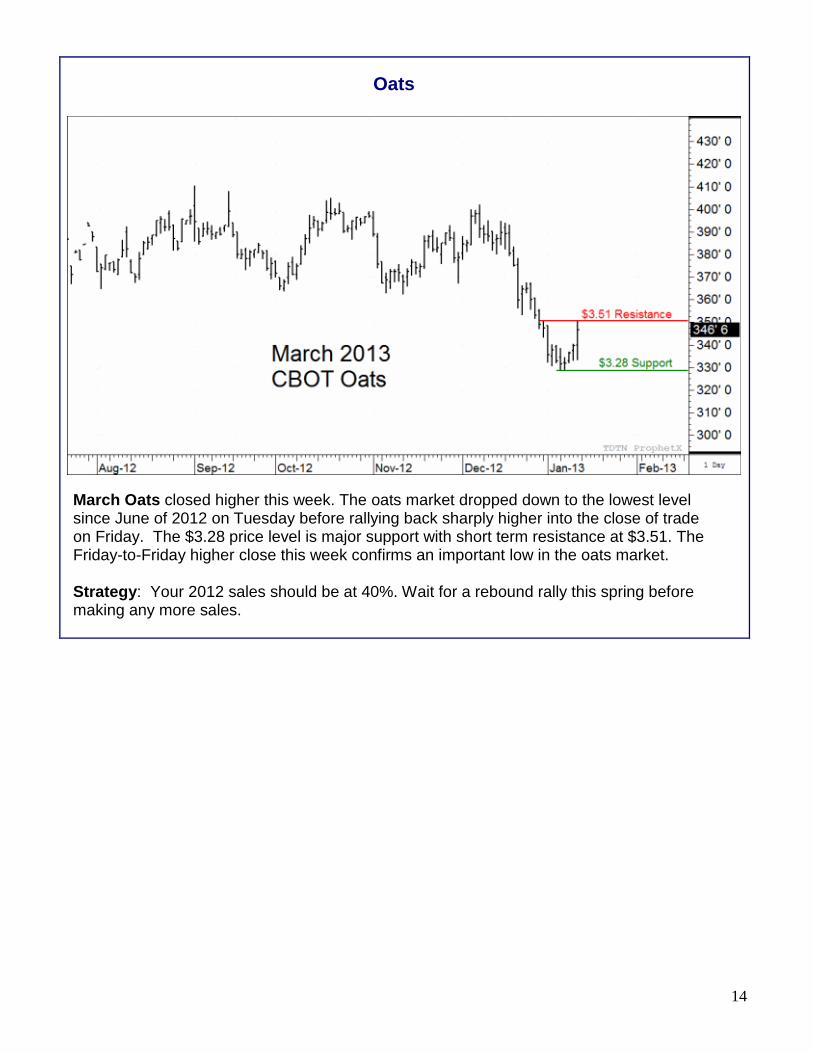
14
Oats
March Oats closed higher this week. The oats market dropped down to the lowest level since June of 2012 on Tuesday before rallying back sharply higher into the close of trade on Friday. The $3.28 price level is major support with short term resistance at $3.51. The Friday-to-Friday higher close this week confirms an important low in the oats market. Strategy: Your 2012 sales should be at 40%. Wait for a rebound rally this spring before making any more sales.

15
Canola
March Canola: The canola market closed higher this week. Prices dropped down to test support at $577 before rallying back into the close of trade on Friday. A close above $598 will confirm an important secondary low in the canola market. Stay disciplined. Wait for higher prices before making more sales. Strategy: Your 2012 canola sales should be at 60%. Wait for a rebound before making any more cash sales.
_______
The analysis and information contained within are based on information we believe to be reliable. There is no liability for its use. There is a risk of loss trading futures and options. The Al Kluis Report is published 48 out of 52 weeks per year. Copyright 2013 Al Kluis.