Embed Size (px)
Citation preview
STATE STREET ASSOCIATES
Correlation Surprise
Will Kinlaw
David Turkingtong
LIMITED ACCESS
STATE STREET ASSOCIATES
Outline
Measuring financial turbulence
Isolating correlation surprises
Investment applications
Summary
LIMITED ACCESS 2

STATE STREET ASSOCIATES
Measuring financial turbulence
LIMITED ACCESS 3
STATE STREET ASSOCIATES
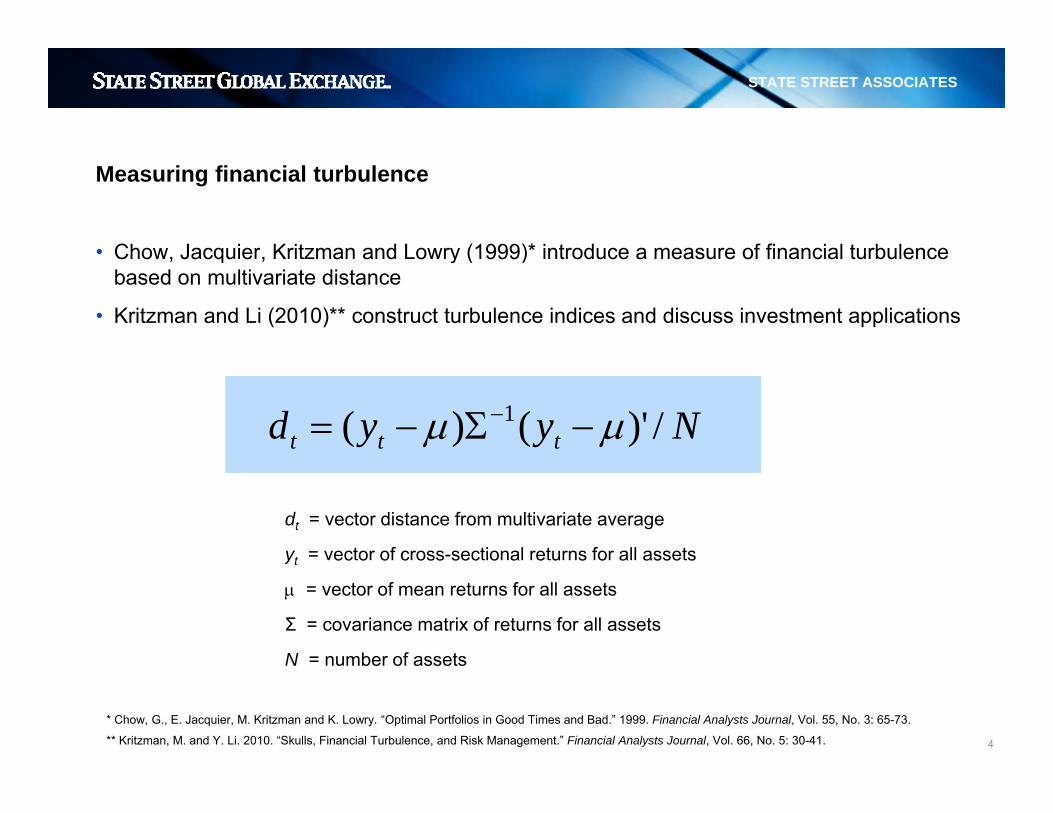
Measuring financial turbulence
• Chow Jacquier Kritzman and Lowry (1999)* introduce a measure of financial turbulence• Chow, Jacquier, Kritzman and Lowry (1999) introduce a measure of financial turbulence based on multivariate distance
• Kritzman and Li (2010)** construct turbulence indices and discuss investment applications
Nyyd ttt /)'()( 1 μμ −Σ−= −
dt = vector distance from multivariate average
yt = vector of cross-sectional returns for all assetsyt ec o o c oss sec o a e u s o a asse s
μ = vector of mean returns for all assets
Σ = covariance matrix of returns for all assets
N = number of assets
LIMITED ACCESS 4
* Chow, G., E. Jacquier, M. Kritzman and K. Lowry. “Optimal Portfolios in Good Times and Bad.” 1999. Financial Analysts Journal, Vol. 55, No. 3: 65-73.
** Kritzman, M. and Y. Li. 2010. “Skulls, Financial Turbulence, and Risk Management.” Financial Analysts Journal, Vol. 66, No. 5: 30-41.
N number of assets
STATE STREET ASSOCIATES
7
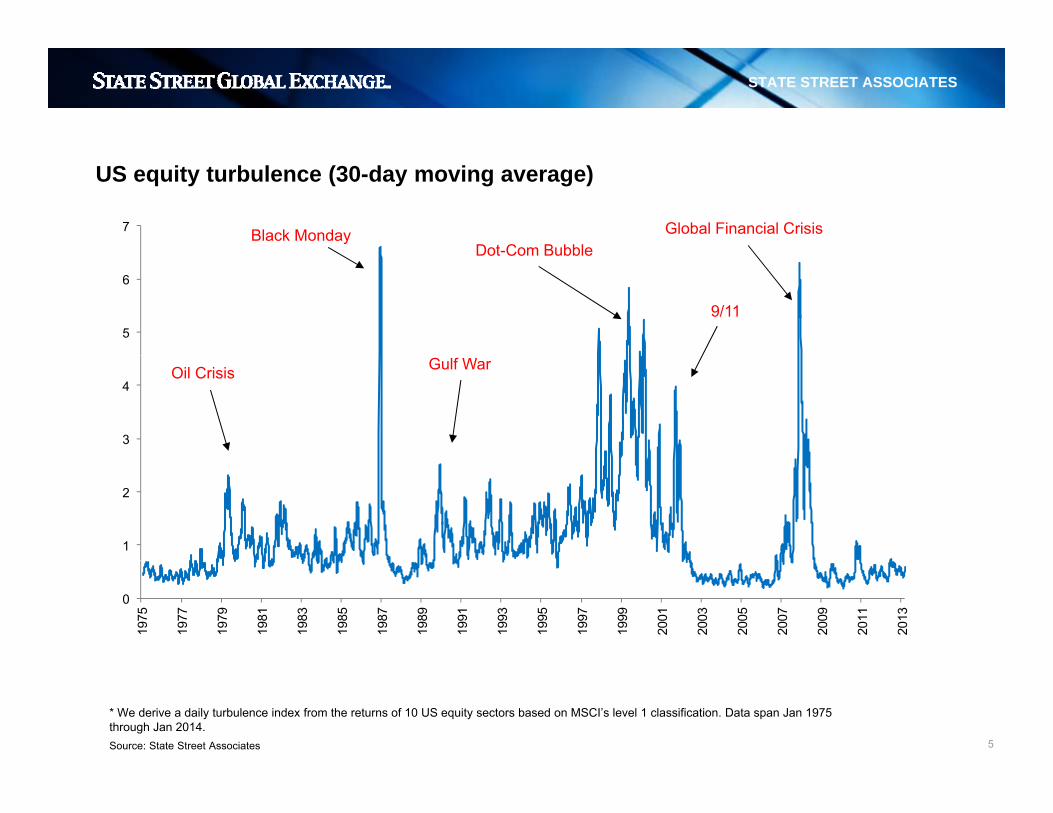
US equity turbulence (30-day moving average)
Global Financial CrisisDot-Com Bubble
Black Monday
5
6
9/11
Dot Com Bubble
3
4Gulf WarOil Crisis
1
2
0
1975
1977
1979
1981
1983
1985
1987
1989
1991
1993
1995
1997
1999
2001
2003
2005
2007
2009
2011
2013
LIMITED ACCESS 5
* We derive a daily turbulence index from the returns of 10 US equity sectors based on MSCI’s level 1 classification. Data span Jan 1975 through Jan 2014. Source: State Street Associates
STATE STREET ASSOCIATES
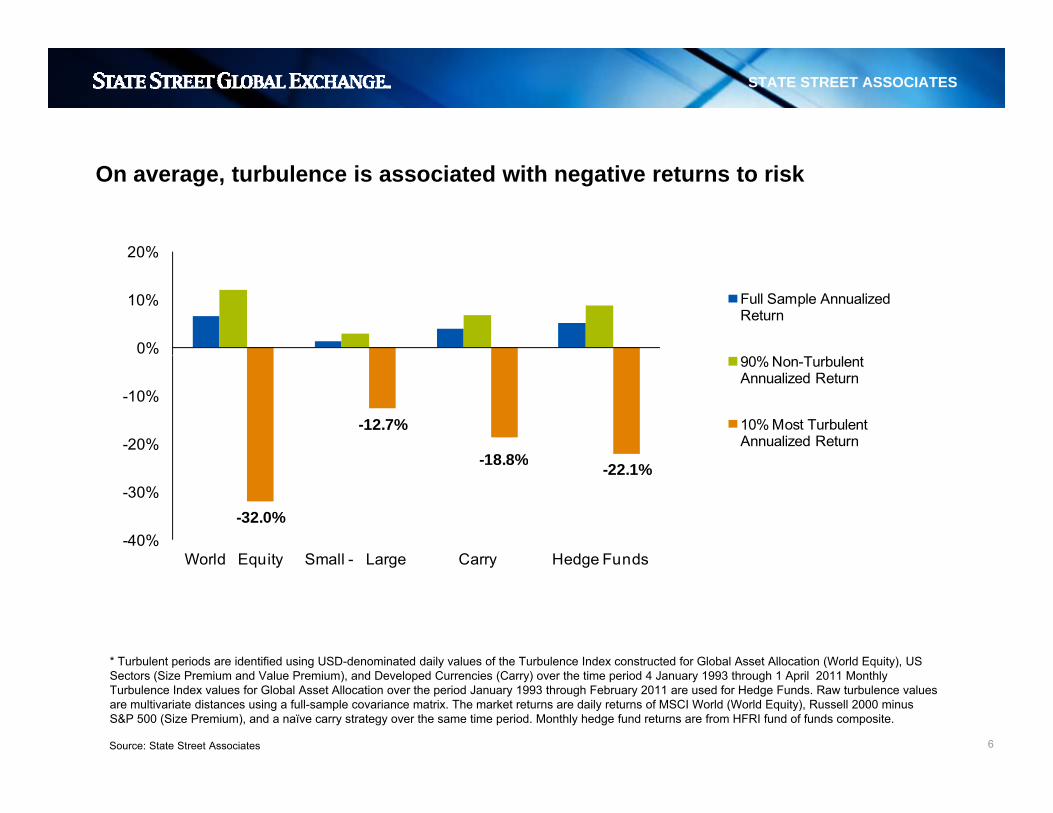
On average, turbulence is associated with negative returns to risk
20%
0%
10%
20%
Full Sample Annualized Return
-12.7%
18 8%-20%
-10%
90% Non-Turbulent Annualized Return
10% Most Turbulent Annualized Return
-32.0%
-18.8% -22.1%
-40%
-30%
World Equity Small - Large Carry Hedge Funds
* Turbulent periods are identified using USD-denominated daily values of the Turbulence Index constructed for Global Asset Allocation (World Equity) US
World Equity Small - Large Carry Hedge Funds
LIMITED ACCESS 6
Turbulent periods are identified using USD denominated daily values of the Turbulence Index constructed for Global Asset Allocation (World Equity), US Sectors (Size Premium and Value Premium), and Developed Currencies (Carry) over the time period 4 January 1993 through 1 April 2011 Monthly Turbulence Index values for Global Asset Allocation over the period January 1993 through February 2011 are used for Hedge Funds. Raw turbulence values are multivariate distances using a full-sample covariance matrix. The market returns are daily returns of MSCI World (World Equity), Russell 2000 minus S&P 500 (Size Premium), and a naïve carry strategy over the same time period. Monthly hedge fund returns are from HFRI fund of funds composite.
Source: State Street Associates
STATE STREET ASSOCIATES
Isolating correlation surprises
LIMITED ACCESS 7
STATE STREET ASSOCIATES
Isolating correlation surprises
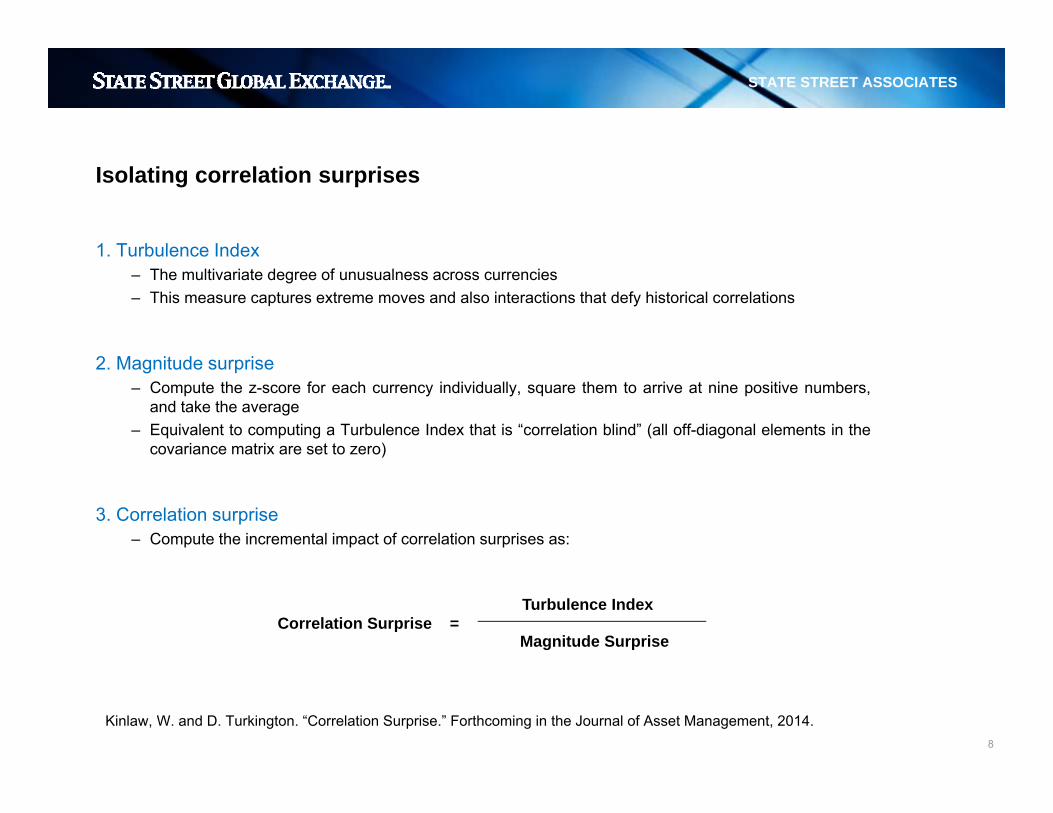
1 Turbulence Index1. Turbulence Index– The multivariate degree of unusualness across currencies– This measure captures extreme moves and also interactions that defy historical correlations
2. Magnitude surprise– Compute the z-score for each currency individually, square them to arrive at nine positive numbers,
and take the average– Equivalent to computing a Turbulence Index that is “correlation blind” (all off-diagonal elements in the
covariance matrix are set to zero)
3. Correlation surprise– Compute the incremental impact of correlation surprises as:
Turbulence Index
Magnitude SurpriseCorrelation Surprise =
LIMITED ACCESS 8
Kinlaw, W. and D. Turkington. “Correlation Surprise.” Forthcoming in the Journal of Asset Management, 2014.
STATE STREET ASSOCIATES
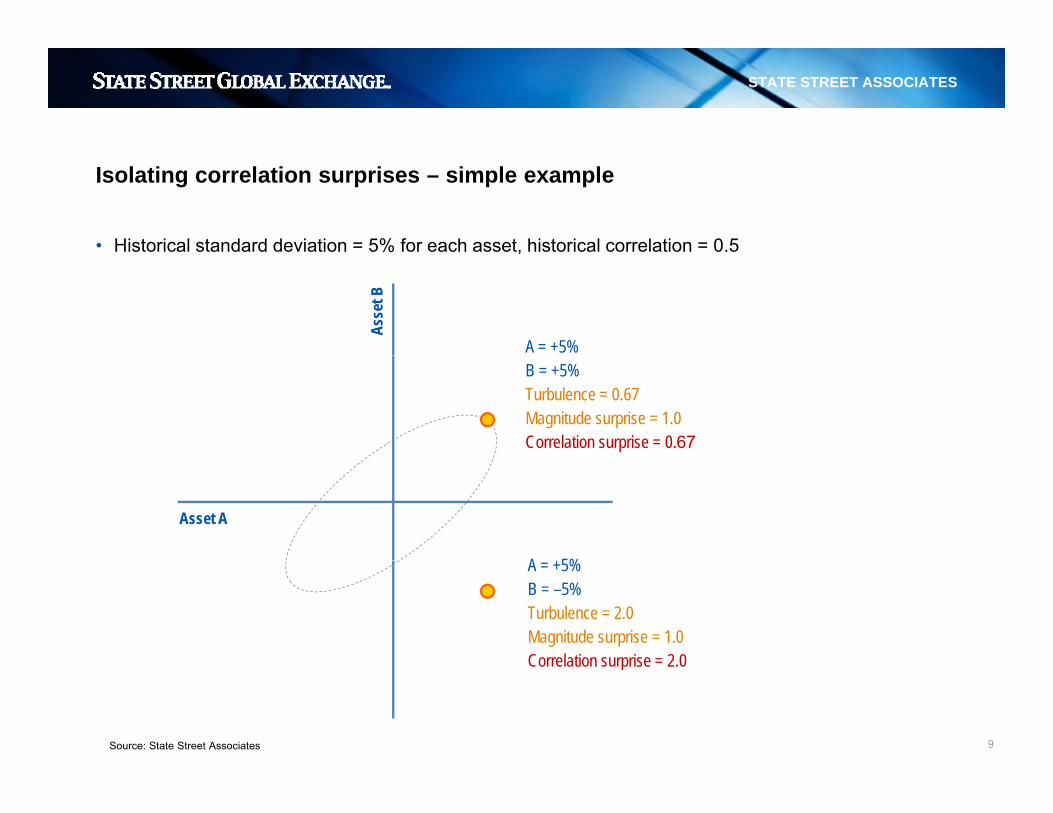
Isolating correlation surprises – simple example
• Historical standard deviation = 5% for each asset, historical correlation = 0.5 ,
A = +5%As
set B
B = +5%Turbulence = 0.67Magnitude surprise = 1.0Correlation surprise = 0.67
A 5%
Asset A
A = +5%B = –5%Turbulence = 2.0Magnitude surprise = 1.0Correlation surprise = 2 0
LIMITED ACCESS 9
Correlation surprise 2.0
Source: State Street Associates
STATE STREET ASSOCIATES
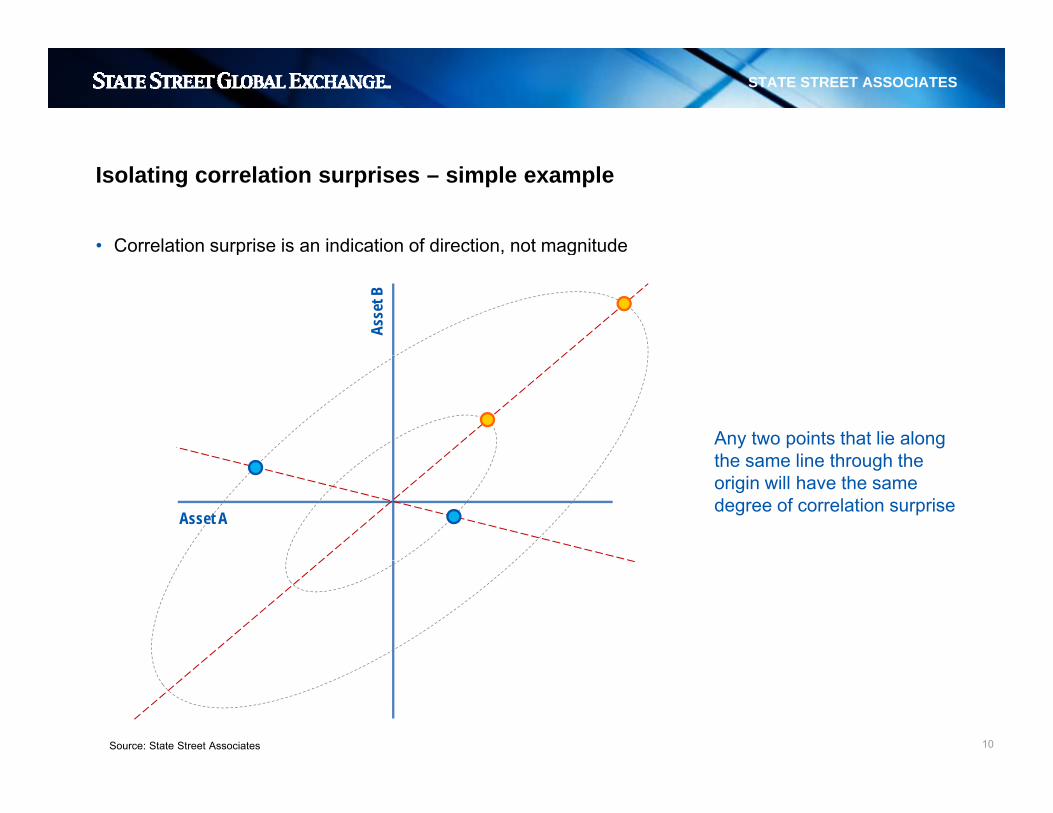
Isolating correlation surprises – simple example
• Correlation surprise is an indication of direction, not magnitudep , g
Asse
t B
Any two points that lie along the same line through thethe same line through the origin will have the same degree of correlation surprise
Asset A
LIMITED ACCESS 10Source: State Street Associates
STATE STREET ASSOCIATES
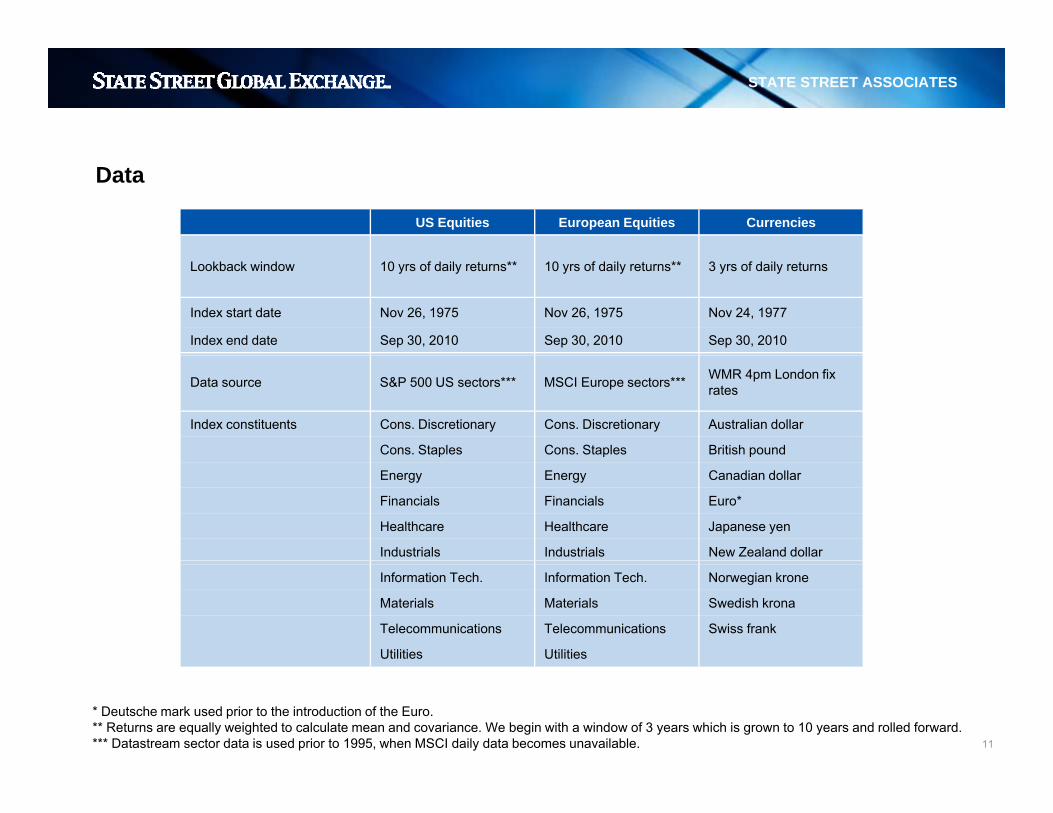
Data
US Equities European Equities Currencies
Lookback window 10 yrs of daily returns** 10 yrs of daily returns** 3 yrs of daily returns
Index start date Nov 26, 1975 Nov 26, 1975 Nov 24, 1977
Index end date Sep 30, 2010 Sep 30, 2010 Sep 30, 2010
Data source S&P 500 US sectors*** MSCI Europe sectors*** WMR 4pm London fix rates
Index constituents Cons. Discretionary Cons. Discretionary Australian dollar
Cons. Staples Cons. Staples British pound
Energy Energy Canadian dollar
Financials Financials Euro*
Healthcare Healthcare Japanese yen
Industrials Industrials New Zealand dollar
Information Tech. Information Tech. Norwegian krone
Materials Materials Swedish krona
Telecommunications Telecommunications Swiss frank
Utilities Utilities
LIMITED ACCESS 11
* Deutsche mark used prior to the introduction of the Euro.** Returns are equally weighted to calculate mean and covariance. We begin with a window of 3 years which is grown to 10 years and rolled forward.*** Datastream sector data is used prior to 1995, when MSCI daily data becomes unavailable.
STATE STREET ASSOCIATES
• On average the most volatile days tend to exhibit less correlation surprise
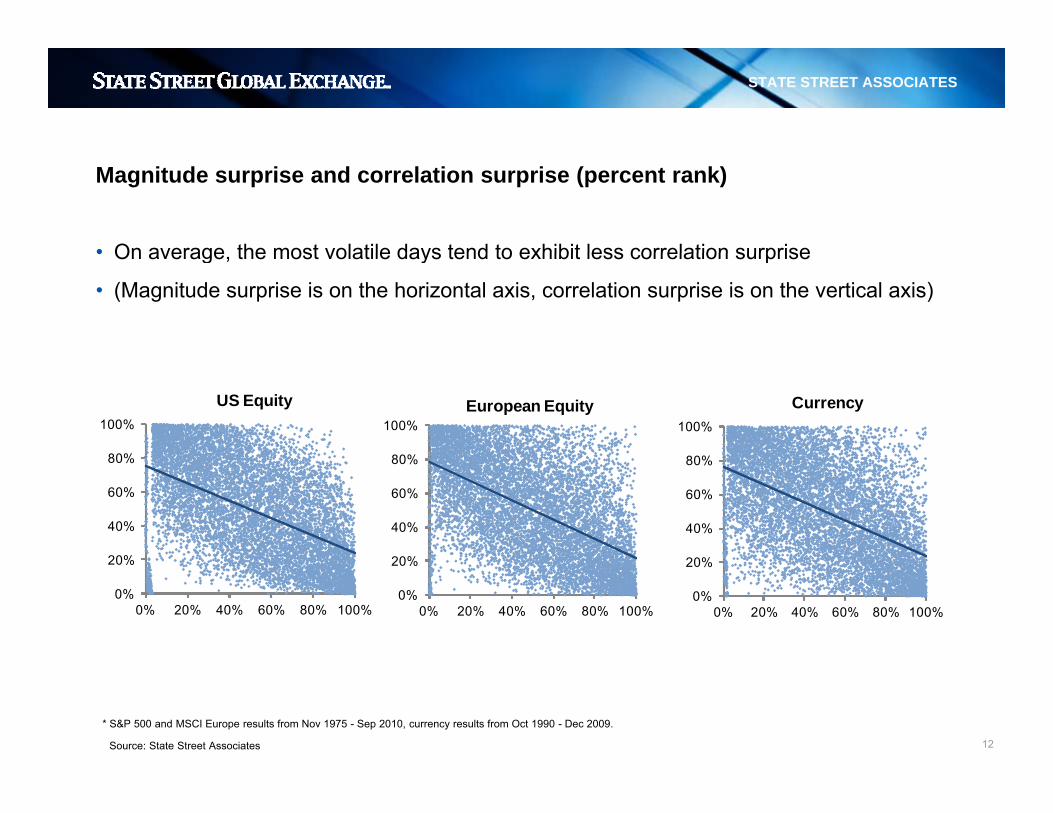
Magnitude surprise and correlation surprise (percent rank)
• On average, the most volatile days tend to exhibit less correlation surprise
• (Magnitude surprise is on the horizontal axis, correlation surprise is on the vertical axis)
80%
100%
US Equity
80%
100%European Equity
80%
100%
Currency
20%
40%
60%
80%
20%
40%
60%
80%
20%
40%
60%
80%
0%
20%
0% 20% 40% 60% 80% 100%0%
20%
0% 20% 40% 60% 80% 100%0%
20%
0% 20% 40% 60% 80% 100%
LIMITED ACCESS 12Source: State Street Associates
* S&P 500 and MSCI Europe results from Nov 1975 - Sep 2010, currency results from Oct 1990 - Dec 2009.
STATE STREET ASSOCIATES
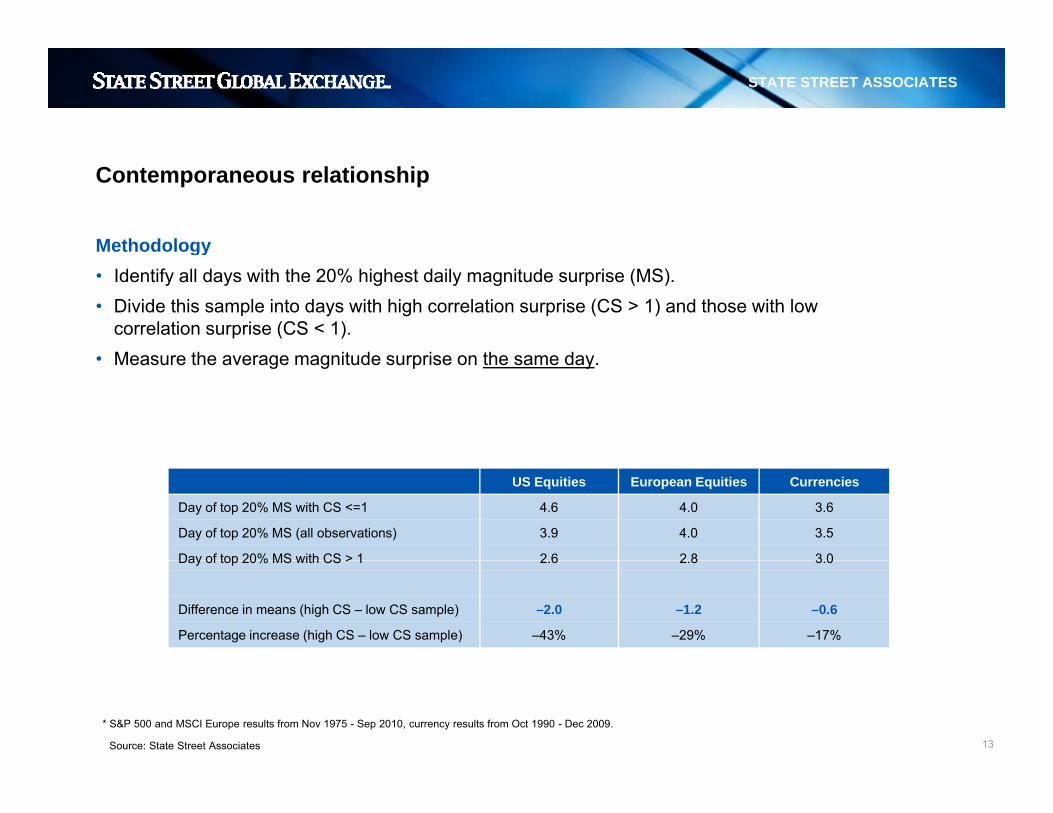
Contemporaneous relationship
Methodologygy• Identify all days with the 20% highest daily magnitude surprise (MS).• Divide this sample into days with high correlation surprise (CS > 1) and those with low
correlation surprise (CS < 1).Measure the average magnitude surprise on the same day• Measure the average magnitude surprise on the same day.
US Equities European Equities Currencies
Day of top 20% MS with CS <=1 4.6 4.0 3.6
Day of top 20% MS (all observations) 3.9 4.0 3.5
Day of top 20% MS with CS > 1 2 6 2 8 3 0Day of top 20% MS with CS > 1 2.6 2.8 3.0
Difference in means (high CS – low CS sample) –2.0 –1.2 –0.6
Percentage increase (high CS – low CS sample) –43% –29% –17%
LIMITED ACCESS 13Source: State Street Associates
* S&P 500 and MSCI Europe results from Nov 1975 - Sep 2010, currency results from Oct 1990 - Dec 2009.
STATE STREET ASSOCIATES
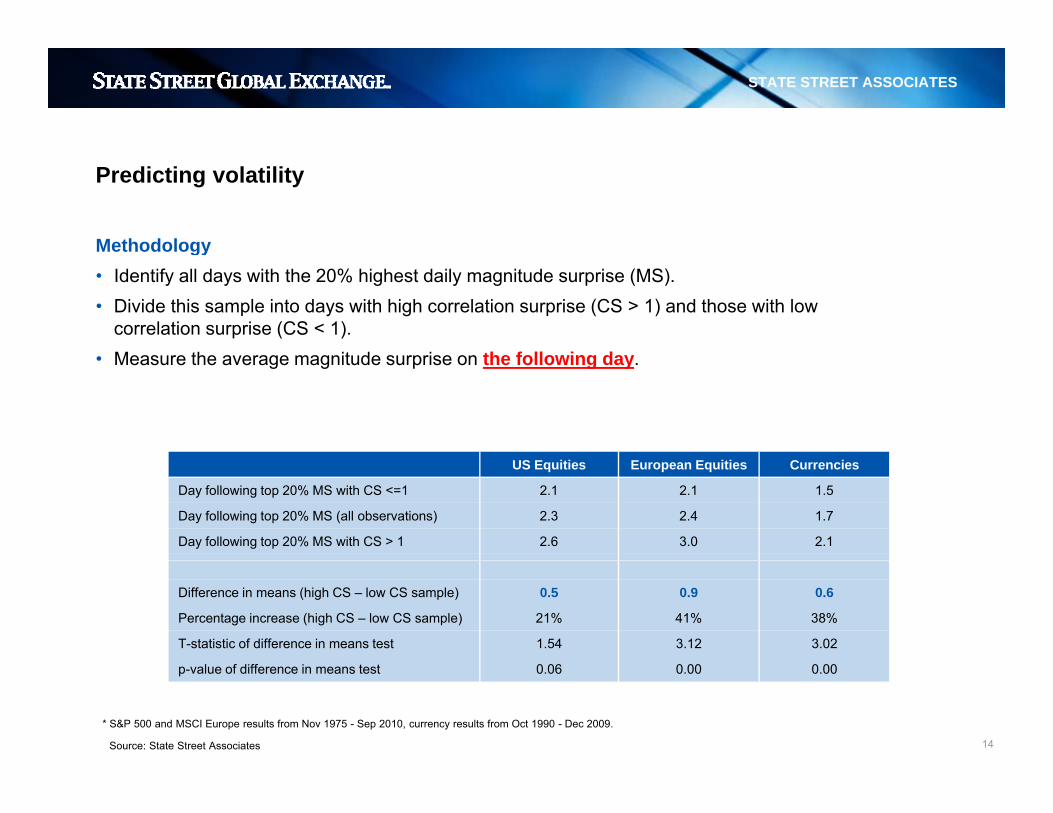
Predicting volatility
Methodologygy• Identify all days with the 20% highest daily magnitude surprise (MS).• Divide this sample into days with high correlation surprise (CS > 1) and those with low
correlation surprise (CS < 1).Measure the average magnitude surprise on the following day• Measure the average magnitude surprise on the following day.
US Equities European Equities Currencies
Day following top 20% MS with CS <=1 2.1 2.1 1.5
Day following top 20% MS (all observations) 2.3 2.4 1.7
Day following top 20% MS with CS > 1 2.6 3.0 2.1
Difference in means (high CS – low CS sample) 0.5 0.9 0.6
Percentage increase (high CS – low CS sample) 21% 41% 38%
T-statistic of difference in means test 1.54 3.12 3.02
LIMITED ACCESS 14
p-value of difference in means test 0.06 0.00 0.00
Source: State Street Associates
* S&P 500 and MSCI Europe results from Nov 1975 - Sep 2010, currency results from Oct 1990 - Dec 2009.
STATE STREET ASSOCIATES
Why might we expect unusual correlations to precede volatility?
• Common strategies break down. Investors who build correlation assumptions into their models –g peither explicitly or through intuition – may underperform when correlations deviate from their historical norms, inducing them to de-risk.
• Shocks propagate. Financial markets are not perfectly efficient and it takes some measure of timeShocks propagate. Financial markets are not perfectly efficient and it takes some measure of time for information to propagate from one segment to another.
• Investors respond to uncertainty. It is also possible that there is a behavioral explanation. Perhaps investors tend to de-risk when markets are “acting weird” and are difficult to understandinvestors tend to de-risk when markets are acting weird and are difficult to understand.
LIMITED ACCESS 15
STATE STREET ASSOCIATES
Investment Applications
US equity, European equity, and currency marketsq y, p q y, y
LIMITED ACCESS 16
STATE STREET ASSOCIATES
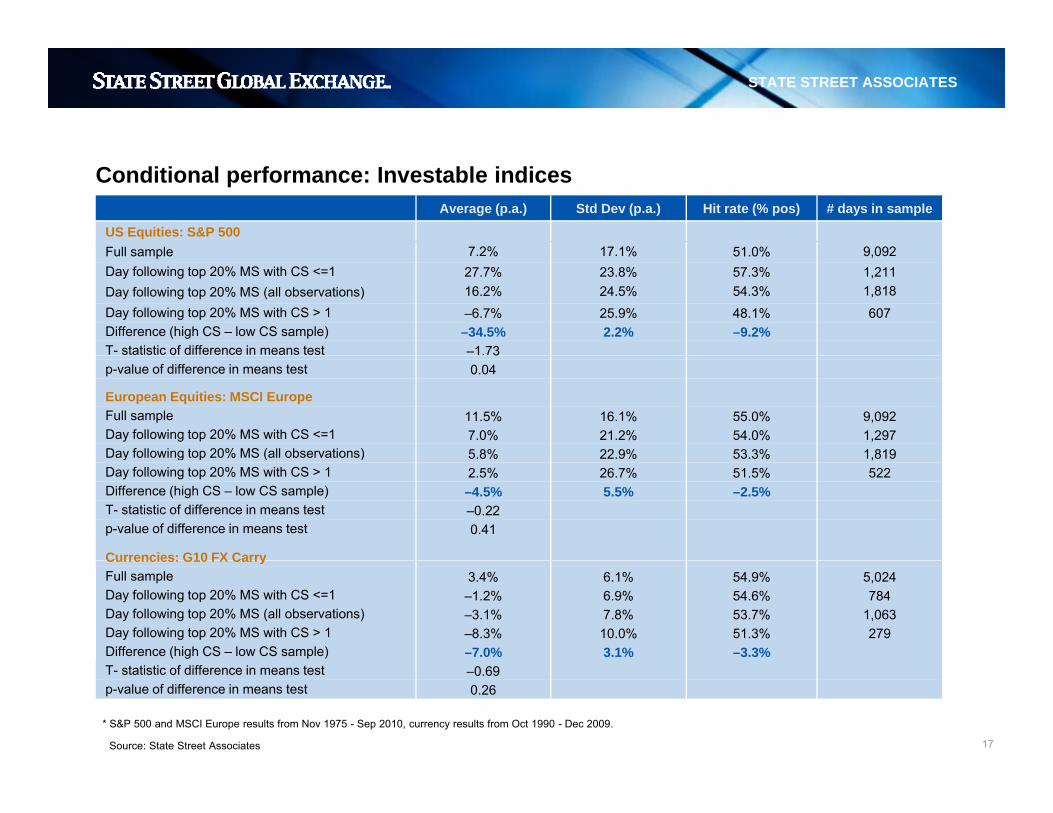
Conditional performance: Investable indicesAverage (p.a.) Std Dev (p.a.) Hit rate (% pos) # days in sample
US Equities: S&P 500Full sample 7 2% 17 1% 51 0% 9 092Full sample 7.2% 17.1% 51.0% 9,092Day following top 20% MS with CS <=1 27.7% 23.8% 57.3% 1,211Day following top 20% MS (all observations) 16.2% 24.5% 54.3% 1,818Day following top 20% MS with CS > 1 –6.7% 25.9% 48.1% 607Difference (high CS – low CS sample) –34.5% 2.2% –9.2%T- statistic of difference in means test –1.733p-value of difference in means test 0.04
European Equities: MSCI EuropeFull sample 11.5% 16.1% 55.0% 9,092Day following top 20% MS with CS <=1 7.0% 21.2% 54.0% 1,297Day following top 20% MS (all observations) 5.8% 22.9% 53.3% 1,819y g p % ( ) 5.8% 22.9% 53.3% 1,819Day following top 20% MS with CS > 1 2.5% 26.7% 51.5% 522Difference (high CS – low CS sample) –4.5% 5.5% –2.5%T- statistic of difference in means test –0.22p-value of difference in means test 0.41
Currencies: G10 FX CarryCurrencies: G10 FX CarryFull sample 3.4% 6.1% 54.9% 5,024Day following top 20% MS with CS <=1 –1.2% 6.9% 54.6% 784Day following top 20% MS (all observations) –3.1% 7.8% 53.7% 1,063Day following top 20% MS with CS > 1 –8.3% 10.0% 51.3% 279Difference (high CS – low CS sample) –7.0% 3.1% –3.3%
LIMITED ACCESS 17
T- statistic of difference in means test –0.69p-value of difference in means test 0.26
* S&P 500 and MSCI Europe results from Nov 1975 - Sep 2010, currency results from Oct 1990 - Dec 2009.
Source: State Street Associates
STATE STREET ASSOCIATES
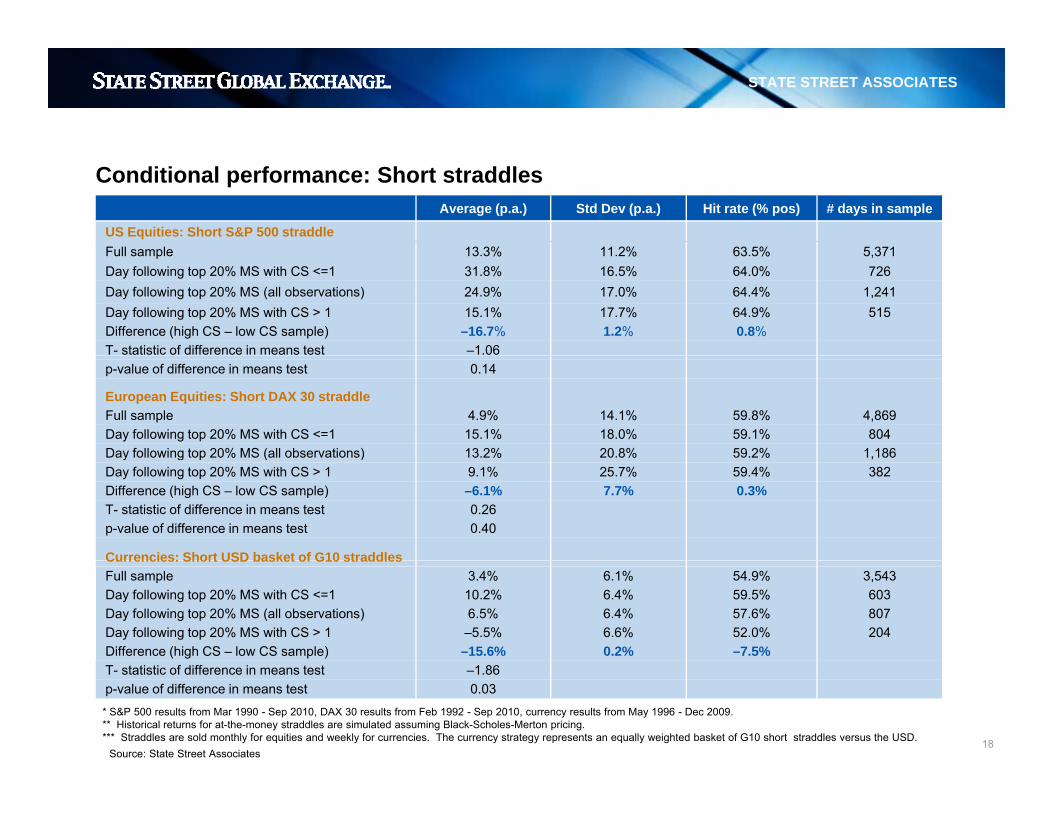
Conditional performance: Short straddlesAverage (p.a.) Std Dev (p.a.) Hit rate (% pos) # days in sample
US Equities: Short S&P 500 straddleFull sample 13 3% 11 2% 63 5% 5 371Full sample 13.3% 11.2% 63.5% 5,371Day following top 20% MS with CS <=1 31.8% 16.5% 64.0% 726Day following top 20% MS (all observations) 24.9% 17.0% 64.4% 1,241Day following top 20% MS with CS > 1 15.1% 17.7% 64.9% 515Difference (high CS – low CS sample) –16.7% 1.2% 0.8%T- statistic of difference in means test –1.06p-value of difference in means test 0.14
European Equities: Short DAX 30 straddleFull sample 4.9% 14.1% 59.8% 4,869Day following top 20% MS with CS <=1 15.1% 18.0% 59.1% 804Day following top 20% MS (all observations) 13.2% 20.8% 59.2% 1,186y g p ( ) ,Day following top 20% MS with CS > 1 9.1% 25.7% 59.4% 382Difference (high CS – low CS sample) –6.1% 7.7% 0.3%T- statistic of difference in means test 0.26p-value of difference in means test 0.40
Currencies: Short USD basket of G10 straddlesCurrencies: Short USD basket of G10 straddlesFull sample 3.4% 6.1% 54.9% 3,543Day following top 20% MS with CS <=1 10.2% 6.4% 59.5% 603Day following top 20% MS (all observations) 6.5% 6.4% 57.6% 807Day following top 20% MS with CS > 1 –5.5% 6.6% 52.0% 204Difference (high CS – low CS sample) –15.6% 0.2% –7.5%
LIMITED ACCESS 18
T- statistic of difference in means test –1.86p-value of difference in means test 0.03
* S&P 500 results from Mar 1990 - Sep 2010, DAX 30 results from Feb 1992 - Sep 2010, currency results from May 1996 - Dec 2009.** Historical returns for at-the-money straddles are simulated assuming Black-Scholes-Merton pricing.*** Straddles are sold monthly for equities and weekly for currencies. The currency strategy represents an equally weighted basket of G10 short straddles versus the USD.
Source: State Street Associates
STATE STREET ASSOCIATES
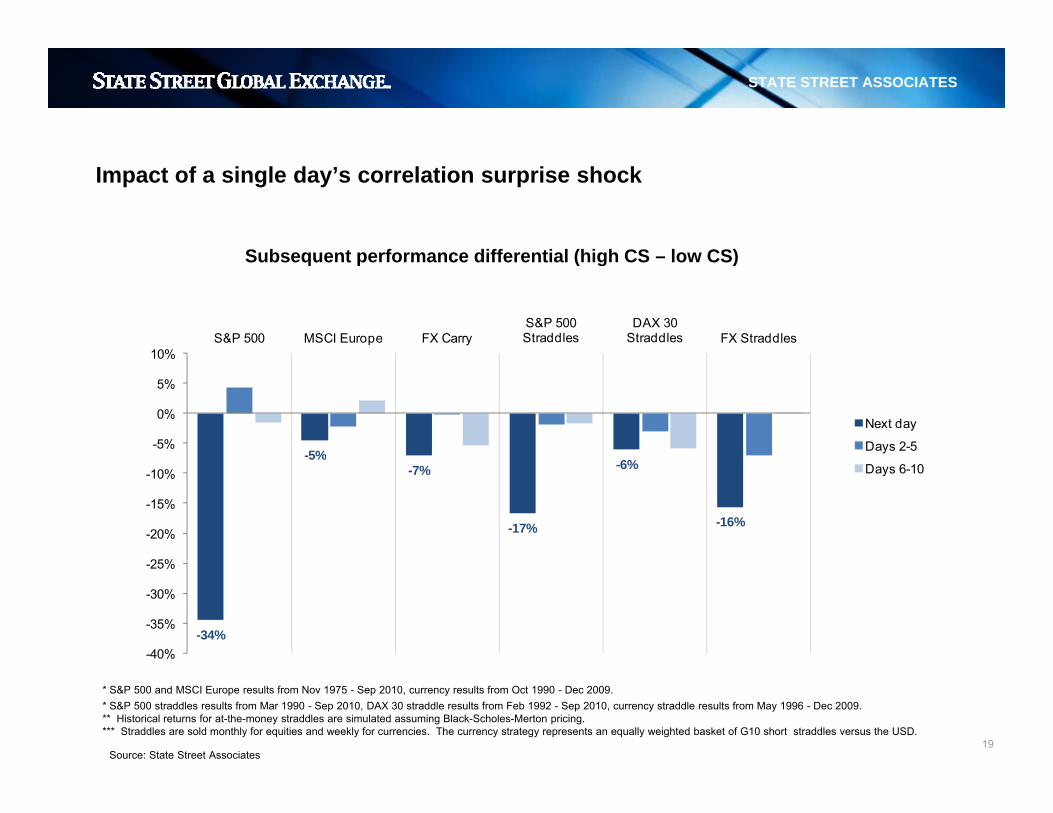
Impact of a single day’s correlation surprise shock
Subsequent performance differential (high CS low CS)Subsequent performance differential (high CS – low CS)
10%S&P 500 MSCI Europe FX Carry
S&P 500 Straddles
DAX 30 Straddles FX Straddles
-5%-5%
0%
5%
10%
Next day
Days 2-55%-7%
-17%
-6%
-16%
25%
-20%
-15%
-10% Days 6-10
-34%-40%
-35%
-30%
-25%
LIMITED ACCESS 19Source: State Street Associates
* S&P 500 and MSCI Europe results from Nov 1975 - Sep 2010, currency results from Oct 1990 - Dec 2009.* S&P 500 straddles results from Mar 1990 - Sep 2010, DAX 30 straddle results from Feb 1992 - Sep 2010, currency straddle results from May 1996 - Dec 2009.** Historical returns for at-the-money straddles are simulated assuming Black-Scholes-Merton pricing.*** Straddles are sold monthly for equities and weekly for currencies. The currency strategy represents an equally weighted basket of G10 short straddles versus the USD.
STATE STREET ASSOCIATES
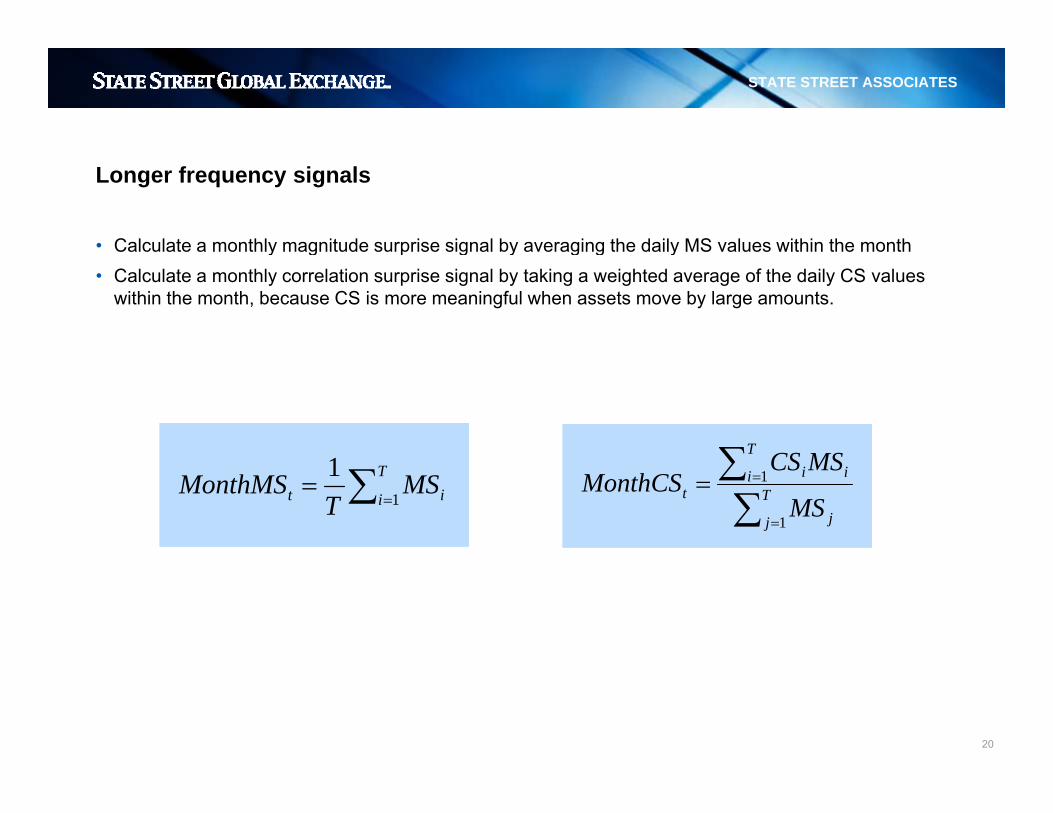
• Calculate a monthly magnitude surprise signal by averaging the daily MS values within the month
Longer frequency signals
y g p g y g g y• Calculate a monthly correlation surprise signal by taking a weighted average of the daily CS values
within the month, because CS is more meaningful when assets move by large amounts.
1 ∑T MSCS∑=
=T
i it MST
MonthMS1
1
∑∑
=
== T
j j
i iit
MS
MSCSMonthCS
1
1
LIMITED ACCESS 20
STATE STREET ASSOCIATES
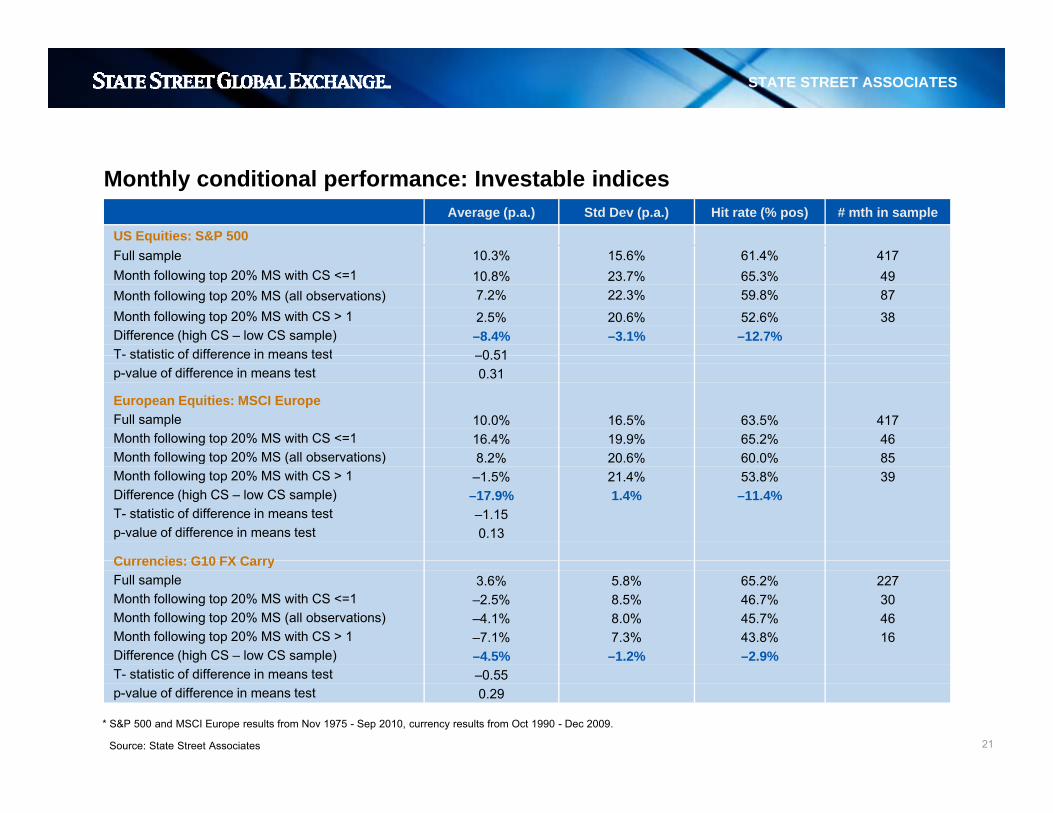
Monthly conditional performance: Investable indicesAverage (p.a.) Std Dev (p.a.) Hit rate (% pos) # mth in sample
US Equities: S&P 500F ll l 10 3% 15 6% 61 4% 417Full sample 10.3% 15.6% 61.4% 417Month following top 20% MS with CS <=1 10.8% 23.7% 65.3% 49Month following top 20% MS (all observations) 7.2% 22.3% 59.8% 87Month following top 20% MS with CS > 1 2.5% 20.6% 52.6% 38Difference (high CS – low CS sample) –8.4% –3.1% –12.7%T- statistic of difference in means test 0 51T- statistic of difference in means test –0.51p-value of difference in means test 0.31
European Equities: MSCI EuropeFull sample 10.0% 16.5% 63.5% 417Month following top 20% MS with CS <=1 16.4% 19.9% 65.2% 46Month following top 20% MS (all observations) 8 2% 20 6% 60 0% 85Month following top 20% MS (all observations) 8.2% 20.6% 60.0% 85Month following top 20% MS with CS > 1 –1.5% 21.4% 53.8% 39Difference (high CS – low CS sample) –17.9% 1.4% –11.4%T- statistic of difference in means test –1.15p-value of difference in means test 0.13
Currencies: G10 FX CarryCurrencies: G10 FX CarryFull sample 3.6% 5.8% 65.2% 227Month following top 20% MS with CS <=1 –2.5% 8.5% 46.7% 30Month following top 20% MS (all observations) –4.1% 8.0% 45.7% 46Month following top 20% MS with CS > 1 –7.1% 7.3% 43.8% 16Difference (high CS – low CS sample) –4.5% –1.2% –2.9%
LIMITED ACCESS 21
T- statistic of difference in means test –0.55p-value of difference in means test 0.29
Source: State Street Associates
* S&P 500 and MSCI Europe results from Nov 1975 - Sep 2010, currency results from Oct 1990 - Dec 2009.
STATE STREET ASSOCIATES
Monthly conditional performance: Short straddlesAverage (p.a.) Std Dev (p.a.) Hit rate (% pos) # mth in sample
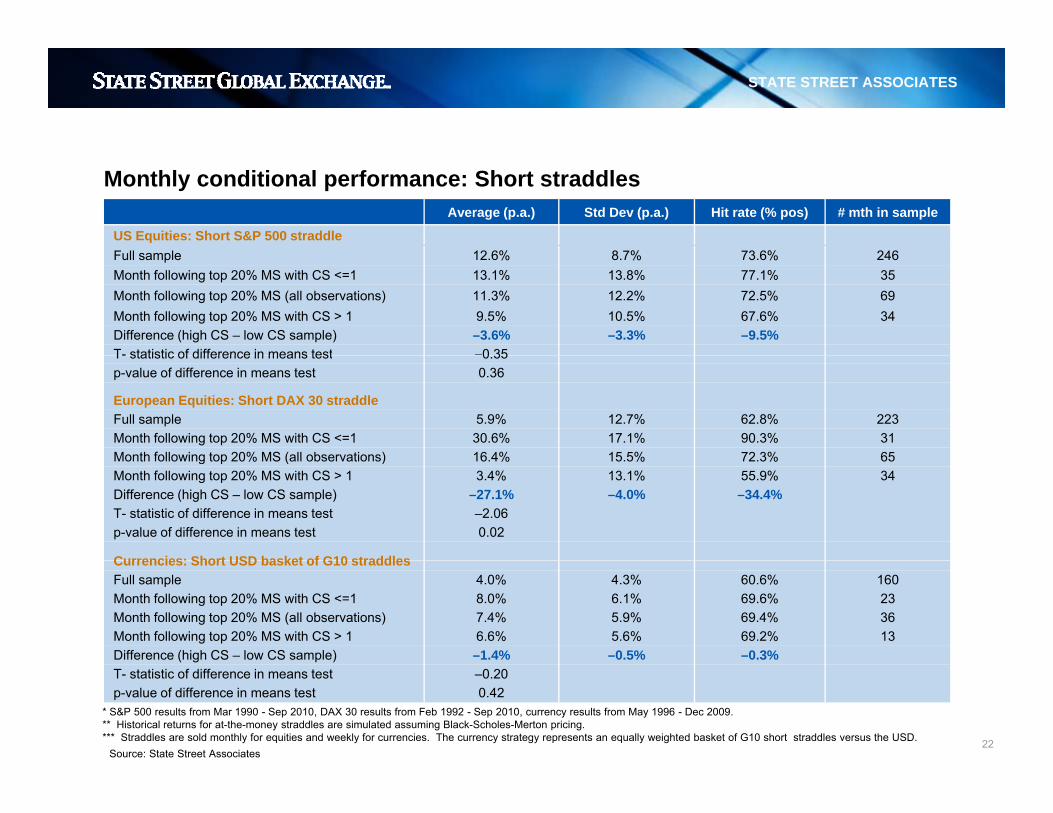
US Equities: Short S&P 500 straddleF ll sample 12 6% 8 7% 73 6% 246Full sample 12.6% 8.7% 73.6% 246Month following top 20% MS with CS <=1 13.1% 13.8% 77.1% 35Month following top 20% MS (all observations) 11.3% 12.2% 72.5% 69Month following top 20% MS with CS > 1 9.5% 10.5% 67.6% 34Difference (high CS – low CS sample) –3.6% –3.3% –9.5%T- statistic of difference in means test –0 35T- statistic of difference in means test 0.35p-value of difference in means test 0.36
European Equities: Short DAX 30 straddleFull sample 5.9% 12.7% 62.8% 223Month following top 20% MS with CS <=1 30.6% 17.1% 90.3% 31Month following top 20% MS (all observations) 16 4% 15 5% 72 3% 65Month following top 20% MS (all observations) 16.4% 15.5% 72.3% 65Month following top 20% MS with CS > 1 3.4% 13.1% 55.9% 34Difference (high CS – low CS sample) –27.1% –4.0% –34.4%T- statistic of difference in means test –2.06p-value of difference in means test 0.02
Currencies: Short USD basket of G10 straddlesCurrencies: Short USD basket of G10 straddlesFull sample 4.0% 4.3% 60.6% 160Month following top 20% MS with CS <=1 8.0% 6.1% 69.6% 23Month following top 20% MS (all observations) 7.4% 5.9% 69.4% 36Month following top 20% MS with CS > 1 6.6% 5.6% 69.2% 13Difference (high CS – low CS sample) –1.4% –0.5% –0.3%
LIMITED ACCESS 22
T- statistic of difference in means test –0.20p-value of difference in means test 0.42
Source: State Street Associates
* S&P 500 results from Mar 1990 - Sep 2010, DAX 30 results from Feb 1992 - Sep 2010, currency results from May 1996 - Dec 2009.** Historical returns for at-the-money straddles are simulated assuming Black-Scholes-Merton pricing.*** Straddles are sold monthly for equities and weekly for currencies. The currency strategy represents an equally weighted basket of G10 short straddles versus the USD.
STATE STREET ASSOCIATES
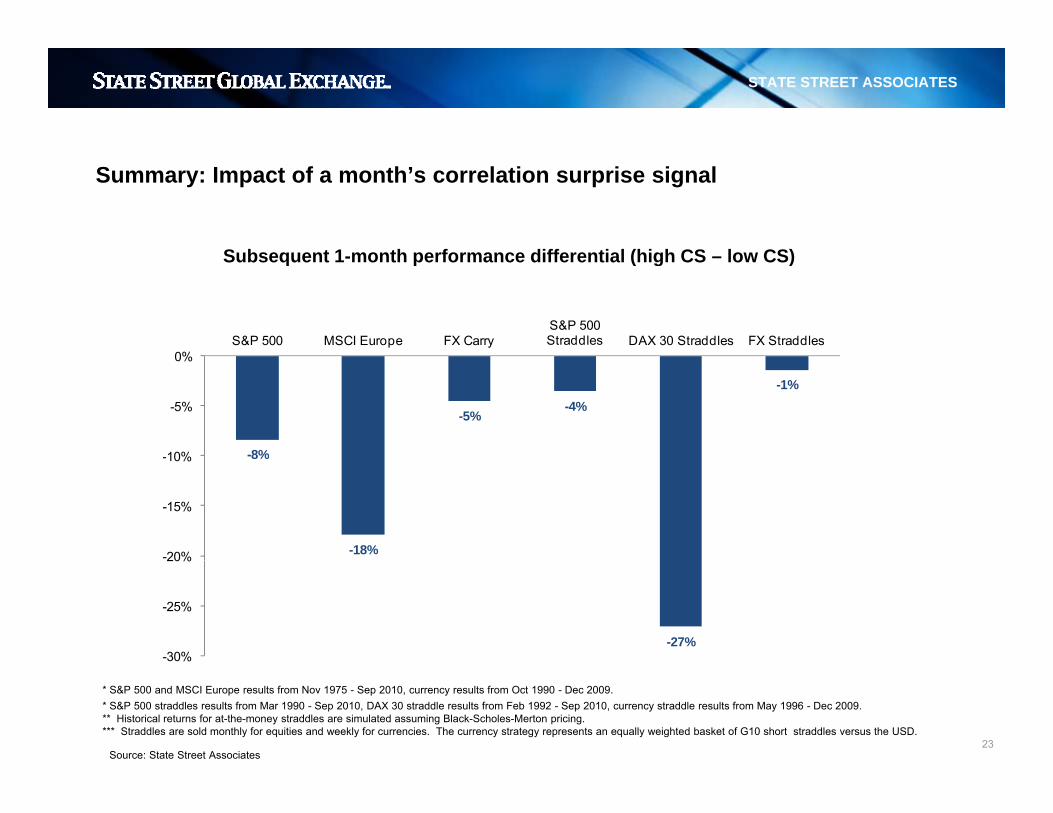
Summary: Impact of a month’s correlation surprise signal
Subsequent 1 month performance differential (high CS low CS)Subsequent 1-month performance differential (high CS – low CS)
0%S&P 500 MSCI Europe FX Carry
S&P 500 Straddles DAX 30 Straddles FX Straddles
-8%
-5%-4%
-1%
-10%
-5%
0%
8%
-18%-20%
-15%
-10%
-27%-30%
-25%
20%
LIMITED ACCESS 23Source: State Street Associates
* S&P 500 and MSCI Europe results from Nov 1975 - Sep 2010, currency results from Oct 1990 - Dec 2009.* S&P 500 straddles results from Mar 1990 - Sep 2010, DAX 30 straddle results from Feb 1992 - Sep 2010, currency straddle results from May 1996 - Dec 2009.** Historical returns for at-the-money straddles are simulated assuming Black-Scholes-Merton pricing.*** Straddles are sold monthly for equities and weekly for currencies. The currency strategy represents an equally weighted basket of G10 short straddles versus the USD.
STATE STREET ASSOCIATES
Summary
• Financial turbulence, as measured by the Mahalanobis distance, can be decomposed to measure , y , pcorrelation surprise across a set of assets.
• Both conceptually and empirically, correlation surprise is distinct from and incremental to magnitude surprise.surprise.
• We find evidence across three different asset classes that the joint occurrence of high magnitude surprise and high correlation surprise foretells higher volatility and lower return than high magnitude surprise in isolationsurprise in isolation.
• Correlation surprise can provide forward-looking information at both the daily and monthly frequency.
LIMITED ACCESS 24

STATE STREET ASSOCIATES
Disclaimers and important risk information
The information provided herein is not intended to suggest or recommend any investment or investment strategy, does not constitute investment advice, does not constitute investment research and is not a solicitation to buy or sell securities. It does not take into account any investor's particular investment objectives, strategies or tax status. Clients should be aware of the risks trading foreign exchange, equities, fixed income or derivative instruments or in investments in non-liquid or emerging markets. Derivatives generally involve leverage and are therefore more volatile than their underlying cash investments. Past performance is no guarantee of future results. This communication is not intended for and must not be provided to retail investors. The products and services described in this communication may not be available in all jurisdictions.The products and services outlined in this document are generally offered in Europe through either State Street Global Markets International Limited, State Street Bank Europe Limited, State Street Bank and Trust Company, London Branch all of which are authorised and regulated by the Financial Services Authority and/or State Street Bank GmbH London branch which is authorised and regulated by the Deutsche Bundesbank and the GermanLondon Branch, all of which are authorised and regulated by the Financial Services Authority and/or State Street Bank GmbH, London branch, which is authorised and regulated by the Deutsche Bundesbank and the German Financial Supervisory Authority (BaFin) and subject to limited regulation by the Financial Services Authority, details of which are available from us on request. Please note that certain foreign exchange business (spot and certain forward transactions) are not regulated by the Financial Services Authority. The products and services outlined in this document are generally offered in the United States and in Latin America by State Street Bank and Trust Company and/or by State Street Global Markets, LLC. The products and services outlined in this document are generally offered in Canada by State Street Bank and Trust Company and/or by State Street Global Markets Canada Inc. This communication is made available in Japan by State Street Global Markets Japan Limited which is regulated by the Financial Services Agency of Japan as a financial instruments firm. This communication is made available in Hong Kong by State Street Bank and Trust Company, which accepts responsibility for its contents, and is intended for distribution to professional investors only (as defined in the Securities and Futures Ordinance). This communication is made available in Australia by State Street Bank and Trust Company ABN 70 062 819 630, AFSL 239679 and is intended only for wholesale clients, as defined in the Corporations Act 2001. This communication is made available in Singapore by State Street Bank and Trust Company, Singapore Branch (“SSBTS”), which holds a wholesale bank license by the Monetary Authority of Singapore. In Singapore, this communication is only distributed to accredited, institutional investors as defined in the Singapore Financial Advisers Act (“FAA”). Note that SSBTS is exempt from Sections 27 and 36 of the FAA. When this communication is distributed to overseas investors as defined in the FAA, note that SSBTS is exempt from Sections 26, 27, 29 and 36 of the FAA. The products and services outlined in this document are
d il bl i S th Af i th h ith St t St t Gl b l M k t I t ti l Li it d St t St t B k E Li it d St t St t B k d T t C ll f hi h th i d i S th Af i dmade available in South Africa through either State Street Global Markets International Limited, State Street Bank Europe Limited or State Street Bank and Trust Company, all of which are authorized in South Africa under the Financial Advisory and Intermediary Services Act, 2002 as a Category I Financial Services Provider; FSP No. 42823, 42838 and 42671 respectively. This communication is made available in Israel by State Street Global Markets International Limited, which is not licensed under Israel’s Regulation of Investment Advice, Investment Marketing and Portfolio Management Law, 1995. This communication may only be distributed to or used by investors in Israel which are “eligible clients” as listed in the First Schedule to Israel’s Regulation of Investment Advice, Investment Marketing and Portfolio Management Law 1995. This communication is made available in Qatar by State Street Bank and Trust Company and its affiliates. The information in this communication has not been reviewed or approved by the Qatar Central Bank, the Qatar Financial Markets Authority or the Qatar Financial Centre Regulatory Authority, or any other relevant Qatari regulatory body. This communication is made available in Malaysia by State Street Global Markets International Limited (“SSGMIL”) which is authorised and regulated by the United Kingdom’s Financial Services Authority. SSGMIL is not licensed within or doing business within Malaysia and the activities that are being discussed are carried out off-shore. The written materials do not constitute, and should not be construed as constituting: 1) an offer or invitation to subscribe for or purchase securities or futures in Malaysia or the making available of securities or futures for purchase or subscription in Malaysia; 2) the provision of investment advice concerning securities or futures; or 3) an undertaking by SSGMIL to manage the portfolio of securities or futures contracts on behalf of other persons. This communication is made available in Turkey by State Street Bank and Trust Company and its affiliates. The information included herein is not investment advice. Investment advisory services are provided by portfolio management companies, brokers and banks without deposit collection licenses within the scope of the investment advisory agreements to be executed with clients. Any opinions and statements included herein are based on the personal opinions of the commentators and authors. These opinions may not be suitable to your financial status and your risk and return preferences. Therefore, an investment decision based solely on the information herein may not be appropriate to your expectations. This communication is made available in United Arab Emirates by State Street Bank and Trust Company and its affiliates. This communication does not, and is not intended to, constitute an offer of securities anywhere in the United Arab Emirates and accordingly should not be construed as such. Nor does the addressing of this research publication to you constitute, or is intended to constitute, the carrying on or engagement in banking, financial and/or investment consultation business in the United Arab Emirates under the rules and regulations made by the Central Bank of the United Arab Emirates, the Emirates Securities and Commodities Authority or the United Arab Emirates Ministry of Economy. Any public offer of securities in the United Arab Emirates, if made, will be made pursuant to one or more separate documents and only in accordance with the applicable laws and regulations. Nothing contained in this communication is intended to endorse or recommend a particular course of action or to constitute investment, legal, tax, accounting or other professional advice. Prospective investors should consult with an appropriate professional for specific advice rendered on the basis of their situation. Further, the information contained within this communication is not intended to lead to the conclusion of any contract of whatsoever nature within the territory of the United Arab Emirates. This communication has been forwarded to you solely for your information, and may not be reproduced or passed on, directly or indirectly, to any other person or published, in whole or in part, for any purpose. This communication is addressed only to persons who are professional, institutional or otherwise sophisticated investors. This communication is made available in South Korea by State Street Bank and Trust Company and its affiliates, which accept responsibility for its contents, and is intended for distribution to professional investors only. State Street Bank and Trust Company is not licensed to undertake securities business within South Korea, and any activities related to the content hereof will be carried out off-shore and only in relation to off-shore non-South Korea securities. This communication is made available in Indonesia by State Street Bank and Trust Company and its affiliates. Neither this communication nor any copy hereof may be distributed in Indonesia or to any Indonesian citizens wherever they are domiciled or to Indonesian residents except in compliance with applicable Indonesian capital market laws and regulations. This communication is not an offer of securities in Indonesia. Any securities referred to in this communication have not been registered with the Capital Market and Financial Institutions Supervisory Agency (BAPEPAM-LK) pursuant to relevant capital market laws and regulations, and may not be offered or sold within the territory of the Republic of Indonesia or to Indonesian citizens through a public offering or in circumstances which constitute an offer within the meaning of the Indonesian capital market law and regulations. This communication is made available in Oman by State Street Bank and Trust Company and its affiliates. The information contained in this communication is for information purposes and does not constitute an offer for the sale of foreign securities in Oman or an invitation to an offer for the sale of foreign securities. State Street is neither a bank or financial services provider registered to undertake business in Oman and is neither regulated by the Central Bank of Oman nor the Capital Market Authority. This document is confidential and is intended solely for the information of the person to whom it has been delivered. No representation or warranty is given as to the achievement or reasonableness of any research material contained in this communication. Nothing contained in this
LIMITED ACCESS 25
p p y g y gcommunication report is intended to constitute Omani investment, legal, tax, accounting, investment or other professional advice. This communication is made available in Taiwan by State Street Bank and Trust Company and its affiliates, which accept responsibility for its contents, and is intended for distribution to professional investors only. State Street Bank and Trust Company is not licensed to undertake securities business within Taiwan, and any activities related to the content hereof will be carried out off-shore and only in relation to off-shore non-Taiwan securities. State Street Global Markets is a registered trademark of State Street Corporation used for its financial markets businesses. Please contact your sales representative for further information.