Embed Size (px)
Citation preview

NOTE TO USERS
This reproduction is the best copy available.
®
UMI

The Origin of the "BlockEffect" which Blurs Images in Positron Emission Tomography
Nada Tomic
Medical Physics Unit McGill University, Montreal
September 2003
A thesis submitted ta the Faculty of Graduate studies and Research in partial fulfillment of the requirements of the degree of Mas ter of Science

1+1 Library and Archives Canada
Bibliothèque et Archives Canada
Published Heritage Branch
Direction du Patrimoine de l'édition
395 Wellington Street Ottawa ON K1A ON4 Canada
395, rue Wellington Ottawa ON K1A ON4 Canada
NOTICE: The author has granted a nonexclusive license allowing Library and Archives Canada to reproduce, publish, archive, preserve, conserve, communicate to the public by telecommunication or on the Internet, loan, distribute and sell th es es worldwide, for commercial or noncommercial purposes, in microform, paper, electronic and/or any other formats.
The author retains copyright ownership and moral rights in this thesis. Neither the thesis nor substantial extracts from it may be printed or otherwise reproduced without the author's permission.
ln compliance with the Canadian Privacy Act some supporting forms may have been removed from this thesis.
While these forms may be included in the document page count, their removal does not represent any loss of content from the thesis.
• •• Canada
AVIS:
Your file Votre référence ISBN: 0-612-98752-3 Our file Notre référence ISBN: 0-612-98752-3
L'auteur a accordé une licence non exclusive permettant à la Bibliothèque et Archives Canada de reproduire, publier, archiver, sauvegarder, conserver, transmettre au public par télécommunication ou par l'Internet, prêter, distribuer et vendre des thèses partout dans le monde, à des fins commerciales ou autres, sur support microforme, papier, électronique et/ou autres formats.
L'auteur conserve la propriété du droit d'auteur et des droits moraux qui protège cette thèse. Ni la thèse ni des extraits substantiels de celle-ci ne doivent être imprimés ou autrement reproduits sans son autorisation.
Conformément à la loi canadienne sur la protection de la vie privée, quelques formulaires secondaires ont été enlevés de cette thèse.
Bien que ces formulaires aient inclus dans la pagination, il n'y aura aucun contenu manquant.

Abstract
Commercial positron emission tomography scanners that use block detectors have
additional blurring on spatial resolution, referred to as block effect. We studied the
origin of the block effect, using experiments in which all other blurring effects were
minimized and precisely determined. Bismuth germanate crystals (1 mm width) and a
small (1 mm) 68Ge source were used to probe the spatial resolution of a CTI HR+ block
detector and two precise translation stages to move detectors. Coincidence aperture
functions for crystals in the block and for single crystals were compared. The central
crystals in the block showed an additional blurring of 0.8 mm whereas the edge ones
showed no additional blurring. The apparent centroids of the crystals in the block are not
located at the geometric centers, which gives errors in the reconstruction algorithm
assumed uniform sampling. Our results suggest that the additional blurring in scanners
with block detectors is not only due to the use of block detectors.

Résumé
Les tomographes par émission de positons commerciales utilisant des détecteurs
bloc multi-cristaux dégradent la résolution spatiale. Cet effet est appelé l'effet bloc.
Nous avons fait une série d'expérimentations pour lesquels chacun des effets affectant la
résolution spatiale, autre que l'effet bloc, ont été précisément déterminés à l'avance. La
résolution spatiale d'un détecteur bloc multi-cristaux commerciale (CTI HR+) fut
mesurée à l'aide de panneaux de translations servant à bouger les détecteurs, de minces
cristaux de germanate de bismuth large de 1 mm et une petite source de 68Ge de 1 mm
de diamètre. Les fonctions de coïncidences d'ouverture de chacun des cristaux du
détecteur bloc multi-cristaux fut comparées à celles de cristaux individuelles. Les
cristaux du centre du bloc ont montré une dégradation de 0.8 mm comparativement aux
cristaux éloignés du centre qui n'ont montré aucune dégradation. La position apparente
des centroïdes des cristaux du bloc ne se trouve pas au centre géométrique de ceux-ci, ce
qui apporte des erreurs dans l'algorithme de reconstruction qui assume une densité
uniforme. Nos résultats suggèrent que la dégradation ajouté par l'effet bloc n'est pas
seulement dut à l'utilisation de détecteurs bloc multi-cristaux.

ACKNOLEDGEMENTS
1 would like to thank to my supervisor, Dr Thompson for his encouragement,
support and guidance through this interesting project. This work would not be possible
without his constant advices and directions.
Thanks to my colleges Nan, Francois, Sam and Martin for their support and
friendly atmosphere in the laboratory.
1 would also like to thank to Joe Larkin for his great help and explanations
related to the problems in the constructions of the electronic components.
Finally, 1 would like to thank to my husband for his infinite encourage, patient
and faith in my capabilities, without whom 1 would have never finished this work .. This
thesis is dedicated to him and to my son Milosh, with love.

List of Figures
Figure 1.1 The schematic diagram of the positron-emission and the annihilation
Figure 1.2 Schematic of the detection of annihilation gamma rays in PET scanners
Figure 1.3 18p_PDG
Figure 1.4 Simplified diagram comparing the behavior of glucose and 18p_PDG in the
tissue
Figure 2.1 Intensity of parallel gamma rays as a function of absorber thickness
Figure 2.2 Interaction distributions as a function depending on the atomic number of the
medium and the energy of the photons entering the medium
Figure 2.3 Schematic of photoelectric effect
Figure 2.4 Schematic of Compton effect
Figure 2.5 The energy band structure of an activated inorganic scintillator
Figure 2.6 Excitation and fluorescence of BGO
Figure 2.7 Attenuation curve for BGO
Figure 2.8 Schematic of PMT
Figure 2.9 Basic diagram of PET detector which consists of scintillator, light guide and
PMT
Figure 2.10 Schematic oftwo PET detector modules with: a) one to one coupling
between crystal and PMT and b) 64 crystals are coupled to 4 PMTs which is
known as block detector design
Figure 2.11 Diagram of Siemens CT! ECAT HR+ PET scanner detector block
Figure 2.12 Binominal distribution
Figure 2.13 Crystal identification matrix obtained from flood-field irradiating the block
detector
Figure 2.14 Schematic diagram of the detection with PET

Figure 2.15 Coincidence sampling paths in PET scanners: a) over many angles (fan-
beam response) and b) at any given angle (parallel- beam response)
Figure 2.16 3D and 2D PET configurations
Figure 2.17 True, scatter and random events in PET imaging
Figure 2.18 Illustration of the independent of the attenuation on the location of the
annihilation along the LOR
Figure 3.1 Factors affecting the spatial resolution in PET
Figure 3.2 Positron range error
Figure 3.3 Angular deviation and detector separation error
Figure 3.4 Crystal width error
Figure 3.5 Spatial resolution in different PET scanners as a function of crystal width.
Figure 4.1 Decay of Ge-68
Figure 4.2 Radiograph of the CTI detector used in this study
Figure 4.3 Quad amplifier box connected with CTI block detector
Figure 4.4 Schematic of the amplifiers assembled in quad amplifier box
Figure 4.5 Single detector box
Figure 4.6 The data acquisition system
Figure 4.7 Signal processing module
Figure 4.8 Schematic of the discriminators assembled in the signal-processing module
Figure 4.9 The basic schematic ofthe coincidence circuit made in the signal-processing
module
Figure 4.10 Experimental set-up for measuring the block effect in block detectors used
in PET

Figure 4.11 Picture of the experimental set-up with two translation stages with block
detector attached on one of them and single detector on the other one and the
shielded 68Ge source of annihilation gamma rays in the middle between two
detectors.
Figure 5.1 SR in PET as a function of cw with and without a 2 mm block effect, as
obtained from Equation 3.2. The symbols show the measured SRs for
different PET scanners from published reports.
Figure 5.2 Crystal identification matrix
Figure 5.3 Energy spectrum for block detector (digital sum energy and analog sum
energy) and energy spectrum from single detector in coincidence with preset
low and high energy discriminators.
Figure 5.4 CAF for two single crystals with detector separation of 12 cm, fitted with
tree Gaussian functions
Figure 5.5 Variation of the FWHM of CAF of single crystals with the detector
separation
Figure 5.6 Variation of the FWHM of CAF of two single crystals (.) and single crystal
with the central (~,O) and the edge crystal of the block detector (0,\7)
Figure 5.7 Data display in the experiments in which crystals in the block detector are in
coincidence with Imm single crystal. The individual frames present the
columns of the crystals in the block that were in coincidence with a single
crystal. The picture in the left top corner represents the sum of all individual
frames
Figure 5.8 CPM/pixel as a function of distance for the regions around visible crystals in
the image.
Figure 5.9 CPM/pixel as a function of distance for the territories between two crystals in
the image.
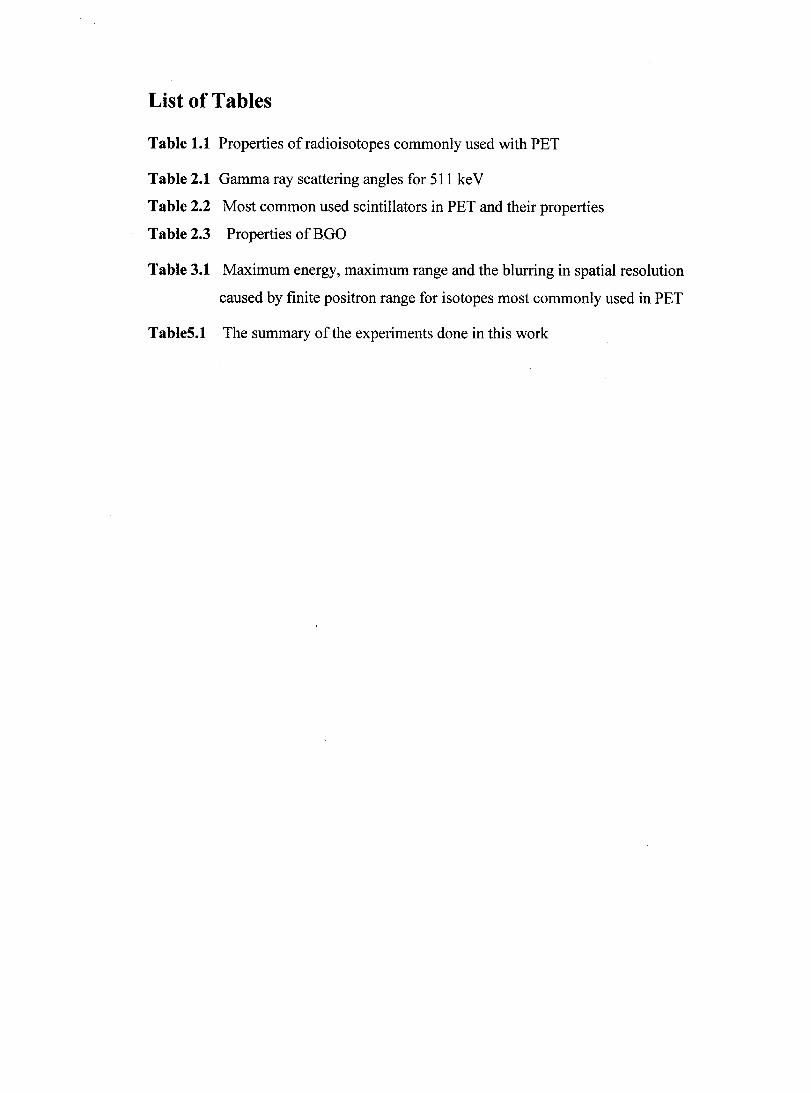
List of Tables
Table 1.1 Properties of radioisotopes commonly used with PET
Table 2.1 Gamma ray scattering angles for 511 ke V
Table 2.2 Most common used scintillators in PET and their properties
Table 2.3 Properties of BGO
Table 3.1 Maximum energy, maximum range and the blurring in spatial resolution
caused by finite positron range for isotopes most commonly used in PET
TableS.l The summary of the experiments done in this work

Table of contents
CHAPTER 1 BASIC PRINCIPLES OF POSITRON EMISSION TOMOGRAPHY ....................... 1 1.1 Introduction ................................................................................... 1 1.2 Positron Emission and Photon Annihilation in PET .................................... 3 1.3 How the PET Scan is Done .......................................... . . . . . . . . . . . . . . . . . . . . ... 4 1.4 Positron-emitters Used in PET ............................................................ 7
References for Chapter 1 ................................................................... 10
CHAPTER2 DETECTION IN PET.................. ......... ... ......... ... ...... .............. ............ Il 2.1 Gamma Interactions with Matter. . . . . . . . . . . . . . . . . . . . . . . . . . . . . . . . . .. . . . . . . . . . . . . . . . . . . . ... Il 2.2 Inorganic Scintillators in PET ............................................................ 17
Bismuth Germanate (BGO) ................................. .......... ..................... 20 2.3 Photo-multiplier Tubes(PMT) ............................................................ 23 2.4 Detectors Used in PET Scanners................. ..................................... ... 23 2.5 Coincidence Detection in PET Scanners ............................................ .... 32
The Basic Characteristics of Coincidence Detection.............................. 32 Image Formation................................................................... .... 34 PET Acquisition Modes ............................................................... 34 Events Types in PET ................... ................................................ 35 Attenuation Correction. . . . . . . . .... . . . . . . . . . . . . . . . . . . . . . . . . . . . . . . . . . . . . . . . . . . . . . . ... . ... 37
References for Chapter 2 ........................................................................................ 39
CHAPTER3 PARAMETERS IN PET... ... .................................... ......... ............ ........ 40 3.1 Spatial Resolution in PET ................................................................. 40 3 .2 Motivation ................................................................................... 46 3.2 The Possible Causes of the Block Effect .................... ........... ................. 48
References for Chapter 3 ...................................................................... 52
CHAPTER4 MATERIALS AND METHODS ............................................................. 53 4.1 Introduction.............................................................................. .... 53 4.2 Materials .................................................................................... 54
4.2.1 Sourceof511 keVGammaRays .............................................. 54 4.2.2 CTI Detector ..................................................................... 55 4.2.3 Quad Amplifier Box......... ..................... .......... ......... ........... 56 4.2.4 Single Crystal Detector ......................................................... 58 4.2.5 R1548 dual PMT ................................................................ 59 4.2.6 The Data Acquisition System... ... ... ... ... ...................... ... ... ... ... 59
Signal Processing Module .................................................... 60 Analog to Digital Converter (ADC) ........ .............................. ... 65 Multichannel Analyzer (MCA) ... ... ........................................ 65
4.2.7 The Automated Displacement System ........................................ 66 4.2.8 The Data Processing ............................................................. 66 4.2.9 Acquisition Software............................................................ 67 4.2.10 Display Software.............. .................................................. 67
4.3 Methods ............................................................ ;............................. 68 4.3.1 Spatial Resolution of PET Scanners.................................................... 68 4.3.2 Experimental Apparatus.............................................................. .... 68 4.3.3 Determination ofthe Effective Source Size........................................... 73 4.3.4 Measurements of CAFs ofVarious Crystals.......................................... 74 4.3.5 Measurements ofInter- crystal Distance in the Block............................... 75
References for Chapter 4 ...................................................................... 77
CHAPTER5 RESULTS AND DISCUSSION ................................................... ""."" .. " 78 5.1 Spatial Resolution of PET Scanners.................................................. ... 78 5.2 Experimental Results ...................................................................... 79 5.2.1 Crystal Identification Matrix............................................................. 79 5.2.2 Energy Spectrum from the Detectors in Coincidence............................ ..... 80 5.2.3 Determination of the Effective Source Size.. .. .. .. .. .. .. .. .. .. .. .. .. .. .. .. .. .. .. .. .... 82 5.2.4 Measuring ofthe CAF ofVarious Crystal Combinations............................ 84 5.2.5 Determination of the Separation ofthe Crystals in the Block........................ 86 5.2.6 Summary of the Experiments Done in this Work........................ ...... ....... 89 5.3 Discussion and Future work.............................................................. 91 5.4 Original Contribution..................................................................... 95
References for Chapter 5 ..... ................................................................... 98
CONCLUSIONS...... .................. ......... ... ... ... ... ...... ... ......... ......... ......... 99

CHAPTERI
BASIC PRINCIPLES OF POSITRON EMISSION TOMOGRAPHY
1.1 Introduction
Positron emission tomography (PET) is a nuclear medical imaging method,
which gives information on physiology and pathology of certain organs within the
human body or animaIs. In order to study physiological function of human organs,
nuclear medicine methods use the radio isotopes bound to molecules with known
biological properties. Unlike other methods of nuclear medicine, PET uses a biologically
active compound labeled with a positron-emitting isotope. It is introduced into the body
in trace quantities either by injection or inhalation. Then the compound accumulates in
the patient and the pattern of its subsequent emission is used to estimate the distribution
of the radioisotope and hence of the tracer compound. The most common radioisotopes
that are used in PET are isotopes of carbon, nitrogen, fluorine and oxygen. AlI of them,
except fluorine, are contained in essentially all compounds that constitute or are
consumed by the human body and the fate ofthem can be studied in vivo. PET gives the
information of the concentrations of positron-emitting radioisotopes within a three
dimensional object by the use of external measurements of the radiation from these
isotopes. It represents the image of a cross-section of the object, with the intensity of
each picture element (pixel) proportional to the isotope concentration at that position in
the object.!' 2, 3
The first medical application for the positron were made and reported by Sweet
in 1951 4 and in 1974, Phelps and Hoffman at CTI constructed the first PET scanner for
1

human studies.5 In the beginning NaI(Tl) crystals were used as detectors for gamma
rays, later on the bismuth-germanate (BGO) was introduced. The first actual tomograph
constructed that employed BGO was designed in 1978 by Christopher Thompson and
his group at the Montreal Neurological Institute.6
PET is capable of targeting where certain metabolic processes occur and
measuring the rate at which these processes take place. It is able to determine whether
tpe biochemical function is impaired, while other forms of medical imaging such as x
ray are confined to determine the physical structure of the organ. It is therefore most
frequently used in organs or diseases where biological function is of primary
importance. Examples are neurological diseases where physical affects are only
observable on microscopic level, heart disease where the relative vigor of the tissue is of
primary importance, or oncology, where the metabolic rate gives valuable information
on whether tissue is cancerous and how it responds to treatment.
Therefore, this imaging modality is applied in neurology, cardiology and
oncology to study functions of the brain, heart and to detect cancer. It has been used in
medical research in neurology to study disorders including Parkinson's disease,
epilepsy, schizophrenia, Alzheimer's disease and depression. The clinical application of
PET has increased considerably in last decade. It is an important tool in the evaluation
and diagnosis of diseases. It can show progress of disease and how body responds to
treatment. In cardiology, it finds application in detection of coronary artery disease and
in myocardial infraction. In oncology it has been used for diagnosis, staging and
metastasis survey of many malignant tumors in patient with lung cancer, breast cancer,
lymphomas, head and neck tumors, melanoma and brain tumors.7-11
2
1.2 Positron Emission and Photon Annihilation in PET
A nucleus is held by means of the strong nuclear force acting among its protons
and neutrons, but protons also repel one another electrically because oftheir charge. For
a nucleus with relatively high proton-to-neutron ratio, this electrical repulsion, together
with the weak nuclear force, may lead to nuclear instability. Such nuclei that are
unstable, having an excessive numbers of protons and a positive charge, become more
stable in two ways: 1) the nucleus can capture an orbital electron and neutralize positive
charge with the negative charge of the electron, or 2) a positive electron (a positron) can
be emitted from the nucleus, removing a positive charge from nucleus. I2
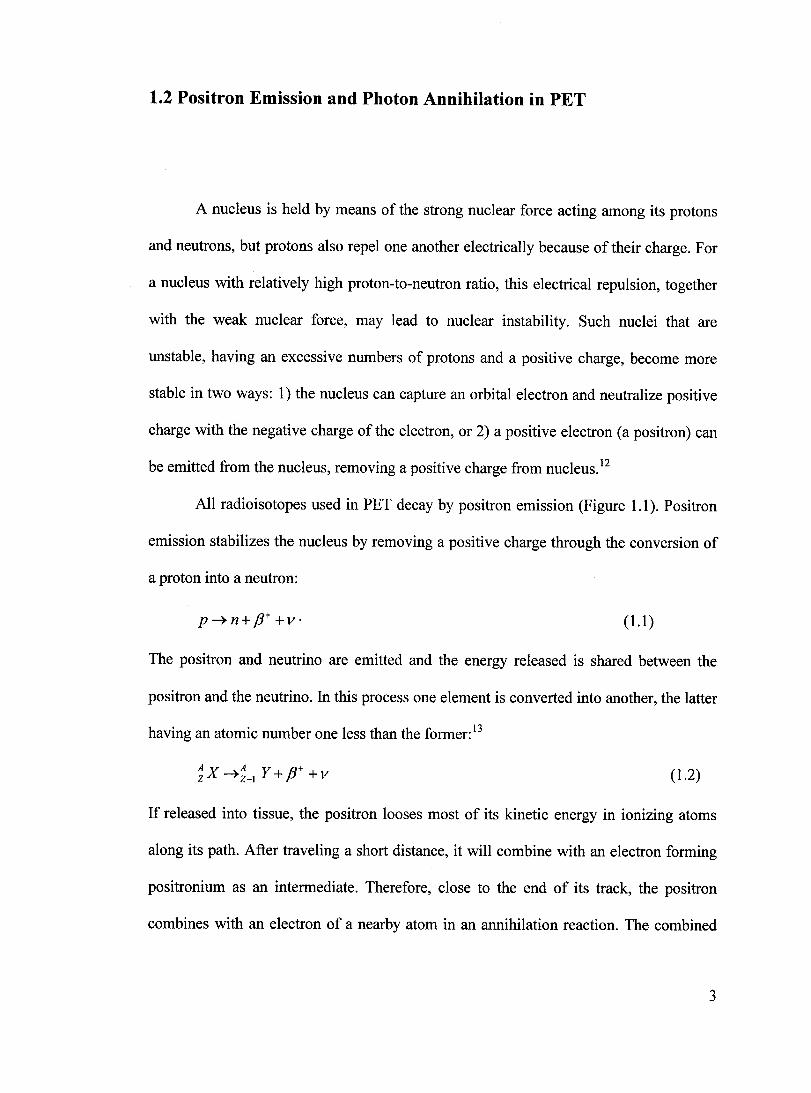
All radioisotopes used in PET decay by positron emission (Figure 1.1). Positron
emission stabilizes the nucleus by removing a positive charge through the conversion of
a proton into a neutron:
(1.1 )
The positron and neutrino are emitted and the energy released is shared between the
positron and the neutrino. In this process one element is converted into another, the latter
having an atomic number one less than the former: 13
A X ~A Y + p+ + V Z Z-l (1.2)
If released into tissue, the positron looses most of its kinetic energy in ionizing atoms
along its path. After traveling a short distance, it will combine with an electron forming
positronium as an intermediate. Therefore, close to the end of its track, the positron
combines with an electron of a nearby atom in an annihilation reaction. The combined
3
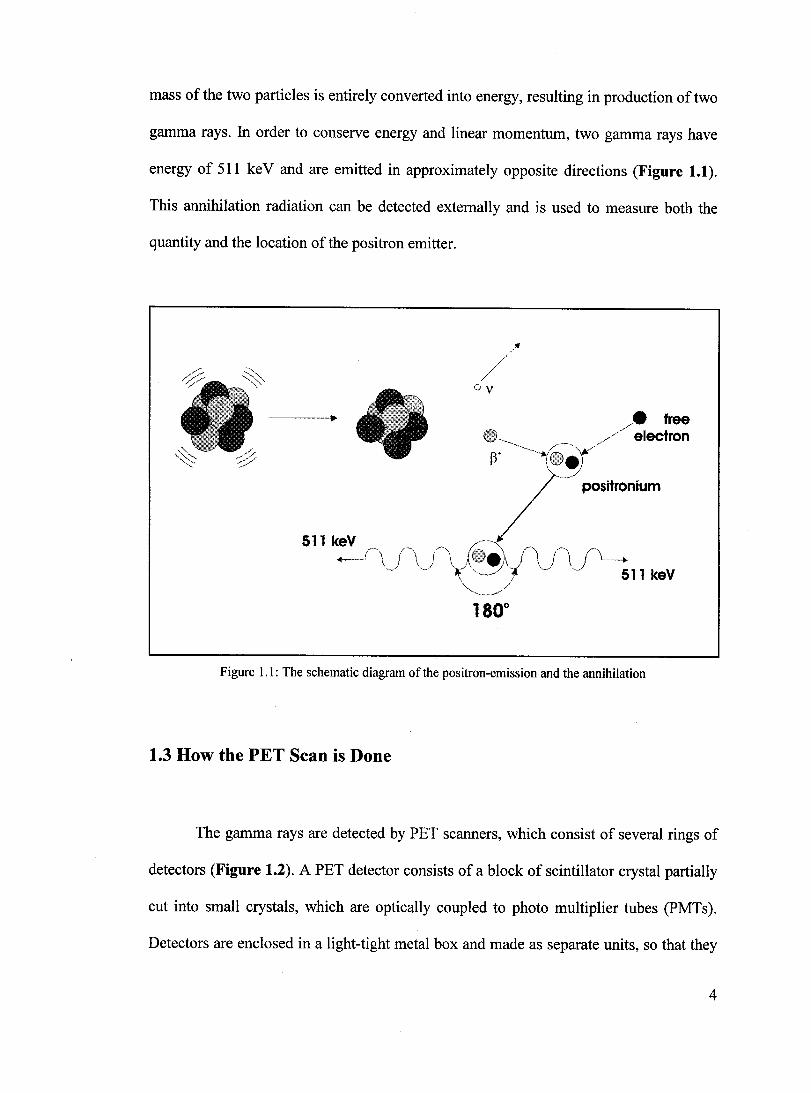
mass of the two particles is entirely converted into energy, resulting in production oftwo
gamma rays. In order to conserve energy and linear momentum, two gamma rays have
energy of 511 keV and are emitted in approximately opposite directions (Figure 1.1).
This annihilation radiation can be detected extemally and is used to measure both the
quantity and the location of the positron emitter.
Figure 1.1: The schematic diagram of the positron-emission and the annihilation
1.3 How the PET Scan is Done
The gamma rays are detected by PET scanners, which consist of several rings of
detectors (Figure 1.2). A PET detector consists of a block of scintillator crystal partially
cut into small crystals, which are optically coupled to photo multiplier tubes (PMTs).
Detectors are enclosed in a light-tight metal box and made as separate units, so that they
4

can be removed from the scanner if necessary. Detectors in the scanner in either the
same ring or different rings are connected to a coincidence circuit. A coincidence circuit
accepts only those events in which two detectors are struck by 511 ke V photons at
virtually the same time. Each scintillation crystal detector emits a brief pulse of light
every time it is struck with a gamma ray coming from the radioisotope within the
patient's body. The pulse of light is converted in electrical signal and amplified by a
photo multiplier tube, and the information is sent to the computer. The external detection
and localization of a positron emitter inside an object take advantage not only of the fact
that the two annihilation photons are emitted at 180 degree to each other , but also of the
fact that they are created simultaneously as weIl as that they have energy of 511 ke V.
Annihilation coincidence detection is the principle feature of the PET and it localizes the
origin of the gamma rays along a line between the detectors from which the signaIs were
obtained. Most of the newer PET scanners do not use collimators, but rather employ
coincidence detection as the sole means of emission localization. 14,15
PET scan begins with injection of a positron-emitting radioisotope into the
patient's body. The isotope circulates through the bloodstream to reach a tissue. If the
used compound is FDG, after certain period required for the compound uptake, the
patient is placed into a scanner. In the case of other compounds uptake the injection is
done when patient is already positioned in the scanner. However, the patient is on a
moveable bed, which slides by remote control into the circular opening of the scanner.
Placed around this opening and inside it there are several rings of detectors. As positron
annihilation occurs, the tomograph detects the isotope's location and concentration and
this information is sent to the computer, which controls the apparatus. The raw data are
stored in memory array called sinogram. Than the reconstruction software takes
5

measured and collected coincidence events to reconstruct the slice image that depicts the
localization and concentration of the isotope.
Independent .' .......... \.
Radiation ." '\/ \\\\_ Detectors .. /~., . ~ /~/ ~.~ .~
----;,---.i -
Annihilation Photons
--'. -,--"
Figure 1.2: Schematic of the detection of annihilation gamma rays in PET scanners (From Wolbarst l2)
PET images of slices of an organ being scanned are displayed in following way.
Structures that have higher concentration of the injected radiopharmaceutical emit a
higher amount of radiation, meaning that they are more active in terms of cell
metabolism or blood circulation. The pseudo-color images are displayed in such a way
to be able to show "hot" regions, with the colors in the same order as a rainbow in this
way. Red is the highest activity, then coming orange, yellow and so forth. Blue, violet
and black represent the lowest levels of activity. PET images are also shown in
conventional gray scale.
6

Since the probability of absorption of the two gamma rays is independent of the
position of the event along a straight line connecting two detectors, PET is an inherently
quantitative imaging method aHowing the measurement of regional concentrations of the
radio pharmaceutical injected after proper calibration.
1.4 Positron-emitters Used in PET
One of the most widely recognized advantages of PET is the use of the positron-
emitting radiotracers: carbon-Il (uC), oxygen-15 ct 50), nitrogen-13 (13N) and fluorine-
18 ct 8F) that mimic natural substrates. AH of these isotopes can be produced with a
compact cyclotron in substantial quantities. The table 1.1 represents a summery of radio
pharmaceuticals used for PET imaging in different applications l6•
Table 1.1: Properties of radioisotopes and compounds commonly used with PET
Isotope & Half-life
Positron range in Production
Function Application
compound water(mm) imaged
18F_FDG 110 min lA Cyclotron Glucose Cancer
metabolism detection
150-Water 123 sec 2.7 Cyclotron Cerebral blood
Brain research flow
82Rb 70 sec 4.0 Generator Cardiac blood flow Heart perfusion
llC-Raclopride 20.3 min 1.7 Cyclotron Neuro-transmission Brain research
AH the isotopes used in PET have short half-life, which implies they give lower
radiation doses. Both, short half-life and lower radiation doses are advantage of PET
imaging. On the other side, the short half-life means they cannot be transported to sites
at great distances from the production facility but produced near imaging site. This is a
7

disadvantage when the radioisotopes need to be distributed to hospitals, which have PET
scanners
HO OH
Figure 1.3: 18F_FDG
Oxygen-15 decays to stable nitrogen-15 by positron emission. It is used to label
gases for inhalation such as oxygen, carbon dioxide and carbon mono xi de and is used to
label water for injection. The major purpose of these gases and liquids is to measure the
blood flow, blood volume and oxygen consumption in the body.
Blood Cell
~L/o~ HO' I-l~-~-' Glucose-6-P, -
HO OH OH
D-Glucose
Cell Membrane
Krebs \ Cycle \ \ Other
Products
Figure 1.4: Simplified diagram comparing the behavior of glucose and 18F_FDG in the tissue
Glucose metabolism can be measured using an analog of glucose, 2-deoxy-
glucose, which can be labeled with 18F. FDG17 (2-fluoro-2-deoxy-D-glucose) is a normal
8

molecule of glucose, attached artificially to an atom of radioactive fluorine. Fluorine-18
decays 97% by positron emission. The other 3 % is by electron capture. It forms very
strong covalent bonds with carbon compounds and can be incorporated into different
organic molecules. It can be substituted for a hydroxyl group18 in the deoxyglucose
(Figure 1.3). As opposed to glucose it does not go through whole Krebs cycle. It makes
18-FDG-6-P product which remains trapped in the tissue, rather than being completely
metabolized (Figure 1.4). It is used in PET for cancer detection. The cancer cells that are
more active in a given period of time following injection will absorb more FDG, since
they have a higher metabolism and need more energy. The ordinary glucose metabolism,
occurring in the presence of oxygen (aerobic cellular respiration) at the end gives 38
adenosine three phosphate (A TP) molecules, which represent basic cellular fuel. The
proliferating cancer cells are highly hypoxic. In the absence of oxygen, growing cancer
cells are redirecting the glucose metabolism towards more ineffective, anaerobic cellular
respiration (lactic acid cycle), that provides only 2 A TP molecules per glucose molecule
metabolized. Rence, growing cancer cells will have much higher uptake of glucose, and
higher uptake ofFDG as well.
9
References
l "Positron Emission Tomography and Autoradiography: Principles and Applications for the Brain and Heart", edited by M. Phelps, J. Mazziotta and H. Schelbert, Raven Press, New York 1986.
2 "The Physics of Medical Imaging", edited by Steve Webb, Adam Hilger, Bristol and Philadelphia (1988).
3 W. W. Moses "Trends in PET Imaging", Nuclear Instrumentation and Methods, A-471, 209-214 (2001). 4 W. H. Sweet "The use ofnuclear disintegration diagnosis and treatment ofbrain tumors", N. Engl. J.
Med. 245 :875-878 (1951). 5 R. Nutt, "The History of Positron Emission Tomography" Moleeular Imaging and Biology 4 (1), 11-26
(2002). 6 C. 1. Thompson, Y. L. Yamamoto and E. Meyer "Positome II: A High Efficiency Positron Imaging
Deviee for Dynamic Brain Studies", IEEE Trans. Nucl. Sei., NS-26 (1), 583-589 (1979). 7 T. R. Henry, J. C. Mazziota and J. 1. Engel " The functional anatomy of frontal lobe epilepsy studied
with PET", Adv. Neural. 57,: 449-463 (1992). 8 H. T. Chugani, M. E. Phelps and 1. C. Mazziotta" Positron Emission Tomography Study of Human
Brain Development", Ann. Neural. 22 ,487-497 (1987). 9 O. Muzik, R. S. B. Beanland, D. Hutchinsg, et al. "Validation ofnitrogen-13-ammonia tracer kinetic
model for quantification ofmyocardial blood flow using PET", J Nucl. Med. 34,83-91 (1993). JO H. A. Mcanpinlac "Clinical usefulness ofFDG PET in differentiated thyroid cancer" J Nucl.Med. 42
(1),77-78 (2001) Il K.H. Bohuslavizki, S. Klutmann, S. Kroger et al. "FDG PET detection ofunknown primary tumors", J
Nucl. Med. 41 (5): 816-822 (2000). 12 A. B. Wolbarst "Physics of Radiology", Appleton and Lange, Norwalk, Connecticut (1993). 13 R. D. Evans "The Atomic Nucleus", McGraw-Hill book Company, Inc., New York, (1955). 14 J. A. Sorenson and M. E. Phelps "Physies in Nuclear Medicine", Second Edition, Grune & Stratton,
(1987). 15 "Principles and Practiee of Positron Emission Tomography", ed. by R. L. Wahl, L. Williams and
Wilkins, Philadelphia 2002. 16 "The Theory and Practice of Scintillation Counting," ed. by J.B. Birks, the MacMillan Co., New York,
(1964). 17 J. S. Fowler and A. P. Wolf"2-Deoxy-2-[18F] fluoro-D-glucose for metabolic studies: CUITent status",
Int. J Appl. Radiat. Isot. 37,663-668 (1986). 18 A. Sols and R. A. Crane" Substrate specificity ofbrain hexokinase", J Biol. Chem. 210, 581-595
(1954).
10

CHAPTER2
DETECTION IN PET
2.1 Gamma Interactions with Matter
Energy of gamma photons range from ke V to Me V. For a photon with frequency
v and wave length À energy is E=hv = hC/À, where c is the speed of light and h is Planks
constant. In PET the gamma rays that have energy of 511 ke V interact with the matter
through which they pass and they 100 se their energy. First, they may interact with the
patient's body. If the photon is not absorbed inside the body, it may interact with the
scintillation crystal.
Gamma ray intensity decreases exponentially from its initial intensity, going
through matter. The reduction of intensity of a photon flux is called attenuation. A
narrow beam of mono energetic photons with incident intensity 10 penetrating a layer of
material with the thickness x, emerges with intensity l given by the exponential
attenuation lawl,2:
(2.1)
where J..l is the attenuation coefficient of the medium. The attenuation of the gamma
photons going through medium as a function of the thickness or distance that they travel
is presented on the Figure 2.1. A term called the half-thickness X1l2 exists analogous to
the half-life. This is the thickness of the material at which the intensity of gamma rays
will decrease to half of the incident one (Io/2). The absorption coefficient is dependent
on gamma ray energy and on the absorber.
11

1.0
0.8
~ 0.6 t/) c CI) .. c 0.4
0.2
0.0
_ 1 -~x - 0 e
Thickness, X
Figure 2.1: Intensity ofparallel gamma rays as a function of absorber thickness
When a gamma ray from a radioactive source interacts with matter, there are
three primary methods by which it is absorbed and those are: photoelectric effect,
Compton scattering and pair production. At energy of 511 ke V the probability for
Rayleigh scattering is negligible, and there is no pair production at these energies.
Therefore, the dominant interactions of the 511 ke V gamma rays are photoelectric effect
and Compton scattering (Figure 2.2).
In photoelectric effect (Figure 2.3), aIl the energy of the incident photon is
absorbed by a bound electron of an atom, most likely, for typical gamma photon energy,
a K-sheIl electron. As a result, a photoelectron is produced, with kinetic energy equal to
the initial photon energy minus the sheIl binding energy:
(2.2)
12

where B is the binding energy of the electron in the particular shell and Ey is the energy
of the gamma ray. The ejected electron is called a photoelectron. The photoelectron is
then capable of causing further ionization.
120
100 Photoelectric Pair production
... effect dominant dominant CI) 80 .CI ... 0 1/1
.CI 60 lU .... 0 N 40
Compton
20 effect dominant
0
0.01 0.1 1 10 100 Photon Energy (MeV)
Figure 2.2: Interaction distributions as a function depending on the atomic number of the medium and the energy of the photons entering the medium
With the loss of an internaI electron the atom is left in an excited state from
which it relaxes by emitting a characteristic x-ray photon (fluorescence photon) or
Auger electrons. The relative probability of fluorescence versus Auger de-excitation is a
function of the atomic number Z and of the interested shell and is called fluorescence
yield. The energy of the Auger electrons ranges from few ke V for low Z materials to
tens of ke V for atoms with higher atomic number. If X ray photons or Auger electrons
do not escape from the detector (the Auger electron has a very short range, due to its
13

low-energy, and the characteristic x-ray photon has small absorption length, about 1
mm), then the whole incident photon energy is deposited in the detector. Thus the ideal
detector spectrum of a monochromatic beam of photons an undergoing photo-electric
absorption is a single delta peak at the incident energy. The photoelectric cross section
varies with photon energy as 1/(hv)3 and with atomic number as Z3.
Photo-electron •
Figure 2.3 : Schematic ofphotoelectric effect
The Compton scattering (Figure 2.4) is an inelastic collision between a gamma
ray and an electron. In the Compton scattering process, incident photons having energy
Ey=hv are scattered by the electrons with a partial energy loss, which depends on the
angle between the direction of the photon before and after the interaction. The photon
scatters through an angle 8 and emerges with energy Ey'=hv', while recoil electron goes
along an angle <p from the initial trajectory of the photon with energy hv. Both the
14

electron and the gamma ray share the available energy. The electron is than capable of
causing further ionization. The energies of the scattered photon (Ey') and electron (Ee)
are given by the equations:
Er Er' = h ,and
1+ v mc2 (1- cos B)
(2.3)
(2.4)
where mc2=511 ke V is the rest energy of the electron, c is the speed of light, me is the
electron mass and e is the photon scattering angle.
Figure 2.4 : Schematic of Compton effect
Recoil electron
The dependence of the energy of the scattering gamma rayon its scattering angle
is given in the Table 2.1. Thus, the maximum energy deposition occurs when 8=180°,
while for e == 0° nearly aIl the incident photon energy goes to the scattered photon and
only small part is converted into electron energy. Therefore the electron energy can
15
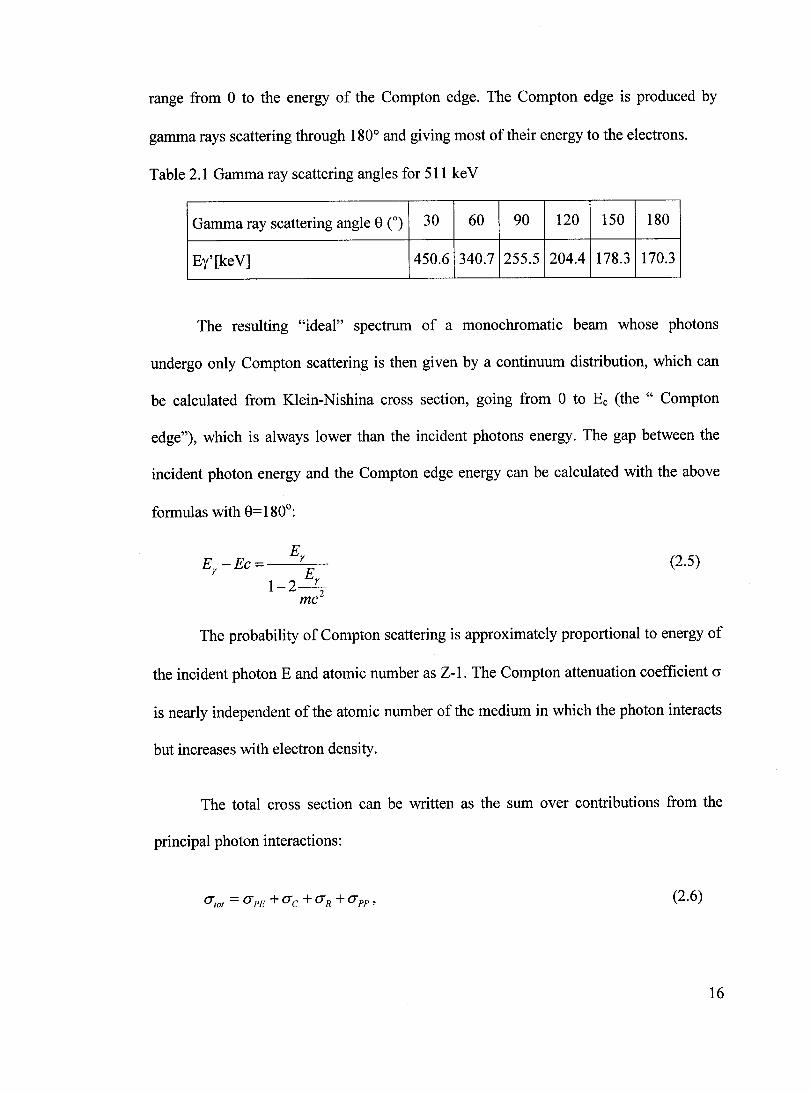
range from 0 to the energy of the Compton edge. The Compton edge is produced by
gamma rays scattering through 1800 and giving most of their energy to the electrons.
Table 2.1 Gamma ray scattering angles for 511 ke V
Gamma ray scattering angle 8 CO) 30 60 90 120 150 180
Ey'[keV] 450.6 340.7 255.5 204.4 178.3 170.3
The resulting "ideal" spectrum of a monochromatic beam whose photons
undergo only Compton scattering is then given by a continuum distribution, which can
be calculated from Klein-Nishina cross section, going from 0 to Ec (the" Compton
edge"), which is always lower than the incident photons energy. The gap between the
incident photon energy and the Compton edge energy can be calculated with the above
formulas with 8=180°:
(2.5)
The probability of Compton scattering is approximately proportional to energy of
the incident photon E and atomic number as Z-l. The Compton attenuation coefficient cr
is nearly independent of the atomic number of the medium in which the photon interacts
but increases with electron density.
The total cross section can be written as the sum over contributions from the
principal photon interactions:
(2.6)
16

where photoelectric, Compton, Rayleigh and Pair Production are cross sections. In the
case of 511 ke V photons there is no Pair Production and Rayleigh scattering is
negligible.
2.2 Inorganic Scintillators Used in PET
In inorganic materials, the energy states are determined by the crystallattice. While
the electron energy states of an isolated atom or molecule consists of a series of discrete
levels, in a crystallattice the outer e1ectron levels are perturbed by interactions between
atoms. The result is broadening of the allowed energy levels into energy bands. A pure
crystal has available only a valence band (where electrons are bound at lattice sites) and
a conduction band (where e1ectrons are free to move through the band), with an energy
gap between them called forbidden band (Figure 2.5). Electron can never exist in a
forbidden band in a pure crystal. When a scintillator is irradiated, there is absorption of
energy by the crystal which results in the moving of an electron from the valence band
to the conduction band and producing the hole in the valence band. In that way the
electron-hole pair is formed, which is called exciton. The electron then recombines with
a hole in the valence band and it de-excites to the valence band with the release of a
high-energy photon. This is very inefficient system because the photon released has
energy that is beyond the visible range. The band gap needs to be reduced in order to
lower the energy of the emitted photon to the visible range. This is achieved with the
addition of small amounts of impurities called activators. The result is the presence of
lattice sites with energy states within the forbidden region (Figure 2.5). The de
excitation through these sites can happen which increases the probability of a photon
17

being ejected within the visible range. When the electron-hole pairs are formed, the
holes can migrate to the activator sites and can ionize them. Then the electrons from the
conduction band are attracted to those sites in order to neutralize them. Those sites can
rapidly de-excite with emission of a scintillation photon. If the proper activator is
chosen, the photons can have energy that can be detected by PMT. 3
Energy
Excited actlvator states
Acfivator ground state
~ • SCintillation photon
Figure 2.5 : The energy band structure of an activated inorganic scintillator
Scintillator should be transparent to its own emission of scintillator light and it
should have linear energy conversion of radiation energy into light. When photon is
absorbed a number of electrons will be left in an excited state and than de-excite back to
the ground state, with the emission of the light photon. This process obeys the
exponential decaying probability with decay time 1". The scintillator should have short
decay time of luminescence. The index of refraction of the scintillator will determine
how much of the light produced in the scintillator is trapped in the detector due to
18
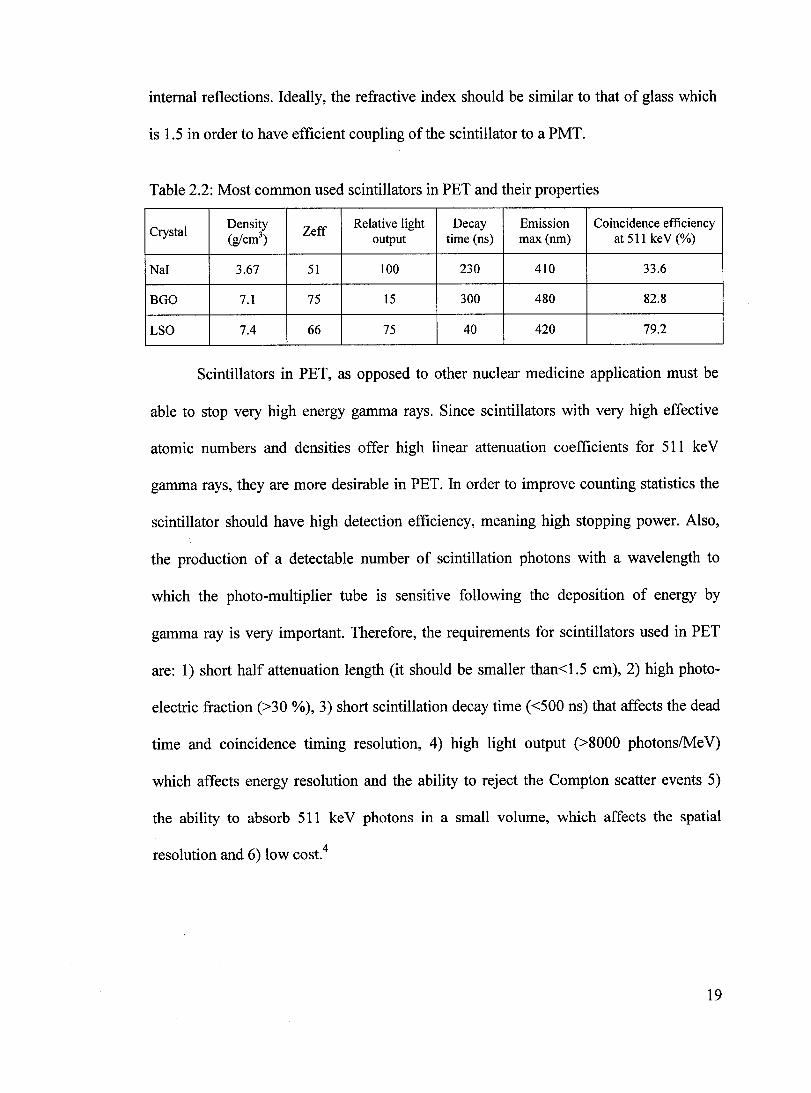
internaI reflections. ldeally, the refractive index should be similar to that of glass which
is 1.5 in order to have efficient coupling of the scintillator to a PMT.
Table 2.2: Most common used scintillators in PET and their properties
Crystal Density
Zeff Relative light Decay Emission Coincidence efficiency
(g/cm3) output time (ns) max (nm) at 511 keV (%)
NaI 3.67 51 100 230 410 33.6
BGO 7.1 75 15 300 480 82.8
LSO 7.4 66 75 40 420 79.2
Scintillators in PET, as opposed to other nuclear medicine application must be
able to stop very high energy gamma rays. Since scintillators with very high effective
atomic numbers and densities offer high linear attenuation coefficients for 511 ke V
gamma rays, they are more desirable in PET. In order to improve counting statistics the
scintillator should have high detection efficiency, meaning high stopping power. AIso,
the production of a detectable number of scintillation photons with a wavelength to
which the photo-multiplier tube is sensitive following the deposition of energy by
gamma ray is very important. Therefore, the requirements for scintillators used in PET
are: 1) short half attenuation length (it should be smaller than<I.5 cm), 2) high photo-
electric fraction (>30 %), 3) short scintillation decay time «500 ns) that affects the dead
time and coincidence timing resolution, 4) high light output (>8000 photonslMeV)
which affects energy resolution and the ability to reject the Compton scatter events 5)
the ability to absorb 511 ke V photons in a small volume, which affects the spatial
resolution and 6) low cost.4
19
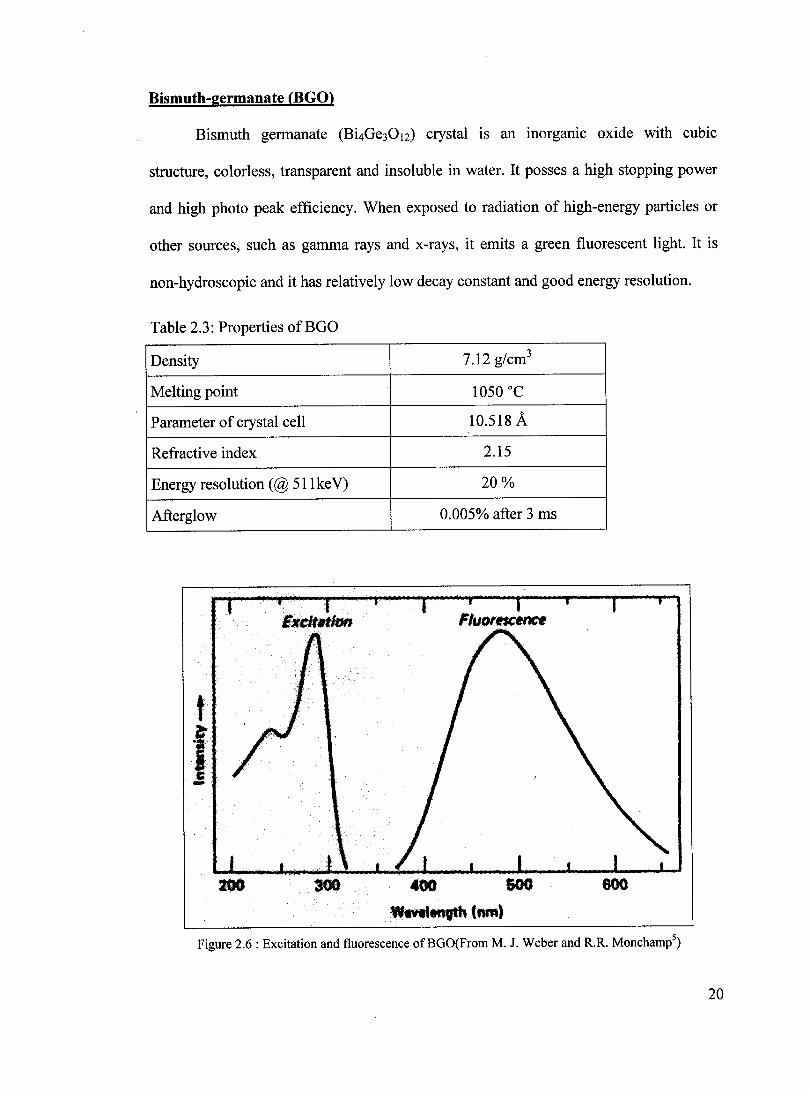
Bismuth-germanate (BGOl
Bismuth germanate (Bi4Ge3012) crystal is an inorganic oxide with cubic
structure, colorless, transparent and insoluble in water. It posses a high stopping power
and high photo peak efficiency. When exposed to radiation of high-energy particles or
other sources, such as gamma rays and x-rays, it emits a green fluorescent light. It is
non-hydroscopic and it has relatively low decay constant and good energy resolution.
Table 2.3: Properties ofBGO
Density 7.12 g/cm3
Melting point 1050 oC
Parameter of crystal cell 10.518 À
Refractive index 2.15
Energy resolution (@ 511keV) 20%
Afterglow 0.005% after 3 ms
FluortISC~
t
f -
Figure 2.6: Excitation and fluorescence ofBGO(From M. J. Weber and R.R. Monchamp5)
20

The presence of the bismuth, which has the large st atomic number of the stable
elements (Z=83) apart from Uranium and Thorium, gives BOO a high photoelectric
cross section. BOO is chemically inert. The emission and absorption spectra of BOO are
presented at Figure 2.6. BOO emission spectrum peaks at 480 nm. Fluorescence is due
to the decay of the Be+ ion from the excited 3pI state to ISO ground state. The most
important properties of BOO are listed in Table 2.3. BOO is an intrinsic scintilator, so it
does not require an activator (see section 2.2).
Attenuation curve for BOO is presented in Figure 2.7. For 511 keV photons the
most probable interaction is the Compton scattering and the photoelectric effect has
somewhat lower attenuation coefficient. Rayleigh scattering is negligible and there is no
pair production. The total linear attenuation coefficient of BOO, because of the high
effective Z combined with a high density, is 0.9 cm-1 at 511 keV.6
c o
:.;:::: cu ::J C Q) --«
1023Q~~~----------------~==============~
-. ..
----- Reyleigh ........... Compton _._._. Photo-electric --Total
-- ---- 511 keV -- ....... --- -- ............. -. -- . ................................................................. " .. :.:::.~.~ .................. '::; ..................... .
...... - ., - "'" .. ~...... '.
---BGO Bismyth Germanate
10-3~-----r--~~~~~~----~~~--r-~~~
0.01 0.1
Photon Energy (MeV)
Figure 2.7: Attenuation curve for BGO
21
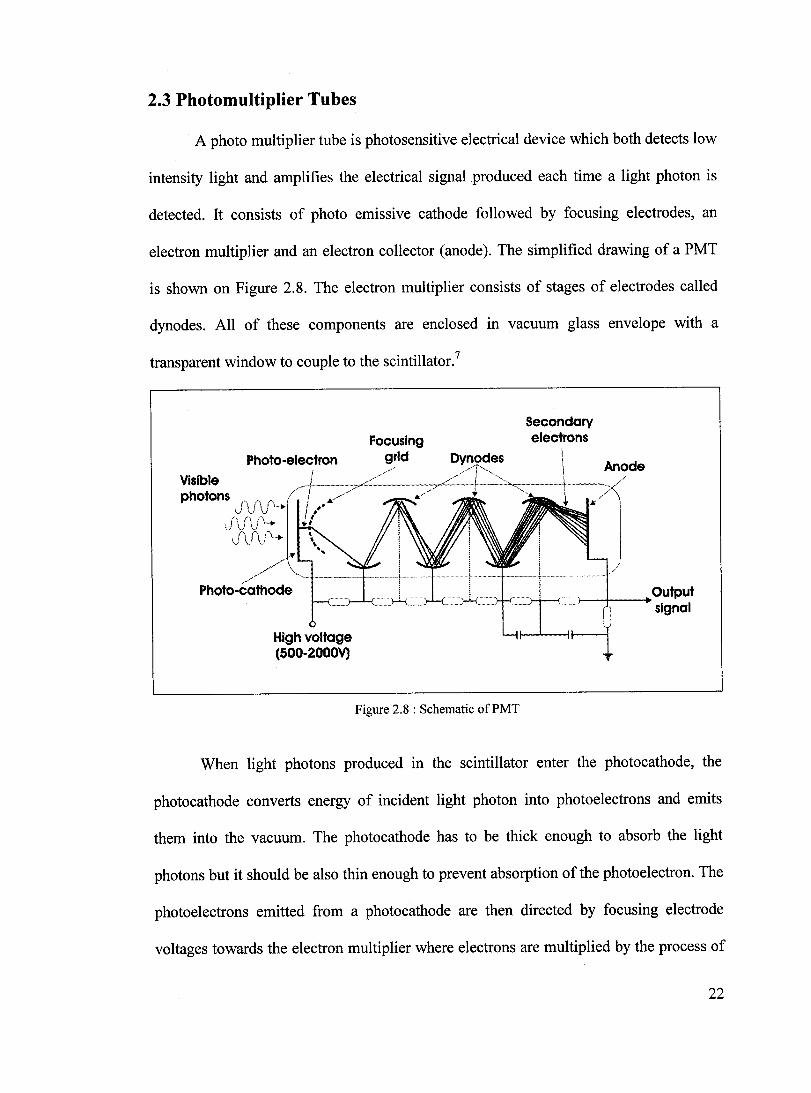
2.3 Photomultiplier Tubes
A photo multiplier tube is photo sensitive electrical device which both detects low
intensity light and amplifies the electrical signal produced each time a light photon is
detected. It consists of photo emissive cathode followed by focusing electrodes, an
electron multiplier and an electron collector (anode). The simplified drawing of a PMT
is shown on Figure 2.8. The electron multiplier consists of stages of electrodes called
dynodes. AlI of these components are enc10sed in vacuum glass envelope with a
transparent window to couple to the scintillator. 7
Visible photons
Photo-cathode
Hlgh voltage (500-2000V)
Figure 2.8: Schematic ofPMT
Secondary electrons
Anode
When light photons produced in the scintillator enter the photocathode, the
photo cathode converts energy of incident light photon into photoelectrons and emits
them into the vacuum. The photo cathode has to be thick enough to absorb the light
photons but it should be also thin enough to prevent absorption of the photoelectron. The
photoelectrons emitted from a photocathode are then directed by focusing electrode
voltages towards the electron multiplier where electrons are multiplied by the process of
22

secondary emission. Photoelectrons which are accelerated by an electric field, strike the
first dynode and produce secondary electron emissions by exciting a number of electrons
at the surface of the dynode. The direction of those electrons is random and a lot of them
will not have enough energy to escape the surface. By repeating this process over
dynode stages a high gain is achieved. The secondary electron emission depends on the
incident electron energy. As shown in the Figure 2.8, the high voltage (HV) up to
5000 V exists between the photocathode and the anode. The multiplied electrons are
collected by the anode as an output signal.
The overall gain of PMT is the ratio of the anode output current to the
photoelectric current from the photocathode. The gain G of a PMT having n dynode and
an average secondary emission ratio Ô per stage is: G= ôn, where ô is the gain per one
dynode. ô can be expressed as a ratio of the numbers of secondary electrons over
number of incident electrons. Typically, there are 9-16 stages in PMT and a typical gain
per stage is 3 to 6. The overall gain of PMT is in the range 103 to 108. The voltage
difference between dynodes in the PMT is defined by the relative values of the resistors
in the voltage divider network and the applied voltage. The gain of PMT depends on the
applied voltage but not linearly. The amplitude of the signal that is coming out of the
PMT is proportional to the number of scintillation photons incident on the photocathode.
2.4 Detectors Used in PET Scanners
Detectors in PET scanners consist of scintillation crystals coupled to photo
multiplier tubes (Figure 2.9). Each scintillation crystal detector emits a brief pulse of
light every time it is struck with a gamma ray coming from the radioisotope within the
23

patient's body. The scintillation light produced by crystals is detected by PMT and
converted into an e1ectrical signal.
The detectors in PET scanner detect mostly single photons, which are later
discarded, but are required to be ready to detect the annihilation photon pairs that are in
coincidence. In order to detect 511 ke V photons the detectors should be thick enough
and have high stopping power. To record a useful "count", both detectors in scanner
must detect its photon. The probability of detecting the count depends on the square of
the single detector efficiency. For this reason the detectors in PET should be thick. On
the other hand, if they are too thick the spatial resolution is worse at the edges and the
optimum thickness should be determined.
Scintillator Light
Guide
PMT
Electrical signal
Figure 2.9: Basic diagram of PET detector which consists ofscintillator, light guide and PMT
The properties that PET detectors should satisfy are that they must identify the
511 ke V photons with: high detection efficiency (>85% per 511 ke V photon), high
spatial resolution «5 mm FWHM), low dead time( <4 ils), good timing resolution «5ns
FWHM), good energy resolution «100 keV FWHM) and low cost8•
24

There are two designs of PET detectors that are most widely used. One of them is
a technique in which there is one-to-one coupling between crystal and PMT (Figure 2.10
a). Early PET systems9,IO used and sorne of them still use one-to-one coupling of
scintillator crystal to a PMT. The width and height of the crystal determine the in-plane
resolution and axial resolution respectively, while the depth of the crystal which is
usually tree attenuation lengths, determines the detector efficiency. In this design the
dead time is shorter and spatial resolution is improved. Those systems have very good
performance but they are very expensive because of the large number of PMTs that they
need.
The most commonly used PET detector module is known as a block detector, a
schematic of which is shown in Figure 2.10 b). Block detector was first described by
Casey and Nuttll , and current PET scanners mostly use this type of the detectors12
. The
block detector is made by cutting deep channels into a solid BGO crystal and then
feeling these channels with non-light conducting material to prevent light from
spreading from one section to the next. In this design up to 64 quasi-independent crystals
are optically coupled to four PMTs. When a gamma ray interacts in the crystal, the
resulting scintillation photons are emitted isotropically but the saw cuts limit their lateral
dispersion as they travel toward the PMTs. The light guide is formed in the crystal itself
by cutting grooves of different depths into a piece of large BGO crystal (as presented on
Figure 2.8 b)). The outer cuts are through cuts which isolate the four corner crystals to
one PMT. Similarly, light produced in all crystals along the outer edge is shared between
only two PMT's. Light from the central crystals is shared among all four PMT's. The
size of "individual" crystals determines the position resolution of the detector. The
25

detector is "dead" for about 1 ~s after a 511 ke V photon interaction while the BGO
emits its scintillation light.
BGO scintillator attenuation length is 1.1 cm, so the 30 mm depth of the BGO
crystal is nearly 3 attenuation lengths, giving high detector efficiency of e-3.3.
Single CrystQ~
PMT
a) b)
Figure 2.10 Schematic oftwo PET detector modules with: a) one to one coupling between crystal and PMT and b) 64 crystals are coupled to 4 PMTs which is known as block detector design
Example of the block detector is CTI HR+ detector and Figure 2.11 represents its
schematics diagram. The crystal has dimensions 38 mm x 36 mm x 30 mm and is cut
into 8 x 8 crystals optically coupled to four PMTs. A typical PET block detector module
has 80% detection efficiency, 20% FWHM energy resolution, and 4 mm FWHM
position resolution for 511 ke V gamma rays.13
For block detectors, the analog ratios among four PMT signaIs are used to
determine in which of the "individual" crystals the interaction occurred. In order to
determine where the annihilation photon was absorbed, the X and Y positions of the
26

interaction are calculated using the Anger logic,14 which is presented with following
equations:
x = (B-A)+(D-C) and A+B+C+D '
y= (C-A)+(D-B) A+B+C+D '
(2.7)
(2.8)
where E = (A+B+C+D) is the signal proportional to the total energy and A, B, C and D
are the amplitudes from the corresponding PMT's after the absorption of gamma ray in
the vicinity of point with coordinates (X, Y). The X and Y position signaIs range from -
1 to + 1. A number of events occurring in a single crystal element give rise to a
distribution of (X, Y) signaIs that are characteristic of that element. Localizing an event
to a single element involves specifying boundaries around each distribution in (X, Y)
signal-space and than determine to which distribution an acquired (X, Y) pair
corresponds.
y
x Figure 2.11: Diagram of Siemens CT! ECAT HR+ PET scanner detector block
27

When the absorption of the annihilation photon happens, there are a certain
number of scintillation photons that are produced in each crystal. Those photons are
shared among the four PMT's and the accuracy of crystal identification will be limited
by the statistical variation of the signaIs. Assuming that a mean of N photons are
produced, NAc photons are collected by PMTs A and N-NAC are collected by PMTs B
and D, the probability distribution of the number of photons (n) collected by PMTs A
plus C can be described by the normal approximation of the binominal distribution: 11,15
1 _(n-J.1)2
ipX(n) = e 2".2. ,
a-.j2:r (2.9)
h NACc 1 N d ~ w erep=--,q= -p,Jl= AC an a="Ijlvpq. N
This is the expression for the x-direction and similar one is valid for y-direction.
Setting the value for N to be 200, the expression (2.9) can be evaluated for different
values of p and q ( different values of Il and cr) that give the optimum separation of the
distribution of each crystal from those of the other crystals. An example how these
distributions look like, calculated for certain value of N by fixing the ratio of the signaIs
from left PMTs and signaIs from right PMTs to be 1,7/8,6/8,5/8,4/8,3/8,2/8 and 1/8 and
changing the values of Il and cr is shown in Figure 2.12. Figure 2.12 shows the
calculated spread in X positions calculated from Equation (2.7) and assuming a
binominal distribution in the number of collected light photons by the four PMTs. Each
peak represents one crystal element. The overlap between the curves is the uncertainty in
crystal identification.
28

The centers of the distributions from each element in the array are separated in
regular intervals. This model does not take into account the variations caused by
differences in light collection among individual crystals in the block, the variation in
light output between elements, the variations in energy depositions in the crystals,
variation in photo-cathode sensitivity and the presence of inter-crystal scatter.
fi) .... s::: :::J o () .... o
=tt:
1 2 3 4 5 6 7 8
rI A \ ' l ' 'r ' 'i \ \ \ Î i f\!\! \ ! \ . \ 1\ f\!/\ 1 \ 1 \ 1 li
1 \ /\ '/ \X/ \~!,! \ 1 \~I \ / \ 1 \/ J, ,,' \1, \ \, 1 \ 'A ' ~ \/ \ ~ / \ ~~~\_~~~""_ ... ".~ .... X
Figure 2.12 : Binominal distribution
The measured probability distribution is different from this ideal mode!. If the
four output signaIs from the block detector are properly balanced, the crystal
identification matrix is obtained from flood irradiating the block detector and forming a
2-dimensional histogram by incrementing the matrix location with coordinates (X, Y)
obtained by summing equations 2.7 and 2.8 by the matrix dimensions. This is presented
in Figure 2.13. The crystal identification matrix gives measured two-dimensional
probability distribution of X and Y positions. Each peak represents a different crystal in
the block detector. Although the distribution presented in Figure 2.12 in general agrees
with those in Figure 2.13, one can see that the peaks are not perfectly aligned along the
rows and columns. The presence of detector spatial non-linearity is bigger in the
detected inter-crystal spacing near periphery. By drawing boundaries around each of the
29

visible crystal elements, each raw event may be mapped to one of the crystals of the
detector block. This process generates a crystal identification matrix. The positioning
accuracy is better for crystals at the edge compared to crystals in the center because the
central crystals are surrounded by more scattering medium (other crystals). The
probability of scatter from one crystal to an adjacent one is higher than for crystal at the
edge. Design of block detector purposely decouple the edge detectors by cutting the
block through its entire depth to get good perimeter positioning response while
apparently sacrificing energy resolution in those elements, being the poorest for those
edge elements ofblock crystal.
Figure 2.13: Crystal identification matrix obtained from flood-field irradiating the block detector
Since there is a misalignment in crystal identification matrix, which causes the
positioning problems, a method for decoding is required. One of them is the following.
From the two-dimensional probability distributions obtained with the flood source, a
two-dimensional look-up table (LUT) is created by drawing regions of interest (ROI)
around each peak and assigning a crystal index to aH points within that region. The
30

crystal is identified by the correspondence between the X and Y positioning values and
the LUT.
2.5 Coincidence Detection in PET Scanners
The basic characteristics of coincidence detection
Detectors described above are mounted as separate units in PET scanners in rings
which surround the patient. Once the patient is placed in the scanner, the localization
and the concentration of the injected isotope is detected in following way. Both of the
annihilation photons penetrate the patient and must escape from the patient to be
detected. These are detected with detectors in a ring that encircles the patient. Detectors
in the ring are connected through coincidence circuit (Figure 2.14).
" ......... _~-" ...... ..
Coincidence 1
Circuit I+---r ....... ___ l Output
Figure 2.14: Schematic diagram of the detection with PET
When a pair of photon detectors simultaneously detect 511 ke V photons, a
positron is known to have annihilated somewhere on the line connecting the two
detectors. If the annihilation originates outside the volume between the two detectors,
31

only one of the photons can be detected, and since the detection of a single photon does
not satisfy the coincidence detection, the event is rejected. Even though both photons are
emitted simultaneously, they may not be detected at exactly the same time. So, a short
time window is set, during which pairs of annihilation photons are considered to be in
coincidence. This window is typically in the range of 8-16 ns. If the detected signaIs
arrive in a specified time interval, two gamma rays are considered to be in coincident.
Annihilation coincidence detection in PET provides an electronic collimation and
localization of the origin of the gamma rays along a Hne between the detectors. 16, 17
The line joining two detectors is referred as a Hne of response (LOR) (Figure
2.14). The set of alllines connecting detectors makes the set of projections to perform
two dimensional image of the isotope distribution in the plane defined by the tomograph
nng.
A typical PET scanner consists of several circular arrays of photon detectors,
with each detector placed in time coincidence with each of the individual detectors on
the opposite side of the rings (Figure 2.14). Modem PET systems typically have more
than 10,000 detector elements arranged in rings surrounding the patient. These detector
elements form over 20,000,000 possible coincidence combinations.
Image Formation
The near-simultaneously detection of a pair of annihilation photons represents
one event or count in the image. During the PET scan all the counts are identified. Then
a memory locations associated with each Hne of response are incremented. The data
acquired by a PET scanner represents the sUffi or integral of radioactivity along the lines
connecting any given pair of detectors, referred to as LORs.
32

The memory arrays used for raw data storage are referred as "sinograms". This
format of data storage is the most suitable for direct use by most of standard image
reconstruction programs. The raw data from which image may be processed, consists of
a series of line integrals, (commonly referred to as "projections"), of line passing
through the subject at various angles. Each projection represents the total numbers of
coincidence counts along the associated projection line. Projections are arranged in
sinogram in such a way that vertical axis represents the projection angle and horizontal
axes the projection distance from the center of the ring.
a) b)
Figure 2.15: Coincidence sampling paths in PET scanners: a) at any given angle (parallel- beam response) and b) over many angles (fan-beam response )
Each detector in PET scanner can be operated in multiple coincidences with
many detectors across from it, defining coincidence sampling paths over many angles
which are caUed fan-beam response (Figure 2.I5.b). Aiso at any given angle many
paraUel coincidence lines can be defined, resulting in high "linear sampling" (Figure
2.I5.a). These sampling features affect final image quality. The tomograph
reconstruction software than takes the coincidence events measured at aU angles and
linear positions to reconstruct an image that gives localization and concentration of
positron emitting radioisotope within a plane of the organ that was scanned.
33
Most reconstruction algorithms for PET can be classified into two general
approaches: reconstruction by filtered back projection (FBP) and iterative reconstruction.
FBP is a method that reconstructs images from their projections. This involves two
princip le steps: filtering the projections and then back-projecting them to create the
reconstructed image. Rather than using an analytical solution to produce an image from
the projection data, iterative reconstruction technique makes a series of estimates of the
image, compares forward-projections ofthese estimates to the measured data, and refines
the estimates by optimizing an objective function until a satisfactory result is obtained. 16
PET Acquisition Modes
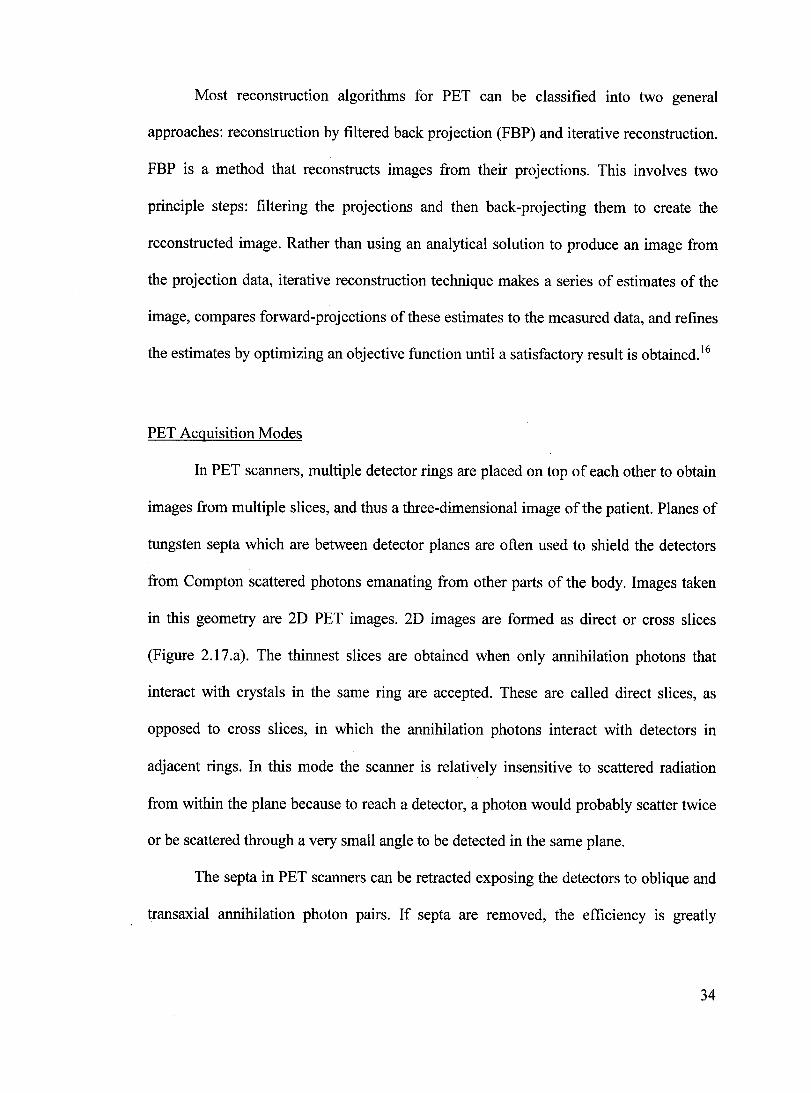
In PET scanners, multiple detector rings are placed on top of each other to obtain
images from multiple slices, and thus a three-dimensional image of the patient. Planes of
tungsten septa which are between detector planes are often used to shield the detectors
from Compton scattered photons emanating from other parts of the body. Images taken
in this geometry are 2D PET images. 2D images are formed as direct or cross slices
(Figure 2.17.a). The thinnest slices are obtained when only annihilation photons that
interact with crystals in the same ring are accepted. These are called direct slices, as
opposed to cross slices, in which the annihilation photons interact with detectors in
adjacent rings. In this mode the scanner is relatively insensitive to scattered radiation
from within the plane because to reach a detector, a photon would probably scatter twice
or be scattered through a very small angle to be detected in the same plane.
The septa in PET scanners can be retracted exposing the detectors to oblique and
transaxial annihilation photon pairs. If septa are removed, the efficiency is greatly
34
increased but backgrounds from Compton scattering in the patient also increase
significantly. This mode of operation is 3D PET mode. In most cases, the additional
scattered rays have scattered only once in 3D imaging, so correction algorithms based on
single, rather than multiple, scattering can be used and do very well in correcting the
image for the loss of contrast due to the detection of scattered radiation.
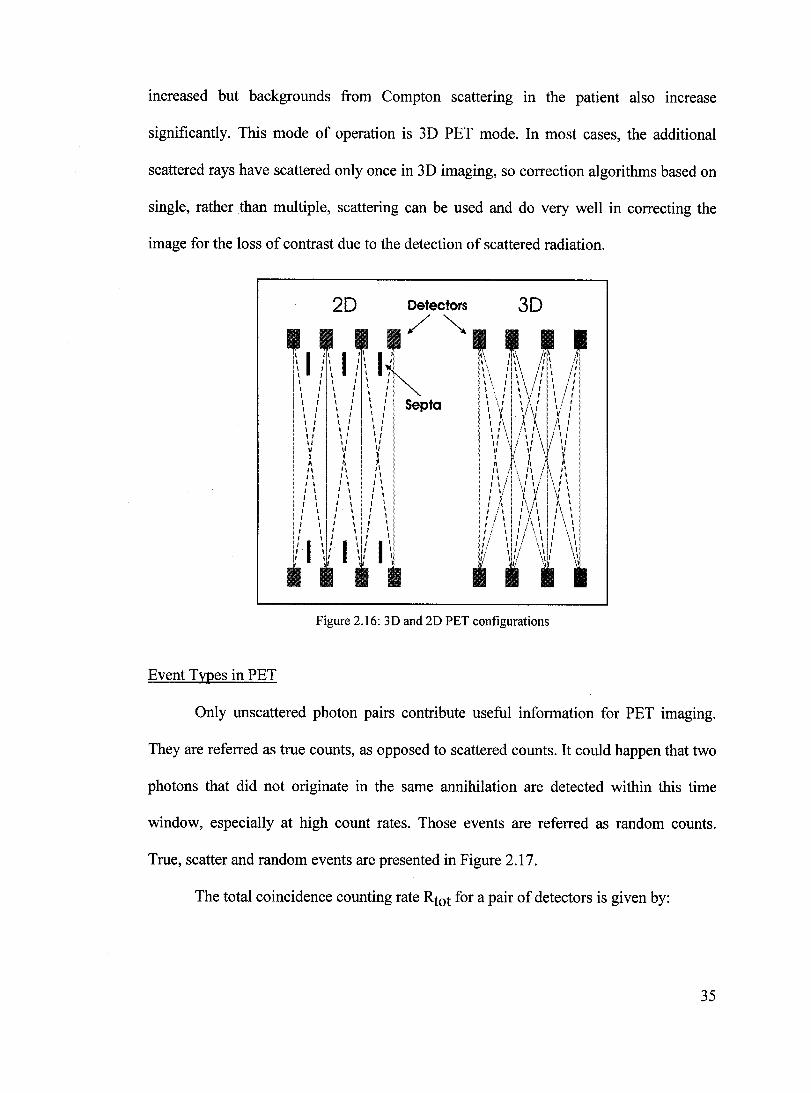
Event Types in PET
2D
~ 1 1\ l ,II l' if' 1 1 , , \ , \ , , \ 1 1 1 l ,\ , l , , l \ ,t 1 , , 1 l , 1 \ , , 1 1 1 \, 1 l , 1 1 1 \' 1 1
l' l' " , , l' l, l' t 1 \, 1 Il \ , " U l' l, 1 1 l, fi ~ ~ 1 Il '1 ,1 Il , , " 1 1 \ " J 1 1
" 1 \ 1 \ '1 ' 1 , 1 " , 1 1 \ 1 1
: \ : 1 : li; 1 1 1 \ , , l " ,1 1
: 1 \ : 1 ~: 1'1 , " " 1 , ,Ill ' , ,
Oetectors
/~
Septa
Figure 2.l6: 3D and 2D PET configurations
Only unscattered photon pairs contribute useful information for PET imaging.
They are referred as true counts, as opposed to scattered counts. It could happen that two
photons that did not originate in the same annihilation are detected within this time
window, especially at high count rates. Those events are referred as random counts.
True, scatter and random events are presented in Figure 2.17.
The total coincidence counting rate Rtot for a pair of detectors is given by:
35

(2.1 0)
where Rsc represents scattered counts, Rtrue is number of true counts and Rran refers to
random counts.
True Sca1ter Random
Figure 2.17: True, scatter and random events in PET imaging
When annihilation photons are scattered before reaching the detector, the LOR
joining the two detectors does not passes through the point of annihilation, producing a
loss of contrast. The contrast can be restored by making an estimate of scattered counts
in each LOR and subtracting it from the observed counts.
Random counts are unique to PET imaging since they arise from the coincidence
requirement. They can be estimated and removed to prevent a loss of image contrast.
Random counts Rran arise when two photons from different annihilations strike two
detectors nearly simultaneously. Each detector records many single counts for each
coincidence count. When there is a lot of activity, it is very likely that two of these
single counts will occur within the coincidence time window 't. If two crystals have
single rates ofRsl and RS2 then random count rate Rran for these detectors is:
36

(2.11 )
To obtain the true count rate associated with any line of response, Rtrue must be
ca1culated:
(2.12)
Attenuation Correction
PET is . considered a quantitative imaging technique, so the images can be
calibrated in units of activity concentration (kBq/mm or nCi/mm). In order that this is
correct, the images must be corrected for the effects of attenuation. The mass attenuation
coefficient of water which is tissue equivalent, at 511 keV is 0.097 cm- I.I For a big
patient, the attenuation can cause the transmitted photons to be significantly reduced and
attenuation correction is necessary to obtain proper PET image.
Annihilated photons produced in the body travel certain distance or thickness
through the body. If one ofthem travels distance dl and the other d2, (Figure 2.18), then
the probability of each ofthem emerging from the body is e-Ildl and e-lld2 (Il is the linear
attenuation coefficient for 511 ke V in tissue), but the probability of both of them
emerging is the product of the probabilities which gives the attenuation correction factor
as shown in the following equation :
(2.13)
where D is the total path length through the body. The equation (2.13) shows that the
attenuation along a particular LOR is independent of the point at which the positron
annihilates. By assuming the attenuation coefficient (Il) and estimating the path length
37

(D), the attenuation correction can be done. A major advantage of this method is that
there is no statistical noise associated with the correction. But there are limitations of
this approach which are: variations in /-l are not easily accounted for, and D is not always
easy to determine accurately.
Figure 2.18: Illustration of the independent of the attenuation on the location of the annihilation along the LOR
The measurement of attenuation correction can be done directly by measuring the
transmission (with patient in the scan's field) and blank scans (with nothing in scan
field). Both scans are performed using radioactive sources that are rotated around the
patient, but in front of the detectors. To form an image or to provide data for attenuation
correction, the number of events in each bin of the transmission scan's sinogram is
divided into the number of events obtained during the equivalent time during a blank
scan. The ratio between these two measures is used , ray by ray, to correct the emission
projection data. The resulting ratio sinogram is produced and is used to correct the
emission counts in each bin while reconstructing the emission scan.
38
References
1 H. E. Johns and J. R. Cunningham" The Physics of Radiology", Charles C. Thomas Publisher, Springfield, Illinois (1983).
2F. H. Attix "Introduction to Radiological Physics and Radiation Dosimetry", John Wiley & Sons, lnc. (1986).
3 G. H. Knoll "Radiation Detection and Measurement", Wiley, (1979). 4 W.W. Moses and S. E. Derenzo, "Scintillators for Positron Emission Tomography", presented at SCINT,
Delft, The Netherlands (1995). 5 M. J. Weber and R. R. Monchamp "Luminescence ofBi4Ge3012 Spectral and Decay Properties",
J.Appl. Phys. ,44: 12,5436-5439 (1973). 6 S. E. Derenzo "Comparison of Detector Materials for Time ofFlight Positron Emission Tomography",
IEEE Workshop on Time of Flight Tomography, St. Louis, p 63-68, (1982). 7 D. R. Carter "Photomultiplier Handbook", Burie Technologist Inc., Lancester, USA, (1989). 8 W. W. Moses, S. E. Derenzo and T. F. Budinger" PET Detector Models Based on Novel Detector
Technologies", Nue/. Instr. Meth A-353 :189-194 (1994). 91. Robertson, R. Marr, B. Rosenbaum " Thirty-two crystal positron transverse section detector"
Freedman G., ed. "Tomographic Imaging in Nuclear Medicine", New york Society ofNuclear Medicine, p. 151-153 (1973).
JO S. Derenzo, T. Budinger, J. Cahoon et al. "The Donner 280 crystal high resolution positron tomograph", IEEE Trans. Nucl. Sci. 26, 2790-2793 (1979).
Il M.E. Casey, R. Nutt " A multicrystal two dimensional BGO detector system for Positron Emission Tomography", IEEE Trans. Nue/. Sci. 33, 460-463 (1986).
12 M. P. Tomai, G. Germano and EJ. Hoffinan" Positioning and energy response of PET block Detectors with Different Light Sharing Schemes" IEEE Trans. Nucl. Sci. NS-41, 1458-1463 (1994).
13 W. W. Moses, S.E. Derenzo and T. F. Budinger" PET detector modules based on novel detector technologies", Nucl. Instr. Meth. A-353, 189-194 (1994).
14 H. Anger "Gamma-ray and Position Scintillation cameras". Nucleonics 21,56-59 (1963). 15 M. Dahlbom and E. J. Hoffinan "An evaluation oftwo-dimensional array detector for high resolution
PET," IEEE Trans. Med. Imaging7 (4), (1988). 16 "Principles and Practice of Positron Emission Tomography," ed. by R. L. Wahl, L. Williams and
Wilkins, Philadelphia 2002. 17 A. B. Wolbarst "Physics ofRadiology," Appleton and Lange, Norwalk, Connecticut (1993).
39
CHAPTER3
P ARAMETERS IN PET
Important parameters which are used to describe PET are: detector efficiency
(the probability that the detector registers an event when gamma ray intersects the
detector), system sensitivity (the number of events registered by the scanner per unit
activity), time resolution (the ability to accurately determine coincidence events), count
rate capability (the ability of the scanner to record events at high count rates) and spatial
resolution (the ability to distinguish closely spaced objects).
3.1 Spatial Resolution in PET
The resolution or resolving capability of an imaging instrument indicates the
ability of that instrument to separate small closely separated details in the image. The
intrinsic resolution in PET is the resolution of the individual detector pairs in the system.
It is usually given in terms of line spread function (LSF) of a pair of detectors at the
center of field of view (FOV), which is than referred as coincidence aperture function
(CAF). It can be specified as a full width at half maximum (FWHM) of the measured
CAF. The intrinsic resolution defines the limit of resolution of the particular PET
system. The resolution in a PET image depends not only on intrinsic resolution but also
on a number of factors in which the image is obtained.!
In PET, the spatial resolution is limited by several factors. These are divided into
theoretical limits and practical limits. Two theoretical limits, which affect the spatial
resolution, are finite positron range and non-colinearity of the annihilation gamma rays.
40

Practicallimits -the width of the scanner's crystal and the block effect in block detector,
determine the best possible resolution for individual PET scanner. The spatial resolution
also depends on the number of factors in the manner in which the image reconstruction
is obtained. AU these factors affecting the spatial resolution are illustrated in Figure 3.1.
Factor
Positron Range
Photon Non-colinearity
Detector Crystal Width
Block Effect
..... --r.\-{(~!~ '., ___ ,/ 180·±O.25°
Reconstruction
Shape
A
Multiplicative
FWHM
0.5 mm (18F) 4.5 mm (82 Rb)
1.3 mm (head) 2.1 mm (heart)
cw/2
Subject of this project
1.25 (in-plane) 1.00 (axial)
Figure 3.1: Factors affecting the spatial resolution in PET
The first theoreticallimit on the spatial resolution in PET is the finite range of the
positrons before annihilation. One of the basic assumptions in PET is that the measured
location of the annihilation positron is also the location of the decaying isotope. This is
just an approximation. An emitted positron does not annihilate immediately but it travels
certain distance in the medium before losing its kinetic energy. The coincident detection
of the annihilation gamma rays localizes the annihilation event, not the localization of
41

the parent nucleus (Figure 3.2). This introduces a blurring into the image, reducing
spatial resolution.
Real positron emission position
LOR assumed by PET
Figure 3.2: Positron range error
The uncertainty or resolution loss due to the positron range in tissue before
annihilation depends on the energy of the emitted positrons, which is isotope dependent.
For most positron emitters the maximum range in soft tissue is 2-20 mm and is given in
Table 3.1. However, the positron range error on spatial resolution in PET is much
smaUer for several reasons. First reason is that positrons are emitted with a spectrum of
energy and only a smaU fraction travel the maximum range. The average positron energy
emitted is approximately 1/3-1/2 of the maximum energy. The total path length the
positron travel is not along a straight line. Through inelastic interactions with electrons,
the positron path is deflected. The distance from the parent nucleus is therefore much
shorter. The other reason is that sorne component of the positron trajectory likely will be
42
along LOR and there is no error if positron annihilates along LOR. Thus, the resolution
limit is much smaller than the maximum positron range (Table 3.1). For 18F, which
produces a comparatively low-energy positron, the resolution broadening due to positron
range is 0.22 mm FWHM? There are sorne investigations about improving spatial
resolution conceming the positron range error that suggest to confine the positron using
a magnetic field, but the magnitude of the field required is very high.3
Table 3.1: Maximum energy, maximum range and the blurring in spatial resolution caused by finite positron range for isotopes most commonly used in PET
Isotope Emax [keV] MaxRange [mm] FWHM [mm]
18F 663 2.6 0.22
Ile 960 4.2 0.28
13N 1200 5.4 0.35
150 1740 8.4 1.22
82Rb 3200 17.1 2.60
The second limit on spatial resolution is introduced by non-colinearity of the
annihilation gamma rays. This effect is illustrated in Figure 3.3. Deviation from exact
180-degree emission of annihilation photons results from the fact that the positron-
electron pair is not completely at rest when annihilation occurs. Because the angular
deviation cannot be determined on event basis, localizing the site of annihilation
inv01ves an assumption that the gamma rays were emitted in exact1y opposite direction.
The angular spread is represented by Gaussian distribution with FWHM of about 0.5
degree for aU materials.4 The magnitude of the resolution 10ss due to the angu1ar
deviation increases linear1y with detector separation and is given by:
43
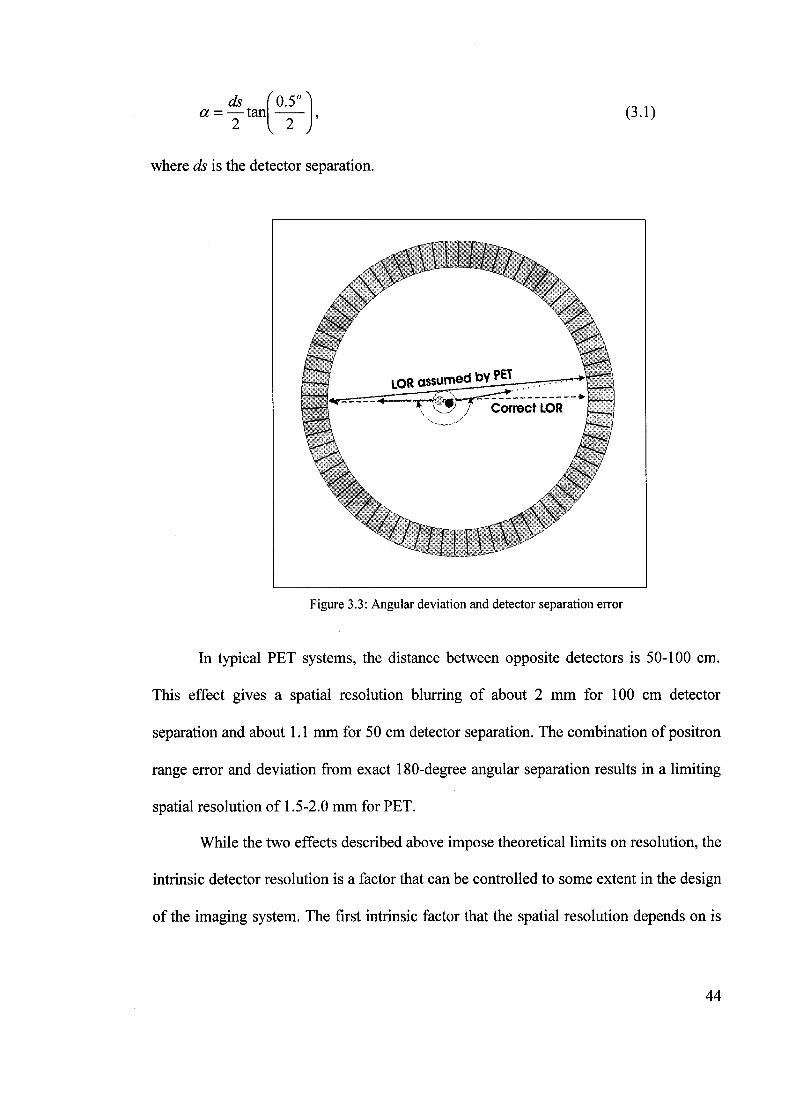
a=-tan --ds (0.50
)
22' (3.1)
where ds is the detector separation.
LOR QSsumed bY PEt
-------------., Correct LOR
Figure 3.3: Angular deviation and detector separation error
In typical PET systems, the distance between opposite detectors is 50-100 cm.
This effect gives a spatial resolution blurring of about 2 mm for 100 cm detector
separation and about 1.1 mm for 50 cm detector separation. The combination of positron
range error and deviation from exact 180-degree angular separation results in a limiting
spatial resolution of 1.5-2.0 mm for PET.
While the two effects described above impose theoreticallimits on resolution, the
intrinsic detector resolution is a factor that can be controlled to sorne extent in the design
of the imaging system. The tirst intrinsic factor that the spatial resolution depends on is
44

crystal width; the LOR is really a "tube" of response (Figure 3.4). For most detector
material and shapes used in PET blurring introduced by this effect is a 0.5 times the
width of individual detector element. Smaller crystals are more expensive, and if each
(of the over 10,000 crystals in modern PET scanner) has its individual readout, the PET
scanner would be un-affordable. Resolution cannot be improved indefinitely by simply
reducing the crystal width. As the crystal width is decreased, Compton scatter from
surrounding crystals degrade the system resolution. Accordingly, the optimum crystal
width should be chosen.
Figure 3.4: Crystal width error
However, when block detectors are used there is an additional blurring due to the
use of crystal arrays called block detectors which are described in chapter 2, section 2.4.
This effect degrades the spatial resolution and it has been referred to as the "block
effect" .
The measured resolution of the system is a convolution of the various resolution
components. If the different resolution components are assumed to be Gaussian in shape
45

and are described by FWHM, than the combined resolution is the squared sum of the
individual resolution components. The formula, which summarizes the various factors
affecting the spatial resolution, is given by5:
(3.2)
where pr is the blurring in image caused by the finite range of the positrons before
annihilation, ss is the blurring caused by finite source size, 0.0022=1I2·tan(0.5°/2) is due
to the 0.5° non-colinearity of the annihilation gamma rays, ds is the detector separation,
cw is the blurring introduced by the crystal width, be is the additional blurring due to the
use of block detector, and 1.25 is factor that describes the degradation of SR due to the
image reconstruction. AlI the quantities in Eq. (3.2) are given in millimeters.
3.2 Motivation
Ideaily, the value in each pixel of a PET image is equal to the concentration of
positron emitter at the point in the patient's body. In practice, as in aIl measurements,
there are sources of error in the technique and an understanding of these sources of error
is required for proper interpretation of results of PET measurements. The primary
limitation in PET is spatial resolution. Po or spatial resolution can affect quantitative PET
measurements by causing difficulty in interpretation of the anatomy for identification of
the structure of interest. It can cause overestimations in the size of structures smaIler
than twice the resolution distance of the PET system, it can cause reducing the apparent
isotope concentration in structures that are smaller than about twice the system
resolution and it can low sensitivity in the detection of smaIllow contrast lesions.
46

PET scanners which have the detectors with single crystals, coupled to individual
photo-multiplier tubes (PMTs), described in chapter 2 have very good performance, but
they are very expensive, particularly when the crystals are made very smaU to optimize
the spatial resolution. In order to reduce the scanner's cost, most modem PET scanners
use the block detectors in which up to 64 crystals are coupled to 4 PMTs and use light
sharing schemes to identify the crystal. The block detectors are much cheaper than those
with 1: 1 coupling between crystal and PMTs, but there is the uncertainty in
determination of the location of the event within a block effect with multiple crystal
elements. In such detectors modalities there is an additional degradation of spatial
resolution in PET images caused by the use of crystal array.
Until now, the block effect was reportedS, 6 and Roger Lecompte coUected sorne
data,1 mostly explaining that SR is better in scanner with one to one coupling between
crystals and PMTs than when block detectors are used.
The Figure 3.5 represents the results of the measurements of the SR, performed on
different PET scanners as a function of crystal size, which are obtained by subtracting
the non-colinearity, positron range and source size effect on spatial resolution. Those
data are coUected by Roger Lecomte. According to those data, the spatial resolution for
a certain detector size that is obtained from the scanners with 1: 1 coupling between
crystal and PMT is better than spatial resolution for scanners that use block detectors.
The degradation of spatial resolution in PET scanners due to the use of block detectors,
according to those measurements, is 2.3 mm when light sharing is used and 1.2 mm
when no light sharing is used.
47

3.5
3 -E E 2.5 -c 0
2 .--::J -0 œ 1.5 Q)
0:::
Hammersmïth • • RatPET
ExactHR • IUCLA) (CTI)
SHR-2000 • Tomitôlni "'-(Ham am ats u)
TierPET (Juiich) t MicroPET (UCLA) À YAPPET (Ferrara)
DonnerGOO
MADPET {M.mien) II1II
(Berkelev) il APD.BGO
(Shel1uooke)
:aE 1 J: HH1AC • Light Sharing (b-2.3 mm)
~ LL
0.5
 A Electronic Coding (b-1.2 mm)
II Individual Coupling (b-O mm)
Crystal Resolution (dI2)
o 1 1 1
0 1 2 3 4 Crystal Size (mm)
Figure 3.5: Spatial resolution in different PET scanners as a function of crystal width.7
So far, there is no work done to try to understand the fundamental cause of the
block effect. This work is done in order to estimate the "block effect" in order to find the
explanation for this effect to be presented in PET scanners with block detectors.
In our opinion, if the precise cause of this effect was better understood, it may be
possible to design an encoded PET detector in which the block effect could be reduced
or eliminated providing better SR and comparable detector cost.
3.3 The Possible Causes of the Block Effect
There are several possible causes of the block effect which occur during the
process of gamma ray entering the detector, gamma ray penetration and interactions in
the crystals, light sharing in the block, as well as in process of determination of centroids
48
5

of interactions and signal decoding, and image reconstruction. Those errors are due to :
multiple interactions of the gamma ray within the block, light transport in the
scintillation crystal as a function of interaction depth, additional electronic noise due to
the use of at least four light sensors (PMTs), errors estimating the crystal's centroid of
interaction, errors in the crystal identification matrix and under-sampling of the image
space with stationary detectors.
When 511 ke V gamma rays incidents on the detector face, it makes its first
interaction with crystal. If this is a photoelectric event, the gamma ray is allocated to this
crystal. If it is a Compton interaction, the scattered ray may take further interactions in
the block. Since most 511 ke V gamma rays undergo Compton scattering in the crystal
before being photo-electrically absorbed, it changes the response of the crystal
depending on their position in the block and the angle of incidence of gamma rays on the
block. So, besides the positron range error, non-colinearity, finite crystal width and
block effect, there is another blurring effect on spatial resolution, which is caused by
relatively low photo-electric interaction probability compared to Compton scattering of
gamma rays in commonly used scintillators.
The total attenuation coefficient (Ptot) at 511 ke V is the sum of the photoelectric
(J-LPE), Compton (pc) and Rayleigh (PR) attenuation coefficients:
PIOI = PPE + Pc + PR . (3.3)
In the case of 511 ke V photons, the Rayleigh scattering is negligible. The
probability of the photo effect to happen can be expressed as the ratio of photoelectric
attenuation coefficient and total attenuation coefficients (PPF/ Ptot). It can be compared to
the probability of Compton scattering, which is the ratio of Compton attenuation
49

coefficient and total attenuation coefficients (;icI J.1tot). Knowing the chemical
composition of the scintillators, it is possible to calculate J.1tot, J.1PE, and Jlc and to
compare the values of linear attenuation coefficient for photo-effect and Compton effect.
The probability that photo-electric absorption happens when gamma-rays interact with
scintillators, accounts for less than half of the total attenuation coefficient and the values
for sorne of the scintillators are calculated to be:
J.1pFlJ.1tot =45 % (for BGO),
J.1pFlJ.1tot =15 % (for NaI), and
J.1pFlJ.1tot = 30 % (for LSO).
This implies that the most of the scintillation light will not originate from the point
where the gamma ray first interacts with the detector. In PET scanners, this can results in
miss-positioning of annihilation events. As crystal dimensions are made smaller, the
fraction of miss-positioning events increases. For smaller detector separations, scatter
from neighboring crystals is the major source of resolution loss. Results reported in
literature suggest that spatial resolution cannot be improved by reducing crystal width to
less than 1 mm.8
Once gamma rays interact with scintillator through the photo-effect, they pro duce
light photons. By looking at the distribution of the detected light photons resulting from
a gamma-ray interaction, it is possible to determine from which crystal the light cornes
from. However, this method does not give the information of the height of interaction,
which again could produce additional degradation of spatial resolution. There are sorne
works that can be found in literature, which reported improving of spatial resolution by
determining the origin of the light appears viewed by array of photo-sensors.9
50

The obtained effective centers of interactions of gamma rays within the crystals
are referred to as centroid of interaction. Since gamma rays interact within crystal
through photo-effect, Compton effect and have multiple interactions, the effective center
is not geometric center of the crystal and it is usually calculated using Monte Carlo
program. If the crystal is at the edge of the block, the Compton scattered ray can escape
from the block. Because of that, the centroids of interaction for edge crystals are moved
towards the center of the crystal to the geometrical centers of the crystals. Therefore,
crystals may appear to be packed closer together than the distance between their
geometric centers. There have been sorne work reported in literature in which the
centroids of interaction are determined instead of assuming that crystals are uniformly
spaced and it was reported that that the spatial resolution of PET scanners could be
improved if the" effective centers of interactions" of gamma rays within the crystals are
determined.lo, II
When light is produced in the scintillator, it is registered with light sensor
devices that convert it to electrical signal. Additional electronic noise due to the use of
four PMTs could pro duce noise in the PET images and further de grade the spatial
resolution in PET scanners using block detectors.
The width and separation of the crystals in the block determine the frequency at
which gamma ray interactions with the detector are sampled. Basic rules of imaging
require that the Nyquist frequency of the imaging system is higher than the maximum
frequency to be found in the imaged object. If the sampling distance of an imaging
system is d, than the Nyquist frequency for that system is 1/(2d). Object with spatial
frequency greater than 1/(2d) produce artifacts in the image. Accordingly, the block
detector and scanner ring design could impose under-sampling of the image space.
51
References
l "Positron Emission Tomography and Autoradiography: Princip les and Applications for the Brain and Heart", edited by M. Phelps, J. Mazziotta and H. Schelbert, Raven Press, New York 1986.
21. Sorenson, M. Phelps, Physics in Nuclear Medicine, Second Edition, W. B. Saunders Company, Philadelphia (1987).
3 H. Ida, 1. Kanno, S. Miura, M. Mrakami, K. Takahashi and K. Uemura" A simulation study of a method to reduce positron annihilation spread distributions using a strong magnetic field in positron emission tomography", IEEE Trans. Nuc/. Sei. 33, (1) 597-600 (1986).
4 S. D. Benedeti, C. Cowan et al. " On angular distribution oftwo-photons annihilation radiation", Physic Review 77, (1950).
5 W.W. Moses, S. E. Derenzo, "Empirical observation ofresolution degradation in positron emission tomographs utilizing block detectors", J. Nue!. Med. 33, (5) 10 1 (abstract)(1993).
6M. E. Casey, L. Eriksson, M. Shmand et al. "Investigation ofLSO crystals for high spatial resolution PET", IEEE Trans. Nue!. Sei. 77, (44) 1109-11l3 (1997).
7 R. Lecomte, Sherbrook University, personal communication. 8 K. Murthy, " A Study of the Effects of Detector width and depth on Spatial Resolution in Positron
Emission Tomography", (1993). 9 F. Cayouette, C. J. Thompson and C. Moissan" Monte-Carlo Modeling of Scintillator crystal
Performance for Stratified PET Detectors", IEEE Trans. Nue!. Sei. 49 (3), 624-628 (2002). \0 C. J. Thompson, J. Moreno-Cantu and Y. Picard" PETS lM : Monte Carlo Simulation ofall Sensitivity
and Resolution Parameters of Positron Imaging Systems ", Phys. Med. Biol. 37 (3), 731-749 (1992). 11 Y. Picard and C. 1. Thompson" Determination of the centroid of interaction of crystals in block
detectors in PET", IEEE Trans. Nuc/. 41 (4), 1464-1468 (1994).
52

CHAPTER4
MATERIALS AND METHODS
4.1 Introduction
Spatial resolution of a pair of detectors in coincidence is described by the FWHM
of the coincidence aperture function. In practice, the coincidence aperture function is
blurred due to the several reasons, which are positron range, the non-colinearity of the
annihilation photons, the source size and the crystal size. In block detectors, the spatial
resolution is further degraded due to the use of crystal array. AU these factors are
described in chapter 3 and the Equation 3.2 takes them all into account, as well as
factors due to the way of reconstruction algorithms being applied. Scatter and multiple
interactions further degrade the spatial resolution of detectors in a block. The spatial
resolution experiments in this study were performed to estimate the block effect and to
investigate the actual cause of the block effect.
In order to investigate the block effect, it is necessary to determine spatial
resolution in the case when only single crystal detectors are in coincidence, then when
crystals in the block detector are in coincidence with single crystals and compare the
results.
Accordingly, we have performed experiments to measure coincidence aperture
functions (CAF) of various BOO crystals being in coincidence. The measurements were
done by moving the detectors in coincidence white the source of 511 ke V annihilation
gamma ray was fixed positioned The FWHMs of the corresponding CAFs were
determined and compared to be able to estimate the magnitude of the block effect.
53

4.2 Materials
4.2.1 Source of 511 keV Gamma Rays
Experiments, which are described in this thesis, were performed using 68Ge as a
source for 511 ke V annihilation photons. A very small, 1.4 mCi activity positron emitter
68Ge was encased and sealed in a stainless steel. The source was purchased from Sanders
Medical Products Inc. The decay scheme of 68Ge is presented in Figure 4.1. 68Ge goes
through electron conversion into 68Ga. Afterwards 68Ga transforms into stable 68Zn
(Z=30) by electron capture or by positron emission. Therefore, 68Ga emits positrons by
two different decay modes. 3% of the positrons are formed by the first mode called BI
decay mode and have energy 1.077 MeV, while 97% of the time 1.88 MeV positrons are
formed by B2 decay mode. The positrons annihilate in steel to produce two 511 ke V
photons almost collinear to each other.
Ga-68 (67.6 min)
_.....lr......I.. __ rI' 0.0000 Zn-68 (stable)
EC,0.08 %
EC, 0.22 %
P,' 1.10 % EC,1.63 %
P,' 88.00 % EC.8.94 %
Ge-68 (287 d) --.,..--- (0.1060)
EC,100.00%
2.9211 (0.0000)
Figure 4.1: Decay of Ge-68
54

4.2.2 CTI Detector
The detector investigated in this work is identical to that used in the Montreal
Neurological Institute's CTI Ecat Exact HR+ scanner. It was donated by CTI and it has a
solid 38x36x30 mm BGO crystal into which saw cuts of various depths are made. The
detector block has 64 crystals coupled to four PMTs with optical glue. Each crystal has
dimensions of 4.4 mm x 4.1 mm x 30 mm.
In order to locate the crystals within the block, CT! detector was X-rayed at 81 kV,
32 mAs at a distance of 200 cm to visualize the BGO crystal and saw cuts. To show the
metal housing of the module and the PMTs we made a second radiograph using 50 kV,
10 mAs, and source to film distance of 110 cm. A composite picture was made and
glued to the detector to assist in the alignrnent during the experiments. Composite X-ray
radiograph of the CT! HR+ detector is shown in Fig. 4.2. The saw cuts are clearly visible
and the crystal widths of central crystals are 4.4 mm and for edge crystals are 4.2 mm.
Figure 4.2: Radiograph of the cn detector used in this study
55
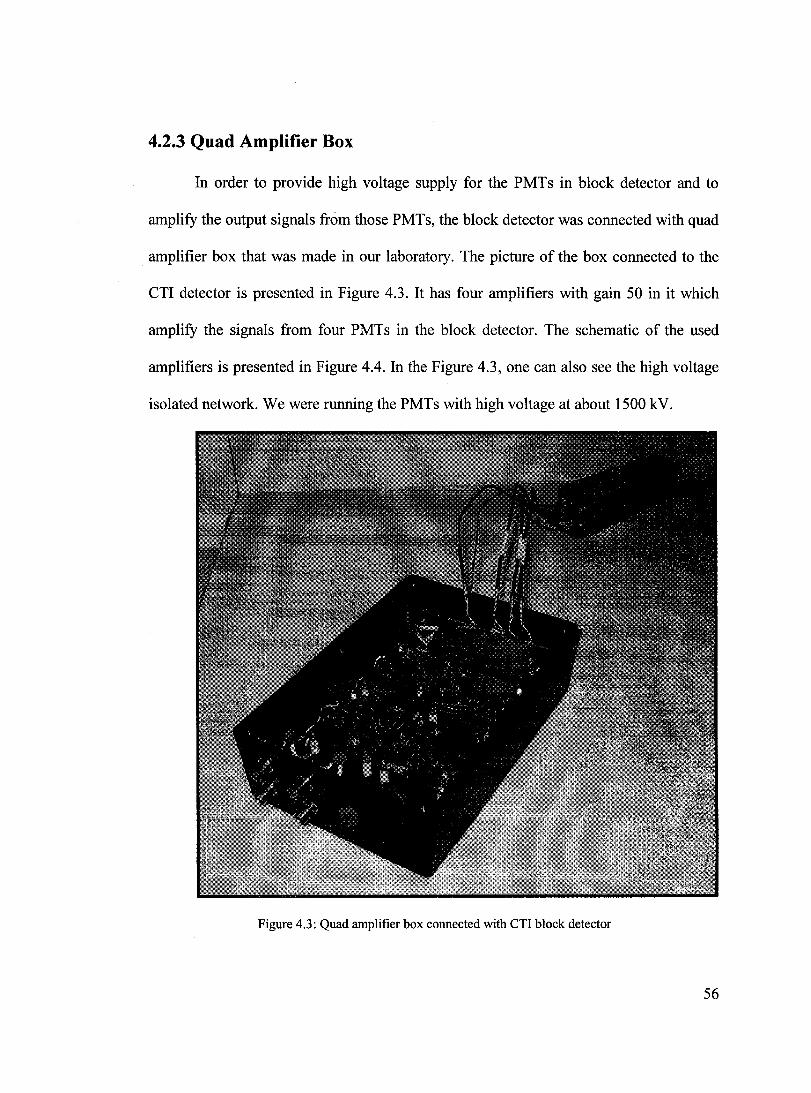
4.2.3 Quad Amplifier Box
In order to provide high voltage supply for the PMTs in block detector and to
amplify the output signaIs from those PMTs, the block detector was connected with quad
amplifier box that was made in our laboratory. The picture of the box connected to the
CTI detector is presented in Figure 4.3. It has four amplifiers with gain 50 in it which
amplify the signaIs from four PMTs in the block detector. The schematic of the used
amplifiers is presented in Figure 4.4. In the Figure 4.3, one can also see the high voltage
isolated network. We were running the PMTs with high voltage at about 1500 kV.
Figure 4.3: Quad amplifier box connected with cn block detector
56

~~ 0",
jJ tll\< ~fZ:j
~l JI. 1Hh' l'IH( Y l ..
il? ...
8!R >!i "'1' "'~
:::" ,I!
o
~
li! W
'" l'li lf::l Ii!R
..-----~,L
"'y
t:l~ Il ~h' Il
o J
if ~ I!!~ , " ::1= .Il
'" ~
~
~i &t~
;1" v
- '" fil", '!il "'- t:~ Ih' -,/' v "J.,r-
f:: Q~
f'III
1
L'::===== ======r===== '====:::3 .. ====z = '=~=====r=====-~ Il
nt-
Figure 4.4: Schematic of the amplifiers assembled in quad amplifier box
57

4.2.4 Single Crystal Detectors
Two 30x20xI mm single BOO crystals were also used in the experiment and those
were purchased from Alpha Spectra Inc. The crystals are polished on all sides and
wrapped with teflon tape in order to increase the reflectivity of the scintillation light.
The singles crystals and Hamamatsu RI548 PMTs along with the same sort as in quad
amplifier box, associated charge-integrating amplifiers were enclosed in light-tight box.
Figure 4.5: Single detector box
Single crystals of 1 mm width are optically coupled with R1548 dual PMT.
Together with the amplifiers and high voltage network they were connected and placed
in the light-tight box (Figure 4.5). The precise alignment of the crystal is very important
in the measurements, which were done in this work. In order to have precise horizontal
58

alignment of two single crystals in coincidence, the firm plastic holder for the crystal
along with the PMT was made.
4.2.5 R1548 Dual PMT
The dual R1548 PMTs are described by Yamashita at al. l They are used in our
experiment to be coupled to single crystal in the single detector box. This kind of PMT
has a fiat, 24x24 mm front face with two 10x20 mm bialkali photo cathodes, each with a
separate ten-stage set of dynodes. Corresponding dynodes from each sector are
electrically connected to the same pin in the PMT base, except for the seventh dynodes,
which are connected to two separate pins in the base. Independent adjustment of the
potentials on the seventh dynodes provides separate gain control of each sector over al:
0.3 range. The maximum voltage that can be applied is 1700V. This tube operates in
cathode ground scheme with anode at a positive high voltage. In our experiments, the
high voltage on R1548 dual PMTs was set in the range from 1200 kV to 1500 kV. The
gains of each PMT sector and high voltage gain were adjusted using potentiometers on
the corresponding dynodes.
4.2.6 The Data Acquisition System
The output signaIs from the four PMTs on the CTI detector were integrated and
amplified. The four signaIs, the sum of these signaIs and the energy signal from the
single PMT were acquired with a Jorway Aurora-12 bit ADC CAMAC module and
saved in a list mode on an Alpha 4/100 workstation.
The way the signaIs are detected is presented on the Figure 4.6. Both single and
block detectors have signal cables for each PMT and require HV connection (about
59

1200V). Two gamma rays coming from the source interact with BGO crystal and they
are converted into the light. This crystal emits photons in the visible range. Than the
visible photons are detected and amplified by PMT, which outputs a pulse of electrical
CUITent whose amplitude is proportional to the incident photon energy. SignaIs from
PMTs were amplified and filtered.
SignaIs from the block detector were summed in summing amplifier. Those
signaIs from single amplifier and summing amplifier provide a signal proportional to the
energy. The PMT signaIs were digitized with 12-bit analog to digital converter (ADe).
Signal from single detector amplifier is going to one discriminator and from summing
amplifier is going to another discriminator. Both energy signaIs were compared with
lower and upper discriminator settings to determine if the photon has an acceptable
energy of 511 ke V. If it does, the discriminator creates the TTL logical signal to go to
the coincidence circuit. If two signaIs are in coincidence, the ADe strobe is sending to
the ADe, from where the signaIs previously digitized are sent to the computer.
(a) Signal Processing Module
Signal processing module was made in our laboratory. It consists of two leading
edge discriminators which are connected to two detectors in the experiment in order to
decide if the signaIs have the right energy of 511 ke V, and the coincidence circuit which
determines if the signaIs are arrived at the same time, as well as voltage divider
necessary for discriminator and coincidence components power supply. The picture of
the module is presented on the Figure 4.7. The front panel for this module was also
made and the module was placed in NIM rack to be used in the experiment.
60

>< <11(,.,
\ \\ \\ \\ \\ ,\ \,
~----------------------------l , 1 1
1
\ \ '\ooi-4l-----.:-".:......, ....... \\ \\
Figure 4,6: Data acquisition system
.. ! i E o (.) G)
1 c o (.)
61

Figure 4.7: Signal processing module
Signal from single detector amplifier and from summing amplifier are going to
corresponding discriminators in the signal-processing module. The schematic of the
discriminators used in this module is presented in Figure 4.8. Both energy signaIs are
compared with lower and upper discriminator settings to determine if the photon has an
acceptable energy of 511 ke V. If it does, the discriminator creates the TTL logical signal
to go to the coincidence circuit. The way the coincidence circuit determines weather two
gamma rays are in coincidence is presented in Figure 4.9. If two signaIs are in
coincidence, the ADC strobe is send to the ADC.
62

0\ li.)
>Tj
~" ..., (1)
~ 00 V1 (") ::r (1)
S ~ 0" 0 ...., Et-(1)
&. '" (")
::!" S 5" ~ 0 ..., '" Il>
'" '" (1)
g. (;) 0-
S" Et-(1)
'" 1iQ" ::s a
1 '0 ..., 0 (") (1)
'" '" 5" (JQ
S 0 0-s:: (;)
Jl1
POS,
[)J
tN<W46
RI J.1.R
l ,.l,l>2 T tN4#6
"~ :t ~ -~-r;,t ;lt/~~
1 1. .". 1:' 1 1 ;,,'"
! i <,11:1
{' IK UL
1" 1~!4 rom ),(10
"',--i' j ~. ,""lI us , , , ru ",fo", ' ~>-"'--~----+---'
c, l r .'JI' i u,.1I<JHC
!*IN ~f:K
"'':] R' L";,~~. SUl .-1--i+
n~
L", L[ TllQi <RB
~ l'OC
uA'tlbUC <. Rt~ < ,WK
j.,n l 1 RH ~fK f Tl
~ TO.!H <RU
~ $"'''
Vil>
Dm
10H11!
VIA
7,(00
D"
CON'
~k ~w
~~'3A ("$ +--Lt
''l''T LJL.-l(~ -=.
1",U~
RIS ""1 ,,,. L,~
(J!-4,
pif, opr
r------i u?, v?-"--. ~~ )-.....t....,oo ~ L'oo' '->--, 1
74'S!JO ?'4S00
l, 1
Rie: \\RCLPC3\Shared Flles\SlngIe_ ChanneI_Dlscrmina1C<lSi>gIe_Channel_Disa1mi1a1Or._ 1 ~ IT'" 1 1 «0> 1 ~o.~SIngI· Channel Discriminai'" 1
2002--12-10 :~~I
·~Jf.{U't."'N~f.l""~,,{'l:.ornod
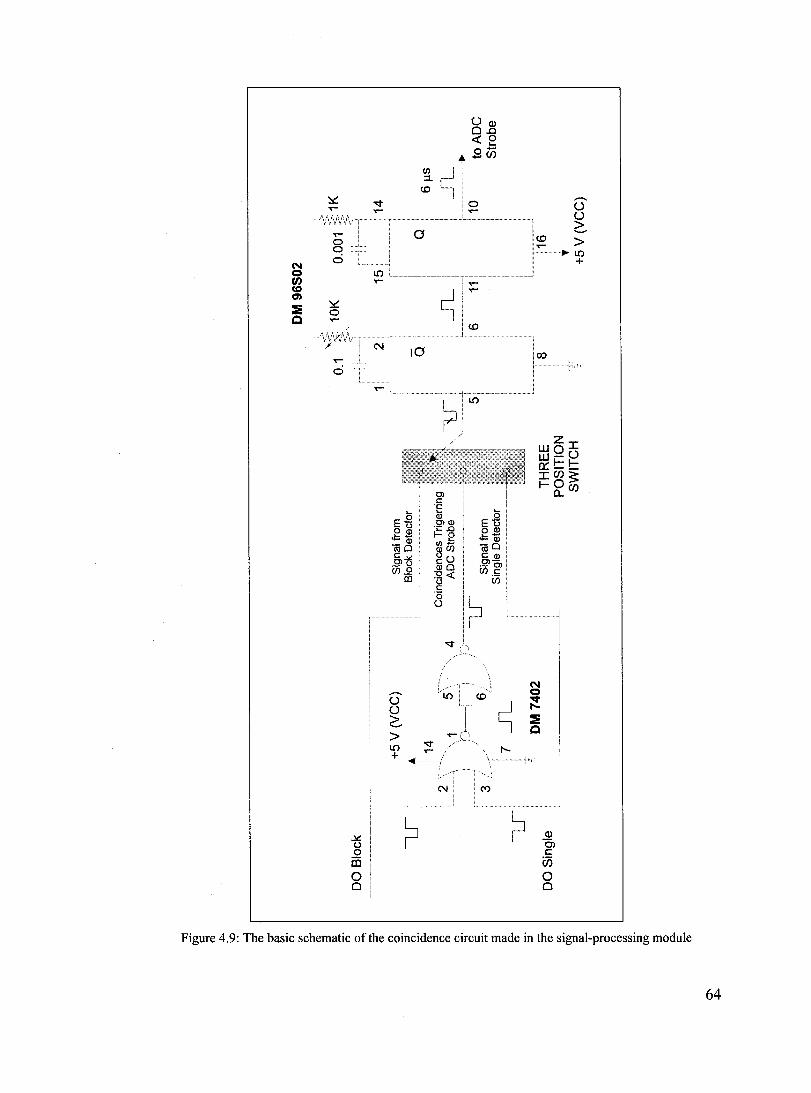
N CI en (Q en :lE Q
:::s::: ,...-
:::s::: 0 ..-
~ t) o
ëi5 e o
~
Ln .....
..-
......... Ü Ü G > Ln +
II)
~ ::t (0
a
~ la
Ol c 'E Ql OlQl ï:: ..0 I-[;? CIl ..... ~U) CÜ QlO }2« u c ·0 ü
~
oo::t .....
Ü(J) 0.0 <ce 0-..... (/)
0 ,...-
..... .....
Ln
(; Eu 0(1) .t::âi ro O C Ql Ol-.- Ol U)c
ü)
?
"'-: (0
~ .....
......... Ü Ü G
(0 > ..... ~Ln
+
00
Z weI w-ü o::!:::!::: I(/)$ I-O(/)
N CI "'1:1' ..... :E Q
Cl..
(J) 0> c: êi5 o Cl
Figure 4.9: The basic schematic of the coincidence circuit made in the signal-processing module
64
(h) Analog to Digital Converter (ADC)
The Aurora 14 analog to digital converter (ADC) digitizer was used in the
experiment in order to digitize the analog signaIs from PMTs. This device is capable of
simultaneous sampling of data on six separate channels aH at rates up to 1 MHz. It is
housed with CAMAC module. Each channel contains a separate differential amplifier,
12-bit analog to digital converter and up to 1024K-word memory. It has range 0 to 10 V
mapped to 0-4095 (12 bits). This means that 5 V gives 2048 in the raw data. The
channels have different gains. The appropriate gains of the channels and offset
correction are done by software.
(c) Multichannel Analyzer (MCA)
In our experiment, we were using a Tracor-Northem Model 7200 multichannel
analyzer (MCA), directly connected to the PMTs of the detectors. It accepts pulses of
varying amplitudes between 0 and 9 V and divides this range into 512 increments of
9/512=0.0175 of a volt per interval. When a pulse representing a detected gamma ray is
received, the MCA determines its height rounded to the nearest 0.0175 of a volt, and
adds 1 to the memory location, which corresponds to that height. Because the voltage
heights are proportional to the energy of the incoming gamma rays the accumulated
counts form an energy spectrum on the screen-the number of times that gamma rays of
different energies have been detected.
The MCA was counted the number of coincidences that each of the detector pairs
in coincidence registered, binning them into different channels and we were able to see
65
the energy spectrum from the detectors in coincidence. In that way, we were able to
ensure that the photo-peaks of the spectra from two detectors in coincidence overlap in
each experiment in which we measured aperture functions of the detectors in
coincidence before we start to acquire the data. This was done by changing the high
voltage gains of different PMTs of the corresponding detectors.
4.2.7 The Automated Displacement System
For data to be consistent from one experiment to the next, two requirements must
be satisfied: 1) the starting position of the detectors with respect to the source must be
fixed and 2) the detectors must be swept by the source in fixed and precise steps along
the line orthogonal to the Hne crystal-source-crystal. The computer controlled detectors
positioning and displacement system was designed for this purpose. The detectors move
in forward direction. Limit switches on translation stages were used to prevent the
detectors from moving too far away in either direction. We were using this system first
to position the detectors and to fix the range of moving them during the experiment
before we start to acquire the data. Then, during the experiment we were able, by using
this system, to move only block detector while single detector and source were fix
positioned or both detectors in tandem while the source was at fixed position.
4.2.8 The Data Processing
Data from the ADe from each event are sent to the Alpha workstation in the
form of digital 12-bit signaIs. Those data are used to increment a 256 x 256 matrix. A
maximum of 80 frames of data can be collected in this manner and plotted as two-
66
dimensional histograms. Those data are collected in buffered mode. Each buffer is an
array of 1024 elements. The buffer receives the data and then the data are processed to
form an image. This allows the use of standard PET image analysis tools like region of
interest (ROI) to analyze the collected data.
4.2.9 Acquisition Software
Acquisition software allows the detectors to be pre-positioned and then move to
the next point without operator intervention. It also allows the spectrum, raw events (in
list mode) and images to be saved. During the study, for each source position, an image
is created by incrementing a location determined by Anger logic in a 256 x 256 matrix
for each event within a preset energy window. A summed image is also created. The
appearance of the summed image is similar to that acquired by block detector exposed to
a point source.
4.2.10 Display Software
The display software has several windows in which the images are analyzed. The
main window shows up to 64 images, which are minified to 64x64 matrices. Any image
can then be zoomed to its full size, and profiles drawn through the crystal territory
matrix. Another window allows for placement of up to eight regions of interest (ROI).
The count rate in these ROIs can be displayed as a function of the detectors' positions
during the experiment. These graphs correspond to the inter-crystal aperture functions.
They can be fitted to the sum of three Gaussian functions and the centroid, FWHM and
FWHM of CAFs are printed.
67

4.3 Methods
4.3.1 Spatial Resolution of PET Scanners
The data from published reports describing SR of several PET scanners2 are
presented with the graph of SR as linear function of the crystal width (cw), which is
obtained by subtracting the non-colinearity and positron range effect on SR (Chapter 3,
Figure 3.5). By plotting the SR as a function of cw using Equation 3.2, including aIl the
blurring effects rather than correcting for them as has been done by others2, the best
possible SR (in the limit of zero width crystals) for any scanner size is more evident. We
made the graph of SR as a function of crystal width, assuming 2 mm block effect and
assuming no block effect. We were using different detector separations (ds) which
correspond to PET scanners used in: human brain imaging (HRRT, ds = 470 mm, cw =
2.8 mm,\ whole body PET (HR+, ds= 825 mm, cw= 4.4 mm,4), small animal imaging
(microPET, ds= 148 mm, cw =1.7 mm,5), and in high-resolution human breast imaging
(PEM, ds = 80 mm, cw =2 mm,6). The measured SRs for those scanners were compared
with the obtained theoretical curves. By taking the square root of the differences
between squares of the measured and calculated SR, we found the block effects for
corresponding scanners and compared it with our result.
4.3.2 Experimental Apparatus
To investigate the block effect we performed experiments in which two detectors
in time coincidence record gamma rays from a positron-emitting source. A complete
data set for the spatial resolution measurements consists of three separate sets of
experiments:
68

• Determination of the effective source size,
• Measurements ofthe coincidence aperture functions (CAF) ofvarious crystal,
• Measurements of the separation between the crystals in the block.
In aU experiments we were measuring CAFs of various BGO crystals being in
coincidence and their FWHMs were determined. In the first set of experiments, we were
using two 1 mm wide single crystals in coincidence. In the second set, we were using
one single crystal of 1 mm width in coincidence with single crystals with various
crystals widths, as weU as in coincidence with the crystals within the block. In the third
set of experiments, we were using single crystal in coincidence with crystals in the block
detector.
In aU experiments, we were able to obtain the spectrum, raw events in list mode,
as weU as an image for each source (or detectors) position, created by incrementing a
location in a 256 x 256 matrix for each event within a preset energy window. The
summed image for each measurement of CAFs was also displayed. Obtained images
from aU three sets of measurements were analyzed by drawing the profiles through the
crystal territory matrix and by placing the regions of interest (ROI). The count rate in
these ROIs is displayed as a function of the detectors positions during the experiment,
which correspond to the crystal aperture functions. The experimental points were fitted
with the sum of three Gaussian functions in order to obtain the centroids, FWHM and
FWTM of CAFs. The FWHMs of the resulting CAFs represents the spatial resolution of
the detector pair in coincidence.
We designed an experimental set-up to measure the coincidence aperture
functions of two single crystals which is presented in Figure 4.1 D.a and to measure the
69

CAFs of the block and single crystal detector which is presented in Figure 4.10.b. The
detectors were mounted on translation stages (Compumotor model 57 102) controlled
from an Alpha 4/100 workstation. The detectors were moved in a direction orthogonal to
the collimated gamma-ray beam line with a precision of 0.5 J..lm. Either both detectors
were moved in tandem or one of them was fixed positioned while the other was moved,
depending of the type of the performed measurement. In order to provide appropriate
lead shielding of the source, in aH experiments the source remained stationary.
a)
Translation Stage
b)
Single CI')'StaI
__ ····•·•· .. ··û .... • .... ,,·····, Source
BJock
Translation Stage
Translation Stage
=>
# ofcounts
,.. 10
Iii'>
.... ..,
... .. #ofcounts
Figure 4.10: Experimental set-up for measuring the block effect in block detectors used in PET scanners.
70

Since there are several factors that blur the spatial resolution (Chapter 3), we have
set-up the experiment in which all the other blurring effects except block effect were
minimized and precisely determined. We were using very small 68Ge (lmm) as a source
of 511 keV annihilation photons described in section 4.2.2, as well as two 1 mm wide
single BGO crystals. The single crystals and Hamamatsu R1548 PMTs along with
associated charge-integrating amplifiers were enc10sed in light-tight box described
above, which is attached to one of linear translation stages used in the experiment.
Precise alignment of the crystal is crucial in these experiments to ensure accurate
measurement of the aperture function. The active crystals must point exactly at each
other. To ensure precise alignment of the active crystals, a 1 mm wide red line laser was
mounted above the source and the detectors. The active crystal edges and the source
were aligned with respect to the laser line.
A set of four charge-integrating amplifiers and a high-voltage decoupling
network was assembled in a quad amplifier box. This and the block detector were
attached to the other linear translation stage, which moves the detector orthogonal to the
collimated gamma-ray beam line defined by the source and the other crystal-PMT unit
with a precision of 0.5 f.lm. The experiment is performed by moving a single detector
and than block detector using translation stages under computer control along x direction
(Figure 4.10) while the source is fixed position. Acquisition software was allowing the
detectors to be pre-positioned and then to move the detectors to the next point without
operator intervention. The picture of the experiment is presented in Figure 4.11, on
which one can see the detector boxes attached to the translation stages and between them
the source of 511 ke V, shielded with lead breaks.
71

Before starting the experiments, we were acquiring data to obtain the energy
spectrum from both detectors in coincidence in order to set energy discriminators for
subsequent experiments. In such a way photo peaks from both energy spectra were
between low and high level di scriminators , while Compton edge of those spectra was
not. We were using MCA to display energy spectra from both detectors to ensure that
the photo-peaks of spectra from detectors in coincidence overlap. The energy window
had to be preset for experiments with single crystals in coincidence and changed and
preset for block detector in coincidence with single detector.
Figure 4.11: Picture of the experimental set-up with two translation stages with block detector attached on
one of them and single detector on the other one and the shielded 68Ge source of annihilation gamma rays
in the middle between two detectors.
In our experiments, the detectors moved in steps of 0.2 mm or 0.75 mm along the
Hne orthogonal to the line crystal-source-crystal. At each source position data were
collected for up to 2400 seconds. At the end of this time the position of the detectors
were incremented automatically. The data were collected at 60 or 63 positions along the
72
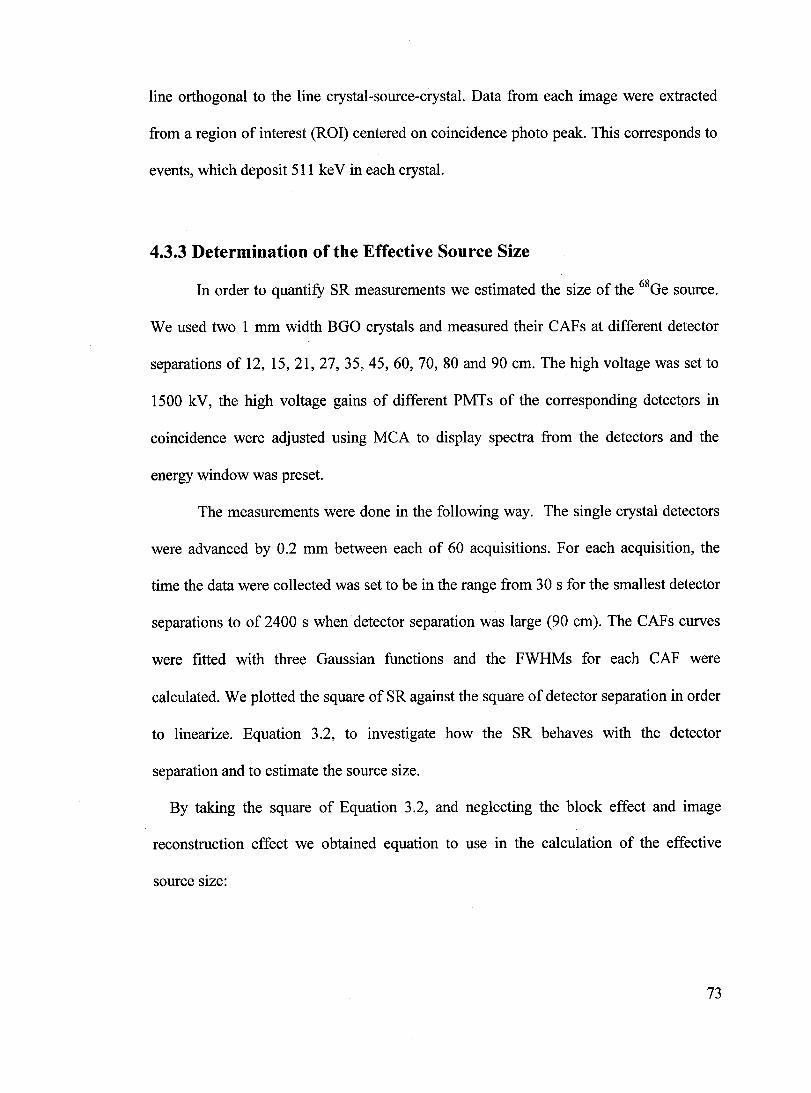
Hne orthogonal to the Hne crystal-source-crystal. Data from each image were extracted
from a region of interest (ROI) centered on coincidence photo peale This corresponds to
events, which deposit 511 ke V in each crystal.
4.3.3 Determination of the Effective Source Size
In order to quantify SR measurements we estimated the size of the 68Ge source.
We used two 1 mm width BGO crystals and measured their CAFs at different detector
separations of 12, 15,21,27,35,45, 60, 70, 80 and 90 cm. The high voltage was set to
1500 kV, the high voltage gains of different PMTs of the corresponding detectors in
coincidence were adjusted using MCA to display spectra from the detectors and the
energy window was preset.
The measurements were done in the following way. The single crystal detectors
were advanced by 0.2 mm between each of 60 acquisitions. For each acquisition, the
time the data were collected was set to be in the range from 30 s for the smallest detector
separations to of 2400 s when detector separation was large (90 cm). The CAFs curves
were fitted with three Gaussian functions and the FWHMs for each CAF were
calculated. We plotted the square of SR against the square of detector separation in order
to linearize. Equation 3.2, to investigate how the SR behaves with the detector
separation and to estimate the source size.
By taking the square of Equation 3.2, and neglecting the block effect and image
reconstruction effect we obtained equation to use in the calculation of the effective
source size:
73

FWHM' ~ (0.00022)' . ds' + (p; + ss' l+( ,;)' (4.1)
For 1 mm wide crystal s, one obtains (cw/2) 2=0.25 mm2. The positron range, Pr = 0.6
mm, was estimated based on the average energy of positrons (836 ke V) emitted during
68Ge decay. A continuous slowing down approximation (CSDA) range of electrons in
steel was taken from the NIST web site7 assuming that it does not differ from the
positron range.
4.3.4 Measurements of CAFs of Various Crystals
In order to measure the block effect in the CTI HR+ block detector we used the
same experimental set-up as in paragraph 4.3.3. On one translation stage, we kept 1 mm
wide single crystal. On the other one, we mounted single crystal detectors with various
crystal widths. To investigate how the FWHMs of CAFs behave with changing the cw
of the crystals in coincidence, we performed three sets of measurements. The 1.0 mm
wide single crystal on the first translation stage was set in coincidence with single
crystals 1.0 mm, 3.4 mm and 7 mm wide, positioned on the second translation stage. The
detector separation was 21 cm. The high voltage power supply was set to 1500 kV, the
high voltage gains of different PMTs of the corresponding detectors in coincidence were
adjusted in the same way as in section 4.3.2, and energy discriminators were preset . We
collected the counts at 60 different crystal positions in steps of 0.2 mm with acquisition
time of60 seconds. The square of FWHM of the measured CAFs was plotted against the
square of the crystal widths. The data were fitted using linear fitting procedure. From the
obtained linear fit the FWHM for crystal width of 4.4 mm was estimated and the
standard error was ca1culated using formula for standard deviation for known function.
74

We repeated the study with block detector crystals. The high voltage was set to 1200
kV and the high voltage gains of different PMTs of the corresponding detectors in
coincidence were changed and new energy window was preset. This experiment was
performed for 44 central crystals (whose cw is 4.4 mm), and 16 edge crystals within the
block detector (who se cw is 4.2 mm, as measured from the X-ray image of the detector)
set in coincidence with the single crystal. The separation between single crystal and the
block detector was 21 cm. We coUected the counts at 60 different crystal positions in
steps of 0.2 mm with acquisition time of 180 seconds. The mean values of squares of
FWHMs of the measured CAFs for one block detector in coincidence with single
crystals were calculated. In order to estimate the FWHMs of crystals when two block
detectors are in coincidence the obtained values were multiplied by .fi .
4.3.5 Measurements of Inter- crystal Distance in the Block
Previous studies reported that the centroids of interactions in the crystal do not
correspond to the geometrical centers of the crystals8. In order to determine the
separation between the crystals in the CTI HR+ block detector and to assign territory in
the crystal identification matrix to appropriate crystals, we performed the foUowing
experiment. The crystals in the block were in coincidence with a 1 mm thick crystal. The
high voltage was set to 1200 kV, the high voltage gains of different PMTs of the
corresponding detectors in coincidence were adjusted, and the energy window was
preset, as in aU previously described experiments. The block detector moved in steps of
0.75 mm while the source and the single crystal detector were at fixed position. We
coUected data for 2000 seconds. For each set of experiments, 63 frames were acquired.
75

A ROI was placed over each crystal's representation in one row of the obtained crystal
identification matrix and counts per minute per pixel (CPM/pixel) were determined for
each crystal in each of the 63 frames. Also the centroid and the separation between
crystals in one row were determined using the acquisition software.
In a given direction along the crystal block, there is a probability that the photon is
detected in a crystal i-1 or in a crystal i+ 1, even if its first interaction was in crystal i. In
order to estimate the fraction of miss positioned events in the crystals, we took a profile
along the central row crystals in the crystal identification matrix. The profile was fitted
with a multi-Gaussian model, having 25 fitting parameters: eight peaks times three
Gaussian function parameters (position, width, and amplitude) and a base-line level.
First iterations were performed with the Gaussian functions positions and widths fixed,
while the amplitudes varied. In the second set of iterations, the widths varied and finally
in the last set of iterations, the positions and the base line varied, altogether with aIl the
other parameters. From eight Gaussian functions, we calculated the fraction of miss
positioned events in a given crystal i in the block detector using:
(4.2)
where Ii is the area of the given crystal i, hl and Ii+ l are the overlapping areas with the
neighboring crystals i-1 and i+ 1.
76

References
1 Y. Yamashita., M. Ito and T. Hayashi "New Dual Rectangular Photomultiplier Tube for Positron CT" , Proc. ofintemationai Workshop on Physics and Engineering in Medical Imaging , (1982). 2 R. Lecomte, Sherbrooke University, personal communication, 1998. 3 R. Boellaard, F. Buijs, H. W. A. M. de Jong, M. Lenox, T. Gremillion and A. A. Lammertsma, "Characterization of a single LSO crystal layer High Resolution Research Tomograph ," Phys. Med. Biol. 48, 429-448, (2003). 4 J. J. Moreno Cantu, C. J. Thompson and R. J. Zattorre, "Evaluation of the ECAT EXCAT HR+ 3-D PET scanner in H2
150 brain activation studies: Dose fractionation strategies for rCBF and signal enchancing protocols," IEEE Trans. Med. Imag. 17, (6),979-985, (1998) 5 S. R. Cherry, Y. Shaoo, R. W. Silverman, K. Meadors, S. Siegel, A. Chatziigannou et al., "MicroPET: A High Resolution PET Scanner for Imaging Small AnimaIs," IEEE Trans. Nue/. Sei. 44 (3), 1161-1166, (1997). 6 Y. Picard and C. J. Thompson, "Determination of the centroid of interaction of the crystals in block detectors for PET," IEEE Trans.Nue/.Sci., 41( 4), 1464-1468, (1994). 7 J. H. Hubbel and S. M. Seltzer, "Tables of X-Ray Mass Attenuation Coefficients and Mass EnergyAbsorption Coefficients," http://www.physics.nist.gov/PhysRetData/XrayMassCoef/cover.html 8 C. J. Thompson, K. Murthy, Y. Picard, 1. N. Weinberg and R. Mako, "Positron Emission Mammography (PEM): A Promising Technique for Detecting Breast cancer," IEEE Trans. Nue/. Sei., 42 (4), 1012-1017, (1995).
77

CHAPTER5
RESUL TS AND DISCUSSION
5.1 Spatial Resolution of PET Scanners
Figure 5.1 represents the spatial resolution (SR) as a function of crystal width (cw) for
different separations between detectors in coincidence that correspond to commercially
available PET scanners: HRRT, HR+, micro PET and PEM, using Equation 3.2, and
assuming positron range to be 0.6 mm. The source size was neglected in this analysis.
The solid Hnes represent a set of curves obtained by assuming no block effect and
dashed Hnes assume the block effect of 2 mm.
7 - No Block Effect - - - With Block Effect of 2 mm
microPET -E 6
E -C 5 0 .. :s '0 4 III
~ CU 3
i Co 2
HR+ Experimental Values en HRRT • HR+ (ds=82.5 cm)
• HRRT (ds=47.0 cm)
• micro PET (ds=14.8 cm) PEM ~ PEM (ds=8.0 cm)
0 0 2 3 4 5 6 7
Crystal Width (mm)
Figure 5.1. SR in PET as a function of cw with and without a 2 mm block effect, as obtained from
Equation (3.2). The symbols show the measured SRs for different PET scanners from published
reports.
78

Only for HR+ scanner, the measured spatial resolution does coincide with the
theoretical curve assuming block effect of 2 mm. For microPET, HRRT and PEM
system the measured points are below predicted curves, which assume a 2 mm block
effect but above the curves that assumes no block effect. Using Figure 5.1, we calculated
block effects for those scanners by taking the square root of the differences between
squares of measured and ca1culated full width at half maximum (FWHMs). The results
show that the block effect for the three scanners is: 0.9 mm (HRRT), 1.0 mm (PEM) and
0.8 mm (microPET).
5.2 Experimental Results
5.2.1 Crystal Identification Matrix
For the experiments with block detector, it is important that gamma ray
interactions in the block are properly assigned to the corresponding crystals within the
block. In order to generate the crystal identification image, data were acquired in single
modes while irradiating the CTI crystal block using a 680e source. The image in Figure
5.2 shows 64 peaks corresponding to the crystals in the block, which were obtained by
properly choosing the scale factors of the four PMTs in the detector. The obtained
pattern from crystals is similar to one in the CTI scanner.
79

Figure 502: Crystal identification matrix
5.2.2 Energy Spectrum from the Detectors in Coincidence
Before starting the experiments, we were acquiring data to obtain the energy
spectrum from both detectors in coincidence inorder to set energy discriminators for
subsequent experimentso The acquisition software allows the energy spectrum to be
savedo In such a way photo-peak from energy spectra from one of the detectors was
ensured to be between low and high level energy discriminators, while Compton edge of
the spectrum was ensured not to be in this range. We were using MCA to display energy
spectra from both detectors to ensure that the photo-peaks of spectra from detectors in
coincidence overlap, by changing the channel number at which photo-peak from
80
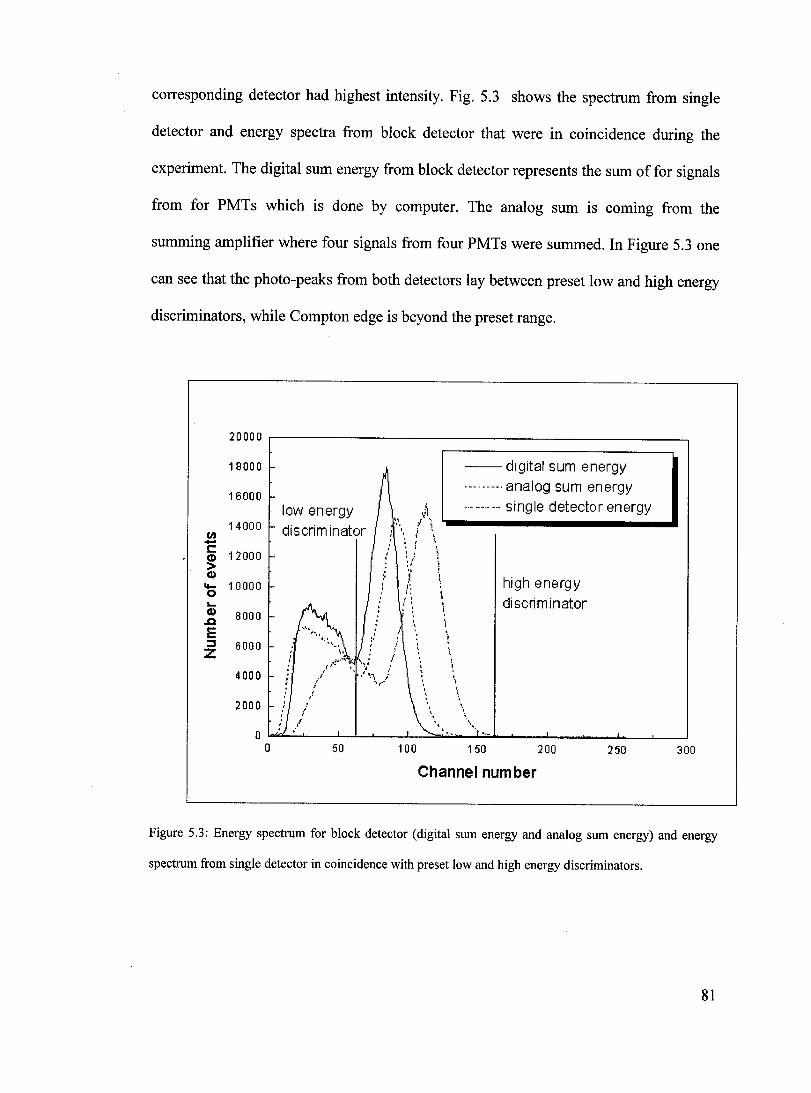
corresponding detector had highest intensity. Fig. 5.3 shows the spectrum from single
detector and energy spectra from block detector that were in coincidence during the
experiment. The digital sum energy from block detector represents the sum of for signaIs
from for PMTs which is done by computer. The analog sum is coming from the
summing amplifier where four signaIs from four PMTs were summed. In Figure 5.3 one
can see that the photo-peaks from both detectors lay between preset low and high energy
discriminators, while Compton edge is beyond the preset range.
20000
18000 --digital sum energy
16000 ... --- ... analog sum energy
lowenergy !, -...... -... single detectorenergy '.,:Ij
14000 discrim inator , t l ri) " ; , - " r
, r:: ,
12000 ' , \ CD , ! "
> .' ;
CD ~ .~ high energy 10000
, ..... , , 0 "
disctiminator L.. , , ! CD 8000
, ,Q 1 E
, , , 't :' ::J 6000 ,
Z , ,
, .!
4000 , " , '.
2000
0 0 50 100 150 200 250 300
Channel num ber
Figure 5,3: Energy spectrum for block detector (digital sum energy and analog sum energy) and energy
spectrum from single detector in coincidence with preset low and high energy discriminators.
81
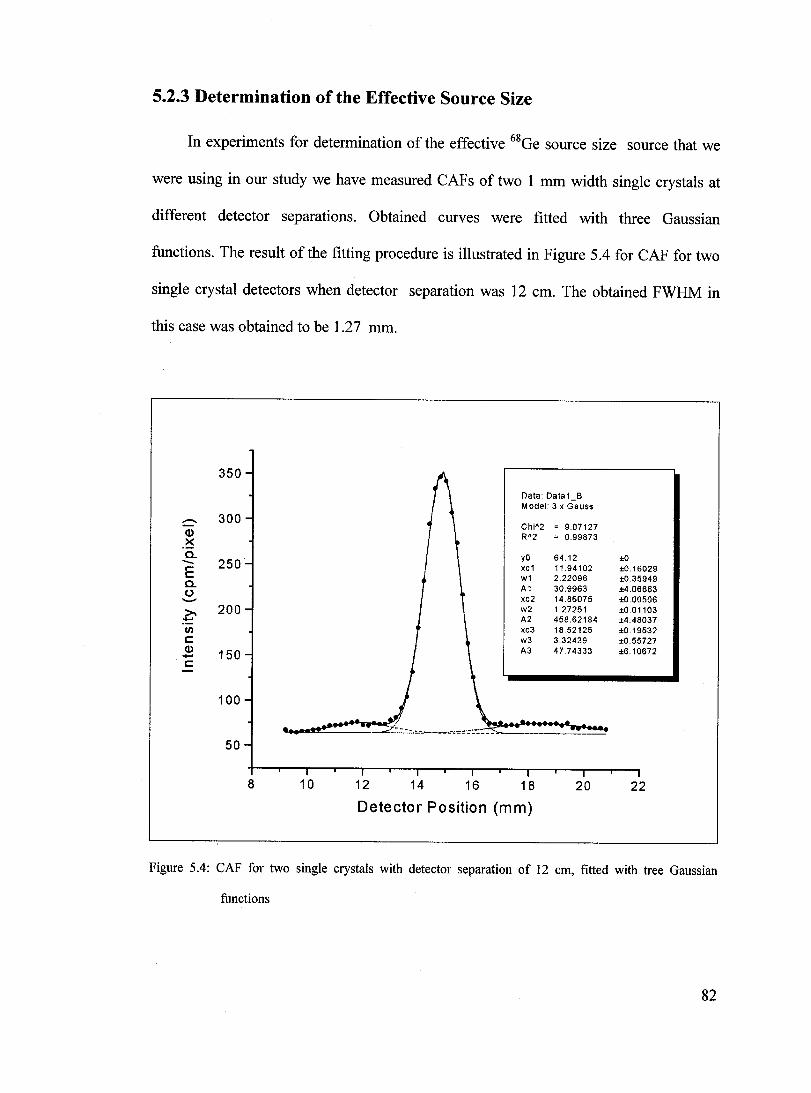
5.2.3 Determination of the Effective Source Size
In experiments for determination of the effective 68Ge source size source that we
were using in our study we have measured CAFs of two 1 mm width single crystals at
different detector separations. Obtained curves were fitted with three Gaussian
functions. The result of the fitting procedure is illustrated in Figure 5.4 for CAF for two
single crystal detectors when detector separation was 12 cm. The obtained FWHM in
this case was obtained to be 1.27 mm.
350
::=:- 300 Q)
.~ a. - 250 E a. u ........ >- 200 --II) c: Q)
150 --c:
100
50
8 10
Data: Data1 B -M odel: 3 x Ga uss
ChiA 2 RA 2
yO xc1 w1 A1 xc2 w2 A2 xc3 w3 A3
12 14 16 18
Detector Position (mm)
= 9.07127 = 0.99873
64.12 11.94102 2.22096 30.9963 14.86075 1.27251 458.62184 18.52125 3.32439 47.74333
20
±O ±O.16029 ±0.35949 ±4.06663 ±0.OO506 ±0.01103 ±4.48037 ±0.19532 ±O.55727 ±6.10672
22
Figure 5.4: CAF for two single crystals with detector separation of 12 cm, fitted with tree Gaussian
functions
82
In Fig. 5.5 the square of the obtained spatial resolution as a function of the square of
the detector separation is plotted. The FWHM points were fitted using linear fit y=ax
+b, where y corresponds to FWHM2, x corresponds to di, parameter a corresponds to
the slope of the line and b is the intercept for detector separation equal to zero. In Fig.
5.5, the value of the slope is in a good agreement with the predicted value of (0.0022i,
as given in Equation 3.2 and Equation 4.1, i. e. a=4.4xlO-6 which gives a1l2=2.09xlO-
3. This confirms 0.5 0 non-colinearity of the annihilation gamma rays. Using Equation
4.1 and Figure 5.5, the intercept withy axis for the ds=O gives:
5.5
5.0
4.5
- 4.0 N
E 3.5 E -N 3.0 :il :I: 2.5 3: u.
2.0
1.5
1.0
0.5
0.0 0
Data: Data1_D Model: Linear (weighted)
ChiA 2 = 9.08846 RA 2 = 0.98893
Par. Value a 4.376E-4 b 1.605
Error ±1.6373E-5 ±0.01868
2000 4000 6000 8000
{detector separation)2 (cm 2)
(5.1)
Figure 5.5: Variation of the FWHM of CAF of single crystals with the detector separation
83

The crystal width in our study is 1 mm, which means that (cw/2) 2=0.25 mm2. The
estimated positron range for 68Ge in steel is about 0.6 mm. The linear fit intersects y-axis
for a zero detector separation at an effective source size (the sum of the physical size of
the source and the positron range) to be 1.164 mm. We estimated the source size (ss)
from the following expression:
(5.2)
which gave us the value of 0.99 mm for the source size. This is slightly underestimated
because we used CSDA positron range instead of FWHM of the projected path lengths
distribution function, which would give us a positron range error smaller than 0.6 mm.
5.2.4 Measuring of the CAF ofVarious Crystal Combinations
In Figure 5.6, the square of FWHM of the measured CAFs for two single crystals in
coincidence is plotted against the square of the various crystal widths, which is
presented with square symbols. Square of the FWHM varies linearly with the square of
the cw, in accordance with Equation3.2.
In Fig. 5.6 we also presented the square of FWHM of the measured CAFs for crystals
in the block in coincidence with 1 mm wide single crystal. The result for the edge
crystals (presented in Figure 5.6 with down triangle) coincides with the single crystals fit
line whereas the result for central ones (presented in Figure 5.6 with up triangle) is
above the line.
84

Using the obtained results for 44 FWHMs for central crystals and 16 FWHMs for
edge crystals in the block we calculated the mean values to be:
FWHM (for central crystals) = 2.20 ± 0.05 mm ,and
FWHM (for edge crystals) = 1.98 ± 0.03 mm.
From the linear fit shown in Figure. 5.6, we estimated what the value of FWHM
would be for single crystal that have crystal width of 4.4 mm, as used in the CTI HR +
block detectors. The result show that:
FWHM (for 4.4 mm width single crystal)=2.l±O.l mm.
N ...-. E E -..-.
N
:lE :I: 3: U.
10
8
6
4
2
o 10 20 30 40 50
(crysta 1 width)2 (m m)2 60
Figure 5.6: Variation of the FWHM of CAF of two single crystals C.) and single crystal with the central
C~) and the edge crystal of the block detector ('V).
85
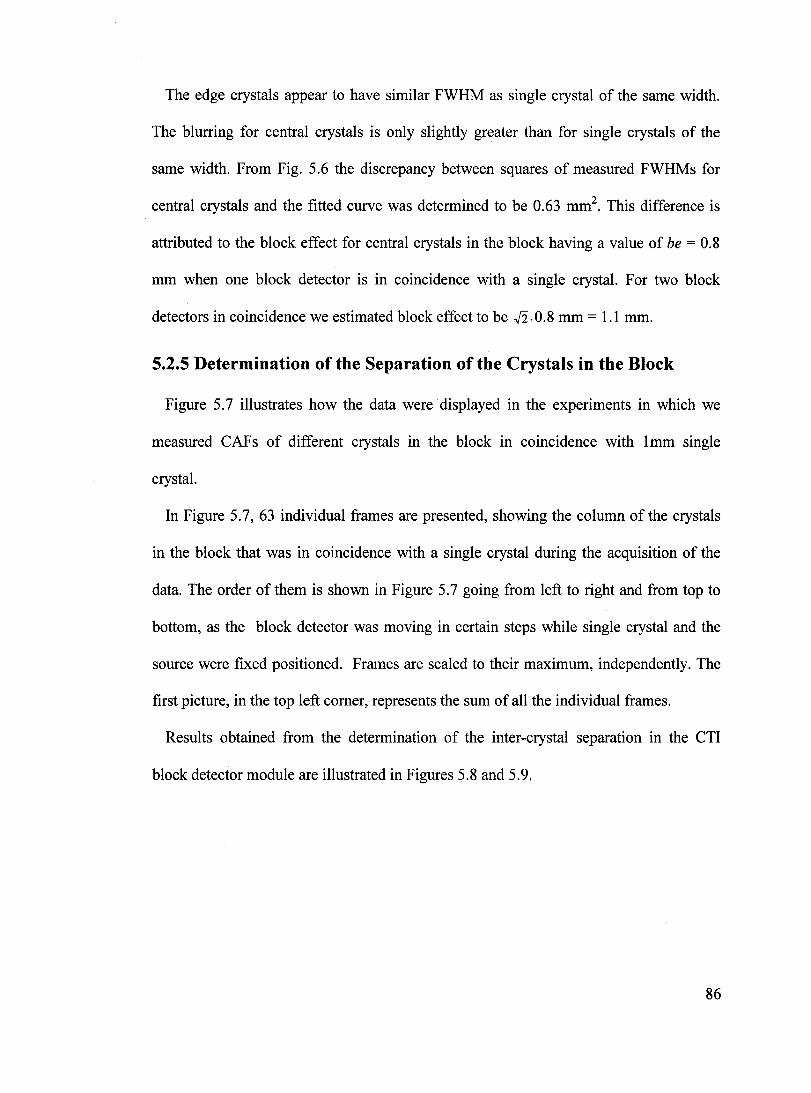
The edge crystals appear to have similar FWHM as single crystal of the same width.
The blurring for central crystals is only slightly greater than for single crystals of the
same width. From Fig. 5.6 the discrepancy between squares of measured FWHMs for
central crystals and the fitted curve was determined to be 0.63 mm2. This difference is
attributed to the block effect for central crystals in the block having a value of be = 0.8
mm when one block detector is in coincidence with a single crystal. For two block
detectors in coincidence we estimated block effect to be .fi. 0.8 mm = 1.1 mm.
5.2.5 Determination of the Separation of the Crystals in the Block
Figure 5.7 illustrates how the data were displayed in the experiments in which we
measured CAFs of different crystals in the block in coincidence with Imm single
crystal.
In Figure 5.7, 63 individual frames are presented, showing the column of the crystals
in the block that was in coincidence with a single crystal during the acquisition of the
data. The order of them is shown in Figure 5.7 going from left to right and from top to
bottom, as the block detector was moving in certain steps while single crystal and the
source were fixed positioned. Frames are scaled to their maximum, independently. The
first picture, in the top left corner, represents the sum of aU the individual frames.
Results obtained from the determination of the inter-crystal separation in the CT!
block detector module are illustrated in Figures 5.8 and 5.9.
86
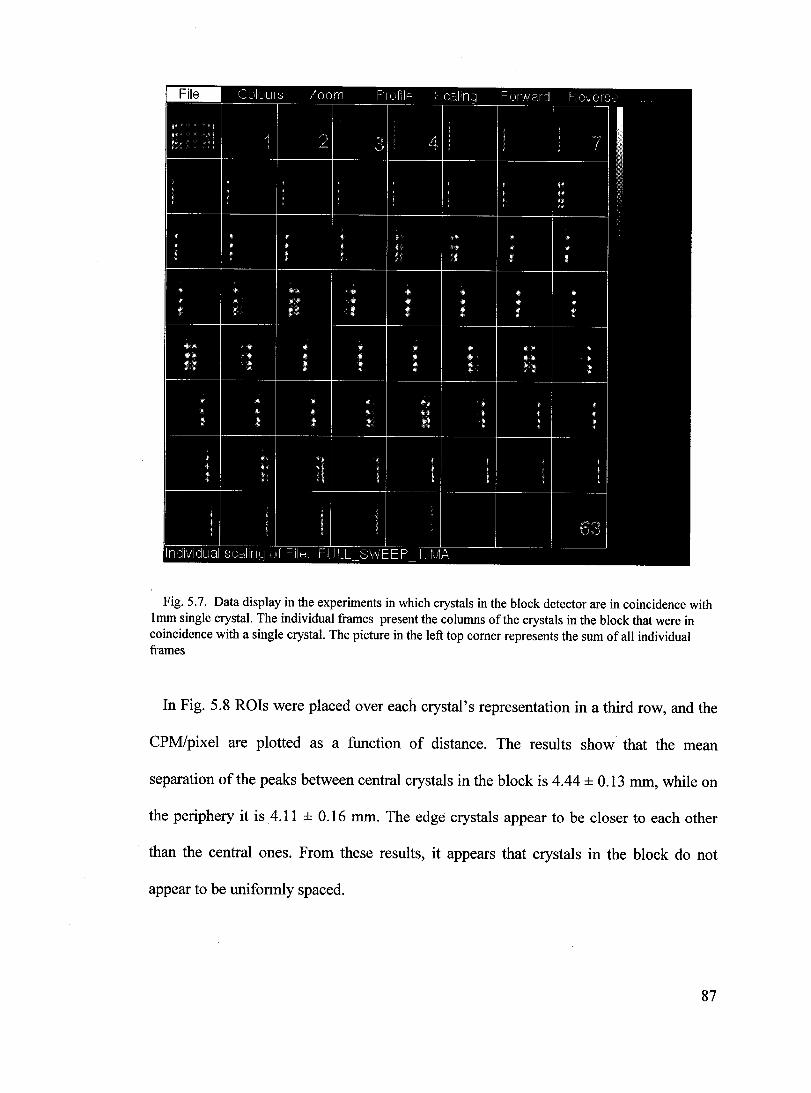
Fig. 5.7. Data display in the experiments in which crystals in the block detector are in coincidence with lmm single crystal. The individual frames present the columns of the crystals in the block that were in coincidence with a single crystal. The picture in the left top corner represents the sum of aIl individual frames
In Fig. 5.8 ROIs were placed over each crystal's representation in a third row, and the
CPM/pixel are plotted as a function of distance. The results show that the mean
separation of the peaks between central crystals in the block is 4.44 ± 0.13 mm, while on
the periphery it is 4.11 ± 0.16 mm. The edge crystals appear to be doser to each other
than the central ones. From these results, it appears that crystals in the block do not
appear to be uniformly spaced.
87
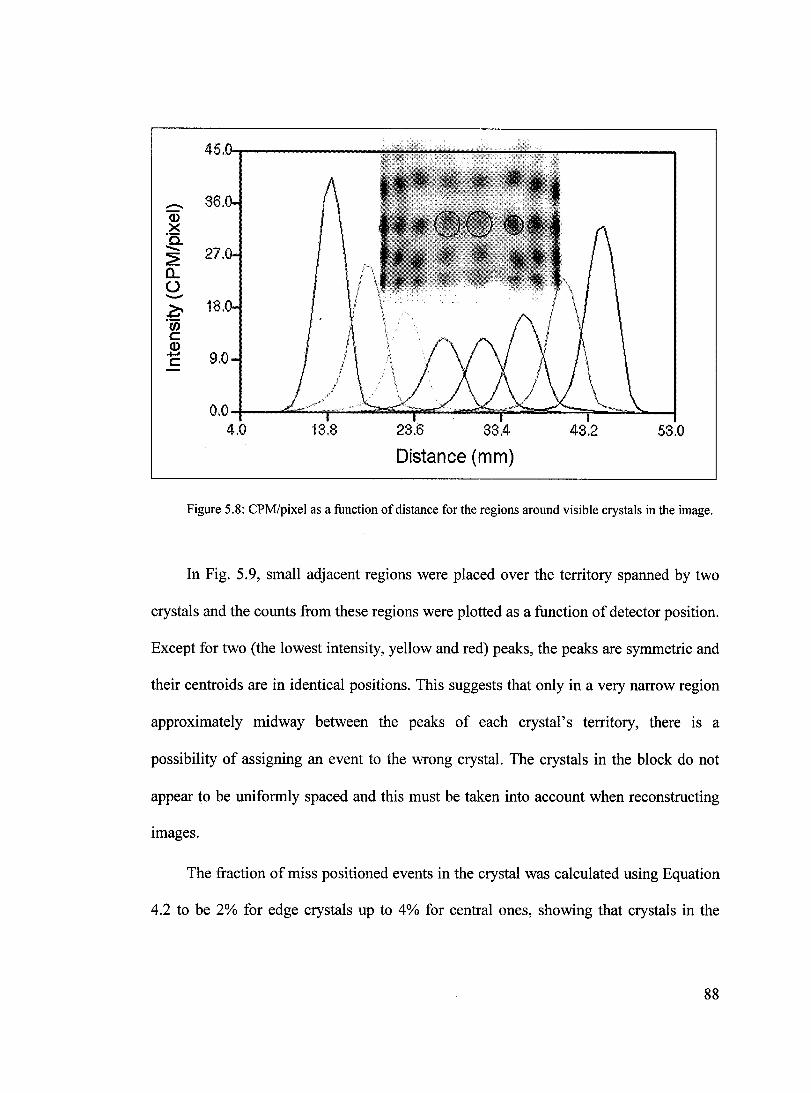
45.u~------------~~--~~~~~----------~
0.0 -I-_,""",",~~;;.;;;.........;;;a::s;;;..;;:op=:S::=-......,.;I~~:=:::s::;....:::::::=:;~::::::"".!:....--I 4.0 13.8 23.6 33.4
Distance (mm) 43.2 53.0
Figure 5.8: CPM/pixel as a function of distance for the regions around visible crystals in the image.
In Fig. 5.9, small adjacent regions were placed over the territory spanned by two
crystals and the counts from these regions were plotted as a function of detector position.
Except for two (the lowest intensity, yellow and red) peaks, the peaks are symmetric and
their centroids are in identical positions. This suggests that only in a very narrow region
approximately midway between the peaks of each crystal's territory, there is a
possibility of assigning an event to the wrong crystal. The crystals in the block do not
appear to be uniformly spaced and this must be taken into account when reconstructing
images.
The fraction of miss positioned events in the crystal was calculated using Equation
4.2 to be 2% for edge crystals up to 4% for central ones, showing that crystals in the
88
block are well separated and that miss positioning of the events in the crystals in the
block is smal!.
25.v~----------------------------------------_
13.8 23.6 33.4 43.2 53.0 Distance (mm)
Figure 5.9: CPM/pixel as a function of distance for the territories between two crystals in the image.
5.2.6 Summary of the Experiments Done in this Work
The summary of the experiments done in this work such as: (l)determination
of the effective source size,(2) measuring the CAFs of various crystals, and
(3) determination of inter-crystal separation within the block, are presented in
Table 5.1. The table contains all input parameters to a particular experiment,
parameters which were changed during the experiments, typical output data from
the acquisition pro gram as well as the results obtained by analyzing the output
data in corresponding experiments.
89

Table 5.1: The summary of the experiments done in this work
EXPERIMENT (1) (2) (3)
Determination Measurements of the CAFs ofvarious crystals: Determination of the
of effective inter-crystal
source size separations in the block
TYPE OF single crystals single crystals in single crystal in single crystal in crystals in the block
EXPERIMENT in coincidence coincidence with coincidence with in coincidence with coincidence (ds=21 cm) central crystals in edge crystals in single crystal (cw=lmm) the block the block
(cw=4,4 mm) (cw=4.2 mm)
INPUT
Positions of ... detectors detectors detectors detectors block detector
step= 0.2 mm 0.2 mm 0.2 mm 0.2 mm 0.75 mm
# of acquisition= 60 60 60 60 63
acquisition time= 30 s-2400 s 60 s 180 s 180 s 2000 s
channel # for energy discriminator
(90,120) (90,120) (low, high)= (70,170) (70,170) (70,170)
PARAMETER ds cw position of the position of the positions of the
(12-90 cm) (1-7 mm) crystal in the block crystal in the crystals in the block block
OUTPUT for different for different cw: for 44 central for 16 edge for 8 crystals in the ds: crystals: crystals: row:
CPM/pixel as CPM/pixel as a CPM/pixel as a CPM/pixel as a CPM/pixel as a a function of function of distance function of distance function of function of distance, distance distance centroids,
separation between crystals
RESULT FWHMasa FWHMasa mean FWHM mean FWHM inter-crystal function of function of cw (for central crystals) (for edge crystals) separations ds in the block
block effect block effect fraction of miss-for central crystals for edge crystals positioned
events in the block
90

5.3 Discussion and Future work
The various experiments done during this study examined the block effect in
CTI HR+ block detector, as well as other detector characteristics in CTI block
detector such as crystal separation appearance. Single module block detector was
brought to the coincidence with a single crystal detector. We determined the
FWHM for central crystals in the block to be 2.20 ± 0.05 mm and the FWHM for
edge crystals in the block to be 1.98 ± 0.03 mm. From the linear fit shown in
Figure. 5~, we estimated what the value of FWHM for single crystal that have
crystal width of 4.4 mm, as used in the CTI HR + block detectors would be
2.1±0.1 mm.
The results from our experiment, specifically made to measure the block effect,
with all the other factors affecting the spatial resolution minimized and precisely
determined show that there is additional blurring of 0.8 mm for central and no
additional blurring for the edge crystals when one block detector is in coincidence
with a single crystal. For two block detectors in coincidence we estimated the
block effect to be 1.1 mm. This result suggests that sorne other effects, apart from
block effect alone, could be the reasons of poorer spatial resolution in the PET
scanners compared by others.
The Sherbrooke APD scanner l is reported to have image spatial resolution of
2.1 mm or 2.4 mm, the Donner 600 (Berkeley) scanner2 2.6 or 2.9 mm and
Tomitani scanner3 2.8 mm or 3.5 mm, depending whether the clamshell motion is
used or not. The clamshell or wobble motion increases the spatial sampling and
improves the SR. Sorne of the early PET scanners had both high-resolution
91

(wobbled) and low-resolution (stationary) mode scans. The under-sampling, which
occurs in the stationary scans, produces poorer spatial resolution. Our opinion is
that this was not taken into account when spatial resolution for different PET
scanners were compared with PET scanners with 1: 1 coupling between crystals
and PMTs. 4
Using Fig. 5.1, we obtained the block effect to be: for HRRT - 0.9 mm, for PEM
- 1.0 mm and for microPET - 0.8 mm. This indicates that the block effect might
have smaller magnitude than previously reported value of 2 mm. The pure block
effect might be closer to our experimental result. On the other hand, a total block
effect may incorporate other factors that degrade the spatial resolution, which
might be dependent on the construction of the detector ring and block detectors
within the ring. For the HR+ PET scanner, these effects may have been much more
pronounced than in the other three models. Consequently, the measured spatial
resolution for the HR+ PET scanner coincides nicely with the curve assuming 2
mm block effect.
From the determination of the separation between crystals in the CTI HR+
block detector and the assignment of territory in the crystal identification matrix to
appropriate crystals, we concluded that the crystals do not appear to be uniformly
spaced in the block. This must be taken into account when reconstructing images.
AIso, our results suggest that only in a very narrow region between the peaks of
each crystal's territory, there is a possibility of assigning an event to the wrong
crystal. The calculated rate of miss positioned events in the crystals shows that
crystals in the block are well separated.
92
Our study suggests that the measured CAFs and non-uniform sampling are
not sufficient to explain the 2.3 mm block effect, which has been observed by R.
Lecomte4 and proposed by W. Moses5 . However, when their theoretical
equations are plotted as in Figure 5.1, the spatial resolution of the CTI HR+
scanner is very close to the curve corresponding to a 2 mm block effect. This
could be due to under-sampling of the image space with stationary detectors.
Our study was aimed at the intrinsic properties of the block effect rather than the
effects of under-sampling.
Experiments on a complete PET scanner are currently underway. The
measurements of CAFs were also done with three 68Ge sources in the PET
scanner. They were positioned 1 cm apart and mounted on the translation stage,
which has been used in the previous measurements. We were able to move the
sources in steps of 0.5 mm and to obtain CAFs ofthe block detectors in the HR+
PET scanner. The additional work is required to analyze the obtained data and
we expect to have additional results, which will give more realistic picture of the
block effect for detectors assembled in the ring of detectors inside the scanner.
Results from those measurements should isolate the under-sampling effects from
the blurring factors.
One of the problems encountered in our experiment was the size of the
source, which was estimated to be 1 mm. This effect obscures the results of the
measured spatial resolution and we believe that more precise measurements of
CAFs could be done with a thinner source. We have ordered 22Na source with
93

smaller source size than 68Ge used until now and we are going to do similar
experiments with new source
Most of 511 ke V gamma rays undergo Compton scattering in the crystal
before being photo-electrically absorbed, which changes the response of the crystal
depending on their position in the block. AIso, response of a particular crystal will
depend on the angle of incidence of gamma rays on the block. The effect of
Compton scattering from surrounding crystals on aperture function in a more
realistic detector arrangement (when detector is surrounded with other BGO
crystals), should be greater for edge crystals than for the center ones.
Consequently, one may expect greater degradation in spatial resolution for the
central crystals. In order to simulate more realistic situation, which appears in PET
scanners, we have performed measurements of coincidence aperture functions of
the block detector surrounded by other BGO crystals available in our laboratory.
The results showed slightly greater FWHM of the measured CAFs compared to the
case of block detector being solely in coincidence with single crystal. The crystals
used to surround the block detector were cut in the same way as the scintillation
crystal inside the block detector module. The cutting depths in the crystal block
determine the way light is spread among the crystals. The edge crystals are cut
more deeply and the light is less spread from them. Next step would be to make
the detectors with different cutting arrangements and to investigate the influence of
the light sharing on the aperture functions.
We have also ordered eight BGO crystals (4.1 mm x 4.4 mm x 30 mm),
which correspond to crystal dimensions in the block detector. We are going to glue
94
them together (one on top of the other) and use them instead of the lmm wide
single crystal to be in coincidence with the block detector. AIso, we are intending
to attach pieces of the scintillation crystal on both sides of the new "single" crystal.
Those side-attached crystals will serve the purpose of providing the Compton
scattered high-energy protons to the measuring "single" crystal, but they will have
to be optically decoupled from the PMT.
We expect to obtain the LSO block detector module, which is used in the
HRRT PET scanners. Our intention is to repeat the measurements described in
this thesis with the new detector type. The new results will be compared with
already obtained results for BGO block detector module.
5.4 Original Contribution
My M.Sc. project is supervised by Dr. Christopher Thompson, worked
through collaboration with my colleges in the Research Computing Laboratory in
MNI, and helped by people from CT!. This project is based on the previous
theoretical and experimental results and experimental experience in various
projects held in the lab in the past, speciaUy from the studies which included
measurements of coincidence aperture functions of different PET detectors and
crystals combinations. Many fundamental concepts in data readout, display
acquiring and processing software, were aU weIl investigated and developed by Dr
Thompson. My contribution in the project include making the experiment
components and setting the whole experiment as weU as performing the
experiments and analyze of the obtained data.
95

I have performed experiment specifically made to measure block effect,
with all other factors affecting the spatial resolution precisely determined and
minimized. I have assembled different parts of the experimental set-up. In order to
provide high voltage supply for the PMTs in block detector and to amplify the
output signaIs from those PMTs, the block detector was connected with quad
amplifier box that I made. It has four amplifiers with gain 50 in it which amplify
the signaIs from four PMTs in the block detector and the high voltage isolated
network.
I have made single crystal detector box as weIl. Single crystals of 1 mm
width were optically coupled with R1548 dual PMT. Together with the amplifiers
and high voltage network they were connected and placed in the light-tight box.
Since the precise alignment of the crystal is very important in the measurements,
the precise horizontal alignment of two single crystals in coincidence was done by
making the firm plastic holder for the crystal along with the PMT.
1 have made signal processing module which contains several components
housed in a single width NIM module. The model contains two discriminators
which are connected to two detectors in the experiment in order to decide if the
signaIs have the right energy of 511 ke V, the coincidence circuit which determines
if the signaIs are arrived at the same time, and voltage regulators necessary for
discriminator and coincidence components power supply. The front panel for this
module was also made and the module was placed in NIM rack to be used in the
experiment. All these components I have assembled in the experimental set-up
explained in Chapter 4. The precise alignment of the crystals in coincidence and
the source is crucial in the measurements of CAFs. 1 did the horizontal and
96
vertical alignment of the detectors end the source, by making plastic holders and
by using 1 mm wide laser in our laboratory.
The acquiring and the analysis of the data were done using software made
by Dr Christopher Thompson, which l learned to use in order to run the
experiment, to acquire and to analyze the obtained data. For each experiment,
before it starts, it was very important to precisely aligned vertically and
horizontally the crystals in coincidence, to preset the low and high energy
discriminators to use only photo-peak part of the spectra, and to preset the moving
of the detectors in the experiments. The analysis of the data required fitting of the
obtained CAFs with three Gaussian functions to obtained the FWHMs and the
mean values of the FWHMs for central and edge crystals in the block and error
analyse. The calculations of the effective source size was done. ROI analysis of the
inter-crystal aperture functions to obtain the inter-crystal separations, and
determinations of the mean values and error analysis were also done. From those
data l calculated of the fraction of miss-positioned events in the crystals in the
block and l did the error analyze. AIso, the determination of the spatial resolutions
in PET scanners and comparison with our result, AlI these steps which l took
during the study were accompanied by learning pulse counting and shaping
electronics, radiation safety, the use of computer programs to run the experiment
and to analyze the acquired data, the learning of statistical analysis, and learning
how to write scientific reports.
97

References
1 R.Lecomte, J. Cadorette, S. Rodrigue, D. Lapointe, D. Rouleau, M. Benturkia et al., " Initial results from the Sherbrooke avalanche photodiode positron tomograph ," IEEE Trans. Nucl. Sei., 43, 1952-1957, (1996). 2 S. E. Derenzo, R. H. Huesman, J. L. Cahoon, A. Geyer, D. Uber, T. Vuletich and T. F. Budinger "A positron tomograph with 600 BGO crystals and 2.6 mm resolution," IEEE Trans. Nucl. Sei., 35 (1), pp. 659-664, (1988). 3 T. Tomitani, N. Nohara, H. Morayama, M. Yamamoto and E. Tanaka, "Development ofa high resolution positron CT for animal studies," IEEE Trans. Nue!. Sei. 32, 822-825, (1985). 4 R. Lecomte, Sherbrooke University, personal communication, 1998. 5 W.W. Moses and S. E. Derenzo, "Empirical observation for spatial resolution degradation in positron emission tomographs using block detectors," Jour. Nue!. Med. , 33, (5),101-102, (1993).
98

CONCLUSIONS
The spatial resolution (SR) of a PET scanner is determined not only by the size of
the crystals in detectors but also by the use of block detectors. The results that could be
found in literature suggest that in the PET scanners using the block detectors SR is
degraded compared to SR in scanners that use one to one coupling between detectors
and PMTs. This thesis has described the first steps in the investigation of the causes of
the block effect, which blurs the images in PET.
The various experiments done during this study have examined the block effect in
CT! HR+ block detector. We have set-up the experiment, specifically made to measure
the block effect, in which aIl the other factors affecting the SR were minimized and
precisely determined. We measured SR for central crystals and SR for edge crystals in
the block in coincidence with single crystal detector. The results from those
measurements, done with one block detector, show that additional blurring for central
crystals is 0.8 mm and that there is no block effect for edge ones. For two block
detectors in coincidence we estimated the additional blurring to be 1.1 mm.
We also determined the separation for the crystals in the CTI HR+ block detector
and the assignment of territory in the crystal identification matrix to appropriate crystals.
The edge crystals appear to be closer to each other than the central ones. In a very
narrow region, approximately midway between the peaks of each crystal' s territory,
there is a possibility of assigning an event to the wrong crystal. From the results of
crystal separations within the block, we concluded that crystals do not appear to be
uniformly spaced and this must be taken into account when reconstructing images.
99
Our experimental results suggest that poorer SR in PET scanners with block detectors
is not only due to the coupling of many crystals in a block. We concluded that sorne
other effects, apart from block effect alone, could be the reasons of poorer SR in the PET
scanners using block detectors. The measured CAFs and non-uniform sampling are not
sufficient to explain the 2.3 mm block effect, which has been proposed in literature. One
of the reasons for additional blurring in PET scanners using block detectors could be the
under-sampling of the image space with stationary detectors.
This work was aimed at the intrinsic properties of the block effect. We expect to get
better picture from the experiments on a complete PET scanner, to isolate the under
sampling effects from the blurring factors and to have better explanation of the real
cause of the additional blurring in PET scanners with block detectors. The work in this
thesis represents the first step in investigation of the block effect, which degrades the SR
in PET scanners using block detectors.
Since we have shown that the additional blurring seen in PET scanners does not
appear to be entire1y due to something else. Under-sampling of the image seems to be a
possible cause. When one considers the cost of the e1ectronics associated each
individual detector we think that our result represent an important step in the evolution
of PET scanners. The invention of the block detector has a significant advance in PET
technology as it significantly reduces the cost of a PET scanners. A scanner like the CTI
HR + would require 16 times more amplifiers if it used 1: 1 coupling. It would also
require PMTs which are far smaller than any one produced so far (or solid state devices
like avalanche photo-diodes).
100


![APPLICATION IN PET RADIOCHEMISTRY. - Politecnico di … · 1.5.2 Nucleophilic fluorination ... Figure 1.13. [18F]FECH and [11C]Choline uptake mechanism . Figure 1.14. Radiolabelled](https://img.pdfslide.us/doc/110x75/5af4e91e7f8b9a190c8da922/application-in-pet-radiochemistry-politecnico-di-nucleophilic-fluorination.jpg)