Embed Size (px)
Citation preview

NUTRITION AND TUBERCULOSIS
Anurag Bhargava
Department of Epidemiology, Biostatistics & Occupational Health
McGill University, Montreal, Canada
May 2012
A thesis submitted to McGill University in partial fulfillment of the requirements
of the degree of Master of Science
© Anurag Bhargava, 2012

2
TABLE OF CONTENTS
List of figures, tables and appendices ............................................................................................. 4
Abbreviations and Acronyms .......................................................................................................... 6
Abstract (English) ............................................................................................................................ 7
Abstract (French) ............................................................................................................................ 8
Acknowledgements …………………………………………………………………………………………………………………..9
Contributions of candidate and co-authors .................................................................................. 10
Chapter 1 Introduction ............................................................................................................... 11
Chapter 2 Background Information and Review of Literature ................................................... 15
2.1. Pathogenesis of Tuberculosis and its Outcomes ................................................. 15
2.2 Clinical Aspects...............................................................................................................17
2.3. Epidemiology of Tuberculosis .............................................................................. 19
2.3.1. Prevalence of Infection, Annual Risk of Infection and Secular Trends............. 20
2.3.2. Determinants of TB Incidence .......................................................................... 21
2.3.3. Determinants of TB Mortality .......................................................................... 23
2.3.4. Epidemiology of TB in India: Current Burden and Evolution of the Epidemic in
India .................................................................................................................. 25
2.4. Nutrition .............................................................................................................. 27
2.4.1. Definitions and Classification ........................................................................... 27
2.4.2. Causes of Under-Nutrition ................................................................................ 27
2.4.3. Epidemiology of Under-Nutrition with Special Reference to India .................. 28
2.5 Nutrition – Tuberculosis Interactions .................................................................... 28
2.5.1. Effect of Nutrition on Immunity ....................................................................... 29
2.5.2. Effects of Under-Nutrition on TB Incidence ..................................................... 31
2.5.3. Effect of Nutrition on TB Mortality ................................................................... 35
2.6. Effect of TB on Nutritional Status ........................................................................ 38
2.7 Conclusion.……………………………………………………………………………………………………….39
Chapter 3 STUDY 1: Nutritional Status of Adult Patients with Pulmonary Tuberculosis
Diagnosed at a Rural Hospital and Community Health Programme in Central India
during 2004-2009, and its Impact on Treatment Outcomes. ........................................41
Abstract.………………………………………………………………………………………………………………..42
3.1. Introduction……………………………………………………………………………………………………43

3
3.2. Objectives……………………………………………………………………………………………………….43
3.3. Methods………………………………………………………………………………………………………….44
3.4. Results …………………………………………………………………………………………………………...47
3.5. Discussion.………………………………………………………………………………………………………49
3.6. Conclusions...................................................................................................... ..52
Chapter 4 Linking Chapter..........................................................................................................53
Chapter 5 STUDY 2: Can Social Interventions prevent Tuberculosis? The Papworth Experiment
(1918-43) Revisited. ...........................................................................................................56
Abstract………………………………………………………………………………………………………………….57
5.1. Introduction…………………………………………………………………………………………………….58
5.2. Methods. .......................................................................................................................60
5.3. Results……………………………………………………………………………………………………………..63
5.4. Discussion.……………………………………………………………………………………………………….66
5.5. Conclusions. ..................................................................................................................70
Chapter 6 Discussion and Conclusions…………………………………………………………………………………...72
6.1. Synopsis of findings of the Papworth experiment…………………………………………….72
6.2. Limitations and strengths of studies………………………………………………………………..74
6.3. Implications of studies. ...............................................................................................75
6.3.1. Implications at the individual level ……………………………………………………………….75
6.3.2. Implications at the population level: Actions on risk factors and social
determinants as a complementary strategy for TB control and the case of
India……………………………………………………………………………………………………………………...79
6.4. Conclusions……………………………………………………………………………………………………..83
References……………………………………………………………………………………………………………………………….85
Figures……………………………………………………………………………………………………………………………………..94
Tables…………………………………………………………………………………………………………………………………….102

4
List of Figures:
Figure 2.1: Vicious cycle of under-nutrition and TB disease (in both drug-susceptible and drug-
resistant disease)…………………………………………………………………………………………………………………....94
Figure 2.2: UNICEF framework for causes for under-nutrition…………………………………………………95
Figure 2.3: Annual tuberculosis mortality rates England and Wales, 1850-1960……………………..96
Figure 3.1: Box plot of distribution of pre-treatment and post- treatment weights in adult
patients with pulmonary Tuberculosis at JSS ( 2004-2009)........................................................97
Figure 3.2: Box plot of distribution of pre-treatment and post- treatment body mass index in
adult patients with pulmonary Tuberculosis at JSS (2004-2009). ..............................................98
Figure 5.1: Overview of the families and children who were the subject of the Papworth survey
(1918-1943).…………………………………………………………………………………………………………………………….99
Figure 5.2: Summary of the children in the cohorts and the pre-Papworth, Papworth and post-
Papworth periods…………………………………………………………………………………………………………………..100
List of Tables
Table 3.1: The international classification of adult underweight, overweight and obesity
according to body mass index..……………………………………………………………………………………………...101
Table 3.2: Demographic and clinical characteristics of adult patients with pulmonary
tuberculosis diagnosed at JSS (2004-2009).….………………………………………………………………………..102
Table 3.3: Demographic and clinical characteristics of adult patients with pulmonary
tuberculosis who were treated at JSS (2004-2009), stratified by outcomes.…..…………………….103
Table 3.4: Weights, heights, body mass index (BMI) in patients with pulmonary TB at JSS, at
diagnosis and after successful treatment (2004-2009)……………………………………………………….....104
Table 3.5: Pre-treatment weights and BMIs of patients with pulmonary TB at JSS stratified by
treatment outcomes (2004-2009)………………………………………………………………………………………....105
Table 3.6: Univariable and multivariable logistic regression of outcome of TB related
deaths on pre-treatment weights and other covariates……………………………………………………......106

5
Table 3.7: Univariable and multivariable logistic regression of outcome of treatment success on
pre-treatment weights and other covariates………………………………………………….........................107
Table 3.8: Comparative weights and body mass index in patients with pulmonary TB from
other high TB burden countries………………………………………………………………………………………….....108
Table 5.1: Characteristics of source cases for the Papworth children (1918-1943)…………........109
Table 5.2: Characteristics of children in admitted and village-born cohorts at the
Papworth village settlement, U.K. (1918-1943)………………………………………………………………........110
Table 5.3: Prevalence of infection and estimated annual risk of infection in village-born and
admitted cohorts using different methods of analysis.……………………………….…………………….......111
Table 5.4: Mortality and morbidity in the admitted cohort, before admission to Papworth….112
Table 5.5: Mortality and morbidity in admitted and village-born cohorts while living in Papworth
……………………………………………………………………………………………………..…………………………….............113
Table 5.6: Mortality and morbidity in admitted and village-born cohorts after discharge from
Papworth ………………………………….. ……………………………………………………………………………………......114
Table 5.7: Summary of TB incidence rates in admitted and village born cohorts before
admission, while living in, and after discharge from Papworth, Papworth…………......................115

6
Abbreviations and Acronyms
AIDS: Acquired Immunodeficiency Syndrome
AFB: Acid-Fast Bacilli
aOR: Adjusted Odds Ratio
ARI: Annual Risk of Infection
BCG: Bacillus Calmette- Guerin
BMI: Body mass index
CDC: Center for Disease Control
CI: Confidence Interval
DOTS: Directly Observed Treatment, Short-course
HIV: Human Immunodeficiency Virus
ICMR: Indian Council of Medical Research
IR: Incidence rate
IRR: Incidence Rate Ratio
JSS: Jan Swasthya Sahyog
LTBI: Latent Tuberculosis Infection
MTB: Mycobacterium tuberculosis
MDR-TB: Multi-Drug Resistant Tuberculosis
N-AIDS: Nutritionally Acquired Immunodeficiency Syndrome
NFHS: National Family Health Survey
OR: Odds Ratio
PYAR: Person years at risk
PAF: Population Attributable Fraction
TB: Tuberculosis
WHO: World Health Organization
X-DR TB: Extensively Drug Resistant Tuberculosis
7
Abstract (English)
Tuberculosis continues to be a major public health problem in low to middle income countries.
Action on risk factors and social determinants of TB is now being proposed to complement the
current strategy of TB control. Under-nutrition is a biologic factor whose distribution is socially
determined. Under-nutrition impairs cell mediated immunity, which normally prevents
progression of M.tuberculosis infection to active TB. Under-nutrition can increase the risk of TB
incidence, as well as TB mortality, while tuberculosis can worsen under-nutrition. India, the
country with the world’s largest burden of TB (including MDR-TB) also has the largest global
burden of under-nutrition, which is the major risk factor for TB in India. There is little published
information regarding the nutritional status and associated outcomes of patients with
tuberculosis in low income countries such as India, and there have been very few intervention
studies assessing the impact of nutritional interventions on prevention of TB disease.
We reviewed data on nutritional status of 1695 adult patients with pulmonary tuberculosis
diagnosed at a rural hospital and community health programme in central India, and its
association with deaths during treatment and treatment success. Under-nutrition was a co-
morbidity that was highly prevalent, severe, persistent even after successful treatment of
tuberculosis, and associated with a 2-4 fold increased risk of death. We re-analyzed data from
the Papworth village settlement for TB patients, where during 1918-43 in an experimental
intervention, the impact of social interventions including adequate nutrition on outcomes of
incidence of TB incidence and disease in over 300 child contacts of TB patients had been
carefully documented. These interventions could not prevent incidence of TB infection but
prevented almost entirely, TB disease from occurring in children born in the settlement and
resulted in substantial protection from TB disease in other children. Nutritional management is
indicated for patients with severe under-nutrition but the impact of nutritional interventions on
tuberculosis related outcomes like mortality needs to be assessed as a priority in future
research. Interventions to address under-nutrition at the population level could have a
significant effect on TB incidence of TB in adults and children, in India.

8
Abstract (French)
La tuberculose représente toujours un problème de santé publique majeur dans les pays en
voie de développement. Pour complémenter les stratégies traditionnelles de contrôle, la prise
en charge des déterminants sociaux et autres facteurs de risques constitue une avenue à
explorer. La malnutrition est un phénomène biologique complexe comprenant une importante
dimension sociale qui, de par son effet délétère sur les mécanismes d’immunité cellulaire, est
un facteur de risque pour le développement de la tuberculose et en augmente la mortalité. En
Inde, le pays portant le plus lourd fardeau de tuberculose (et de tuberculose multirésistante), la
malnutrition est le facteur de risque principal, et le bilan nutritionnel est le pire au monde.
Cependant, il existe peu de données analysant le lien entre l’état nutritionnel et les issues
cliniques reliées à la tuberculose dans les pays comme l’Inde, et encore moins d’études ont
abordé l’impact d’interventions nutritionnelles sur la prévention de la tuberculose.
Nous avons analysé le parcours de 1965 patients atteints de tuberculose pulmonaire
diagnostiqués par le biais d’un programme communautaire d’un hôpital rural de l’Inde centrale.
Chez ces patients, la malnutrition était sévère, hautement prévalente, et persistait malgré une
thérapie anti-tuberculeuse. De plus, la malnutrition était associée avec un risque de 2 à 4 fois
plus accru de mortalité. Nous avons également procédé à une ré-analyse des données de la
cohorte du village de Papworth, dans lequel une intervention expérimentale portant sur la
modification de certains aspects sociaux pour prévenir la tuberculose, incluant un apport
nutritionnel adéquat, a été étudiée entre 1918 et 1943 chez plus de 300 enfants ayant été en
contact avec la tuberculose. Bien que l’incidence de l’infection par la tuberculose n’a pas été
modifiée par ces interventions, le développement de la tuberculose active a été presque
entièrement enrayé chez les enfants nés dans le village, alors que ceux qui y sont arrivés après
la naissance ont bénéficié d’une protection substantielle.
Les impacts de la prise en charge de la malnutrition sur les issues cliniques reliées à la
tuberculose demeurent toutefois en grande partie inconnus. Étant donné les bénéfices
potentiels reliés à des interventions ciblant ce problème dans des pays comme l’Inde, il est
urgent de considérer ces avenues comme des priorités de recherche.

9
Acknowledgements
As I document, in a part of this thesis, the impact of tuberculosis on the people of rural
Chhattisgarh, I want to acknowledge their unfailing humanity and civility amidst all the
aggravations of poverty and avoidable disease that they suffer. The African proverb “It takes a
village to educate a child “applies equally to the education of a Master’s student. I am grateful
to Dr. Dick Menzies, my primary supervisor, for the guidance, mentoring, and feedback that
made my research a valuable educational experience. I would like especially to thank my co-
supervisor, Dr. Madhukar Pai, for his help in making my training in Epidemiology possible, as
also for his responses, helpful comments, and numerous kindnesses. I thank Dr. Andrea
Benedetti for her help on key statistical issues; thanks are also due to Ms. Caroline Vadnais,
Research co-coordinator, and Ms. Ibtisam Mahmoud, the Librarian at the Montreal Chest
Institute. I wish to acknowledge the extraordinary assistance of the staff at Jan Swasthya
Sahyog in Ganiyari – Rakesh Prajapati, Saukhi Nirmalkar,Mannu Gandharva,Dilharan ,Benbai
Nirmalkar, and Bhuwneshwar Sahu-- in the crucial process of data abstraction. Thanks also to
Drs. Madhuri and Biswaroop Chatterjee, Yogesh and Rachana Jain,Raman and Anju Kataria,
Madhavi Bhargava,Ravi D’souza,and Ramani Atkuri, all of them my colleagues at Jan Swasthya
Sahyog. An unexpected pleasure during the development of the thesis was my contact with Mr.
Peter Pattle, one of the ‘children’ who was part of the Papworth experiment of 1918-1943.
Mr.Pattle, who has been an inhabitant of the Papworth village settlement since 1929, when he
entered it as a four-year old, provided unique information about many aspects of the
settlement. I thank him warmly for his emails and for his handwritten responses to my queries.
I also wish to acknowledge some personal debts. My parents, Deokinandan and Sarla Bhargava,
for giving me many of the values I hold dear; my sister, Aparna Dharwadker, for her editorial
insights and unfailing support over the years; and my brother, Sanjay Bhargava, for shouldering
many a responsibility in India during my stay in Montreal. Finally I wish to thank my wife
Madhavi for all her support, and my young sons Aman and Anshuman for their patience and
understanding about their father’s academic sojourn as a ‘mature’ student at McGill University.

10
Contributions of the candidate and the co-authors:
For the 2 manuscripts contained in this thesis, I (Anurag Bhargava) am the primary author. I was
the lead investigator in protocol development and study execution, entered the data,
performed the analyses, wrote the first draft of all manuscripts, and carried out all revisions.
Manuscript 1:
Drs. Madhuri Chatterjee, Yogesh Jain, Biswaroop Chatterjee, Anju Kataria, Raman Kataria ,and
Ravi D’souza were involved with data collection, abstraction and revisions of the manuscript.
Professors Madhukar Pai and Dick Menzies were the supervisors who contributed to the
protocol development, data analysis, and preparation of the manuscript. Professor Andrea
Benedetti contributed to the data analysis and provided critical comments on the manuscript.
Manuscript 2:
Professor Dick Menzies was the supervisor and contributed to conception and design, data
analysis and interpretation, and revisions of the manuscript. Dr. Madhavi Bhargava contributed
to data abstraction and data analysis. Professor Madhukar Pai contributed to data analysis ,
interpretation, and drafting of the manuscript. Professor Ben J. Marais contributed to the
interpretation of data, and drafting for important intellectual content.

11
CHAPTER 1. INTRODUCTION
Tuberculosis (TB) is a global health problem which exacts a high toll of morbidity and premature
mortality in low and middle income countries. In 2010, an estimated 8.8 million new cases of TB
occurred globally,1 along with an estimated 1.4 million TB related deaths, of which a third
occurred in patients with HIV-TB co-infection.1 India has the largest burden of TB in the world,
with an estimated annual incidence of 2.3 million new cases, and 320,000 deaths annually.1
Unlike the situation in Sub-Saharan Africa, only 5% of cases in India are associated with HIV.1,
2The current response to the TB epidemic in India and other high TB burden countries involves
BCG immunization in children, promoting universal access to TB treatment organized under the
Directly Observed Treatment, Short-course (DOTS) strategy, and increasing access to treatment
for multi-drug resistant TB (MDR-TB) and antiretroviral treatment for those with HIV infection.
The DOTS strategy was expected to lead to significant reductions in TB incidence and mortality,3
but this has not happened, in India, or elsewhere.4 A recent review of data from 134 countries
inferred that TB transmission and incidence were determined largely by biological and socio-
economic factors and that these needed to be addressed.5
Under-nutrition and poverty have long been associated with tuberculosis.6, 7Under-nutrition is
widely present in the developing world, and contrary to popular perception, its prevalence is
higher in South Asia (38-51%, India included) than in Sub-Saharan Africa (26%).8 The highest
rates and largest number of people suffering from under-nutrition occur in India.9 Half of Indian
children have low weight and height for their age, and up to 75 % of them have iron deficiency
anemia, while a third or more of adult men and women have a body mass index (BMI) of less
than 18.5 kg/m2.10
The linkage between under-nutrition and infectious diseases like tuberculosis is of crucial
importance to public health in low-middle income countries. These linkages were noted more
than a century ago and have been strengthened by evidence from ecologic, observational, and
experimental studies and developments in the field of immunology. However, after the advent
of chemotherapy, linkages between TB and nutrition were considered peripheral to TB control.
Sir Hugh Beevor commented in 1901 “As the wages rise, phthisis rates fall: this fall affects

12
especially the young; it is due to food supply.”11, while Major Greenwood* noted“...a principal
determinant of mortality in tuberculosis is nutrition.”12In the pre-chemotherapy era, adequate
balanced food was considered an essential part of treatment for patients and prevention of TB
in infected contacts. A consistent association between food availability during the great wars
and TB mortality was noted in many countries. A review in 1959 highlighted that under-
nutrition and infections had a synergistic association.13, 14Infections can lead to under-nutrition,
while under-nutrition can in turn lead to greater prevalence and severity of infections including
tuberculosis.13, 14 This was later shown to be due to impairment of immunological responses to
infections in cases of under-nutrition. Cell-mediated immunity, which is crucial in resistance to
M.tuberculosis, was found to be particularly impaired in cases of under-nutrition, and so has
been termed “the leading cause of acquired correctable immune system dysfunction
throughout the world.”15A number of large cohort studies in the 1950-1980s established the
relationship between being underweight and of low BMI and TB incidence16-18. A recent analysis
based on data from these studies showed a consistent inverse logarithmic relationship
between BMI and TB incidence and concluded that that the association between nutritional
status (as measured by BMI) and TB incidence fulfilled the criteria for causality.19 In children
under five years of age, under-nutrition became an even greater public health priority when it
was shown that 50% of deaths attributed to childhood infections in this age group were due to
the potentiating effect of under-nutrition.20
The persistence of significant TB mortality and lack of decline in TB incidence has led to a
resurgence of interest in under-nutrition and other social determinants of TB.21-23 The evidence
for a causal association between under-nutrition and TB, and the quantitative relationship
between BMI and TB incidence, was summarized in recent systematic reviews.6, 19In 22 high
burden countries, under-nutrition has been identified to account for the highest population
attributable risk for TB.24A recent systematic review found a consistent association between
under-nutrition and mortality in both HIV negative and HIV positive TB patients.25 A recent
cohort study found that under-nutrition in childhood contacts was associated with the highest
risk of development of TB, and suggested that improved nutrition as an intervention to reduce
* The first professor of epidemiology at the London School of Tropical Medicine and Hygiene

13
TB incidence should be evaluated in prospective studies.26 A population based cohort study
conducted between 1972-1992, showed that nutritional status had a strong association with TB
incidence in adults in the U.S independent of socio-economic, demographic, and medical
characteristics, and that persons with low BMI, decreased subcutaneous fat and skeletal muscle
had a 5.5-12 fold increased risk of TB incidence compared to persons with normal nutritional
status.27 The acceptance of under-nutrition as a major contributor to the epidemic of TB is still
slow. A recent TB update in a leading journal failed to mention under-nutrition as a risk factor
for TB.28
We explored in this thesis, the bidirectional interactions between nutrition and tuberculosis in
high TB burden settings in the current and the pre-chemotherapy era. In the first part of this
thesis we report on the effect of tuberculosis on nutrition in a retrospective analysis of
nutritional status of a consecutive cohort of 1,695 rural patients over 18 years of age diagnosed
with pulmonary tuberculosis in rural central India in the state of Chhattisgarh during 2004-
2009.Our primary objective was to assess the association of the nutritional status with
pulmonary tuberculosis related mortality during treatment, and treatment success. Our
secondary objective was to compare the nutritional status of TB patients at baseline and at the
completion of therapy. There is a paucity of information on nutritional status of TB patients in
India and its implications, and a particular lack of data from its rural areas where prevalence of
both TB and under-nutrition is higher. A recent study was limited to urban HIV positive
patients,29 while the effect of under-nutrition on TB mortality was evaluated in only one
study.30 Other studies have investigated the impact of under-nutrition on TB mortality in HIV
positive patients,31-33 or in hospital settings in low incidence countries.34
In the second part of the thesis, we examined the effect of adequate nutrition (as part of a
package of social interventions) on incidence of TB infection and active TB in a group especially
vulnerable to development of active TB-children living in contact with patients with active TB.
We reanalyzed, using current epidemiological and statistical methods, a cohort study
conducted in the pre-chemotherapy era in which the impact of social interventions(including
adequate nutrition) on incidence of TB infection and disease, as well as related morbidity and
mortality, was estimated.35, 36This study was widely commented upon in the medical literature

14
of the day, but hardly cited later, and did not find mention in a recent comprehensive review of
contact studies from the pre-chemotherapy era.37 The Papworth village settlement founded in
1918 by Sir Pendrill Varrier-Jones in Cambridgeshire UK was considered by the Lancet as “the
most comprehensive effort to deal simultaneously with every aspect of the TB
problem.”38There, TB patients discharged from a sanatorium were provided assured
employment in industries, adequate nutrition, better housing, and close medical supervision.39,
40 A medical team closely monitored the health status of children at a weekly clinic, provided
advice on nutrition, and conducted evaluations for TB related outcomes. The results of the
evaluations for TB infection and disease were published as a monograph of 674 pages in which
the individual and family level demographic and medical information was available.36 We used
the data from this published monograph on outcomes in 315 children from 135 TB affected
families who lived in the settlement between 1918 and 1943. Our objective was to estimate the
effect of the residence within the Papworth village settlement on the incidence of TB infection
and disease in children who were household contacts of TB patients.

15
CHAPTER 2. BACKGROUND INFORMATION AND REVIEW OF LITERATURE
2.1. Pathogenesis of Tuberculosis and its Outcomes
The causative organism of Tuberculosis is Mycobacterium tuberculosis (MTB), a slow growing
bacterium of the same family as the organism which causes leprosy. The following is a
simplified schema of the events involved in the pathogenesis of tuberculosis and its outcomes
under natural conditions without chemotherapy, as suggested by Rieder.41 The events are
exposure to organisms, development of infection, progression of infection to disease, outcomes
of disease. The actual details are a still evolving story of complex interactions between a
diversity of cells and cytokines which mediate the immune response, and a sophisticated array
of molecules and processes that the Mycobacterium uses to evade death, while living inside
what is arguably one of the most hostile environments for a pathogen.
Exposure to Organisms: This occurs when a patient with active contagious TB of the lung
releases infectious droplets in the air during speaking, coughing, or sneezing. These bacteria
form droplet nuclei which are infective to another person when inhaled. The risk of exposure
rises with the risk of inhaling infectious droplets and is proportionate to the number of cases,
the number of air exchanges in the room per hour which can dilute the droplets, the availability
of sunlight which can destroy the organisms, etc. Higher rates of exposure to M.tuberculosis will
occur where the number of cases are higher, housing is poor with overcrowding and
inadequate ventilation, and access to care is lacking, all of which occur in resource limited
communities.42
Primary Infection: The mycobacteria in the droplet nuclei are carried straight to the alveoli
where they infect macrophages, multiply inside them, leading to their death. Initially, the
macrophages are unable to clear the infection; the bacteria reach the lymph nodes and may
even enter the systemic circulation and seed different organs. However, within 2-6 weeks, the
infection is followed by a cellular immune response generated by interactions between CD4+ T
lymphocytes and infected macrophages which involve release of cytokines and chemokines.
This cellular immune response results in the formation of a granuloma in the lungs or other

16
sites, and in a delayed type of hypersensitivity reaction to the cell wall protein of the bacilli,
manifested as a positive tuberculin skin test.
Latent TB Infection: The immune response is able to contain the mycobacterial infection at the
sites of infection, but often unable to “sterilize” them, and these foci become associated with a
state of latent TB infection (LTBI) with M.tuberculosis in which the person is healthy and
asymptomatic, and the infection is present in an enclosed environment in a non-transmissible
state. The granuloma in the lung may manifest as a Ghon focus, often accompanied by
enlargement of hilar lymph nodes, and may be visible on an X-ray. Sometimes these foci calcify.
An estimated 2 billion people worldwide have LTBI,43 and form the reservoir for potential future
cases of TB disease.
The likelihood of getting infected with M.tuberculosis depends upon the infectivity of the
source case (smear positive cases are more infectious), proximity and duration of contact,
susceptibility of the host (increased by malnutrition, HIV, or genetic factors), and environmental
factors (like overcrowding).
Progression from Latent TB Infection to Active TB: If the person is unable to control the initial
infection, active disease or “progressive primary disease” can result, especially in children, and
can give rise to extensive disease in the lung or meningitis. In another scenario, the latent foci
of TB infection in the body can undergo “reactivation” months, years or decades later to result
in active TB or “post-primary disease”. This process of reactivation occurs with the weakening
of the immune response, breakdown of the granuloma, and active uncontrolled replication of
mycobacteria with resultant disease in the lungs or other organs.44 This “reactivation” type of
tuberculosis is usually seen within 2-5 years post-infection, but is also often observed even
decades after the primary infection in elderly people in developed countries. The reactivation
process is associated with liquefaction and necrosis in the granulomas, which in the lung results
in the formation of cavities. Cavities are associated with higher bacillary burdens, usually smear
positive disease and risks of disease transmission.
Due to factors still poorly understood, the clinical presentation of tuberculosis differs according
to age. Young children have a higher likelihood of and faster progression to active TB, with

17
more frequent dissemination of disease. They are less likely to have cavities in their lungs, and
more likely to have serious forms of extrapulmonary disease like meningitis. In the pre-
chemotherapy era and before the introduction of BCG, TB meningitis was a leading cause of
death in infants and young children infected with M.tuberculosis.
The lifetime risk of progression to active TB in older children and adults without any medical
problems is about 10%.42Within a few years, 5% of infected people progress to disease. The risk
of active TB is markedly increased by HIV infection. However, other factors which impair cell-
mediated immunity like under-nutrition, diabetes, and immunosuppressive drugs also increase
the risk of active TB.
Outcomes of Active TB: Active untreated TB of the lungs has a fatality rate of 20-70%
depending on the smear status (fatality is higher in smear positive pulmonary TB),45 while
spontaneous cure occurs in about 30% of patients with smear positive TB.46 Some forms of
extrapulmonary TB involving the central nervous system, intestines, and heart can also be fatal.
Apart from fatality, there is a substantial amount of morbidity in the community due to
pulmonary tuberculosis (TB in the lung), and extrapulmonary tuberculosis (TB in organs other
than the lung).
Timely access to effective anti-TB drugs can dramatically reduce the fatality rate, although
disability may still result from tuberculosis. In many parts of the world, poor access to
healthcare, delays in diagnosis, errors in treatment and adherence, and co-morbidities maintain
a high death rate due to TB.
2.2. Clinical Aspects
2.2.1. Diagnosis and Treatment of LTBI and TB Disease
Subjects with LTBI do not have any clinical abnormalities. The tests used to diagnose them are
the tuberculin skin test and the newer interferon-gamma release assay, both of which assess
cell-mediated immune responses to M.tuberculosis. These tests do not distinguish between
latent TB infection and TB disease, and in the case of the tuberculin skin test, can be affected by
prior BCG vaccination and exposure to non-tuberculous mycobacteria. Subjects at high risk of

18
LTBI (child contacts of TB patients) and/or high risk of developing active TB are treated with
Isoniazid (INH) for 9 months.
Subjects with TB disease have symptoms and signs depending on the site of involvement, but
may share common symptoms like fever, loss of appetite and weight loss. The most definitive
tool for diagnosis of active TB is demonstration of M.tuberculosis in a culture of sputum or
other relevant specimens. In low resource settings with lack of culture facilities, demonstration
of acid-fast bacilli (AFB) in sputum smears of patients with pulmonary TB is used in lieu of
demonstration in culture, while in cases where the sputum smear is negative; TB is diagnosed
on the basis of symptoms and compatible radiographic abnormalities. In children where cough
may not be accompanied by sputum, a combination of symptoms, a positive tuberculin test,
and radiologic features are often used to diagnose active TB.
Treatment of patients with tuberculosis depends on the susceptibility of the organisms to anti-
TB drugs. In patients with drug susceptible tuberculosis, the therapy consists of using4 anti-TB
drugs –isoniazid, rifampicin, pyrazinamide, and ethambutol. All of these are used in an initial
intensive phase of 2 months, followed by administration of isoniazid and rifampicin in a
maintenance phase of 4 months. In patients who have drug resistant M.tuberculosis, either as a
result of infection with drug resistant organisms, or prior ineffective or interrupted treatment,
drug therapy is tailored to the drug susceptibility pattern. Over the last 3 decades, in parts of
the world where TB control programs have been functioning poorly, drug resistance in MTB is
increasing. Organisms resistant to more than one drug, known as multi-drug resistant
tuberculosis (MDR-TB) are increasingly being encountered. Therapy for these forms of drug
resistant TB carries higher risk of failure, consists of a larger number of drugs (often 5-6 drugs),
and is given for a longer duration (24 months).In low resource settings where neither cultures
nor susceptibility tests are available, therapy often uses standardized regimens based on
treatment history.
2.2.2 Adjunctive Treatments in Patients with Tuberculosis
Adjunctive treatment in patients with tuberculosis is given for co-morbidities, of which the
most important is HIV infection. Such patients are initiated on anti-retroviral treatment. The
19
other common co-morbidity is under-nutrition. As patients with TB are often poor and may
experience food insecurity, treatment programs in high income countries and some countries
like Cambodia address this issue by offering food assistance, supplements or coupons.47
However, in the WHO recommendations for drug-susceptible TB, there is at present no
guideline or advice in this respect. In patients with MDR-TB however, the WHO recommends
nutritional support to under-nourished patients to prevent the worsening of disease.48
2.2.3. The DOTS Strategy of the WHO
The DOTS (Directly Observed Treatment, Short-course) is a WHO-recommended TB control
strategy which was launched in 1993 in response to the worsening global TB epidemic.49 The
components of this strategy included raising the level of political commitment to TB control,
case finding based on smear microscopy, standardized short course chemotherapy
administered under direct observation, and regular monitoring of treatment outcomes.
Modeling studies predicted that the adoption of this strategy would result in a 50% reduction in
TB incidence in high prevalence countries within 10-12 years, if at least 70% of infectious cases
were detected and at least 85% of those diagnosed were cured.3 Despite nearly complete
global implementation of the DOTS strategy, this epidemiologic impact has not materialized,
which has led the WHO to rethink its TB control strategies. There is a resurgence of interest in
the social determinants of TB, and realization of the need to address them to complement the
present medical model of TB control.21-24
2.3. Epidemiology of Tuberculosis
More than 95% of TB cases and 98% of TB deaths occur in low-middle income countries. Of this
burden of TB, 80% occurs in 22 high TB burden countries.50 The highest TB incidence rates occur
in Sub-Saharan Africa(for example in South Africa, the TB incidence rate is 1,170 per 100,000
population), but nearly half of the world’s cases occur in 5 Asian countries (India, China,
Bangladesh, Indonesia, and Pakistan).50 Worldwide the TB epidemic is an “archetypal disease of
poverty”.51 Low income populations have been shown to have up to four times the prevalence
of infection and seven times the rate of disease and death compared to people in the higher
income categories.51 Seventeen of the e 22 high burden TB countries are low income countries

20
with an annual gross national product of less than $760.51 In addition to monetary poverty,
these populations face food insecurity, poor environmental conditions and barriers in access to
care.51
2.3.1. Prevalence of Infection, Annual Risk of Infection and Secular Trends
A positive tuberculin skin test indicates the presence of infection. In Western Europe, the
infection is concentrated in the elderly population, while in developing countries; young
economically productive individuals have the highest prevalence. An estimate of the incidence
of infection is important to determine the dynamics of TB transmission in the community and
the effect of interventions, but requires repeated skin testing. The calculation of the annual risk
of infection (ARI) is useful in this respect. The average annual risk of infection is calculated from
the observed prevalence of infection, and approximates the incidence of infection.52 It is the
proportion of the population that is infected, or will be infected or re-infected with TB during
one year. It is calculated as follows:
Annual Risk of Infection (ARI) =1- (1-P) 1/A
Where P = Mean prevalence of infection in a specific age group
A= Weighted mean of age at time of survey
The highest ARIs documented were in European countries at the turn of the 20th century, e.g.
France where more than 75% of children were infected by the age of 10,41 and the Netherlands
where the ARI was 10% in 1910. In comparison, the ARI in present day in high TB incidence
countries is between 1-2.5%.3After 1910, there was a remarkable decline of about 5% per year
in the ARI in the Netherlands because of socio-economic improvements and isolation of
patients in sanatoria, even during the era where no chemotherapy was available. This decline
accelerated to 14% per year with the availability of effective antibiotic therapy.53
2.3.2. Determinants of TB Incidence
The transition from latent TB infection to active TB is a critical step in the pathogenesis of TB
and a key target which needs to be addressed in any TB control strategy. The exact mechanism
of this transition in any individual still awaits elucidation, but a number of risk factors have been
identified with increased risk of development of active TB. Some of them have a strong

21
association, but are uncommon at the population level – these are risks associated with
silicosis, gastrectomy, jejuno-ileal bypass surgery, end-stage renal disease, and therapy with
immunosuppressive drugs. The risk factors which have relevance for disease burden at the
population level are discussed below.
1. Time since infection: In about half of TB infected persons, progression to active TB occurs in
the first few years, and later the probability of disease becomes much lower.41
2. Age: The risk of TB disease is maximal below 2 years of age, and is lowest at around 10
years of age. Adolescents and young adults have a higher risk of developing active TB
following latent TB, and susceptibility increases with old age.
3. HIV infection: This is the most potent risk factor for progression of latent TB to active TB,
and HIV infected persons are 20 times more likely to develop TB in the presence of latent
TB than HIV negative persons.50 This is because the HIV virus affects the CD4+ T cells which
mediate the cellular immune response to TB, in a quantitative and qualitative manner. HIV
infected individuals have a 5-15% risk of developing TB per year as against the 10% lifetime
risk for immune-competent subjects,54 and tuberculosis is the commonest infectious cause
of death in persons with HIV disease in developing countries. The HIV epidemic has been
directly responsible for the 2-3 fold increase in TB incidence in Sub-Saharan Africa, and this
dual HIV-TB epidemic has wiped off the gains in life-expectancy achieved in African
countries.50
4. Under-nutrition: Under-nutrition of macronutrients (e.g. proteins, calories) and
micronutrients (e.g. zinc) are associated with immunodeficiency, which translates into
increased risk of developing tuberculosis.6 Epidemiologic studies have estimated a 4 fold
(range 2-6) risk of development of active TB in the presence of under-nutrition.6, 55A strong
protective effect of overweight and obesity on TB incidence was seen in a large cohort
study in elderly subjects in Hong Kong,56 and being overweight or obese also reduced risk
of death and TB in HIV positive individuals.57 Recent evidence suggests possible links
between Vitamin D deficiency and development of tuberculosis, as Vitamin D plays a role in

22
immune responses to mycobacteria.58 However, a causal association has yet to be
established by epidemiologic studies.58
5. Diabetes mellitus: A recent systematic review of 13 observational studies found that
presence of diabetes elevated the TB risk 3 fold.59 In light of the rising prevalence of
diabetes in many TB endemic countries, this assumes public health significance.60
6. Substance use- smoking, alcohol: Smoking has been found to be consistently associated
with 2 fold risk of developing TB infection and disease in numerous observational studies.61
7. Genetic factors-gender: TB in adolescents is equally common in men and women. In older
ages in high TB burden countries like India, the ratio of men to women is 2:1. However, in a
trial conducted in Puerto Rico, incidence of disease was higher in women, as was the case
in a national survey in Denmark.41 It is not clear whether there is a biologic difference in
susceptibility. Genetic factors -race: There is no evidence for differential susceptibility to
TB following latent TB with respect to race.
8. Exposure to indoor air pollution: A relation between indoor air pollution due to exposure to
biomass fuels and risk of active TB was put forward on the basis of some case control
studies, but results were not consistent.61
A recent review evaluated the role of some of these risk factors on the TB burden in 22 high
burden countries, based on the strength of their associations and their prevalence in the
populations. The weighted average of the population attributable fractions for some of these
risk factors were HIV infection (11.0%), under-nutrition (26.9%), diabetes mellitus(7.5%),
alcohol misuse (9.8%), and smoking (15.8%).24
2.3.3. Determinants of TB Mortality
TB continues to cause a high number of deaths globally, which in the low-middle income
countries occur predominantly in the 15-49 years age group. These premature deaths have a
devastating impact on the families, communities and countries affected. Deaths in patients with
TB can occur due to the effects of the TB disease itself or the associated co-morbidities like HIV

23
infection and their complications. Death can occur if tuberculosis has remained undiagnosed,
early within the first 2 months of therapy usually because of overwhelming disease, or after
completion of therapy (when it is related to the sequelae of TB in the lung).25In low-middle
income countries, systems of vital registration are often weak and medical certification of death
may occur in a minority as many deaths occur at home. Given these limitations, the WHO
considers TB deaths as any death occurring during treatment of TB.25 In the younger age groups
in low-middle income countries with low HIV prevalence, most of such deaths will truly
represent TB deaths, but this definition excludes deaths occurring after interruption of therapy,
and those occurring after completion of therapy. In a recent systematic review and meta-
analysis, the pooled percentage of TB patients dying during TB treatment was 18.8% (95% CI:
14.8-22.8%) in HIV infected persons and 3.5% (95% CI: 2.0-4.9%) in HIV uninfected persons.25 In
the HIV infected group, half of the deaths during treatment could be attributed to TB,
compared to more than three quarters of deaths in the HIV uninfected group.45 Identifying the
risk factors for TB mortality may help in devising adjunctive interventions to prevent mortality.
The evidence for various risk factors of TB deaths has been recently summarized25, 62 and
includes increasing age, HIV infection, under-nutrition, smoking, alcohol use, as well as certain
disease specific factors:
1. Lack of diagnosis of TB: A number of patients, especially patients with HIV disease or those
with poor access to care may die of TB without being diagnosed. This is an important cause
of TB related mortality in low-middle income countries.
2. Site of TB: Most of TB deaths occur in pulmonary TB, but there are fatal extrapulmonary
forms of TB as well.
3. Extent of TB: Extensive TB of the lungs with cavities is a risk factor for death. This can cause
mortality even in the first 2 months of therapy.
4. Sputum AFB smear result: In the pre-chemotherapy era, mortality was very clearly linked to
smear status. In patients with smear positive pulmonary TB, the case fatality rate was about
70%, while in patients with smear negative pulmonary TB, the rate was around 20%.62 The
average duration of disease before death was about 3 years, and was similar in the 2

24
groups.62 In the era of HIV, smear negative TB is associated with more advanced HIV disease
and has been linked to higher mortality in many reports.62
5. Drug resistance: The risk of death is elevated in drug resistant TB because such patients may
not receive effective antibiotic therapy in high TB burden countries.
6. HIV infection: This factor is strongly associated with TB death, and the risk increases with
accrued immunosuppression with advanced stages of HIV disease. Death may result from
TB or just as commonly from other opportunistic infections like pneumonia, and septicemia,
which can occur in HIV disease.63
7. Under-nutrition: Undernutrition is an established risk factor for mortality. Severe under-
nutrition leads to loss of body cell mass, and studies in starvation and AIDS have shown that
when this loss approaches 40% death becomes inevitable.64 Low body mass index was
identified as an independent risk factor for all cause and TB mortality in cohort studies,
which had adjusted for the effects of smoking and pre-existing disease at baseline.65-67
In patients with active TB, under-nutrition has been consistently associated with risk of
death in both HIV positive and negative subjects,25 with both early death and death after
completion of treatment,25 and with death in the community as well as in hospital
settings.68, 69 A weight of < 35 kg was associated with a 4 fold risk of death in an Indian
study,30 while in Zambia a weight of >55 kg was associated with lower death rates.70 A BMI
of less than 17 kg/m2 was associated with increased risk of death in the first month of
treatment ,1 while in a study from Guinea-Bissau, the mid-upper arm circumference (MUAC)
was related in a dose dependent manner with the risk of death. MUAC measurements
reflect protein reserves and a MUAC of <23 cm in men and <22 cm in women is considered
suggestive of under-nutrition.71
8. Age and gender: Increasing age is associated with higher risk of death, but TB patients in
India in the 15-44 years age group had a mortality rate 12 times higher than that of the
same age group in the general population.72 Many studies have reported higher death rates
with men, but the evidence is not conclusive.25

25
9. Smoking and alcohol: Alcohol use is a risk factor for TB death, especially in countries like
Russia and Brazil.25 A recent systematic review found that smoking elevated the risk of TB
disease in infected persons (RR of 1.4-1.6), but could not find clear evidence of any
additional mortality risk due to smoking in patients with active TB.73
10. Poor adherence to therapy: This is an important risk factor in many countries where social
factors and/or poorly functioning TB control programs contribute to non-adherence. One
third of patients who interrupt therapy die within a few years.25
2.3.4. Epidemiology of TB in India: Current Burden and Evolution of the Epidemic in India
70% of Indians live in villages. According to a National Family Health Survey-3(NFHS-3)
conducted in 2005-2006, rural areas of India also have a higher prevalence of self-reported TB
of 469/100,000 compared to 307/100,000 in urban areas.10 The prevalence of self-reported TB
is higher in men compared to women (6/100,000 vs. 309/100,000). The National Family Survey-
2 (NFHS-2) conducted in 1998-1999 showed 3 fold higher prevalence of TB in households with
low standard of living index compared to those with high standard of living index. Women
belonging to the “indigenous groups”(scheduled tribes) had a self-reported TB prevalence 7
times that of women of upper castes.74
If we trace the evolution of TB in India in the last 150 years, the historical record is sparse, but
yields some surprising information. In a 1920 monograph, Lankester summed up the available
information on TB and its trends in India.75 The monograph had accounts of British doctors,
many of whom were working in different parts of the country for decades, which were
consistent on the point that tuberculosis had appeared to be uncommon/non-existent in their
areas earlier, but appeared and increased in prevalence in the late 19th century.75 The origins of
the epidemic seem linked to urban centers, and spread to rural areas through migrant
workers.75 Unlike the trend in Western Europe, where TB declined after a peak in the mid-
nineteenth century, in India, the epidemic gradually increased in numbers, and geographic
spread. 76As antibiotics for TB were not available in either India or Europe until 1950, the social

26
determinants of the increase in India would require an analysis, similar to the analysis of the
decline of TB in the West. One factor which could have played a crucial role is under-nutrition.
The period of 1871-1921 saw repeated famines in India in which millions died and the effect of
the uneven rainfall was compounded by British administrative and economic policies,77 a fact
pointed out by a person no less than Florence Nightingale.78 However, even in the 1920s, a
tuberculin survey in four zones of India revealed age-specific prevalence rates of infection
significantly lower than those reported in European countries.76
In the post-independence period,79 a detailed survey was done in 6 cities and surrounding rural
areas in 1955-1958 to assess the epidemiology of TB in India. The prevalence of TB in urban
areas varied from 240/100,000 to 638/100,000, while in rural areas it varied from 211/100,000
to 611/100,000. However, in 5 of the 6 zones, the prevalence of culture positive cases in cities
was higher than in villages, in contrast to the present higher prevalence of self-reported TB in
rural areas.80 No decline in incidence or prevalence of pulmonary TB over the period 1960-1986
was observed in epidemiological studies.81 The recent two decades have seen significant
economic growth in India, but this has not been reflected in any decline in prevalence of TB, as
seen from the results of the 2 successive National Family Health Surveys (NFHS-2 in 1998-1999
and NFHS-3 in 2005-2006). It is pertinent that between 1999 and 2006 there has also been no
improvement in the problem of under-nutrition. Lankester noted in 1920 that “Malnutrition is
also a most important predisposing condition, and in the cities the steady and marked rise in
the price of foodstuffs has in a multitude of cases resulted in a gradual semi-starvation.”75 The
current era of high food prices and a global financial crisis has worsened access to food in low-
middle income countries including India.82 This has implications on the prevalence of under-
nutrition, which is the mostly widely prevalent risk factor for TB in India.

27
2.4. Nutrition
2.4.1. Definitions and Classification
Malnutrition is often used interchangeably with under-nutrition, but actually refers to all
deviations from adequate and optimal nutritional status and includes thereby both under-
nutrition and over-nutrition (obesity).83 The constituents of an optimal diet should include
macronutrients, such as carbohydrates, proteins, and lipids, and micronutrients, such as iron,
vitamins, and other minerals and trace elements, in adequate amounts and appropriate
combination. Under-nutrition refers to poor nutritional status, which is caused primarily by an
inadequate intake of macronutrients and thereby implies underfeeding.83 Under-nutrition is
usually associated with one or more micronutrient deficiencies, but the converse is not true.
The body mass index (BMI), a measure of weight adjusted for height ([weight in kg]/ [height
in meter]2) is used to define states of under-nutrition and over-nutrition in adults. There is a
widely accepted classification of nutritional status of adults based on the BMI which is given in
table 1. In the case of under-nutrition in children, weight and height according to age are
measured. If the values are below -2 standard deviations of the median values according to the
WHO child growth standards, underweight (low weight for age) and stunting (low height for
age) are diagnosed.
2.4.2. Causes of Under-Nutrition
A broad framework for understanding causes of under-nutrition in low-middle income
countries has been developed by the UNICEF( figure 2.2).84 This framework is useful while
addressing under-nutrition as a public health problem.
1. Basic causes which operate at the societal level: Political, social, and economic factors are
associated with lack of capital at various levels, which leads to income poverty.
2. Underlying causes which operate at the level of households and communities: Income
poverty is associated with food insecurity, inadequate care (delayed weaning), unhealthy
environment (lack of access to clean water, sanitation) and poor access to health services
which lead to under-nutrition and infections.

28
3. Immediate causes operate at the individual level: Infections lead to decreased intake and
worsen the under-nutrition, while under-nutrition leads to more severe infections.
2.4.3. Epidemiology of Under-Nutrition with Special Reference to India
Under-nutrition in low-middle income countries differs from that in high income countries. In
high income countries, macronutrient under-nutrition occurs in small groups of people, such as
the elderly, hospitalized patients, patients with cancer, anorexics and the homeless. For
example, in the US, less than 5% of newborns are underweight (weight <2500 g),and less than
3% of 20 year old males are underweight (BMI of less than 18.5 kg/m2).85 In low-middle income
countries, macronutrient under-nutrition affects larger parts of the population, across gender
and age groups. For example in India, 30% of newborns are underweight, 86 and more than 30%
of both adult men and women have a BMI of less than 18.5 kg/m2.10
Burden and Consequences of Under-Nutrition in India: The burden of undernourished people
in India is the highest in the world. In 2006-2008, India had an estimated 224.6 million under-
nourished people compared to an estimated 217.5 million undernourished people in the entire
Sub-Saharan African region.9 Under-nutrition has serious consequences for all age groups. Of
the 2.1 million deaths in children under five, 50% are attributable to under-nutrition, while
maternal under-nutrition contributes both to maternal and infant mortality. Recent research
has also revealed adverse long-terms effects of fetal under-nutrition,87 including effects on
immune function,88 and susceptibility to non-communicable diseases.87 This effect of fetal
under-nutrition is relevant to India where the prevalence of non-communicable diseases is on
the rise in both rural and urban areas.
Worsening Food Insecurity in India: At present, more than three quarters of the population live
in households with per capita calorie consumption below 2,100 per day in urban areas and
2,400 per day in rural areas, caloric requirements considered as “minimum requirements” in
India.89 The most worrisome aspect of food security in India is the indication that it is worsening
in spite of rapid economic growth. The National Sample Survey found that between 1983 and
2005, the per capita levels of caloric intake and protein consumption have declined in rural and
urban areas, with a steeper decline in rural areas.89 While mean per capita caloric consumption

29
declined by 8.6% from its 1983 value of 2,240 calories, protein consumption declined by 12.1%
over the same period in both urban and rural areas.89 The current levels of mean capita calorie
consumption in India are lower than the calorie consumption in mid-nineteenth century
England, which has been estimated at 2,362 by Robert Fogel and colleagues.90 It is important to
consider that these are average figures of consumption, and do not reflect calorie
consumptions in marginalized groups like tribals (indigenous people), which are most affected
by under-nutrition.91 In Chhattisgarh, the mean per capita calorie consumption in 2004-2005
was found to be even lower among the indigenous people – 1,600-1,900 calories per day.91 The
effect of this deterioration in food security is seen in the NFHS-3 data where prevalence of
under-weight in children has not declined, while prevalence of anemia in children and women
has increased in India. This situation has grave implication for the problem of under-nutrition as
well as tuberculosis in India.10
2.5. Nutrition – Tuberculosis Interactions
2.5.1. Effects of Nutrition on Immunity
2.5.1. A) Under-Nutrition and Immunity in General
An optimal nutritional status contributes to immuno-competence. The microbial defense
system of the body consists of an integrated system of anatomic and physiologic barriers,
innate immunity and adaptive immunity. The barriers consist of intact skin and mucosal
membranes, acidic pH in the stomach, etc. Innate immunity is the body’s first line of defense
and has a cellular component (neutrophils, macrophages, natural killer cells, dendritic cells) and
a humoral component made of the complement system. The adaptive immune system is the
most sophisticated system as it can generate highly specific responses as well as immunologic
memory. This system consists of T cells which generate cell-mediated immune responses and a
humoral component with B cells which elaborate immunoglobulins.
Under-nutrition which often coexists with deficiencies of specific micronutrients like vitamin A
and C, iron and zinc, has effects on all 3 arms of the microbial defense system. Barrier functions
can be impaired by vitamin A deficiency. In the innate system, phagocytosis and the production
of reactive oxygen and nitrogen intermediates by neutrophils are affected, complement levels

30
are reduced, levels of natural killer cells are decreased, and macrophage activation is impaired
in under-nutrition.92, 93 Under-nutrition affects both the components of the adaptive immunity,
though the cellular component is more affected than the humoral component. Production of
immunoglobulins, especially against capsulated organisms like pneumococcus and H.influenzae,
are affected and increase the susceptibility to these infections, while decreased
immunoglobulin A levels compromise mucosal immunity in the gut and respiratory system.
With regard to the cell-mediated immunity, a host of components and mechanisms
contributing to it are affected. Under-nutrition leads to atrophy of lymphoid tissues, including
the thymus gland, with decreased counts of T lymphocytes, reduced ratio of CD4/CD8
lymphocytes and increased number of immature T cells in the peripheral blood.6 In a study in
mild to moderately undernourished children, cell-mediated immune responses were found to
be impaired in a rather dose dependent manner, suggesting that severe under-nutrition was
not required to produce immunosuppression.94
2.5.1. B) Under-Nutrition and Immunity with Specific Reference to Tuberculosis
Experimental models of human tuberculosis have been studied to investigate the precise
nature of the immune deficit with under-nutrition and the effect of deficiencies of specific
nutrients. A low infecting dose guinea pig model is relevant because it closely mimics the
pathogenesis of tuberculosis in human.95 In this model, zinc and Vitamin D deficiencies did not
alter the natural course of tuberculosis, or interfere with the protection conferred by BCG.96,
97However, protein deficiency (feeding with a 10% ovalbumin diet) had 2 major effects in this
model. The first was a loss of innate and BCG vaccine induced resistance to tuberculosis with
marked loss of T cell functions and impaired granuloma formation.98 The loss of resistance was
related to altered numbers and subpopulations of T cells, decreased antigen induced
proliferation in T cells, impaired production of protective cytokines like Interleukin-1,
Interferon-γ, Interleukin-2, tumor necrosis factor-α, and anti-mycobacterial molecules like nitric
oxide, and effect of suppressor cytokines like transforming growth factor-beta which were
found to be increased in protein deficiency. These defects were found to be reversible following
institution of a high protein diet.99 Findings significantly similar to the low dose guinea pig
model were also seen in a mouse model. Mice fed with a 2% protein diet rapidly succumbed to

31
infection with M.tuberculosis, but the fatal course of the disease was reversed by a 20% protein
diet.100
These experimental studies suggest that the resistance mechanisms to M.tuberculosis are
impaired by protein deficiency and offer the possibility that nutritional interventions can
reverse this loss of resistance. Both HIV/AIDS and under-nutrition increase the risk of TB by
causing immunodeficiency, especially in the cell-mediated immune system. This similarity led a
nutritionist to term under-nutrition and its associated immunodeficiency as “nutritionally
acquired immunodeficiency syndrome or N-AIDS.”92
2.5.2 Effects of Under-Nutrition on TB Incidence
Since the time of Hippocrates, weight loss has been recognized to be a consequence of
tuberculosis. Thus, exploring the causal role of under-nutrition in a patient with active TB is
confounded by this potential for reverse causality. Observations of nutritional status measured
before development of TB are sparse. A recent systematic review summarized 6 large studies
done between 1957-2007, and found a consistent and strong inverse log-linear relationship
between body mass index and incidence of TB.19 However, a review of the earlier literature
revealed some prescient observations made on nutritional status and TB which were not
included in the recent systematic reviews.6, 19A. Huntington (1876): “Forty deaths of
underweights included no less than 25 of consumption, and 5 of dropsy of the heart and liver.
Consumption very, very often sends out its warning voice far in advance of its active
coming,(italics added) and in many cases this interference with the tissue making powers of the
human system foreshadows the coming of tuberculosis.”101
Arthur Hunter, actuary of the New York Life Insurance Company (1913):“At age of entry 30-44,
the death rate due to tuberculosis was nine times as heavy among the under-weights as among
the over-weights.”102
The association between being underweight and TB risk in fact translated into higher insurance
premiums for underweight persons, before the association of overweight and obesity with
excess deaths was recognized.103

32
2.5.2. A) Some Cohort Studies on Weight, Amount of Subcutaneous Fat and Risk of TB
In 1929, Reed and Love analyzed a cohort of 5,021 military officers commissioned between
1901 and 1916 in the US Army in which weight, height records at commission, results of annual
physical examinations, and results of evaluation for TB were available.101 A total of 106 cases of
TB were diagnosed in this cohort. The mean weights of those officers at specific ages were
compared to those in the general group who did not develop TB. Mean weights documented
between 7.5 -20 years before diagnosis of tuberculosis were found to be 13-15 lbs lower than
the mean weights of those who remained disease free.101 Similar findings were reported by
Long and Jablon in army recruits during World War II.104
In an interesting case-control study published in 1955,105 Berry and Nash first validated a
measure of the fat layer visible in mass miniature radiographs against the measurements of
subcutaneous fat made with calipers. When the X-ray based measurement were found to be
valid, they studied 51 patients with pulmonary TB, matched with 2 age, sex, occupation
matched controls who had undergone X-rays at the same time. The fat measurements in the
baseline normal X-rays of subjects who had later developed tuberculosis were compared with
similar measurement made in the controls. The assessors were blinded to the disease status of
the subject. The median time between normal X-rays and the subsequent diagnosis of TB was
16 months. The difference in the fat thickness between patients and controls was clinically and
statistically significant.
In 1966, Comstock and Palmer published results from a long term follow up study of BCG
vaccination in which the association between subcutaneous fat thickness and incidence of TB
was examined. It was found that TB incidence was 2.2 times higher in those with subcutaneous
fat of 0-4 mm thickness than in persons with subcutaneous fat thickness of 10 mm or more.106
A cohort of 616 men who had undergone partial gastrectomy for peptic ulcer and who had
normal X-rays were followed up over a 1.5 to 6 year period. Sixteen patients developed TB and
the incidence was 14 times higher in those who were 15% or more below ideal weight at the
time of surgery.107

33
2.5.2.B)Large cohort studies which examined the relationship between anthropometric
measures and TB incidence, and which have been the subject of a recent systematic review19
In a large cohort study conducted in 1957, Palmer and colleagues reported TB incidence in
68,754 young US Navy recruits (age group 17-21) in relation to tuberculin sensitivity and body
build. The average follow up was 4 years. All types of active TB were ascertained from annual X-
ray screening records and 109 cases of TB were diagnosed in this cohort. The incidence rates in
the tuberculin reactors were 5 times that of the non-reactors. In a stratified random sample of
1,138 men, the relation between height, weight and incidence of TB was studied. Subjects were
classified as different grades of underweight, within 5% of standard, and overweight on basis of
deviation of weight for the median weight for that height in the study sample. TB incidence in
those underweight by 15% by the above standard was 3.94 times higher than in those who
were overweight by 5%. The authors interpreted these results not in terms of nutritional status,
but in favour of a certain ‘body build’ underlying the susceptibility to TB.
Edwards and colleagues conducted a similar study on 823,199 US Navy recruits between 1958-
1967, and had similar conclusions.17 Overweight and underweight recruits had similar likelihood
of being infected with M.tuberculosis, but TB incidence was 3.4 times higher in underweight
tuberculin reactors than in overweight reactors. There was a 36 fold difference between obese
non-reactors in whom the TB incidence was 4/100,000 and underweight reactors who had a TB
incidence rate of 150/100,000. Again the authors interpreted these findings as supportive of an
association between a genetically determined body build and TB.
The largest study of the association of anthropometric measures and TB incidence was done by
Tverdal in 1986 and was based on a sample of 1.7 million Norwegians >14 years of age who had
participated in the National mass radiography service between 1963-1982, with an average
follow up time of 12 years.18 The incidence of pulmonary TB decreased with increasing BMI and
was 5 times higher in the lowest BMI group than in the highest BMI group. The decreasing
incidence of TB with increasing BMI was consistent for both the sexes, all age groups and over
different periods of follow up. There was no association between BMI and incidence of
extrapulmonary forms of TB. The author again attributed the findings to a “constitutional”

34
factor which is related both to thinness and lung disease, and ruled out nutritional status as an
explanation on grounds that are not clear.
The 3 other large cohort studies mentioned in this review were also large. Two were limited to
defined populations -elderly patients in Hong Kong,56 and male smokers108- while the third
was based on unpublished data.
2.5.2.C) Recent Systematic Review of Cohort Studies which Evaluated the Association of BMI
with Risk of TB Incidence19
The systematic review by Lonnroth and colleagues based on the above 6 prospective studies
found a consistent inverse logarithmic relationship between BMI and TB incidence over the
range of 18.5-30 kg/m2 in all studies.19 In other words, TB incidence increased in an exponential
manner with the decrease in BMI across the range of BMIs of 18.5-30 kg/m2. They estimated
that a unit increase in BMI would decrease TB incidence by 13.8% (95% CI 13.4-14.2). They
summarized the evidence for a causal association between nutritional status measured by BMI
and risk of TB disease. This included the strength and consistency of the association, clear
evidence of direction of association (BMI was ascertained at baseline in TB free subjects), a
dose-response relationship across all studies, and finally the biological plausibility of the
association based on the current understanding of nutrition and immunity. The more recent
studies had also used multivariable analysis to adjust for smoking, alcohol use, and diabetes.
This systematic review found that being overweight reduced the risk of TB.
This systematic review suggested that shifting the overall BMI distribution in a population may
reduce TB incidence but did not address the crucial issue of the risk of TB incidence in those
who were undernourished (BMI<18.5 kg/m2). The authors commented that only 2 studies
provided data for BMIs less than 18.5 kg/m2, and that the dose response relationship was less
certain below 18.5 kg/m2. On biological grounds and intuitive understanding, we would expect
that the relationship would hold good for BMIs <18.5 kg/m2. In fact, in the unpublished study by
Cegielski et al,109 where subjects had been classified as having BMIs <18.5 kg/m2, the TB
incidence in the undernourished group(BMI<18.5 kg/m2) was 6 times and 12 times higher than

35
the TB incidence in the subjects within the normal range of BMIs, and within the overweight
range of BMIs respectively.
2.5.2. D) Can Adequate Food Reduce TB Incidence? Natural Experiments of Food
Adequacy/Inadequacy in Relation to TB Incidence
It can be argued that the above mentioned observational studies do not provide conclusive
evidence of a causal association between nutritional status and risk of TB, which can only be
provided by a randomized trial. It is however ethically unacceptable to randomize people to
diets which are deficient/adequate in calories and proteins. Nevertheless, 2 reports from the
prisoner of war (POW) camps in World War II in Germany by 2 British physicians who were
themselves POWs, provide the more direct evidence of the role of adequate/inadequate
nutrition and TB incidence.110, 111 In a report by Leyton, Russian and British soldiers lived under
identical conditions of overcrowding, work, and stress, but differed in their diets, as the
Russians had to subsist on the 1,600 calorie camp diet, while the British soldiers had access to
weekly Red Cross parcels which provided an additional 1,000 calories a day. The incidence of TB
in 500 British soldiers was 1.2% while it was 15 fold higher at 19% in the 2,000 Russian
soldiers.110 This would translate into a relative risk of 0.06 (0.03, 0.14) with a relative risk
reduction of 94% for the effect of the Red Cross intervention. The clinical course of TB in these
patients was noted to be extra-ordinarily rapid, with patients often dying within 6 months of
generalized miliary TB. Cochrane described similar striking findings in another POW camp
where no British soldier developed TB, only 2 out of 1,200 French soldiers developed TB during
the period that they received the parcels and 4 French soldiers developed TB when the parcels
were stopped, while 62 of 1200 Russian soldiers on the camp diet developed TB.111
2.5.3. Effect of Nutrition on TB Mortality
2.5.3. A) Ecologic Evidence: The Decline of TB Mortality in England
TB was a major cause of premature deaths in Europe and America until the early 20th century,
and figures of TB mortality were available in most countries beginning in the middle or late 19th
century. The trends in TB mortality in England and for other countries during 1850-1950
showed 2 consistent findings (Figure 2.3). The first was that TB mortality declined at the rate of
5% per year in these countries during that period, with almost a ten-fold reduction in TB

36
mortality.112 There is overall agreement that the decline was largely due to an improvement in
overall standards of living. After examining the various possible explanations, McKeown
concluded that improved nutrition played the predominant role in reducing TB mortality.113
Recently, the Nobel prize winning economist Robert Fogel has provided evidence for a marked
improvement in British diet amounting to an increase of about 1,000 calories between 1850-
1950.90He also assessed the contribution of nutrition to the mortality reduction by using data
on changes in height (which can be used as a surrogate marker of nutrition) in this period. A
regression of the mortality rates on heights and other factors led him to estimate that
improved nutrition accounted for approximately 40% of the decline in mortality in England
between 1800 and 1980.114The McKeown proposition has however been debated by others
who believe that other explanations, like increasing segregation of patients, and natural
selection due to deaths of patients, reduced the risk of infection.115, 116
The second consistent trend in TB mortality was that in most countries, this decline was
interrupted by a temporary but significant increase in TB mortality during the first and second
World Wars. The reasons for the wartime increase in TB mortality and subsequent decline
offers us insights into the role that nutrition may have played in the decline of TB in Europe.
The most detailed analysis on the role of food has been made by Faber on the Danish
experience with TB in World War I.117
2.5.3.B) TB Epidemiology in Denmark in World War I and Inadequate Nutrition as a Cause of TB
Mortality117
A causal effect of food availability on TB mortality at the population level would require
demonstration of a clear temporal sequence where cause preceded effect, and be further
strengthened if altering the cause altered the effect. The detailed analysis of TB mortality in
Denmark in World War I by Faber fulfils these 2 criteria of causality.117 Further, his analysis of
the different food factors involved pointed to low intake of animal protein as an important
cause.
Denmark was an exporter of dairy products including meat and butter to other countries like
Germany. In 1915, its exports to Germany increased and in 1916, the per capita availability of

37
meat had dropped to 26.2 kg/year from 40.9 kg/year and butter consumption dropped from 8.1
kg/year to 3.2 kg/year. TB mortality rose from 132 /100,000 to 176/100,000 in 1917.In
1917,due to the submarine warfare, the exports ended, prices were fixed, and the availability of
these foodstuffs rose to 44.7 kg/year(meat) and 9.9 kg/year (butter).In 1918, the TB mortality
rate dropped to 138/100,000. A scarcity of butter in 1920, without scarcity of meat, did not
result in increased TB mortality.117
2.5.3.C) Other Wartime Experiences that Support a Causal Association
In wartime, the rations for psychiatric institutions were often reduced. In such institutions in
France, a 50% increase in TB mortality from 1938-1943 was documented when all other factors
had remained unaltered.118 The increase in TB mortality in wartime often did not involve the
rural areas where food availability was better, as in Brittany during the French occupation.118 In
France, among young children whose energy ration was 38% above the minimum, the TB
mortality decreased by 10% in 1941 compared to 1938, whereas in school going children where
the ration was 23% below minimum, the TB mortality rose by 100%.118
2.5.3. D) Clinical Evidence on Under-Nutrition and TB Mortality and Its Interpretation: Issues of
Effect-Cause, and Confounding
Effect or cause or both? The association of poor nutritional status with increased mortality in
patients with active TB has been referred to in an earlier section (determinants of TB mortality).
Under-nutrition in TB patients may be the effect of the disease itself as it is in high-income
countries, but in low-middle income countries, pre-existing under-nutrition is one of the
contributory causes for both the occurrence of active TB and for the severity of the disease,
which in turn results in worsened under-nutrition. Regardless of the cause of the under-
nutrition (pre-existing or disease-induced), the vicious cycle generated by the ongoing
interaction between under-nutrition and active TB is highly detrimental to the patient (figure
2.1).The WHO guidelines for management of drug resistant tuberculosis emphasize this point:
“In addition to causing malnutrition, DR-TB can be exacerbated by poor nutritional status.
Without nutritional support, patients, especially those already suffering from baseline hunger,
can become enmeshed in a vicious cycle of malnutrition and disease.”48This vicious cycle

38
enhances the risk of death or may even culminate in death. So it is fallacious to think of under-
nutrition merely as an effect of the disease, as it is a factor which affects disease progression.
2.5.3.E) Issue of Confounding between Under-Nutrition and Disease Severity
Numerous studies referred to earlier have reported strong, consistent association of nutritional
status with risk of TB mortality. However, a causal interpretation of this association has been
considered difficult to make, because of the association of under-nutrition with severity of lung
disease, which is also an independent risk factor for TB mortality.119 Thus, there is an
impression that severity of disease could confound the association between under-nutrition
and TB mortality.
In a recent study which studied the impact of nutritional deficit on TB mortality, adjustments
were made for severity of disease by adjusting for radiographic extent of disease and disease
severity. Under-nutrition was still found to be associated with in-hospital TB mortality with an
adjusted odds ratio (OR) of 17.8.69 This suggests that under-nutrition is a risk factor for TB
mortality independent of the association with severity of disease.
2.6. Effect of TB on Nutritional Status
Tuberculosis leads to both macronutrient under-nutrition, manifested as weight loss and
wasting, and micronutrient under-nutrition, which may result in anemia and other
deficiencies.120, 121 Cross-sectional studies of micronutrient status in TB patients are
complicated by reverse causality as active TB can elevate or decrease the levels of
micronutrients.120 Studies of patients across the world have shown high prevalence of under-
nutrition and wasting in patients with TB.119, 122-125 The weight loss and wasting associated with
tuberculosis can result from 2 processes.120 First is the decreased oral intake because of
reduced appetite. This is a form of starvation, and results in depletion of lipids from the adipose
tissue to sustain energy requirements, but conserves the protein compartment, especially
visceral protein. The other processes which lead to weight loss are cachexia, which is a complex
metabolic syndrome associated with TB and other diseases like HIV, and cancer, where there is
loss of adipose tissue as well as skeletal and visceral protein.126 Cachexia impairs quality of life
and is a strong risk factor for mortality.126, 127Loss of fat mass of 13-35% and lean body mass of

39
19-20% compared to controls has been seen in TB patients.34, 128 The effects of TB and HIV can
have an adverse synergism and co-infected patients can have more marked wasting.129 The
mechanisms underlying cachexia are being elucidated, but excess of pro-inflammatory
cytokines like IL-1, IL-2, and TNF-alpha possibly mediate this process.126 These cytokines initiate
processes leading to decreased muscle protein synthesis, and activate ubiquitin-mediated
proteolytic pathways. The distinction between starvation and cachexia is crucial because
starvation responds readily to nutritional interventions, but cachexia and the attendant loss in
the somatic and visceral protein is not as amenable to reversal by nutritional support alone.130
Provision of an adequate balanced diet was associated with better weight gain, more rapid
sputum conversion and faster radiographic clearance in the famous Madras trial of home vs.
sanatorium treatment of TB.131 High energy supplements improved lean body mass and
physical function in a randomized controlled trial (RCT).132 The effect of micronutrients like
Vitamin A,133, 134and zinc on different end points has been evaluated in RCTs, but results have
not been conclusive.135
2.7 Conclusions
The critical step in the pathogenesis of TB is the transition of an infection enclosed and
contained by the cell-mediated immune response (latent TB infection), to a stage of active
disease. Taken together, the material in this section indicates that there is strong experimental
evidence that under-nutrition (especially low protein intake) impairs the cellular immune
responses, and this impairment is reversible with nutritional intervention. Under-nutrition
causes ‘nutritionally acquired immunodeficiency syndrome.’
A strong, consistent, dose-dependent association between nutritional status indicated by
weight or BMI and risk of TB incidence was seen in large cohort studies across diverse
populations. Highly suggestive evidence of a causal association between food scarcity and
tuberculosis mortality was seen in the case of Denmark during World War I. Natural
experiments in prisoner of war camps highlight that better food availability in some groups
could have a dramatic impact on TB incidence in spite of the presence of adverse

40
environmental factors like overcrowding, and lack of medical therapy. Tuberculosis can also
affect nutritional status adversely and generate a vicious cycle of worsening under-nutrition
and worsening disease.
There is a current resurgence of interest in social determinants of TB incidence, but a lack of
clarity and evidence about the potential impact of various social interventions on TB
incidence.21 Nutritional status is an important social determinant which influences progression
of LTBI to active TB and accounts for the highest population-attributable risk for development
of TB in 22 high TB burden countries.24 However, there is no long term prospective study of the
effect of nutritional intervention on TB incidence. The re-analysis of the Papworth experiment,
a well documented but now forgotten study where social interventions including adequate
nutrition were used to prevent TB, aims to fill a part of this evidence gap.
With regards to adverse outcomes of TB disease, recent systematic reviews have emphasized
the consistent association of under-nutrition with TB mortality.25 However, this evidence has
been generated in countries with a different nutritional status at the population level, in patient
populations which are predominantly HIV infected, and in urban and hospital-based practice
settings. India has a high background prevalence of under-nutrition, patients are predominantly
HIV negative and the majority of patients suffering and dying from TB live in rural areas. There
is a paucity of reports on prevalence and impact of under-nutrition in Indian patients with
active TB.29 The analysis of a cohort of rural patients with pulmonary TB is aimed at filling this
information gap.

41
CHAPTER 3:
Nutritional status of adult patients with pulmonary tuberculosis diagnosed at a
rural hospital and community health programme in rural central India (2004-
2009) and its impact on selected treatment outcomes.
Anurag Bhargava1,2, Madhuri Chatterjee3, Yogesh Jain4, Biswaroop Chatterjee5,Anju Kataria4
Raman Kataria4, Ravi D’souza4 , Andrea Benedetti6, Madhukar Pai1, Dick Menzies6
Current Affiliations:
1 Department of Epidemiology, Biostatistics and Occupational Health, McGill University,
Montreal, Canada.
2 Department of Internal Medicine, Himalayan Institute of Medical Sciencs, P.O.Doiwala, District
Dehradun, Uttarakhand, India.
3 Sanjivan Hospital, Phuleswar, District Howrah, West Bengal, India.
4 Jan Swasthya Sahyog, village and P.O.Ganiyari, District Bilaspur, Chhattisgarh, India.
5 Khamis Mushayt General Hospital, Khamis Mushayt, Kingdom of Saudi Arabia.
6 Respiratory Epidemiology& Clinical Research Unit, Montreal Chest Institute, McGill University Health Centre, Montreal, Canada

42
ABSTRACT
Background and Rationale: India has the largest share of the global burden of TB and the global
burden of under-nutrition. Under-nutrition can increase risk of TB disease, and is associated
with more severe disease and increased risk of death, while TB disease may worsen-nutritional
status. There is paucity of data especially from rural India on nutritional status of TB patients
and its association with treatment outcomes.
Design, setting, Objectives: Retrospective review of a cohort of adult patients with active
pulmonary tuberculosis diagnosed at a rural hospital and community health programme during
2004-2009. We assessed the nutritional status (weight, BMI) of TB patients pre-treatment and
at completion of therapy and evaluated the association of nutritional status with deaths during
TB treatment, and treatment success.
Methods: Information on anthropometric data at baseline and end of treatment, demographic,
disease related characteristics, co-morbidities, and patient outcomes were abstracted from
medical records. Adjusted estimates of the association of nutritional status with deaths and
treatment success were obtained using multi-variable logistic regression.
Results: The cohort was comprised of 1695 pulmonary TB patients, of whom two-thirds had
smear positive pulmonary TB. Median Body Mass Index and body weights were 16.0 kg/m2and
42.1 kg in men, and 15.0 kg/m2and 34.1 kg in women, respectively. At diagnosis, 80% of women
and 67% of men had moderate to severe under-nutrition (BMI<17.0).Seventy-five percent of all
patients had short stature for their age. Out of 816 patients whose outcomes were ascertained,
there were 60 deaths. The median weight gain after treatment was around 4 kg in both sexes,
but half of women and one third of men remained moderately to severely underweight at the
end of treatment.HIV, age, body weight and BMI were significant predictors of TB death with 2
fold higher risk of death at a BMI of 16.0 kg/m2 compared to 18.5 kg/m2.
Conclusions: A majority of patients with pulmonary TB had severe under-nutrition at diagnosis
which was associated with increased risk of death and persisted even after successful
treatment in a significant proportion. Provision of nutritional support during treatment of
Pulmonary TB in this population may reduce risk of deaths and improve end of treatment
weights.

43
3.1 Introduction:
India has a major share of the global incidence of tuberculosis (TB) (including MDR-TB) and TB
related mortality. TB incidence has not declined over the past 5 decades, while it is estimated
that 332,000 TB-related deaths occur per year.136 HIV infection plays a relatively minor role in
the TB epidemic in India, occurring in less than 5% of patients with TB,2 whereas under-
nutrition, smoking, and diabetes are considered more important risk factors.60, 137, 138 Recent
systematic reviews have established that under-nutrition is an important risk factor for
reactivation of latent TB infection to TB disease.6, 19 In India more than one third of women and
men in the age group of 15-49 years are under-nourished, and nearly half of children under the
age of five years have moderate to severe under-nutrition. Under-nutrition is considered the
most widely prevalent risk factor, accounting for the highest population attributable risk (PAR)
for TB in India.24
Tuberculosis can lead to or worsen pre-existing under-nutrition, by decreasing appetite, and by
catabolism associated with cytokines.121 Under-nutrition has been linked to excess deaths,119
relapse, and drug toxicity139 in TB patients. High prevalence of under-nutrition in TB patients
has been reported from other countries,119, 124 but there have been few reports on prevalence,
severity and implications of under-nutrition in Indian patients with TB. There is particular lack of
information on patients from India’s rural areas, where the majority of Indians live, and which
has a higher prevalence of poverty, under-nutrition and self-reported TB than urban areas.10
We have conducted a retrospective review of nutritional status of a consecutive cohort of 1695
patients over 18 years of age diagnosed with pulmonary tuberculosis during 2004-2009, at a
rural hospital and community health programme in central India.
3.2 Objectives
1. To assess the nutritional status of TB patients before and at the completion of therapy.
2. To assess the association of the pre-treatment nutritional status with the outcomes of deaths
during TB treatment and treatment success

44
3.3 Methods
Study site: Chhattisgarh state, a recently constituted state in central India has a population of
20 million of which more a third is of indigenous people(tribals)- a marginalised social group,
which has higher rates of poverty, illiteracy, infant and maternal mortality and under-nutrition,
than the average Indian population.10, 140, 141 Seventy-two percent of the population lives in
poverty, defined by the multi-dimensional poverty index.142,143 The economy is based on
cultivation of rain-fed rice crops; many residents migrate seasonally to other states for
livelihood .
The Revised National Tuberculosis Control program (RNTCP) became operational in this state in
2002.144Our study was conducted at Jan Swasthya Sahyog (JSS-or People’s Health Support
Group), a non-profit voluntary organisation that has provided health services in Bilaspur district
of Chhattisgarh state since 2000. JSS caters to the rural population through its community
health programme in 54 villages, a secondary care level hospital which is accessed by people of
over 1500 villages, and 3 outreach clinics serving remote villages. Smear microscopy for the
diagnosis of active TB is performed at the 3 outreach clinics and the hospital under supervision
of a microbiologist. JSS is not affiliated with the RNTCP. Treatment consists of self-administered
therapy, with intermittent supervision and support provided by village health workers for
residents living in the community health programme areas.
Study design and participants: All patients with pulmonary tuberculosis 18 years of age and
older, diagnosed at the hospital, and the 3 outreach clinic centres between January 1, 2004 and
31 December, 2009, were included in the study. Smear positive pulmonary tuberculosis was
diagnosed if microscopic examination of one or more direct smears of sputum was positive for
acid-fast bacilli on Ziehl-Neelsen staining. Smear negative pulmonary tuberculosis was
diagnosed if a patient with symptoms suggestive of pulmonary TB had two smear examinations
negative for acid-fast bacilli but had chest radiographic appearance judged by the physicians to
be compatible with pulmonary TB.145 Cultures and drug susceptibility were sent to a RNTCP
accredited laboratory but only for new cases with persistent smear positivity after 5 months of
treatment, or previously treated patients (especially patients with treatment failure).

45
Case definitions, diagnosis and care of Pulmonary TB: Patients were classified as new or
previously treated cases according to RNTCP and World Health Organisation (WHO)
guidelines.145 Voluntary counselling and testing services for HIV infection were offered to all
patients from 2007 onwards. Patients were tested for anemia when indicated, and from 2008
all adults above 40 years of age were offered random plasma glucose testing.
Patients were advised to seek treatment under the RNTCP as a first option. Patients who opted
for treatment at JSS received daily, self-administered, short course therapy prescribed
according to WHO Guidelines.146 Anti-TB drugs were provided at highly subsidised rates or were
free. Patients were counselled about TB, its treatment, cessation of smoking, and avoidance of
alcohol use. For patients who interrupted treatment, responses included postal reminders,
phone calls (if feasible), and home visits for those patients who lived in the village programme
area or within a 20 km distance of the hospital.
Outcomes were classified according to WHO guidelines as ‘Cured’ and ‘Treatment completed’
(these categories together constituted “treatment success”) ‘Deaths’, ‘Defaults’, ‘Treatment
failure, and ‘Transferred out’(i.e. those who sought care under RNTCP).146TB deaths refer to any
deaths occurring during the course of TB treatment. 146
Data recording, measurements/definitions and reference standards: Information on age,
gender, residence, sputum smear status, grade of sputum smear, previous history of treatment,
history of any illness or death in a family member diagnosed as TB, was recorded for each
patient. Information on educational level, land-holding, history of migration for livelihood was
available for about half of all patients, since 2007 when this information began to be recorded
as part of social assessment during counselling. Weights were recorded at the time of diagnosis
and at completion of treatment using the same regularly calibrated beam balance (+100 g
precision), with the patient wearing light clothing. Heights were recorded to the nearest
centimetre with a stadiometer using standard procedures. Measurements were made by
trained paramedics.
Statistical analysis: In patients where both heights and weights were obtained, body mass
index (BMI in kg/m2) was calculated and the patients were classified into categories based on

46
the BMI cut-offs for weight categories as recommended by the WHO (table 3.1).147, 148 The
Indian Council of Medical Research(ICMR) has recommended weights and heights of 60 kg and
172 cm for adult Indian men, and 55 kg and 162 cm for adult Indian women; these were used
as reference weights and heights in this study.149 The Indian reference standard for height was
a single value and for purpose of comparison of the distribution of heights, the US Centres for
Disease Control (CDC) growth standards were used. Short stature was defined as less than the
median minus 2 standard deviations of the CDC reference heights for 18 year old men and
women,150 as has been done in some other studies on nutritional status from India.151 We used
the body weight as well as the BMI in our analyses. Use of body weights allowed comparisons
with studies from the RNTCP, and older studies (which recorded only weight). Use of BMI
enabled classification into weight categories, using WHO recommended cut-offs.
Patients were classified into 3 groups, based on the location of their residence. Group 1) if
residence was related to the village health programme and outreach clinics. Group 2) if
residence was within a 20 km radius of the hospital. Group 3) if residence was not related to
the village health programme/outreach clinics and was beyond 20 km from the hospital.
Association between categorical variables was assessed using the Chi-squared and Fisher’s
exact test. Student’s t tests (paired and unpaired), and Mann-Whitney tests were used to
compare means, medians respectively as appropriate. The multivariable logistic regression
analyses of outcomes of TB deaths and treatment success were performed with nutritional
status (weight, BMI) as the predictor variables and were adjusted for demographic, clinical and
disease related covariates. Age, weight and BMI were included as continuous variables in the
regression model after verifying the linearity of associations under study in a generalised
additive model .Patients who defaulted were excluded in the analyses of death, but included in
analyses of treatment success. Percent attributable risk for TB death due to severe
undernutrition was calculated using the formula: %ARexposed= (OR-1.0/OR) x 100.152 Statistical
analysis was done using STATA 11 (StataCorp, College Station, TX).

47
Ethics approvals: The study was approved by the Institutional review boards of JSS and McGill
University, Faculty of Medicine. Since the study used existing data that were routinely collected
as part of clinical care, no informed consent was obtained from patients.
3.4 Results
Characteristics of participants: The characteristics of patients are described in table 3.2. The
majority of the subjects were men, from rural areas, and had smear positive pulmonary TB.
(Table 3.2) Most patients came from considerable distances [median (inter-quartile) distance:
38 km (20, 140)]. A significant proportion had history of a family member with active TB; of
these many had died. The most common co-morbidities in order of occurrence were anemia,
diabetes and HIV infection. Among 852 subjects with information on these characteristics,
nearly half of men and three-quarters of women were illiterate, three-quarters of patients were
landless or had small land holdings (<2 acres), and a quarter reported past history of migration
to other states for livelihood (data not shown in table).
TB outcomes: Out of the 1695 diagnosed TB patients, 516 patients were transferred out to
receive their treatment in the RNTCP and their subsequent outcomes were unknown. This left
1179 patients treated at JSS, of whom 756 were successfully treated (64.1%), 60 patients
(5.1%) died, 4 patients failed treatment (0.3%), 354 (30%) patients interrupted treatment
before completion, and in 5 (0.4%) patients the outcomes were unknown. Increasing age, male
gender, and HIV status were associated with both death and default (table 3.3).The median
(IQR) ages of deathwas42 (35, 55) years in men and 32.5 (27, 50) years in women .Previously
treated cases, and patients from distant villages (group 3), had significantly higher rate of
default.
Pre-treatment Nutritional status: As seen in table 3.4, on average the pre-treatment weights
were at least 30%lower, and the heights were 10 cm shorter than the ICMR recommended
reference measures. Only 2.4% had pre-treatment weights equal to or above the suggested
Indian reference weights. Seventy five percent of men and women had heights less than 2
standard deviations of the median of CDC growth standards, suggesting short stature. The

48
median pre-treatment BMI in men and women was about 16 kg/m2 and 15 kg/m2 respectively.
More than 80% of men and 90% of women were underweight at diagnosis (BMI <18.5 kg/m2),
and two-thirds of women and half of men were severely underweight (BMI < 16 kg/m2) (table
3.4). There were 72 men and women with a BMI< 13 kg/m2 (data not shown in table); the
lowest value of BMI was 9.37 kg/m2.
There was no statistically or clinically significant difference in weights of men and women
according to smear status, treatment history, HIV and diabetes status, year of diagnosis or
group.
Nutritional status after TB therapy: Weights and BMIs after successful treatment are also
shown in table 3.4 and figures 3.1 & 3.2. These weights were around 10% higher than pre-
treatment weights, with a similar median weight gain of 3.9 kg (IQR: 1.9, 5.9) in men and
women. Of the patients who completed treatment successfully, more than half of women and
one-third of men were moderately to severely underweight (BMI<17 kg/m2).
Association between nutritional status and TB outcomes: As seen in table 3.5, men who
died during treatment had significantly lower weights at baseline than those who were treated
successfully (difference in medians of 4 kg), but in women this difference was not statistically
significant. Overall 80% of deaths in men and women occurred in those who were moderately
or severely underweight (data not shown in table).
Age, pre-treatment weight, height, BMI, sex, was significantly associated with the outcome of
death during TB treatment. HIV positive status had the strongest association with TB related
deaths (table 3.6). Pre-treatment weight was significantly associated with TB related deaths.
Death during treatment was significantly lower with greater pre-treatment body weight
[adjusted OR (aOR) for a 5 kg increase in pre-treatment weight was 0.59(CI 0.47to 0.77), and
aOR for a unit increase in BMI was 0.78(CI 0.68, 0.90)]. The replacement of weight by BMI did
not significantly change estimates for other covariates. The aOR for TB death for men and
women at their median levels of BMI (BMI 16.0 in men and 15.0 in women) compared to 18.5
kg/m2(cut-off for normal BMI) were 1.9 (CI 1.3 to 2.6) for men, and 2.4 (CI 1.4 to 3.9). Gender
was significantly associated with death during treatment in univariable analysis but was not

49
associated with treatment outcomes when height was included in the model. Age, pre-
treatment weight and height, treatment category, HIV status, and location of residence were
significantly associated with Treatment success, with HIV status being the strongest predictor
(table 3.7).
3.5 Discussion
In this study of TB in an impoverished rural population in India, under-nutrition was the most
prevalent co-morbidity, present in more than 85% of rural men and women with pulmonary TB
at diagnosis, of which more than two thirds were moderately-severely underweight according
to BMI based criteria. Women had an especially severe nutritional deficit. More than half of
women and one third of men continued to be moderately-severely underweight at the end of
successful treatment. The deaths which occurred during TB treatment were premature, with
median (IQR) of ages at death in men and women being 42 (35, 55) years in men and 32.5 (27,
50) years in women. Patients with a BMI of 16.0 kg/m2and 13.0 kg/m2 had a 2 and 4 fold higher
odds of death, respectively, compared to a BMI of 18.5 kg/m2 in this study.
The body weights and BMIs in our cohort were lower than those reported in HIV positive
patients in urban India and sub-Saharan Africa (table 3.8).29, 32, 33 The body weights were in fact
close to those of poor urban patients of the famous Madras (now Chennai) trial 5 decades
ago.153 In the RNTCP where 1.5 million patients are diagnosed per year, body weights are
recorded but have not been reported. The weight gain in this study was similar to the mean
weight gain of 3.2 kg observed in another study in South India.154 Low BMI has been reported as
an independent risk factor for all cause and TB related mortality in population based cohorts.65-
67 In TB patients, under-nutrition has been associated with increased risk of TB related
mortality, including those with drug resistant TB and HIV infection.30, 57, 68, 71, 119, 155-158 The
strength of the association of under-nutrition with mortality in this study was broadly
consistent with other studies.BMI of less than 17 was associated with a mortality rate ratio of
1.7(95% CI 1.18, 2.62),71 while in a cohort from south India where body weight was used as a
predictor, weight < 35 kg was associated with 4 fold risk of death [aOR 3.9(CI 1.9, 7.8)].30
Severity of TB disease can confound the association between under-nutrition and deaths during

50
treatment as increased severity of disease is associated with both under-nutrition and
increased risk of mortality. However in a recent study where adjustments were made for
severity of disease, under-nutrition remained strongly associated with TB mortality.69
This study has certain limitations and strengths. Heights were missing in about 10% of subjects,
but the weights, demographic and clinical characteristics of subjects with missing values were
similar to those without missing values. We could not comment on specific loss with regard to
lean body mass or body fat or micronutrient malnutrition. Information on radiographic extent
of disease was lacking, but results of bacillary density in sputum, another marker of disease
severity were available and used in the multivariable analyses. HIV status was offered but not
ascertained in all subjects, but Chhattisgarh is a low prevalence area for HIV infection with
estimated HIV prevalence of 0.-0.30% of the adult population in 2009.159 The outcomes in the
significant proportion of patients who defaulted could not be ascertained. Adjustments for
socioeconomic status, smoking and alcohol consumption could not be made in the
multivariable regression analysis.
The strengths of this study are that it represents a large sample of rural patients studied over 6
years. The sampling of consecutive patients makes selection bias less likely, though because of
the location and low-cost nature of services, the poor might have been over-represented in our
cohort. The composition of patients reflects the status of patients diagnosed at both primary
and secondary care level. The median heights in this study were identical to the median heights
of rural men and women in a survey in 16 states in India. This suggests that the levels of
chronic under-nutrition in our patients were not exceptional and were similar to other subjects
in rural India, which enhances the generalizability of our findings.160
This study has some important implications. Under-nutrition was a serious co-morbidity in adult
patients with pulmonary TB in this population. It also had adverse prognostic implications since
it was associated with an increased risk of death in patients. The extent and severity of this co-
morbidity of under-nutrition in TB patients in different settings in India needs to be evaluated
and the existing data on weights in the RNTCP could be utilized for this purpose. The severity of
the under-nutrition raises the issue of nutritional support in such patients. The WHO guidelines

51
for management of severe undernutrition recommend hospitalization of such patients in view
of their mortality risk , concurrent treatment of co-existing illness, and outline the nutritional
management of such patients with a supplemented diet till the BMI returns to >18.5 kg/m2.161
In this study following the WHO recommendations would have entailed hospitalization of
nearly 50% (842/ 1695) of all diagnosed patients who had severe under-nutrition which was not
possible in view of resource constraints. Nutritional interventions for severely undernourished
patients with TB in other settings (community or home based) need to be investigated. Current
WHO guidelines for treatment of tuberculosis,162 or the International Standards of Tuberculosis
Care163 do not address issues of nutritional management and support, though the Patient’s
Charter for Tuberculosis Care does mentions the right of patients to nutritional security.164 A
recent Cochrane review of randomized controlled trials of nutritional supplements for patients
with active TB found trials of free food or high energy supplements were too small to confirm
or exclude clinically important benefits on mortality, cure, or treatment completion.135
Guidelines for nutritional support of TB patients are presently being planned by the WHO.165
The persistence of under-nutrition after successful treatment could impair work productivity
and quality of life, impair immuno-competence and enhance susceptibility to disease including
recurrent TB, and confer enhanced risk of mortality. Being underweight at diagnosis was
associated with a 3 fold risk of failure, relapse in a large trial.166.167
Under-nutrition with a relative risk of 4.0 (range 2.0-6.0) 55 for the development of active TB is
the most widely prevalent risk factor for TB in India. This study provides suggestive evidence of
pre-existing chronic under-nutrition which could have played a causal role in development of TB
in this cohort. Short stature in adults is an indicator of poor nutrition during childhood. The
heights of 75% of our patients fell below the 5th percentile of the CDC standards.150 Body
weights after successful treatment would be expected to reflect pre-morbid body weights, but
the majority of patients had low post-treatment weights. If under-nutrition was purely disease
related, patients with smear positive pulmonary TB (who have higher disease burden) would
have had lower BMI and weights, but BMI and weights were similar across categories of smear
status in this study. Finally the population from which these patients were drawn has a high
background prevalence of undernutrition. According to National Family Health Survey-3 figures,

52
46% of women and 36% of men in rural Chhattisgarh were undernourished (BMI<18.5), while
less than 3% of men and women were obese (>30.0 kg/m2).10
3.6 Conclusions
To conclude, a majority of rural men and women with pulmonary TB had severe under-nutrition
which persisted in 40% even after successful treatment. This nutritional deficit was associated
with two to four-fold increased risk of TB related death. Nutritional support should be
considered for severely underweight patients to decrease their risk of mortality, and improve
their weight gain with treatment.

53
Chapter 4: Linking Chapter
This thesis explores the interactions between nutrition and TB, namely the effect of active
tuberculosis on nutrition, and the effect of nutrition on tuberculosis infection and active
disease.
The association between tuberculosis and weight loss has been known since the times of
Hippocrates and are reflected in the terms phthisis, (Latin, to waste away.) and consumption -
which were used previously as terms for the disease itself. In the pre-chemotherapy era this
wasting was treated aggressively with food regimes, which were considered helpful in retarding
the progression of the disease or even resulting occasionally in cures. After the advent of
antibiotic treatment of tuberculosis, this picture of tuberculosis as a wasting disease became a
thing of the past in high income countries, because of early diagnosis, institution of early
effective treatment and availability of adequate diet during convalescence.
Observers from the late 19th century onwards drew attention to under-nutrition as a cause
rather than simply an effect of TB, as discussed earlier in the review of literature. In the first
half of the 20th century under-nutrition was consistently mentioned by numerous scientists as
an issue of central concern for the prevention of TB.11, 168, 169 In a book which reviewed the
epidemiological risk factors for TB at a global level in 1949, Dr. J.B.McDougall of the WHO
stated, “The nutrition of the individual using the term in its widest sense, is in the author’s
opinion, the most vital factor in the prevention of tuberculous disease….”170 However after the
advent of antibiotics for TB and the BCG vaccination, priority was given to expand access to TB
treatment and BCG vaccination in low-middle income countries. There was a relative lack of
attention during this period to under-nutrition as a contributor to the problem of TB. In the last
decade a number of reviews and cohort studies have drawn attention back to under-nutrition
as a major risk factor for TB.6, 19, 171 It has been suggested that improving the nutritional status
in child contacts and at the population level could reduce TB incidence.19 The last decade has
also seen a resurgence of interest in social determinants of TB, and in social interventions to
complement the current biomedical model of TB control.21-23, 172

54
4.1. Nutrition-Tuberculosis interactions in the JSS study:
The JSS study was conducted in a population with a high background prevalence of under-
nutrition and poverty. It revealed suggestive evidence for the causal role of under-nutrition in
the development of TB in this cohort of patients. A majority of the patients had evidence of
chronic under-nutrition, which has been shown to be associated with a four-fold higher risk
(range 2-6) for the development of active TB.
A number of large cohort studies have provided evidence for the causal role of under-nutrition
in TB.55 An intervention study with nutritional interventions as an exposure and TB incidence as
outcome would strengthen the evidence for a causal role of under-nutrition in TB. A re-analysis
of experimental study from the pre-chemotherapy era which employed adequate nutrition as
one of the major interventions forms the second part of this thesis.
4.2. The effect of nutrition on TB incidence- The Papworth study: In the second study in this
thesis we present the re-analysis of a study in which social interventions which included
adequate nutrition were used to prevent TB in a cohort of children living with their parents who
had active TB. This study was conducted between 1918-1943 at the Papworth village
settlement which was founded for the care and rehabilitation of TB patients in the early part of
the 20th century.36 Dr. Varrier-Jones who founded the settlement hypothesized that adequate
and balanced food considered crucial to retardation of TB disease in patients then, could also
The study of nutritional status of patients with active pulmonary tuberculosis in rural India
showed that active tuberculosis was associated with a high prevalence of under-nutrition which
was frequently severe, and associated with mortality during treatment for the patients in this
cohort. Despite effective treatment moderate to severe under-nutrition persisted in a
significant proportion of patients. Associations between the nutritional status at diagnosis and
during treatment with a number of other tuberculosis related outcomes have been reported.
These include an increased risk of hepatotoxicity due to anti-TB drugs in under-nourished
patients,173 and increased risk of relapse.174 Severe under-nutrition needs to be recognized as
an important co-morbidity of active TB in poor populations, and managed appropriately with
nutritional interventions.

55
heighten the family’s resistance to TB and prevent its spread.175 As the patients had no access
to TB antibiotics, and the children did not receive BCG vaccine, this study allows us to access
the efficacy of these interventions independent of the confounding effect of vaccines or
antibiotic therapy.

56
CHAPTER 5.
Can Social Interventions Prevent Tuberculosis? The Papworth experiment (1918-
43) revisited.
Anurag Bhargava1, Madhukar Pai1, Madhavi Bhargava2, Ben J. Marais3, Dick Menzies4
Am J Respir Crit Care Med. 2012 Jul 5. [Epub ahead of print]
1 Department of Epidemiology, Biostatistics and Occupational Health, McGill University, Montreal, Canada.
2 Division of Clinical Epidemiology & Division of Infectious Diseases, Department of Medicine,
McGill University Health Centre, Montreal, Canada
3 Sydney Institute for Emerging Infectious Diseases and Biosecurity (SEIB) & The Children’s Hospital at Westmead, The University of Sydney, Australia
4 Respiratory Epidemiology & Clinical Research Unit, Montreal Chest Institute, McGill University Health Centre, Montreal, Canada
Reprinted with permission of the American Thoracic Society. Copyright (c) 2012 American Thoracic Society
American Journal of Respiratory and Critical Care Medicine/In press
An official Journal of The American Thoracic Society

57
ABSTRACT
Rationale: There is consensus on the need to address social determinants of TB to achieve TB
control, but evidence based on interventions is lacking.
Objectives: We reanalyzed data from the socio-medical experiment at the Papworth village
settlement England, where the impact of stable employment, adequate housing and nutrition
on the incidence of TB infection and disease in children living with parents with active TB, was
documented during 1918-43.
Methods: Information on 315 children of patients, who lived at Papworth, was abstracted from
a published monograph. Overall, and age specific occurrence of TB infection, disease, and
deaths in the children born in the settlement (village-born cohort) were compared to those
born outside and admitted later (admitted cohort) to Papworth.
Results: The annual risks of infection in the village-born and admitted cohorts were 20% and
24% respectively. Of 24 children who developed TB disease, only one was village-born. Among
children aged five and under, there was zero incidence of TB in the village-born, compared to
five cases (1217/100,000 person-years) among children born outside Papworth. Among the
admitted cohort, in children 13 years and older, the incidence of TB prior to admission to
Papworth was 5263/100,000 person-years, while it was 341/100,000 person-years while living
in Papworth.
Conclusions: At Papworth social interventions including adequate nutrition did not reduce TB
transmission but did reduce incidence of TB disease in children living with parents with active

58
TB. These results are relevant today for prevention of TB in children of patients with active TB,
particularly with multi-drug resistant TB in high burden settings.

59
5.1 Introduction
In developing countries, the incidence of TB remains high, with a current decline of less than 1%
per year.4 The epidemic of drug-resistant TB poses a major challenge to traditional TB control
efforts, based primarily on the use of antibiotics to treat disease and latent infection. There is
consensus that social determinants including poverty, under-nutrition, poor housing, and
substance use are drivers of the TB epidemic and should be addressed to achieve TB control
targets. 21, 23, 24, 172, 176 There is, however, a lack of studies documenting the effects of social
interventions on Mycobacterium tuberculosis transmission and TB incidence.7, 21
The Papworth village settlement was founded in 1918 by Sir Pendrill Varrier-Jones.177 This was
started as a socio-medical experiment for the rehabilitation of working class TB patients
discharged from a sanatorium.39, 40 TB patients were provided assured employment, adequate
nutrition and housing, and close medical supervision.39, 40 Attempts to limit TB transmission
included strict implementation of cough etiquette, use of sputum flasks containing
disinfectants, adequate ventilation and separate rooms for infectious patients.36, 39 A medical
team closely monitored the health status of children at a weekly clinic, provided advice on
nutrition, and conducted evaluations for TB related outcomes.36 In 1938 the settlement
consisted of a 200 bed hospital, a sanatorium, laboratories, a research unit, numerous
industries, and a residential area with 142 cottages, schools, and recreational facilities for
patients and their families. 36 The Lancet described it as the “the most comprehensive single
effort to deal simultaneously with every aspect of the tuberculosis problem. 38

60
Beginning in 1937, a survey was conducted to document the outcomes of TB infection and
disease in children who had lived in the settlement during 1918-38.36 The results were
published as an article,35 and a detailed 674 page monograph.36 The survey compiled data from
patients’ files, Papworth clinic records, and the X-ray records of each family.36. Every effort
was made to follow-up each family until 1938, and all children until 1943.36 We re-analyzed
data on 315 children from 135 TB affected families who lived in the settlement between 1918
and 1943, as reported in the monograph,36 using current epidemiologic and statistical methods.
Our objective was to estimate the effect of residence within the Papworth settlement on the
incidence of TB infection and disease in child household contacts of TB patients.
5.2 Methods
Study population and data collection
After a period of sanatorium treatment, patients with active TB were admitted to the
Papworth settlement, and their families then joined them, including their children. We studied
315 children who lived with a parent suffering from active TB at Papworth during 1918-43. This
included children who died of TB before the family was admitted to the settlement, but
excluded surviving children who never resided in Papworth, and children of healthy staff
members.
We abstracted detailed information from the monograph on the Papworth families.36 This
included years of birth, admission, evaluation, discharge from the Papworth settlement or
death. Clinical, microbiologic and radiologic information of the source case, as well as results of

61
clinical, microbiologic and radiologic evaluation in the children, TB disease characteristics and
causes of death were also retrieved.
Definition of outcomes
The following outcome definitions were used:36
Normal – no clinical or radiologic abnormalities.
TB Infection – absence of clinical symptoms with one of the following radiologic abnormalities:
Ghon focus, calcified foci, radiological evidence of primary infection, transient peri-focal
reactions (transient radiologic densities that appeared and resolved completely). Tuberculin
skin testing was done in 136 child contacts using Moro’s tuberculin ointment. However X-rays
were used to diagnose TB infection, perhaps due to completeness of data, and issues of
sensitivity and interpretation of the Moro’s test. 178
TB disease – presence of clinical symptoms with sputum smear and gastric lavage examinations
positive or radiologic abnormalities documented on serial X-rays. This was classified as
childhood tuberculosis (pulmonary and extrapulmonary) or adult-type (cavitary) pulmonary TB.
Data analysis
We compared outcomes in 2 groups of child contacts, based on their place of birth (as was
done in the original study). The village-born cohort included all children born within the
settlement. The admitted cohort included children born outside Papworth, who were later
admitted with their families. Both groups of children lived in the same house as their parent

62
with active TB at Papworth. We analyzed outcomes in the two cohorts during different time
periods defined as follows:
The pre-Papworth period, applied only to the admitted group, and extended from the year of
TB diagnosis in the source case to the year of admission to Papworth.
The Papworth period began with the year of birth (village-born) or the year of admission to
Papworth (admitted), and extended to the year the child left, or to the end of the study period
(1943).
The post-Papworth period was the same for both cohorts, and extended from the year of
leaving to the year of re-evaluation at Papworth; this could be analyzed only for those later re-
evaluated. However, all those discharged were evaluated and were known to be free of disease
at the time of discharge.
For each period, we calculated the total person-years of exposure of each child within three age
groups: 0-5 years, 6-12 years, and 13 years and older.
The prevalence of TB infection and the annual risk of infection in the village born and admitted
cohorts were compared in a series of analyses: The village- born children were exposed to TB
since birth; hence the duration of exposure to TB at the time of assessment for TB infection was
equal to their age. For the admitted cohort, their exposure was estimated in three ways:
Analysis 1: The duration of household exposure to TB at the time of assessment was considered
as the age at assessment minus their age when TB was first diagnosed in their parent. Analysis
2: The age at assessment was considered as the duration of exposure - which incorporated both
household and community exposure to TB. Analysis 3: The analysis was restricted to the subset

63
of children in the admitted cohort who were exposed to TB since birth, in whom the duration of
exposure was equal to their age at the time of assessment for TB infection. This analysis was
considered the most comparable to that in the village born children.
The annual risk of infection per year of exposure (ARI) was calculated using the formula: ARI =
1-(1-P)1/A,179, 180 where P is the mean prevalence of infection, and A is the weighted mean
duration of exposure.
TB incidence rates were estimated in the two cohorts of children, the three age groups, and in
the three time periods. Incidence rate ratios (IRR) were calculated to compare disease
incidence in the two cohorts, and between time periods. Confidence intervals (CIs) for
incidence rates were calculated using the Poisson distribution. 95% CIs were calculated, unless
explicitly stated. Confounding was assessed using a priori criteria and stratified analysis. All data
was analyzed using STATA 11.1.
5.3 Results
The 315 child contacts consisted of 84 children in the village born cohort, and 231 children in
the admitted cohort. Figure 5.1 provides an overview of all families and children, while figure
5.2 describes the number of child contacts in the pre-Papworth, Papworth, and post-Papworth
periods. In 135 families, the fathers alone were the source cases, while in 15 families; the
fathers plus additional family members had active TB. Source cases spent a median of 1 year
(IQR 1-2 years) in the sanatorium before admission to the settlement. The median age of the
source cases was 33 years (inter-quartile range [IQR] 28-38). Among the source cases, sixty-four
percent had sputum smear-positive TB of which 44% died after their admission to the

64
settlement (Table 5. 1). Proportions of children in contact with sputum smear-positive cases
were similar amongst the two cohorts (Table 5.2). The children’s stay in the settlement totaled
2980 person-years and was similar in both cohorts (median stay 9 years, p=0.09); a high
proportion (272; 87.2 %) resided in the settlement for more than three years.
Children in both cohorts underwent detailed clinical evaluation on admission and at regular
intervals, or on suspicion of TB disease. The number of evaluations was similar in the two
cohorts, such as the number of X-rays per child. Table 5.3 describes the prevalence of TB
infection based on radiologic abnormalities and estimated annual risk of infection in the two
cohorts on the basis of analysis 1-3. The age- specific prevalence of infection in the two cohorts
including the subset of admitted children exposed to TB since birth was similar. The estimated
ARI was high in both cohorts with no significant difference (Table 5.3).
Table 5.4 describes the incidence and TB disease characteristics in children before they were
admitted to Papworth. The median age of disease onset was 11 years (range 2-25 years).
Calculated incidence rates were 578/100,000 person-years (95% Confidence interval (CI): 70 to
2088) in the 6-12 age group, 1217/100,000 person-years (95% CI: 395 to 2839) in the 0-5 years
age group, and 5263/100,000 person-years (95% CI: 1931 to 11456) in children who were 13
years and older. Six deaths occurred in children whose active TB began prior to admission to
Papworth. Of these three deaths occurred before admission to Papworth (one of which was
due to disseminated TB in an infant), and three deaths occurred after admission.

65
TB incidence, disease characteristics, and mortality data for the Papworth period is described in
Table 5.5. Most of the cases, and all the TB-related deaths, occurred in the admitted cohort. In
the village-born cohort only a single case of active TB developed, which was cervical
lymphadenitis in a 10-year old girl (Table 5.5). No cases of TB disease were diagnosed in the age
group of 5 and under, and no serious forms of extrapulmonary disease occurred in the village
born cohort. The median age at TB diagnosis in the admitted cohort was 15 years (range 12-19
years). The incidence rate of the admitted cohort during the Papworth period was significantly
lower than in the pre-Papworth period. The reduction in incidence rate in those aged 13 years
and older was also significant. There was no significant difference in the overall incidence rates
of the village-born and admitted cohorts, while living in Papworth. There were a number of
neonatal deaths in the village-born group, and deaths unrelated to TB in both cohorts.
Excluding neonatal deaths, there was no significant difference in the all-cause mortality rate in
the two cohorts.
Of the admitted cohort, 105 were discharged from Papworth, of whom 34 (32%) were re-
evaluated, compared to 3 of the 21 (14%) of the village born group who were discharged from
the settlement. As seen in Table 5.6, of those who left Papworth five persons were diagnosed
to have active TB at a median age of 23 years (range 13-26 years). All five cases, occurred in the
admitted cohort, although only three village born children were re-evaluated. Person time was
contributed only by those who returned for re-evaluation after discharge. If we assume that all
diseased children reported back to Papworth, while those who did not return remained healthy
then the incidence rate in the post-Papworth period would have been lower (Table 5.6).

66
Table 5.7 provides a summary of disease characteristics and TB incidence calculated for the
different time periods. A total of 24 cases of active TB were seen. Most TB cases (20/24; 83.3%)
were contacts of sputum smear-positive disease cases and the majority (17/24; 70.8%)
developed pulmonary manifestations. Cases were most common during the pre-Papworth
period, followed by the Papworth and the post-Papworth periods.
5.4 Discussion
The Papworth experiment documented the impact of social interventions on TB infection and
disease in child TB contacts followed closely over an extended time period. The prevalence of
TB infection and estimated annual risk of infection (ARI) was high, but was similar in the two
cohorts of children. There was however a marked difference in incidence of disease in two high
risk age groups, 181 associated with the period of residence at Papworth. Among young children
(≤ 5 years), none of the village born cohort developed TB in the Papworth period, compared to
5 children in the same age group who developed TB prior to admission to Papworth (IR 1217
/105 person-years at risk). In the admitted cohort aged ≥13 years, the incidence rate of disease
was sixteen fold higher prior to admission to Papworth, than while living in Papworth. Overall
only one of 84(1.2%) village-born children developed TB, while nearly 10% of children born
outside the settlement developed TB; the majority of these disease episodes started before
admission to Papworth. There were 12 deaths related to TB, all in the admitted cohort.
The monograph on the Papworth survey offered the following explanations for the reduced
incidence of TB in children at Papworth: adequate food supply, decreased stress, and reduced
intensity of TB exposure through implementation of hygienic precautions and provision of

67
improved housing.36 Interestingly, the results indicate that conditions at Papworth did not
reduce the risk of TB infection, although some infection control measures may have reduced
the intensity of exposure. Rather the Papworth experiment was associated with a substantially
reduced risk of disease and related deaths. Recent systematic reviews have underscored the
role of under-nutrition as a risk factor for progression of TB infection to TB disease.6, 19 In 22
high TB burden countries, 5.2-62.6% (weighted average of 26.9%) of TB cases were attributable
to under-nutrition,24 while in a cohort of childhood contacts of TB it was found to be strongly
associated (hazard ratio of 37.5) with TB disease risk.26
Ensuring adequate nutrition was given high priority at Papworth. One of the children, who
entered the village settlement in 1929, observed in 2011 “There was always enough to eat.”
(Peter Pattle, personal communication). Since weights were not reported we can only speculate
that adequate nutrition likely played a significant role in the prevention of TB disease at
Papworth. The significant independent effect of nutrition on TB incidence, under similar
conditions of housing and stress, was illustrated in ecologic studies from the pre-
chemotherapy era.110, 111 In prisoner of war camps in Germany, TB incidence in British soldiers
receiving a 1000 calorie/day Red Cross supplement in addition to the camp diet of 1600
calories /day was 1.2%, whereas the incidence of TB in Russian prisoners who subsisted on the
camp diet alone was 19%.(Risk ratio of 0.06. 95% CI: 0.03, 0.14).110 The even greater protection
from TB seen in the village born cohort could perhaps reflect early life influences on immune
and thymic function, consequent to birth under conditions of better nutrition.88, 182
A comparison of the results at Papworth with other reports from the same period shows
comparable rates of TB infection. Annual risk of infection in children aged 0-10 years, estimated
68
from a 1930 study tuberculin skin test survey, was 0∙16 (95% CI: 0∙12,0∙22) in TB contacts and
0∙04 (95% CI: 0∙03,0∙05) in children not living with an adult TB patient.183 Interestingly the
incidence of TB disease in the admitted cohort prior to admission to Papworth period was
comparable to rates reported elsewhere in that era, but rates in children while living in
Papworth were significantly lower. The incidence rate of TB in family contacts reported from 4
studies in the US in the same era showed incidence rates in the range of 1030-1330 per
100,000 person-years.184 A notable feature in the Papworth period was the complete absence
of severe disease manifestations in young children, although their numbers were limited. Young
children living in contact with TB patients in the pre-chemotherapy and pre-BCG era were
particularly susceptible to developing tubercular meningitis, which was a major cause of TB-
related mortality in this age group.183, 185
This study has important limitations. It mostly involved child contacts of men with moderately
advanced pulmonary TB; contacts of women with TB or bedridden patients with advanced TB
were under-represented. The definition of TB infection was based on the absence of symptoms
and the presence of radiologic signs suggestive of infection rather than results of tuberculin skin
tests. This could have resulted in an underestimation of TB infection prevalence, or
misclassification. However, the main finding relates to reduced risk of TB disease progression,
for which case detection methods were very similar to what is in use today. There would have
been no blinding to the child’s birth status -village born or otherwise, but there is no indication
that this may have biased the results. The intensity of exposure to TB may have differed in the
two cohorts, since village-born children were exposed to source cases after sanatorium
“treatment”, and occurred in conditions which may have reduced the intensity of exposure.

69
However the estimated risk of infection was very similar in the two groups, suggesting that
exposure was very similar. Many children were lost to follow up after they left the settlement,
and so estimates of disease risk in the Post-Papworth period are much less certain.
Strengths of this re-analysis include the documented experience of more than 300 childhood
contacts with close to 4000 person years at risk. The two cohorts had comparable
characteristics, TB exposure (at least during their stay in Papworth), and were assessed for
study outcomes in a similar manner. The diagnosis of TB disease was based on chest
radiography and clinical signs similar to those used today, although cultures were not
performed. TB incidence estimates for the Papworth period were reliable due to the
completeness of data and close medical supervision. There appeared to be no confounding by
sputum status of the source case. Differences in the child’s age at exposure, or assessment
were handled by restricted and age-stratified analyses. The results of the analyses suggest that
unmeasured community exposure to TB in the admitted cohort is unlikely to have influenced
the outcomes of TB infection and disease in this study, especially in the case of young children.
This study is of particular relevance to the present problem of child contacts living with patients
with multi-drug resistant (MDR)-TB in high burden settings. Their current predicament is
reminiscent of that of TB patients and their child contacts in the pre-chemotherapy era.
Patients often lack access to effective chemotherapy and remain infectious over long periods.
Children are at high risk,186 of developing a potentially fatal disease without the benefit of
protection by chemoprophylaxis. The World Health Organization(WHO) does not currently
recommend chemoprophylaxis with second line drugs, suggesting careful clinical follow-up of
child contact with initiation of MDR-TB treatment should they develop signs consistent with TB

70
disease.187 Ensuring adequate nutrition seems a feasible and necessary intervention in such
child contacts in settings where childhood under-nutrition is highly prevalent. For example the
prevalence of severe under-nutrition was 31.0 % and 26.7% in child contacts in South African
and India, respectively.188 189
5.5 Conclusions
The Papworth experiment suggests that even in the absence of BCG vaccination or
chemoprophylaxis, social interventions were associated with reduced incidence of TB disease,
despite high rates of infection in highly vulnerable child contacts. Trials evaluating the efficacy
and feasibility of such interventions (including adequate nutrition) in child contacts of patients
with drug resistant TB should be conducted as a priority.

71
Acknowledgements
We wish to acknowledge the generous help of Mr. Peter Pattle of Papworth-Everard, U.K. in
clarifying many aspects of the Papworth village settlement.

72
CHAPTER 6: DISCUSSION AND CONCLUSIONS
The Papworth experiment in the pre-antibiotic era in England, and the study of the prevalence,
distribution and impact of undernutrition on selected outcomes in TB patients in present day
rural India, present a picture of the interactions of Tuberculosis with nutrition in two different
population groups ( children, adults) in three dimensions. These dimensions are the effects of
social interventions including adequate nutrition on development of active TB in a highly
exposed and infected cohort; the association of active TB and nutritional status of adult
patients in a setting with a background prevalence of under-nutrition, and the association of
nutritional status with mortality despite receiving effective therapy for TB.
6.1. Synopsis of Studies
6.1.1. Synopsis of findings of the Papworth experiment: The Papworth experiment involved
young children who are at high risk of progressing to serious forms of active TB when infected.
It was conducted during 1918 to 19-43 when Tuberculosis was still a significant problem in
England, with a mortality rate of 135.8 /100,000 in 1918 when the experiment began.190 The
cohort comprised 315 children living in contact with a parent (the father and sometimes also
the mother) with active TB, at the Papworth village settlement. 84 were born in the settlement
(village born) and 231 were admitted at varying ages after birth (admitted cohort). The annual
risk of infection was high and similar for children in both cohorts, with a 20% -24% probability
of getting infected per year of exposure to parental TB. However the rates of disease in the 2
cohorts were very different. In the pre-Papworth period, 13 (of 231) children in the admitted
cohort developed active TB over a median period of 3 years. During the stay at Papworth, 5 of
the remaining 218 children developed disease over a median period of 9 years, compared to
only 1 out of 84 village born children over a median period of 9 years. In the post-Papworth
period, which could be documented only in a minority of children, 5 children belonging to the
admitted cohort developed TB, compared to none of the village born children Overall half of
the children who developed TB disease died – all deaths occurred only in the admitted cohort.
The overall incidence in the admitted cohort declined six-fold (IRR 0.16 CI 0.04-0.47) after
admission to Papworth, with an even greater reduction in incidence rates in the children above

73
the age of 12 years (IRR 0.06 CI 0.01-0.27). Among the children born in Papworth, there was
zero incidence of TB in the highest risk period – i.e. while they were under 5 years old.
6.1.2. Synopsis of findings of the Jan Swasthya Sahyog (JSS) study: The study of nutritional
status of adult patients with pulmonary TB and its impact on TB outcomes was conducted in a
rural Chhattisgarh in central India, where under-nutrition affects nearly half of women, and
more than one-third of men in the general population. The JSS cohort comprised 1695 patients
with active TB, the majority of whom had smear positive pulmonary tuberculosis .Moderate to
severe undernutrition (BMI<17.0) was present in more than two-thirds of men and more than
three-quarters of women at diagnosis. BMIs of < 13 kg/m2 in men and BMI of < 12 kg/m2 which
are considered incompatible with life,191 were encountered in more than a hundred patients.
Case fatality during treatment was 7.3% and 80% of deaths during treatment occurred in
patients with moderate to severe undernutrition. Death during treatment was associated with
HIV status, age, weight, and BMI but not with AFB sputum smear status, treatment history, and
gender. After controlling for age, sex, smear status, HIV status, and treatment history, body
weight (and pre-treatment BMI were significantly associated with death. Based on these point
estimates, and in comparison to reference values for BMI (BMI of 18.5 kg/m2 both sexes),
women with the median values of BMI (BMI of 15.0 in women) had a 2.5 fold higher risk of
death, and men with median BMI (BMI of 16.0in men) had a 1.9 times increased risk of death. If
the relationship between under-nutrition and TB death is considered causal then nearly 50% of
deaths during treatment in both sexes in the entire cohort could have been prevented, if their
pre-treatment weights had been in the ideal range. The severe under-nutrition at diagnosis
with tuberculosis could have been a result of TB alone or of pre-existing under-nutrition
worsened by TB. Three features suggest the presence and influence of pre-existing under-
nutrition in this cohort. Firstly the short stature in both sexes, provided indication of chronic
under-nutrition in childhood and adolescence. The heights were 10 cm lower than the Indian
reference heights and below the 3rd percentile of the reference heights for 18 year olds in the
Center for Disease Control(CDC) growth charts.150 Secondly the nutritional status was
significantly associated with gender, but not associated with disease related characteristics like
AFB sputum smear status, treatment history or co-morbidities like HIV infection. In India at the

74
population level, under-nutrition is higher in prevalence in women.10 The third suggestive
feature was the low weights at end of successful treatment. Successful therapy was associated
with improvements of around 10% in body weights but they were still more than 20-30% lower
than the reference weights for adults, and moderate-severe undernutrition (BMI<17.0)was still
seen in one-third of men and half of women. One would have expected pre-morbid weights, if
they had been normal, to return to that level after successful treatment.
6.2. Limitations and strengths of the studies:
6.2.1. The Papworth study: The limitations included the nature of the source cases - men with
moderately advanced pulmonary TB that did not require hospitalization, while women and
bedridden patients with advanced disease were under-represented. The prevalence of infection
may have been under-estimated, and disease occasionally mis-classified as infection, by the
measurement by X-ray rather than tuberculin skin testing. The lack of adequate follow-up for
disease in the children who left Papworth was a limitation. Another limitation of the study was
the absence of baseline and follow up data on nutritional status. These were recorded in the
clinic records but were not available in the monograph.
The Papworth study has numerous strengths, with the experience of a large number of child
contacts documented meticulously over nearly 4000 person years at risk. The two groups of
children had comparable characteristics, periods of exposure to Papworth, and assessment, and
had similar levels of exposure to and infection with TB. The diagnosis of active TB was based on
criteria which are comparable to current criteria, and the estimates for disease incidence for
the Papworth period were reliable due to the completeness of data and close medical
supervision. There appeared to be no confounding by sputum status of index case and the age
at exposure to infection.
6.2.2. The JSS study: The limitations of this study included, missing information on heights - in
about 10%, and no information with regard to loss of lean body mass vs. body fat or
micronutrient malnutrition. Disease severity had to be inferred from the smear status and
grade of smear positivity in the absence of radiographic information.HIV testing was offered but
was not accepted by all subjects. The outcomes in the patients who defaulted could not be

75
ascertained. Information on smoking, and alcohol use was not available .The strengths of this
study are that it represents a large sample of rural patients studied over 6 years. The
composition of patients reflects status of patients diagnosed at both primary and secondary
care level, and the nutritional status was similar in patients who accessed the healthcare
services as a primary or secondary care facility. The median heights of patients in this study
were nearly identical to that obtained in a large survey of nutritional status conducted in rural
India.160 This suggests that the exposure to inadequate nutrition in childhood was similar across
rural India and these findings could be generalizable to other populations in rural India.
6.3. Implications of the studies:
6.3.1. At the level of individual patients:
6.3.1. A. Implications of the Papworth study: Prevention of TB – generally and especially in
contacts of patients with MDR-TB.
In the Papworth experiment, the social interventions resulted in almost complete prevention of
disease development in children born in the settlement, and substantial reduction in TB disease
incidence in the admitted cohort members. The annual risk of infection (ARI) in the Papworth
children was similar to the ARI reported in child contacts at the time. The incidence rates of
disease at Papworth of 235/100,000 person-years (in admitted cohort) and 132/100,000
person-years (in village born) were however much lower than the incidence rates of 1030-
1390/100,000 person-years reported in 5 contact studies conducted in that era.192 This
difference was significant at a time when cohabitation with parents with TB was considered
dangerous and led to practices such as raising children in foster homes ( Grancher system in
France) or separate residential facilities(preventoriums in the US).193
In the monograph on the Papworth families, the protection against clinical disease in the
children was attributed to adequate nutrition as a result of adequate income and dietetic
advice, decreased intensity of exposure due to proper housing, better ventilation, segregation
of patients, and scrupulous attention to cough etiquette.36 A reduced risk of active TB can result
from either a reduced risk of exposure, or reduced risk of infection following exposure, or a

76
reduced risk of progression of infection to active TB. Since there was high prevalence of
tuberculosis infection, the reduction in risk of active TB in the Papworth children must have
been mediated by reduced progression of infection to disease. The state of cell mediated
immunity (CMI) in a person is an important determinant of the progression from LTBI to active
TB. Among the various interventions at Papworth, the maintenance of adequate nutrition was
the most likely to have directly influenced the CMI. Recent epidemiologic research has
revealed that while nutrition in children in the post-natal period is important for development
of immunity, nutrition in the fetal period may exert a crucial influence on thymic
development, early programming of cell mediated immunity and thereby on susceptibility to
tuberculosis.182 A recent study in Swedish twins born between 1926 and1958 showed a 11%
decrease in risk of TB in twins with a 500 g greater birth weight.182
In current practice, treatment with Isoniazid is highly effective for prevention of TB disease in
subjects with LTBI due to drug sensitive organisms and increased risk of developing active TB
(children under five years, persons with HIV infection).The results of the Papworth experiment
have possible relevance for prevention of TB disease in child contacts of MDR-TB patients. In
such children isoniazid is unlikely to be effective, and no other drugs are currently
recommended for use by WHO.194 In low-middle income countries, such child contacts are
often undernourished which increases their risk of developing active TB.188, 195 The evidence
from the Papworth study suggests that restoration and/or maintenance of nutrition of their
child contacts may help prevent active MDR-TB in child contacts .Prevention of MDR-TB disease
can be highly beneficial, as treatment for MDR-TB in children is expensive, prolonged, toxic and
marked by significant morbidity and mortality.196
6.3.1. B. Implications of the JSS study: Nutritional support for patients with TB and severe
under-nutrition.
In the JSS study, half of men and two-thirds of women had a BMI < 16.0 kg/m2 at diagnosis. The
weights and BMI of patients in this cohort were significantly lower than those recorded in other
case series.32, 33, 122, 125, 134, 197 The anthropometric measures for example were lower than those

77
in urban HIV positive TB patients from south India,29 and other cohorts of predominantly HIV
positive patients in sub-Saharan Africa.32, 33, 124
Under-nutrition is association with increased mortality in patients with tuberculosis in both HIV
positive and HIV negative patients with tuberculosis.25 The death rate in this study was twice
that reported elsewhere in patients undergoing treatment.45 The strength of the association of
under-nutrition with mortality was broadly consistent with other studies.BMI of less than 17
was associated with a mortality rate ratio of 1.7(95% CI 1.18, 2.62),71 while in a cohort from
south India where body weight was used as a predictor, weight < 35 kg was associated with 4
fold risk of death [ aOR 3.9(CI 1.9, 7.8)].30In a study in MDR-TB patients, low BMI associated
with severe disease was an important predictor of the time to treatment failure and TB death (
Hazard ratio 3.23 (95% CI 0.90, 11.53).155AFB sputum smear status was not associated with TB
deaths in a study from south India, similar to the finding in this study.72
Apart from the risk of mortality being underweight at baseline has been shown to be an
independent risk factor for relapse in HIV negative patients(Hazard ratio 3.0, 1.8 -4.9).166The
loss of lean body mass in cachexia due to tuberculosis has an adverse effect on physical
function and performance status.
Nutritional interventions in patients with TB can be considered in two differing contexts- The
first is nutritional management of patients with severe under-nutrition aimed at restoration of
normal nutritional status. The second is nutritional supplementation (by macronutrients or
micronutrients) of patients, irrespective of their nutritional status, with the aim of improving
tuberculosis related outcomes, and quality of life,
Severe under-nutrition (BMI< 16.0) is considered an indication for intensive nutritional
interventions.161 The available literature pertains mainly to children but the physiological
principles and principles of management in adults are considered similar and have been
detailed in a WHO manual. 161 According to these recommendations patients with severe
under-nutrition, including those with a co-existing illness, should be managed in a hospital. The
protein requirements are up to 2 g/kg/day, the energy requirements are considered about 40 -
50 cal /kg, which may be given initially as a formula feed, and later as traditional foods.

78
Micronutrients should be supplemented to the daily recommended allowance, and a mineral
mix is also recommended as a supplement. The WHO recommends a supplemented diet till the
BMI comes over18.5 kg/m2.161 A recent consensus statement has endorsed these guidelines
and suggested similar guidelines for severely undernourished patients with HIV disease.198
While these are generic guidelines, in the context of patients with TB,WHO’s currently
recommends nutritional support only for patients with MDR-TB nutritional support to prevent
the vicious cycle of under-nutrition and disease.48 More than half of the patients in our study
would have been eligible for nutritional management according to the standards mentioned
above. However there were constraints in the management of patients at the hospital level,
and patients were hospitalized only when indicated for the primary illness (TB).
The effect of free food and energy supplements, and micronutrients alone on TB treatment
outcomes, physical function and quality of life, on patients with/without under-nutrition have
been recently reviewed.135 This Cochrane review reported that the research in this field had
been insufficient to reach any conclusion.135 High energy supplements were reported to result
in modest weight gain, but results on mortality, physical function and quality of life were
inconclusive. Micronutrient supplementation at or above the physiologic doses did not result in
any clinical benefits. No studies on nutritional support to prevent TB have been undertaken.
There is need for operational and clinical research to clarify the nutritional management of
severely underweight TB patients in different settings (hospital vs. non-hospital based), use of
culturally acceptable locally available foodstuffs, and the cost-benefit analysis of such
interventions. As suggested in the Cochrane review, future randomized controlled trials of
nutritional supplements should be conducted in food insecure settings , in patients with
different levels of under-nutrition, with an adequate sample size, with a clearer patho-
physiologic rationale for the interventions (micronutrients are unlikely to result in weight gain)
and should evaluate a range of clinically and patient important outcomes like mortality,
physical function, risk of relapse and quality of life.135

79
6.3.2. Implications of the studies at Population level: Action on risk factors and social
determinants as a complementary strategy in TB control and the case of India.
The Papworth experiment was not a study at a population level, though it could be considered
a microcosm of TB control. It showed that reduction in TB incidence in a cohort was possible
despite high prevalence of infection as a result of social interventions (including adequate
nutrition and improved living conditions) and their effect on the progression of LTBI to active
TB.
Can the findings of the Papworth study be applied to prevent the progression of LTBI at the
population level in low-middle income countries which have significant burden of persons with
LTBI? How would a package of interventions similar to the Papworth experiment compare to
medical measures for prevention like treatment of LTBI with Isoniazid? Would adequate
nutrition alone be adequate to produce the effect that was seen at Papworth, and what should
be the composition of a basic nutrition package in light of current knowledge? Should such
interventions be targeted only to vulnerable groups (e.g. food insecure) or the larger
population? Should they be applied for a particular time period, or be available as entitlements
as a matter of social policy?
The Papworth experiment was a hypothesis generating study which offered a complementary
perspective to TB control. This mode of TB control did not involve treatment of active disease,
but involved measures to reduce susceptibility to disease by focusing on maintenance of health
and better living conditions. A number of recent analyses of the global epidemiology of TB have
also pointed out the need for action on risk factors and social determinants as a complement to
the current medical model of TB control.23, 55The following sections use India as a point of
reference, as it has the largest global burden of incidence of drug susceptible and multi-drug
resistant tuberculosis, and has not witnessed a decline in TB incidence. The efficacy and
limitations of the medical model of TB control is discussed followed by a discussion on the need
to address under-nutrition amongst the various risk factors at the population level in India.
6.3.2. A. Medical model of TB control evolved since Papworth: Its efficacy and limitations,
especially in low income countries. The existing medical measures of TB control consist of

80
treatment of active TB with highly effective antibiotics, use of BCG vaccination and use of
isoniazid treatment of persons with LTBI.199 Treatment with antibiotics has major benefits in
reducing mortality and morbidity for patients with TB. The prognosis for patients with active
pulmonary TB has improved dramatically where patients with drug-susceptible TB can expect
a more than 95% chance of cure Such treatment also has public health benefits by making
patients with TB non-infectious within a few weeks – thereby stopping transmission of
M.tuberculosis. BCG vaccination protects children from serious forms of tuberculosis in
childhood. Treatment of persons with LTBI is highly effective in preventing active TB.
However these medical measures have some limitations especially in the context of low income
and high TB burden countries like India. Medical measures do not prevent the occurrence of
new TB infections in the community. Treatment of active cases decreases the period of
transmission of M.tuberculosis, but a significant amount of transmission to contacts occurs in
cases before they have been diagnosed and treated .This period can be significant with the
patient and health system related delays that are common in low-middle income countries. The
median delay in diagnosis due to patient and health system delay in a study from south India
was 60 days.200 Reliance on smear microscopy for diagnosis means that patients have more
advanced disease by the time they are diagnosed. Efficacy of Treatment in many low-middle
income countries like India is lowered by increasing drug resistance, which further reduces their
ability to decrease transmission in the community.
The most important limitation of medical measures presently available in low-middle income
countries is that they cannot prevent re-activation to active TB in the vast pool of persons with
LTBI.A large trial in south India found that BCG vaccination had zero efficacy in prevention of
the adult infectious forms of TB.201 BCG vaccination therefore plays no role in controlling TB at
the population level in India. The other alternative- of treatment of LTBI with Isoniazid would be
a formidable exercise in countries like India (where an estimated 400 million persons have
LTBI). Also this form of treatment would not be effective in those with LTBI due to drug
resistant organisms. There are also concerns about duration of protection from TB conferred by
this therapy in settings where re-infection with M.tuberculosis is possible. Currently no low-
middle income country implements LTBI treatment on a population level for control of TB, and

81
the Stop TB department of the WHO does not deem this as a feasible option for prevention of
TB in high TB burden countries.202
The efficacy of medical measures for TB control can be complemented or counteracted by
changes in socioeconomic status and living conditions. High income countries had experienced
significant decline in TB as a result of improved living conditions. In these countries the
introduction of the medical model of TB control produced excellent results at the patient level
as well as an epidemiologic impact on the disease burden; for example a decline of TB incidence
of 14% per year was seen in the Netherlands.112 In low-middle income countries with no
preceding or concomitant improvement in the TB burden by improved nutrition and living
conditions, and with less than optimal TB care, the impact on TB incidence has been minimal (
<1% per year).4 Exceptions to this rule are countries like Cuba where TB treatment programs
functioned in concert with improvements in other public health programmes, and food
security. With this dual approach TB incidence declined at more than 5% per year from
65/100,000 in 1965 to 4.7/100,000 in 1991– lower than the TB incidence in many high income
countries.203 An economic crisis in 1991-1994 saw caloric consumption per capita fall by 18% to
2513 calories per day, with a steeper fall in products of animal origin. Coupled with setbacks to
the TB program during this period, TB incidence increased to 14.7/100,000 in 1994.204, 205
6.3.2. B. A TB prevention strategy in India directed at risk factors like under-nutrition. A
prevention strategy for control of TB in India would either have to involve medical measures
like treatment of LTBI with Isoniazid at a mass scale, or action on the risk factors which
determine incidence at the population level like under-nutrition. A current focus on under-
nutrition is also required because of the decline in already low levels of per capita calorie
consumption in India.89 The comparative efficacy, operational feasibility and cost-effectiveness
of INH vs. nutritional interventions could be evaluated in pragmatic trials done under field
conditions by the RNTCP in India or at sites elsewhere where families are receiving food
assistance during TB care e.g. by the World Food Programme.206 A trial of nutritional
intervention in lieu of LTBI treatment by Isoniazid would be ethically problematic, and a trial
could compare Isoniazid alone with Isoniazid supplemented with nutrition.

82
In sub-Saharan Africa, the HIV/AIDS epidemic is chiefly responsible for TB incidence at the
population level, whereas in India the immunodeficiency associated with under-nutrition or
‘nutritionally acquired immuno-deficiency syndrome’ (N-AIDS)92 is a major driver of the TB
epidemic. One conservative(see footnote†) estimate of population attributable fraction(PAF)of
TB for under-nutrition was 32%, while similar PAF for other risk factors in India were diabetes
mellitus ( 7%), smoking(11%), alcohol (7%), HIV (5%).24 In rural India, like rural Chhattisgarh
where the prevalence of adult nutrition is higher than the national average, the population
fraction of TB attributable to under-nutrition would be up to 50% for women and 43% in men. If
one accepts the considerable evidence for a causal role of under-nutrition in TB ,19 up to 50%
of cases with pulmonary TB in rural Chhattisgarh could have been prevented by eliminating
under-nutrition. The benefits of addressing under-nutrition in India could have the following
advantages.
Firstly it could be an effective tool for TB control. The recent systematic review of the cohort
studies of TB incidence and nutritional status estimated a 13.8% decrease in TB incidence for
every unit increase in BMI,19 though the validity of these estimates at the population level
would need to be proven. Improving population nutritional status if proven cost-effective,
might have a significant impact on TB incidence in low-middle income countries like India.
Secondly this approach could help prevent multi-drug resistant tuberculosis. While prevention
of exposure to MDR-TB may not be possible, and treatment of MDR-TB is difficult and
expensive, it may be possible to prevent LTBI with multi-drug resistant organisms from
progressing to active TB by improving the nutritional status of the infected person.
Thirdly improving population nutritional status could impact on incidence of TB across
categories of age and gender as under-nutrition is prevalent in all age groups and both sexes in
India. The impact of such an intervention would be greater in women, who suffer higher levels
of under-nutrition in India, and in whom TB currently causes more deaths than all causes of
maternal mortality combined.207 In the JSS study the median post-TB treatment weight of
†The calculation of the PAF for under-nutrition was based on prevalence and relative risk of only severe under-
nutrition, while even mild and moderate under-nutrition can impair defenses against TB

83
women was only 38 kg, while the deaths in women occurred at a highly premature age (median
32.5 years).
Finally improving population nutritional status could have spin-offs on population health
beyond TB control. The incidence of a host of other infectious diseases whose prevalence and
severity is affected by under-nutrition could improve e.g. 50% of the estimated 2.1 million
deaths occurring in under-fives are a result of under-nutrition potentiating the effects of
common infections.20 Malnutrition was the risk factor responsible for greatest loss of disability
adjusted life years lost in India (22.4%) according to the global burden of disease study,208 and
improvements in nutrition could have thus enormous economic and public health benefits.
A national food security bill has been proposed which seeks to provide a legal entitlement to
food grains at subsidized prices to 75% of the rural and about 50% of India’s urban
population.209 This represents an opportunity to improve the nutritional status of India’s
population, especially the poor, and this proposed entitlement should be carefully scrutinized
by nutritionists. Inputs could be provided to the Government so that this entitlement addresses
the basic needs for energy and proteins, and plays its part in the prevention of diseases.
6.4. Conclusions:
There has been a resurgence of interest in the biological and social determinants of TB
incidence. This is due to the failure of the treatment based strategy for TB control to result in
the anticipated decline in TB incidence in high burden countries. Under-nutrition causes
impairment of cell mediated immunity which is crucial to prevention of progression of
M.tuberculosis infection to active disease. There is consistent evidence from cohort studies
which favours a causal association between under-nutrition and TB incidence and TB related
mortality, and under-nutrition is the risk factor with the highest population attributable fraction
for TB in high burden countries.24
The retrospective cohort study of adult patients with pulmonary tuberculosis in rural India
showed that rural Indian patients had a higher prevalence and more severe forms of under-
nutrition. Under-nutrition was significantly associated with deaths during treatment. Nutritional

84
management is indicated for patients with severe under-nutrition but the impact of nutritional
interventions on tuberculosis related outcomes like mortality needs to be assessed as a priority
in future research.
The effect of adequate nutrition and other social interventions on TB incidence was assessed in
a reanalysis of the Papworth experiment (1918-43). This study showed that even in the absence
of effective treatment for patients with active TB, adequate nutrition and other social
interventions could have a powerful biological effect on TB incidence possibly by preventing
progression of LTBI to active TB.
The current medical model of TB control in low-middle income countries based on antibiotic
treatment of infectious cases is of individual benefit to patients with TB but has not lead to
prevention of TB at the population level. The Papworth study results suggest that a strategy
directed at reducing susceptibility to TB by social interventions (including adequate nutrition)
could reduce TB incidence and complement the current DOTS strategy for TB control. In the
particular case of India, under-nutrition is the major biological risk factor and social
determinant for TB incidence. A focus on addressing under-nutrition at the population level
could have a significant effect on TB incidence including incidence of MDR-TB, in adults and
children, in India.
The Papworth and JSS studies have identified the need for future clinical and operational
research in two keys areas. The first would be feasibility, efficacy, and cost-effectiveness of
nutritional improvements as an instrument of TB control in populations with a high burden of
under-nutrition. The second is the need for research on appropriate nutritional interventions
for patients with tuberculosis and severe under-nutrition, and to evaluate the impact of
nutritional supplements on a range of clinically important and patient important outcomes in
undernourished patients with TB.

85
REFERENCES 1. Global Tuberculosis Control: WHO report 2011. Geneva: World Health Organisation; 2012. 2. Steinbrook R. Tuberculosis and HIV in India. New Engl J Med. 2007; 356(12): 1198-9. 3. Kochi A. The global tuberculosis situation and the new control strategy of the World Health Organization. Tubercle. 1991; 72(1): 1-6. 4. Global Tuberculosis Control. Geneva: World Health Organisation.; 2009. Report No.: WHO/HTM/TB/2009.411. 5. Dye C, Lonnroth K, Jaramillo E, Williams BG, Raviglione M. Trends in tuberculosis incidence and their determinants in 134 countries. Bull World Health Organ. 2009; 87: 683-91. 6. Cegielski JP, McMurray DN. The relationship between malnutrition and tuberculosis: evidence from studies in humans and experimental animals. Int J Tuberc Lung Dis. 2004; 8(3): 286-98. 7. Raviglione M, Krech R. Tuberculosis: still a social disease [Editorial]. Int J Tuberc Lung Dis. 2011; 15(Supplement 2): S6-S8. 8. Repositioning nutrition as central to development : A strategy for large scale action. Washington D.C.: World Bank 2006. 9. The State of Food Insecurity in the world. Rome: Food and Agriculture Organisation of the United Nations,; 2011. 10. International Institute for PopulationSciences (IIPS) Macro International. National Family Health Survey (NFHS-3), 2005-06: India:Volume 1. Mumbai:IIPS; 2007. 11. Newsholme A. Prevention of tuberculosis London Methuen & Co.; 1908. 12. Major Greenwood. Epidemics and crowd diseases. London Williams and Northgate; 1935. 13. Scrimshaw NS, Taylor CE, Gordon JE. Interactions of nutrition and infection. Americal Jounal of Medical Sciences. 1959: 367-403. 14. Scrimshaw NS, Taylor CE, Gordon JE. Interactions of nutrition and infection. Monogr Ser World Health Organ. 1968; 57: 3-329. 15. Department of Health and Human Services. The Surgeon General's report on Nutrition and Health. Washington, DC: US Government printing office; 1988. 16. Palmer CE, Jablon S, Edwards PQ. Tuberculosis morbidity of young men in relation to tuberculin sensitivity and body build. Am Rev Tuberc. 1957; 76(4): 517-39. 17. Edwards LB, Livesay VT, Acquaviva FA, Palmer CE. Height, weight, tuberculous infection, and tuberculous disease. Arch Environ Health. 1971; 22(1): 106-12. 18. Tverdal A. Body mass index and incidence of tuberculosis. Eur J Respir Dis. 1986; 69(5): 355-62. 19. Lonnroth K, Williams BG, Cegielski P, Dye C. A consistent log-linear relationship between tuberculosis incidence and body mass index. Int J Epidemiol. 2010; 39(1): 149-55. 20. Pelletier DL, Frongillo EA, Schroeder DG, Habicht JP. The effects of malnutrition on child mortality in developing countries. Bull World Health Organ ; :. 1995; 73(4): 443-8. 21. Hargreaves JR, Boccia D, Evans CA, Adato M, Petticrew M, Porter JDH. The Social Determinants of Tuberculosis: From Evidence to Action. Am J Public Health. 2011; 101(4): 654-62. 22. Rasanathan K, Sivasankara Kurup A, Jaramillo E, nnroth K. The social determinants of health: key to global tuberculosis control. Int J Tuberc Lung Dis. 2011; 15(Supplement 2): S30-S6. 23. Lönnroth K, Jaramillo E, Williams BG, Dye C, Raviglione M. Drivers of tuberculosis epidemics: The role of risk factors and social determinants. Soc Sci Med. 2009; 68(12): 2240-6. 24. Lönnroth K, Castro KG, Chakaya JM, Chauhan LS, Floyd K, Glaziou P, et al. Tuberculosis control and elimination 2010–50: cure, care, and social development. Lancet. 2010; 375: 1814-29. 25. Waitt CJ, Squire SB. A systematic review of risk factors for death in adults during and after tuberculosis treatment [Review article]. Int J Tuberc Lung Dis. 2011; 15(7): 871-85. 26. O. Morán-Mendoza, S. A. Marion, K. Elwood, D. Patrick, FitzGerald JM. Risk factors for developing tuberculosis: a 12-year follow-up of contacts of tuberculosis cases. Int J Tuberc Lung Dis. 2010; 14(9): 1112-9.

86
27. Cegielski JP, Arab L, Cornoni-Huntley J. Nutritional Risk Factors for Tuberculosis Among Adults in the United States, 1971-1992,. Am J Epidemiol; 2012 Jul 11.[Epub ahead of print]. 28. Connell DW, Berry M, Cooke G, Kon OM. Update on tuberculosis: TB in the early 21st century. European Respiratory Review. 2011; 20(120): 71-84. 29. Swaminathan S, Padmapriyadarsini C, Sukumar B, Iliayas S, Kumar SR, Triveni C, et al. Nutritional status of persons with HIV infection, persons with HIV infection and tuberculosis, and HIV-negative individuals from southern India. Clin Infect Dis. 2008; 46(6): 946-9. 30. Santha T, Garg R, Frieden T, Chandrasekaran V, Subramani R, Gopi P. Risk factors associated with default, failure and death among tuberculosis patients
treated in a DOTS programme in Tiruvallur District, South India, 2000. . Int J Tuberc Lung Dis. 2002; 6: 780-8. 31. Kennedy N, Ramsay A, Uiso L, Gutmann J, Ngowi FI, Gillespie SH. Nutritional status and weight gain in patients with pulmonary tuberculosis in Tanzania. Trans R Soc Trop Med Hyg. 1996; 90(2): 162-6. 32. Zachariah R, Spielmann MP, Harries AD, Salaniponi FML. Moderate to severe malnutrition in patients with tuberculosis is a risk factor associated with early death. Trans R Soc Trop Med Hyg. 2002; 96(3): 291-4. 33. Villamor E, Saathoff E, Mugusi F, Bosch RJ, Urassa W, Fawzi WW. Wasting and body composition of adults with pulmonary tuberculosis in relation to HIV-1 coinfection, socioeconomic status, and severity of tuberculosis. Eur J Clin Nutr. 2005; 60(2): 163-71. 34. Onwubalili JK. Malnutrition among tuberculosis patients in Harrow, England. Eur J Clin Nutr. 1988; 42(4): 363-6. 35. Brieger EM. Children in a tuberculosis colony. Arch Dis Child. 1943; 18: 178-85. 36. Brieger EM. The Papworth Families. A 25 years survey. London: Heinemann 1944. 37. Marais BJ, Gie RP, Schaaf HS, Hesseling AC, Obihara CC, Starke JJ, et al. The natural history of childhood intra-thoracic tuberculosis: a critical review of literature from the pre-chemotherapy era. Int J Tuberc Lung Dis. 2004; 8(4): 392-402. 38. The Case for a Rehabilitation Board. Lancet. 1940; 235(6073): 131-2. 39. Bryder L. Papworth village settlement- A unique experiment in the treatment and care of the Tuberculous? Med Hist. 1984; 28: 172-90. 40. Trail RR. Environment and education at Papworth. Health education journal. 1952; 10: 158-64. 41. Reider HL, editor. Epidemiologic basis of tuberculosis control. Paris: International Union Against Tuberculosis and Lung Disease; 1999. 42. Comstock GW. Epidemiology of tuberculosis. Am Rev Respir Dis. 1982; 125(3 Pt 2): 8-15. 43. Dye C, Scheele S, Dolin P, Pathania V, Raviglione MC, Surveillance ftWG, et al. Global Burden of Tuberculosis. JAMA. 1999; 282(7): 677-86. 44. Smith I. Mycobacterium tuberculosis Pathogenesis and Molecular Determinants of Virulence. Clinical Microbiology Reviews. 2003; 16(3): 463-96. 45. Straetemans M, Glaziou P, Bierrenbach AL, Sismanidis C, van der Werf MJ. Assessing Tuberculosis Case Fatality Ratio: A Meta-Analysis. PLoS One. 2011; 6(6): e20755. 46. National Tuberculosis Institute. Tuberculosis in a rural population of South India: a five year epidemiological study. Bull World Health Organ. 1974; 51: 473-88. 47. Thim S, Sath S, Sina M, Tsai EY, Delgado JC, Shapiro AE, et al. A community-based tuberculosis program in Cambodia. JAMA. 2004; 292(5): 566-8. 48. WHO. Guidelines for the programmatic management of
drug-resistant tuberculosis,
Emergency update 2008. Geneva: World Health Organisation; 2008.

87
49. World Health Organisation. What is DOTS? A guide to understanding the WHO-recommended TB control strategy known as DOTS: World Health Organisation; 1999. 50. Lawn SD, Zumla AI. Tuberculosis. Lancet. 378(9785): 57-72. 51. Tackling poverty in TB control. Lancet. 2005; 366: 2063. 52. Reider HL. Annual risk of infection with Mycobacterium tuberculosis. European Respiratory Journal. 2005; 25(1): 181-5. 53. Styblo K. Overview and Epidemiologic Assessment of the Current Global Tuberculosis Situation with an Emphasis on Control in Developing Countries. Rev Infect Dis. 1989; 11(SUPPLEMENT 2): S339-46. 54. Guelar A, Gatell JM, Verdejo J, Podzamczer D, Lozano L, Aznar E, et al. A prospective study of the risk of tuberculosis among HIV-infected patients. AIDS. 1993; 7(10): 1345-9. 55. Lönnroth K, Raviglione M. Global Epidemiology of Tuberculosis: Prospects for Control. Semin Respir Crit Care Med. 2008; 29(05): 481,91. 56. Leung CC, Lam TH, Chan WM, Yew WW, Ho KS, Leung G, et al. Lower Risk of Tuberculosis in Obesity. Arch Intern Med. 2007; 167(12): 1297-304. 57. Hanrahan CF, Golub JE, Mohapi L, Tshabangu N, Modisenyane T, Chaisson RE, et al. Body mass index and risk of tuberculosis and death. AIDS. 2010; 24(10): 1501-8. 58. Chocano-Bedoya P, Ronnenberg AG. Vitamin D and tuberculosis. Nutr Rev. 2009; 67(5): 289-93. 59. Jeon CY, Murray MB. Diabetes Mellitus Increases the Risk of Active Tuberculosis: A Systematic Review of 13 Observational Studies. PLoS Med. 2008; 5(7): e152. 60. Stevenson C, Forouhi N, Roglic G, Williams B, Lauer J, Dye C, et al. Diabetes and tuberculosis: the impact of the diabetes epidemic on tuberculosis incidence. BMC Public Health. 2007; 7(1): 234. 61. Lin H-H, Ezzati M, Murray M. Tobacco Smoke, Indoor Air Pollution and Tuberculosis: A Systematic Review and Meta-Analysis. PLoS Med. 2007; 4(1): e20. 62. Tiemersma EW, van der Werf MJ, Borgdorff MW, Williams BG, Nagelkerke NJD. Natural History of Tuberculosis: Duration and Fatality of Untreated Pulmonary Tuberculosis in HIV Negative Patients: A Systematic Review. PLoS One. 2011; 6(4): e17601. 63. Lawn SD, Zumla AI. Tuberculosis. Lancet. 2011; 378(9785): 57-72. 64. Kotler D, Tierney A, Wang J, Pierson R. Magnitude of body-cell-mass depletion and the timing of death from wasting in AIDS. Am J Clin Nutr. 1989; 50(3): 444-7. 65. Waaler HT. Height. Weight and Mortality The Norwegian Experience. Acta Medica Scandinavica. 1984; 215(S679): 1-56. 66. Pednekar MS, Hakama M, Hebert JR, Gupta PC. Association of body mass index with all-cause and cause-specific mortality: findings from a prospective cohort study in Mumbai (Bombay), India. Int J Epidemiol. 2008; 37(3): 524-35. 67. Prospective studies collaboration. Body mass index and cause specific mortality in 900,000 adults: colllaborative analyses of 57 prospective studies. Lancet. 2009; 373: 1083-96. 68. Garcia-Garcia Mde L, Ponce-De-Leon A, Garcia-Sancho MC, Ferreyra-Reyes L, Palacios-Martinez M, Fuentes J, et al. Tuberculosis-related deaths within a well-functioning DOTS control program. Emerg Infect Dis. 2002; 8(11): 1327-33. 69. Kim HJ, Lee CH, Shin S, Lee JH, Kim YW, Chung HS, et al. The impact of nutritional deficit on mortality of in-patients with pulmonary tuberculosis. Int J Tuberc Lung Dis. 2010; 14(1): 79-85. 70. Elliott AM, Halwiindi B, Hayes RJ, Luo N, Mwinga AG, Tembo G, et al. The impact of human immunodeficiency virus on mortality of patients treated for tuberculosis in a cohort study in Zambia. Trans R Soc Trop Med Hyg. 1995; 89(1): 78-82. 71. Gustafson P, Gomes V, Vieira C, Samb B, Nauclér A, Aaby P, et al. Clinical Predictors for Death in HIV-positive and HIV-negative Tuberculosis Patients in Guinea-Bissau. Infection. 2007; 35(2): 69-80.

88
72. Kolappan C, Subramani R, Kumaraswami V, Santha T, Narayanan PR. Excess mortality and risk factors for mortality among a cohort of TB patients from rural south India. Int J Tuberc Lung Dis. 2008; 12(1): 81-6. 73. Bates MN, Khalakdina A, Pai M, Chang L, Lessa F, Smith KR. Risk of tuberculosis from exposure to tobacco smoke: a systematic review and meta-analysis. Arch Intern Med. 2007; 167(4): 335-42. 74. Kaulagekar A, Radkar A. Social status makes a difference: Tuberculosis scenario during the National Family Health Survey-2. Indian Journal of Tuberc. 2007; 54: 17-23. 75. Lankester A. Tuberculosis in India: Its prevalence, causation and prevention: Butterworth and co.; 1920. 76. Ukil AC. A note on the epidemiology and pathology of tuberculosis in India. Tubercle. 1931; 12(6): 244-50. 77. Davis M. Late Victorian Holocausts: El nino famines and the making of the third world. London, New York: Verso books; 2001. 78. Famine in India 2012 [cited 2012 April 9]; Available from: http://en.wikipedia.org/wiki/Famine_in_India 79. Chadha VK. Tuberculosis epidemiology in India : a review. Int J Tuberc Lung Dis. 2005; 9(10): 1072-82. 80. Chakraborty AK. Epidemiology of tuberculosis: current status in India. Indian J Med Res. 2004; 120: 248-76. 81. Tuberculosis Research Centre. Trends in the prevalence and incidence of tuberculosis in south India Int J Tuberc Lung Dis. 2001; 5(2): 142-57. 82. Brinkman HJ, de Pee S, Sanogo I, Subran L, Bloem MW. High food prices and the global financial crisis have reduced access to nutritious food and worsened nutritional status and health. J Nutr. 2010; 140(1): 153S-61S. 83. Shetty P. Malnutrition and undernutrition. Medicine. 2006; 34(12): 524-9. 84. The State of the World's Children. Geneva: United Nations Children's Fund,; 1998. 85. CDC Growth charts. 2012 [cited 2012 April 7]; Available from: http://www.cdc.gov/growthcharts/percentile_data_files.htm 86. UNICEF. Under-nutrition a challenge for India 2011 [cited 07.08.2011]; Available from: http://www.unicef.org/india/nutrition_1556.htm 87. Barker DJ. The origins of the developmental origins theory. J Intern Med. 2007; 261(5): 412-7. 88. Moore SE, Cole TJ, Collinson AC, Poskitt EM, McGregor IA, Prentice AM. Prenatal or early postnatal events predict infectious deaths in young adulthood in rural Africa. Int J Epidemiol. 1999; 28(6): 1088-95. 89. Deaton A, Dreze J. Food and nutrition in India : Facts and Interpretations. Economic and Political Weekly. 2009; 44(7): 42-65. 90. Fogel RW. The Escape from Hunger and Premature Death, 1700-2100: Cambridge University Press; 2004. 91. Dubey A. Poverty and under-nutrition among scheduled tribes in India: a disaggregated analysis Indira Gandhi Institute of Development Research; 2009. 92. Beisel WR. Nutrition and Immune Function: Overview. J Nutr. 1996; 126(10 Suppl): 2611S-5S. 93. Schaible UE, Kaufmann SH. Malnutrition and infection: complex mechanisms and global impacts. PLoS Med. 2007; 4(5): e115. 94. McMurray D, Loomis S, Casazza L, Rey H, Miranda R. Development of impaired cell-mediated immunity in mild and moderate malnutrition. Am J Clin Nutr. 1981; 34(1): 68-77. 95. McMurray DN. Disease model: pulmonary tuberculosis. Trends Mol Med. 2001; 7(3): 135-7. 96. McMurray DN, Bartow RA, Mintzer CL, Hernandez-Frontera E. Micronutrient status and immune function in tuberculosis. Ann N Y Acad Sci. 1990; 587: 59-69.

89
97. Hernandez-Frontera E, McMurray DN. Dietary vitamin D affects cell-mediated hypersensitivity but not resistance to
experimental pulmonary tuberculosis in guinea pigs. . Infect Immun 1993; 61: 2116–21. 98. McMurray DN, Carlomagno MA, Mintzer CL, Tetzlaff CL. Mycobacterium bovis BCG vaccine fails to protect protein-deficient guinea pigs against respiratory challenge with virulent Mycobacterium tuberculosis. Infect Immun. 1985; 50(2): 555-9. 99. McMurray DN, Mintzer CL, Tetzlaff CL, Carlomagno MA. The influence of dietary protein on the protective effect of BCG in guinea pigs. Tubercle. 1986; 67(1): 31-9. 100. Chan J, Tian Y, Tanaka KE, Tsang MS, Yu K, Salgame P, et al. Effects of protein calorie malnutrition on tuberculosis in mice. Proc Natl Acad Sci U S A. 1996; 93: 14857-61. 101. Reed LJ, Love AG. Biometric studies on U.S.Army Officers-Somatological norms in disease. Human Biology. 1933; 5(1): 61-93. 102. Love AG. Somatological norms in tuberculosis and heart disease. Human Biology. 1929; 1(2): 166-97. 103. Keys A. Overweight, Obesity, Coronary Heart Disease and Mortality. Nutr Rev. 1980; 38(9): 297-307. 104. Long E, Jablon S. Tuberculosis in theArmy ofthe UnitedStates in World War II: An Epidemiological Study With an Evaluation of X-ray Screening,. Washington, DC: Veterans Administration; 1955. 105. Berry WTC, Nash FA. Studies in the aetiology of pulmonary tuberculosis. Tubercle. 1955; 36(6): 164-74. 106. Comstock GW, Palmer CE. Long term results of BCG vaccination in the southern United States. Am Rev Respir Dis. 1966; 93: 171-83. 107. Thorn PA, Brookes VS, Waterhouse JAH. Peptic ulcer, partial gastrectomy, and pulmonary tuberculosis. BMJ. 1956; (1): 603-8. 108. Hemila H, Kaprio J, Pietinen P, Albanes D, Heinonen OP. Vitamin C and other compounds in vitamin C rich food in relation to risk of tuberculosis in male smokers. Am J Epidemiol. 1999; 150(6): 632-41. 109. Cegielski JP, L K, Cornoni-HuntleyJ. Relative and population attributable risks of tuberculosis due to under and over-nutrition. 110. Leyton GB. Effects of Slow starvation. Lancet. 1946; 248(6412): 73-9. 111. Cochrane AL. Tuberculosis among prisoners of war in Germany. BMJ. 1945: 656-8. 112. Dye C. Epidemiology. In: Davies PDO, Barnes PF, Gordon SB, editors. Clinical Tuberculosis Fourth ed: Hodder Arnold; 2008. 113. McKeown T, Record RG. Reasons for the Decline of Mortality in England and Wales during the Nineteenth Century. Population Studies. 1962; 16(2): 94-122. 114. Steckel RH. Strategic Ideas in the Rise of the New Anthropometric History and Their Implications for Interdisciplinary Research. J Econ Hist. 1998; 58(3): 803-21. 115. Grange JM, Gandy M, Farmer P, Zumla A. Historical declines in tuberculosis: nature, nurture and the biosocial model. Int J Tuberc Lung Dis. 2001; 5(3): 208-12. 116. Szreter S. Rethinking McKeown: Relationship between Public health and social change. Am J Public Health. 2002; 92(5): 722-5. 117. Faber K. Tuberculosis and Nutrition. Acta Tuberc Scandinavica. 1938; 12: 287. 118. Marche J, Gounelle H. The Relation of Protein Scarcity and Modification of Blood Protein to Tuberculosis among Undernourished Subjects. Milbank Mem Fund Q. 1950; 28(2): 114-26. 119. Zachariah R, Spielmann MP, Harries AD, Salaniponi FM. Moderate to severe malnutrition in patients with tuberculosis is a risk factor associated with early death. Trans R Soc Trop Med Hyg. 2002; 96(3): 291-4.

90
120. Schwenk A, Macallan DC. Tuberculosis, malnutrition and wasting. Curr Opin Clin Nutr Metab Care. 2000; 3(4): 285-91. 121. Macallan DC. Malnutrition in tuberculosis. Diagnostic Microbiology and Infectious Disease. 1999; 34(2): 153-7. 122. Kennedy N, Ramsay A, Uiso L, Gutmann J, Ngowi FI, Gillespie SH. Nutritional status and weight gain in patients with pulmonary tuberculosis in Tanzania. Transactions of the Royal Society of Tropical Medicine and Hygiene. 1996; 90(2): 162-6. 123. Harries AD, Nkhoma WA, Thompson PJ, Nyangulu DS, Wirima JJ. Nutritional status in Malawian patients with pulmonary tuberculosis and response to chemotherapy. Eur J Clin Nutr. 1988; 42(5): 445-50. 124. Van Lettow M, Kumwenda JJ, Harries AD, Whalen CC, Taha TE, Kumwenda N, et al. Malnutrition and the severity of lung disease in adults with pulmonary tuberculosis in Malawi. Int J Tuberc Lung Dis. 2004; 8(2): 211-7. 125. Karyadi E, Schultink W, Nelwan RH, Gross R, Amin Z, Dolmans WM, et al. Poor micronutrient status of active pulmonary tuberculosis patients in Indonesia. J Nutr. 2000; 130(12): 2953-8. 126. Morley JE, Thomas DR, Wilson M-MG. Cachexia: pathophysiology and clinical relevance. Am J Clin Nutr. 2006; 83(4): 735-43. 127. Tan BHL, Fearon KCH. Cachexia: prevalence and impact in medicine. Current Opinion in Clinical Nutrition & Metabolic Care. 2008; 11(4): 400-7. 128. Harries AD, Thomas J, Chugh KS. Malnutrition in African patients with pulmonary tuberculosis. Hum Nutr Clin Nutr. 1985; 39(5): 361-3. 129. Van Lettow M, Fawzi WW, Semba PH, Semba RD. Triple Trouble: The Role of Malnutrition in Tuberculosis and Human Immunodeficiency Virus Co-infection. Nutr Rev. 2003; 61(3): 81-90. 130. Thomas DR. Distinguishing starvation from cachexia. Clinics in Geriatric Medicine. 2002; 18(4): 883-91. 131. Tuberculosis Research Centre .A concurrent comparison of home and sanatorium treatment of tuberculosis in south India. Bull World Health Organ. 1959; 21: 51-144. 132. Paton NI, Chua YK, Earnest A, Chee CB. Randomized controlled trial of nutritional supplementation in patients with newly diagnosed tuberculosis and wasting. Am J Clin Nutr. 2004; 80(2): 460-5. 133. Karyadi E, West CE, Schultink W, Nelwan RH, Gross R, Amin Z, et al. A double-blind, placebo-controlled study of vitamin A and zinc supplementation in persons with tuberculosis in Indonesia: effects on clinical response and nutritional status. Am J Clin Nutr. 2002; 75(4): 720-7. 134. Pakasi TA, Karyadi E, Suratih NMD, Salean M, Darmawidjaja N, Bor H, et al. Zinc and vitamin A supplementation fails to reduce sputum conversion time in severely malnourished pulmonary tuberculosis patients in Indonesia. Nutr J. 2010; 9: 41. 135. Sinclair D, Abba K, Grobler L, Sudarsanam TD. Nutritional supplements for people being treated for active tuberculosis. Cochrane Database Syst Rev. 2011; 11: CD006086. 136. TB India 2009. RNTCP Status Report; 2009. 137. Kolappan C, Gopi PG. Tobacco smoking and pulmonary tuberculosis. Thorax. 2002; 57(964-966). 138. Hassmiller K. The Impact of Smoking on Population Level Tuberculosis Outcomes. TSRU progress report The Hague: KNCV; 2007. 139. Pande JN, Singh SP, Khilnani GC, Khilnani S, Tandon RK. Risk factors for hepatotoxicity from antituberculosis drugs: a case-control study. Thorax. 1996; 51(2): 132-6. 140. Subramanian SV, Smith GD, Subramanyam M. Indigenous Health and Socioeconomic Status in India. PLoS Med. 2006; 3(10): e421. 141. Sarkar S, Mishra S, Dayal H, Nathan D. Development and Deprivation of Scheduled Tribes. Economic and Political Weekly. 2006; 41(46): 4824-7.

91
142. Alkire S, Maria E S. India Country Briefing: Oxford Poverty & Human Development
Initiative (OPHI) Multidimensional Poverty Index Country Briefing Series; 2010. 143. Health profile: Chhattisgarh. National Rural Health Mission State Profiles 2012 [cited 2012 February 27]; Available from: http://mohfw.nic.in/NRHM/State%20Files/chhattisgarh.htm 144. TB India 2011: Revised Tuberculosis Control Programme Annual Status Report: Central TB division, Ministry of Health and Family Welfare, Government of India.; 2011. 145. Managing the Revised National Tuberculosis Control Programme in your area. A training course: Modules 1-4. New Delhi: Central TB division Ministry of Health and Family Welfare.; 2005. 146. World Health Organisation. Treatment of Tuberculosis : Guidelines for National Programmes: World Health Organisation; 2003. 147. WHO Expert consultation.Appropriate body-mass index for Asian populations and its implications for policy and intervention strategies. Lancet. 2004; 363(9403): 157-63. 148. WHO.Physical status: the use and interpretation of anthropometry. Report of a WHO Expert Committee. WHO Technical Report Series 854. Geneva: World Health Organisation; 1995. 149. Nutrient Requirements and Recommended Dietary Allowances for Indians. Hyderabad: National Institute of Nutrition. Indian Council of Medical Research; 2010. 150. CDC. STATAGE. Stature-for-age charts, 2 to 20 years, LMS parameters and selected smoothed stature percentiles in centimeters, by sex and age. . National Center for Health Statistics,; 2000. 151. Venkaiah K, Damayanti K, Nayak MU, Vijayaraghavan K. Diet and nutritional status of rural adolescents in India. Eur J Clin Nutr. 2002; 56: 1119-25. 152. Szklo M, Nieto FJ, editors. Epidemiology : Beyond the basics: Jones and Bartlett Publishers; 2007. 153. Tuberculosis Chemotherapy Centre. A concurrent comparision of home and sanatorium treatment of pulmonary tuberculosis in south India. Bull World Health Organ. 1959; 21: 51-144. 154. Vasantha M, Gopi PG, Subramani R. Weight gain in patients with tuberculosis treated under directly observed treatment short-course (DOTS). Indian J Tuberc. 2009; 56(1): 5-9. 155. Mitnick C, Bayona J, Palacios E, Shin S, Furin J, Alcántara F, et al. Community-Based Therapy for Multidrug-Resistant Tuberculosis in Lima, Peru. New Engl J Med. 2003; 348(2): 119-28. 156. Walpola HC, Siskind V, Patel AM, Konstantinos A, Derhy P. Tuberculosis-related deaths in Queensland, Australia, 1989-1998: characteristics and risk factors. Int J Tuberc Lung Dis. 2003; 7(8): 742-50. 157. Rao VK, Iademarco EP, Fraser VJ, Kollef MH. The Impact of Comorbidity on Mortality Following In-hospital Diagnosis of Tuberculosis. Chest. 1998; 114(5): 1244-52. 158. Matos ED, Moreira Lemos AC. Association between serum albumin levels and in-hospital deaths due to tuberculosis. Int J Tuberc Lung Dis. 2006; 10(12): 1360-6. 159. National AIDS Control Organisation. Annual Report 2010-11. New Delhi: Department of AIDS Control, Ministry of Health and Family Welfare. 160. National Nutrition Monitoring Bureau. Diet and Nutritional status of Rural Population.Technical Report No 21. Hyderabad: National Institute of Nutrition, ICMR,; 2002. 161. WHO. Management of severe malnutrition: A manual for physicians and other senior health workers. Geneva: World Health Organisation; 1999. 162. WHO. Treatment of tuberculosis: guidelines. 4th edition. ed. Geneva: World Health Organisation; 2010. 163. Hopewell P, Pai M, Maher D, Uplekar M, Raviglione M. International Standards for Tuberculosis Care. Lancet Infect Dis. 2006; 6(11): 710-25. 164. World care council. The Patients' Charter for Tuberculosis Care. 2006. 165. Scoping meeting for the development of guidelines on nutritional/food support to prevent TB and improve health status among TB patients. Geneva: World Health Organisation,; 2009.

92
166. Consortium TTT. Rifapentine and isoniazid once a week versus rifampicin and isoniazid twice a week for treatment of drug-susceptible pulmonary tuberculosis in HIV negative patients: a randomised clinical trial. Lancet. 2002; 360(9332): 528-34. 167. RNTCP Modules 1-4. New Delhi: Central TB division; 2011. 168. Long ER. Certain Theoretical and Practical Tuberculosis Problems. Yale J Biol Med. 1943; 15(3): 403-10. 169. Dubos RJ. Health and Disease. JAMA. 1960; 174(5): 505-7. 170. McDougall JB. Tuberculosis : A global study in social pathology. Baltimore: Williams & Wilkins Company; 1949. 171. Papathakis P, Piwoz E. Nutrition and Tuberculosis: A Review of the Literature and Considerations for TB Control Programs: United States Agency for International Development, Africa's Health 2010 Project (2008. 172. Lienhardt C. From Exposure to Disease: The Role of Environmental Factors in Susceptibility to and Development of Tuberculosis. Epidemiology Reviews. 2001; 23(2): 288-301. 173. Warmelink I, ten Hacken NH, van der Werf TS, van Altena R. Weight loss during tuberculosis treatment is an important risk factor for drug-induced hepatotoxicity. Br J Nutr. 2011; 105(3): 400-8. 174. Khan A, Sterling TR, Reves R, Vernon A, Horsburgh CR. Lack of weight gain and relapse risk in a large tuberculosis treatment trial. Am J Respir Crit Care Med. 2006; 174(3): 344-8. 175. Sir Pendrill Varrier-Jones. Papers of a Pioneer: Hutchinson & Co.; 1943. 176. Rasanathan K, Sivasankara Kurup A, Jaramillo E, Lonnroth K. The social determinants of health: key to global tuberculosis control. . Int J Tuberc Lung Dis. 2011; 15(Supplement 2): S 30-6. 177. Varrier-Jones PC. A tuberculosis colony in the making. British Journal of Tuberculosis. 1919; 13(1): 14-21. 178. Ustvedt H. Technique of tuberculin testing: A comparative study. . Bull World Health Organ. 1950; 2(26): 335-40. 179. Cauthen GM, Pio A, ten Dam HG. Annual risk of tuberculous infection( WHO/TB/88.154). Geneva: World Health Organization, ; 1988. 180. Rieder H. Annual risk of infection with Mycobacterium tuberculosis. Eur Respir J. 2005; 25(1): 181-5. 181. Comstock GW, Livesay VT, Woolpert SF. The prognosis of a positive tuberculin reaction in childhood and adolescence. Am J Epidemiol. 1974; 99(2): 131-8. 182. Villamor E, Iliadou A, Cnattingius S. Evidence for an Effect of Fetal Growth on the Risk of Tuberculosis. J Infect Dis. 2010; 201(3): 409-13. 183. Schlesinger B, Hart PD. Human contagion and tuberculous infection in childhood. Arch Dis Child. 1930; 5(27): 191-206. 184. Downes J. Salient Points of Attack against Tuberculosis. Milbank Mem Fund Q. 1940; 18(1): 44-60. 185. Joint Tuberculosis Council Research Committee. Report of the Lancashire Group of Tuberculosis Officers on the fate of young children in tuberculosis households.: G. Tinling & Co.; 1929. 186. Schaaf HS, Gie RP, Kennedy M, Beyers N, Hesseling PB, Donald PR. Evaluation of Young Children in Contact With Adult Multidrug-Resistant Pulmonary Tuberculosis: A 30-Month Follow-up. Pediatrics. 2002; 109(5): 765-71. 187. World Health Organization Stop TB Partnership Childhood TB Subgroup. Chapter 4: childhood contact screening and management. Int J Tuberc Lung Dis. 2007; 11(1): 12-5. 188. Beyers N, Gie RP, Schaaf HS, Zyl SV, Talent JM, Nel ED, et al. A prospective evaluation of children under the age of 5 years living in the same household as adults with recently diagnosed pulmonary tuberculosis. Int J Tuberc Lung Dis. 1997; 1(1): 38-43.

93
189. Singh M, Mynak ML, Kumar L, Mathew JL, Jindal SK. Prevalence and risk factors for transmission of infection among children in household contact with adults having pulmonary tuberculosis. Arch Dis Child. 2005; 90(6): 624-8. 190. TB mortality data since 1913. [cited 2012 April 12]; Available from: http://www.hpa.org.uk/Topics/InfectiousDiseases/InfectionsAZ/Tuberculosis/TBUKSurveillanceData/TuberculosisMortality/TBMortality01trend/ 191. Henry CJK. The biology of human starvation: some new insights. Nutrition Bulletin. 2001; 26(3): 205-11. 192. Downes J. Salient Points of Attack against Tuberculosis. Milbank Mem Fund Q. 1940; 18(1): 44-60. 193. Connolly C. The TB preventorium. American Journal of Nursing. 2000; 100(10): 62-5. 194. Chapter 4: childhood contact screening and management. Int J Tuberc Lung Dis. 2007; 11(1): 12-5. 195. Singh M. Prevalence and risk factors for transmission of infection among children in household contact with adults having pulmonary tuberculosis. Archives of Disease in Childhood. 2005; 90(6): 624-8. 196. Seddon JA, Godfrey-Faussett P, Hesseling AC, Gie RP, Beyers N, Schaaf HS. Management of children exposed to multidrug-resistant Mycobacterium tuberculosis. Lancet Infect Dis. (0). 197. van Lettow M, Harries AD, Kumwenda JJ, Zijlstra EE, Clark TD, Taha TE, et al. Micronutrient malnutrition and wasting in adults with pulmonary tuberculosis with and without HIV co-infection in Malawi. BMC Infect Dis. 2004; 4(1): 61. 198. Raiten DJ, Mulligan K, Papathakis P, Wanke C. Executive summary—Nutritional Care of HIV-Infected Adolescents and Adults, including Pregnant and Lactating Women: What Do We Know, What Can We Do, and Where Do We Go from Here? Am J Clin Nutr. 2011; 94(6): 1667S-76S. 199. Canetti G. The eradication of tuberculosis: Theoretical problems and practical solutions. Tubercle. 1962; 43(3): 301-21. 200. Rajeswari R, Chandrasekaran V, Suhadev M, Sivasubramaniam S, Sudha G, Renu G. Factors associated with patient and health system delays in the diagnosis of tuberculosis in South India. Int J Tuberc Lung Dis. 2002; 6(9): 789-95. 201. Tuberculosis Prevention Trial. Trial of BCG vaccines in South India for tuberculosis prevention. Indian J Med Res. 1980; 72 Suppl: 1-74. 202. Lonnroth K. Risk factors and social determinants of TB. 15th conference of The Union North America region 2011; Vancouver, British Columbia, Canada; 2011. 203. Marrero A, Caminero JA, Rodríguez R, Billo NE. Towards elimination of tuberculosis in a low income country: the experience of Cuba, 1962–97. Thorax. 2000; 55(1): 39-45. 204. Gonzalez E, Armas L, Llanes MJ. Progress towards tuberculosis elimination in Cuba. Int J Tuberc Lung Dis. 2007; 11(4): 405-11. 205. Ross JE. Food security in Cuba. In: Font MA, editor. Cuba Today: Continuity and Change Since the ‘Período Especial,’. New York Bildner Center for Western Hemisphere Studies,; 2004. p. 115-25. 206. Getting started: WFP Food Assistance in the context of Tuberculosis Care and Treatment: World Food Programme; 2007. 207. Connolly M, Nunn P. Women and tuberculosis. World Health Stat Q. 1996; 49(2): 115-9. 208. Murray CJL, Lopez AD. Global mortality, disability and contribution of risk factors: the Global Burden of Disease study Lancet. 1997; 349: 1436-42. 209. National Food Security Bill. National Advisory Council. 2011.

94
Figure 2.1: Vicious cycle of under-nutrition and TB disease (in both drug-susceptible and drug-
resistant disease)
UNDER-NUTRITION
POOR CELL MEDIATED IMMUNITY
POOR CONTAINMENT OF M.TUBERCULOSIS
INCREASED SEVERITY OF
DISEASE
ANOREXIA
CYTOKINE DRIVEN CACHEXIA

95
Figure 2.2: UNICEF framework for causes for under-nutrition (figure adapted from R.E. Black
et al: Maternal and child undernutrition: global and regional exposures and health
consequences. Lancet 2008; 371:243-60)
Short-term consequences:
Mortality, morbidity, disability
Long-term consequences:
Adult size, intellectual ability, economic
productivity, reproductive performance,
metabolic and cardiovascular disease
Inadequate dietary intake Disease
Household food
insecurity
Inadequate care Unhealthy household
environment and lack of
health services
Income poverty: employment,
self-employment, dwelling,
assets, remittances, pensions,
transfers, etc
Lack of capital: financial, human,
physical, social and natural
Social, economic, and political
context
Underlying causes
Immediate causes
Basic causes
Adult and child under nutrition

96
Figure 2.3: Annual tuberculosis mortality rates England and Wales, 1850-1960. BCG, Bacillus
Calmette Guerin.
[Figure from Lienhardt C. From Exposure to Disease: The Role of Environmental Factors in Susceptibility to and Development of Tuberculosis. Epidemiology Reviews 2001; 23(2): 288-301.]

97
Figure 3.1: Box plot showing distribution of pre-treatment and post-treatment weights in
adult patients with pulmonary Tuberculosis at JSS (2004-9).
20
40
60
80
Weig
ht in
kg
women men
N=1665(pre-treatment weights) N=755(post-treatment weights)
Distribution of weights in pulmonary TB patients
Pre-treatment weight Post-treatment weight

98
Figure 3.2: Box plot showing distribution of pre-treatment and post-treatment body mass
index in adult patients with pulmonary Tuberculosis at JSS (2004-9).
*The line indicates the BMI of 18.5 kg/m2 , which is the cut-off separating under-nutrition
(BMI<18.5 kg/m2) from normal (18.5-24.99 kg/m2)
10
15
20
25
30
BM
I in
kg/m
2
women men
line indicates BMI of 18.5 kg/m2
N=1523 (pre-treatment BMI) N=728(post-treatment BMI)
Distribution of body mass index in pulmonary TB patients
BMI pre-treatment BMI post-treatment

99
Figure 5.1: Overview of the families and children who were the subject of the Papworth
survey (1918-1943).

100
Figure 5.2: Summary of children in the village-born and admitted cohorts before admission to
Papworth, while living in Papworth, and after discharge.
PRE-PAPWORTH Period:
231 child contacts were born outside the settlement of which 3 died of TB in this period. The
rest were admitted to the settlement with their families.
c
PAPWORTH Period :
312 child contacts of TB patients lived at Papworth between1918-43
228 were admittedto the settlement after their birth outside
(admitted cohort).
84 child contacts were born in the settlement (village-born cohort).
Village- born cohort: 84 child contacts
Of these, 63 children were in the settlement till
end of study period or development of TB (n=1).
All others were followed in settlement beyond the
major risk period for TB development (mean 4.0
years)
Admitted cohort: 228 child contacts Of these, 123 children were in the settlement till end of study period or development of TB(n=5).
All others were followed in settlement beyond the major risk period for TB development (mean 6.7
years)
POST PAPWORTH Period in village- born cohort
21 children were of families which left the
settlement.
3 children were re-evaluated at the settlement
POST-PAPWORTH Period in admitted cohort
105 children were of families which left the
settlement.
34 children were re-evaluated at the settlement.

101
Table 3.1: The international classification of adult underweight, overweight and obesity
according to BMI (based on references.*)
Classification BMI kg /m2
Underweight <18.5
Severe thinness <16.0
Moderate thinness 16.0-16.99
Mild thinness 17.0-18.49
Normal range 18.5-24.99
Overweight >25.0
Pre-obese 25.0-29.99
Obese >30.0
Obese Class I 30.0-34.99
Obese Class II 30.0-34.99
Obese Class III 30.0-34.99
*References:
1. WHO.Physical status: the use and interpretation of anthropometry. Report of a WHO Expert Committee. WHO Technical Report Series 854. Geneva: World Health Organisation; 1995. 2.WHO. Obesity: preventing and managing the global epidemic. Report of a WHO consultation.WHO Technical Report Series 894. Geneva: World Health Organisation, ; 2000. 3.WHO Expert consultation.Appropriate body-mass index for Asian populations and its implications for policy and intervention strategies. The Lancet. 2004; 363(9403): 157-63.

102
Table 3.2. Demographic and clinical characteristics of adult patients with pulmonary tuberculosis at JSS (2004-2009). Characteristic N=1695
DEMOGRAPHIC AND GEOGRAPHIC
Median age in years, (IQR) 38(29,50)
Age groups, no. (%)
18-25 years 306(18)
26-35 years 475(28)
36-45 years 388(23)
46-55 years 267(16)
≥56 years 259(15)
Gender, (%)
Men 1152 (68)
Women 543 (32)
Residence, (%)
Rural 1601(94)
Urban 94 (6)
Location of residence, (%)
Group 1:related to outreach clinics 193 (11)
Group 2: within radius of 20 km of hospital 161 (9)
Group 3:beyond 20 km radius from hospital 1341 (80)
DISEASE RELATED
Sputum smear, (%)
Smear positive 1119 (66)
Smear negative 576 (34)
Sputum grade, (%)
1+ 357 (32)
2+ 302 (27)
3+ 460(41)
Treatment history, (%)
New cases 1395 (82)
Retreatment cases 300 (18)
No. of retreatment patients with MDR-TB 20
CO-MORBIDITIES
No. of patients with HIV infection 2004-2009 91
No. of patients with Pulm. TB- HIV co-infection 39
No. of patients with Diabetes mellitus 77
No. of patients with anemia (Hb*.<12 g/dl) 515
severe anemia (Hb*.<8 g/dl) 143
FAMILY HISTORY OF TB
No. of patients with family history of TB, (%) 389(23)
No. of patients with family history of TB related death, 207
*Hb.: Hemoglobin

103
Table 3.3: Demographic and clinical characteristics of adult patients with pulmonary
tuberculosis who were treated at JSS (2004-2009), stratified by outcomes.
Characteristic Treatment
success*
N=756
TB
death§
N=60
Default¶
during TB treatment
N=354
P values
(Treatment
success vs.
TB death)
P values
(Treatment
success vs.
default)
DEMOGRAPHIC & GEOGRAPHIC
Median age in years, (IQR) 35(27,45) 40(35,53) 40(29,52) P<0.0001††
P<0.0001†
Gender, (%)
Men 479(63) 46 (77) 251 (71) P=0.04‡ P=0.01‡
Women 277(37) 14 (23) 103 (29)
Residence, (%)
Rural 722 (96) 54 (90) 327 (92) P=0.06‡ P=0.03‡
Urban 34 (4) 6 (10) 27 (8)
Location of residence, (%)
village program/outreach clinics 140(18) 11(18) 34 (10) P<0.0001‡ P<0.0001‡
< 20 km of hospital 87(12) 11(18) 32 ( 9)
>20 km from hospital 529(70) 38(64) 288 (81)
DISEASE RELATED
Sputum smear, (%)
Smear positive 499(66) 37(62) 215 (61) p>0.4‡ P=0.08‡
Smear negative 257(34) 23(38) 139 (39)
Sputum grade, (%)
1+ 156(31) 10(27) 60 (28) P=0.15‡ P=0.3‡
2+ 151(30) 7 (19) 59 (27)
3+ 192(39) 20 (46) 96 (45)
Treatment history, (%)
New cases 628(83) 46(77) 269 (76) P=0.18‡ P=0.004‡
Retreatment cases 128(17) 14(23) 85 (24)
CO-MORBIDITIES
No. of patients with Pulm. TB-
HIV co-infection, % of all HIV-TB
9 (23) 10(26) 20(51) P<0.0001‡ P<0.00001
No. of patients with Diabetes
mellitus, % of all TB-DM patients
42(55) 3(4) 16(21) p>0.5‡ p>0.4‡
‡ Chi-square test. † Mann-Whitney test.
*this includes patients who were cured and those who completed treatment.
§ Death due to any reason occurring during treatment of TB.
¶Interruption of therapy for 2 consecutive months or more.

104
Table 3.4: Weights, heights, body mass index (BMI) in patients with pulmonary TB at JSS, at
diagnosis and after successful treatment (2004-2009).
30 (1.8%) patients had missing values for weights. The heights were missing in 172 patients (10%) and
more in the patients who were transferred out.
‡ Weight change with treatment = *post-treatment weight –pre-treatment weight] (%)
§ Weight change as a proportion of pre-treatment weight= [weight change/pre-treatment weight *100]
Men Women
Measurements at diagnosis
Weight (kg) N=1128 N=537
Median (IQR) 42.0(37.5, 47) 34.1(30.4, 38.1)
Height(cm) N=1030 N=493
median (IQR) 162(158,) 151(148,154)
Body mass index (BMI) kg/m2 N=1030 N=493
BMI , Median (IQR) in kg/m2 16.0
(14.6, 17.4)
15.0
(13.6, 16.5) Distribution of BMI according to WHO recommended cut-offs
BMI> 30 kg/m2: Obese, (%) 0 0
BMI 25.0-29.99: Overweight, (%) 2 (0.2) 1 (0.2)
BMI 18.5-24.99: Normal, (%) 131 (12.8) 32 (7)
BMI 17.0-18.49: Mild underweight, (%) 203 (20) 63 (12.8)
BMI 16.0-16.99: Moderate underweight, (%) 179 (17) 70 (14)
BMI <16.0: Severe underweight, (%) 515(50) 327 (66)
Measurements at end of treatment Men Women
I. Post –treatment weight and changes in weight (kg) N=478 N=277
a. Weight in kg, Median (IQR) 46.4(42.3,51.2) 38(34.3,42.6)
b. Weight change with treatment‡ , median (IQR)
4.1(2,6) 3.7(1.5,5.9)
c. Weight change as a proportion of pre-treatment
weight §
9.3(4.5,14.3) 10.8(3.8, 17.8)
II. Post-treatment body mass index (BMI) kg/m2 N=459 N=269
BMI> 30 : Obese, (%) 0 0
BMI 25.0-29.99: Overweight, (%) 2 (0.4) 1 (0.4)
BMI 18.5-24.99: Normal, (%) 164(35.6) 70 (26)
BMI 17.0-18.49: Mild underweight, (%) 131(28) 59 (22)
BMI 16.0-16.99: Moderate underweight, (%) 85 (19) 45 (16.6)
BMI <16.0: Severe underweight, (%) 77(17) 94 (35)

105
Table 3.5: Pre-treatment weights and pre-treatment BMIs according to subsequent outcomes
of patients at JSS (2004-2009).
Men Women
Successful
treatment
Death Default Successful
treatment
Death Default
N=478 N=46 N=245 N=277 N=14 N=100
Weight in
kg,
median
(IQR)
42.5
(37.8,47.3)
38.5
(34.4,44.6)
41.7
(37.1,47.5)
34.3
(30.4,38.8)
32.7
(29,38.1)
33.9
(30,37.3)
N=459 N=46 N=219 N=269 N=14 N=83
BMI
(kg/m2),
median
(IQR)
16.1
(14.7, 17.5)
15.0
(12.7,16.4)
15.8
(14.4,17.4)
15.1
(13.7,16.8)
14.6
(12.8,17.8)
14.7
(13.4,16)

106
Table 3.6: Univariable and multivariable logistic regression of outcomes of TB related
deaths on pre-treatment weights and other covariates.
Variable Unadjusted OR for TB
death
( with 95% CI)
Adjusted OR§ for TB
related death
( with 95% CI)
OR 95% CI OR 95% CI
Age in years 1.48* (1.10,1.97) 1.34* (1.10,1.79)
Sex
Female 1 1
Male 1.90 (1.03, 3.52) 1.59 (0.67, 3.75)
Pre-treatment weight 0.82** (0.70,1.00) 0.59** (0.47,0.77)
Height at diagnosis 1.03 (0.99, 1.06) 1.06 (1.0, 1.12)
Body mass index‡ 0.80 (0.71,0.91) 0.78 (0.68,0.90)
Sputum status
Smear negative 1 1
Smear positive 0.83 (0.48, 1.42) 1.0 (0.55, 1.85)
HIV status
HIV negative 1 1
HIV positive 16.6 (6.45,42.7) 19.78 (6.83,57.31)
Treatment category
New case 1 1
Previously treated
case
1.49 (0.80,2.80) 1.24 (0.62,2.48)
Location of residence
group 1: 1 NA NA
group 2: 1.61 (0.67,3.83) NA NA
group 3: 0.91 (0.46,1.83) NA NA
Family history of TB
No history of TB 1 NA NA
History of TB + 1.14 (0.63,2.09) NA NA
§ Adjusted for age, gender, pre-treatment weight, height, sputum status, HIV status, treatment
category.
‡ For logistic regression of TB death on BMI, weight, height were omitted from the model
*OR scaled to represent increase of age of 10 years.
**OR scaled to represent increase of weight of 5 kg.
NA: Not applicable as variable is not in final model

107
Table 3.7: Univariable and multivariable logistic regression of outcomes of treatment
success on pre-treatment weights and other covariates.
Variable Unadjusted OR for
treatment success
(with 95% CI)
Adjusted OR§ for
treatmentsuccess
(with 95% CI) OR 95% CI OR 95% CI
Age in years 0.82* (0.74,0.90) 0.82* (0.74,0.90)
Sex
Female 1 1
Male 0.68 (0.53,0.88) 0.83 (0.56,1.22)
Pre-treatment weight 1.05** (0.95,1.10) 1.16** (1.05,1.34)
Height at diagnosis 0.97 (0.97, 1.00) 0.97 (0.95, 1.00)
Body mass index‡ 1.07 (1.01,1.13) 1.07 (1.01,1.14)
Sputum status
Smear negative 1 1
Smear positive 1.25 (0.97, 1.60) 1.16 (0.87, 1.55)
HIV status
HIV negative 1 1
HIV positive 0.15 (0.07,0.33) 0.16 (0.07,0.35)
Treatment category
New case 1 1
Previously treated case 0.65 (0.48,0.87) 0.70 (0.50,0.97)
Location of residence
group 1: 1 1
group 2: 0.65 (0.40,1.07) 0.54 (0.30,0.98)
group 3: 0.52 (0.36, 0.75) 0.43 (0.27, 0.68)
Family history of TB
No history of TB 1
Positive History of TB in family 1.22 (0.92, 1.63) 1.13 (0.84,1.53)
§ Adjusted for age, sex, pre-treatment weight, height, sputum status, HIV status, treatment category, location of residence and family history of TB. ‡ Logistic regression on BMI was done after omitting weight, height from the model *OR scaled to represent increase of age of 10 years. **OR scaled to represent increase of weight of 5 kg. NA: Not applicable as variable is not in final model

108
Table 3.8: Comparative weights and body mass index in patients with pulmonary TB from other high TB burden countries (reference numbers in superscripts). Country ,Year Setting,
% HIV positivity
No. of patients
Percent HIV positivity
Weight (males), mean
Weight (females),
mean
BMI in males,
mean
BMI in female,
mean
India (south), 1959153
Urban 193 Pre-HIV era 39.8 33.3 ---- -----
India (south),200829
Urban 174 100% 50.2 43.2 18.7 18.7
India(central), 2012-present study
Rural 1665 2.3% 42.3 34.6 16.1 15.2
Malawi, 200232 Rural 1181 80% --- --- 18.4 17.9
Tanzania,2006122 Urban 2231 32% 52.7 47.2 18.95 19.3
Indonesia,2000125 Urban 41 Low prevalence, area, Not tested
50.6 40.8 18.5 17.8
Indonesia, 2010134 Rural 300 Low prevalence area, Not tested
--- --- 16.5 (both sexes)

109
TABLE 5.1: Characteristics of source cases for the Papworth children (1918-1943)
CHARACTERISTIC N=150
Demographic
No. of families with source cases 135
Families with more than 1 source case 15
Median (IQR)age at admission, years 33( 28, 33)
Males, % 93
Disease Related
Sputum status of source cases
Sputum smear positive
96* (64%)
Sputum smear negative
54* (36%)
Outcome in smear positive cases(n=96), %
Death 44
Persistently smear positive 16
Intermittent smear positive 10
Smear negative 30
Median (IQR) age at death, years 38 (32,42)
Median (IQR) duration of disease at death in smear positives,
years
6 ( 4,10)
*15 families had more than 1 source case. IQR denotes inter-quartile range.

110
Table 5.2: Characteristics of children in admitted and village-born cohorts from the Papworth
village settlement (1918-1943)
Characteristic Admitted cohort
n=228*
Village-born
cohort n=84
Demographic
Median ( IQR) age of children at time of admission to Papworth, years 7 (3, 11) At birth
Females, % 52% 53%
No. of children 5 years and younger at age at time of admission to Papworth 99 84
Medical status of parents
Smear negative pulmonary TB,% 34% 40%
Smear positive pulmonary TB,% 66% 60%
Other characteristics related to exposure to TB
Age when first exposed to at least one parent with active TB, %
0-4 years 72% 100%
≥5 years 28%
No. of child contacts of smear positive TB 151 50
No. of child contacts of smear negative TB 77 34
Before admission to Papworth N=231
Total person-years of observation before admission to Papworth 881 Not applicable
Median (IQR) person-years of observation 3(2,5) Not applicable
While living in Papworth N=228 N=84
Total person-years of observation in Papworth‡ 2215 765
Median (IQR) person-years of observation 9( 5,14) 9 ( 5,13.5)
Child contacts with ≥3 years stay in Papworth; N(%) and *95% CIs+
199(87)
[82,91]
70(83)
[73,91]
After discharge from Papworth N=34 N=3
Number of child contacts who left the settlement 105 23
Number re-evaluated (percent of those who were discharged) 34(32) 3(13)
Person-years of observation after discharge from Papworth 221 23
Median person-years of observation (IQR) 6.5(3,10) 9(5,9)
* 3 children who died before admission to Papworth are not part of this analysis. IQR denotes inter-quartile range.95 % CI
denotes 95% confidence intervals. ‡ Person-time of stay in Papworth extended from year of admission to either 1943(for those
who continued to live in the settlement), or to year of leaving the settlement (for those who left the settlement). In case the
child died, this period extended from year of admission to year of death.

Table 5.3: Prevalence of infection and estimated annual risk of infection in village born and
admitted cohorts using different methods of analysis.
Village-born*
cohort
Admitted cohort*†
N=69 ANALYSIS 1‡.
N=196
ANALYSIS 2§.
N=196
ANALYSIS||
N=89 Prevalence of TB
infection in 1.0-3.9
years
0.44 0.82 0.5 (10) 0.38
Prevalence of TB
infection in 4.0-
6.9 years
0.71 0.84 0.82(45) 0.79
Prevalence of TB
infection in 7.0-9.9
years
0.94 0.86 0.88(50) 0.9
Prevalence of TB
infection ≥ 10 years
1 0.84 0.87(91) 0.83
Mean prevalence of
infection, (95% CI)
0.68
(0.56,0.79)
0.84
(0.78,0.89)
0.84
(0.78, 0.89)
0.80
(0.70,0.88)
Mean duration of
exposure (years)
5.1 6.8 10.1 6.9
Annual risk of
infection, (95% CI)
0.20
(0.15,0.26)
0.24
(0.20,0.28)
0.17
(0.14,0.20)
0.21
(0.16,0.26)
*47 (15 children in the village born cohort and 32 in the admitted cohort) children were not evaluated by X-rays and their status
with regard to infection cannot be ascertained. † Assessment for infection was done only after admission to Papworth, and
there was no data for the pre-Papworth period.
† ANALYSIS 1- All admitted children. Duration of exposure = [(Age at assessment) - (Age of child when TB was diagnosed in
parent)]
§ ANALYSIS 2-All admitted children. Duration of exposure= [Age at assessment]. (Some admitted children had only community
levels of exposure for some years, before the parent was diagnosed with TB).
||ANALYSIS 3- Restricted to admitted children exposed since birth. Duration of exposure =[Age at assessment]
95% CI denotes 95% confidence intervals.

112
Table 5.4: Mortality and morbidity in the admitted cohort, before admission to Papworth.
Admitted cohort
No. of children at risk 231
Total no. of children with TB disease 13
Types of disease PTB*: 8
smear positive: 5
smear negative:3 EPTB
†: 5
Disseminated TB:1
TB peritonitis: 1
Articular TB: 1
Mediastinal lymph node:2 Deaths in children with TB disease 6 (PTB smear positive: 3, PTB smear
negative: 1, EPTB:2)** Estimated person-years at risk (PYAR)‡ 871
Overall incidence rate per 100,000 PYAR, 95% CIs 1493 ( 795, 2552)
Age group ≤5 years
No. of children years with disease 5
Person years at risk (PYAR) 411
Incidence rate per 100,000 PYAR‡, 95% CIs 1217 (395, 2839)
Age group 6-12 years
No. of children with age 6-12 years with disease 2
Person years at risk (PYAR) 346
Incidence rate , per 100,000 PYAR‡, 95% CIs 578 (70, 2088)
Age group ≥13 years
No. of children with age≥13 years with disease 6
Person years at risk (PYAR) 114
Incidence rate of active TB, per 100,000PYAR‡, 95% CIs 5263 (1931, 11,456)
** Of the 6 deaths, three occurred before admission, and three occurred after admission to Papworth.
But in all six the onset of disease was before Papworth admission.
*PTB denotes pulmonary TB. † EPTB denotes extra-pulmonary TB.
‡ PYAR denotes person-years at risk for a child in the pre-Papworth period. It extends from the year of
exposure to either the year of admission to the settlement or the year of diagnosis of TB.
95% CIs denotes 95% confidence intervals.
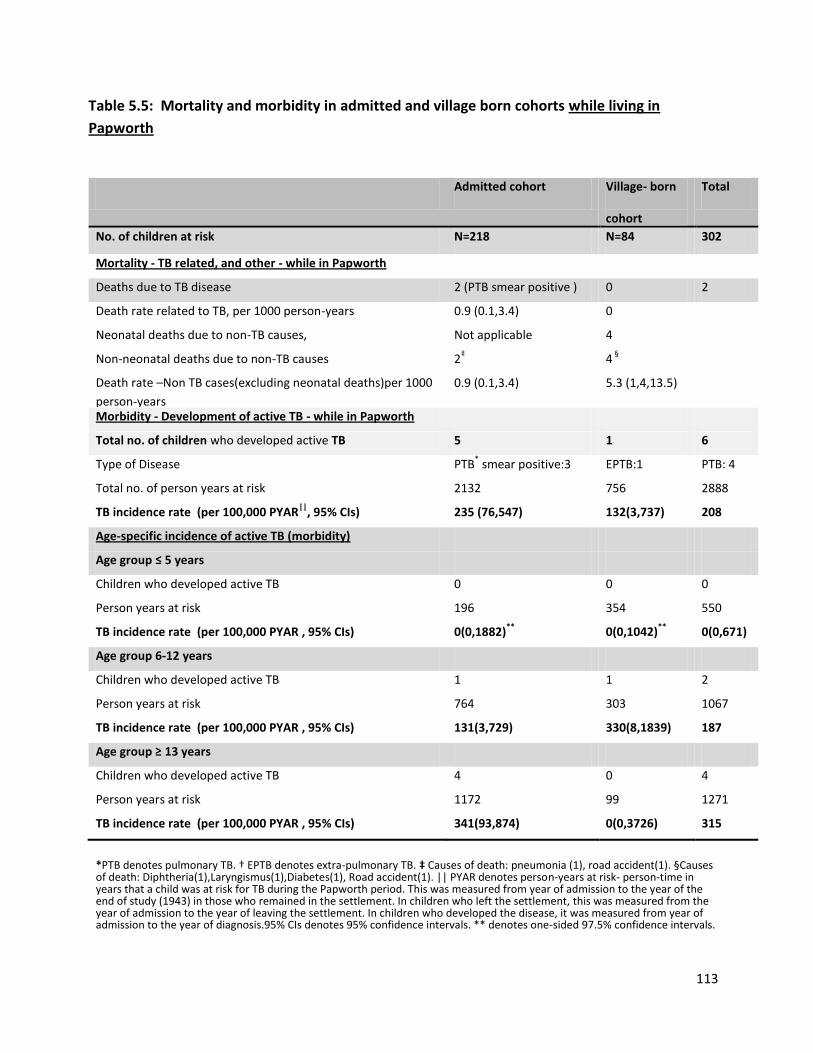
113
Table 5.5: Mortality and morbidity in admitted and village born cohorts while living in
Papworth
Admitted cohort Village- born
cohort
Total
No. of children at risk N=218 N=84 302
Mortality - TB related, and other - while in Papworth
Deaths due to TB disease 2 (PTB smear positive ) 0 2
Death rate related to TB, per 1000 person-years 0.9 (0.1,3.4) 0
Neonatal deaths due to non-TB causes,
Neonatal death rate (non-TB)
Not applicable 4
48/1000 births
Non-neonatal deaths due to non-TB causes 2‡ 4
§
Death rate –Non TB cases(excluding neonatal deaths)per 1000
person-years
0.9 (0.1,3.4) 5.3 (1,4,13.5)
Morbidity - Development of active TB - while in Papworth
Total no. of children who developed active TB 5 1 6
Type of Disease PTB* smear positive:3
PTB* smear negative: 1
EPTB†:1
EPTB:1 PTB: 4
EPTB: 2 Total no. of person years at risk 2132 756 2888
TB incidence rate (per 100,000 PYAR||
, 95% CIs) 235 (76,547) 132(3,737) 208
(76,452) Age-specific incidence of active TB (morbidity)
Age group ≤ 5 years
Children who developed active TB 0 0 0
Person years at risk 196 354 550
TB incidence rate (per 100,000 PYAR , 95% CIs) 0(0,1882)**
0(0,1042)**
0(0,671)
Age group 6-12 years
Children who developed active TB 1 1 2
Person years at risk 764 303 1067
TB incidence rate (per 100,000 PYAR , 95% CIs) 131(3,729) 330(8,1839)
187
(22,677) Age group ≥ 13 years
Children who developed active TB 4 0 4
Person years at risk 1172 99 1271
TB incidence rate (per 100,000 PYAR , 95% CIs) 341(93,874) 0(0,3726) 315
(86,806) *PTB denotes pulmonary TB. † EPTB denotes extra-pulmonary TB. ‡ Causes of death: pneumonia (1), road accident(1). §Causes of death: Diphtheria(1),Laryngismus(1),Diabetes(1), Road accident(1). || PYAR denotes person-years at risk- person-time in years that a child was at risk for TB during the Papworth period. This was measured from year of admission to the year of the end of study (1943) in those who remained in the settlement. In children who left the settlement, this was measured from the year of admission to the year of leaving the settlement. In children who developed the disease, it was measured from year of admission to the year of diagnosis.95% CIs denotes 95% confidence intervals. ** denotes one-sided 97.5% confidence intervals.

114
Table 5.6: Mortality and morbidity in admitted and village born cohorts after discharge from
Papworth
Admitted cohort Village-born
Cohort
Total
No. of children evaluated at least once, after discharge
from Papworth
N=34 N=3 37
Deaths in children with TB 4
(all PTB smear positive)
0 4
No. of children with TB disease 5 0 5
Type of Disease PTB
† smear positive:(4)
PTB† smear negative: (1)
0 PTB†:5
Person-years of observation (PYAR) ‡
214 23 237
TB incidence rate (per 100,000 PYAR , 95% CIs) 2336
(759-5452)
0
(0-16039)§
2110
(685-4923) Age-specific incidence of active TB (morbidity)
Age group 0-5 years
Children with TB 0 0 0
Person-years at risk 0 2 2
Age group 6-12 years
Children with TB 0 0 0
Person- years at risk
9 14 23
Age group ≥ 13 years
Children with TB 5 0 5
Person-years at risk 205 7 212
TB incidence rate (per 100,000 PYAR , 95% CIs) 2439
(792-5692)
0
(0-52698) §
2358
(766-5504) Best case scenario
|| for post-Papworth period
Person-years at risk (PYAR) –best case scenario 795 239 1034
TB incidence rate (per 100,000 PYAR , 95% CIs) 629
(258-1855)
0
(0-1543)§
484
(157-1128)
*only 25% of the contacts in the admitted cohort were < 18years of age at re-evaluation. IQR denotes inter-quartile range.
† PTB denotes pulmonary TB. ‡PYAR: Person years at risk, estimated as number of years between leaving the settlement and
re-evaluation/admission at Papworth. § denote one-sided 97.5% confidence intervals.||The best case scenario for post-
Papworth period would assume that all the children who developed active TB after leaving the settlement returned to
Papworth for evaluation, and all the children who did not undergo re-evaluation were healthy. 95% CIs denote 95% confidence
intervals.

115
Table 5.7: Summary of TB incidence rates in admitted and village born cohorts before
admission, while living in, and after discharge from Papworth
* PYAR= Person years at risk. 95% CIs denote 95% confidence intervals. † N.A = Not applicable.
‡ denotes one sided 97.5% confidence interval. § IRR=Incidence rate ratio
Admitted cohort Village-born cohort
Cohort
Total
No. of children at risk N=231 N=84 315
Person-years at risk (PYAR)*
3217 779 3996
Annual risk of infection per year of exposure,95% CI 0.24(0.20,0.28)
(0.20,0.28)
0.20(0.15,0.26)
(0.15,0.26)
No. of children with disease in all periods 23 1 24
Smear status of source case:
smear positive pulmonary TB 20 0 20
smear negative pulmonary TB 3 1 4
TB disease characteristics
1.Site
Pulmonary 17 0 17
Extra-pulmonary TB 6 1 7
2.Median age at onset of TB, in years 15 10 15
3.Deaths due to TB 12 0 12
Before admission to Papworth (Pre-Papworth) No. at risk =231
No. with disease 13 N.A. † 13
Overall Incidence rate per 105 PYAR
*, 95% CIs 1493(795,2552) N.A 1493 (795,2552)
Incidence rate in ≤5 years age/ 105 PYAR, 95%CIs 1217(395,2839) N.A 1217 (395,2839)
Incidence rate in 6-12 years age/105 PYAR, 95%CIs 578 (70,2088) 578 (70,2088)
Incidence rate in ≥13 years age/105 PYAR, 95%CIs 5263 (1931,11456) 5263(1931,1145
6) While living in Papworth (Papworth) No. at risk=218 No. at risk=84
No. with disease 5 1 6
Overall Incidence rate /105 PYAR , 95% CIs 235( 76,547) 132( 3,737) 208( 76,452)
Incidence rate /105 PYAR in children ≤ 5 years,95%CIs 0 (0,1882)
†
0(0,1042) ‡ 0(0,671)
Incidence rate in 6-12 years age/105 PYAR, 95%CIs 131(3,729) 330(8,1839) 187(22,677)
Incidence rate in ≥13 years age/105 PYAR, 95%CIs 341(93,874) 0(0,3726)
‡ 315(86,806)
After discharge from Papworth (Post-Papworth) No. at risk =34 No. at risk =3
No. with disease 5 0 5
Overall Incidence rate per 105 PYAR ,95% CIs 2336 (759,5452) 0(0 ,16039)
† 2110(685,4923)
Incidence rate in ≥13 years age/105 PYAR, 95%CIs 2439(792,5692) 0(0,52698)
† 2252(766,5504)
Incidence rate (best case scenario)/105 PYAR,95% CIs 629 (258,1855) 0(0,1543)
† 484(157,1128)
Comparison of TB incidence rates in various periods
IRR§ - Papworth vs. pre-Papworth period, 95% CIs 0.16 (0.04,0.47)
N.A. 0.14(0.04,0.39)
IRR-Post-Papworth period vs. Papworth period,95% CIs 10( 2.3, 43.3) 0(0,1282) 10.2(2.5,40)
IRR -Post-Papworth period vs. Papworth period (best case scenario),
95% CI
2.7(0.6,11.7) 0(0,123) 2.3(0.6,9.2)