Embed Size (px)
Citation preview

1
AuSSI Litter Audit - SecondaryNote: For the most up-to-date digital version of this resource click here.
Activity IntroductionQuick summary: In this activity students map the distribution and composition of litter in the school courtyards and grounds. Students work in groups to count the number of litter items across the school. Groups then come together to compile their
information to create a complete picture of litter at your school.
Completing this litter audit gathers the baseline litter data for the school. This audit activity should be conducted again after some litter reduction activities have been put in place in the school, so that changes in the amount and location of litter can be measured and reported on.
This lesson can be used when working on the Waste Module of ResourceSmart AuSSI Vic Certification. By completing this lesson you will have completed the following actions:
Waste Checklist Compulsory Actions:
A1 – Have you undertaken litter assessments at your school? A1 – Has this data been entered as your baseline, and any anomalies
explained?
Checklist data goals:
No official data goal.
Australian Curriculum Links:
Cross curriculum priorities
Sustainability – OI.5 – World views are formed by experiences at personal, local, national and global levels, and are linked to individual and community actions for sustainability.
General Numeracy, Critical and creative thinking

2
capabilitiesExplicit content description
Science Year 7 Some of Earth’s resources are renewable, but others are
non-renewable (ACSSU116)

3
Geography Year 7 Collect, select and record relevant geographical data and
information, using ethical protocols, from appropriate primary and secondary sources (ACHGS048)
Reflect on their learning to propose individual and collective action in response to a contemporary geographical challenge, taking account of environmental, economic and social considerations, and predict the expected outcomes of their proposal (ACHGS054)
Mathematics Year 7 Find percentages of quantities and express one quantity as
a percentage of another, with and without digital technologies. (ACMNA158)
Science Year 8 Science and technology contribute to finding solutions to a
range of contemporary issues; these solutions may impact on other areas of society and involve ethical considerations (ACSHE135)
Geography Year 8 Collect, select and record relevant geographical data and
information, using ethical protocols, from appropriate primary and secondary sources (ACHGS056)
Reflect on their learning to propose individual and collective action in response to a contemporary geographical challenge, taking account of environmental, economic and social considerations, and predict the expected outcomes of their proposal (ACHGS062)
Mathematics Year 8 Solve problems involving the use of percentages,
including percentage increases and decreases, with and without digital technologies (ACMNA187)
Geography Year 9 Collect, select, record and organise relevant geographical
data and information, using ethical protocols, from a range of appropriate primary and secondary sources (ACHGS064)
Geography Year 10 Collect, select, record and organise relevant data and
geographical information, using ethical protocols, from a range of appropriate primary and secondary sources (ACHGS073)
Connecting lessons: Waste audit – must be completed as a compulsory action.
Resources required: Map of the school grounds, student worksheet, clip board

4
(if using printed copies of worksheet), camera/smart phone or iPad for photographing litter. Optional: bag or bin for collecting the litter items to put into a rubbish or recycling bin.Digital technology opportunities: Digital sharing capabilities.

5
Keywords: Litter, school, waste, rubbish, organic waste, recyclable waste.
Need some more support? Visit these leading organisations:
CERES
Greening Australia
VAEE (Victorian Association for Environmental Education)
Port Phillip EcoCentre
PlanetSavers

6
Teacher worksheetTeacher preparation:Overarching learning goals:
Students recognise that litter can be found to varying degrees in schools and the environment in general.
Students recognise that litter has many negative impacts for people and animals in the environment, and can have impacts far away from the school site.
Students understand that reducing litter can have many benefits for the school community and the environment in general.
Teacher content information: View the Cool Australia Waste video here: http://vimeo.com/77933477
Hot tips: Prior to the activity obtain map of the school that includes the buildings, courtyards, gardens and sports grounds. If you don't have a copy of the plan, print a map of the school from Google Maps.
Student and classroom organisation:Step 1. Introduce the activity with a discussion about what litter is, what items often become litter and what students think about the amount of litter in their school and how it gets there. Where do students think the main litter hot spots are and why?
Explain that in this activity, they will be identifying the 'litter hot spots' in the school and then mapping the distribution and composition of the litter. Remind students that when working with litter, they must act in a safe manner and use gloves or tongs when handling any litter. Explain that they must not handle 'sharps' (syringes, broken glass) themselves but notify a teacher about where 'sharp' items are located.
Step 2. Using the map of the school take the class on a quick walk around the school to see where the litter seems to be most common. The students will probably know this already and will be able to help you find these hot spots.

7
Step 3. Work with the students to divide the school grounds into about six to eight distinct areas, so that all the outside locations are covered. Cut up the school ground map and give each part of the map a code from A-H, mark north on each and enlarge each map on the photocopier. The areas don’t have to be equal in size, but should include some littered spots. Some locations with high litter densities (e.g., around the canteen) may be quite small while others, such as the sports oval with low litter densities, may be quite large.
Split the class into groups of 2-4 students, allowing each group to choose a map area to investigate. The task of each group is to mark the position of each item of litter in their section on their area map.
Step 4. Before going out in the grounds:
Discuss the scale of the maps, so that students will be able to mark the position of each item on their map with some accuracy.
Hand out the litter identification key (see student worksheet) to the different types of litter that they may find (you may wish to add or delete items in this list). The students could also create their own keys.
Step 5. The groups then go to their areas and collect their data. In order to do this they will need to:
Take a photograph of the area to give an overview of the location. Take photographs of any 'litter hot spots'. Work as team to identify every item of litter in the area and to record
the position of each item on the map, using the key to identify each piece of litter (remind them not to handle any litter).
Step 6. All groups return to the classroom and join all the completed plans to form a compositeplan for the school. This should show a clear picture of the 'litter hot spots' in the school. In addition, each group examine their section in more detail:
Count the number of each type of litter and then write the totals in the table on the student worksheet (or ask students to create their own).
Add up the total number of litter items in their group's section. Use the data to create bar charts or pie charts showing the makeup of
the litter in the area they mapped. Alternatively, they can use the online data sheet to record their totals.

8
Step 7. Still working in groups, ask students to answer the following questions for each mapped area (questions also available on the student worksheet):
What was the total number of items of litter in your section? What were the three most common items? What do you think are some
reasons for this? Where was the litter densest in your section? Why do you think this is so? Identify which pieces could have been recycled or composed. What percentage of all the pieces of litter could be recycled? What percentage of all the pieces of litter could be composted? What percentage of all the pieces of litter should have been placed in the
rubbish bins?
Step 8. Ask all the groups to come together to collate the results of all the sections. Ask students to:
Write the total number of litter items found in each mapped area in last table on the student worksheet.
Create bar charts or pie charts showing the numbers of items of litter for each section. Alternatively, they can use the online data sheet to record the totals.
Step 9. Still working as a class, ask students to answer the following questions for the whole school grounds and courtyards (also available on the student worksheet):
What was the total number of items of litter in the school grounds and courtyards?
Which area had the greatest number of litter items? What were the three most common litter items overall? What do you
think are some reasons for this? Identify which piece could have been composed and which could have been
recycled? What percentage of all the pieces of litter could be recycled? What percentage of all the pieces of litter could be composted? What percentage of all the pieces of litter should be placed in the rubbish
bins?
Ask students to write their answers in response to the following questions (also available on the student worksheet):
Why do you think there is so much litter in certain areas of the school grounds? What is it about these areas that creates litter (e.g. are there bins nearby that are often overflowing, does the wind always blow loose bits of litter to this part of the school yard, can animals get into the bins)?

9
Take actionMapping and measuring the current amount and types of litter in the school grounds provides the baseline data against which litter reduction efforts can be measured. After students have identified and implemented actions to reduce litter they should repeat the audit activity to measure how
10
successful these actions have been in reducing litter in these locations. Or use the results to identify where improvements could be made to their litter reduction action plan.
What do you think should be done to reduce the litter at your school? How would you do it?
Students develop an action plan to reduce litter in the school grounds. They need to specify ways to prevent litter rather than just picking it up afterwards, e.g. provide appropriate recycling, food waste and rubbish bins in courtyards and outdoor locations). Action plans should be based on the 4Rs (refuse, reduce, reuse, recycle) and should include actions for addressing:
Paper/cardboard, paper) Food waste (organics) Recyclable food and drink packaging (plastic bottles/containers,
aluminium cans, cardboard cartons) Packaging such as polystyrene , soft plastic wrappers) Batteries Solid waste (non-compostable or non-recyclable waste) Litter
Students create actions to address each of these waste streams. If your school is already addressing these waste streams, how could these actions be improved? Which types of litter have most impact on 1) people, 2) on wildlife? What actions can target these litter items?
Students should consider actions that are school-based and actions that are home-based (such as not bringing throw-away food and drink packaging to school). How can they plan for home-based actions (e.g. send information home in newsletters or on the school website)?

11
Extension:1. Students develop a litter reduction plan that can be transferable across all the classrooms at the school.
2.Students develop waste actions for other parts of the school, such as staff rooms, library, media rooms and science labs, outdoor areas etc.
3. The class works with the local management committee to develop a litter reduction plan for a park/reserve/sports ground adjoining the school.
4.Students visit the Victorian Litter Action Alliance website to check out how litter reduction is planned and conducted by local and state government authorities in partnership with community groups: http://www.litter.vic.gov.au/
Additional informationSome alternative ways for sampling the data in each section are:
1. Use three hoops thrown randomly in the location to be mapped and take photographs of the litter within the boundary of the hoop. Total the number of different types of litter and record the data in the Record Sheet.2. Draw a transect line (e.g. 5 or 10 metres) on the section of the map being surveyed and mark and count every item that touches the transect line on the map.
3. Use a rope to physically create a transect line in the location being surveyed and mark and count every item that touches the transect line.
Ideas for reducing litter at your school
Project Description ResourcesSpread the word
Create interpretive signage for the school about cutting waste. Cool Australia Waste
factsheetTake it home
Create 3R booklets or brochures for the school community. Cool Australia Waste
factsheetEngage an expert
Contact a local waste expert to arrange an incursion or an excursion.
Your local council or waste management company.
Waste free lunch
Hold a 'Nude Food Day' at your school Nude Food Day, EnviroWeek

12
For more ideas on the 4R's, visit the Cool Australia Waste Toolbox

13
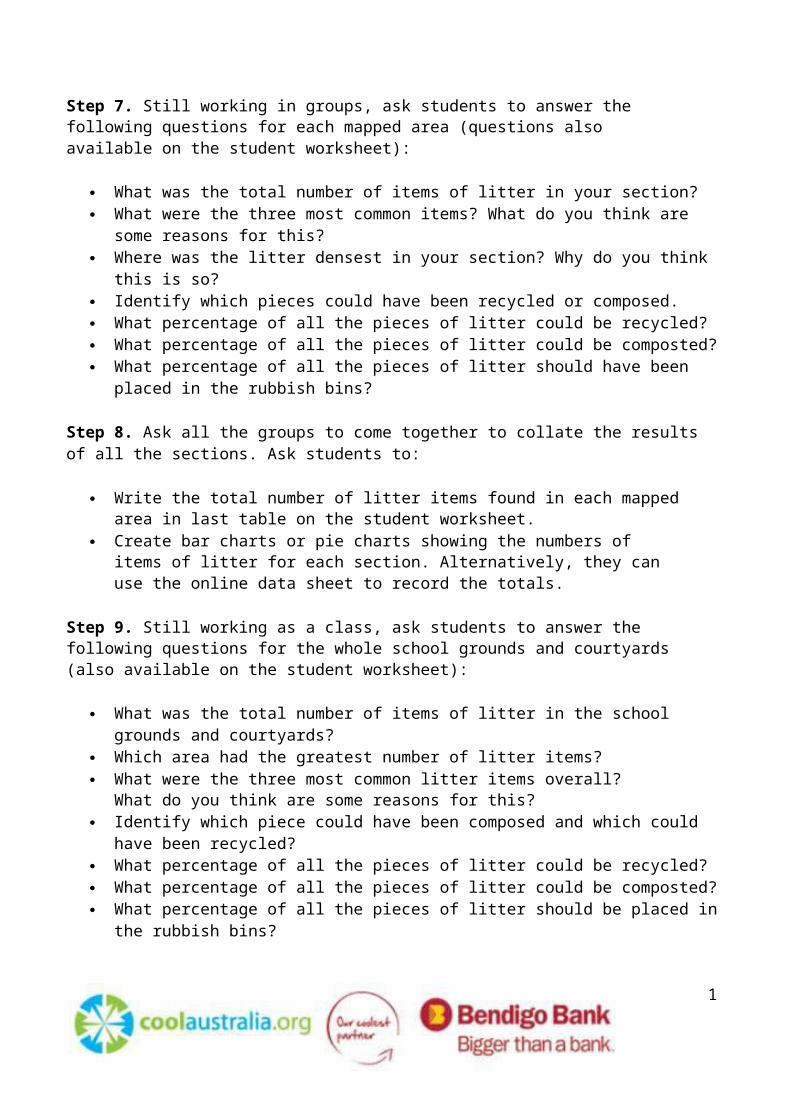
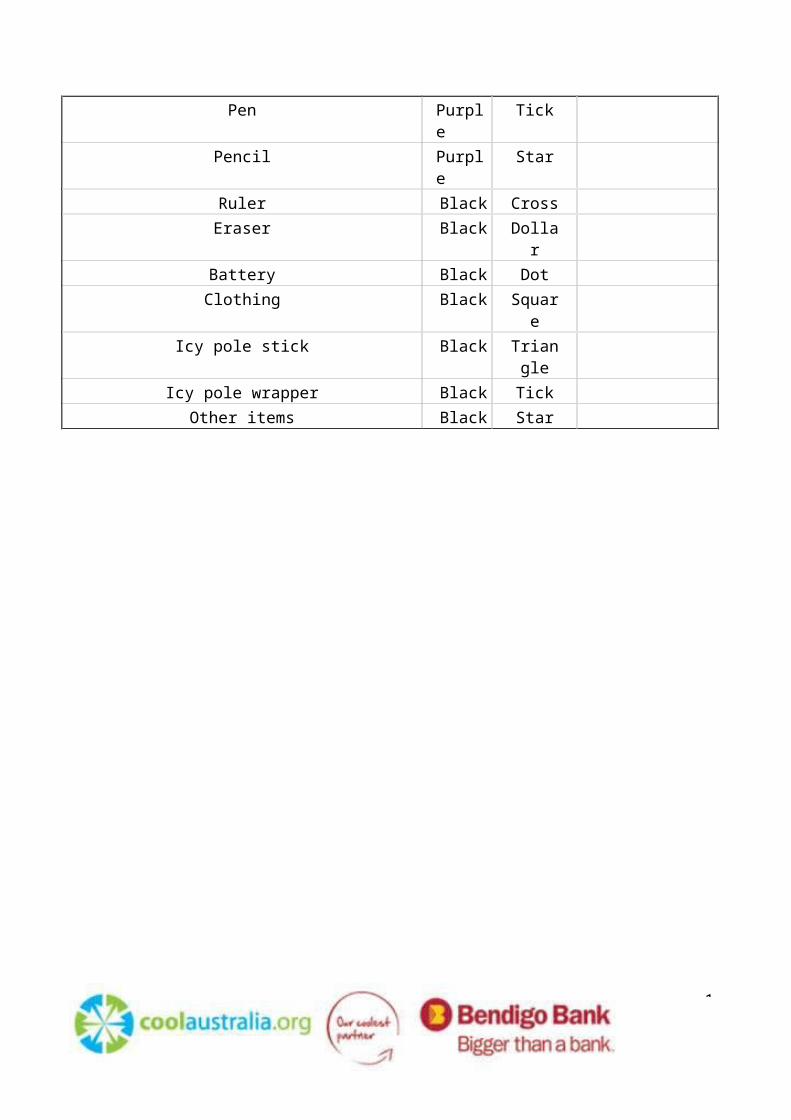
Student worksheetThought starter: What is the most common type of litter in Australia? What is the most common type of litter at your school?Litter Identification Key - Use this key to identify the types of litter you find in your allocated area. If you are working from a printed copy of the worksheet you can also add the actual symbol you will use to the relevant column.
Type of litter Colour
Shape Actual symbol
Newspaper Red DotMagazine Red Square
Book Red Triangle
Sheets of paper Red TickSmall pieces of paper Red Star
Paper bag Red CrossCardboard box Red Dollar
Paper sandwich wrap Blue DotPlastic drink bottle Blue Square
Plastic drink bottle lid Blue Triangle
Paper tissue Blue TickPlastic straw Blue Star
Plastic lolly wrapper Blue CrossPlastic chip packet Gree
nDollar
Plastic wrap Green
Dot
Small plastic item Green
Square
Whole or partly eaten raw fruit or skin
Green
Triangle
Whole or partly eaten raw vegetable
Green
Tick
Cigarette butt Green
Tick
Other food item Gree Star

14
nAluminium can Purpl
eCross
Aluminium foil Purple
Dollar
Lid or ring pull from a can Purple
Dot
Steel can Purple
Square
Drink box (milk or juice) Purple
Triangle

1
Pen Purple TickPencil Purple StarRuler Black CrossEraser Black DollarBattery Black DotClothing Black Square
Icy pole stick Black Triangle
Icy pole wrapper Black TickOther items Black Star

1
Mapping the litter in our school - Area record sheet
Team members:
Date:
Recent weather conditions: (e.g. windy)
Section name and location:
Type of litter Tally Number of itemsNewspaperMagazine
BookSheets of paperSmall pieces of
paperPaper bag
Cardboard boxPaper sandwich
wrapPlastic drink bottlePlastic drink bottle
lidPaper tissuePlastic straw
Plastic lolly wrapperPlastic chip packet
Plastic wrapSmall plastic itemWhole or partly
eaten raw fruit or skin
Whole or partly eaten raw vegetable
Other food itemAluminium can
1
Aluminium foil

1
Lid or ring pull from a can
Steel canDrink box (milk or
juice)Pen
PencilRulerEraserBatteryClothing
Icy pole stickCigarette buttOther items
TOTAL:
1
Your section - Once all the litter counts for your area have been added to the record sheet, answer the following questions:
1. What was the total number of items of litter in your mapped area?
2.What were the three most common litter items? What do you think are
some reasons for this? i.
ii.
iii.
3. Where was the litter densest in your section? Why do you think this is so?
4.What percentage of all the pieces of litter could be recycled?
5. What percentage of all the pieces of litter could be composted?

1
6.What percentage of all the pieces of litter should be placed in the rubbish bins?
Whole school litter totals
Area name
Area description
Total number of items of litter
Number of recyclable items
Number of compostable items
Number of items of rubbish
Whole school - Once all the litter mapping results for the whole school have been collated, answer the following questions:
1. What was the total number of items of litter in the school grounds and courtyards?
2. Which area had the greatest number of litter items?
1
3. What were the three most common litter items overall? What do you think are some reasons for this?
i.
ii.
iii.
4. What percentage of all the pieces of litter could be recycled?
5. What percentage of all the pieces of litter could be composted?
6. What percentage of all the pieces of litter should be placed in the rubbish bins?

1
Reflection questions
Mapping and measuring the current amount and types of litter in the school grounds provides the baseline data against which litter reduction efforts can be measured.
1. Why do you think there is so much litter in certain areas of the school grounds? What is it about these areas that creates litter (e.g. are there bins nearby that are often overflowing, does the wind blow loose bits of litter to this part of the school yard, can animals get into the bins, was a community events recently held at/adjoining the school)? How could the time of day affect the amount of litter found (e.g. before/after lunch?
2. What impact does litter in the school courtyards/grounds have on you and your friends? How does it make you feel about using that area? What impact do you think that this litter has on visitors to the school? What impact do you think that this litter has on wildlife and pets living in or near the school?
3. What do you think should be done to reduce the litter at your school? Are some types of litter or locations more important to target for action than others? What specific actions do you suggest be included in a litter reduction plan for the school?