Embed Size (px)
Citation preview

2018
Norwich Economic Assessment
1
Content
Introduction ........................................................................................................................................................................................4
Summary - Norwich local authority area ..........................................................................................................................................5
Section 1 Demographics ...............................................................................................................................................................7
1.1 DEMOGRAPHY .................................................................................................................................................................... 7
1.2 AGE PROFILE ....................................................................................................................................................................... 8
1.3 ETHNICITY ........................................................................................................................................................................... 9
1.4 GENDER ............................................................................................................................................................................ 11
1.5 MIGRATION ....................................................................................................................................................................... 11
Section 2: Functional Economic Geography ...................................................................................................................................1
2.1 TRANSPORT ........................................................................................................................................................................ 1
2.2 ECONOMIC LINKAGES ......................................................................................................................................................... 2
Section 3: Business and Enterprise .................................................................................................................................................8
3.1 COUNT OF BUSINESSES ...................................................................................................................................................... 9
3.2 COMPANY SIZE ................................................................................................................................................................. 12
3.3 EMPLOYMENT BY SECTOR ................................................................................................................................................ 15
3.4 BUSINESS START-UPS, CLOSURES AND SURVIVAL RATES ................................................................................................ 18
3.5 TURNOVER ........................................................................................................................................................................ 20
2
Section 4: Productivity .................................................................................................................................................................... 21
4.1 MEASURES OF PRODUCTIVITY .......................................................................................................................................... 21
4.2 INTERNATIONAL TRADE .................................................................................................................................................... 23
Section 5: Qualifications and Skills ................................................................................................................................................ 24
5.1 MARKET FOR SKILLS ......................................................................................................................................................... 24
5.2 JOB-RELATED TRAINING ................................................................................................................................................... 26
5.3 YOUNG PEOPLE NOT IN EDUCATION, EMPLOYMENT OR TRAINING (NEET) ....................................................................... 27
5.4 GCSE PERFORMANCE ........................................................................................................................................................ 28
5.5 HIGHER EDUCATION (HE) AND FURTHER EDUCATION (FE) INSTITUTIONS ......................................................................... 29
Section 6: Labour Market ................................................................................................................................................................ 30
6.1 JOBS DENSITY ................................................................................................................................................................... 30
6.2 ECONOMIC ACTIVITY ......................................................................................................................................................... 31
6.3 EMPLOYEE STATUS ........................................................................................................................................................... 33
6.4 OCCUPATIONAL PROFILE .................................................................................................................................................. 34
6.5 SKILLS SHORTAGES AND SKILLS GAPS .............................................................................................................................. 36
6.6 EARNINGS ......................................................................................................................................................................... 36
Section 7: Deprivation ..................................................................................................................................................................... 38
7.1 THE ENGLISH INDICES OF DEPRIVATION 2015 – LA SUMMARY ........................................................................................... 38
7.2 THE ENGLISH INDICES OF DEPRIVATION 2015 – LSOAS ...................................................................................................... 41
7.3 CLAIMANT COUNT ............................................................................................................................................................. 42
3
Section 8: Housing ........................................................................................................................................................................... 48
8.1 TENURE............................................................................................................................................................................. 48
8.2 HOUSING MARKET AREA (HMA) ......................................................................................................................................... 49
8.3 HOUSE PRICES AND AFFORDABILITY ................................................................................................................................ 50
8.4 HOUSEHOLD PROJECTIONS .............................................................................................................................................. 52
Data sources ..................................................................................................................................................................................... 54
4
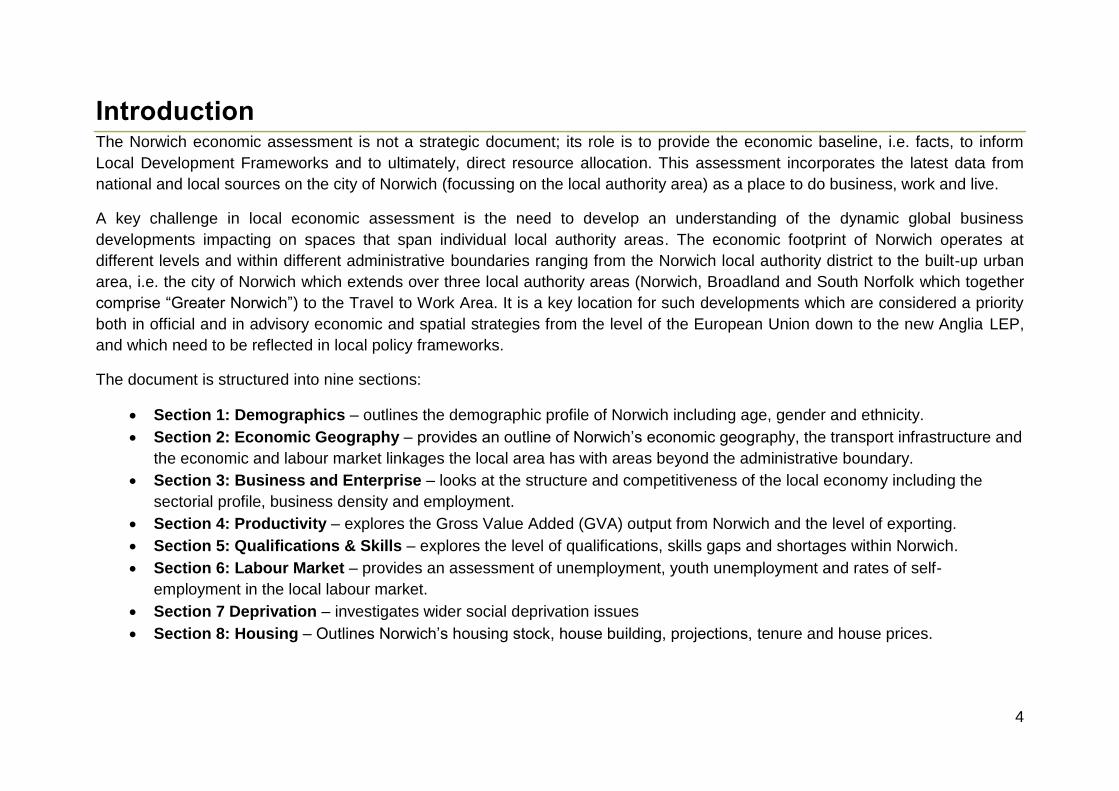
Introduction The Norwich economic assessment is not a strategic document; its role is to provide the economic baseline, i.e. facts, to inform
Local Development Frameworks and to ultimately, direct resource allocation. This assessment incorporates the latest data from
national and local sources on the city of Norwich (focussing on the local authority area) as a place to do business, work and live.
A key challenge in local economic assessment is the need to develop an understanding of the dynamic global business
developments impacting on spaces that span individual local authority areas. The economic footprint of Norwich operates at
different levels and within different administrative boundaries ranging from the Norwich local authority district to the built-up urban
area, i.e. the city of Norwich which extends over three local authority areas (Norwich, Broadland and South Norfolk which together
comprise “Greater Norwich”) to the Travel to Work Area. It is a key location for such developments which are considered a priority
both in official and in advisory economic and spatial strategies from the level of the European Union down to the new Anglia LEP,
and which need to be reflected in local policy frameworks.
The document is structured into nine sections:
Section 1: Demographics – outlines the demographic profile of Norwich including age, gender and ethnicity.
Section 2: Economic Geography – provides an outline of Norwich’s economic geography, the transport infrastructure and
the economic and labour market linkages the local area has with areas beyond the administrative boundary.
Section 3: Business and Enterprise – looks at the structure and competitiveness of the local economy including the
sectorial profile, business density and employment.
Section 4: Productivity – explores the Gross Value Added (GVA) output from Norwich and the level of exporting.
Section 5: Qualifications & Skills – explores the level of qualifications, skills gaps and shortages within Norwich.
Section 6: Labour Market – provides an assessment of unemployment, youth unemployment and rates of self-
employment in the local labour market.
Section 7 Deprivation – investigates wider social deprivation issues
Section 8: Housing – Outlines Norwich’s housing stock, house building, projections, tenure and house prices.
5
Summary - Norwich local authority area
Major regional service centre
Norwich is linked to Cambridge via the A11, which leads to the M11 motorway for London and the M25.
The Norwich Travel to Work Area (TTWA) takes in Norwich, Broadland and South Norfolk local authorities plus parts of the
local authority areas of North Norfolk, Breckland and Mid-Suffolk.
A growing population is a driver for economic growth
Population growth of 11 per cent in the ten years to 2016 – compared to 7 per cent for the LEP area, 9 per cent for the
region and 8 per cent nationally.
Much higher proportions of 16-24 year olds and 25-49 years old than in the LEP area, regionally and nationally.
A higher rate of long-term international inflow per 1,000 resident population compared to the East of England and
nationally.
A diverse business base of local, national and global companies
A regional service centre, a locus for services such as health, retail and leisure - a major employment centre, providing
almost two-thirds of the TTWA’s jobs
Retail has the largest share of the business base – top UK retail centre. Next biggest sector is professional, scientific &
technical.
Around 40 per cent of the business base are knowledge intensive firms - same as nationally but higher than the LEP area
and regionally.
Smaller than average percentage of micro firms and higher than average proportion of large firms.
Largest employment sector is business administration & support services, followed by retail and education
The business start-up rate has improved over the past five years but is lower than the rate nationally.
Higher than average percentage of companies with a turnover greater than £10m.
Higher GVA per capita than LEP area, regionally and nationally - reflects Norwich’s position as a centre of employment.
6
Vibrant labour market
Estimated 39 per cent of 16-64 year olds hold a level 4 (degree level) qualification or higher; the same as at the national
level and higher than across the LEP area and regionally.
Job density, the ratio of jobs within an area to working age residents, stands at 1.06.
Employment growth of 9 per cent since 2011 compared to 7 per cent LEP area; 2 per cent regionally and 9 per cent
nationally
Number of employees are forecast to grow by 9 per cent to 2030
Home to two universities, Norwich University of the Arts (NUA) and the University of East Anglia (UEA).
A majority (83 per cent) of Norfolk employers reported they were not affected by a skills shortage or skills gap
Disadvantaged communities
Increased level of deprivation from 2010 to 2015 on the extent measure - the most deprived local authority in the region on
this measure.
Similar levels of 16-18 year olds classed as Not in Education, Employment or Training (NEET) as the English average.
Claimant count has fallen dramatically over the period 2013-2018 - at a much stronger rate than in the LEP area,
regionally and nationally.
In 2012 higher level of long-term Jobseeker Allowance (JSA) claimants than the LEP, the East of England and Gt.Britain,
by January 2018 the lowest proportion.
Workplace earnings are higher than resident earnings - probably caused by high levels of incommuting from the rest of
Norfolk.
Ranked 4th worse in the country for deprivation in educational attainment, skills and training.
Housing
House prices well below the national average.
By 2037, the number of households is projected to grow by 21 per cent.
Norwich city centre has seen residential population growth of 54 per cent - ranked 10th highest in UK
Rental prices have increased for all property sizes since 2010/11 - demand exceeds supply
7
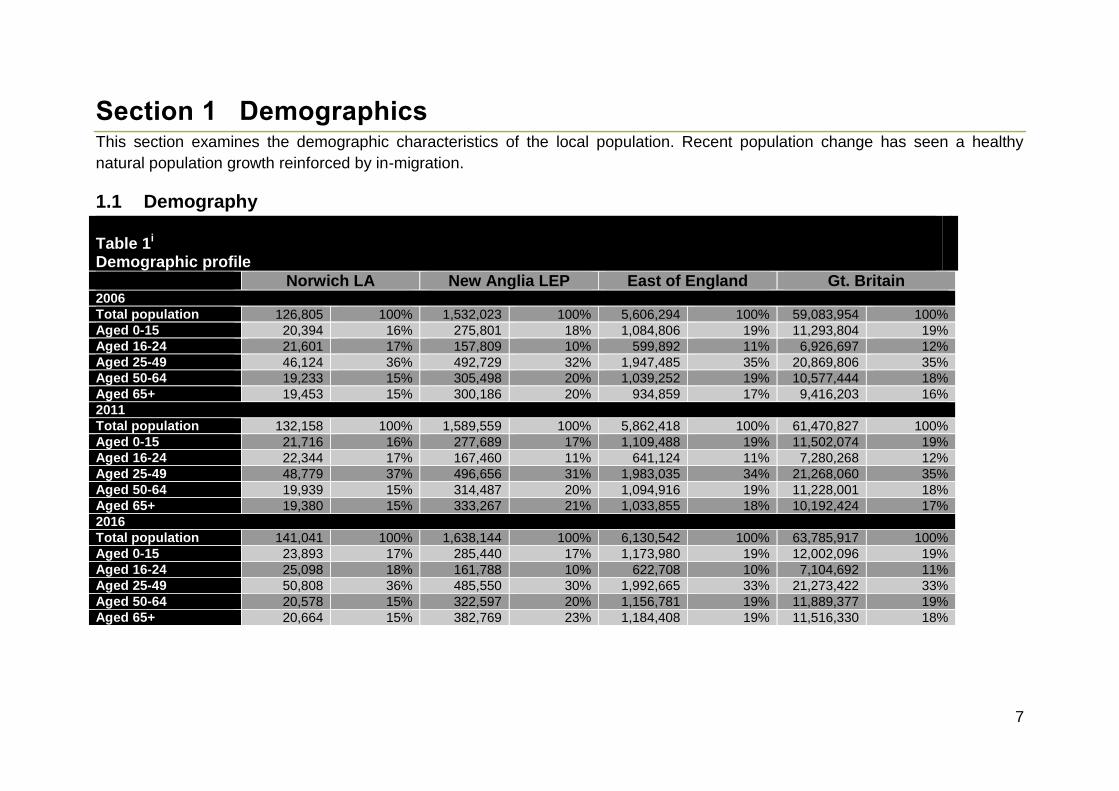
Section 1 Demographics This section examines the demographic characteristics of the local population. Recent population change has seen a healthy
natural population growth reinforced by in-migration.
1.1 Demography
Table 1i Demographic profile
Norwich LA New Anglia LEP East of England Gt. Britain 2006
Total population 126,805 100% 1,532,023 100% 5,606,294 100% 59,083,954 100%
Aged 0-15 20,394 16% 275,801 18% 1,084,806 19% 11,293,804 19%
Aged 16-24 21,601 17% 157,809 10% 599,892 11% 6,926,697 12%
Aged 25-49 46,124 36% 492,729 32% 1,947,485 35% 20,869,806 35%
Aged 50-64 19,233 15% 305,498 20% 1,039,252 19% 10,577,444 18%
Aged 65+ 19,453 15% 300,186 20% 934,859 17% 9,416,203 16%
2011
Total population 132,158 100% 1,589,559 100% 5,862,418 100% 61,470,827 100%
Aged 0-15 21,716 16% 277,689 17% 1,109,488 19% 11,502,074 19%
Aged 16-24 22,344 17% 167,460 11% 641,124 11% 7,280,268 12%
Aged 25-49 48,779 37% 496,656 31% 1,983,035 34% 21,268,060 35%
Aged 50-64 19,939 15% 314,487 20% 1,094,916 19% 11,228,001 18%
Aged 65+ 19,380 15% 333,267 21% 1,033,855 18% 10,192,424 17%
2016
Total population 141,041 100% 1,638,144 100% 6,130,542 100% 63,785,917 100%
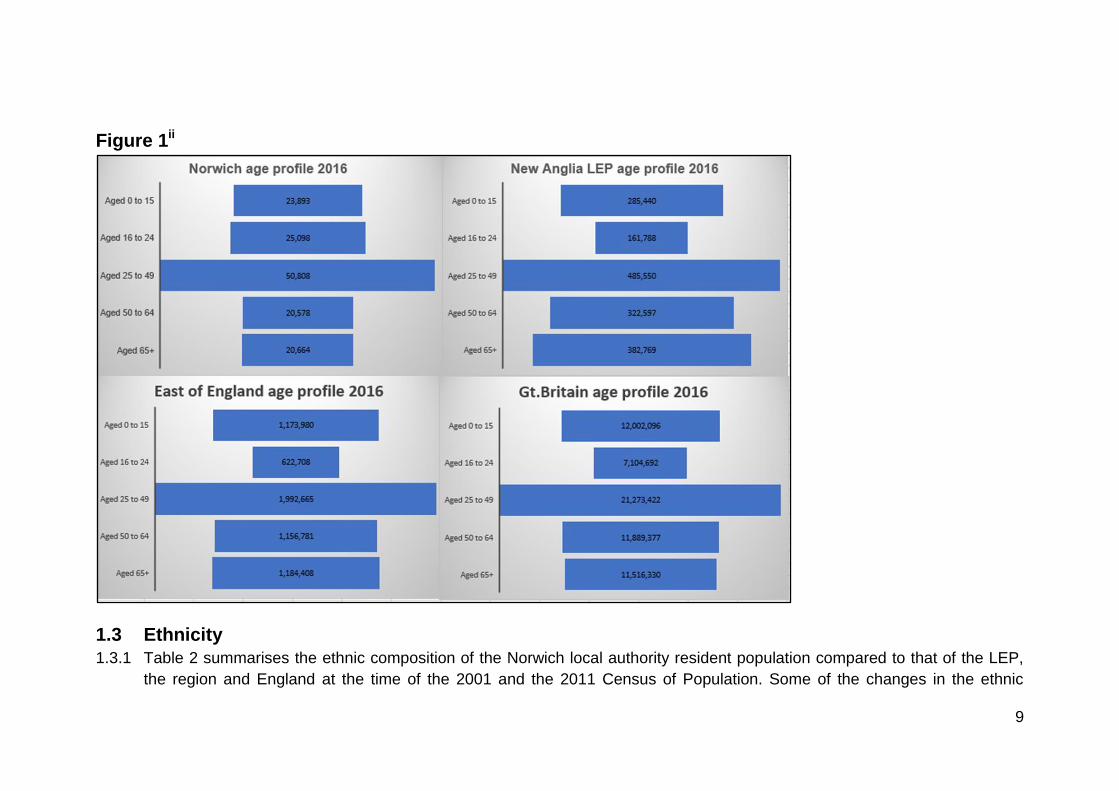
Aged 0-15 23,893 17% 285,440 17% 1,173,980 19% 12,002,096 19%
Aged 16-24 25,098 18% 161,788 10% 622,708 10% 7,104,692 11%
Aged 25-49 50,808 36% 485,550 30% 1,992,665 33% 21,273,422 33%
Aged 50-64 20,578 15% 322,597 20% 1,156,781 19% 11,889,377 19%
Aged 65+ 20,664 15% 382,769 23% 1,184,408 19% 11,516,330 18%
8
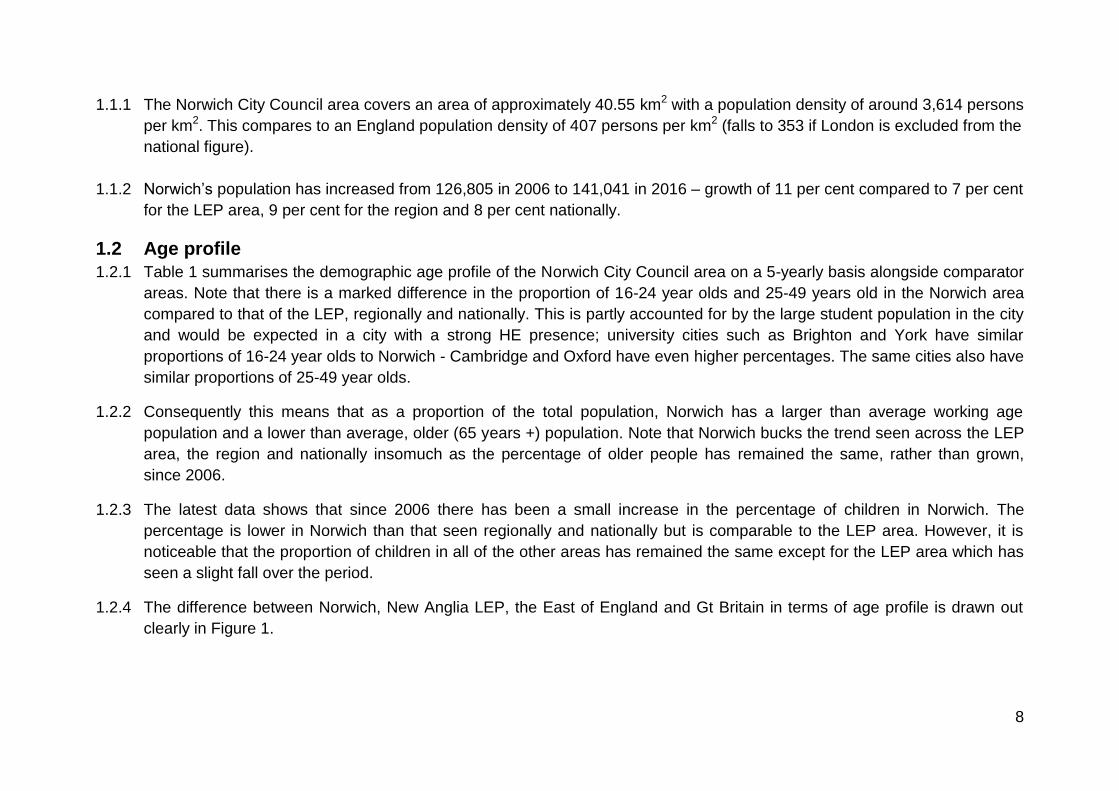
1.1.1 The Norwich City Council area covers an area of approximately 40.55 km2 with a population density of around 3,614 persons
per km2. This compares to an England population density of 407 persons per km2 (falls to 353 if London is excluded from the
national figure).
1.1.2 Norwich’s population has increased from 126,805 in 2006 to 141,041 in 2016 – growth of 11 per cent compared to 7 per cent
for the LEP area, 9 per cent for the region and 8 per cent nationally.
1.2 Age profile
1.2.1 Table 1 summarises the demographic age profile of the Norwich City Council area on a 5-yearly basis alongside comparator
areas. Note that there is a marked difference in the proportion of 16-24 year olds and 25-49 years old in the Norwich area
compared to that of the LEP, regionally and nationally. This is partly accounted for by the large student population in the city
and would be expected in a city with a strong HE presence; university cities such as Brighton and York have similar
proportions of 16-24 year olds to Norwich - Cambridge and Oxford have even higher percentages. The same cities also have
similar proportions of 25-49 year olds.
1.2.2 Consequently this means that as a proportion of the total population, Norwich has a larger than average working age
population and a lower than average, older (65 years +) population. Note that Norwich bucks the trend seen across the LEP
area, the region and nationally insomuch as the percentage of older people has remained the same, rather than grown,
since 2006.
1.2.3 The latest data shows that since 2006 there has been a small increase in the percentage of children in Norwich. The
percentage is lower in Norwich than that seen regionally and nationally but is comparable to the LEP area. However, it is
noticeable that the proportion of children in all of the other areas has remained the same except for the LEP area which has
seen a slight fall over the period.
1.2.4 The difference between Norwich, New Anglia LEP, the East of England and Gt Britain in terms of age profile is drawn out
clearly in Figure 1.
9
Figure 1ii
1.3 Ethnicity
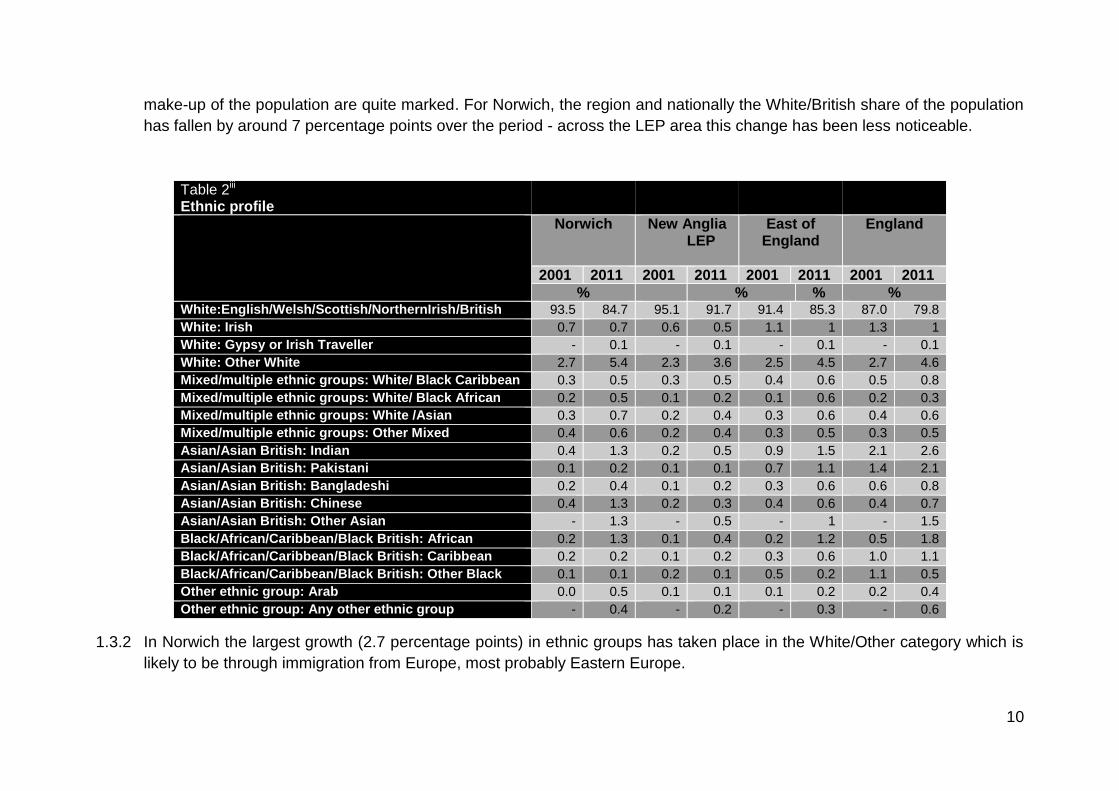
1.3.1 Table 2 summarises the ethnic composition of the Norwich local authority resident population compared to that of the LEP,
the region and England at the time of the 2001 and the 2011 Census of Population. Some of the changes in the ethnic
10
make-up of the population are quite marked. For Norwich, the region and nationally the White/British share of the population
has fallen by around 7 percentage points over the period - across the LEP area this change has been less noticeable.
1.3.2 In Norwich the largest growth (2.7 percentage points) in ethnic groups has taken place in the White/Other category which is
likely to be through immigration from Europe, most probably Eastern Europe.
Table 2iii Ethnic profile
Norwich New Anglia LEP
East of England
England
2001 2011 2001 2011 2001 2011 2001 2011
% % % % White:English/Welsh/Scottish/NorthernIrish/British 93.5 84.7 95.1 91.7 91.4 85.3 87.0 79.8
White: Irish 0.7 0.7 0.6 0.5 1.1 1 1.3 1
White: Gypsy or Irish Traveller - 0.1 - 0.1 - 0.1 - 0.1
White: Other White 2.7 5.4 2.3 3.6 2.5 4.5 2.7 4.6
Mixed/multiple ethnic groups: White/ Black Caribbean 0.3 0.5 0.3 0.5 0.4 0.6 0.5 0.8
Mixed/multiple ethnic groups: White/ Black African 0.2 0.5 0.1 0.2 0.1 0.6 0.2 0.3
Mixed/multiple ethnic groups: White /Asian 0.3 0.7 0.2 0.4 0.3 0.6 0.4 0.6
Mixed/multiple ethnic groups: Other Mixed 0.4 0.6 0.2 0.4 0.3 0.5 0.3 0.5
Asian/Asian British: Indian 0.4 1.3 0.2 0.5 0.9 1.5 2.1 2.6
Asian/Asian British: Pakistani 0.1 0.2 0.1 0.1 0.7 1.1 1.4 2.1
Asian/Asian British: Bangladeshi 0.2 0.4 0.1 0.2 0.3 0.6 0.6 0.8
Asian/Asian British: Chinese 0.4 1.3 0.2 0.3 0.4 0.6 0.4 0.7
Asian/Asian British: Other Asian - 1.3 - 0.5 - 1 - 1.5
Black/African/Caribbean/Black British: African 0.2 1.3 0.1 0.4 0.2 1.2 0.5 1.8
Black/African/Caribbean/Black British: Caribbean 0.2 0.2 0.1 0.2 0.3 0.6 1.0 1.1
Black/African/Caribbean/Black British: Other Black 0.1 0.1 0.2 0.1 0.5 0.2 1.1 0.5
Other ethnic group: Arab 0.0 0.5 0.1 0.1 0.1 0.2 0.2 0.4
Other ethnic group: Any other ethnic group - 0.4 - 0.2 - 0.3 - 0.6
11
1.3.3 Other ethnicities experiencing notable growth were Asian/Asian British: Indian; Black/African/Caribbean/Black British: African
and Asian/Asian British: Chinese which saw their share in the population more than double from 2001 to 2011, albeit from a
very small base
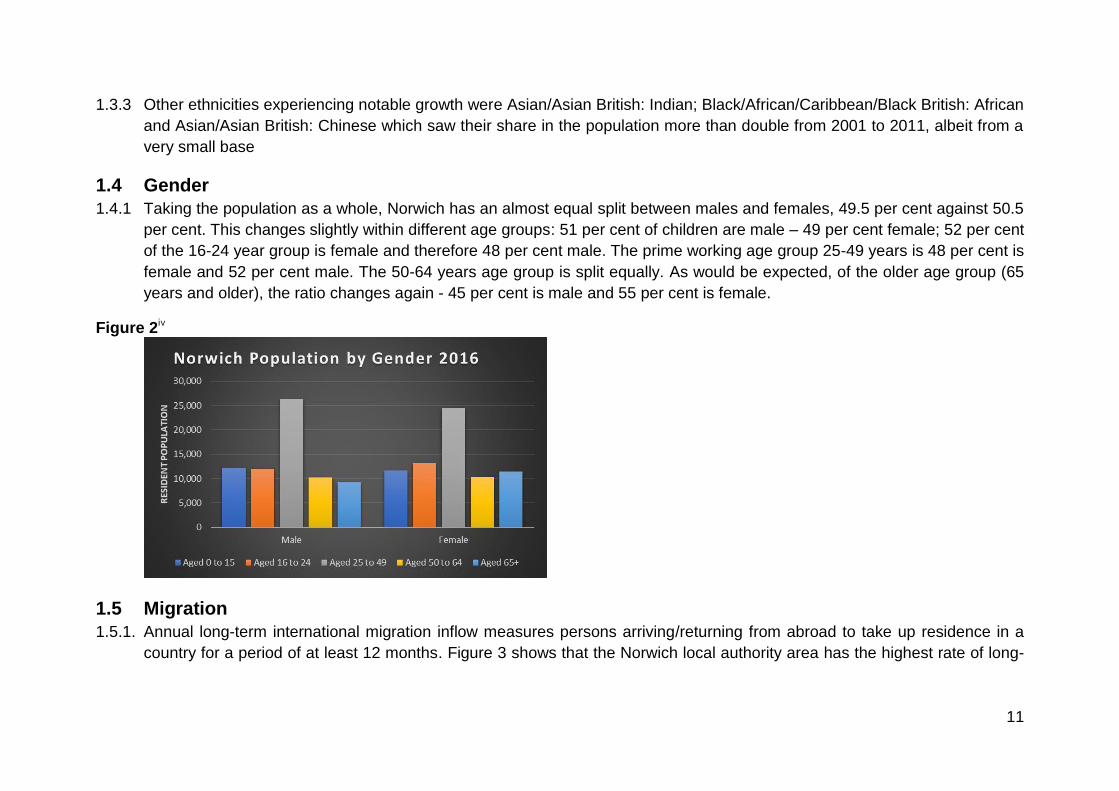
1.4 Gender
1.4.1 Taking the population as a whole, Norwich has an almost equal split between males and females, 49.5 per cent against 50.5
per cent. This changes slightly within different age groups: 51 per cent of children are male – 49 per cent female; 52 per cent
of the 16-24 year group is female and therefore 48 per cent male. The prime working age group 25-49 years is 48 per cent is
female and 52 per cent male. The 50-64 years age group is split equally. As would be expected, of the older age group (65
years and older), the ratio changes again - 45 per cent is male and 55 per cent is female.
Figure 2iv
1.5 Migration
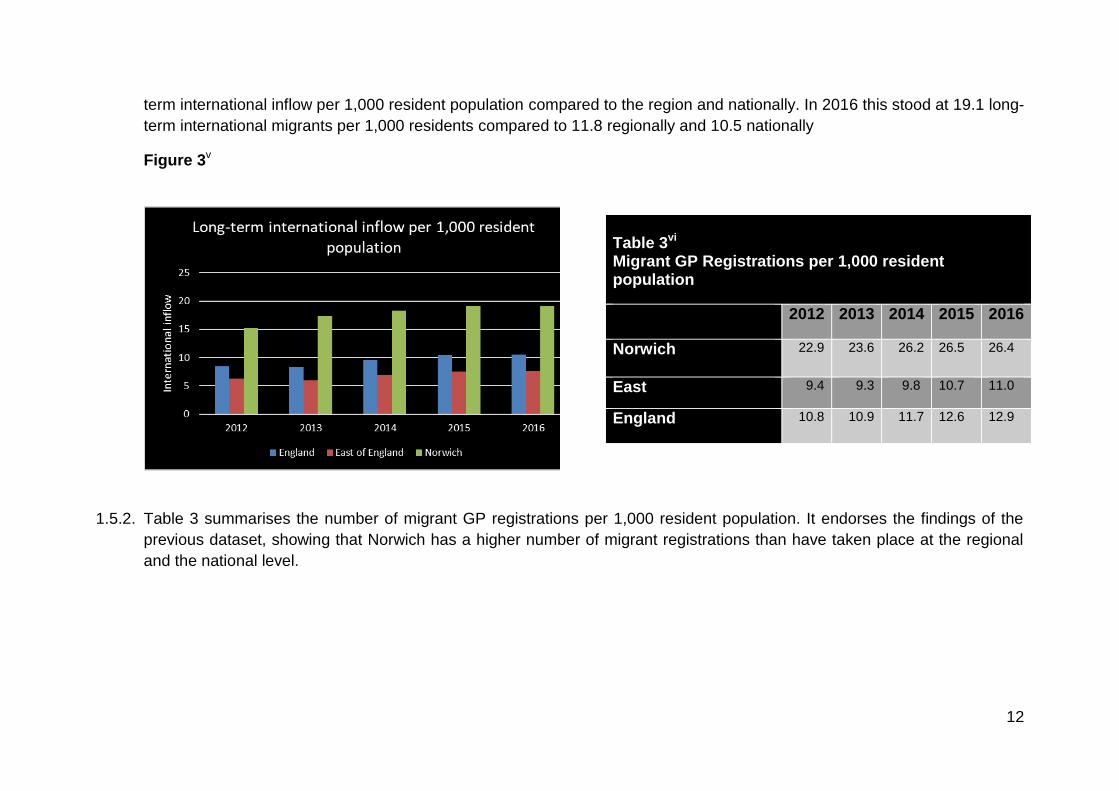
1.5.1. Annual long-term international migration inflow measures persons arriving/returning from abroad to take up residence in a
country for a period of at least 12 months. Figure 3 shows that the Norwich local authority area has the highest rate of long-
12
term international inflow per 1,000 resident population compared to the region and nationally. In 2016 this stood at 19.1 long-
term international migrants per 1,000 residents compared to 11.8 regionally and 10.5 nationally
Figure 3v
1.5.2. Table 3 summarises the number of migrant GP registrations per 1,000 resident population. It endorses the findings of the
previous dataset, showing that Norwich has a higher number of migrant registrations than have taken place at the regional
and the national level.
Table 3vi Migrant GP Registrations per 1,000 resident population
2012 2013 2014 2015 2016
Norwich 22.9
23.6
26.2 26.5 26.4
East 9.4
9.3
9.8
10.7 11.0
England 10.8
10.9
11.7 12.6 12.9
1
Section 2: Functional Economic Geography This section focuses on the pattern of economic flows which will vary depending upon which particular market is being analysed -
identifying economic areas can help define potential markets which in turn influence priorities for spatial and development
planning.
2.1 Transport
2.1.1. It has long been accepted that a link exists between transport and economic growth. An efficient transport network is seen
as a critical enabling component to long-term economic growth. Conversely a poor transport system constrains economic
activity. For businesses, connectivity to main roads and train lines in necessary in order to reach their customers, to connect
with their suppliers and to draw from a wider pool of labour. As such, it is a key factor in a business’ location decision.
2.1.2. Norwich sits north of the A47 (bypassed to the south of the city). The A47 is the main east west connection in northern East
Anglia which connects Norwich with Great Yarmouth to the east and to Kings Lynn to the west, which ultimately connects to
Peterborough. The A47 is in the planning stages of upgrades. Norwich is linked to Cambridge via the A11, which leads to
the M11 motorway for London and the M25. It is linked to Ipswich (to the south) by the A140 and to Lowestoft (to the south-
east) by the A146.
2.1.2. Norwich railway station is situated in the city centre. It forms the northern terminus of the Great Eastern Main Line with half
hourly services to London Liverpool Street with a journey time of just under two hours. It is also linked to the Midlands with
hourly services to Liverpool Lime Street, via Peterborough, Nottingham and Manchester Piccadilly. Additional hourly regional
services run to Cambridge and out of Norwich as far as Ely. Further to this, hourly local services connect to Great
Yarmouth, Lowestoft and Sheringham. Norwich is also the site of Norwich Crown Point Traction Maintenance Depot.
2.1.3. Norwich International Airport is 4 miles, a 15 minute drive, from the city centre. Around 1.5 million people live within a 90
minute drive of Norwich International Airport. Domestic services provide a link to Norwich from Aberdeen, Edinburgh,
Guernsey, Jersey and Manchester whilst over 1000 worldwide destinations are reached by connecting services at Schiphol,
Amsterdam. The next closest airport to Norwich is London Stansted which is 86 miles away
2
2.2 Economic linkages
2.2.1. To assess Norwich’s economic linkages requires a functional definition of the economic and the social ‘reach’ of the city - to
identify the boundaries of those areas in which a majority of the population see Norwich as ‘their’ place in which they may
work; shop for certain types of goods; visit for entertainment and leisure pursuits; obtain education and health services and
with which they identify. The degree of self-containment is also likely to vary depending on the kind of activity. People live,
work and spend their leisure time between different local areas and businesses often make location decisions based on a
wider city offer which does not conform to a single local authority’s boundary.
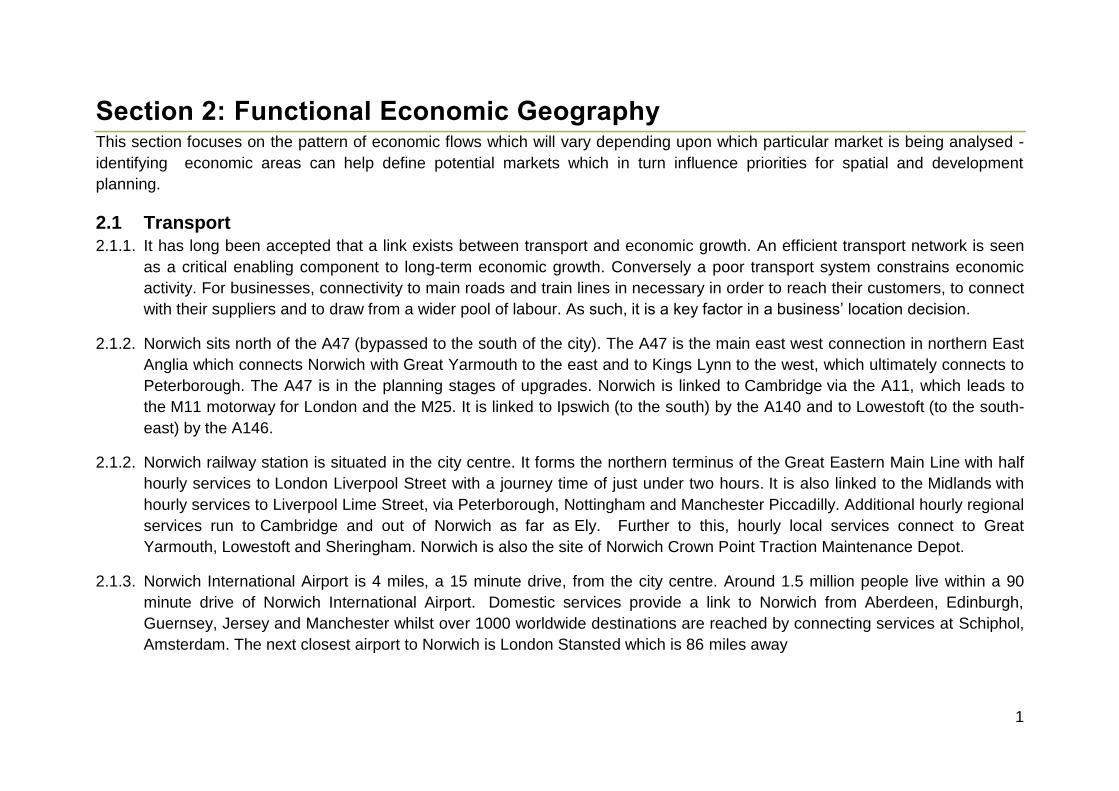
2.2.2 Figure 4 shows the Norwich Policy Area (NPA) which is a long standing spatial definition, since the mid-1970s, in the
Norfolk Structure Plan specifically designed to deal with growth relating to Norwich with the key objective of achieving a
better local balance between homes and jobs so as to reduce the need to travel and to keep Norwich-related growth as
close to the city as possible. Figure 2 also displays the built-up urban area the area which is what most people would
describe as the “City of Norwich”
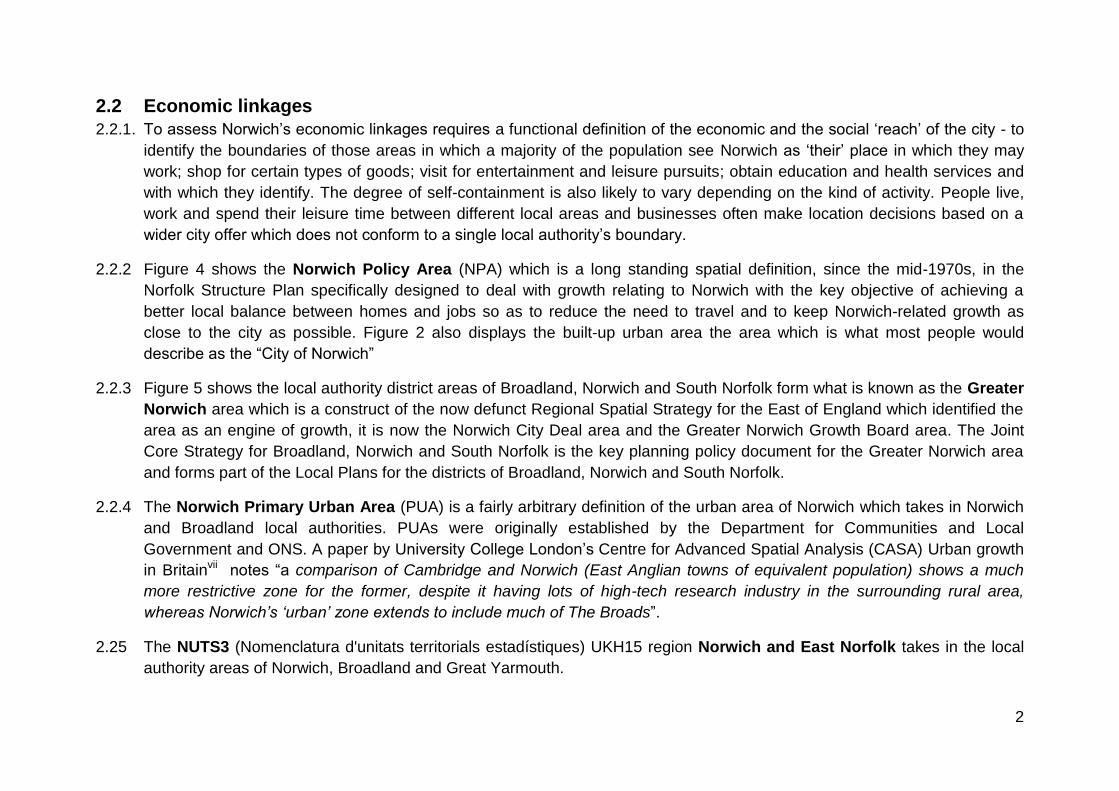
2.2.3 Figure 5 shows the local authority district areas of Broadland, Norwich and South Norfolk form what is known as the Greater
Norwich area which is a construct of the now defunct Regional Spatial Strategy for the East of England which identified the
area as an engine of growth, it is now the Norwich City Deal area and the Greater Norwich Growth Board area. The Joint
Core Strategy for Broadland, Norwich and South Norfolk is the key planning policy document for the Greater Norwich area
and forms part of the Local Plans for the districts of Broadland, Norwich and South Norfolk.
2.2.4 The Norwich Primary Urban Area (PUA) is a fairly arbitrary definition of the urban area of Norwich which takes in Norwich
and Broadland local authorities. PUAs were originally established by the Department for Communities and Local
Government and ONS. A paper by University College London’s Centre for Advanced Spatial Analysis (CASA) Urban growth
in Britainvii notes “a comparison of Cambridge and Norwich (East Anglian towns of equivalent population) shows a much
more restrictive zone for the former, despite it having lots of high-tech research industry in the surrounding rural area,
whereas Norwich’s ‘urban’ zone extends to include much of The Broads”.
2.25 The NUTS3 (Nomenclatura d'unitats territorials estadístiques) UKH15 region Norwich and East Norfolk takes in the local
authority areas of Norwich, Broadland and Great Yarmouth.
3
Figure 4 Norwich Policy Areaviii
Figure 5 Greater Norwichix
4
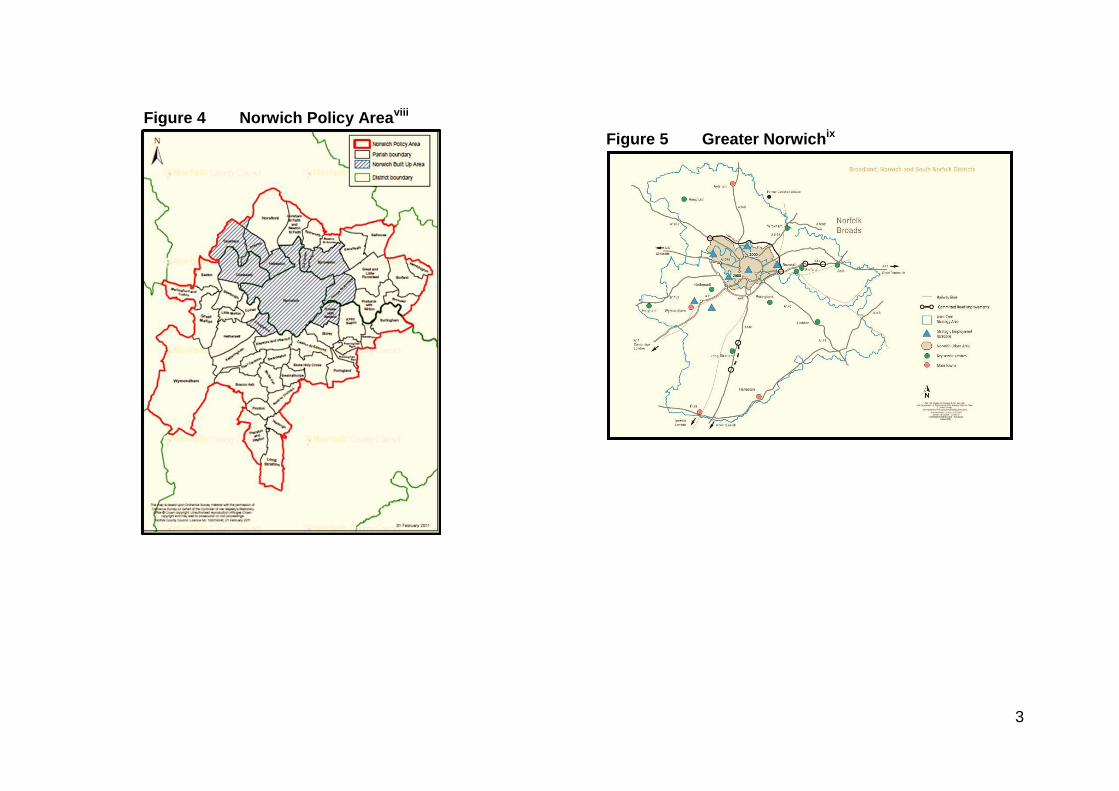
2.2.2. Figure 6 shows the approximate radius drive times from Norwich city centre.
Figure 6 Drive-time map from central Norwichx
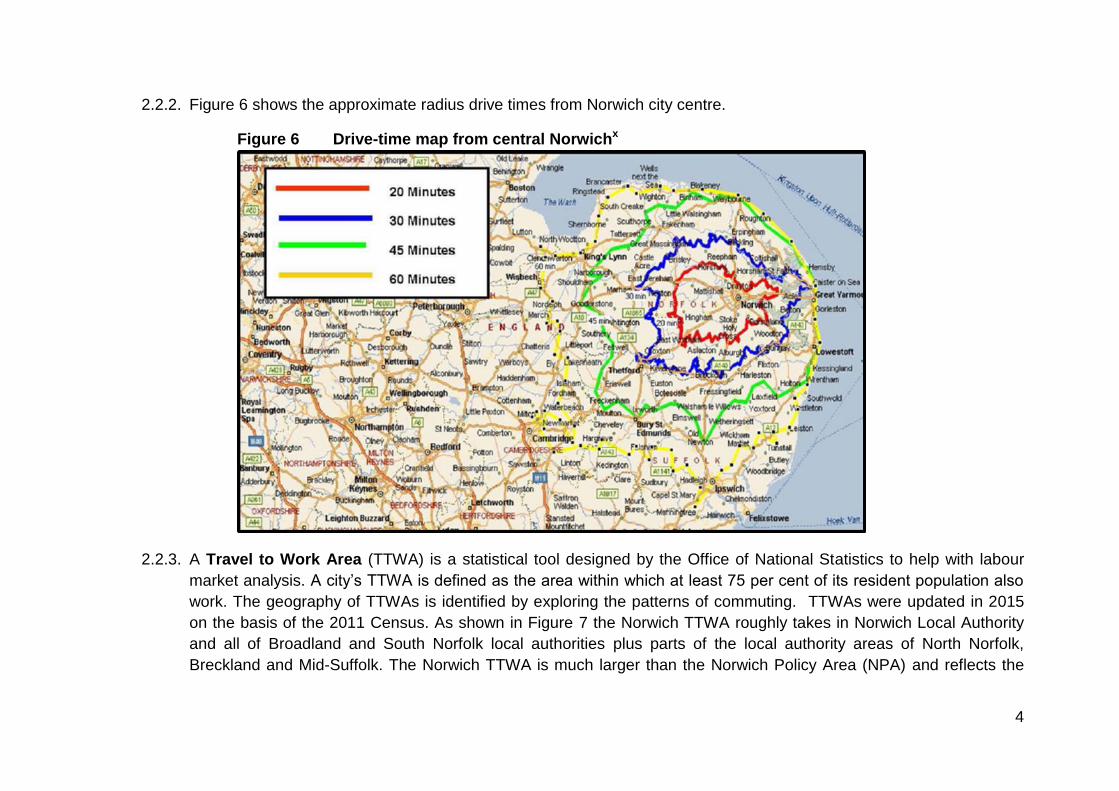
2.2.3. A Travel to Work Area (TTWA) is a statistical tool designed by the Office of National Statistics to help with labour
market analysis. A city’s TTWA is defined as the area within which at least 75 per cent of its resident population also
work. The geography of TTWAs is identified by exploring the patterns of commuting. TTWAs were updated in 2015
on the basis of the 2011 Census. As shown in Figure 7 the Norwich TTWA roughly takes in Norwich Local Authority
and all of Broadland and South Norfolk local authorities plus parts of the local authority areas of North Norfolk,
Breckland and Mid-Suffolk. The Norwich TTWA is much larger than the Norwich Policy Area (NPA) and reflects the
5
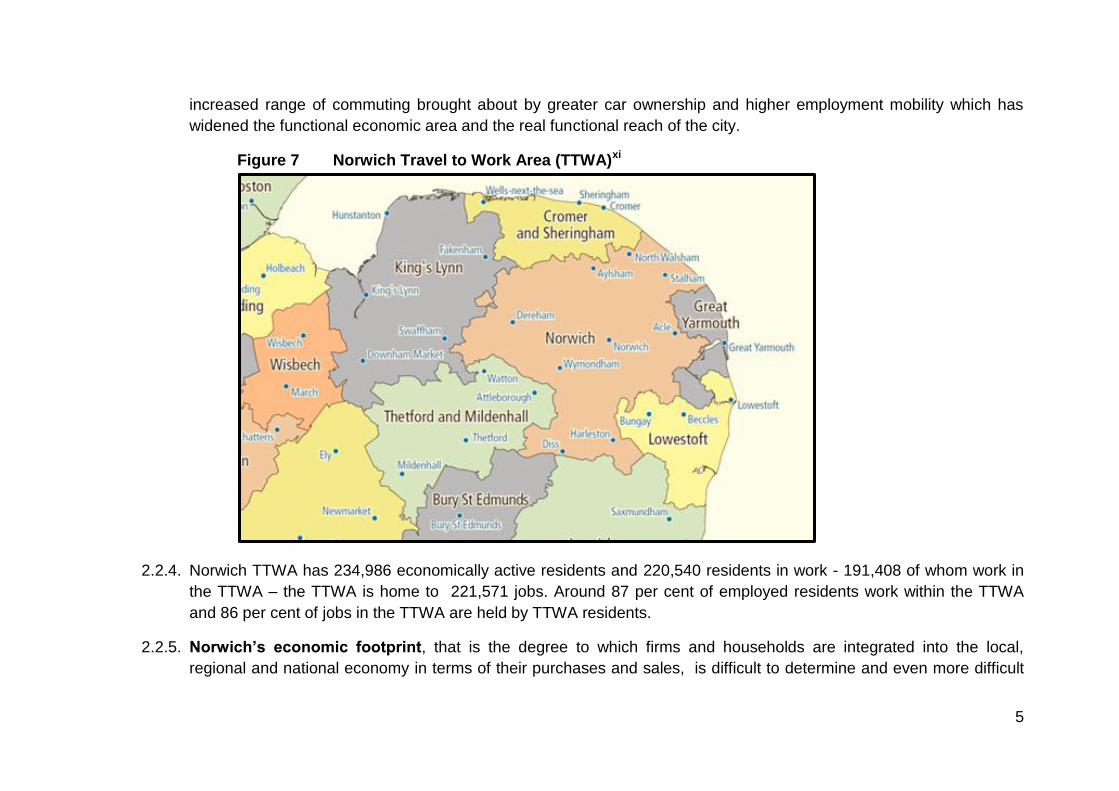
increased range of commuting brought about by greater car ownership and higher employment mobility which has
widened the functional economic area and the real functional reach of the city.
Figure 7 Norwich Travel to Work Area (TTWA)xi
2.2.4. Norwich TTWA has 234,986 economically active residents and 220,540 residents in work - 191,408 of whom work in
the TTWA – the TTWA is home to 221,571 jobs. Around 87 per cent of employed residents work within the TTWA
and 86 per cent of jobs in the TTWA are held by TTWA residents.
2.2.5. Norwich’s economic footprint, that is the degree to which firms and households are integrated into the local,
regional and national economy in terms of their purchases and sales, is difficult to determine and even more difficult
6
to quantify. Without doubt the urban area of Norwich acts as a regional service centre, a locus for services such as
health, retail and leisure. It is a major employment centre, providing almost two-thirds of the TTWA’s jobs. Much of
the Norwich TTWA is rural with very low population densities; so although parts of the North Norfolk and Mid Suffolk
local authority areas fall within the Norwich TTWA the actual numbers of people involved are very small.
Figure 8 Central Norfolk and Norwich Broad Rental Market Area (BRMA)xii
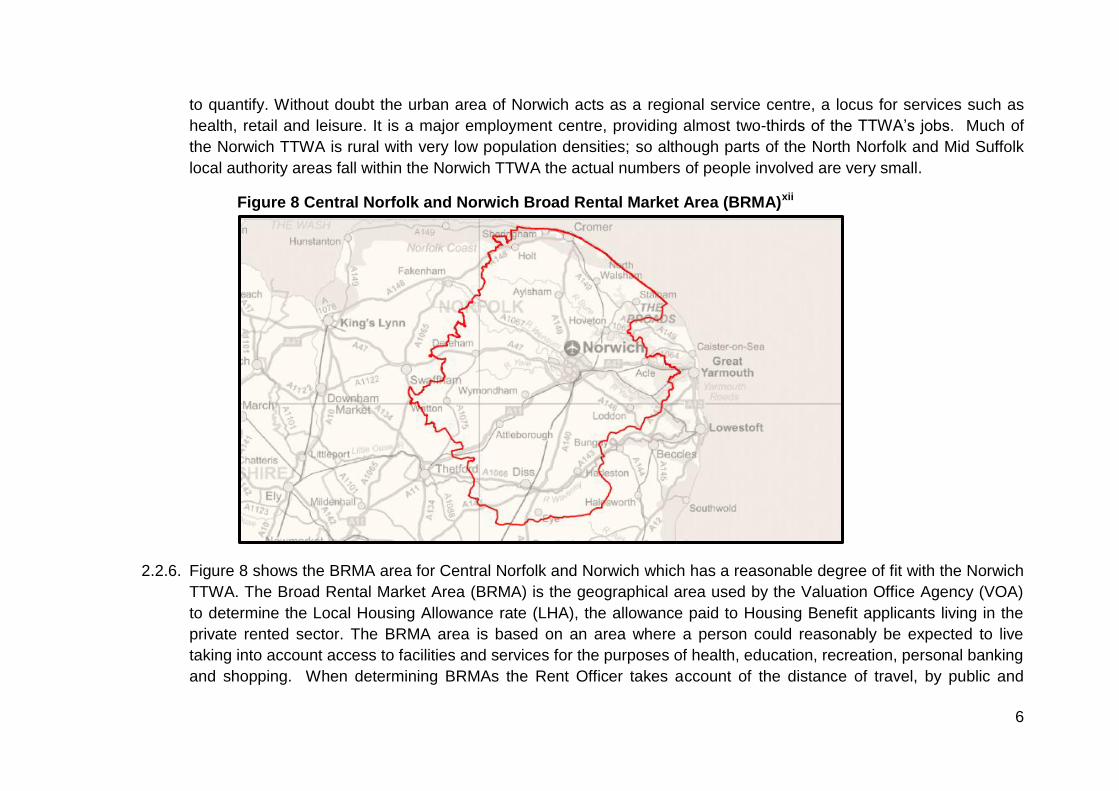
2.2.6. Figure 8 shows the BRMA area for Central Norfolk and Norwich which has a reasonable degree of fit with the Norwich
TTWA. The Broad Rental Market Area (BRMA) is the geographical area used by the Valuation Office Agency (VOA)
to determine the Local Housing Allowance rate (LHA), the allowance paid to Housing Benefit applicants living in the
private rented sector. The BRMA area is based on an area where a person could reasonably be expected to live
taking into account access to facilities and services for the purposes of health, education, recreation, personal banking
and shopping. When determining BRMAs the Rent Officer takes account of the distance of travel, by public and

7
private transport, to and from these facilities and services. In addition, the latest Strategic Housing Market
Assessment undertaken for the Norwich area suggests a further mapping of the housing market area which can be
found in Section 8, Figure 24.
2.2.7. Economic linkages, examined in terms of market links and supply links of firms are essentially spatially very diverse,
varying by sector, size of firm and the location of markets. For example, tthe city of Norwich has a strong business
and professional services sector which is likely to have strong economic linkages across the TTWA because these
firms undertake much of their business activity on a face-to-face basis and it is unlikely that other urban centres within
the TTWA are large enough to have the critical mass of business and professional service firms that is concentrated in
Norwich. Conversely it may be suggested that manufacturing firms are likely to have far fewer local economic
linkages through their supply chains and will tend to source their inputs nationally or internationally, whilst also
operating in national and international markets.
2.2.8. Overall, larger firms tend to have increasingly strong international rather than local and regional links. The degree of
local/regional networks between businesses is equally dependant on the industry concerned. Norwich is the location
of some national head quarters and many other businesses which operate on a global and a national scale through
their customer and supply chains, although unfortunately these cannot be quantified.
2.2.9. Exporting data is not readily available at local authority level; regional data, which shows the main trading partners, is
available in Section 4: Productivity, 4.2.
8
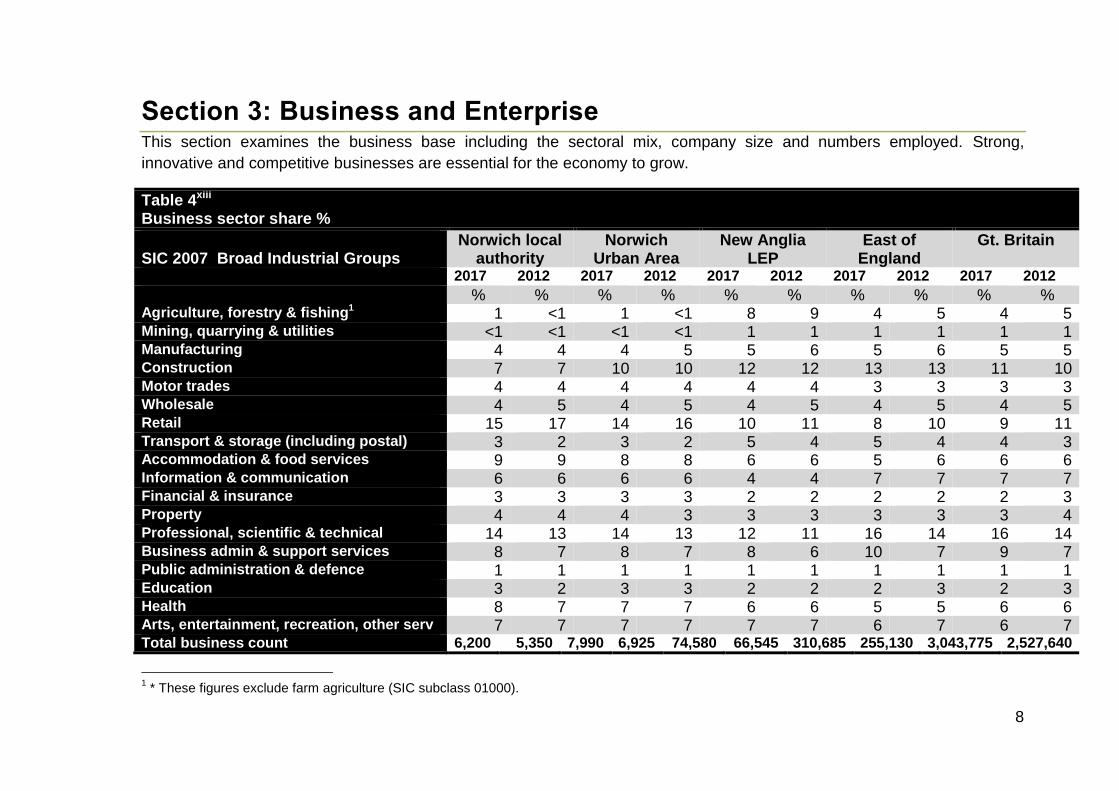
Section 3: Business and Enterprise This section examines the business base including the sectoral mix, company size and numbers employed. Strong,
innovative and competitive businesses are essential for the economy to grow.
Table 4xiii Business sector share %
SIC 2007 Broad Industrial Groups
Norwich local authority
Norwich Urban Area
New Anglia LEP
East of England
Gt. Britain
2017 2012 2017 2012 2017 2012 2017 2012 2017 2012
% % % % % % % % % % Agriculture, forestry & fishing1 1 <1 1 <1 8 9 4 5 4 5 Mining, quarrying & utilities <1 <1 <1 <1 1 1 1 1 1 1 Manufacturing 4 4 4 5 5 6 5 6 5 5 Construction 7 7 10 10 12 12 13 13 11 10 Motor trades 4 4 4 4 4 4 3 3 3 3 Wholesale 4 5 4 5 4 5 4 5 4 5 Retail 15 17 14 16 10 11 8 10 9 11 Transport & storage (including postal) 3 2 3 2 5 4 5 4 4 3 Accommodation & food services 9 9 8 8 6 6 5 6 6 6 Information & communication 6 6 6 6 4 4 7 7 7 7 Financial & insurance 3 3 3 3 2 2 2 2 2 3 Property 4 4 4 3 3 3 3 3 3 4 Professional, scientific & technical 14 13 14 13 12 11 16 14 16 14 Business admin & support services 8 7 8 7 8 6 10 7 9 7 Public administration & defence 1 1 1 1 1 1 1 1 1 1 Education 3 2 3 3 2 2 2 3 2 3 Health 8 7 7 7 6 6 5 5 6 6 Arts, entertainment, recreation, other serv 7 7 7 7 7 7 6 7 6 7 Total business count 6,200 5,350 7,990 6,925 74,580 66,545 310,685 255,130 3,043,775 2,527,640
1 * These figures exclude farm agriculture (SIC subclass 01000).
9
3.1 Count of businesses
3.1.1. Table 4 on the previous page gives the number of businesses2 based in the Norwich local authority area and the
change in the number from 2012 to 2017; the number has grown by 850 businesses during the 5-year period, growth
of 16 per cent compared to 15 per cent in the Norwich urban area, 12 per cent across the LEP area, 22 per cent
regionally and 20 per cent nationally.
3.1.2. The industrial profile of the business base given in the Tables is based on the standard 2007 SIC (Standard Industrial
classification) Broad Industrial Grouping. Although SIC codes have been periodically updated, they fail to provide
classifications for services and new industries in the 21st century. Moreover, SIC codes are product based, as
opposed to process-based - their focus is limited to the products and services delivered by a firm. As a result, SIC
codes do not consider markets and methods of marketing products and services. Nonetheless, they are a mainstay
methodology for segmenting firms by industry and provide a useful tool to compare the industrial profile of Norwich
over time and against other areas.
3.1.3. The largest share of Norwich’s business base is taken by retail businesses - although this share has fallen slightly
since 2012 the actual number of retail businesses grew by 20 businesses - it is at least 5 percentage points higher
than the proportion seen across the LEP, the region and nationally and reflects the significance of Norwich’s position
as a top 20 UK retail centre. Norwich city centre is the focus for the city’s retail sector and it houses several hundred
independent shops, national chains, two indoor shopping centres and a large 6-day open air market.
3.1.4. The professional, scientific & technical sector has the next largest share of the business base in Norwich, over the
period 2012 to 2017 the sector has grown by 190 businesses - growth of 28 per cent. Enterprises providing
professional, scientific and technical services are often small and include legal and accounting activities; combined
with the activity of head offices and of management consultancy activities and architectural, engineering, technical
testing and analysis activities. The sector in Norwich accounts for a similar proportion as in the urban area of Norwich
and a bigger share of the business base than across the LEP area as a whole. However, it commands a smaller share
2 Businesses = local units, an individual site (for example a factory or shop) associated with an enterprise. It can also be referred to as a workplace.
10
than that seen regionally and nationally. The professional, scientific & technical sector has seen growth in its share of
the business base across each of the areas reported in the Table.
3.1.5. Accommodation and food services is the third largest sector in Norwich in terms of number of businesses. Over the
5-year period it has increased by 75 businesses; growth of 16 per cent. The sector is slightly larger in Norwich than
across the other areas reported and has seen stronger growth than the other areas where the sector share was static.
3.1.6. The financial & insurance sector accounts for around one-third more of the share of businesses than across the
other reported areas. Other sectors are roughly in line with the regional and national averages or in line with what
would be expected in an urban area i.e. the share of agricultural businesses is very low in Norwich whilst Health has a
higher than average share, as would be expected. The transport and storage share of businesses in both Norwich
areas is lower than across the other areas - not unexpected given the city’s location.
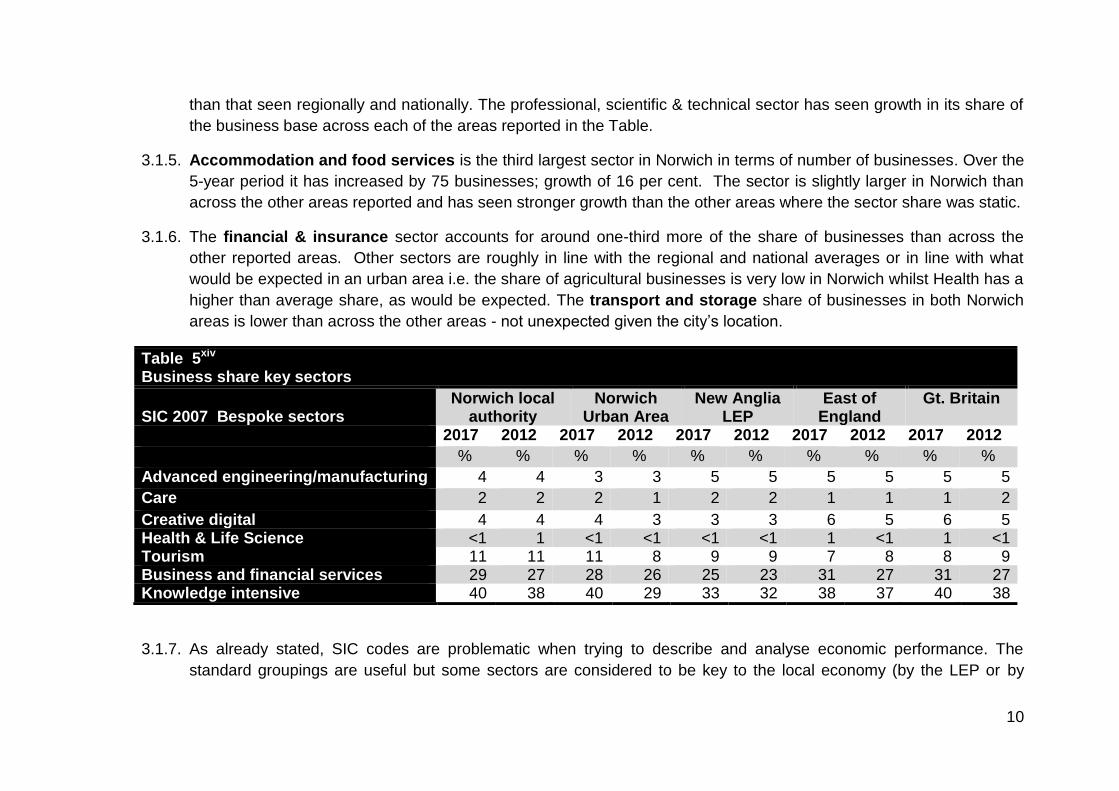
Table 5xiv Business share key sectors
SIC 2007 Bespoke sectors
Norwich local authority
Norwich Urban Area
New Anglia LEP
East of England
Gt. Britain
2017 2012 2017 2012 2017 2012 2017 2012 2017 2012
% % % % % % % % % %
Advanced engineering/manufacturing 4 4 3 3 5 5 5 5 5 5
Care 2 2 2 1 2 2 1 1 1 2
Creative digital 4 4 4 3 3 3 6 5 6 5 Health & Life Science <1 1 <1 <1 <1 <1 1 <1 1 <1 Tourism 11 11 11 8 9 9 7 8 8 9 Business and financial services 29 27 28 26 25 23 31 27 31 27 Knowledge intensive 40 38 40 29 33 32 38 37 40 38
3.1.7. As already stated, SIC codes are problematic when trying to describe and analyse economic performance. The
standard groupings are useful but some sectors are considered to be key to the local economy (by the LEP or by
11
Norwich City Council) and are not sufficiently defined by standard SIC groupings, therefore bespoke sets of SIC codes
at 3 and 4 digit level have been designed to segment these “key sectors” more adequately. The business base share
of key sectors are given in Table 5
3.1.8. In terms of the number of businesses, business and financial services has the largest share of the business base of
any key sector across all of the areas reported in the Table. Norwich’s business and financial services sector has a
higher share of the business base than is the case for the Norwich urban area and the LEP area as a whole; it has a
slightly lower share than is seen regionally and nationally. The sector has seen growth in the share of the business
base across each of the areas, but Norwich has seen slightly weaker growth over the period at 25 per cent (+360
businesses) compared to 34 per cent nationally.
3.1.9. The tourism sector is the next largest key sector in Norwich and it accounts for a significantly bigger share of the
business base than in the other reported areas; the share has remained roughly the same over the period (+95
businesses) but has seen a marginal fall in the other areas except for Norwich urban area where the share has
increased.
3.110. Creative digital is a growing key sector and has some overlap with the business and financial services sector. Its
share of the business base has remained the same (+50 businesses) compared to growth in the urban area,
regionally and nationally. The sector in the local authority area has the same share of the business base than as the
Norwich urban area; a larger share than in the LEP area but a smaller share than regionally and nationally.
3.1.11. The advanced engineering and manufacturing sector’s share of the business base in Norwich is fairly small
compared to the other reported areas. However, this masks its importance as a growing industry particularly the
aviation related sub-sector centred on Norwich airport. The share of the business base in each reported area
remained unchanged over the period 2012 to 2017. However, the sector saw a small increase of 65 businesses in
Norwich over the period.
3.1.12. Given the aging population, particularly in Norfolk and the areas surrounding Norwich, the care sector is becoming
increasingly important. The sector’s share of the business base in Norwich is similar to the proportion across each of
12
the other reported areas; the share has remained fairly static over the period except in the Norwich urban area which
saw an increase and nationally where the share of the business base fell over the period.
3.1.13. Health & life science is another sector that is small in its share of the business base but important to the local area
because of the high value jobs it supports. The share is similar across each of the reported areas and has remained
fairly static over the period.
3.1.14. A knowledge-intensive industry is one where the workers need a high level of education, skills and experience in
order to work effectively, the definition used in this document was devised by EUROSTAT. Knowledge-intensive firms
account for a higher share of the business base in the Norwich local authority area, the Norwich urban area and
nationally than is the case in the LEP area and regionally. The share of the business base has increased over the
period 2012 to 2017 across each of the reported areas; the strongest growth occurred in the Norwich urban area.
3.2 Company size
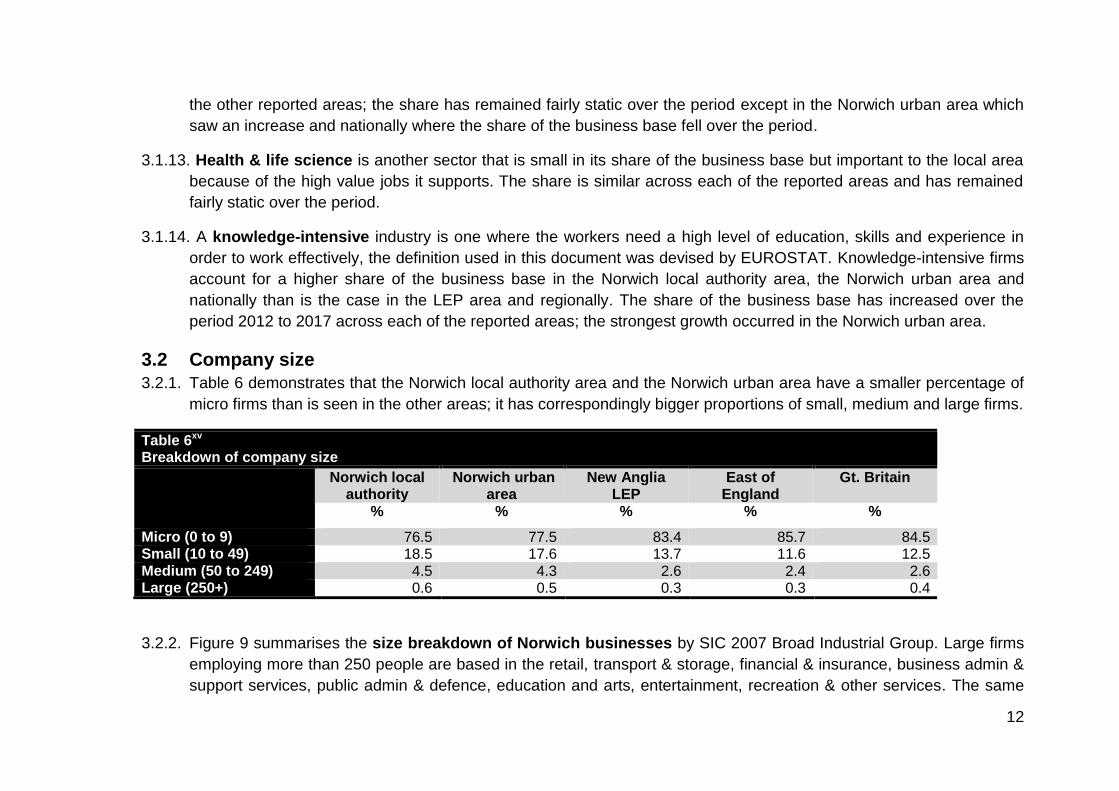
3.2.1. Table 6 demonstrates that the Norwich local authority area and the Norwich urban area have a smaller percentage of
micro firms than is seen in the other areas; it has correspondingly bigger proportions of small, medium and large firms.
Table 6xv Breakdown of company size
Norwich local authority
Norwich urban area
New Anglia LEP
East of England
Gt. Britain
% % % % %
Micro (0 to 9) 76.5 77.5 83.4 85.7 84.5 Small (10 to 49) 18.5 17.6 13.7 11.6 12.5 Medium (50 to 249) 4.5 4.3 2.6 2.4 2.6 Large (250+) 0.6 0.5 0.3 0.3 0.4
3.2.2. Figure 9 summarises the size breakdown of Norwich businesses by SIC 2007 Broad Industrial Group. Large firms
employing more than 250 people are based in the retail, transport & storage, financial & insurance, business admin &
support services, public admin & defence, education and arts, entertainment, recreation & other services. The same
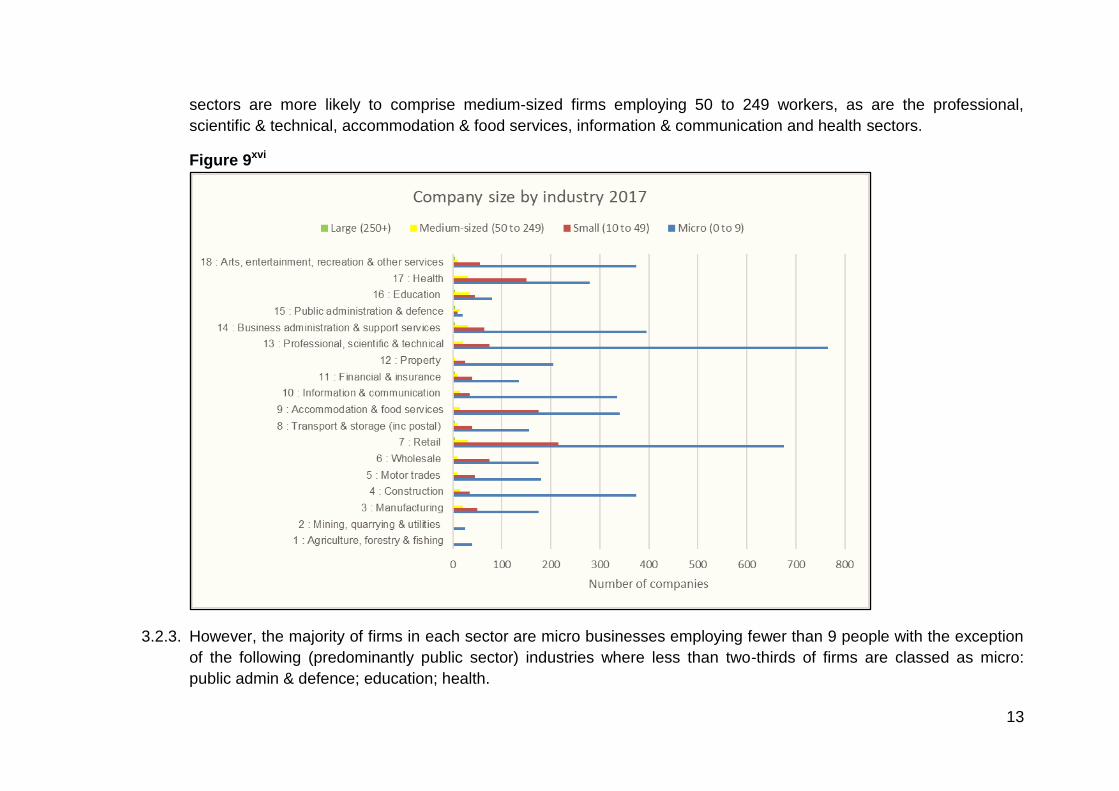
13
sectors are more likely to comprise medium-sized firms employing 50 to 249 workers, as are the professional,
scientific & technical, accommodation & food services, information & communication and health sectors.
Figure 9xvi
3.2.3. However, the majority of firms in each sector are micro businesses employing fewer than 9 people with the exception
of the following (predominantly public sector) industries where less than two-thirds of firms are classed as micro:
public admin & defence; education; health.
14
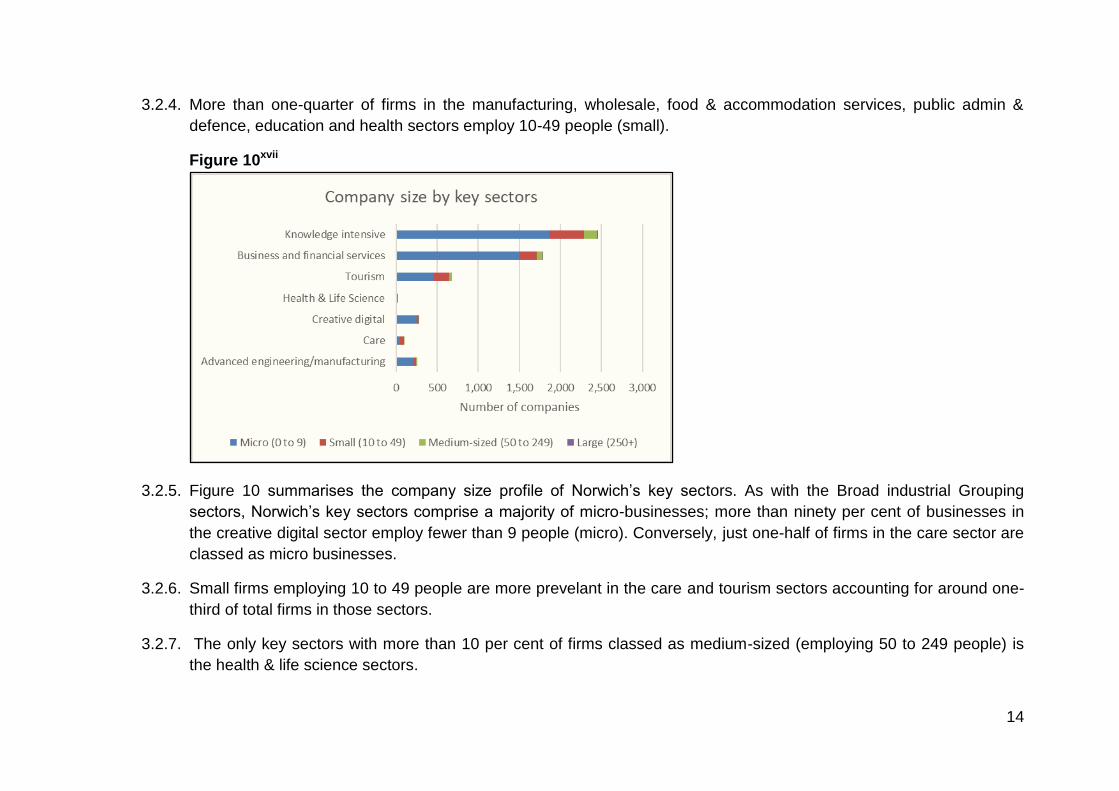
3.2.4. More than one-quarter of firms in the manufacturing, wholesale, food & accommodation services, public admin &
defence, education and health sectors employ 10-49 people (small).
Figure 10xvii
3.2.5. Figure 10 summarises the company size profile of Norwich’s key sectors. As with the Broad industrial Grouping
sectors, Norwich’s key sectors comprise a majority of micro-businesses; more than ninety per cent of businesses in
the creative digital sector employ fewer than 9 people (micro). Conversely, just one-half of firms in the care sector are
classed as micro businesses.
3.2.6. Small firms employing 10 to 49 people are more prevelant in the care and tourism sectors accounting for around one-
third of total firms in those sectors.
3.2.7. The only key sectors with more than 10 per cent of firms classed as medium-sized (employing 50 to 249 people) is
the health & life science sectors.
15
3.2.8. Of the local key sectors, only business and financial services firms employ more than 250 people.
3.3 Employment by sector
It should be noted that employment share data is extracted from the Business Register and Employment Survey : open
access which does not include employment in companies registered for PAYE only. It is likely then to undercount companies
with a turnover which falls below the VAT threshold.
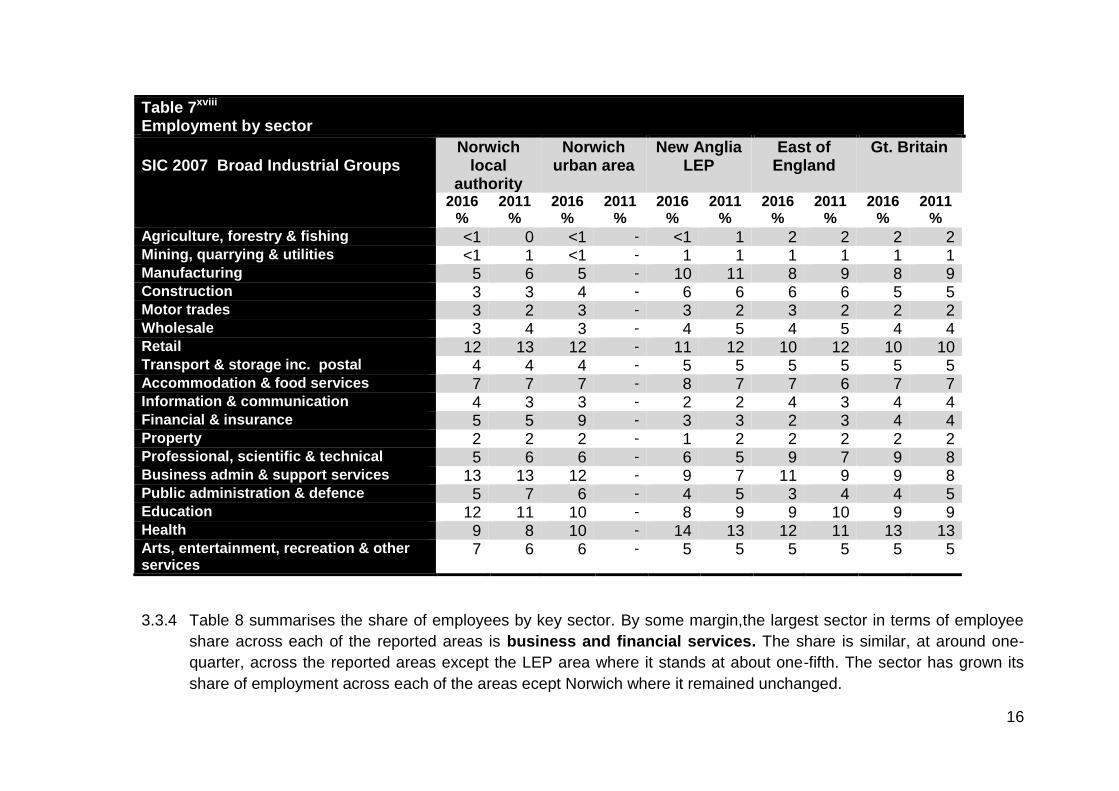
3.3.1. The employee shares given in Table 7 are based on the standard 2007 SIC Broad Industrial Grouping. The largest
sector in Norwich in employment terms is Business administration & support services with 13 per cent of the
workforce. The sector is significant in the other areas but the share of employment is at least 2 percentage points
lower than in the Norwich local authority area. Business administration & support services share of employment
remained unchanged over the period in the local authority area; business administration & support services saw a
small increase across the other areas.
3.3.2 Retail and Education are the next largest employment sectors in Norwich, accounting for 12 per cent of the
workforce. Again, these sectors are also significant in the other reported areas with retail accounting for the third
largest share of employees after the health sector. The share has fallen by one percentage point across each of the
areas over the period 2011 to 2016; except for Gt. Britain as a whole where it remained unchanged. Employment in
the education sector accounts for a much larger share of the total in Norwich than in the other areas and the share
has increased slightly over the five-year period. Education sector employment share saw a marginal fall across the
LEP area and regionally but remained unchanged at the national level.
3.3.3. The health sector has a 9 per cent share of employment in Norwich; a much smaller share than seen across the other
areas. This is mostly the result of the siting of the Norfolk and Norwich University Hospital in the neighbouring district
of South Norfolk. The employment share of the health sector increases to 10 per cent in the urban area. Health’s
share of employment stands at 14 per cent in the LEP area, 12 per cent regionally and 13 per cent nationally.
16
Table 7xviii Employment by sector
SIC 2007 Broad Industrial Groups
Norwich local
authority
Norwich urban area
New Anglia LEP
East of England
Gt. Britain
2016 %
2011 %
2016 %
2011 %
2016 %
2011 %
2016 %
2011 %
2016 %
2011 %
Agriculture, forestry & fishing <1 0 <1 - <1 1 2 2 2 2 Mining, quarrying & utilities <1 1 <1 - 1 1 1 1 1 1 Manufacturing 5 6 5 - 10 11 8 9 8 9 Construction 3 3 4 - 6 6 6 6 5 5 Motor trades 3 2 3 - 3 2 3 2 2 2 Wholesale 3 4 3 - 4 5 4 5 4 4 Retail 12 13 12 - 11 12 10 12 10 10 Transport & storage inc. postal 4 4 4 - 5 5 5 5 5 5 Accommodation & food services 7 7 7 - 8 7 7 6 7 7 Information & communication 4 3 3 - 2 2 4 3 4 4 Financial & insurance 5 5 9 - 3 3 2 3 4 4 Property 2 2 2 - 1 2 2 2 2 2 Professional, scientific & technical 5 6 6 - 6 5 9 7 9 8 Business admin & support services 13 13 12 - 9 7 11 9 9 8 Public administration & defence 5 7 6 - 4 5 3 4 4 5 Education 12 11 10 - 8 9 9 10 9 9 Health 9 8 10 - 14 13 12 11 13 13 Arts, entertainment, recreation & other services
7 6 6 - 5 5 5 5 5 5
3.3.4 Table 8 summarises the share of employees by key sector. By some margin,the largest sector in terms of employee
share across each of the reported areas is business and financial services. The share is similar, at around one-
quarter, across the reported areas except the LEP area where it stands at about one-fifth. The sector has grown its
share of employment across each of the areas ecept Norwich where it remained unchanged.
17
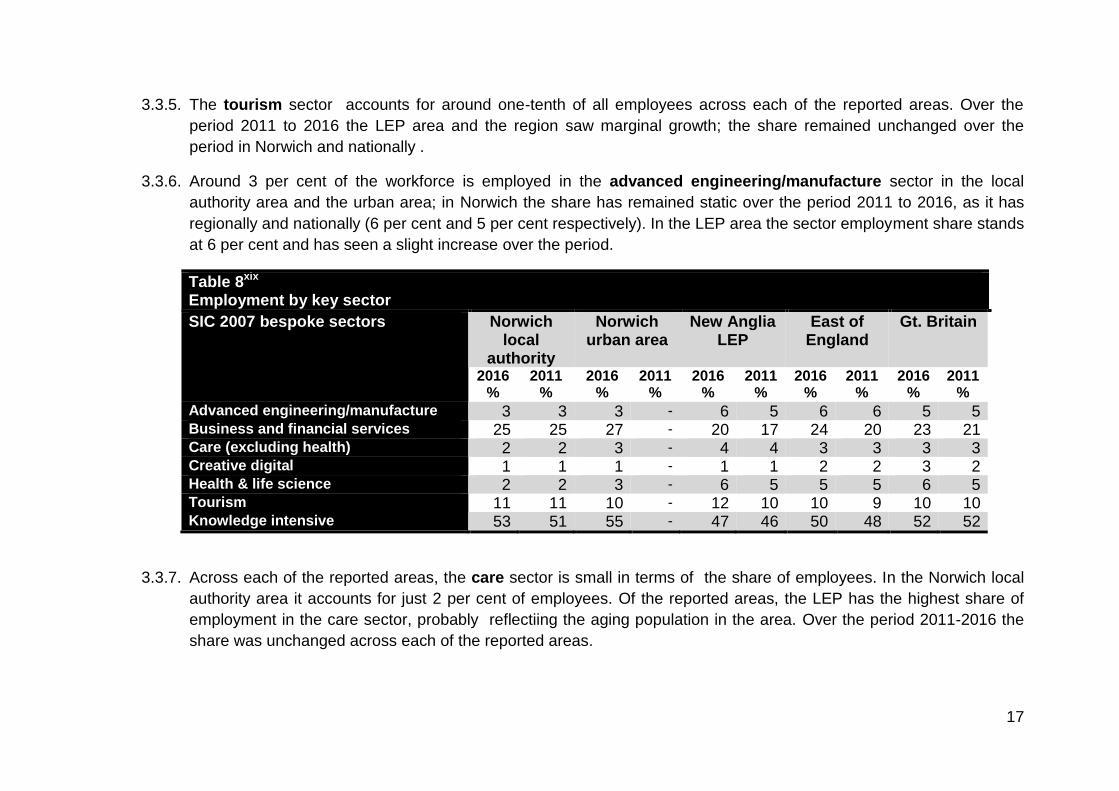
3.3.5. The tourism sector accounts for around one-tenth of all employees across each of the reported areas. Over the
period 2011 to 2016 the LEP area and the region saw marginal growth; the share remained unchanged over the
period in Norwich and nationally .
3.3.6. Around 3 per cent of the workforce is employed in the advanced engineering/manufacture sector in the local
authority area and the urban area; in Norwich the share has remained static over the period 2011 to 2016, as it has
regionally and nationally (6 per cent and 5 per cent respectively). In the LEP area the sector employment share stands
at 6 per cent and has seen a slight increase over the period.
Table 8xix Employment by key sector
SIC 2007 bespoke sectors Norwich local
authority
Norwich urban area
New Anglia LEP
East of England
Gt. Britain
2016 %
2011 %
2016 %
2011 %
2016 %
2011 %
2016 %
2011 %
2016 %
2011 %
Advanced engineering/manufacture 3 3 3 - 6 5 6 6 5 5 Business and financial services 25 25 27 - 20 17 24 20 23 21 Care (excluding health) 2 2 3 - 4 4 3 3 3 3 Creative digital 1 1 1 - 1 1 2 2 3 2 Health & life science 2 2 3 - 6 5 5 5 6 5 Tourism 11 11 10 - 12 10 10 9 10 10 Knowledge intensive 53 51 55 - 47 46 50 48 52 52
3.3.7. Across each of the reported areas, the care sector is small in terms of the share of employees. In the Norwich local
authority area it accounts for just 2 per cent of employees. Of the reported areas, the LEP has the highest share of
employment in the care sector, probably reflectiing the aging population in the area. Over the period 2011-2016 the
share was unchanged across each of the reported areas.
18
3.3.8. The health & life science sector comprises just 2 per cent of employees in the local authority area and 3 per cent in
the urban area. At the national level and across the LEP area the sector has seen a marginal increase in its share of
employment over the period 2011 to 2016. Regionally the employment share stands at 5 per cent and remained static
over the period.
3.3.9. Creative digital is another small sector in terms of its employment share and its share of employment remained the
same in each of the reported areas from 2011 to 2016 except for nationally where a small increase took place.
3.3.10 Norwich local authority area and the urban area have the highest share of employees working in knowledge-
intensive businesses than the other reported areas. The share has increased over the period 2011 to 2016 in the
Norwich areas, across the LEP area and regioanlly but remained unchanged nationally.
3.4 Business start-ups, closures and survival rates
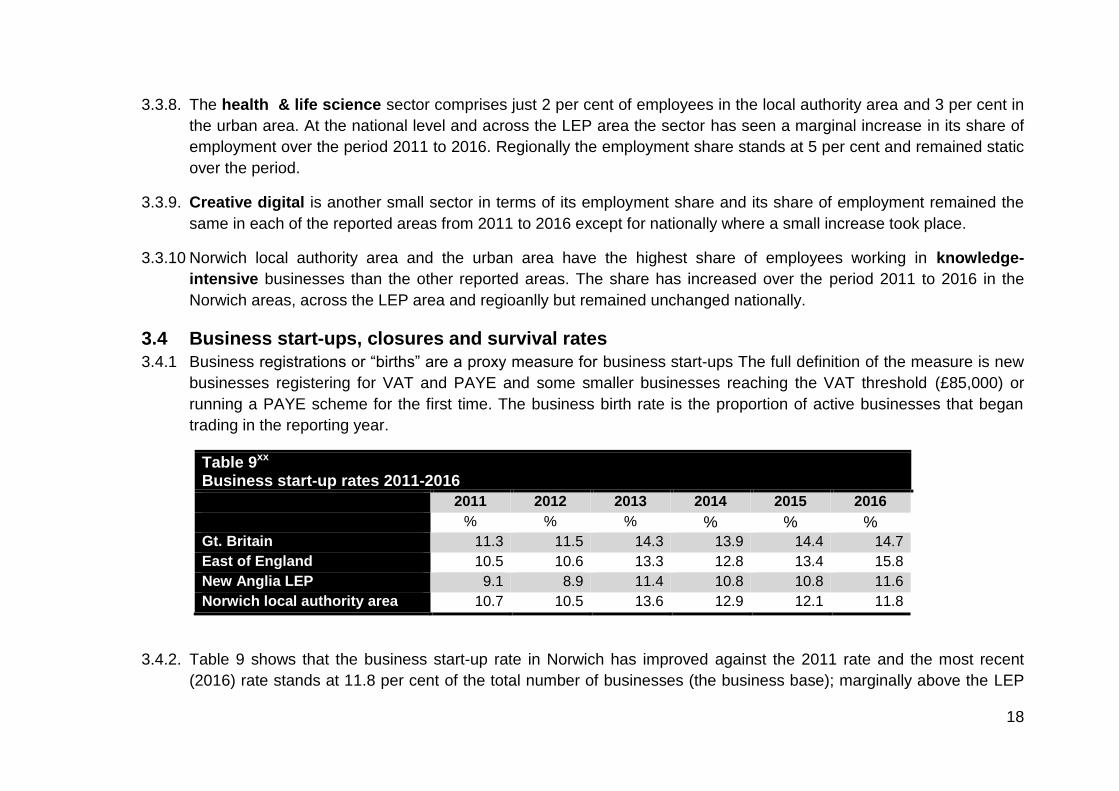
3.4.1 Business registrations or “births” are a proxy measure for business start-ups The full definition of the measure is new
businesses registering for VAT and PAYE and some smaller businesses reaching the VAT threshold (£85,000) or
running a PAYE scheme for the first time. The business birth rate is the proportion of active businesses that began
trading in the reporting year.
Table 9xx Business start-up rates 2011-2016
2011 2012 2013 2014 2015 2016
% % % % % % Gt. Britain 11.3 11.5 14.3 13.9 14.4 14.7
East of England 10.5 10.6 13.3 12.8 13.4 15.8
New Anglia LEP 9.1 8.9 11.4 10.8 10.8 11.6
Norwich local authority area 10.7 10.5 13.6 12.9 12.1 11.8
3.4.2. Table 9 shows that the business start-up rate in Norwich has improved against the 2011 rate and the most recent
(2016) rate stands at 11.8 per cent of the total number of businesses (the business base); marginally above the LEP
19
average of 11.6 per cent but significantly lower than the rate of 15.8 per cent seen at the regional level and 14.7 per
cent at the national level. Although Norwich’s business start-up rate has increased over the five-year period (2011-
2016) growth has been considerably weaker than that seen regionally and nationally although it is comparable to
growth at the LEP.The Norwich rate peaked in 2013 when it increased above the regional rate but has gradually fallen
since then.
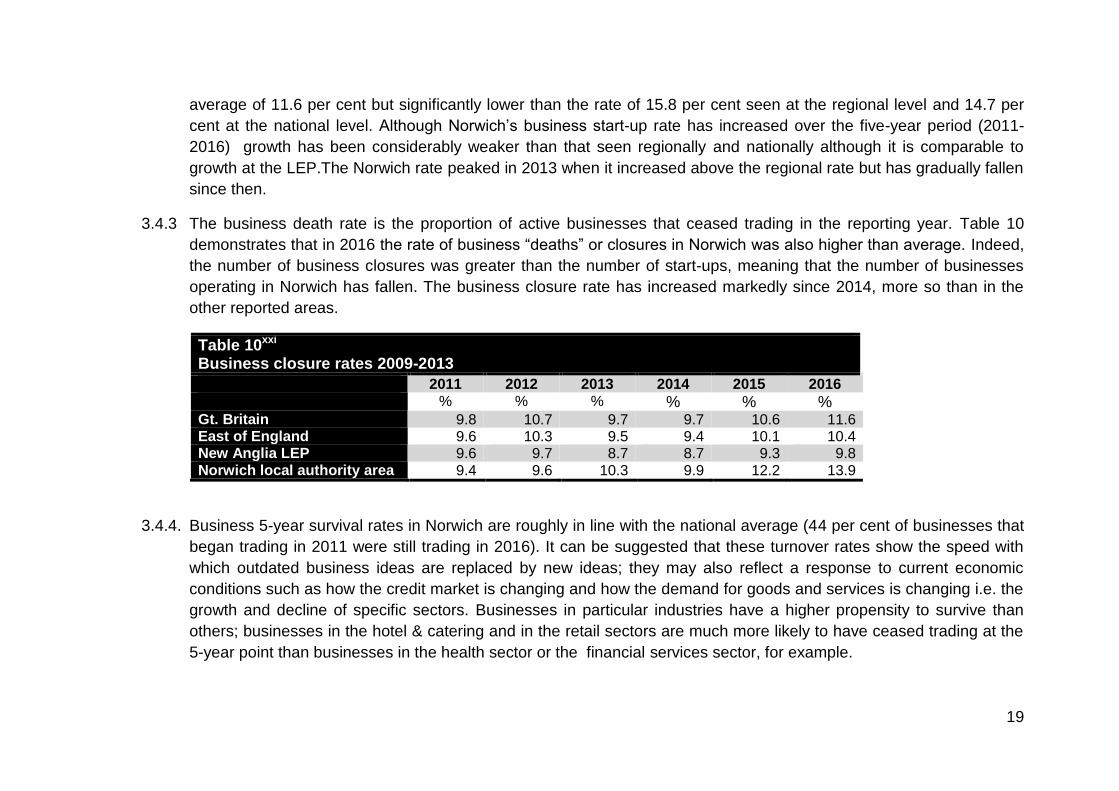
3.4.3 The business death rate is the proportion of active businesses that ceased trading in the reporting year. Table 10
demonstrates that in 2016 the rate of business “deaths” or closures in Norwich was also higher than average. Indeed,
the number of business closures was greater than the number of start-ups, meaning that the number of businesses
operating in Norwich has fallen. The business closure rate has increased markedly since 2014, more so than in the
other reported areas.
Table 10xxi Business closure rates 2009-2013
2011 2012 2013 2014 2015 2016 % % % % % % Gt. Britain 9.8 10.7 9.7 9.7 10.6 11.6 East of England 9.6 10.3 9.5 9.4 10.1 10.4 New Anglia LEP 9.6 9.7 8.7 8.7 9.3 9.8 Norwich local authority area 9.4 9.6 10.3 9.9 12.2 13.9
3.4.4. Business 5-year survival rates in Norwich are roughly in line with the national average (44 per cent of businesses that
began trading in 2011 were still trading in 2016). It can be suggested that these turnover rates show the speed with
which outdated business ideas are replaced by new ideas; they may also reflect a response to current economic
conditions such as how the credit market is changing and how the demand for goods and services is changing i.e. the
growth and decline of specific sectors. Businesses in particular industries have a higher propensity to survive than
others; businesses in the hotel & catering and in the retail sectors are much more likely to have ceased trading at the
5-year point than businesses in the health sector or the financial services sector, for example.
20
3.5 Turnover
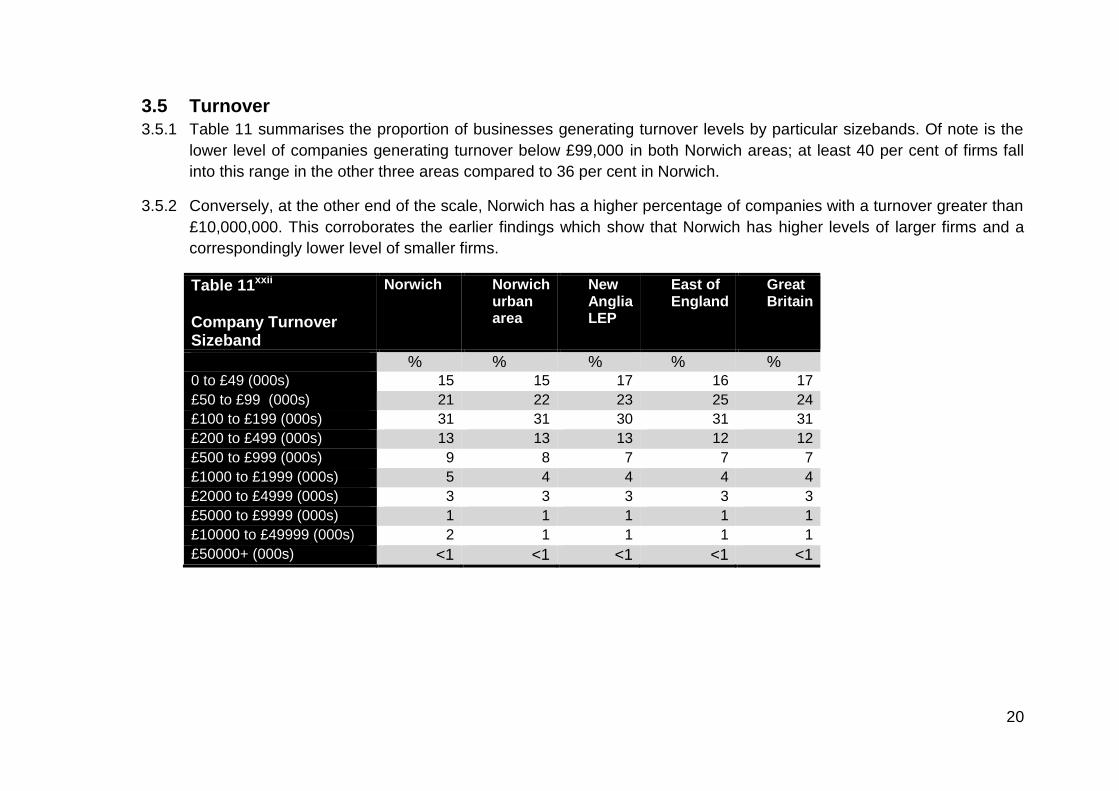
3.5.1 Table 11 summarises the proportion of businesses generating turnover levels by particular sizebands. Of note is the
lower level of companies generating turnover below £99,000 in both Norwich areas; at least 40 per cent of firms fall
into this range in the other three areas compared to 36 per cent in Norwich.
3.5.2 Conversely, at the other end of the scale, Norwich has a higher percentage of companies with a turnover greater than
£10,000,000. This corroborates the earlier findings which show that Norwich has higher levels of larger firms and a
correspondingly lower level of smaller firms.
Table 11xxii Company Turnover Sizeband
Norwich Norwich urban area
New Anglia LEP
East of England
Great Britain
% % % % % 0 to £49 (000s) 15 15 17 16 17
£50 to £99 (000s) 21 22 23 25 24
£100 to £199 (000s) 31 31 30 31 31
£200 to £499 (000s) 13 13 13 12 12
£500 to £999 (000s) 9 8 7 7 7
£1000 to £1999 (000s) 5 4 4 4 4
£2000 to £4999 (000s) 3 3 3 3 3
£5000 to £9999 (000s) 1 1 1 1 1
£10000 to £49999 (000s) 2 1 1 1 1
£50000+ (000s) <1 <1 <1 <1 <1
21
Rateable Value
Section 4: Productivity This section examines economic productivity which is a measure of the efficiency with which capital and labour are combined
to produce more with the same level of factor inputs. Growth in an economy can be driven by increases or improvements in
either land, labour or capital.
4.1 Measures of productivity
4.1.1 Productivity is an important determinant of living standards – it quantifies how an economy uses the resources it has
available, by relating the value of inputs to output. “Productivity isn’t everything, but in the long run it is almost
everything. A country’s ability to improve its standard of living over time depends almost entirely on its ability to raise
output per worker” (Paul Krugman, OECD, 2006). Productivity estimates tend to use one of three different measures
of output:
1. Gross Value Added (GVA)
2. Gross Domestic Product (GDP) - only available at the national economy level
3. Total Output
4.1.2 GVA is the value of output less the value of intermediate consumption; it measures the contribution to the national
economy of each individual producer, industry or sector. In 2015 total GVA3 for the Norwich local authority area was
estimated to be £3,097m. Norwich has seen growth of 17 per cent over the period 2011-2016. However, total GVA is
not a measure that enables comparison at across different levels of geography. GVA per capita (or head of
population) is a measure of productivity which allows comparison, though it also reflects the levels of unemployment
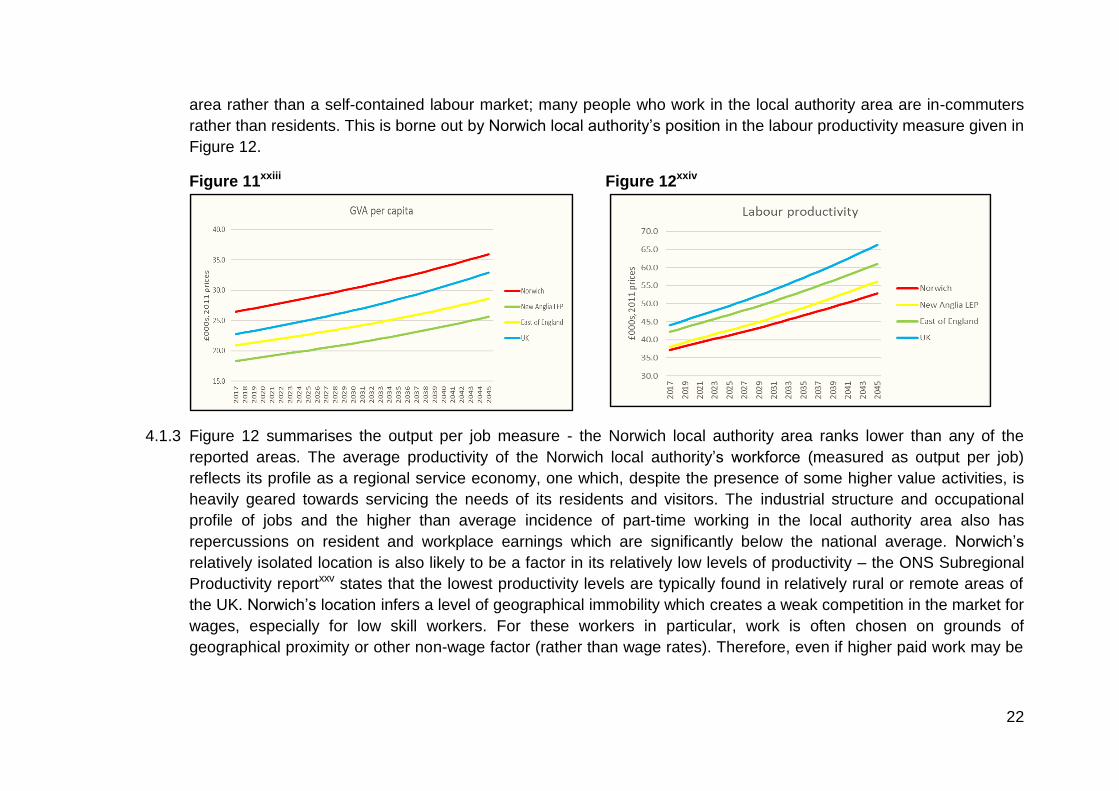
and the relative numbers of economically inactive, such as students and pensioners. Figure 11 shows that Norwich
local authority area has the highest GVA per capita or head of population of all the reported areas. However, this
measure is somewhat misleading as the Norwich local authority area is a centre for employment for the surrounding
3 2015 £m, current prices - (income approach). Note: this indicator should be treated with caution. GVA is essentially the sum of profits and wages - it
is difficult to allocate GVA on a resident basis. Local authority level GVA is constructed based on employee data and regional GVA.
22
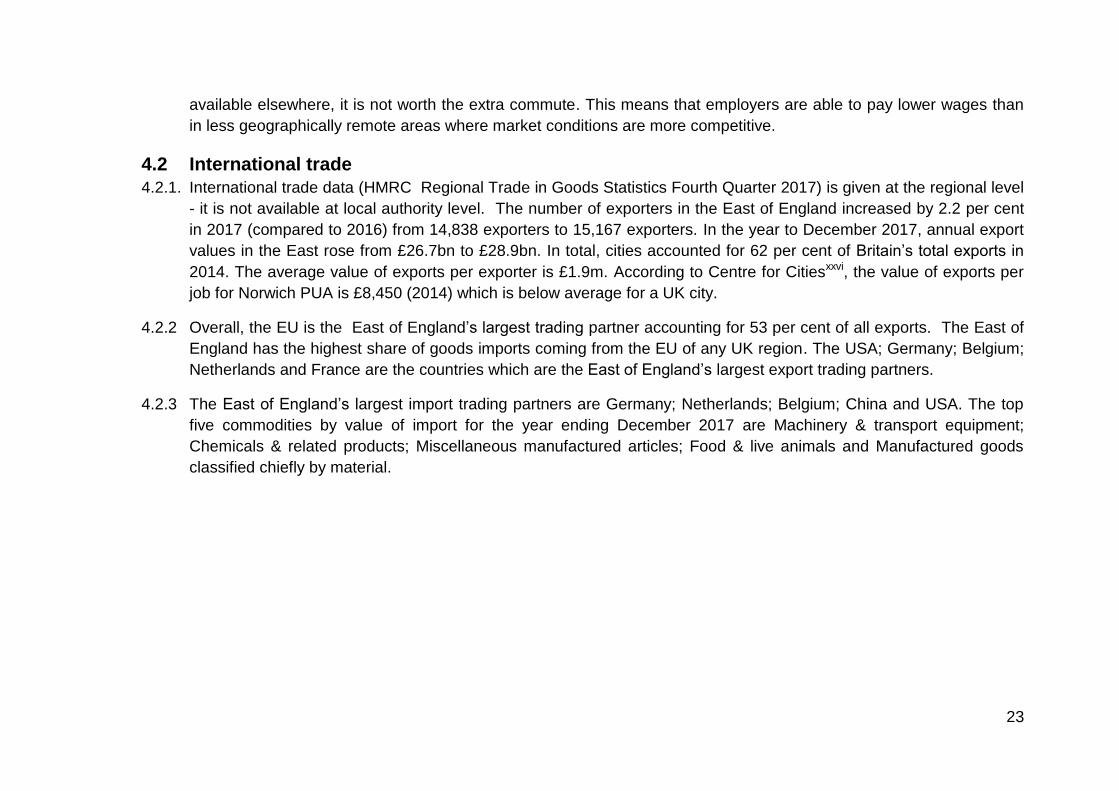
area rather than a self-contained labour market; many people who work in the local authority area are in-commuters
rather than residents. This is borne out by Norwich local authority’s position in the labour productivity measure given in
Figure 12.
Figure 11xxiii
Figure 12xxiv
4.1.3 Figure 12 summarises the output per job measure - the Norwich local authority area ranks lower than any of the
reported areas. The average productivity of the Norwich local authority’s workforce (measured as output per job)
reflects its profile as a regional service economy, one which, despite the presence of some higher value activities, is
heavily geared towards servicing the needs of its residents and visitors. The industrial structure and occupational
profile of jobs and the higher than average incidence of part-time working in the local authority area also has
repercussions on resident and workplace earnings which are significantly below the national average. Norwich’s
relatively isolated location is also likely to be a factor in its relatively low levels of productivity – the ONS Subregional
Productivity reportxxv states that the lowest productivity levels are typically found in relatively rural or remote areas of
the UK. Norwich’s location infers a level of geographical immobility which creates a weak competition in the market for
wages, especially for low skill workers. For these workers in particular, work is often chosen on grounds of
geographical proximity or other non-wage factor (rather than wage rates). Therefore, even if higher paid work may be
23
available elsewhere, it is not worth the extra commute. This means that employers are able to pay lower wages than
in less geographically remote areas where market conditions are more competitive.
4.2 International trade
4.2.1. International trade data (HMRC Regional Trade in Goods Statistics Fourth Quarter 2017) is given at the regional level
- it is not available at local authority level. The number of exporters in the East of England increased by 2.2 per cent
in 2017 (compared to 2016) from 14,838 exporters to 15,167 exporters. In the year to December 2017, annual export
values in the East rose from £26.7bn to £28.9bn. In total, cities accounted for 62 per cent of Britain’s total exports in
2014. The average value of exports per exporter is £1.9m. According to Centre for Citiesxxvi, the value of exports per
job for Norwich PUA is £8,450 (2014) which is below average for a UK city.
4.2.2 Overall, the EU is the East of England’s largest trading partner accounting for 53 per cent of all exports. The East of
England has the highest share of goods imports coming from the EU of any UK region. The USA; Germany; Belgium;
Netherlands and France are the countries which are the East of England’s largest export trading partners.
4.2.3 The East of England’s largest import trading partners are Germany; Netherlands; Belgium; China and USA. The top
five commodities by value of import for the year ending December 2017 are Machinery & transport equipment;
Chemicals & related products; Miscellaneous manufactured articles; Food & live animals and Manufactured goods
classified chiefly by material.

24
Section 5: Qualifications and Skills This section examines the qualification attainment levels of the working age population, evidence of job-related training to
up-skill the work force and trends in the incidence of young people not in education, employment or training (NEETs) as an
indicator of future employment vulnerability and risk.
5.1 Market for skills
5.1.1. The Norwich area is home to a number of innovative businesses that are leaders in knowledge creation However, the
majority of businesses use technology and business ideas that originate somewhere else. Therefore, a broad and
deep skills base is needed to increase the city’s ability not only to create knowledge, but also to understand and
spread knowledge. Consequently, the skills available in the labour market need to be the ‘right’ skills; if the supply of
skills is not well matched to employer need there will be inefficiencies and lost opportunities for growth. From a social
inclusion point of view the low or no skilled population may find it difficult to take advantage of both existing and future
employment opportunities.
5.1.2 Qualifications or educational attainment are used as a proxy for skill because it is very difficult to measure or monitor
skills per se. The qualification profile of the Norwich local authority area working age population is summarised in
Figure 12 Just over one-third (39 per cent) of the working age population is qualified to level 4 (degree level) or
higher; the same proportion as at the national level. This is marginally higher than the percentage in Norwich urban
area (34 per cent), in the region (35 per cent) and nationally (38 per cent). Of the reported areas the LEP area has the
lowest level with just 31 per cent holding a level 4 and above qualification.
5.1.3 Of the reported areas, the proportion of the working age population whose highest qualification is at level 3 (A level)
or above is the same across each of the reported areas at 17 per cent of the working age population.
5.1.4 Roughly 15 per cent of the working age population in Norwich holds a level 2 as their highest qualification. Nationally
16 per cent hold their highest qualification at level 2; around 17 per cent of the working age population in the other
three areas report that their highest level of qualification is at level 2.
25
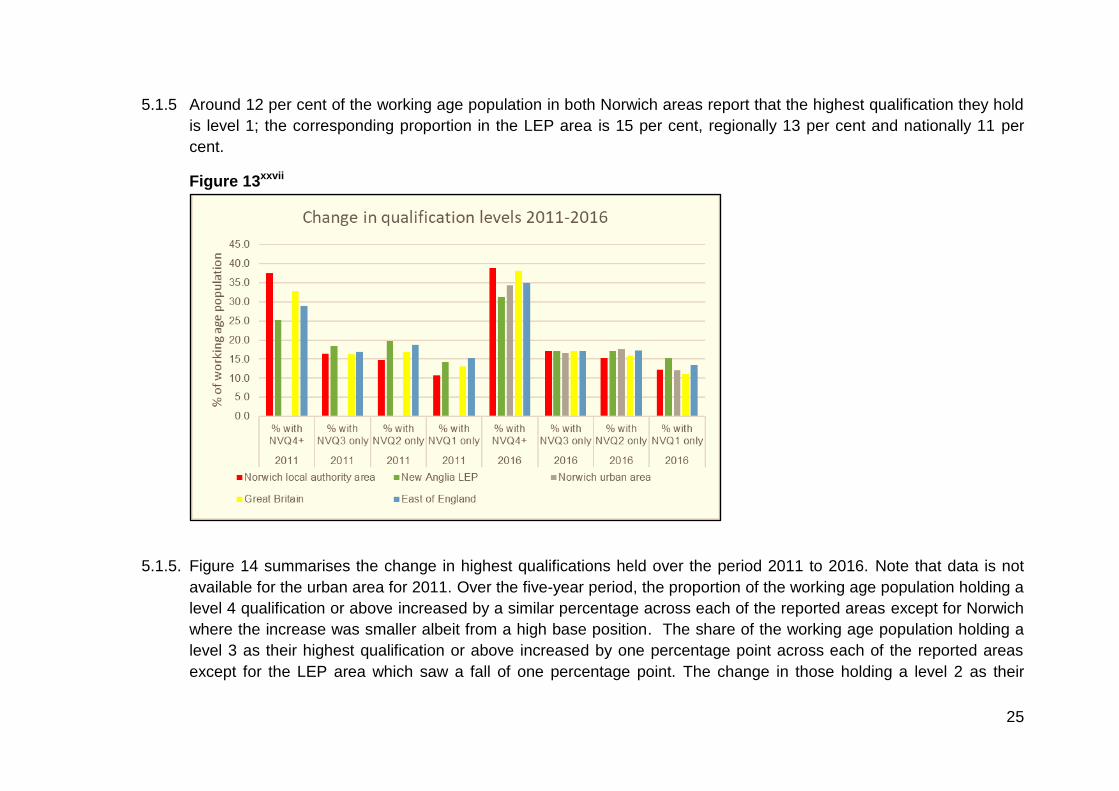
5.1.5 Around 12 per cent of the working age population in both Norwich areas report that the highest qualification they hold
is level 1; the corresponding proportion in the LEP area is 15 per cent, regionally 13 per cent and nationally 11 per
cent.
Figure 13xxvii
5.1.5. Figure 14 summarises the change in highest qualifications held over the period 2011 to 2016. Note that data is not
available for the urban area for 2011. Over the five-year period, the proportion of the working age population holding a
level 4 qualification or above increased by a similar percentage across each of the reported areas except for Norwich
where the increase was smaller albeit from a high base position. The share of the working age population holding a
level 3 as their highest qualification or above increased by one percentage point across each of the reported areas
except for the LEP area which saw a fall of one percentage point. The change in those holding a level 2 as their
26
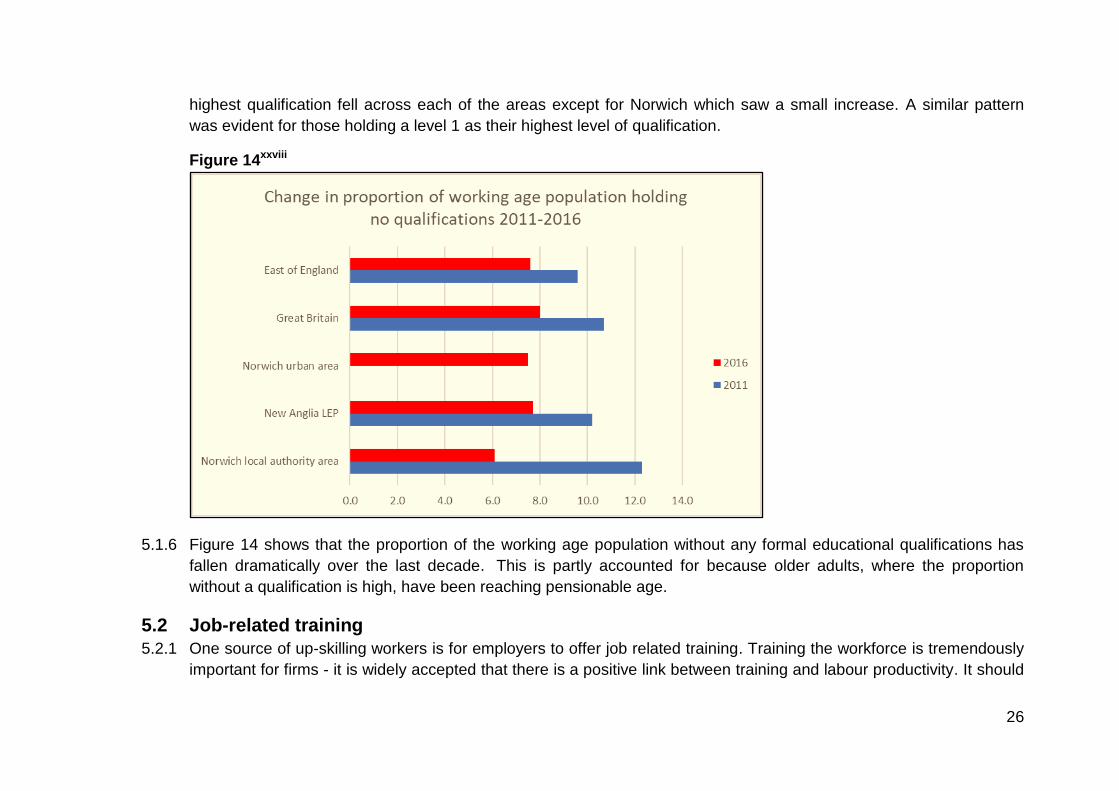
highest qualification fell across each of the areas except for Norwich which saw a small increase. A similar pattern
was evident for those holding a level 1 as their highest level of qualification.
Figure 14xxviii
5.1.6 Figure 14 shows that the proportion of the working age population without any formal educational qualifications has
fallen dramatically over the last decade. This is partly accounted for because older adults, where the proportion
without a qualification is high, have been reaching pensionable age.
5.2 Job-related training
5.2.1 One source of up-skilling workers is for employers to offer job related training. Training the workforce is tremendously
important for firms - it is widely accepted that there is a positive link between training and labour productivity. It should
27
be noted however, that the Leitch Review of Skills in 2006 found that the UK’s relatively poor skills base accounts for
only 20 per cent of the productivity gap with European countries; with the remainder caused by lack of investment “in
physical capital, R&D and infrastructure*. Job related training is a combination of work and preparing for work. It
includes on the job training, training away from the job and pre-employment training.
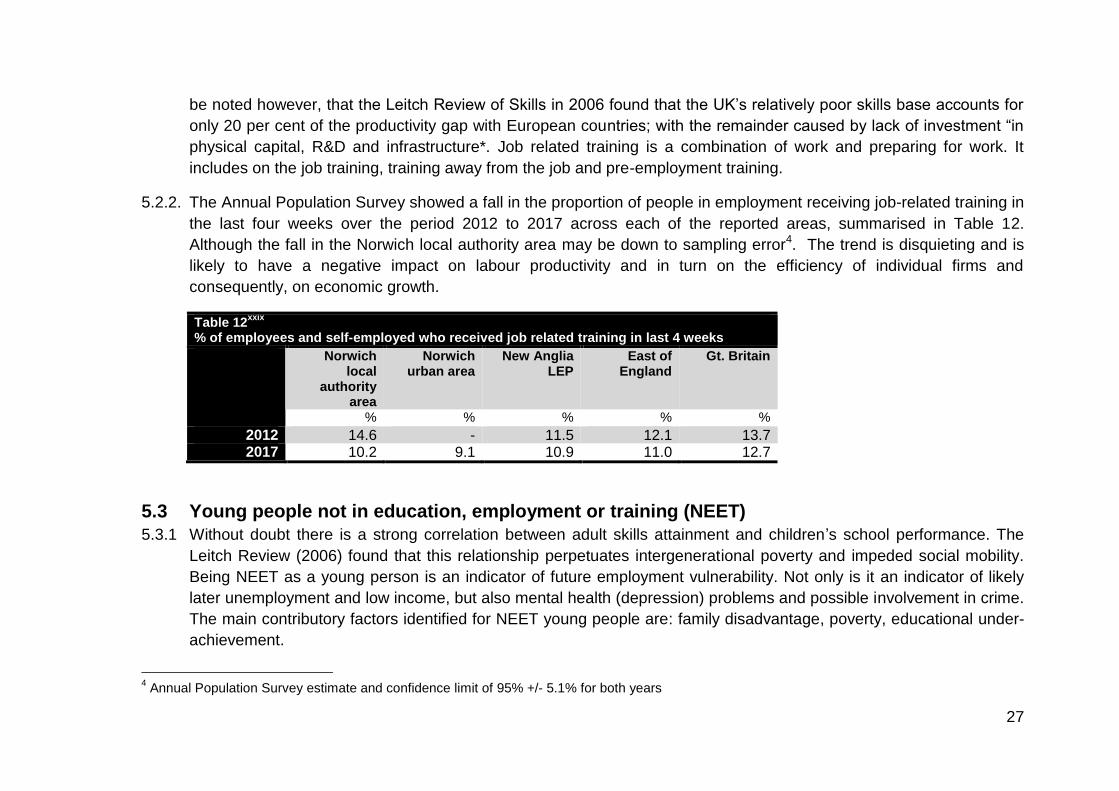
5.2.2. The Annual Population Survey showed a fall in the proportion of people in employment receiving job-related training in
the last four weeks over the period 2012 to 2017 across each of the reported areas, summarised in Table 12.
Although the fall in the Norwich local authority area may be down to sampling error4. The trend is disquieting and is
likely to have a negative impact on labour productivity and in turn on the efficiency of individual firms and
consequently, on economic growth.
Table 12xxix
% of employees and self-employed who received job related training in last 4 weeks
Norwich local
authority area
Norwich urban area
New Anglia LEP
East of England
Gt. Britain
% % % % %
2012 14.6 - 11.5 12.1 13.7 2017 10.2 9.1 10.9 11.0 12.7
5.3 Young people not in education, employment or training (NEET)
5.3.1 Without doubt there is a strong correlation between adult skills attainment and children’s school performance. The
Leitch Review (2006) found that this relationship perpetuates intergenerational poverty and impeded social mobility.
Being NEET as a young person is an indicator of future employment vulnerability. Not only is it an indicator of likely
later unemployment and low income, but also mental health (depression) problems and possible involvement in crime.
The main contributory factors identified for NEET young people are: family disadvantage, poverty, educational under-
achievement.
4 Annual Population Survey estimate and confidence limit of 95% +/- 5.1% for both years
28
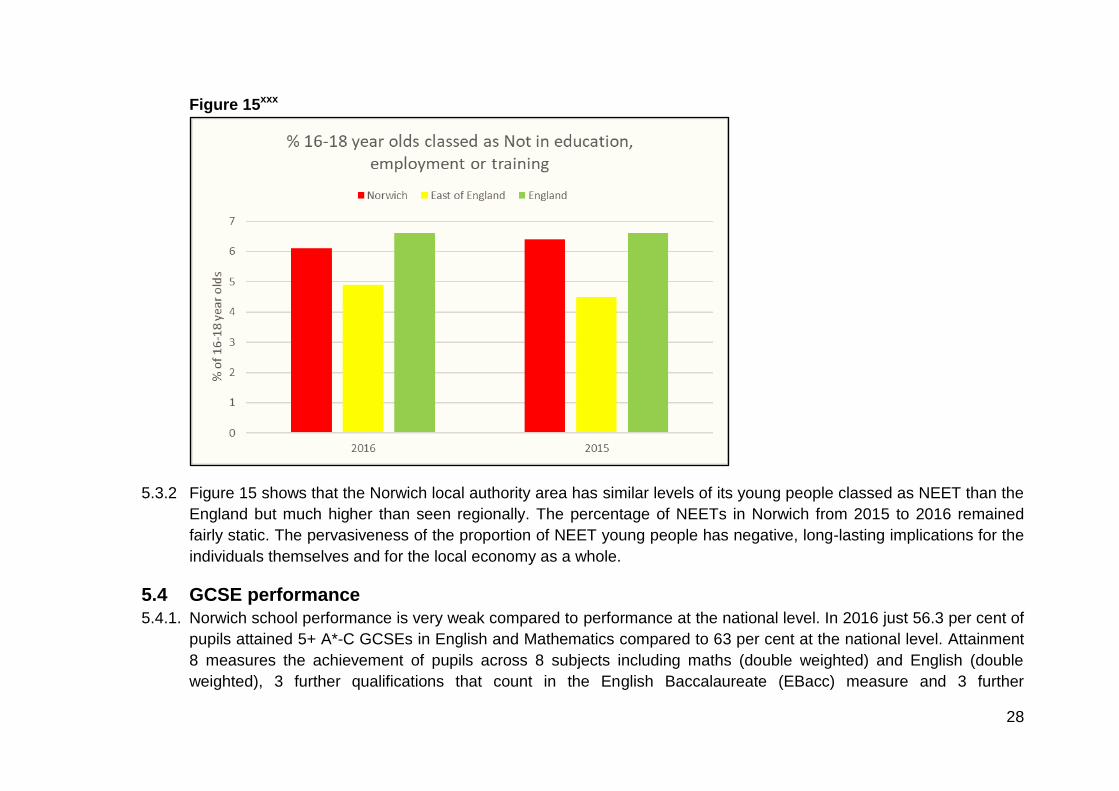
Figure 15xxx
5.3.2 Figure 15 shows that the Norwich local authority area has similar levels of its young people classed as NEET than the
England but much higher than seen regionally. The percentage of NEETs in Norwich from 2015 to 2016 remained
fairly static. The pervasiveness of the proportion of NEET young people has negative, long-lasting implications for the
individuals themselves and for the local economy as a whole.
5.4 GCSE performance
5.4.1. Norwich school performance is very weak compared to performance at the national level. In 2016 just 56.3 per cent of
pupils attained 5+ A*-C GCSEs in English and Mathematics compared to 63 per cent at the national level. Attainment
8 measures the achievement of pupils across 8 subjects including maths (double weighted) and English (double
weighted), 3 further qualifications that count in the English Baccalaureate (EBacc) measure and 3 further
29
qualifications that can be GCSE qualifications (including EBacc subjects). In Norwich just 45.9 per cent of pupils
achieved this level of attainment against 49.9 per cent nationally.
5.5 Higher Education (HE) and Further Education (FE) Institutions
5.5.1 The Norwich local authority area is home to two universities, Norwich University of the Arts (NUA) and the University
of East Anglia; City College Norwich also has HE/FE provision including vocational qualifications. The University
Technical College Norfolk provides technical courses for 14-18 year olds with a particular focus on the advanced
engineering and energy sectors. The Norwich International Aviation Academy is now operating and with its delivery
partners is providing education across a broad spectrum of aviation-related skills.
30
Section 6: Labour Market Section 6 examines some of the details of the local labour market including employment, unemployment, occupational profile
and earnings differentials.
6.1 Jobs density
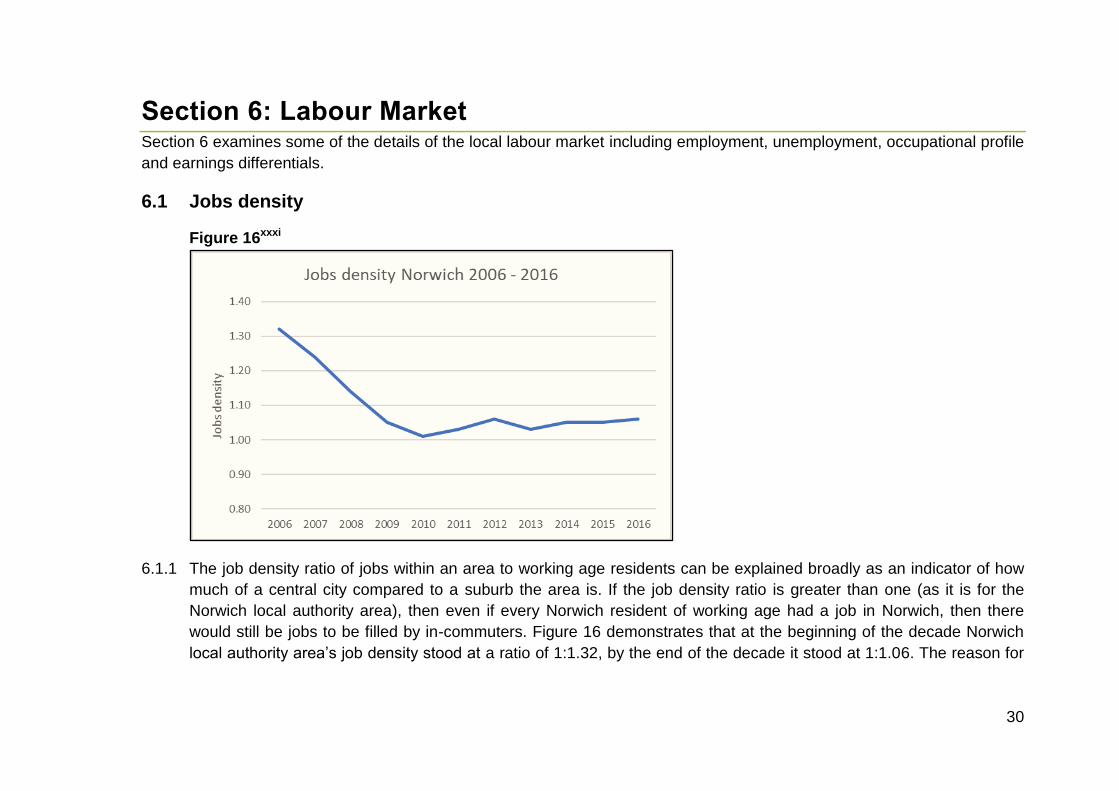
Figure 16xxxi
6.1.1 The job density ratio of jobs within an area to working age residents can be explained broadly as an indicator of how
much of a central city compared to a suburb the area is. If the job density ratio is greater than one (as it is for the
Norwich local authority area), then even if every Norwich resident of working age had a job in Norwich, then there
would still be jobs to be filled by in-commuters. Figure 16 demonstrates that at the beginning of the decade Norwich
local authority area’s job density stood at a ratio of 1:1.32, by the end of the decade it stood at 1:1.06. The reason for
31
this is twofold; the working age population has increased by 12 per cent over the period, while the number of jobs has
fallen by 11 per cent.
6.2 Economic activity
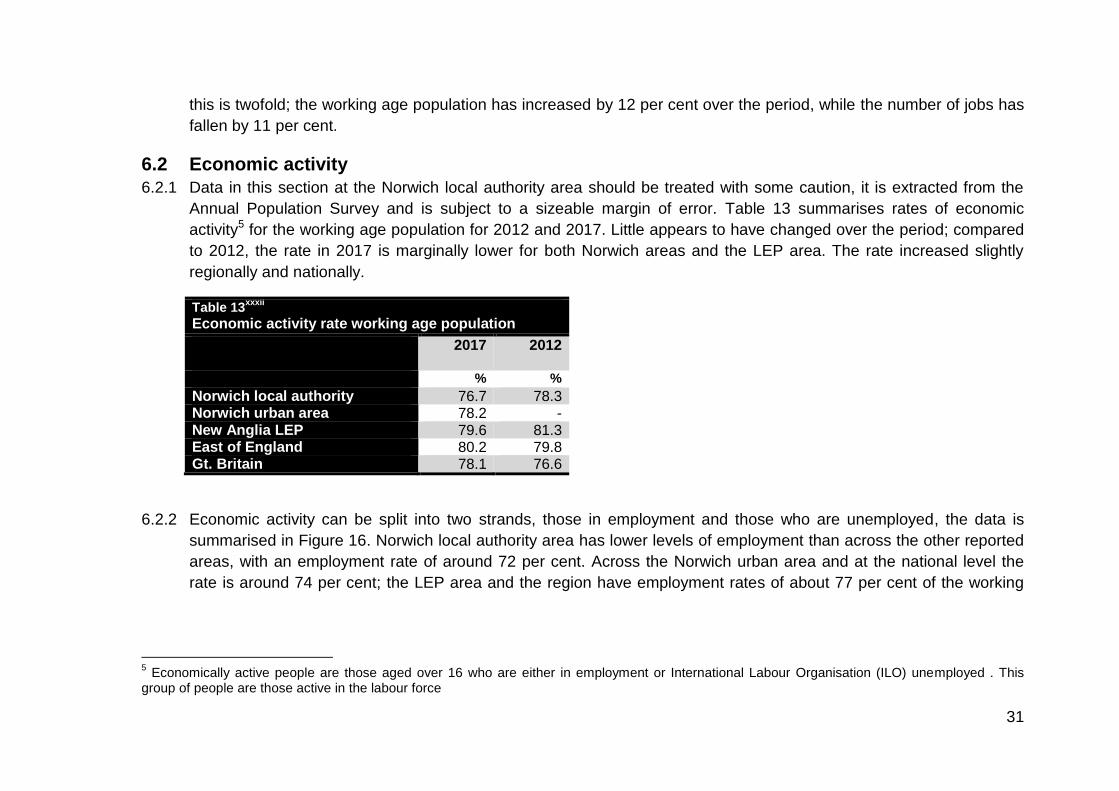
6.2.1 Data in this section at the Norwich local authority area should be treated with some caution, it is extracted from the
Annual Population Survey and is subject to a sizeable margin of error. Table 13 summarises rates of economic
activity5 for the working age population for 2012 and 2017. Little appears to have changed over the period; compared
to 2012, the rate in 2017 is marginally lower for both Norwich areas and the LEP area. The rate increased slightly
regionally and nationally.
Table 13xxxii
Economic activity rate working age population
2017 2012
% %
Norwich local authority 76.7 78.3 Norwich urban area 78.2 - New Anglia LEP 79.6 81.3 East of England 80.2 79.8 Gt. Britain 78.1 76.6
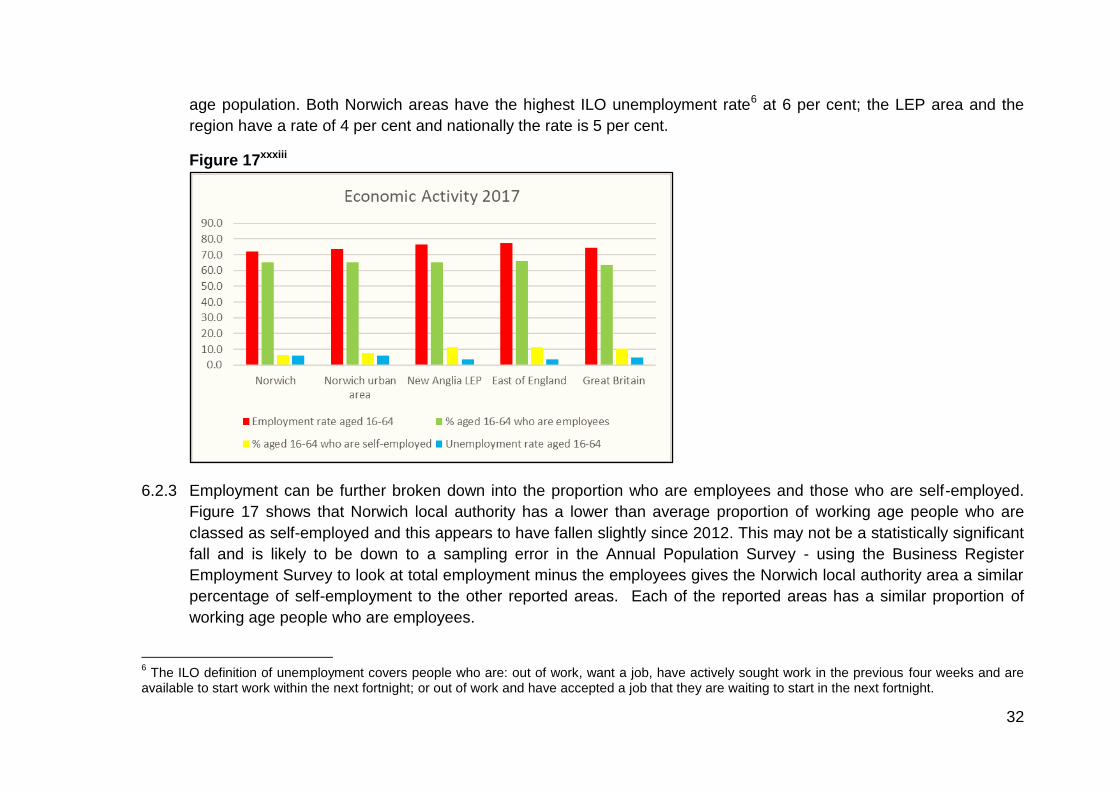
6.2.2 Economic activity can be split into two strands, those in employment and those who are unemployed, the data is
summarised in Figure 16. Norwich local authority area has lower levels of employment than across the other reported
areas, with an employment rate of around 72 per cent. Across the Norwich urban area and at the national level the
rate is around 74 per cent; the LEP area and the region have employment rates of about 77 per cent of the working
5 Economically active people are those aged over 16 who are either in employment or International Labour Organisation (ILO) unemployed . This
group of people are those active in the labour force
32
age population. Both Norwich areas have the highest ILO unemployment rate6 at 6 per cent; the LEP area and the
region have a rate of 4 per cent and nationally the rate is 5 per cent.
Figure 17xxxiii
6.2.3 Employment can be further broken down into the proportion who are employees and those who are self-employed.
Figure 17 shows that Norwich local authority has a lower than average proportion of working age people who are
classed as self-employed and this appears to have fallen slightly since 2012. This may not be a statistically significant
fall and is likely to be down to a sampling error in the Annual Population Survey - using the Business Register
Employment Survey to look at total employment minus the employees gives the Norwich local authority area a similar
percentage of self-employment to the other reported areas. Each of the reported areas has a similar proportion of
working age people who are employees.
6 The ILO definition of unemployment covers people who are: out of work, want a job, have actively sought work in the previous four weeks and are
available to start work within the next fortnight; or out of work and have accepted a job that they are waiting to start in the next fortnight.
33
6.2.4 The East of England Forecasting Model (EEFM) predicts that employee numbers in Norwich will increase to 98,000 by
2030, forecast growth of around 9 per cent from 2017.
6.3 Employee status
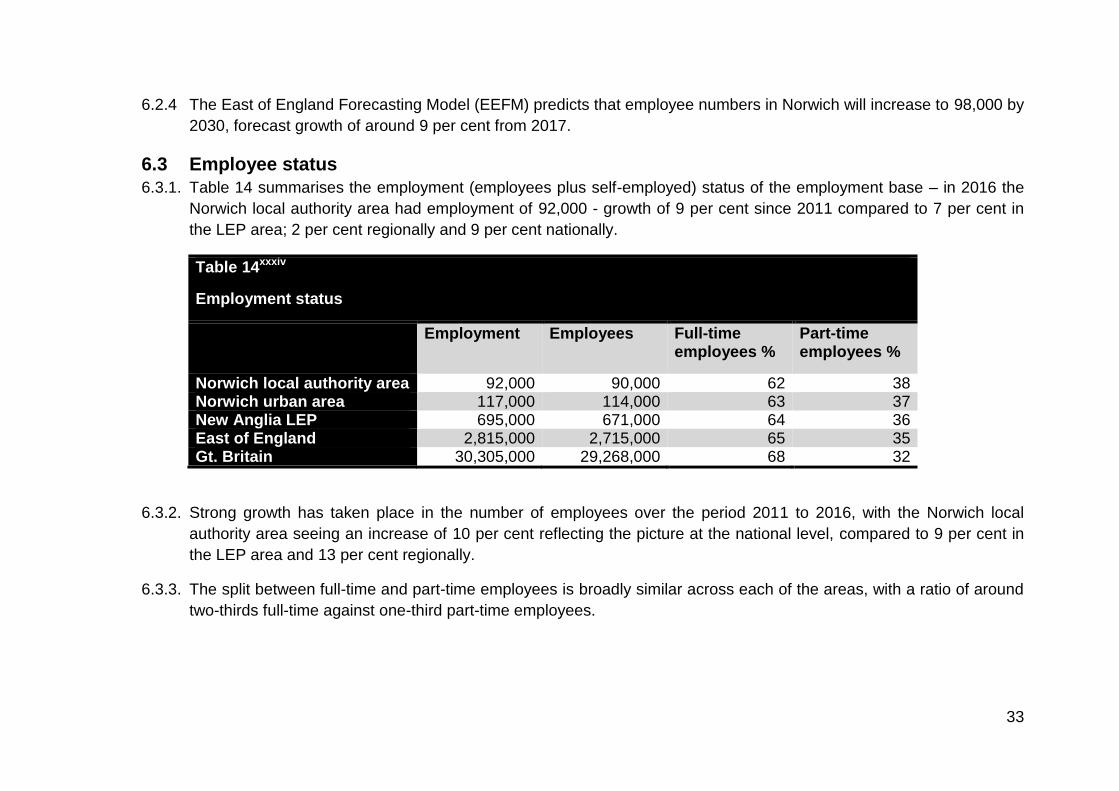
6.3.1. Table 14 summarises the employment (employees plus self-employed) status of the employment base – in 2016 the
Norwich local authority area had employment of 92,000 - growth of 9 per cent since 2011 compared to 7 per cent in
the LEP area; 2 per cent regionally and 9 per cent nationally.
Table 14xxxiv
Employment status
Employment Employees Full-time employees %
Part-time employees %
Norwich local authority area 92,000 90,000 62 38 Norwich urban area 117,000 114,000 63 37 New Anglia LEP 695,000 671,000 64 36 East of England 2,815,000 2,715,000 65 35 Gt. Britain 30,305,000 29,268,000 68 32
6.3.2. Strong growth has taken place in the number of employees over the period 2011 to 2016, with the Norwich local
authority area seeing an increase of 10 per cent reflecting the picture at the national level, compared to 9 per cent in
the LEP area and 13 per cent regionally.
6.3.3. The split between full-time and part-time employees is broadly similar across each of the areas, with a ratio of around
two-thirds full-time against one-third part-time employees.
34
6.4 Occupational profile
Figure 18xxxv
35
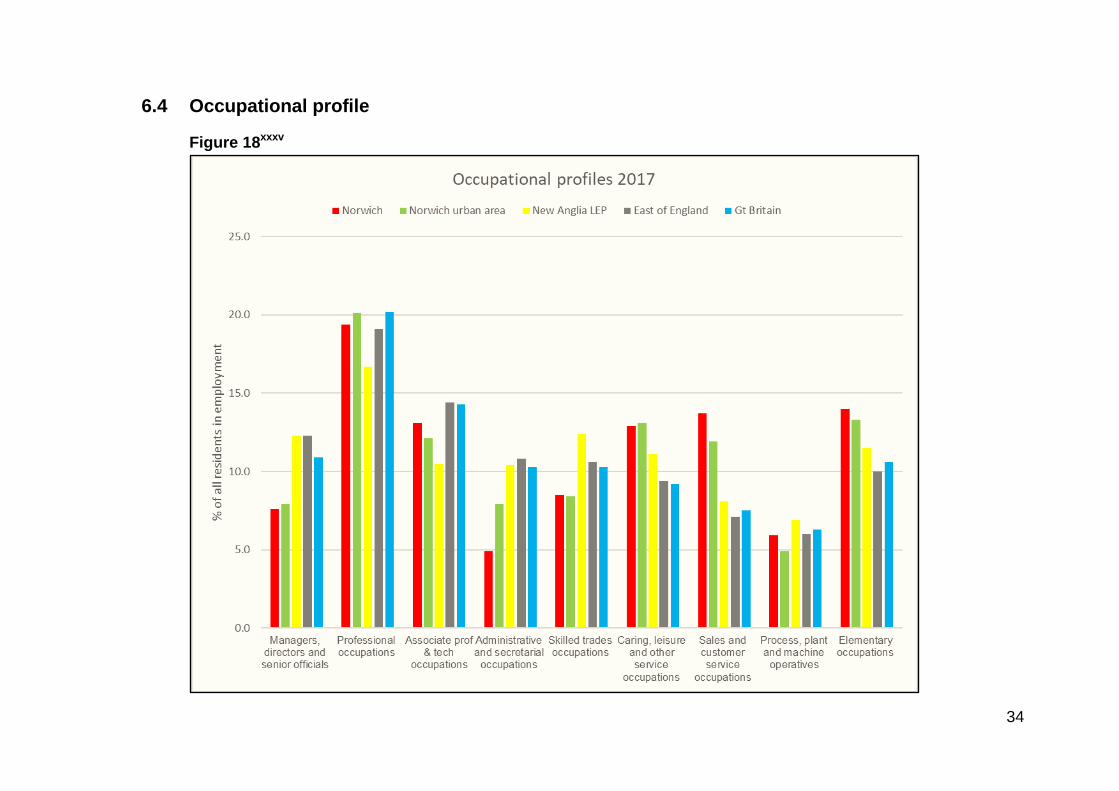
6.4.1. Data in this section at the Norwich local authority area should be treated with some caution, it is extracted from the
Annual Population Survey and is subject to a sizeable margin of error. Figure 18 shows that both Norwich areas have
a lower percentage (8 per cent) of employed residents working in managers, directors and senior than in the other
areas (LEP and the region 12 per cent, nationally 11 per cent) . This is likely to be the result of the high levels of in-
commuting to Norwich from the rest of Norfolk Around one-fifth of residents in employment work in professional
occupations and this is similar across all of the reported areas except the LEP area where it is slightly lower. Around
13 per cent of Norwich local authority residents are employed in associate professional & technical occupations
compared to 12 per cent in the urban area; 10 per cent across the LEP area and 14 per cent regionally and
nationally..
6.4.2 The Norwich local authority area has the lowest percentage (5 per cent) of residents employed in administrative and
secretarial occupations of all the reported areas, followed by the urban area at 8 per cent. Around 10 per cent of
residents in the other three areas are employed in these occupations. conversely, the local authority and the LEP area
have the highest (10 per cent). The Norwich areas have the lowest share of skilled trades occupations (8 per cent),
reflecting the relatively low percentage of construction firms based within the urban area; the LEP area has the
highest share of skilled trades occupations at 12 per cent compared to 11 per cent regionally and 10 per cent
nationally.
6.4.3. Employment in caring, leisure and other service occupations is more prevalent in the Norwich areas (13 per cent)
compared to the other reported areas (LEP 11 per cent, regionally and nationally 9 per cent. A much higher
percentage of Norwich local authority area residents are employed in sales and customer service occupations (14 per
cent) compared to the other reported areas (Norwich urban area 12 per cent, LEP 8 per cent, regionally and nationally
7 per cent).
6.4.4 The Norwich local authority area has the highest employment share (20 per cent) of lower level occupations (process,
plant and machine operatives and elementary occupations), closely followed by the Norwich urban area and the LEP
area (18 per cent); at the regional level the share is 16 per cent and at the national level 16 per cent.
36
6.5 Skills shortages and skills gaps
6.5.1 A skills shortage means that employers are unable to recruit new staff with the necessary skills to do the job; a skills
gap affects workers, already employed by a firm, who do not have the skills necessary to do a particular job.
According to the UKCES 2015 Employer Skills Survey, a majority (83 per cent) of Norfolk employers report that they
were not affected by a skills shortage or skills gap. Where they exist, skills shortages in Norfolk are most prevalent in
skilled trade occupations (reported by 41 per cent of employers with skill shortage vacancies); elementary staff (11 per
cent) and sales and customer services staff (10 per cent).
6.5.2. The reasons that Norfolk employers (4 per cent reported having a skills shortage vacancy) with hard to fill vacancies
reported for having such vacancies are the low number of applicants with the required skills (37 per cent) and low
number of applicants generally (19 per cent).
6.5.3 Norfolk employers reported that administrative/clerical staff and elementary staff were the most likely to be affected by
skills gaps.
6.6 Earnings
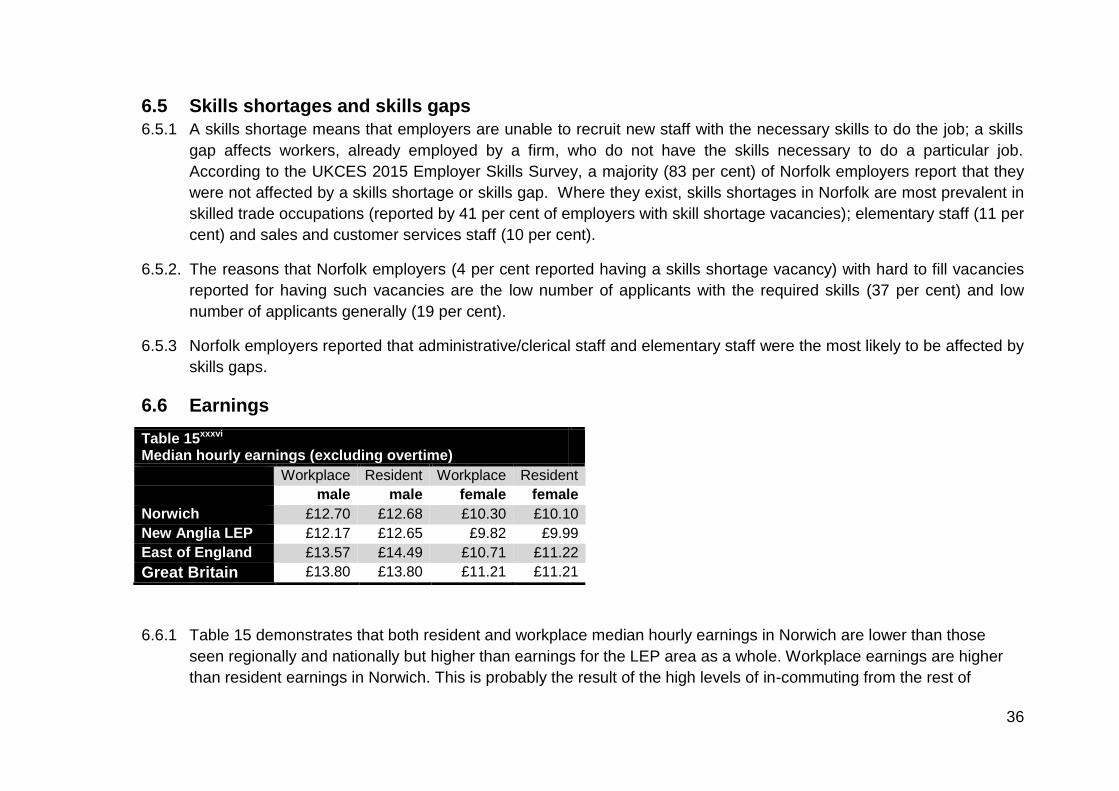
6.6.1 Table 15 demonstrates that both resident and workplace median hourly earnings in Norwich are lower than those
seen regionally and nationally but higher than earnings for the LEP area as a whole. Workplace earnings are higher
than resident earnings in Norwich. This is probably the result of the high levels of in-commuting from the rest of
Table 15xxxvi Median hourly earnings (excluding overtime)
Workplace Resident Workplace Resident
male male female female
Norwich £12.70 £12.68 £10.30 £10.10
New Anglia LEP £12.17 £12.65 £9.82 £9.99
East of England £13.57 £14.49 £10.71 £11.22
Great Britain £13.80 £13.80 £11.21 £11.21
37
Norfolk and, as discussed in the previous occupational profile section, high earners employed in managerial and
director level occupations are likely to live outside of the local authority boundaries.
6.6.2 Female earnings are lower than male earnings across each of the reported areas. In Norwich the differential is 19 per
cent for workplace earnings and 20 per cent for residential earnings. Across the LEP area the differential is 19 per
cent for workplace earnings and 21 per cent for residential earnings; regionally the differential is 21 per cent for
workplace earnings and 22 per cent for residential earnings; nationally the differential stands at 19 per cent for both
workplace and residential earnings.
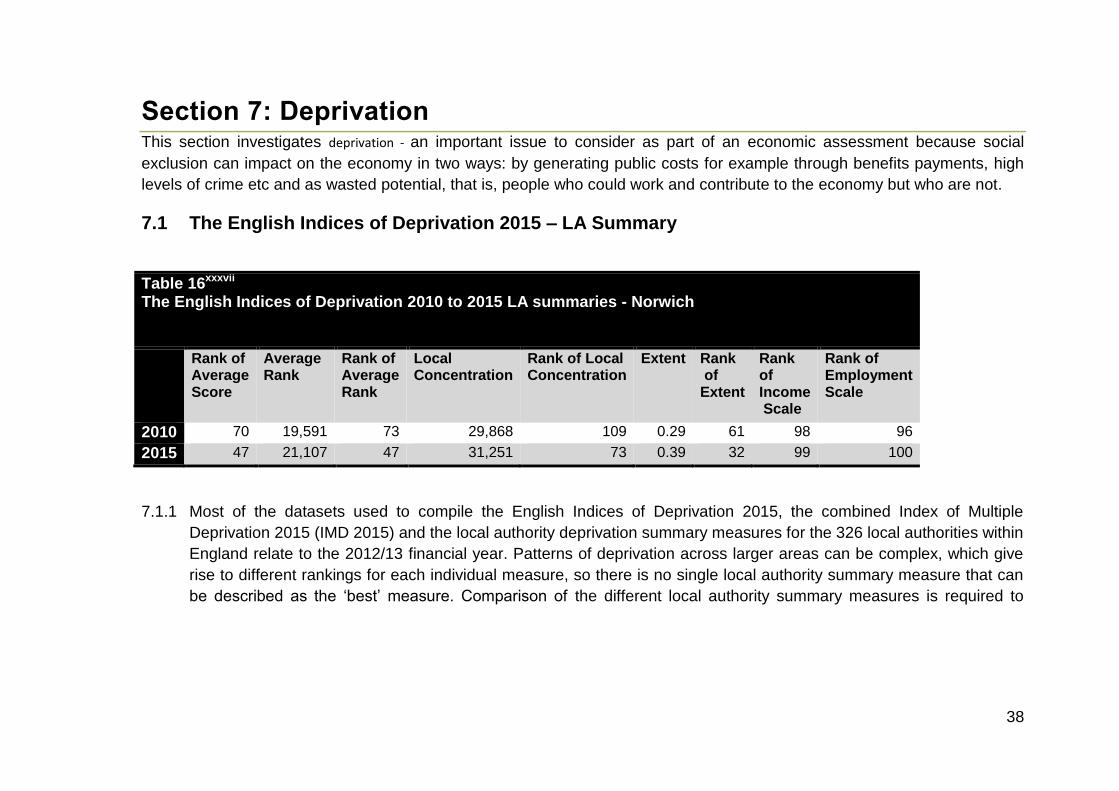
38
Section 7: Deprivation This section investigates deprivation - an important issue to consider as part of an economic assessment because social
exclusion can impact on the economy in two ways: by generating public costs for example through benefits payments, high
levels of crime etc and as wasted potential, that is, people who could work and contribute to the economy but who are not.
7.1 The English Indices of Deprivation 2015 – LA Summary
Table 16xxxvii The English Indices of Deprivation 2010 to 2015 LA summaries - Norwich
Rank of Average Score
Average Rank
Rank of Average Rank
Local Concentration
Rank of Local Concentration
Extent
Rank of Extent
Rank of Income Scale
Rank of Employment Scale
2010 70 19,591 73 29,868 109 0.29 61 98 96
2015 47 21,107 47 31,251 73 0.39 32 99 100
7.1.1 Most of the datasets used to compile the English Indices of Deprivation 2015, the combined Index of Multiple
Deprivation 2015 (IMD 2015) and the local authority deprivation summary measures for the 326 local authorities within
England relate to the 2012/13 financial year. Patterns of deprivation across larger areas can be complex, which give
rise to different rankings for each individual measure, so there is no single local authority summary measure that can
be described as the ‘best’ measure. Comparison of the different local authority summary measures is required to
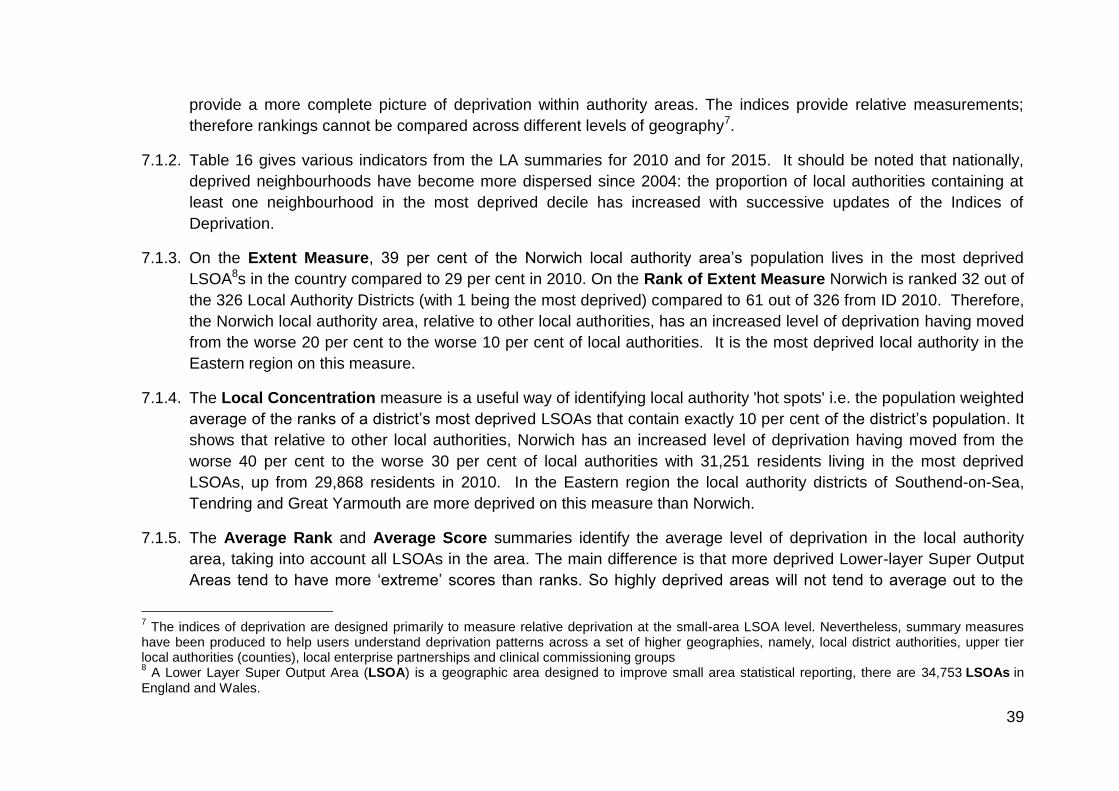
39
provide a more complete picture of deprivation within authority areas. The indices provide relative measurements;
therefore rankings cannot be compared across different levels of geography7.
7.1.2. Table 16 gives various indicators from the LA summaries for 2010 and for 2015. It should be noted that nationally,
deprived neighbourhoods have become more dispersed since 2004: the proportion of local authorities containing at
least one neighbourhood in the most deprived decile has increased with successive updates of the Indices of
Deprivation.
7.1.3. On the Extent Measure, 39 per cent of the Norwich local authority area’s population lives in the most deprived
LSOA8s in the country compared to 29 per cent in 2010. On the Rank of Extent Measure Norwich is ranked 32 out of
the 326 Local Authority Districts (with 1 being the most deprived) compared to 61 out of 326 from ID 2010. Therefore,
the Norwich local authority area, relative to other local authorities, has an increased level of deprivation having moved
from the worse 20 per cent to the worse 10 per cent of local authorities. It is the most deprived local authority in the
Eastern region on this measure.
7.1.4. The Local Concentration measure is a useful way of identifying local authority 'hot spots' i.e. the population weighted
average of the ranks of a district’s most deprived LSOAs that contain exactly 10 per cent of the district’s population. It
shows that relative to other local authorities, Norwich has an increased level of deprivation having moved from the
worse 40 per cent to the worse 30 per cent of local authorities with 31,251 residents living in the most deprived
LSOAs, up from 29,868 residents in 2010. In the Eastern region the local authority districts of Southend-on-Sea,
Tendring and Great Yarmouth are more deprived on this measure than Norwich.
7.1.5. The Average Rank and Average Score summaries identify the average level of deprivation in the local authority
area, taking into account all LSOAs in the area. The main difference is that more deprived Lower-layer Super Output
Areas tend to have more ‘extreme’ scores than ranks. So highly deprived areas will not tend to average out to the
7 The indices of deprivation are designed primarily to measure relative deprivation at the small-area LSOA level. Nevertheless, summary measures
have been produced to help users understand deprivation patterns across a set of higher geographies, namely, local district authorities, upper tier local authorities (counties), local enterprise partnerships and clinical commissioning groups 8 A Lower Layer Super Output Area (LSOA) is a geographic area designed to improve small area statistical reporting, there are 34,753 LSOAs in
England and Wales.
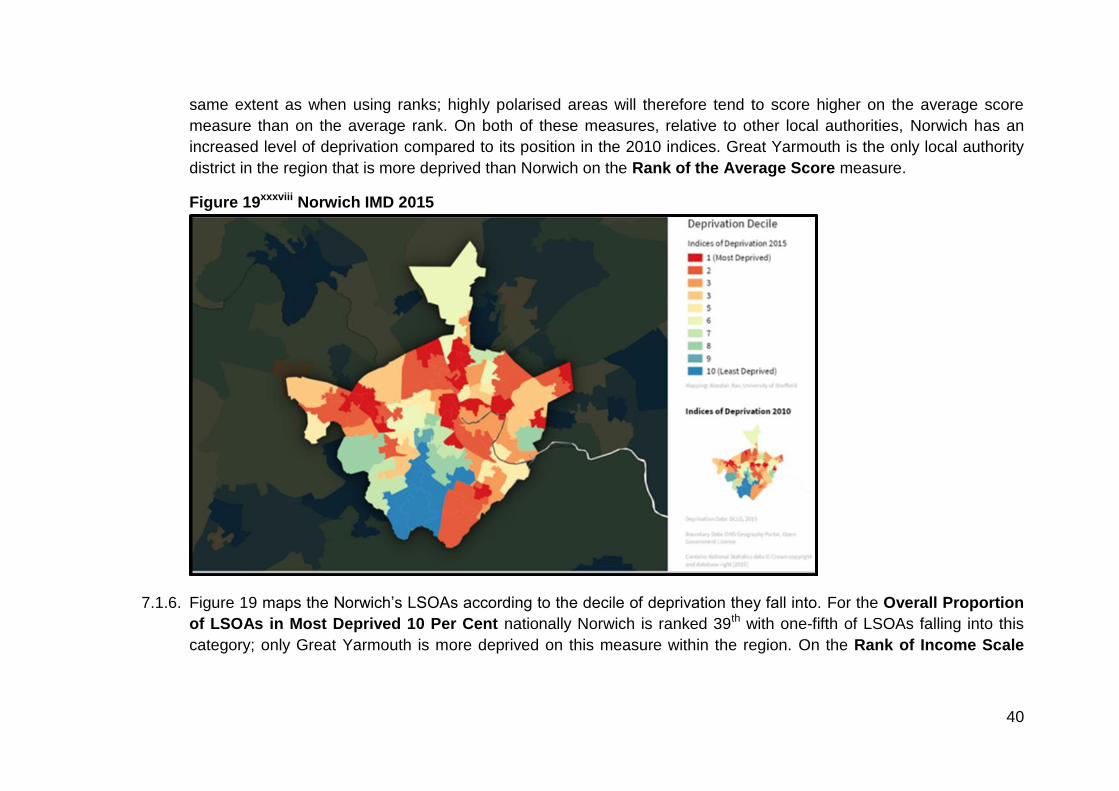
40
same extent as when using ranks; highly polarised areas will therefore tend to score higher on the average score
measure than on the average rank. On both of these measures, relative to other local authorities, Norwich has an
increased level of deprivation compared to its position in the 2010 indices. Great Yarmouth is the only local authority
district in the region that is more deprived than Norwich on the Rank of the Average Score measure.
Figure 19xxxviii Norwich IMD 2015
7.1.6. Figure 19 maps the Norwich’s LSOAs according to the decile of deprivation they fall into. For the Overall Proportion
of LSOAs in Most Deprived 10 Per Cent nationally Norwich is ranked 39th with one-fifth of LSOAs falling into this
category; only Great Yarmouth is more deprived on this measure within the region. On the Rank of Income Scale
41
Norwich’s position has remained relatively static from 2010 to 2015, falling into the worse 40% of districts in the
country on this measure. The position was the same for the Rank of Employment Scale.
7.1.7 The Education, Skills and Training Deprivation domain measures deprivation in educational attainment, skills and
training for children, young people and the working age population in a local area. The Norwich local authority area is
ranked 4th worse in the country with 36 per cent of LSOAs in the most deprived 10 per cent nationally. The wards that
the LSOAs are based in and the number of LSOAs in each are as follows: Bowthorpe (3), Catton Grove (3), Crome
(4), Lakenham (4), Mancroft (1), Mile Cross (6), Sewell (1), University (2) and (Wensum (4).
7.1.8 The Health Deprivation and Disability Deprivation domain measure shows that relative to other areas, Norwich
ranks 51st worse in the country with 18% of LSOAs falling within England’s most deprived 10 per cent based on this
domain. On the Crime domain the Norwich local authority area is ranked 94th worse in the country with almost one in
tent LSOAs in the most deprived 10 per cent nationally. This is similar to the Living Environment domain where
Norwich is ranked 90th with 11 per cent of LSOAs in the most deprived 10 per cent in England. The Norwich local
authority is relatively less deprived on the Barriers to Housing domain, with just 1 per cent of its LSOAs in the most
deprived 10 per cent in England and ranked at 244th.
7.1.9 The Income Deprivation Affecting Children Index (IDACI) is a ranking based on the percentage of children aged 0
- 15 in each LSOA living in families that are income deprived - i.e. in receipt of income support, income based
jobseeker's allowance or pension credit, or those not in receipt of these benefits but in receipt of Child Tax Credit with
an equivalised income (excluding housing benefits) below 60 per cent of the national median before housing costs.
Norwich is ranked 46th out of 326 local authorities with 17 per cent of LSOAs in the most deprived in England. Norwich
ranks 58th out of 326 local authorities on the Income Deprivation Affecting Older People Index (IDAOPI) with 13 per
cent of LSOAs in the most deprived nationally.
7.2 The English Indices of Deprivation 2015 – LSOAs
7.2.1. The overall Index of Multiple Deprivation 2015 describes each Lower-layer Super Output Area by combining
information from all seven domains: Income Deprivation, Employment Deprivation, Health Deprivation and Disability,
Education Skills and Training Deprivation, Barriers to Housing and Services, Living Environment Deprivation, and
42
Crime. Norwich has 17 LSOAs which fall into the most deprived decile of LSOAs in the country, the wards which the
LSOAs are based in and the number of LSOAs affected are as follows: Mancroft (3), Mile Cross (3), Catton Grove (2),
Crome (2), Thorpe Hamlet (2), Wensum (2), Bowthorpe (1), Lakenham (1) and Town Close (1).
7.2.2. Norwich has eight LSOAs in the most deprived 10 per cent of LSOAs in England on the rank of Income score. The
wards which the LSOAs are based in and the number of LSOAs affected are as follows: Bowthorpe (1), Crome (1),
Mancroft (2), Mile Cross (1), Thorpe Hamlet (1) and Wensum (2). On the rank of Employment scale ten LSOAs in
Norwich fall into the most deprived 10 per cent of LSOAs nationally. The wards that these LSOAs are based in and
the number of LSOAs affected are as follows: Catton Grove (1), Crome (1), Mancroft (4), Mile Cross (1), Thorpe
Hamlet (1), Town Close (1) and Wensum (1).
7.3 Claimant count
7.3.1 The Claimant Count is a measure of the number of people claiming benefits for unemployment related purposes taken
from DWP administrative sources. Currently the Claimant Count is a composite of the number of people claiming
Jobseeker’s Allowance (JSA) and those claiming Universal Credit (UC) who are required to seek work to qualify for
their benefits. Combining these two identifies all the people claiming benefit principally for the reason of being
unemployed. Many users’ interest in the Claimant Count specifically relates to its tracking of the claimants of benefits
for this purpose. However, due to the large correlation between those claiming benefits for unemployment-related
purposes and people who are unemployed, the Claimant Count is also often used as a proxy for unemployment. This
is particularly the case for smaller domains such as local geographic areas and for specific age. Due to sampling
variability, the estimates of unemployment available from other sources, such as the Labour Force Survey (LFS) and
Annual Population Survey (APS), will have high volatility for these smaller domains, which is not the case with an
administrative dataset. The Claimant Count does not measure unemployment and there are a number of ways in
which the two differ with regard to who is covered by the two measures. The effect of this is that the Claimant Count
tends to be much lower than the unemployment level. However, despite its differences from unemployment, the
Claimant Count does still have value as a proxy.
7.3.2 Figure 20 shows that the claimant count in the Norwich local authority area has fallen dramatically over the period
January 2013-2018 and at a much stronger rate (by 3.1 percentage points) than in the other reported areas (the LEP
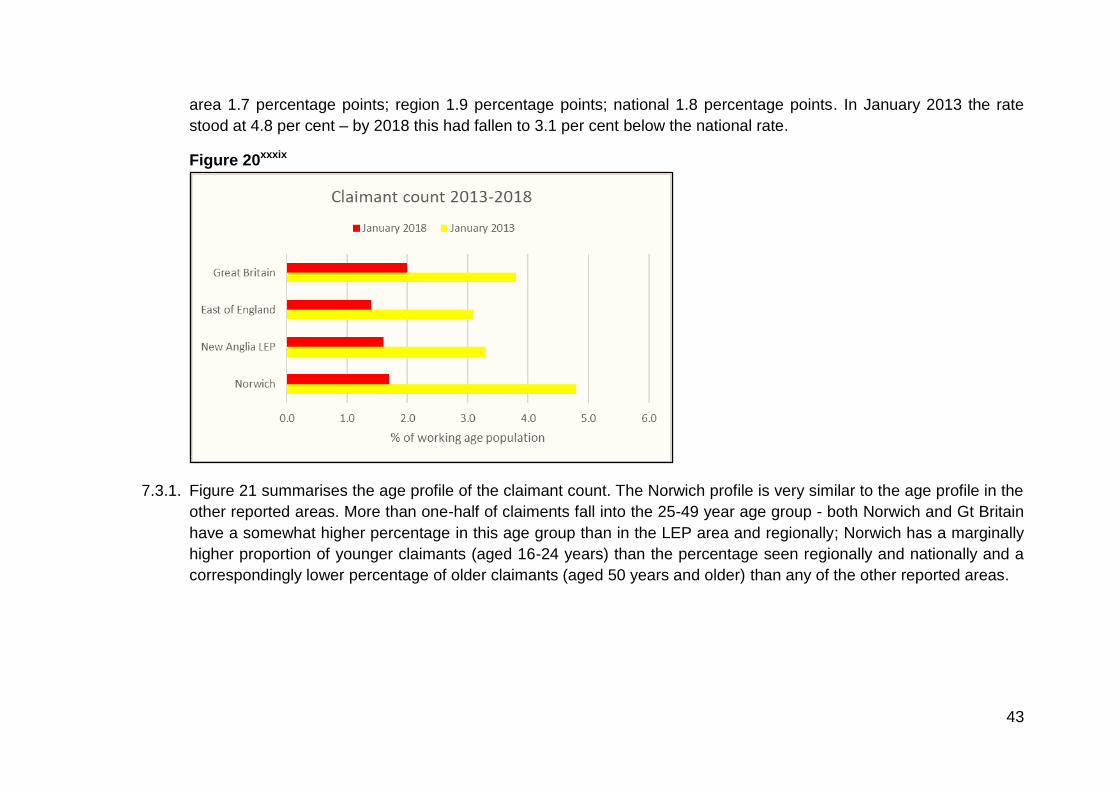
43
area 1.7 percentage points; region 1.9 percentage points; national 1.8 percentage points. In January 2013 the rate
stood at 4.8 per cent – by 2018 this had fallen to 3.1 per cent below the national rate.
Figure 20xxxix
7.3.1. Figure 21 summarises the age profile of the claimant count. The Norwich profile is very similar to the age profile in the
other reported areas. More than one-half of claiments fall into the 25-49 year age group - both Norwich and Gt Britain
have a somewhat higher percentage in this age group than in the LEP area and regionally; Norwich has a marginally
higher proportion of younger claimants (aged 16-24 years) than the percentage seen regionally and nationally and a
correspondingly lower percentage of older claimants (aged 50 years and older) than any of the other reported areas.
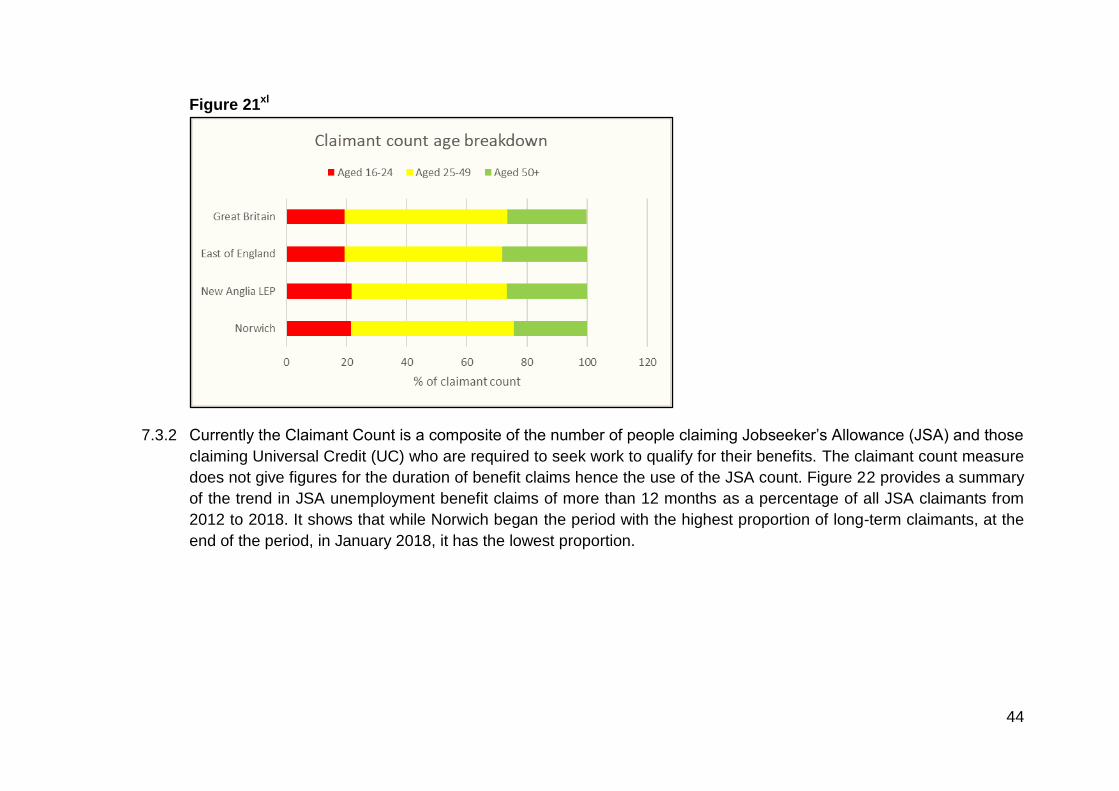
44
Figure 21xl
7.3.2 Currently the Claimant Count is a composite of the number of people claiming Jobseeker’s Allowance (JSA) and those
claiming Universal Credit (UC) who are required to seek work to qualify for their benefits. The claimant count measure
does not give figures for the duration of benefit claims hence the use of the JSA count. Figure 22 provides a summary
of the trend in JSA unemployment benefit claims of more than 12 months as a percentage of all JSA claimants from
2012 to 2018. It shows that while Norwich began the period with the highest proportion of long-term claimants, at the
end of the period, in January 2018, it has the lowest proportion.
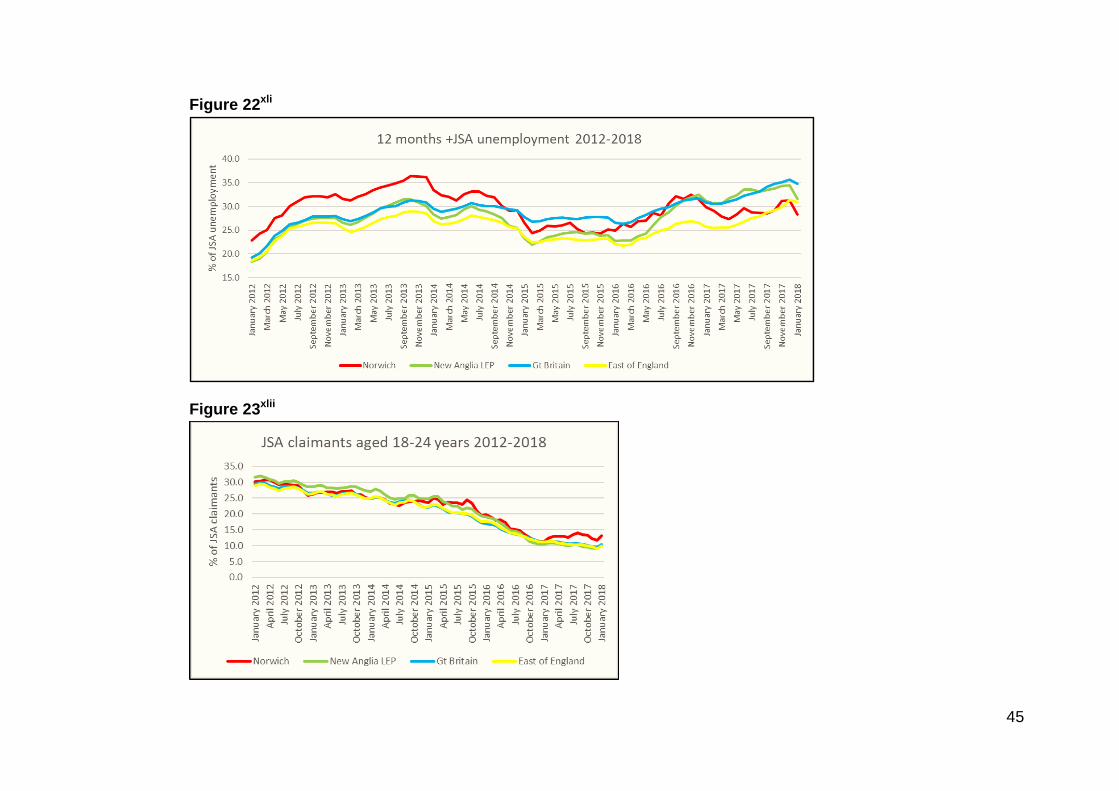
45
Figure 22xli
Figure 23xlii
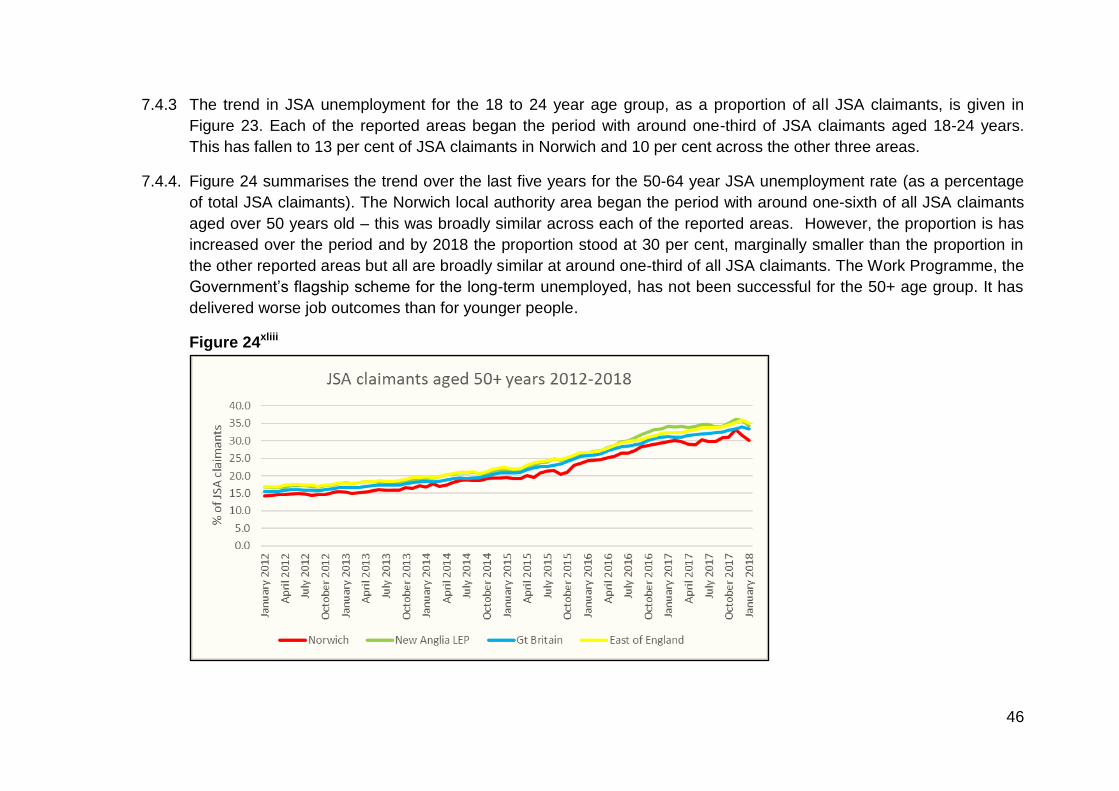
46
7.4.3 The trend in JSA unemployment for the 18 to 24 year age group, as a proportion of all JSA claimants, is given in
Figure 23. Each of the reported areas began the period with around one-third of JSA claimants aged 18-24 years.
This has fallen to 13 per cent of JSA claimants in Norwich and 10 per cent across the other three areas.
7.4.4. Figure 24 summarises the trend over the last five years for the 50-64 year JSA unemployment rate (as a percentage
of total JSA claimants). The Norwich local authority area began the period with around one-sixth of all JSA claimants
aged over 50 years old – this was broadly similar across each of the reported areas. However, the proportion is has
increased over the period and by 2018 the proportion stood at 30 per cent, marginally smaller than the proportion in
the other reported areas but all are broadly similar at around one-third of all JSA claimants. The Work Programme, the
Government’s flagship scheme for the long-term unemployed, has not been successful for the 50+ age group. It has
delivered worse job outcomes than for younger people.
Figure 24xliii
47
7.5 Measuring inequality 7.5.1 The Gini Coefficient aggregates the gaps between people's incomes into a single measure. If everyone in a group has
the same income, the Gini coefficient is 0 (perfect equality) ; if all income goes to one person, it is 1 (perfect
inequality). Norwich PUA’s Gini coefficient currently stands at 0.40 (Centre for Cities), the UK as a whole has a Gini
coefficient of 0.41. This indicates that Norwich has a similar level of inequality within its resident population as the UK
overall.
7.6 Welfare spend 7.6.1 Welfare covers a number of benefits; the largest share is spent on pensions (42 per centxliv). Total welfare spend per
capita stands at £3,258.31 in Norwich PUA (Centre for Cities 2014), the average spend for the UK as a whole is .
Welfare spend in Norwich PUA has increased by 3.38 per cent since 2010, this is likely to be caused by an increase in
the pension age population in Broadland which forms part of Norwich PUA.
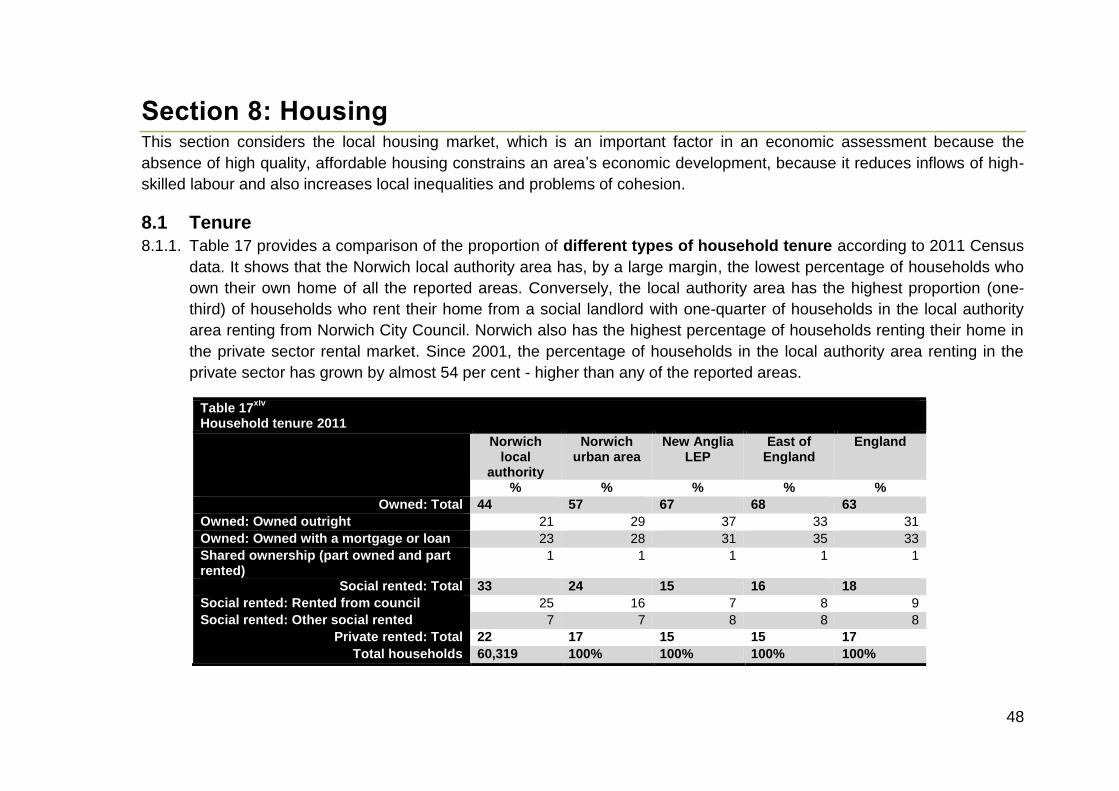
48
Section 8: Housing This section considers the local housing market, which is an important factor in an economic assessment because the
absence of high quality, affordable housing constrains an area’s economic development, because it reduces inflows of high-
skilled labour and also increases local inequalities and problems of cohesion.
8.1 Tenure
8.1.1. Table 17 provides a comparison of the proportion of different types of household tenure according to 2011 Census
data. It shows that the Norwich local authority area has, by a large margin, the lowest percentage of households who
own their own home of all the reported areas. Conversely, the local authority area has the highest proportion (one-
third) of households who rent their home from a social landlord with one-quarter of households in the local authority
area renting from Norwich City Council. Norwich also has the highest percentage of households renting their home in
the private sector rental market. Since 2001, the percentage of households in the local authority area renting in the
private sector has grown by almost 54 per cent - higher than any of the reported areas.
Table 17xlv
Household tenure 2011
Norwich local
authority
Norwich urban area
New Anglia LEP
East of England
England
% % % % %
Owned: Total 44 57 67 68 63
Owned: Owned outright 21 29 37 33 31
Owned: Owned with a mortgage or loan 23 28 31 35 33
Shared ownership (part owned and part rented)
1 1 1 1 1
Social rented: Total 33 24 15 16 18
Social rented: Rented from council 25 16 7 8 9
Social rented: Other social rented 7 7 8 8 8
Private rented: Total 22 17 15 15 17
Total households 60,319 100% 100% 100% 100%
49
8.1.2. The local authority’s relatively low level of home ownership is a cause for concern for a number of reasons. There is
a large literature on the potential benefits of home ownership most of which focuses on external benefits to the wider
community e.g. lower crime rates, social trust etc. A house is a valuable asset; high collateral values give better
access to credit and so raise consumption. Studies9 have shown that there is a strong positive correlation between
self-employment and home ownership which can provide new business collateral. Figure 16 in the labour market
section demonstrates that self-employment levels in the local authority area are indeed, lower than in urban Norwich,
the LEP area, regionally and nationally. It could be suggested that this may be linked to relatively low levels of home-
ownership.
8.1.3 Census data for household size shows that over the decade to 2011 the trend in the Norwich areas (local authority,
urban area and Greater Norwich) has been toward more people in households, particularly families. The main
household increase in the local authority area is for non-family multi person households indicating increasing numbers
of sharers especially in Houses in Multiple Occupation (HMOs).
8.2 Housing Market Area (HMA)
8.2.1. Figure 23 shows the Central Norfolk HMA identified by the Central Norfolk Strategic Housing Market Assessment
2015; the Core area of settlements with the strongest connections to the Norwich Urban Area, which is similar, but not
identical, to the Norwich Policy Area, and the Greater Norwich Growth Board area of Broadland, Norwich and South
Norfolk councils. The identification of Housing Market Areas (HMAs) is the key building block in the evidence base for
identifying the Objectively Assessed Need (OAN) for housing. The National Planning Policy Framework requires that
local planning authorities identify the OAN for housing in their areas. The OAN ascertains the future quantity of
housing that is likely to be needed (both market and affordable) in the Housing Market Area over future plan periods.
8.2.2. The SHMA concludes that the OAN for the HMA should be increased indicating an OAN for 70,483 dwellings over the
period 2012-36; an annual average of 2,937. This represents a 20 per cent increase above the demographic trends
for the area which is largely due to the impact of the additional jobs planned as part of the City Deal for Greater
Norwich. The additional dwellings will also provide more affordable housing. If the full OAN for affordable housing is to
9 http://www.twri.org.uk/sites/default/files/twri/twri_housing_wealth_small_business.pdf
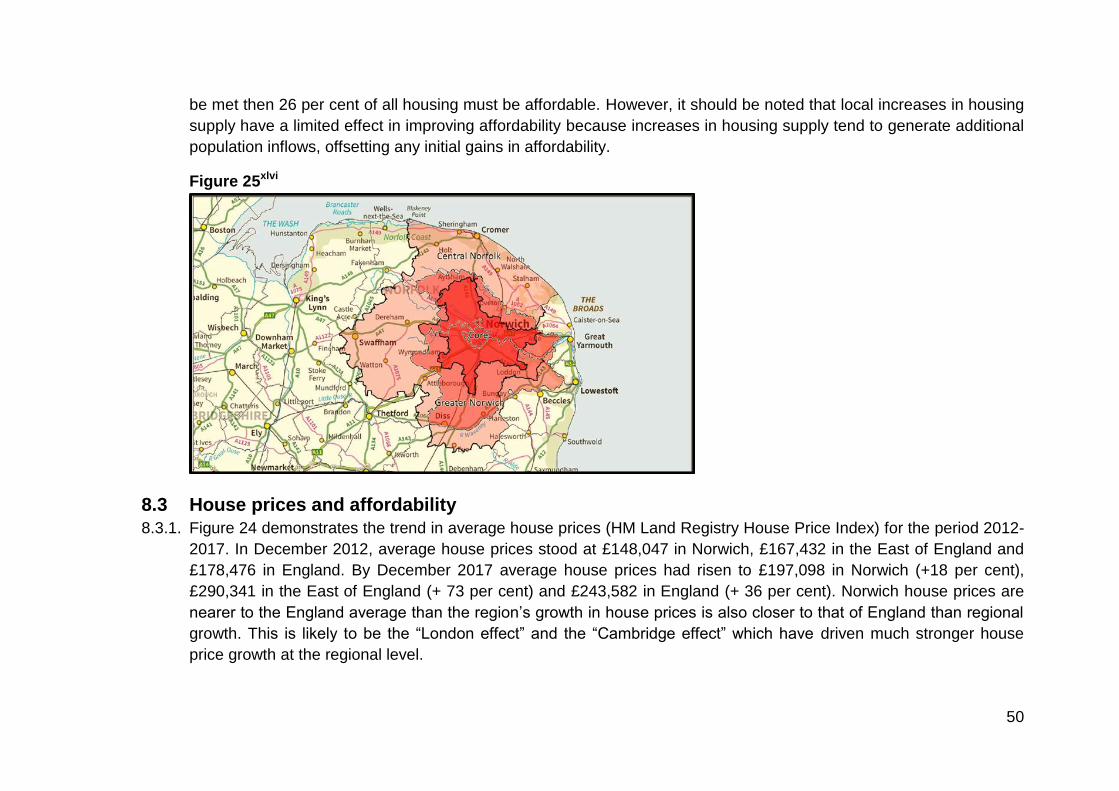
50
be met then 26 per cent of all housing must be affordable. However, it should be noted that local increases in housing
supply have a limited effect in improving affordability because increases in housing supply tend to generate additional
population inflows, offsetting any initial gains in affordability.
Figure 25xlvi
8.3 House prices and affordability
8.3.1. Figure 24 demonstrates the trend in average house prices (HM Land Registry House Price Index) for the period 2012-
2017. In December 2012, average house prices stood at £148,047 in Norwich, £167,432 in the East of England and
£178,476 in England. By December 2017 average house prices had risen to £197,098 in Norwich (+18 per cent),
£290,341 in the East of England (+ 73 per cent) and £243,582 in England (+ 36 per cent). Norwich house prices are
nearer to the England average than the region’s growth in house prices is also closer to that of England than regional
growth. This is likely to be the “London effect” and the “Cambridge effect” which have driven much stronger house
price growth at the regional level.
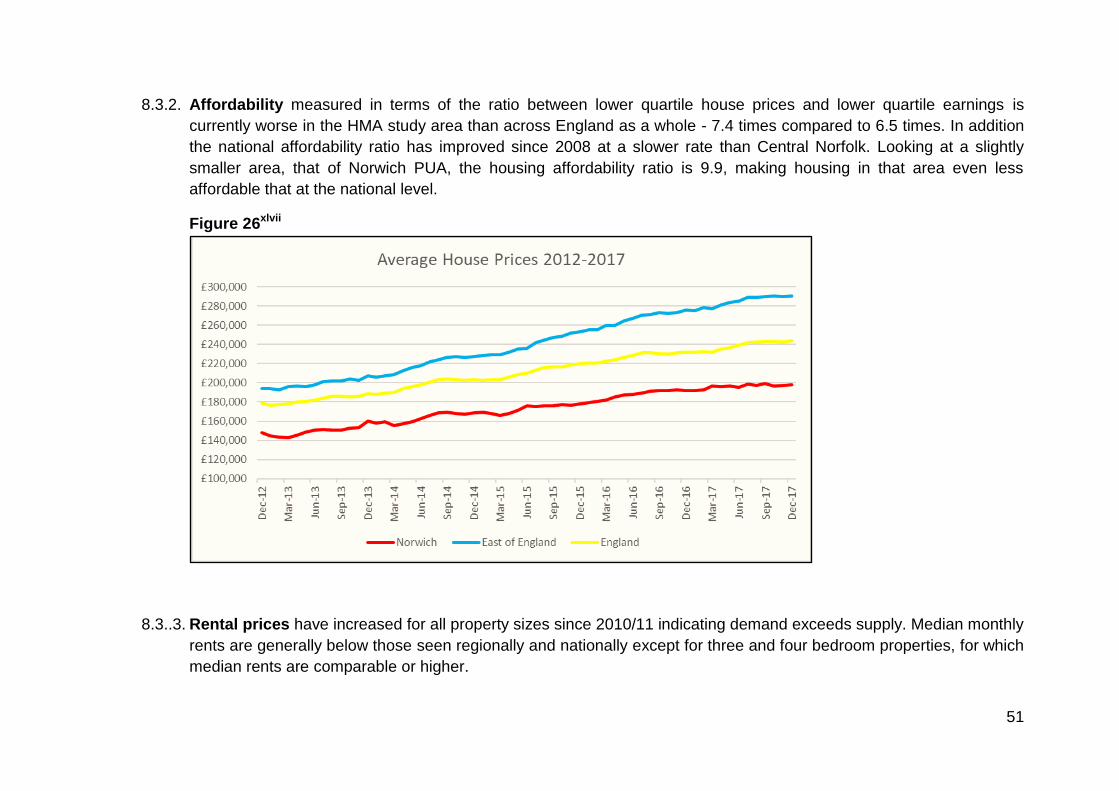
51
8.3.2. Affordability measured in terms of the ratio between lower quartile house prices and lower quartile earnings is
currently worse in the HMA study area than across England as a whole - 7.4 times compared to 6.5 times. In addition
the national affordability ratio has improved since 2008 at a slower rate than Central Norfolk. Looking at a slightly
smaller area, that of Norwich PUA, the housing affordability ratio is 9.9, making housing in that area even less
affordable that at the national level.
Figure 26xlvii
8.3..3. Rental prices have increased for all property sizes since 2010/11 indicating demand exceeds supply. Median monthly
rents are generally below those seen regionally and nationally except for three and four bedroom properties, for which
median rents are comparable or higher.
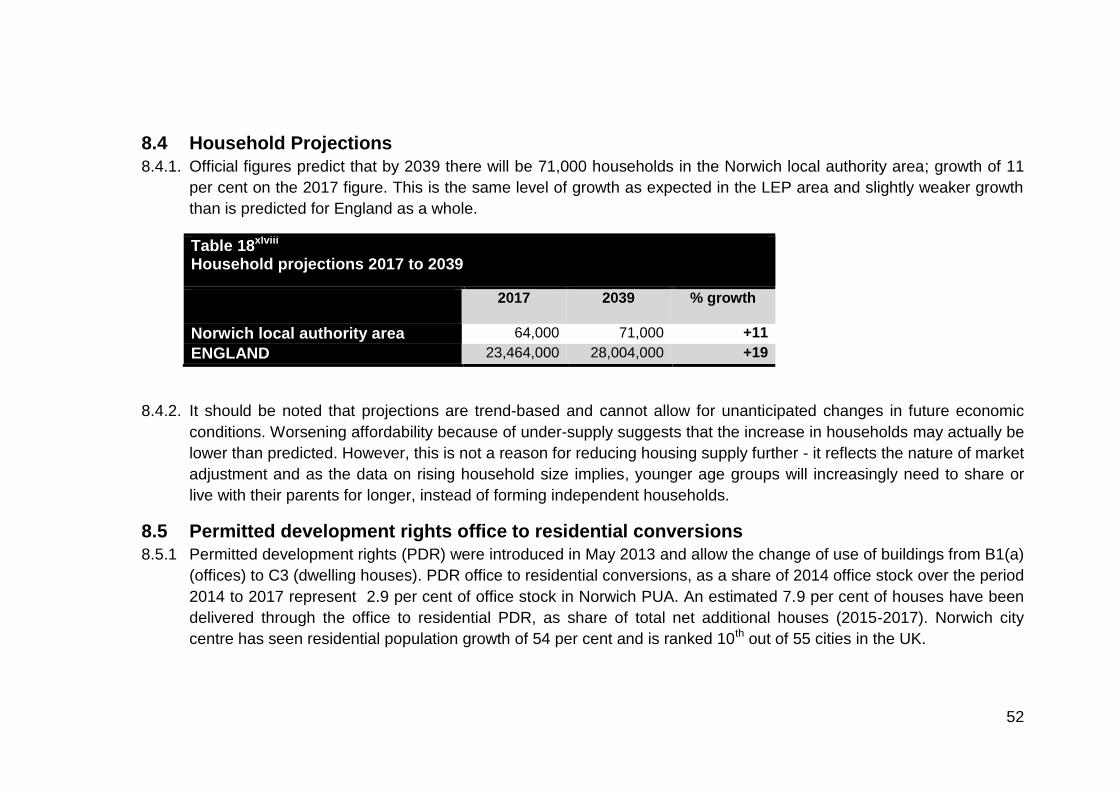
52
8.4 Household Projections
8.4.1. Official figures predict that by 2039 there will be 71,000 households in the Norwich local authority area; growth of 11
per cent on the 2017 figure. This is the same level of growth as expected in the LEP area and slightly weaker growth
than is predicted for England as a whole.
Table 18xlviii Household projections 2017 to 2039
2017 2039 % growth
Norwich local authority area 64,000 71,000 +11
ENGLAND 23,464,000 28,004,000 +19
8.4.2. It should be noted that projections are trend-based and cannot allow for unanticipated changes in future economic
conditions. Worsening affordability because of under-supply suggests that the increase in households may actually be
lower than predicted. However, this is not a reason for reducing housing supply further - it reflects the nature of market
adjustment and as the data on rising household size implies, younger age groups will increasingly need to share or
live with their parents for longer, instead of forming independent households.
8.5 Permitted development rights office to residential conversions
8.5.1 Permitted development rights (PDR) were introduced in May 2013 and allow the change of use of buildings from B1(a)
(offices) to C3 (dwelling houses). PDR office to residential conversions, as a share of 2014 office stock over the period
2014 to 2017 represent 2.9 per cent of office stock in Norwich PUA. An estimated 7.9 per cent of houses have been
delivered through the office to residential PDR, as share of total net additional houses (2015-2017). Norwich city
centre has seen residential population growth of 54 per cent and is ranked 10th out of 55 cities in the UK.

53
54
Data sources i Table 1 Source: mid-population estimates NOMIS ii Figure 1 Source: mid-population estimates NOMIS
iii Table 2 Source: Census of Population NOMIS
iv Figure 2 Source: Mid-year population estimates NOMIS
v Figure 3 Source: Migration Indicators Suite, 2016, ONS
vi Table 3 Source: Migration Indicators Suite, 2016, ONS
vii http://geotheory.co.uk/
viii Figure 4 Source: Norfolk County Council
ix Figure 5 Source: Norfolk County Council
x Figure 6 Source: Crown copyright Valuation Office Agency
xi Figure 7 Source: Crown copyright Office of National Statistics
xii Figure 8 Source: Crown copyright Valuation Office Agency
xiii Table 4 Source: UK business Counts, NOMIS
xiv Table 5 Source: UK business Counts, NOMIS
xv Table 6 Source: UK business Counts, NOMIS
xvi Figure 9 Source: UK business Counts, NOMIS
xvii Figure 10 Source: BRES, NOMIS
xviii Table 7 Source: BRES, NOMIS
xix Table 8 Source: BRES, NOMIS
xx Table 9 Source: Business Demography, ONS
xxi Table 10 Source: Business Demography, ONS
xxii Table 11 Source: UK Business Counts NOMIS
xxiii Figure 11 Source: East of England Forecasting Model (EEFM)
xxiv Figure 12 Source: East of England Forecasting Model (EEFM)
xxv http://www.ons.gov.uk/ons/rel/regional-trends/regional-economic-analysis/sub-regional-productivity--february-2015
xxvi http://www.centreforcities.org/data-tool/
xxvii Figure 13 Source: Annual Population Survey, NOMIS
xxviii Figure 14 Source: Annual Population Survey, NOMIS
xxix Table 13 Source: Annual Population Survey, NOMIS
xxx Figure 15 Source: https://public.tableau.com/profile/learning.plus.uk#! , Norfolk County Council for Norwich %
xxxi Figure 16 Source: Job density, NOMIS
xxxii Table 13 Source: Annual Population Survey, NOMIS
xxxiii Figure 17 Source: Annual Population Survey, NOMIS
xxxiv Table 14 Source: BRES, NOMIS
xxxv Figure 18 Source: Annual Population Survey, NOMIS
55
xxxvi
Table 15 Annual Survey Pay and Earnings 2017 NOMIS xxxvii
Table 16 Source: Department for Communities and Local Government xxxviii
Figure 19 Source: Oxford Consultants for Social Inclusion xxxix
Figure 20 Source: DWP benefits, NOMIS xl Figure 21 Source: JSA claimant count, NOMIS
xli Figure 22 Source: JSA claimant count, NOMIS
xlii Figure 23 Source: JSA claimant count, NOMIS
xliii Figure 24 Source: JSA claimant count, NOMIS
xliv https://www.ons.gov.uk/economy/governmentpublicsectorandtaxes/publicsectorfinance/articles/howisthewelfarebudgetspent/2016-03-16
xlv Table 17 Source: 2011 Census, NOMIS
xlvi Figure 25 Source: Central Norfolk Strategic Housing Market Assessment 2015, Opinion Research Services
xlvii Figure 26 Source: HM Land Registry, House Price Index, Crown copyright
xlviii Table 18 Source: ONS 2014-based household projections live tables