Embed Size (px)
Citation preview
Northwestern Hawaiian Islands/Kure Atoll
Assessment and Monitoring Program
Final Report
March 2002
Grant Number NA070A0457
William j. Walsh1, Ryan Okano2, Robert Nishimoto1, Brent Carman1.
1 Division of Aquatic Resources
1151 Punchbowl Street Rm. 330
Honolulu, HI 96813
2 Botany Department
University of Hawai`i MǕnoa
Honolulu, HI 96822
2
INTRODUCTION
The Northwest Hawaiian Islands (NWHI) consist of 9,124 km2 of land and approximately
13,000 km2 of coral reef habitat. They comprise 70% of all coral reef areas under U.S.
jurisdiction. This isolated archipelago of small islands, atolls, reefs and banks represent
a unique and largely pristine coral reef ecosystem. The islands support millions of
nesting seabirds and are breeding grounds for the critically endangered Hawaiian monk
seal and threatened green sea turtle. The reefs include a wide range of habitats and
support a diverse assemblage of indigenous and endemic reef species, many of which
have yet to be described.
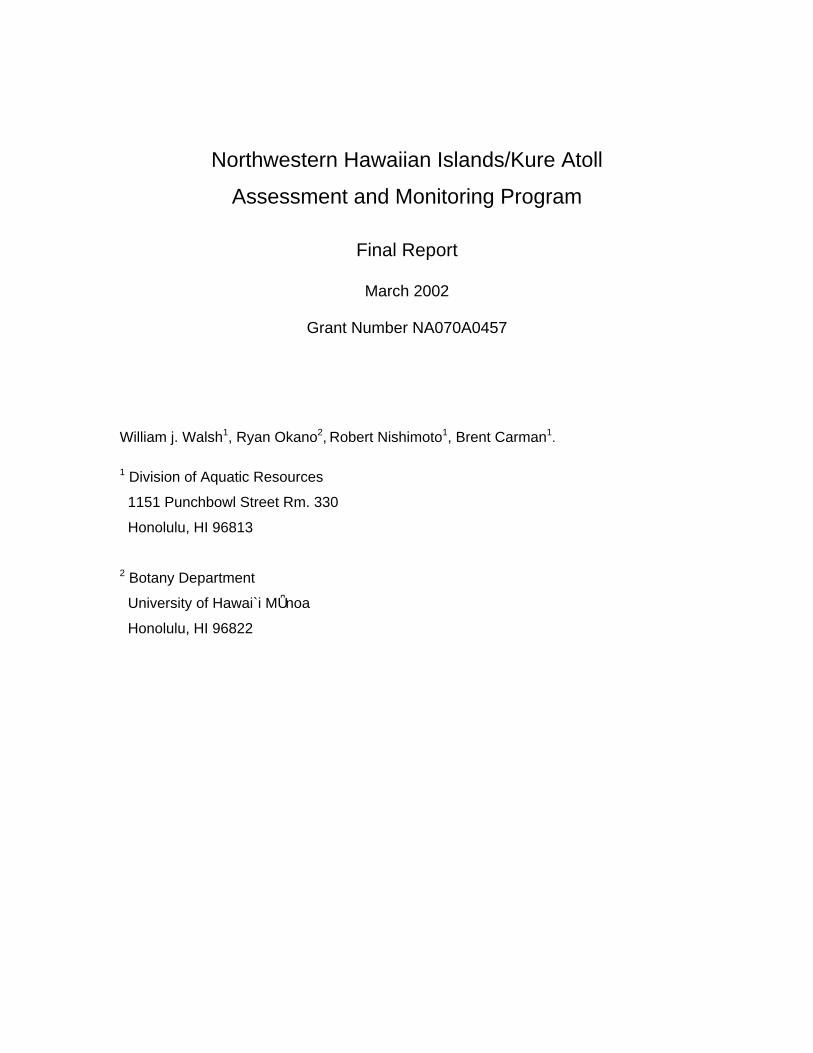
Kure Atoll, located at the northwestern end of the NWHI chain (approximately 28º 25’ N
latitude and 178º 20’ W longitude) is the northernmost atoll in the world. The atoll is
located 91 km northwest of Midway Islands and nearly 1,958 km northwest of Honolulu.
It is a nearly circular atoll with a diameter of 10 km (6mi). The outer reef is continuous
Figure 1. IKONOS satellite image of Kure Atoll
3
and almost encircles the atoll’s lagoon except for passages to the southwest (Fig. 1). An
emergent rock ledge consisting primarily of coralline algae and algally bound and
encrusted coral is present along some sections of the reef crest. C-14 dating of this
ledge indicates a present age of 1,510 ± 250 yrs. (Gross et al., 1969).
The interior of the atoll consists of a large sediment-built lagoon terrace with a maximum
depth of 14 m. A series of elongate patch reefs of undetermined origin are located in
the deeper section of the lagoon. The highest point of the atoll (6.1m) is on Green
Island, the largest and most permanent land mass. It is located in the southeast sector
and houses a Hawai`i Department of Land and Natural Resources (DLNR) field station.
To the west of Green Island are a number of small sandbars collectively known as Sand
Island. These sandbars may seasonally vary in size, shape and number.
Several agencies have management responsibility over the marine resources of the
NWHI. The U.S. Fish and Wildlife Service administers two National Wildlife Refuges
that protect all islands (excluding Kure), all reef areas at Midway, and all other reef areas
to a depth of 10 fathoms. The National Marine Fisheries Service is responsible for
monitoring and protecting monk seals and other marine mammals as well as sea turtles
and fisheries resources within the U.S. Exclusive Economic Zone (EEZ). The State of
Hawai`i Department of Land and Natural Resources (DLNR), Division of Aquatic
Resources (DAR) has management responsibility for all marine resources out to 3 nm
from all emergent lands, with the exception of Midway.
Kure Atoll is a state wildlife refuge under the jurisdiction of the Hawai`i Division of
Forestry and Wildlife (DOFAW), DLNR. Although it is not part of the Hawaiian Island
National Wildlife Refuge (HINWR), jurisdiction of the U.S. Fish and Wildlife Service and
the National Marine Fisheries Service applies for the purposes of enforcing the Marine
Mammal Protection and Endangered Species Acts. Additionally, waters and
submerged lands from the seaward boundary of Hawai`i state waters out to a mean
depth of 100 fathoms are designated as a Reserve Preservation Area within the
Northwestern Hawaiian Islands Coral Reef Ecosystem Reserve.
Despite the actual and potential importance of the NWHI for biodiversity conservation,
commercial and recreational fisheries as well as eco-tourism, its immense size and
remoteness have challenged scientific observation, data gathering and effective
4
management of this coral reef ecosystem. There is further concern that the islands and
reefs have been degraded from the accumulation of derelict fishing gear which
physically destroys reefs, entangles reef fauna and poses a risk of introducing alien
species. Ship groundings have also impacted reef habitats by spilling fuel and scattering
debris. An increased interest for access to the area by eco-tourism companies and
proposals to develop additional coral reef fisheries such as bio-prospecting, marine
ornamentals and precious corals have raised awareness by management agencies of
the need to better assess and monitor this unique reef ecosystem. More comprehensive
data is clearly needed for effective management and preservation.
Kure Atoll by virtue of its small size, northern-most location, and proximity to Midway
(with potential charter boat and support facilities), may be particularly vulnerable to
anthropogenic impact and ecosystem degradation. The State of Hawai`i also has
primary management oversight for the reef resources within and around the Atoll. It is
these factors which have prompted the current assessment and monitoring efforts.
The primary goal of this project was to characterize and document the shallow water
community of Kure Atoll focusing primarily on back reef areas. This work is an initial
description of these areas and serves as a baseline for future monitoring efforts.
Specific objectives of this project were to:
ü Characterize benthic habitats by estimating abundance and percent cover of important components including coral, coralline algae and macro algae.
ü Describe the diversity and distribution of macro invertebrates. ü Describe the diversity, distribution and size composition of fishes. ü Describe the diversity and distribution of recently recruited fishes. ü Compile comprehensive species lists for fishes, corals and macroalgae ü Collect algal voucher specimens of all alien species, rare species, new records
or new species.ü Attempt to locate recruitment habitats for larger apex predators particularly
carangids.ü Conduct reconnaissance for the presence of alien species and derelict fishing
gear.ü Collect fish specimens for genetic analysis. ü Deploy temperature data loggers.
5
Previous Marine Research in Kure waters The earliest known study focusing on marine resources at Kure is by Gross et al. (1969)
which provides a preliminary report on the geology of the atoll and a short discussion of
its marine organisms and related environmental factors. Thomas F. Dana reported on
the corals of Kure (Dana, 1971) as a result of field work with the Scripps Institution of
Oceanography’s 1968 STYX expedition and its 1969 Pacific Ocean Biological Survey
Program (POBSP). Hobson and Chess (1979) investigated nocturnally emerging
zooplankton from the lagoon floors of Kure and Midway.
Two major multi-agency research investigations focusing on marine resources have
been conducted at Kure Atoll. The first, known as the Tripartite Cooperative Agreement, involved researchers from the National Marine Fisheries Service, The U.S.
Fish and Wildlife Service, and what was then known as the Division of Fish and Game
(now Division of Aquatic Resources). This project commenced in 1975 and continued
for five years. Research efforts were wide ranging, encompassing onshore (turtles,
seals, seabirds), nearshore (reefishes, ciguatera, lobsters) and offshore (plankton,
bottomfishes, pelagics) resources.
A second research expedition was undertaken during September and October 2000.
The Northwestern Hawaiian Islands Reef Assessment and Monitoring Program (NOW-RAMP) involved fifty scientists aboard two vessels. The primary object of this
project was to conduct Rapid Ecological Assessments (REAs) of the Northwest
Hawaiian Islands (NWHI) with the goal of acquiring adequate information to map, assess
and eventually monitor and manage this unique coral reef ecosystem. The program
encompassed a number of specific initiatives including:
¶ Inventory and assessment of benthos ¶ Fish and fisheries assessment ¶ Marine algal sampling and assessment ¶ Lagoon sediment and contaminants sampling ¶ Marine debris assessment and monitoring ¶ Mapping and remote sensing ¶ Hyperspectral sensing and imaging
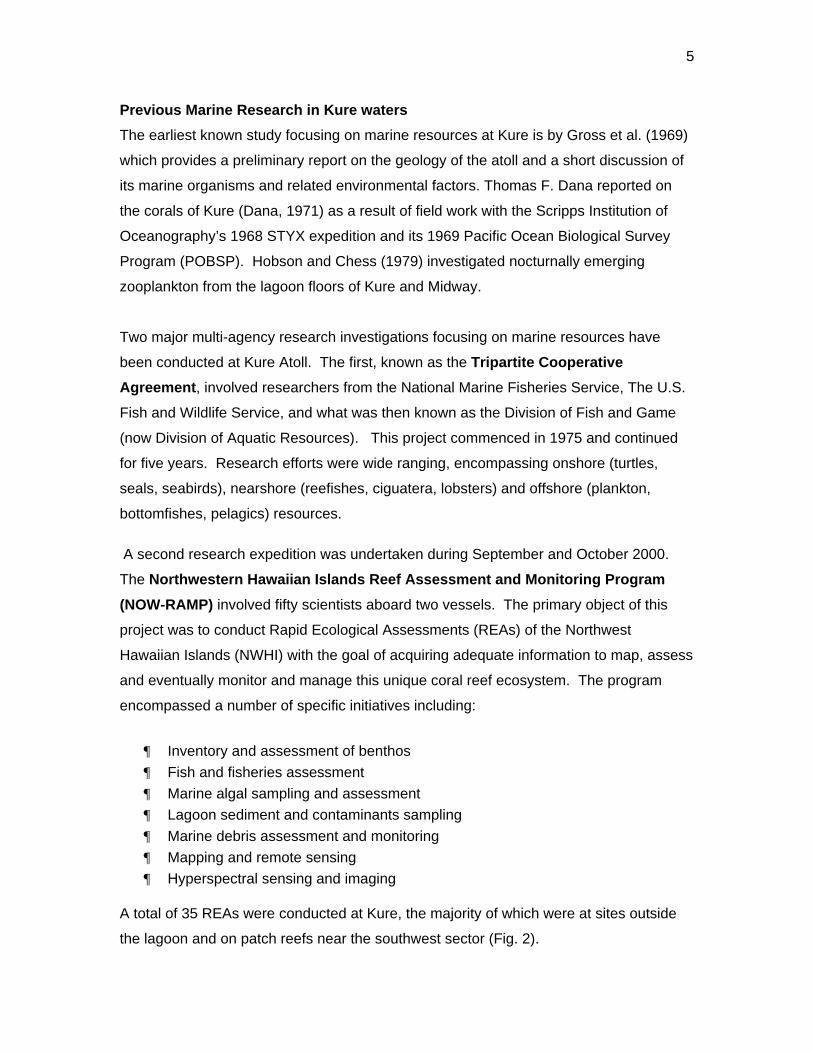
A total of 35 REAs were conducted at Kure, the majority of which were at sites outside
the lagoon and on patch reefs near the southwest sector (Fig. 2).
6
Figure 2. Kure Atoll NOW-RAMP REA sites - October 2000.
The site descriptions are included in Appendix 1. SCUBA was used for all REAs. The
data from the NOW-RAMP program is presently under analysis.
DAR Kure 2001 In September 2001, the Division of Aquatic Resources initiated the first of what is
anticipated to be regular field expeditions to Kure Atoll. The overall objectives of this
long-term project are to further our understanding of the atoll’s ecosystem and to
increase the capacity and ability of DAR to monitor, assess and effectively manage the
Atoll’s marine resources.
Personnel from DAR (5), DOFAW (1) and the University of Hawai`i MǕnoa (1) conducted
field operations at Kure Atoll during the first two weeks of September. The focus of this
expedition was to investigate shallow reef areas on the lagoon side of the reef crest and
along the beaches adjacent to the islands. Previous NOW-RAMP REAs were conducted
mostly in deeper SCUBA diving depths and shallow water environments were largely
ignored. These shallower habitats are often important nursery areas in the main
Hawaiian Islands for a number of species including carangids. Observations from the
7
earlier NOW-RAMP expedition indicated that some predatory species such as giant ulua
(Caranx ignobilis), and `Ǿmilu (Caranx melampygus), were larger and considerably more
abundant overall than on reefs of the main Hawaiian Islands. Juvenile and small
immature members of these species were scarce however, even though efforts were
specifically made to locate them. Their virtual absence may be due to insufficient
sampling or alternatively they may, in fact, be extremely scarce. If the latter is the case
these seemingly robust populations of large predators may have an atypical, top heavy
size distribution and therefore be extremely vulnerable to fishing pressure. Logistical
constraints which precluded the use of SCUBA further directed the emphasis of the DAR
Kure 2001 work to focus on assessing shallow (1-3m) habitats that had not been
adequately investigated at any NWHI site.
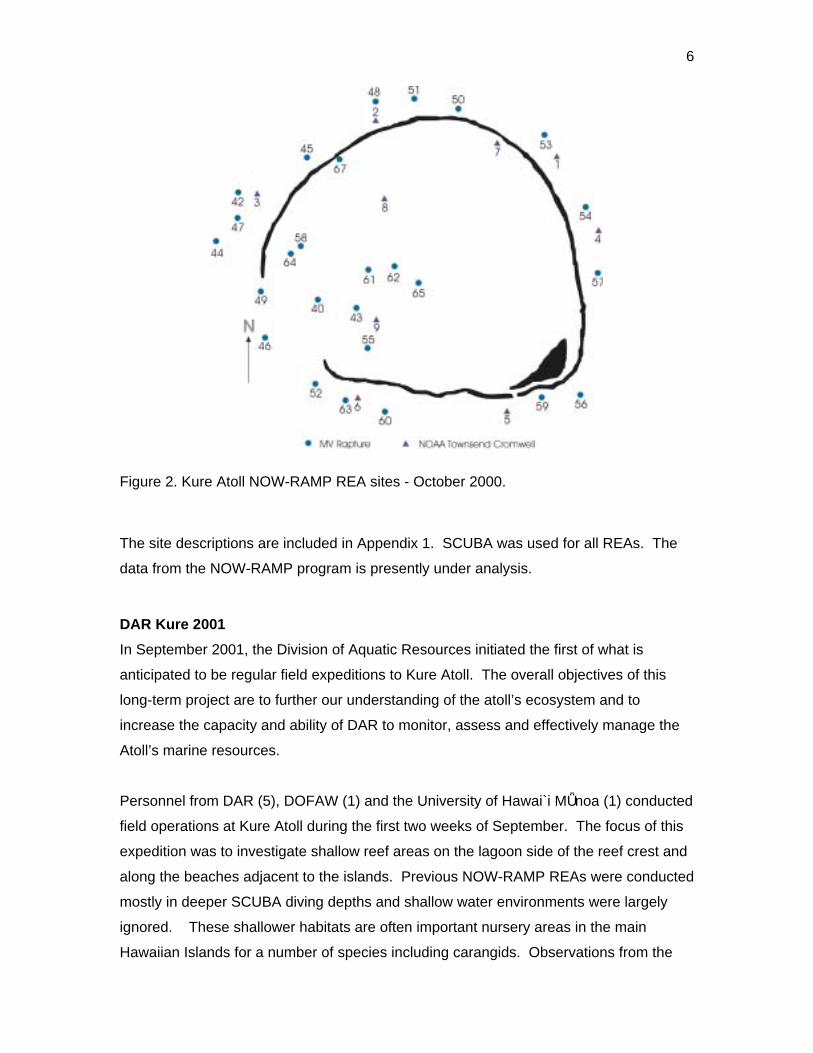
REAs were conducted at 0.5 mi (0.8 km) intervals along the back reef just inside the reef
crest, at three sites within the lagoon, and at a site adjacent to Green Island. A total of
28 sites were surveyed (Appendix 2). All sites were shallow (2-6 ft./0.6-1.8m) and were
surveyed by snorkeling. In addition to the REAs, 3 reconnaissance snorkels were
undertaken along the east and west sides of Green Island (Fig. 3).
METHODOLOGY
The REA methodology employed was compatible with that used during the NOW-RAMP
expedition and ongoing surveys at other NWHI islands. Only snorkeling was done on
this project however. The methodology consists of five primary elements:
1. Belt Transects for fishes:
The transecting method for fishes involves deploying a reeled 25m line from an initial
haphazardly selected starting point. One of a pair of free divers swims a chosen bearing
(parallel to reef or shore orientation) while unreeling the line. A second swims along side
at least 2m away. As they swim, each diver visually estimates a corridor 2m wide by 4m
high and records size specific counts (to the nearest 5cm) of all fishes >25cm TL. Upon
reaching the end of the line the reel is affixed to the bottom and the divers commence to
census fishes back to the starting point. On the return leg only fishes <25 cm TL are
8
Figure 3. DAR Kure 2001 study sites. Lines along Green Island are recon snorkels.
recorded and they are grouped into 5cm bins based on Total Length (i.e. 1-5cm=”A”, 6-
10cm=”B”, 11-15cm=”C”, etc. or classified as “recruits” or “juveniles” based on
preestablished size limits. Recruits are fishes considered to have settled on the reefs
within the past several weeks. Juveniles are those whose larger size presumably
indicates earlier settlement but still within the present season. Together these two
groups constitute the young of the year (YOY).
The fish transects at each site consisted of two adjacent 25m segments providing a total
coverage per site of 200m2. These data were used to estimate numerical and biomass
densities and contributed to describing relative abundances (sensum DACOR) of the fish
assemblage. In most instances density estimates are presented relative to a standard
area of 100m2.
2. DACOR for fishes:
Relative abundances of fishes in the general area of transects was determined by a free
swim inspection after the belt transects were completed. Three snorkelers swam
9
independently in areas adjacent to transects while recording the presence of additional
species and noting relative abundances. The area was surveyed over a 25-30 minute
period and typically encompassed at least 50m X 100m (5000m2). Species were
subsequently classified into the following relative abundance categories: Dominant
(>100), Abundant (50-100), Common (11-49), Occasional (6-10), and Rare (1-5).
3. Belt Transects for Invertebrates:
Using a single pass along the two lines deployed for the fish transects a pair of divers
censused 27 taxa of macro-invertebrates. Total area censused was 2 X 100m2.
Echinoderms (12 spp.) and Molluscs (9 spp.) were given particular emphasis due both to
their censusability and for comparison with similar work done on the Big Island by DAR
and the University of Hawai`i Hilo QUEST program (Quantitative Underwater Ecological
Surveying Techniques).
4. Macroalgae:
Quantitative and qualitative algal data were collected at each site. To quantify
macroalgal abundance by species, a 0.25 m2 quadrat with 49 evenly spaced intersects
(7 lines X 7 lines) was placed along each of the two transects at 5m intervals (n=10
placements/site.) Twenty of the 49 intersect points were randomly selected for analysis.
When the quadrat was placed on the reef whatever was under these 20 intersects was
determined and recorded. A total of 200 points were thus determined per site and since
there were 28 study sites, a total of 5600 points were determined for the entire atoll.
Qualitative information on algae was obtained by observations along transects as well in
the surrounding areas. These adjacent areas were typically smaller than those covered
for fish DACOR. Algae that could be visually identified in the field were listed during the
snorkel. Voucher specimens of turf algae and other algae that could not be identified in
the field were collected to verify species identity. Every species of algae encountered at
a site was either listed or collected
5. Benthic Characterization:
Digital videography methods developed in cooperation with the Hawai`i Coral Reef
10
Assessment and Monitoring Program (CRAMP) was used to estimate substratum
abundance, diversity and distribution. A miniDV camcorder (Sony PC 100 - 1.07 mega
pixels) in an underwater housing was held 0.5m off and perpendicular to the bottom.
The diver-videographer snorkeled at a steady pace so as to cover the 25m line in
approximately 8 minutes. Only the second of the two deployed transect lines at each
site was videotaped for subsequent analysis. Due to technical difficulties, sites # 15 &
16 were not videotaped and thus not analyzed by this method.
PointCount 99 software was utilized for this analysis. Fifty randomly selected points on
each of twenty randomly selected frames was employed to characterize the bottom.
Due to the fact that a coral biologist was not on the expedition, most coral species
identifications were subsequently made by examining the video images.
Coral abundance was also qualitatively documented through use of the DACOR method.
Percent coverage for each species was based on a combination of colony size and
number of colonies encountered along the transect. Species were classified as being
Dominant (>50% coverage), Abundant (26%-50%), Common (6%-25%), Occasional
(%1-5%), or Rare (<1%).
6. Genetic Analysis:
In addition to the REAs and reconnaissance snorkels, tissue samples (gill arches) were
collected from 96 speared specimens of three fish species for genetic analysis
(Microsatellite DNA). This was part of a project to determine gene flow within the
Hawaiian archipelago. The species sampled were the endemic pelagic spawner
(Thalassoma duperrey), a nonendemic pelagic spawner (Acanthurus triostegus) and a
nonendemic demersal spawner (Stegastes fasciolatus). These specimens will be
compared with specimens collected from Kaua`i, O`ahu, and the Big Island. This work
will be completed later this year.
11
RESULTS & DISCUSSION
Algae
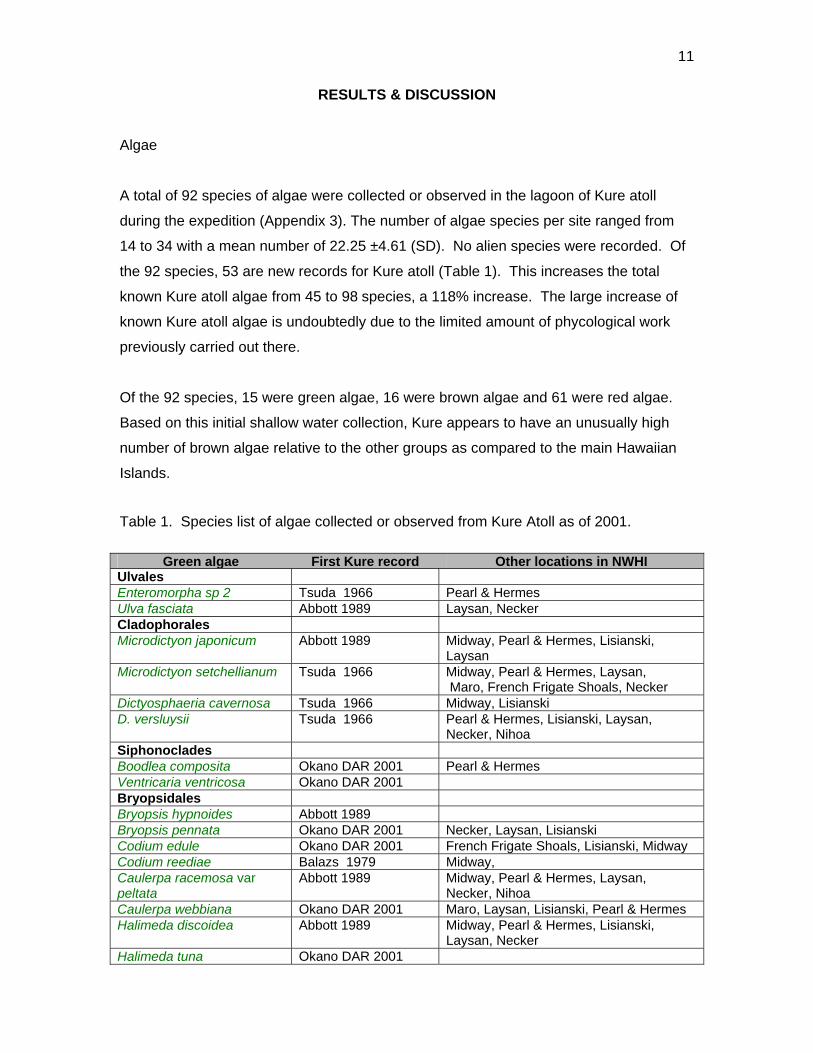
A total of 92 species of algae were collected or observed in the lagoon of Kure atoll
during the expedition (Appendix 3). The number of algae species per site ranged from
14 to 34 with a mean number of 22.25 ±4.61 (SD). No alien species were recorded. Of
the 92 species, 53 are new records for Kure atoll (Table 1). This increases the total
known Kure atoll algae from 45 to 98 species, a 118% increase. The large increase of
known Kure atoll algae is undoubtedly due to the limited amount of phycological work
previously carried out there.
Of the 92 species, 15 were green algae, 16 were brown algae and 61 were red algae.
Based on this initial shallow water collection, Kure appears to have an unusually high
number of brown algae relative to the other groups as compared to the main Hawaiian
Islands.
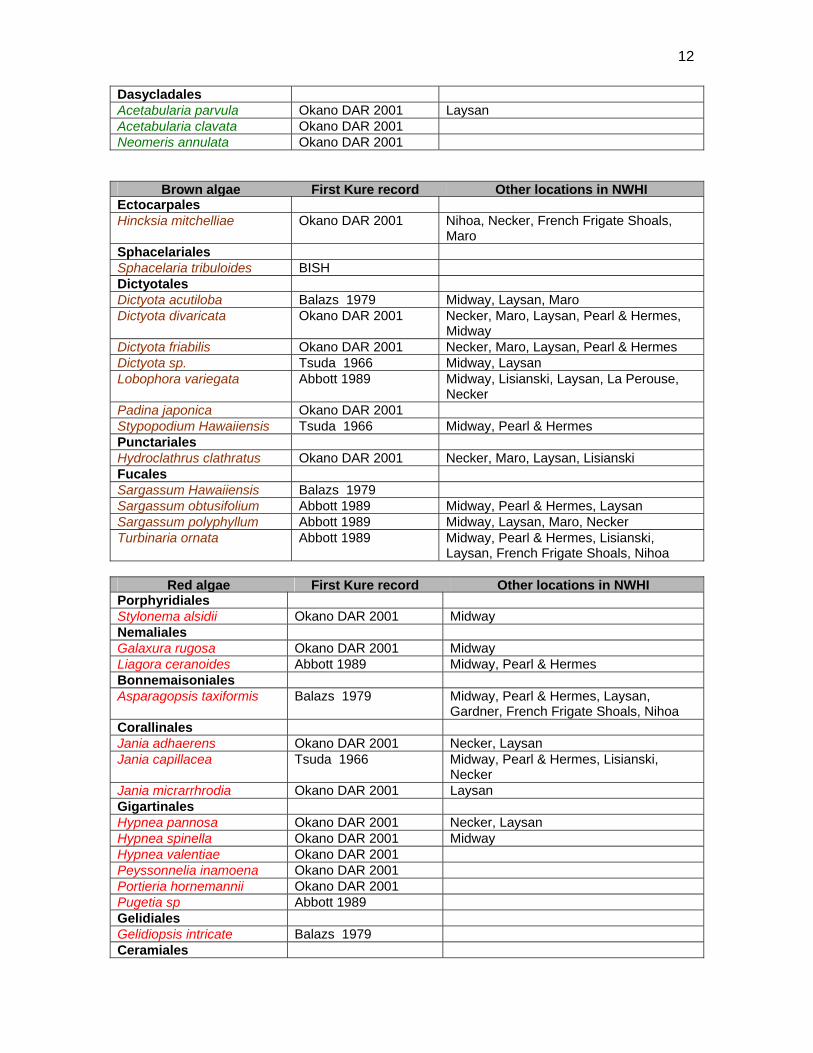
Table 1. Species list of algae collected or observed from Kure Atoll as of 2001.
Green algae First Kure record Other locations in NWHI Ulvales Enteromorpha sp 2 Tsuda 1966 Pearl & Hermes Ulva fasciata Abbott 1989 Laysan, Necker Cladophorales Microdictyon japonicum Abbott 1989 Midway, Pearl & Hermes, Lisianski,
Laysan Microdictyon setchellianum Tsuda 1966 Midway, Pearl & Hermes, Laysan,
Maro, French Frigate Shoals, Necker Dictyosphaeria cavernosa Tsuda 1966 Midway, Lisianski D. versluysii Tsuda 1966 Pearl & Hermes, Lisianski, Laysan,
Necker, Nihoa Siphonoclades Boodlea composita Okano DAR 2001 Pearl & Hermes Ventricaria ventricosa Okano DAR 2001 Bryopsidales Bryopsis hypnoides Abbott 1989 Bryopsis pennata Okano DAR 2001 Necker, Laysan, Lisianski Codium edule Okano DAR 2001 French Frigate Shoals, Lisianski, Midway Codium reediae Balazs 1979 Midway, Caulerpa racemosa var peltata
Abbott 1989 Midway, Pearl & Hermes, Laysan, Necker, Nihoa
Caulerpa webbiana Okano DAR 2001 Maro, Laysan, Lisianski, Pearl & Hermes Halimeda discoidea Abbott 1989 Midway, Pearl & Hermes, Lisianski,
Laysan, Necker Halimeda tuna Okano DAR 2001
12
Dasycladales Acetabularia parvula Okano DAR 2001 Laysan Acetabularia clavata Okano DAR 2001 Neomeris annulata Okano DAR 2001
Brown algae First Kure record Other locations in NWHI Ectocarpales Hincksia mitchelliae Okano DAR 2001 Nihoa, Necker, French Frigate Shoals,
MaroSphacelariales Sphacelaria tribuloides BISH Dictyotales Dictyota acutiloba Balazs 1979 Midway, Laysan, Maro Dictyota divaricata Okano DAR 2001 Necker, Maro, Laysan, Pearl & Hermes,
MidwayDictyota friabilis Okano DAR 2001 Necker, Maro, Laysan, Pearl & Hermes Dictyota sp. Tsuda 1966 Midway, Laysan Lobophora variegata Abbott 1989 Midway, Lisianski, Laysan, La Perouse,
Necker Padina japonica Okano DAR 2001 Stypopodium Hawaiiensis Tsuda 1966 Midway, Pearl & Hermes Punctariales Hydroclathrus clathratus Okano DAR 2001 Necker, Maro, Laysan, Lisianski FucalesSargassum Hawaiiensis Balazs 1979 Sargassum obtusifolium Abbott 1989 Midway, Pearl & Hermes, Laysan Sargassum polyphyllum Abbott 1989 Midway, Laysan, Maro, Necker Turbinaria ornata Abbott 1989 Midway, Pearl & Hermes, Lisianski,
Laysan, French Frigate Shoals, Nihoa
Red algae First Kure record Other locations in NWHI Porphyridiales Stylonema alsidii Okano DAR 2001 Midway NemalialesGalaxura rugosa Okano DAR 2001 Midway Liagora ceranoides Abbott 1989 Midway, Pearl & Hermes Bonnemaisoniales Asparagopsis taxiformis Balazs 1979 Midway, Pearl & Hermes, Laysan,
Gardner, French Frigate Shoals, Nihoa CorallinalesJania adhaerens Okano DAR 2001 Necker, Laysan Jania capillacea Tsuda 1966 Midway, Pearl & Hermes, Lisianski,
Necker Jania micrarrhrodia Okano DAR 2001 Laysan Gigartinales Hypnea pannosa Okano DAR 2001 Necker, Laysan Hypnea spinella Okano DAR 2001 Midway Hypnea valentiae Okano DAR 2001 Peyssonnelia inamoena Okano DAR 2001 Portieria hornemannii Okano DAR 2001 Pugetia sp Abbott 1989 GelidialesGelidiopsis intricate Balazs 1979 Ceramiales
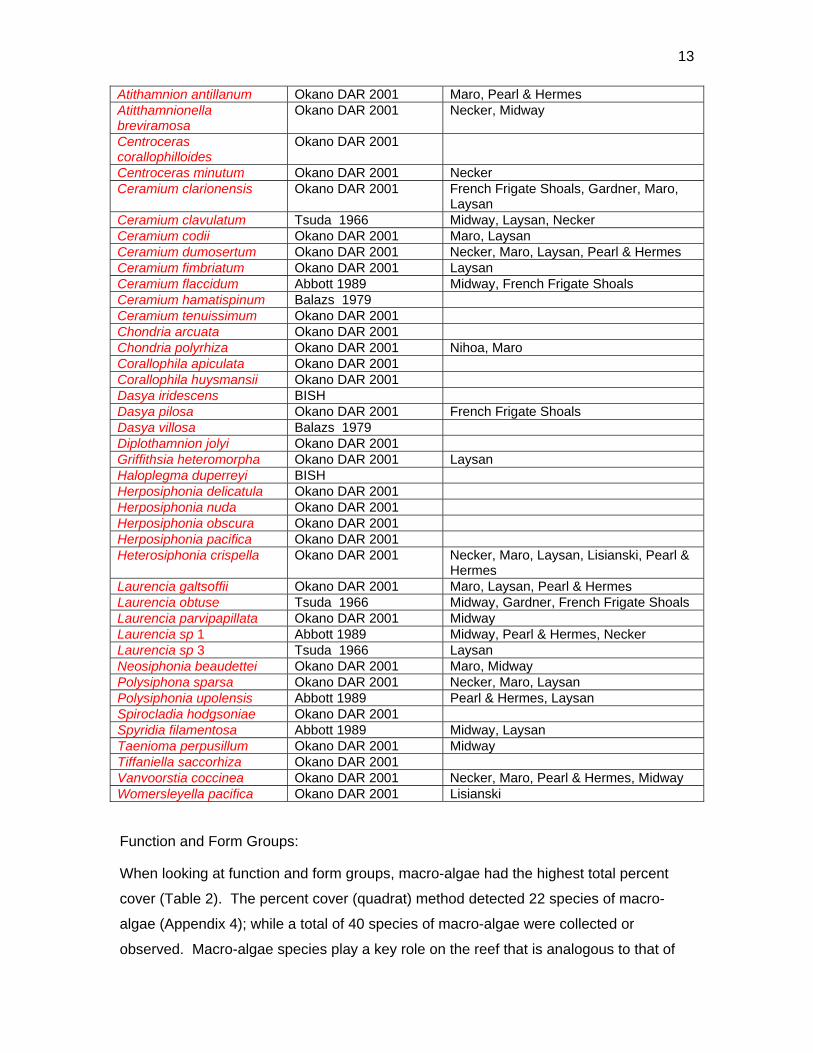
13
Atithamnion antillanum Okano DAR 2001 Maro, Pearl & Hermes Atitthamnionella breviramosa
Okano DAR 2001 Necker, Midway
Centroceras corallophilloides
Okano DAR 2001
Centroceras minutum Okano DAR 2001 Necker Ceramium clarionensis Okano DAR 2001 French Frigate Shoals, Gardner, Maro,
Laysan Ceramium clavulatum Tsuda 1966 Midway, Laysan, Necker Ceramium codii Okano DAR 2001 Maro, Laysan Ceramium dumosertum Okano DAR 2001 Necker, Maro, Laysan, Pearl & Hermes Ceramium fimbriatum Okano DAR 2001 Laysan Ceramium flaccidum Abbott 1989 Midway, French Frigate Shoals Ceramium hamatispinum Balazs 1979 Ceramium tenuissimum Okano DAR 2001 Chondria arcuata Okano DAR 2001 Chondria polyrhiza Okano DAR 2001 Nihoa, Maro Corallophila apiculata Okano DAR 2001 Corallophila huysmansii Okano DAR 2001 Dasya iridescens BISH Dasya pilosa Okano DAR 2001 French Frigate Shoals Dasya villosa Balazs 1979 Diplothamnion jolyi Okano DAR 2001 Griffithsia heteromorpha Okano DAR 2001 Laysan Haloplegma duperreyi BISH Herposiphonia delicatula Okano DAR 2001 Herposiphonia nuda Okano DAR 2001 Herposiphonia obscura Okano DAR 2001 Herposiphonia pacifica Okano DAR 2001 Heterosiphonia crispella Okano DAR 2001 Necker, Maro, Laysan, Lisianski, Pearl &
Hermes Laurencia galtsoffii Okano DAR 2001 Maro, Laysan, Pearl & Hermes Laurencia obtuse Tsuda 1966 Midway, Gardner, French Frigate Shoals Laurencia parvipapillata Okano DAR 2001 Midway Laurencia sp 1 Abbott 1989 Midway, Pearl & Hermes, Necker Laurencia sp 3 Tsuda 1966 Laysan Neosiphonia beaudettei Okano DAR 2001 Maro, Midway Polysiphona sparsa Okano DAR 2001 Necker, Maro, Laysan Polysiphonia upolensis Abbott 1989 Pearl & Hermes, Laysan Spirocladia hodgsoniae Okano DAR 2001 Spyridia filamentosa Abbott 1989 Midway, Laysan Taenioma perpusillum Okano DAR 2001 Midway Tiffaniella saccorhiza Okano DAR 2001 Vanvoorstia coccinea Okano DAR 2001 Necker, Maro, Pearl & Hermes, Midway Womersleyella pacifica Okano DAR 2001 Lisianski
Function and Form Groups:
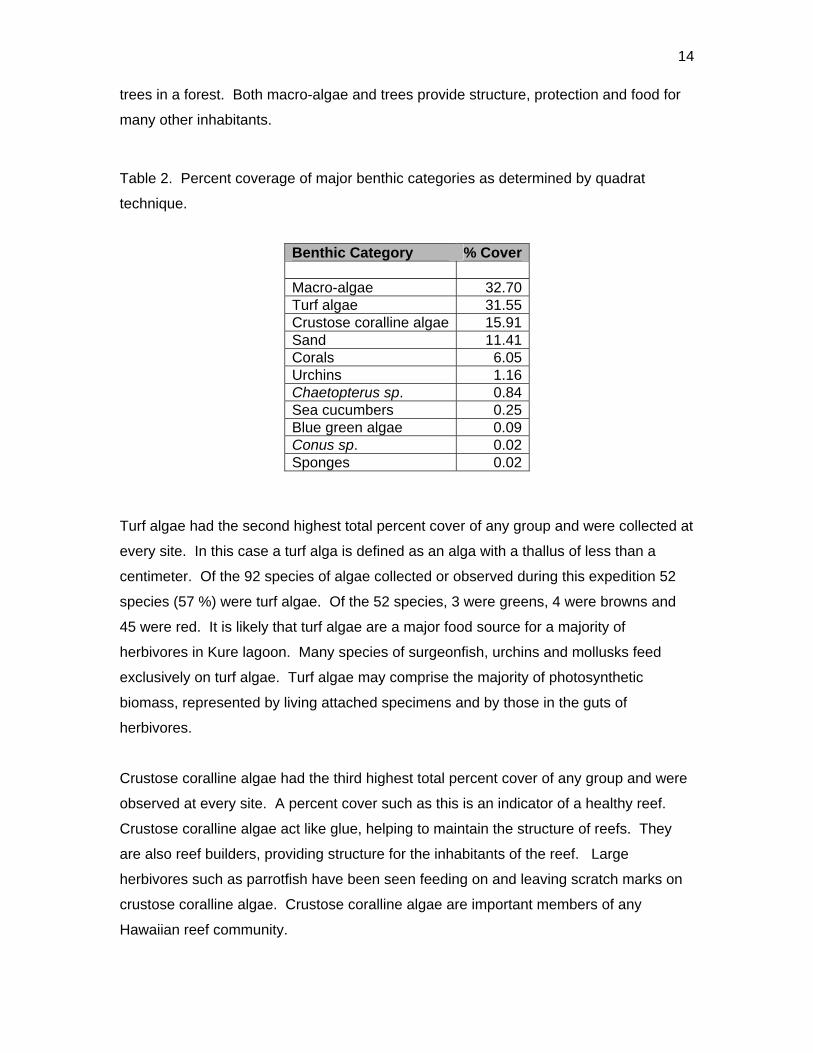
When looking at function and form groups, macro-algae had the highest total percent
cover (Table 2). The percent cover (quadrat) method detected 22 species of macro-
algae (Appendix 4); while a total of 40 species of macro-algae were collected or
observed. Macro-algae species play a key role on the reef that is analogous to that of
14
trees in a forest. Both macro-algae and trees provide structure, protection and food for
many other inhabitants.
Table 2. Percent coverage of major benthic categories as determined by quadrat
technique.
Benthic Category % Cover
Macro-algae 32.70Turf algae 31.55Crustose coralline algae 15.91Sand 11.41Corals 6.05Urchins 1.16Chaetopterus sp. 0.84Sea cucumbers 0.25Blue green algae 0.09Conus sp. 0.02Sponges 0.02
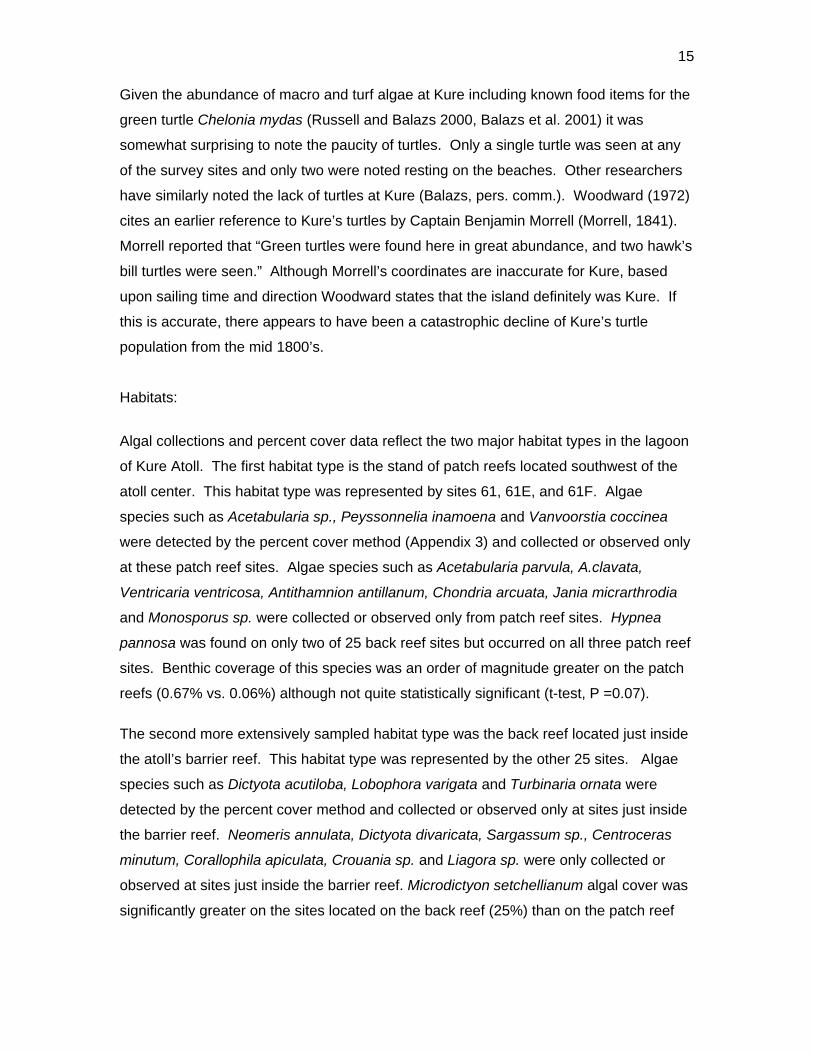
Turf algae had the second highest total percent cover of any group and were collected at
every site. In this case a turf alga is defined as an alga with a thallus of less than a
centimeter. Of the 92 species of algae collected or observed during this expedition 52
species (57 %) were turf algae. Of the 52 species, 3 were greens, 4 were browns and
45 were red. It is likely that turf algae are a major food source for a majority of
herbivores in Kure lagoon. Many species of surgeonfish, urchins and mollusks feed
exclusively on turf algae. Turf algae may comprise the majority of photosynthetic
biomass, represented by living attached specimens and by those in the guts of
herbivores.
Crustose coralline algae had the third highest total percent cover of any group and were
observed at every site. A percent cover such as this is an indicator of a healthy reef.
Crustose coralline algae act like glue, helping to maintain the structure of reefs. They
are also reef builders, providing structure for the inhabitants of the reef. Large
herbivores such as parrotfish have been seen feeding on and leaving scratch marks on
crustose coralline algae. Crustose coralline algae are important members of any
Hawaiian reef community.
15
Given the abundance of macro and turf algae at Kure including known food items for the
green turtle Chelonia mydas (Russell and Balazs 2000, Balazs et al. 2001) it was
somewhat surprising to note the paucity of turtles. Only a single turtle was seen at any
of the survey sites and only two were noted resting on the beaches. Other researchers
have similarly noted the lack of turtles at Kure (Balazs, pers. comm.). Woodward (1972)
cites an earlier reference to Kure’s turtles by Captain Benjamin Morrell (Morrell, 1841).
Morrell reported that “Green turtles were found here in great abundance, and two hawk’s
bill turtles were seen.” Although Morrell’s coordinates are inaccurate for Kure, based
upon sailing time and direction Woodward states that the island definitely was Kure. If
this is accurate, there appears to have been a catastrophic decline of Kure’s turtle
population from the mid 1800’s.
Habitats:
Algal collections and percent cover data reflect the two major habitat types in the lagoon
of Kure Atoll. The first habitat type is the stand of patch reefs located southwest of the
atoll center. This habitat type was represented by sites 61, 61E, and 61F. Algae
species such as Acetabularia sp., Peyssonnelia inamoena and Vanvoorstia coccinea
were detected by the percent cover method (Appendix 3) and collected or observed only
at these patch reef sites. Algae species such as Acetabularia parvula, A.clavata,
Ventricaria ventricosa, Antithamnion antillanum, Chondria arcuata, Jania micrarthrodia
and Monosporus sp. were collected or observed only from patch reef sites. Hypnea
pannosa was found on only two of 25 back reef sites but occurred on all three patch reef
sites. Benthic coverage of this species was an order of magnitude greater on the patch
reefs (0.67% vs. 0.06%) although not quite statistically significant (t-test, P =0.07).
The second more extensively sampled habitat type was the back reef located just inside
the atoll’s barrier reef. This habitat type was represented by the other 25 sites. Algae
species such as Dictyota acutiloba, Lobophora varigata and Turbinaria ornata were
detected by the percent cover method and collected or observed only at sites just inside
the barrier reef. Neomeris annulata, Dictyota divaricata, Sargassum sp., Centroceras
minutum, Corallophila apiculata, Crouania sp. and Liagora sp. were only collected or
observed at sites just inside the barrier reef. Microdictyon setchellianum algal cover was
significantly greater on the sites located on the back reef (25%) than on the patch reef
16
sites (4%) (t-test, P<.006). This was also true for the red alga Laurencia galtsoffii (3.9%
vs. 0.8%, P<0.1).
Significant Algae Species:
Although the back reef sites just inside the atoll barrier reef were largely homogenous,
there were a few sites that were somewhat different. Site #7 was unique in that it was
adjacent to a nearby shipwreck of a fishing boat which ran around in the late 1970’s
(Gulko, in prep). Temperature data loggers were affixed during this project to the two
pieces of this wreck. It has been suggested that Lyngbya majuscula, a blue-green
algae, is often associated with shipwrecks (Maragos, pers. comm.). Site #7 was one of
only two sites where L. majuscula was found attached. Although L. majuscula was not
found directly attached to the wreck, it was attached to substrata surrounding the wreck.
Site #11, the other site where L. majuscula was found, had only small numbers of
attached L. majuscula. At site #7, L. majuscula was found abundantly, suggesting that
L. majuscula does indeed have an association with shipwrecks.
Lyngbya majuscula was also consistently observed as drift within sandy areas around
the lagoon. The extent and density of the L. majuscula population at site #7 does not
appear sufficient to support the amount of drift observed. Since no other large
population of L. majuscula was observed inside the lagoon, it is possible that the source
of this drift is located outside Kure Atoll, most likely to the northeast.
Microdictyon setchellianum had the highest total percent cover (23%) for a single
species and was collected at all sites. It is thus one of the most abundant species inside
the atoll. Microdictyon setchellianum is represented by an overlapping morphology that
forms many layers in Kure lagoon. This type of morphology has many nooks and
crannies. This alga provides food for some larger herbivores and substrate for a
community of turf algae and smaller species of sponges, zoanthids and anemones. It
also provides cover for recruits and juvenile fish and smaller species of crustaceans and
mollusks. During periods of high surf, percent cover of Microdictyon setchellianum may
be decline, but it is suspected that the lower portions of the alga’s thallus remain
resulting in a persistent year-round species.
17
Dictyospheria cavernosa had the 16th highest total percent cover (0.4%) and was
collected at 75% of the sites. Although it is not a dominant member of Kure’s lagoon
community, it must be considered as common, as it was found at almost every site
visited and covered enough area to show up in the percent cover data. This alga’s
highest percent cover was 6% in the lagoon patch reefs at site 61E. Kure lagoon’s
setting demonstrates how a so-called “invasive” alga can stay in balance with other
species under pristine conditions. This is a marked contrast to KǕne’ohe Bay where this
species is regarded as invasive and expanding its coverage. Dictyospheria coverage
has already reached 100% at some locations in the bay.
The habitats of Kure Atoll's lagoon seem in many respects to be similar to places on the
main eight Hawaiian Islands. The back reef habitat just inside the barrier reef is similar
to reef flat habitats located on `Oahu and Kaua`i, specifically KǕhala, Lanikai and
Limahuli. The patch reefs of the atoll are somewhat similar to the patch reefs of
KǕne’ohe Bay. Although habitats may be similar, the composition of algae species
found on the main island is quite different from Kure Atoll. Anthropogenic change such
as nutrification, over fishing and the introduction of alien species may be part of the
reason for the difference in species composition.
Based on these data, algae dominate the benthic community of Kure atoll’s lagoon.
Some have suggested that pristine near shore habitats of Hawai`i should be coral
dominant and not algal dominant, but Kure’s lagoon showcases algal dominance in
healthy even pristine settings. Perhaps this serves as a reminder that not all algal
dominated coastal areas around the main Hawaiian Islands should be considered
problematic.
Benthic & Coral Coverage
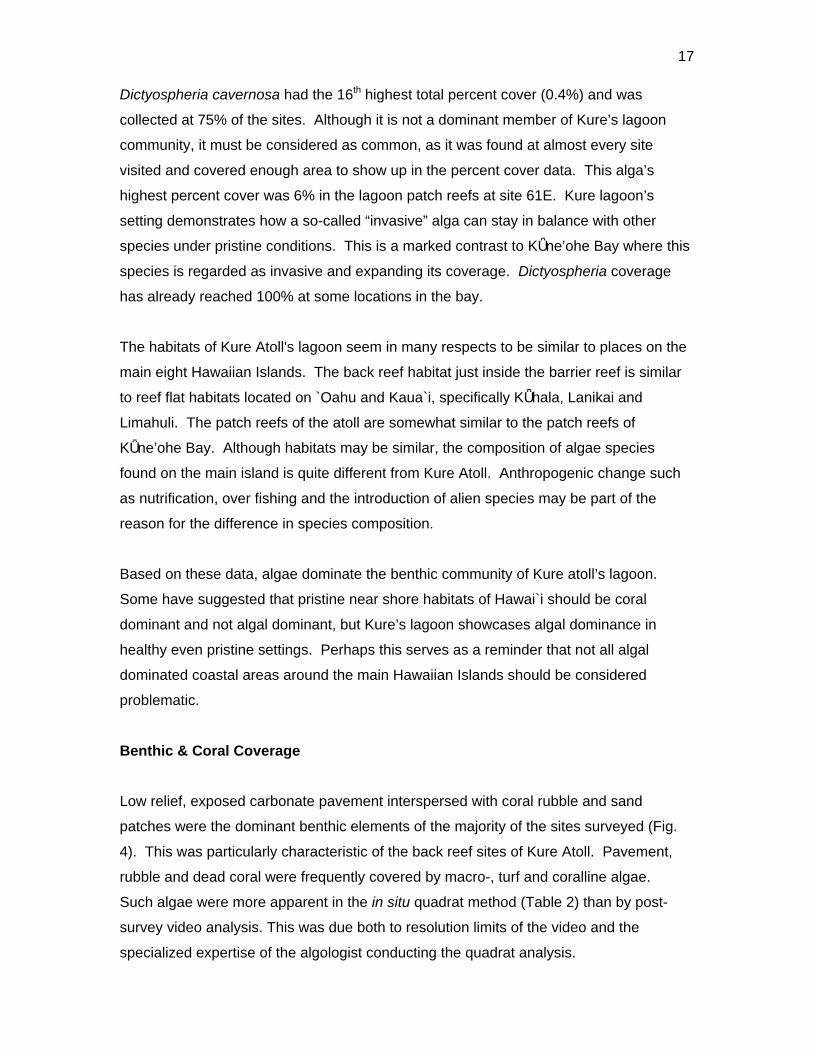
Low relief, exposed carbonate pavement interspersed with coral rubble and sand
patches were the dominant benthic elements of the majority of the sites surveyed (Fig.
4). This was particularly characteristic of the back reef sites of Kure Atoll. Pavement,
rubble and dead coral were frequently covered by macro-, turf and coralline algae.
Such algae were more apparent in the in situ quadrat method (Table 2) than by post-
survey video analysis. This was due both to resolution limits of the video and the
specialized expertise of the algologist conducting the quadrat analysis.
18
SubstratumCalca
reous pavementRubble
Sand
Porites compressa
Macro-algae
Turf Algae
Pocillopora
sp.
Urchins
Porites sp.
Old Dead Coral
Porites lobata
New Dead Coral
Porites lich
en
Coralline Algae
Montiporasp.
Pocillopora meandrina
Unknown Coral
Leptastrea purpurea
Mea
n Pe
rcen
t Cov
er
0
10
2050
60
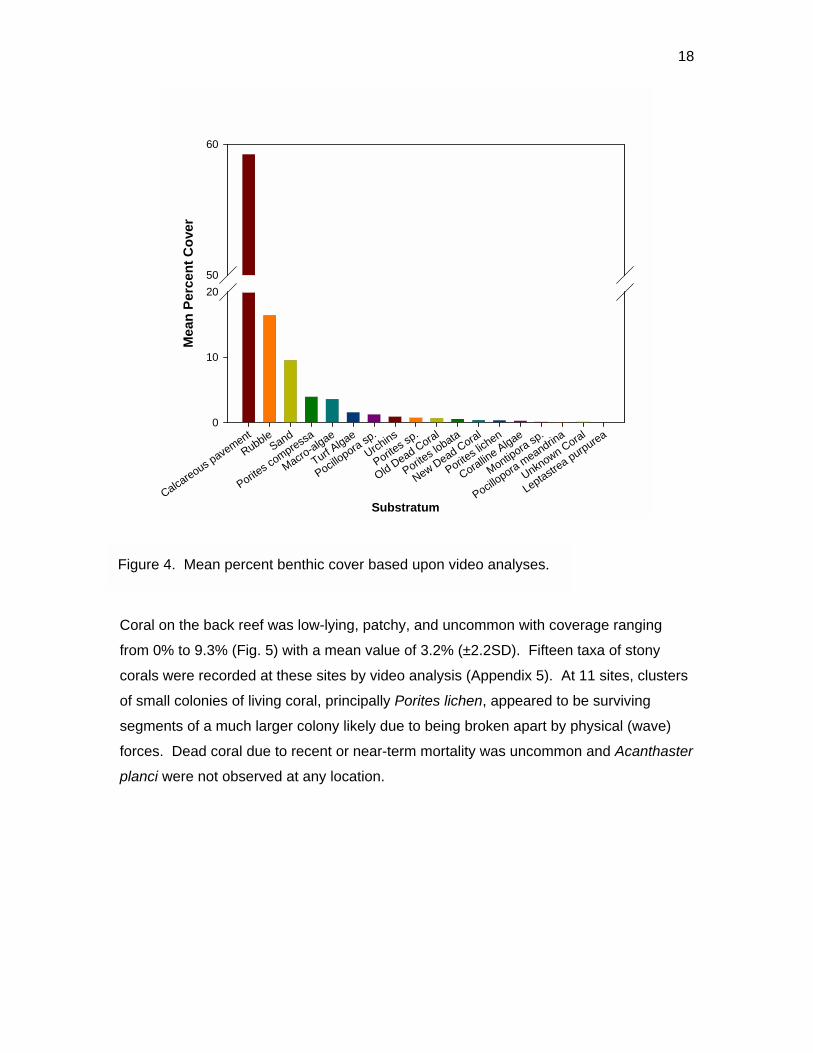
Coral on the back reef was low-lying, patchy, and uncommon with coverage ranging
from 0% to 9.3% (Fig. 5) with a mean value of 3.2% (±2.2SD). Fifteen taxa of stony
corals were recorded at these sites by video analysis (Appendix 5). At 11 sites, clusters
of small colonies of living coral, principally Porites lichen, appeared to be surviving
segments of a much larger colony likely due to being broken apart by physical (wave)
forces. Dead coral due to recent or near-term mortality was uncommon and Acanthaster
planci were not observed at any location.
Figure 4. Mean percent benthic cover based upon video analyses.
19
Figure 5. Percent Live Coral at Survey Sites
With regards to corals, one particularly noteworthy back reef site was #67 (see Fig. 3,
pg. 8). This site was given the nickname “blue reef” due to the dramatic presence of the
blue colored coral Montipora flabellata. This site was one of only two sites where M.
flabellata was detected (by quadrat method only) with a cover of 7%. Site 67 also had
the lowest percent cover of sand when compared to other back-reef sites. The other site
where M. flabellata was detected was a patch reef site (#61) with a cover of 4%.
In contrast to the back reef sites, the patch reef sites near the center of the lagoon (#61,
61E & 61F) were characterized by substantially higher coral cover and spatial
complexity. Cover at these sites ranged from 23.7% to 47.3% even in the shallow 4’
depths where the transects were run. The finger coral Porites compressa was the
dominant coral at these depths often forming large continuous colonies. The bases of
most of the coral fingers were overgrown with either fleshy (especially Microdictyon
setchellianum) or calcareous algae. Many of the finger corals appeared to be very pale
in comparison to high Island colonies. Finger coral rubble was abundant at these sites.
20
Invertebrates
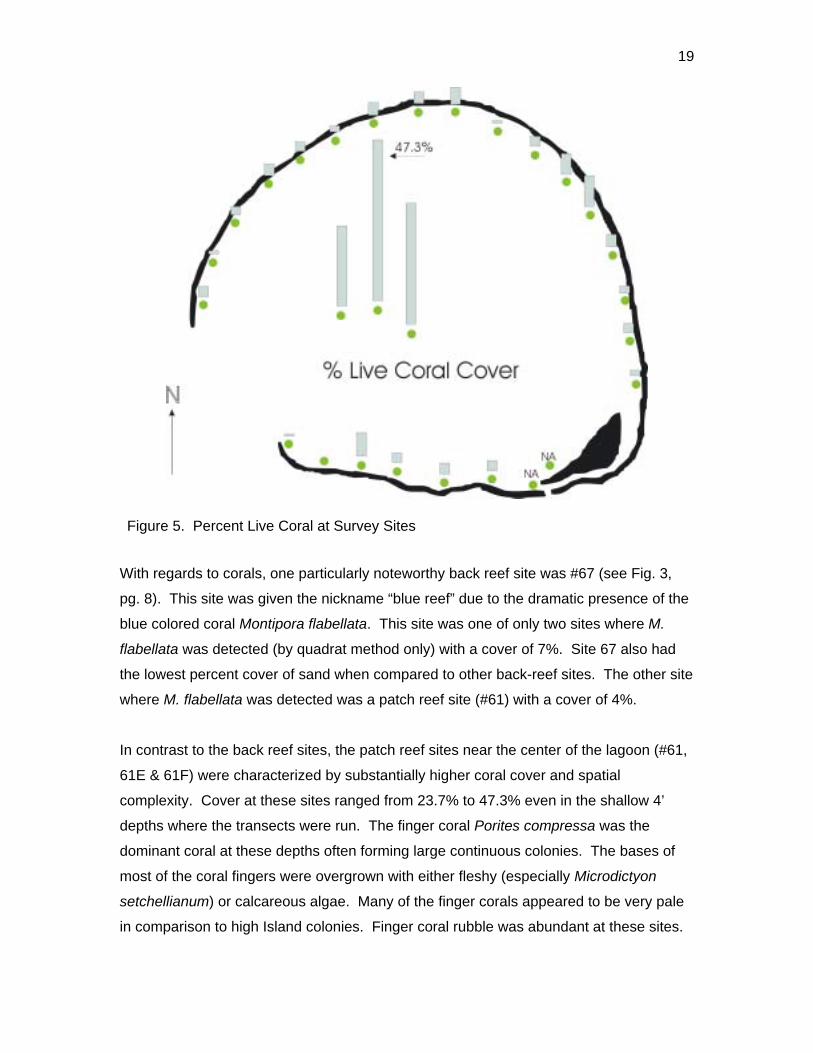
Of the 27 invertebrate taxa surveyed, 20 were recorded on the belt transects. Most of
these were uncommon or rare (Table 3).
Table 3. Invertebrates recorded on transects. Frequency (Freq.) is the proportion of transects in which the taxa occurred. Total No. is the total number of organisms recorded on all transects.
Scientific Name Common Name Freq.TotalNo.
MeanNo./100m2
Echinometra mathaei Rock-Boring Urchin 1.000 30,843 550.77Echinostrephus aciculatus Needle-Spined Urchin 0.821 3,804 67.93Heterocentrotus mammillatus Red Pencil Urchin 0.929 813 14.52Actinopyga obesa Plump Sea Cucumber 0.786 537 9.59Spirobranchus giganteus Christmas Tree Worm 0.429 108 1.93Conus spp. Cone shell 0.536 41 0.73Holothuria atra Black Sea Cucumber 0.464 27 0.48Sabellastarte sanctijosephi Feather Duster Worm 0.143 16 0.29Holothuria whitmaei Teated Sea Cucumber 0.143 10 0.18Echinothrix diadema Blue-Black Urchin 0.360 4 0.07Turbo sandwicensis Hawaiian Turban 0.143 4 0.07Octopus cynea Day Octopus 0.710 4 0.07Ophiocoma erinaceus Spiny Brittle Star 0.143 4 0.07Spondylus violacescens Cliff Oyster 0.360 3 0.05Cypraea spp. Cowries 0.710 3 0.05Linkia multiflora Spotted Linkia 0.360 3 0.05Echinothrix calamaris Banded Urchin 0.360 1 0.02Ophiocoma pica Pied Brittle Star 0.360 1 0.02“Hermit Crab” Hermit Crab 0.360 1 0.02Pinctada margaritifera Black-Lipped Pearl Oyster 0.360 1 0.02
Far and away the most abundant species was the rock-boring urchin, Echinometra
mathaei. It occurred on all transects (Figure 6) ranging in abundance from 29.5/100 m2
on one of the patch reefs to 2,450/100 m2 at site 11 (Appendix 6). Patch reef sites had
significantly less E. mathaei than the back reef sites (t-test P<.001). Based on quadrat
counts, back reef sites had an average E. mathaei (urchin) cover of 1.12%, compared to
0.16% on the patch reef sites (p<.03). Although the density of this urchin seemed very
high at several sites, the overall mean density of rock-boring urchins was no higher than
reported in other shallow-water locations (<15’) such as Kealakekua Bay (å1800/100m2;
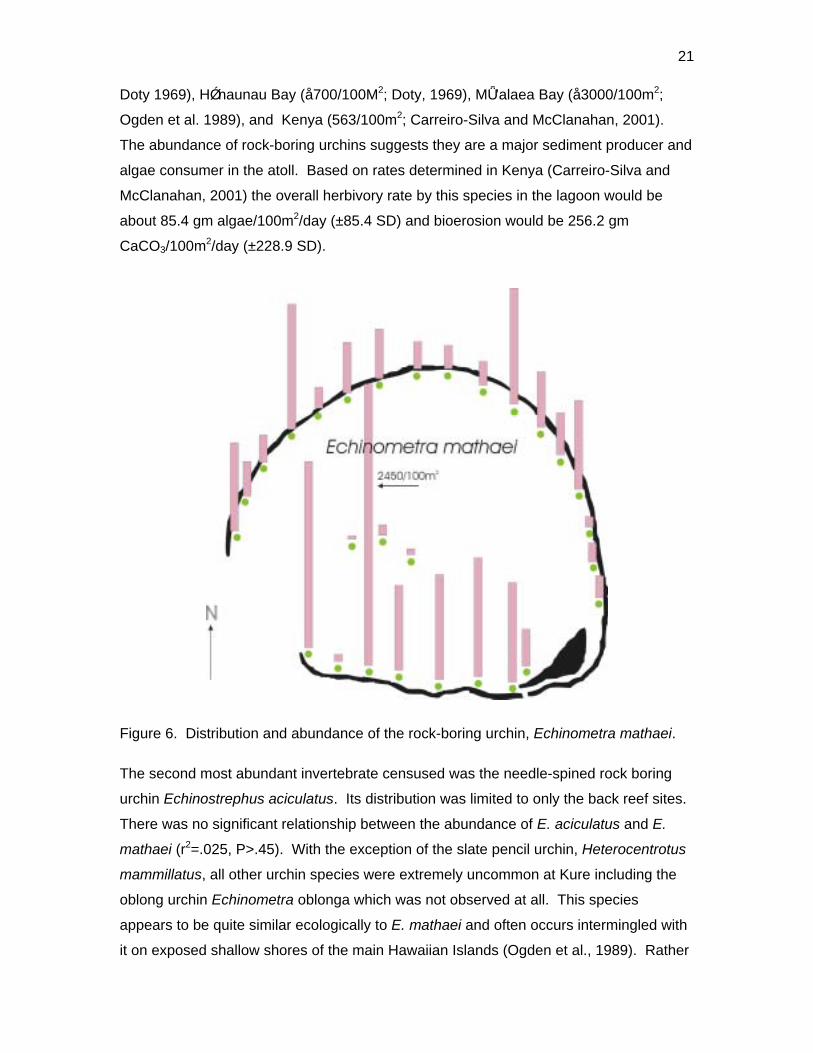
21
Doty 1969), HǾnaunau Bay (å700/100M2; Doty, 1969), MǕ’alaea Bay (å3000/100m2;
Ogden et al. 1989), and Kenya (563/100m2; Carreiro-Silva and McClanahan, 2001).
The abundance of rock-boring urchins suggests they are a major sediment producer and
algae consumer in the atoll. Based on rates determined in Kenya (Carreiro-Silva and
McClanahan, 2001) the overall herbivory rate by this species in the lagoon would be
about 85.4 gm algae/100m2/day (±85.4 SD) and bioerosion would be 256.2 gm
CaCO3/100m2/day (±228.9 SD).
Figure 6. Distribution and abundance of the rock-boring urchin, Echinometra mathaei.
The second most abundant invertebrate censused was the needle-spined rock boring
urchin Echinostrephus aciculatus. Its distribution was limited to only the back reef sites.
There was no significant relationship between the abundance of E. aciculatus and E.
mathaei (r2=.025, P>.45). With the exception of the slate pencil urchin, Heterocentrotus
mammillatus, all other urchin species were extremely uncommon at Kure including the
oblong urchin Echinometra oblonga which was not observed at all. This species
appears to be quite similar ecologically to E. mathaei and often occurs intermingled with
it on exposed shallow shores of the main Hawaiian Islands (Ogden et al., 1989). Rather
22
than being absent, the possibility exists that E. oblonga may not have its usual black
coloration at Kure and thus was visually misidentified as E. mathaei.
Although not included on the list of surveyed species for the belt transects, the
parchment worm, Chaetopterus sp. an annelid with parchment-like tubes was recorded
on the quadrat surveys. It was found at three back reef sites in very low abundance.
Noteworthy however was its presence at site 7, the site adjacent to the boat wreck. At
this location Chaetopterus sp. had a percent cover of 21.5%. The second highest
percent cover of Chaetopterus sp. was 1% at site 11 (Appendix 4). As noted previously
the blue-green algae Lyngbya majuscula was also present at these two sites.
No Acanthaster planci were observed anywhere in the lagoon. Black-lipped pearl
oysters Pinctada margartifera, were rare with only a single individual being recorded on
transects. Only four Lobsters (Panulirus marginatus) were observed (outside of
transects), three at site #61 and one at #17. A large barnacle, Balanus sp. reported to
be locally abundant on the algal terraces near the reef edge at Kure (Gross et al., 1969)
was not observed.
Fishes
A total of 111 species of 35 families were observed by all methods at Kure Atoll
(Appendix 7). Endemics constituted 27% of the species, slightly higher than the overall
level of endemism (23.1%) for nearshore Hawaiian fishes (Randall 1998). No
introduced species (i.e. Lutjanus kasmira, Lutjanus fulvus Cephalopholis argus) were
observed. The recent immigrant to Hawai`i, Abudefduf vaigiensis was noted at a single
site (DACOR analysis - Appendix 8). Another recent immigrant that appears to have
become established on one or more of the main Hawaiian Islands (MHI), the triggerfish
Balistes polylepis was not observed. Indeed no balistids were recorded at any of the
sites. The filefish Pervagor spilosoma was noted by DACOR as rare at only a single site
(#16).
Sixty-one fish species (37.8% endemic) were recorded on belt transects with Stethojulis
balteata and Thalassoma duperrey, both endemic labrids, found on all transects
(Appendix 9). Patch reef sites had over three times as many fishes (434.5/100m2
SD=51.4) as back reef sites (128.1/100m2 SD=48.4, t-test P<0.001) although they did
23
not generally have more species per transect (Table 4). Adult Kyphosus bigibbus,
Stegastes fasciolatus, juvenile scarids (especially Scarus dubius and Chlorurus
sordidus) and Gomphosus varius recruits were especially abundant in the shallows of
the patch reefs. The two most common species overall, Acanthurus triostegus &
Stethojulis balteata, were generally much more common on the back reefs than the
patch reefs. As is often the case elsewhere, the endemic wrasse Thalassoma duperrey
was ubiquitous.
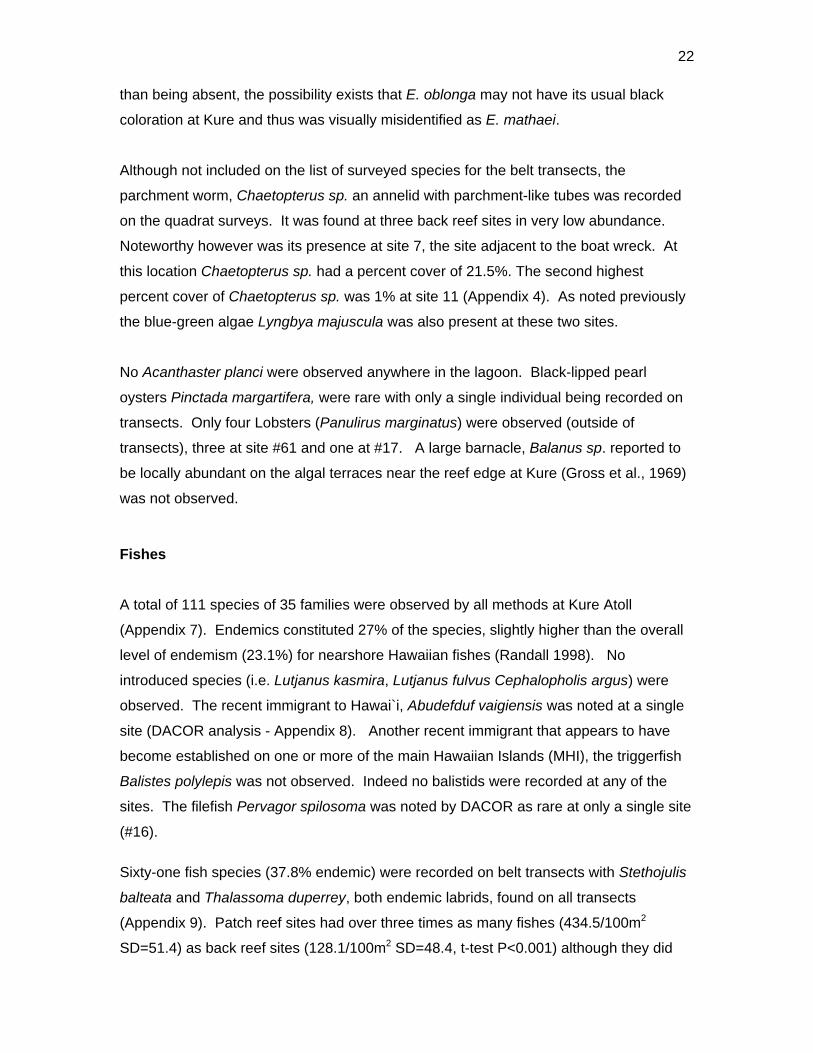
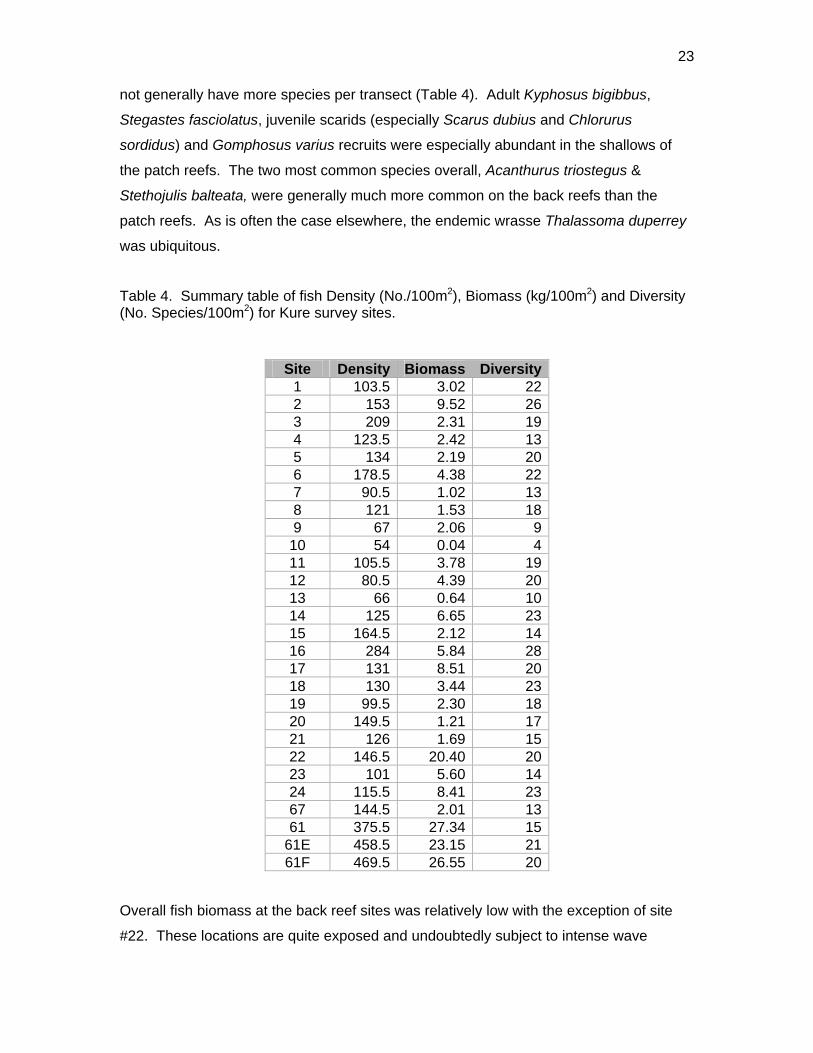
Table 4. Summary table of fish Density (No./100m2), Biomass (kg/100m2) and Diversity(No. Species/100m2) for Kure survey sites.
Site Density Biomass Diversity1 103.5 3.02 222 153 9.52 263 209 2.31 194 123.5 2.42 135 134 2.19 206 178.5 4.38 227 90.5 1.02 138 121 1.53 189 67 2.06 9
10 54 0.04 411 105.5 3.78 1912 80.5 4.39 2013 66 0.64 1014 125 6.65 2315 164.5 2.12 1416 284 5.84 2817 131 8.51 2018 130 3.44 2319 99.5 2.30 1820 149.5 1.21 1721 126 1.69 1522 146.5 20.40 2023 101 5.60 1424 115.5 8.41 2367 144.5 2.01 1361 375.5 27.34 15
61E 458.5 23.15 2161F 469.5 26.55 20
Overall fish biomass at the back reef sites was relatively low with the exception of site
#22. These locations are quite exposed and undoubtedly subject to intense wave
24
stresses during periods of strong winter swells. Nevertheless the biomass was still
higher than at three of four MLCDs on `Oahu (Friedlander, 2001). The low spatial relief
and lack of refugia at back reef sites appears to limit resident populations to large fish
which can range widely and small bodied individuals (including YOY) which can utilize
whatever small scale shelter is available. The greatest concentrations of site-resident
fishes often occurred in cuts or depressions on the back reef. Cleaning stations of the
adult cleaner wrasse Labroides phthirophagus were also in these low-lying areas in
contrast to their usual prominent and exposed locations on MHI reefs. The relatively high
fish biomass recorded at site #22 was due to a roving school of the herbivore
Acanthurus nigroris which crossed the transect line. Of note was the fact that this
species almost invariably exhibited a white band on its caudal peduncle in contrast to the
island of Hawai`i, where it is usually observed without the white band.
As with A. nigroris a number of other isolated concentrations of fishes were seen within
the atoll during the project. Foraging schools of hundreds of large (>15cm TL)
Acanthurus triostegus were observed at two sites (#18 & #22), 5.6 km apart. A large
school of Acanthurus leucoparieus was also noted at site #22. Small schools (å50 fish)
of the clupeid Spratelloides delicatulus were present at most (71%) sites usually
swimming just below the water’s surface. Schools of the goatfishes Mulloidichthys
flavolineatus and Mulloidichthys vanicolensis were also noted at several locations. M.
flavolineatus was present throughout the atoll and common at every transect site except
one (#9). Active foraging schools of this species with hundreds of adult individuals were
observed at eight sites (Appendix 9) and small individuals (å12 cm TL.) were commonly
seen in the shallows along the beaches. M. vanicolensis in comparison was much less
abundant being common only at four sites. This species gathered in inactive resting
schools and were not actively feeding during the day. The largest concentrations were
found at the section of the fishing boat wreck near site #7 and the piece within the atoll
lagoon proper. A large resting school of small (å20 cm TL) kǕhala, Seriola dumerili, also
occurred at this later wreck. When one of the support boats motored rapidly over the
school, the fish moved up off of the sandy bottom and followed the boat for
approximately 20 m until it stopped.
Two large schools of adult Ǖholehole, Kuhlia xenura, were observed on a recon snorkel
of the east side of Green Island associated with rock piles close to the shore. One of
these schools also contained akule, Selar crumenopthalmus, the only sighting of this
25
species. While juvenile Ǖholehole were observed widely distributed in the shallows
along sandy shorelines, with the exception of the rock piles, adults were observed at
only one other location, that being just inside the reef crest at site #03. Due to the
difficulty of working so close to the reef crest and the large number of juveniles observed
within the atoll, it is possible that substantial numbers of adult Ǖholehole might inhabit
these areas.
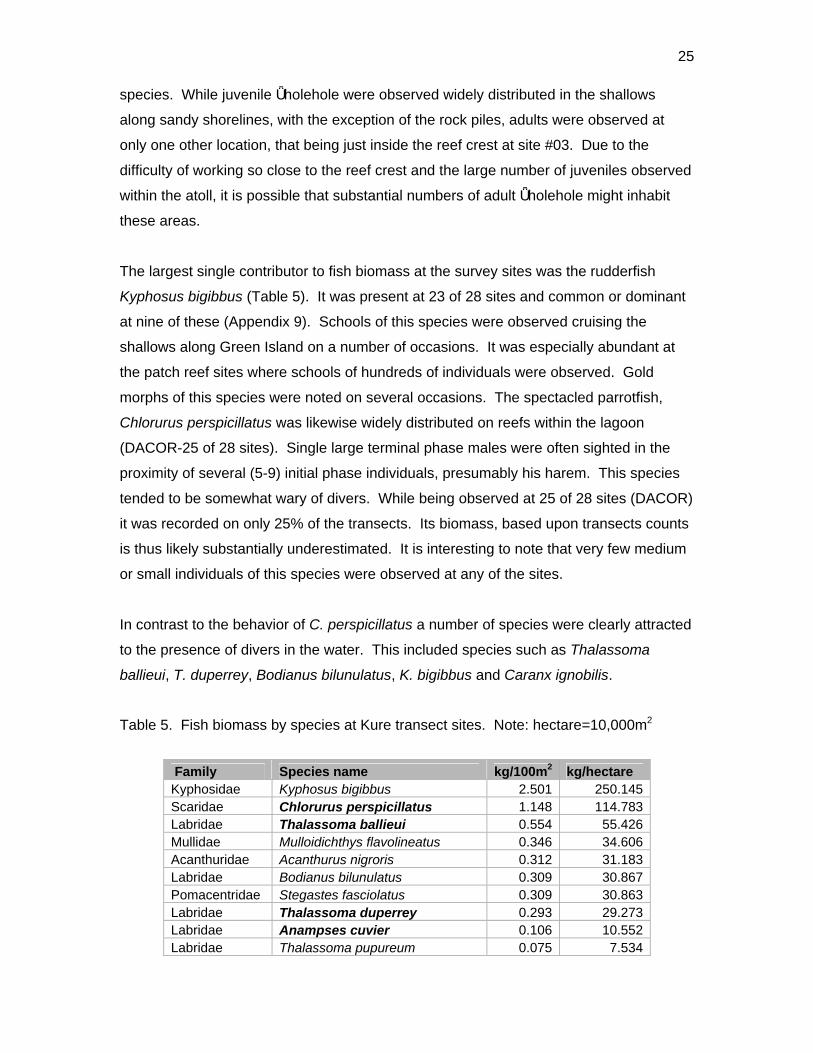
The largest single contributor to fish biomass at the survey sites was the rudderfish
Kyphosus bigibbus (Table 5). It was present at 23 of 28 sites and common or dominant
at nine of these (Appendix 9). Schools of this species were observed cruising the
shallows along Green Island on a number of occasions. It was especially abundant at
the patch reef sites where schools of hundreds of individuals were observed. Gold
morphs of this species were noted on several occasions. The spectacled parrotfish,
Chlorurus perspicillatus was likewise widely distributed on reefs within the lagoon
(DACOR-25 of 28 sites). Single large terminal phase males were often sighted in the
proximity of several (5-9) initial phase individuals, presumably his harem. This species
tended to be somewhat wary of divers. While being observed at 25 of 28 sites (DACOR)
it was recorded on only 25% of the transects. Its biomass, based upon transects counts
is thus likely substantially underestimated. It is interesting to note that very few medium
or small individuals of this species were observed at any of the sites.
In contrast to the behavior of C. perspicillatus a number of species were clearly attracted
to the presence of divers in the water. This included species such as Thalassoma
ballieui, T. duperrey, Bodianus bilunulatus, K. bigibbus and Caranx ignobilis.
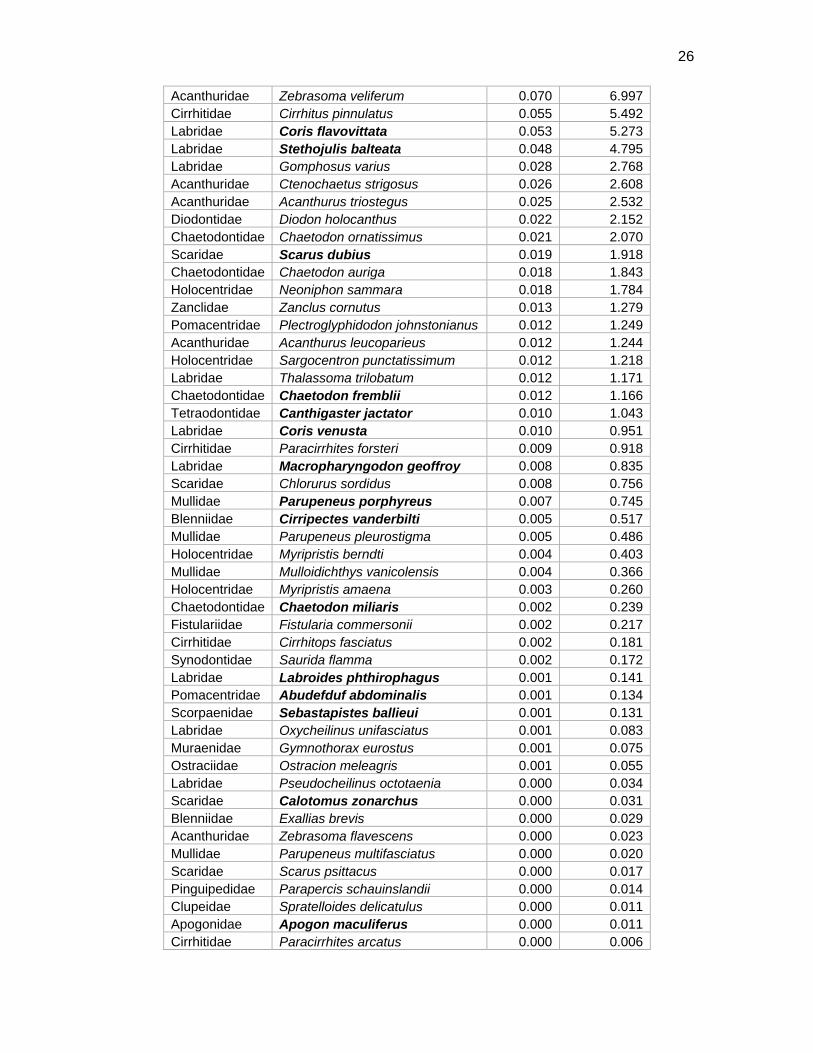
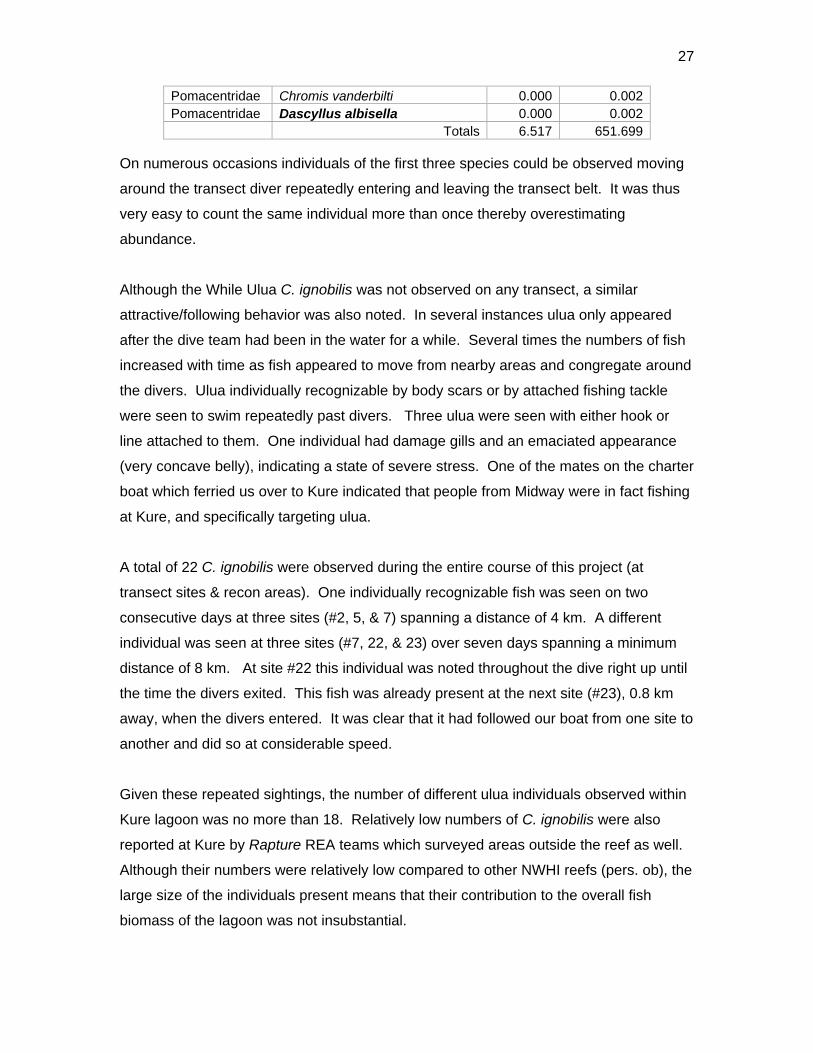
Table 5. Fish biomass by species at Kure transect sites. Note: hectare=10,000m2
Family Species name kg/100m2 kg/hectare Kyphosidae Kyphosus bigibbus 2.501 250.145 Scaridae Chlorurus perspicillatus 1.148 114.783 Labridae Thalassoma ballieui 0.554 55.426 Mullidae Mulloidichthys flavolineatus 0.346 34.606 Acanthuridae Acanthurus nigroris 0.312 31.183 Labridae Bodianus bilunulatus 0.309 30.867 Pomacentridae Stegastes fasciolatus 0.309 30.863 Labridae Thalassoma duperrey 0.293 29.273 Labridae Anampses cuvier 0.106 10.552 Labridae Thalassoma pupureum 0.075 7.534
26
Acanthuridae Zebrasoma veliferum 0.070 6.997 Cirrhitidae Cirrhitus pinnulatus 0.055 5.492 Labridae Coris flavovittata 0.053 5.273 Labridae Stethojulis balteata 0.048 4.795 Labridae Gomphosus varius 0.028 2.768 Acanthuridae Ctenochaetus strigosus 0.026 2.608 Acanthuridae Acanthurus triostegus 0.025 2.532 Diodontidae Diodon holocanthus 0.022 2.152 Chaetodontidae Chaetodon ornatissimus 0.021 2.070 Scaridae Scarus dubius 0.019 1.918 Chaetodontidae Chaetodon auriga 0.018 1.843 Holocentridae Neoniphon sammara 0.018 1.784 Zanclidae Zanclus cornutus 0.013 1.279 Pomacentridae Plectroglyphidodon johnstonianus 0.012 1.249 Acanthuridae Acanthurus leucoparieus 0.012 1.244 Holocentridae Sargocentron punctatissimum 0.012 1.218 Labridae Thalassoma trilobatum 0.012 1.171 Chaetodontidae Chaetodon fremblii 0.012 1.166 Tetraodontidae Canthigaster jactator 0.010 1.043 Labridae Coris venusta 0.010 0.951 Cirrhitidae Paracirrhites forsteri 0.009 0.918 Labridae Macropharyngodon geoffroy 0.008 0.835 Scaridae Chlorurus sordidus 0.008 0.756 Mullidae Parupeneus porphyreus 0.007 0.745 Blenniidae Cirripectes vanderbilti 0.005 0.517 Mullidae Parupeneus pleurostigma 0.005 0.486 Holocentridae Myripristis berndti 0.004 0.403 Mullidae Mulloidichthys vanicolensis 0.004 0.366 Holocentridae Myripristis amaena 0.003 0.260 Chaetodontidae Chaetodon miliaris 0.002 0.239 Fistulariidae Fistularia commersonii 0.002 0.217 Cirrhitidae Cirrhitops fasciatus 0.002 0.181 Synodontidae Saurida flamma 0.002 0.172 Labridae Labroides phthirophagus 0.001 0.141 Pomacentridae Abudefduf abdominalis 0.001 0.134 Scorpaenidae Sebastapistes ballieui 0.001 0.131 Labridae Oxycheilinus unifasciatus 0.001 0.083 Muraenidae Gymnothorax eurostus 0.001 0.075 Ostraciidae Ostracion meleagris 0.001 0.055 Labridae Pseudocheilinus octotaenia 0.000 0.034 Scaridae Calotomus zonarchus 0.000 0.031 Blenniidae Exallias brevis 0.000 0.029 Acanthuridae Zebrasoma flavescens 0.000 0.023 Mullidae Parupeneus multifasciatus 0.000 0.020 Scaridae Scarus psittacus 0.000 0.017 Pinguipedidae Parapercis schauinslandii 0.000 0.014 Clupeidae Spratelloides delicatulus 0.000 0.011 Apogonidae Apogon maculiferus 0.000 0.011 Cirrhitidae Paracirrhites arcatus 0.000 0.006
27
Pomacentridae Chromis vanderbilti 0.000 0.002 Pomacentridae Dascyllus albisella 0.000 0.002 Totals 6.517 651.699
On numerous occasions individuals of the first three species could be observed moving
around the transect diver repeatedly entering and leaving the transect belt. It was thus
very easy to count the same individual more than once thereby overestimating
abundance.
Although the While Ulua C. ignobilis was not observed on any transect, a similar
attractive/following behavior was also noted. In several instances ulua only appeared
after the dive team had been in the water for a while. Several times the numbers of fish
increased with time as fish appeared to move from nearby areas and congregate around
the divers. Ulua individually recognizable by body scars or by attached fishing tackle
were seen to swim repeatedly past divers. Three ulua were seen with either hook or
line attached to them. One individual had damage gills and an emaciated appearance
(very concave belly), indicating a state of severe stress. One of the mates on the charter
boat which ferried us over to Kure indicated that people from Midway were in fact fishing
at Kure, and specifically targeting ulua.
A total of 22 C. ignobilis were observed during the entire course of this project (at
transect sites & recon areas). One individually recognizable fish was seen on two
consecutive days at three sites (#2, 5, & 7) spanning a distance of 4 km. A different
individual was seen at three sites (#7, 22, & 23) over seven days spanning a minimum
distance of 8 km. At site #22 this individual was noted throughout the dive right up until
the time the divers exited. This fish was already present at the next site (#23), 0.8 km
away, when the divers entered. It was clear that it had followed our boat from one site to
another and did so at considerable speed.
Given these repeated sightings, the number of different ulua individuals observed within
Kure lagoon was no more than 18. Relatively low numbers of C. ignobilis were also
reported at Kure by Rapture REA teams which surveyed areas outside the reef as well.
Although their numbers were relatively low compared to other NWHI reefs (pers. ob), the
large size of the individuals present means that their contribution to the overall fish
biomass of the lagoon was not insubstantial.
28
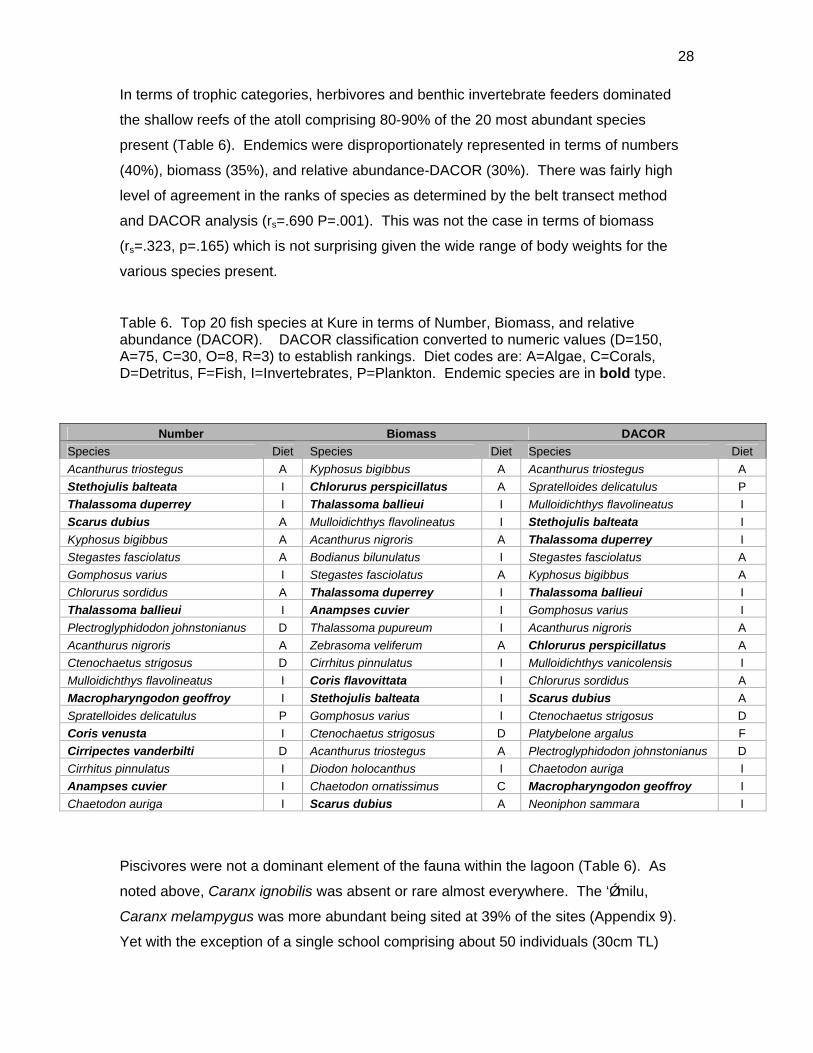
In terms of trophic categories, herbivores and benthic invertebrate feeders dominated
the shallow reefs of the atoll comprising 80-90% of the 20 most abundant species
present (Table 6). Endemics were disproportionately represented in terms of numbers
(40%), biomass (35%), and relative abundance-DACOR (30%). There was fairly high
level of agreement in the ranks of species as determined by the belt transect method
and DACOR analysis (rs=.690 P=.001). This was not the case in terms of biomass
(rs=.323, p=.165) which is not surprising given the wide range of body weights for the
various species present.
Table 6. Top 20 fish species at Kure in terms of Number, Biomass, and relative abundance (DACOR). DACOR classification converted to numeric values (D=150, A=75, C=30, O=8, R=3) to establish rankings. Diet codes are: A=Algae, C=Corals, D=Detritus, F=Fish, I=Invertebrates, P=Plankton. Endemic species are in bold type.
Number Biomass DACOR Species Diet Species Diet Species DietAcanthurus triostegus A Kyphosus bigibbus A Acanthurus triostegus AStethojulis balteata I Chlorurus perspicillatus A Spratelloides delicatulus PThalassoma duperrey I Thalassoma ballieui I Mulloidichthys flavolineatus IScarus dubius A Mulloidichthys flavolineatus I Stethojulis balteata IKyphosus bigibbus A Acanthurus nigroris A Thalassoma duperrey IStegastes fasciolatus A Bodianus bilunulatus I Stegastes fasciolatus AGomphosus varius I Stegastes fasciolatus A Kyphosus bigibbus AChlorurus sordidus A Thalassoma duperrey I Thalassoma ballieui IThalassoma ballieui I Anampses cuvier I Gomphosus varius IPlectroglyphidodon johnstonianus D Thalassoma pupureum I Acanthurus nigroris AAcanthurus nigroris A Zebrasoma veliferum A Chlorurus perspicillatus ACtenochaetus strigosus D Cirrhitus pinnulatus I Mulloidichthys vanicolensis IMulloidichthys flavolineatus I Coris flavovittata I Chlorurus sordidus AMacropharyngodon geoffroy I Stethojulis balteata I Scarus dubius ASpratelloides delicatulus P Gomphosus varius I Ctenochaetus strigosus DCoris venusta I Ctenochaetus strigosus D Platybelone argalus FCirripectes vanderbilti D Acanthurus triostegus A Plectroglyphidodon johnstonianus DCirrhitus pinnulatus I Diodon holocanthus I Chaetodon auriga IAnampses cuvier I Chaetodon ornatissimus C Macropharyngodon geoffroy IChaetodon auriga I Scarus dubius A Neoniphon sammara I
Piscivores were not a dominant element of the fauna within the lagoon (Table 6). As
noted above, Caranx ignobilis was absent or rare almost everywhere. The ‘Ǿmilu,
Caranx melampygus was more abundant being sited at 39% of the sites (Appendix 9).
Yet with the exception of a single school comprising about 50 individuals (30cm TL)
29
observed along the beach west of Green Island, these too were typically in low numbers.
Limited sampling by rod & reel along the beaches of Green Island caught only C.
melampygus, Carangoides ferdau and, Polydactylus sexfilis (moi). This latter species is
generally not considered piscivorous. Approximately 13 individuals were seen
repeatedly in the vicinity of the landing pier on the west side of the island. None of these
three species were recorded on transects. Only a single small Galapagos shark,
Carcharhinus galapagensis was observed during the course of the project. As
previously mentioned a school of small kǕhala was noted at one of the wreck sites. A
single large individual (å120 cm TL) was seen chasing juvenile moi and Ǖholehole along
the shoreline of Green Island. It even beached itself several times in its feeding
attempts.
Recruits
Recruits were observed for 24 of the 61 fish species recorded on transects. The top five
species accounted for over 90% of the total (Table 7). Endemics represented 45.8% of
the species and 34.7% of the number of recruits. Recruits were found at all sites.
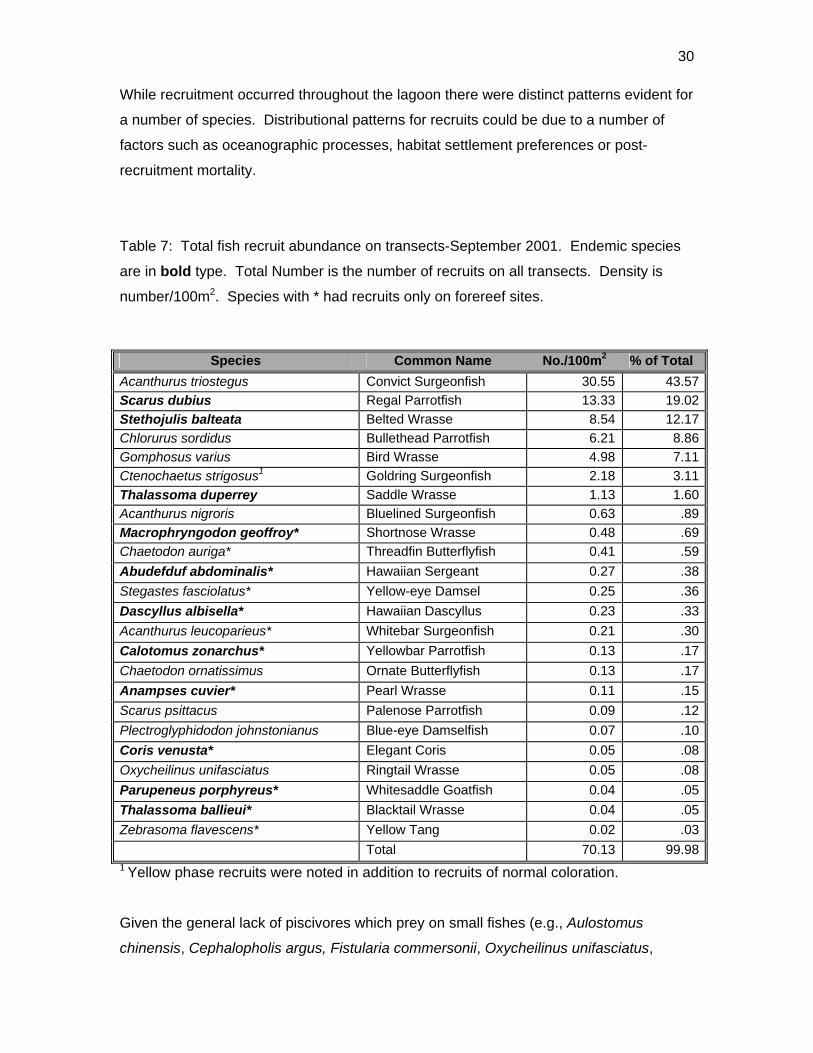
Highest densities occurred at two of the three patch reef sites (Figure 7) but overall
mean recruit densities were just nonsignificant between back reef and patch reef sites (t-
test, P=0.06). This was somewhat surprising given the dramatic differences between the
habitat types in terms of reef complexity and available small-scale shelter (essentially
unlimited on the patch reefs). Total recruit densities at Kure during this period were
higher, with one exception, than historically (1993-2000) reported for Midway or French
Frigate Shoals (DeMartini, in review). The exception was at Midway in 1997 when a
large recruitment episode of ‘Ǖweoweo, Priacanthus meeki occurred. Total recruit
density during this period at Midway exceeded 130/100m2.
Only a single species of recruit (Oxycheilinus unifasciatus) was found solely on the patch
reefs while 12 species occurred exclusively on back reef sites (Table 7). This latter
finding is likely an artifact of the large disparity in the number of survey sites between the
two habitat types. Nevertheless it points out the importance of the entire lagoon as a
nursery habitat for different species.
30
While recruitment occurred throughout the lagoon there were distinct patterns evident for
a number of species. Distributional patterns for recruits could be due to a number of
factors such as oceanographic processes, habitat settlement preferences or post-
recruitment mortality.
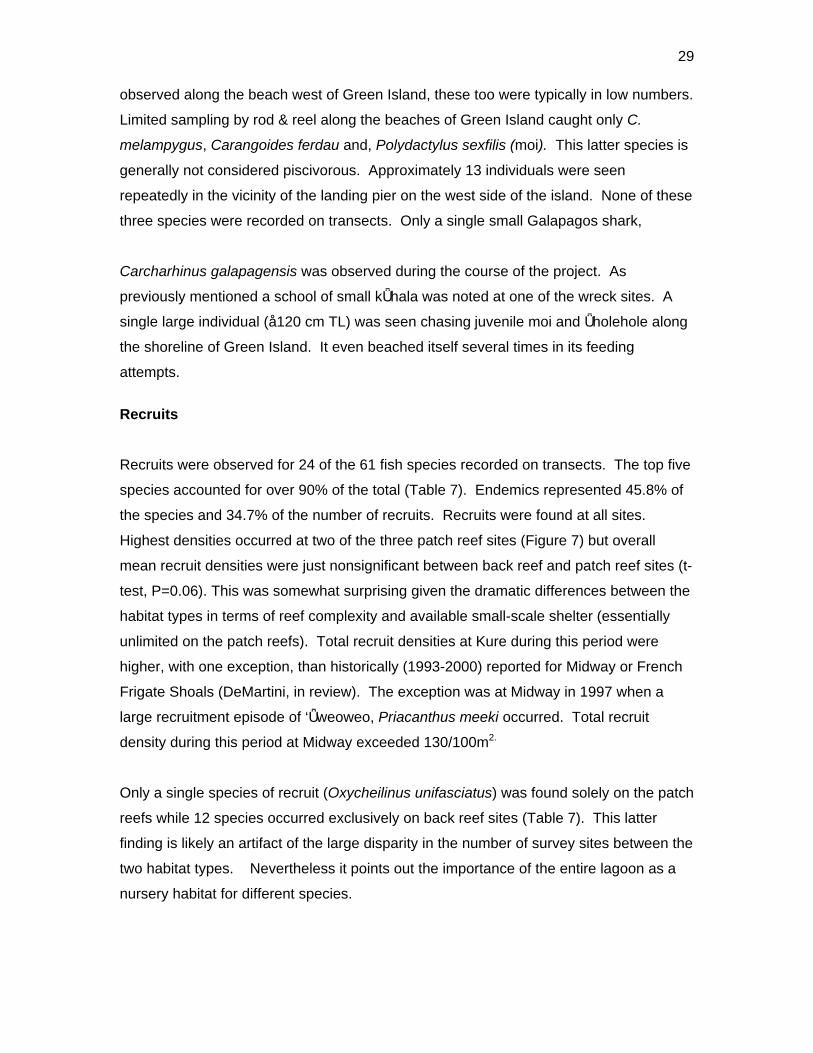
Table 7: Total fish recruit abundance on transects-September 2001. Endemic species
are in bold type. Total Number is the number of recruits on all transects. Density is
number/100m2. Species with * had recruits only on forereef sites.
Species Common Name No./100m2 % of Total Acanthurus triostegus Convict Surgeonfish 30.55 43.57Scarus dubius Regal Parrotfish 13.33 19.02Stethojulis balteata Belted Wrasse 8.54 12.17Chlorurus sordidus Bullethead Parrotfish 6.21 8.86Gomphosus varius Bird Wrasse 4.98 7.11Ctenochaetus strigosus1 Goldring Surgeonfish 2.18 3.11Thalassoma duperrey Saddle Wrasse 1.13 1.60Acanthurus nigroris Bluelined Surgeonfish 0.63 .89Macrophryngodon geoffroy* Shortnose Wrasse 0.48 .69Chaetodon auriga* Threadfin Butterflyfish 0.41 .59Abudefduf abdominalis* Hawaiian Sergeant 0.27 .38Stegastes fasciolatus* Yellow-eye Damsel 0.25 .36Dascyllus albisella* Hawaiian Dascyllus 0.23 .33Acanthurus leucoparieus* Whitebar Surgeonfish 0.21 .30Calotomus zonarchus* Yellowbar Parrotfish 0.13 .17Chaetodon ornatissimus Ornate Butterflyfish 0.13 .17Anampses cuvier* Pearl Wrasse 0.11 .15Scarus psittacus Palenose Parrotfish 0.09 .12Plectroglyphidodon johnstonianus Blue-eye Damselfish 0.07 .10Coris venusta* Elegant Coris 0.05 .08Oxycheilinus unifasciatus Ringtail Wrasse 0.05 .08Parupeneus porphyreus* Whitesaddle Goatfish 0.04 .05Thalassoma ballieui* Blacktail Wrasse 0.04 .05Zebrasoma flavescens* Yellow Tang 0.02 .03
Total 70.13 99.981 Yellow phase recruits were noted in addition to recruits of normal coloration.
Given the general lack of piscivores which prey on small fishes (e.g., Aulostomus
chinensis, Cephalopholis argus, Fistularia commersonii, Oxycheilinus unifasciatus,
31
scorpaenids and synodontids) it is likely that observed patterns are the result of one or
both of the first two factors. At this point it is not possible to clearly distinguish between
them and assess their relative importance.
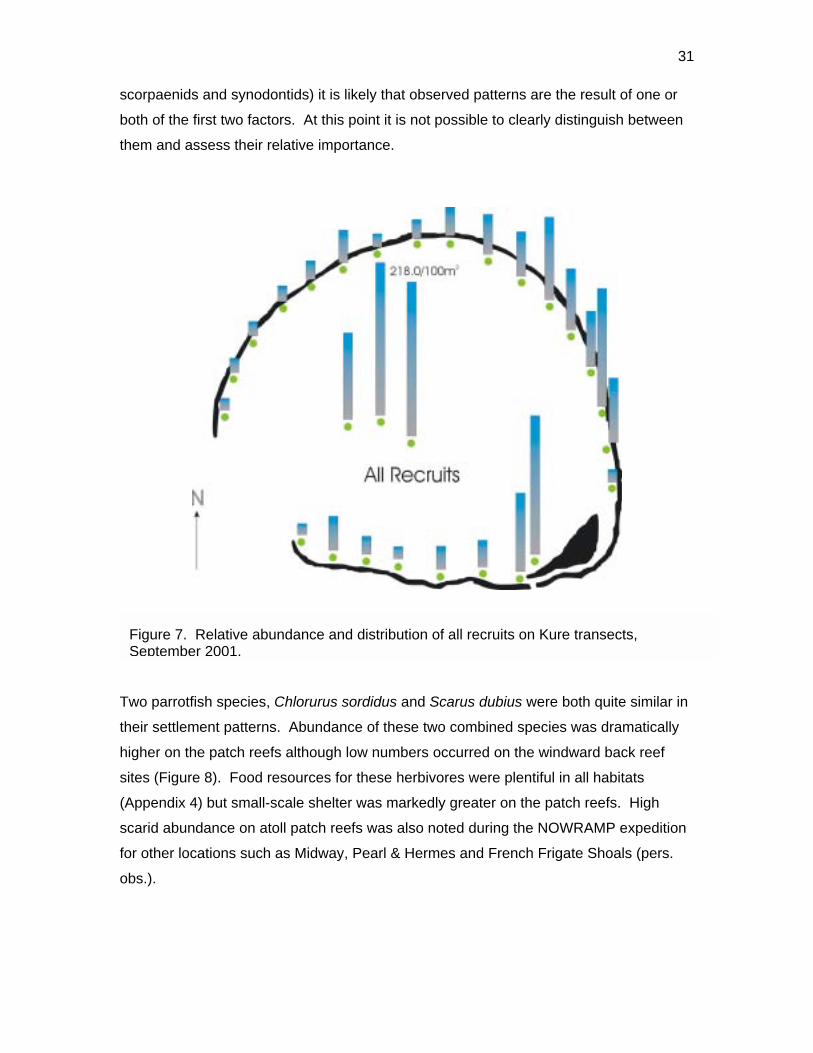
Two parrotfish species, Chlorurus sordidus and Scarus dubius were both quite similar in
their settlement patterns. Abundance of these two combined species was dramatically
higher on the patch reefs although low numbers occurred on the windward back reef
sites (Figure 8). Food resources for these herbivores were plentiful in all habitats
(Appendix 4) but small-scale shelter was markedly greater on the patch reefs. High
scarid abundance on atoll patch reefs was also noted during the NOWRAMP expedition
for other locations such as Midway, Pearl & Hermes and French Frigate Shoals (pers.
obs.).
Figure 7. Relative abundance and distribution of all recruits on Kure transects, September 2001.
32
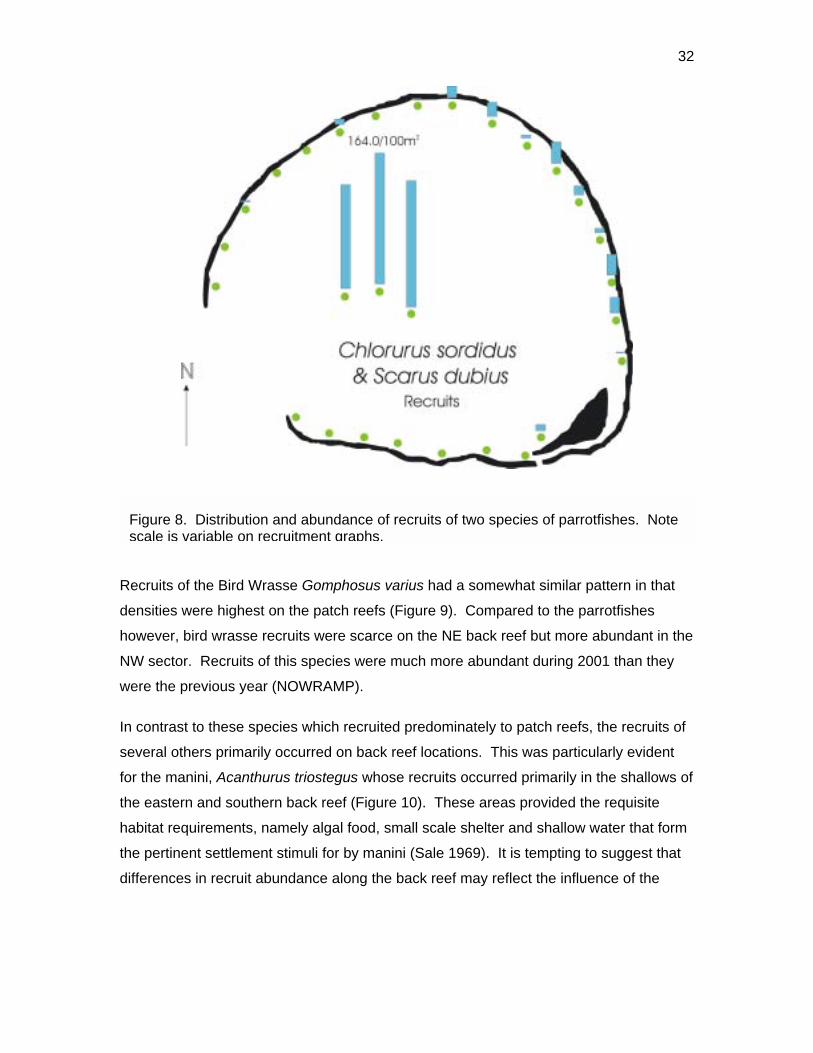
Recruits of the Bird Wrasse Gomphosus varius had a somewhat similar pattern in that
densities were highest on the patch reefs (Figure 9). Compared to the parrotfishes
however, bird wrasse recruits were scarce on the NE back reef but more abundant in the
NW sector. Recruits of this species were much more abundant during 2001 than they
were the previous year (NOWRAMP).
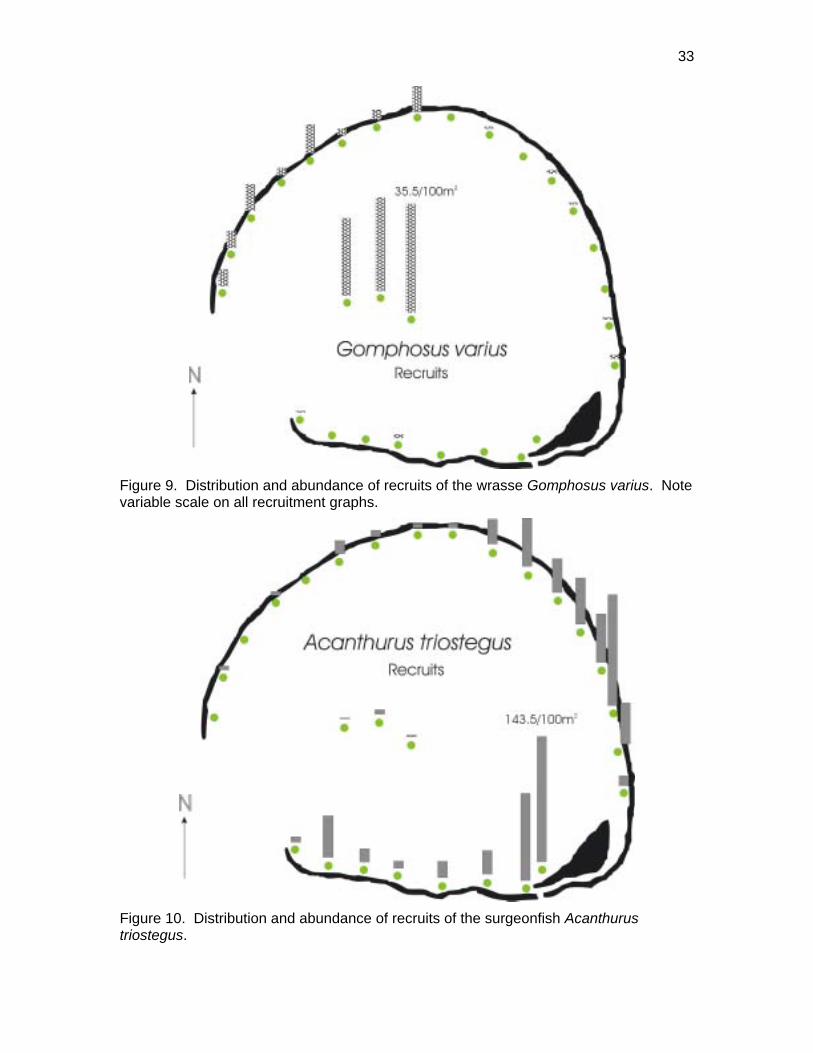
In contrast to these species which recruited predominately to patch reefs, the recruits of
several others primarily occurred on back reef locations. This was particularly evident
for the manini, Acanthurus triostegus whose recruits occurred primarily in the shallows of
the eastern and southern back reef (Figure 10). These areas provided the requisite
habitat requirements, namely algal food, small scale shelter and shallow water that form
the pertinent settlement stimuli for by manini (Sale 1969). It is tempting to suggest that
differences in recruit abundance along the back reef may reflect the influence of the
Figure 8. Distribution and abundance of recruits of two species of parrotfishes. Note scale is variable on recruitment graphs.
33
Figure 9. Distribution and abundance of recruits of the wrasse Gomphosus varius. Note variable scale on all recruitment graphs.
Figure 10. Distribution and abundance of recruits of the surgeonfish Acanthurustriostegus.
34
predominately northeast to southwest tradewind driven flow of water cross the atoll (Dana, 1971).
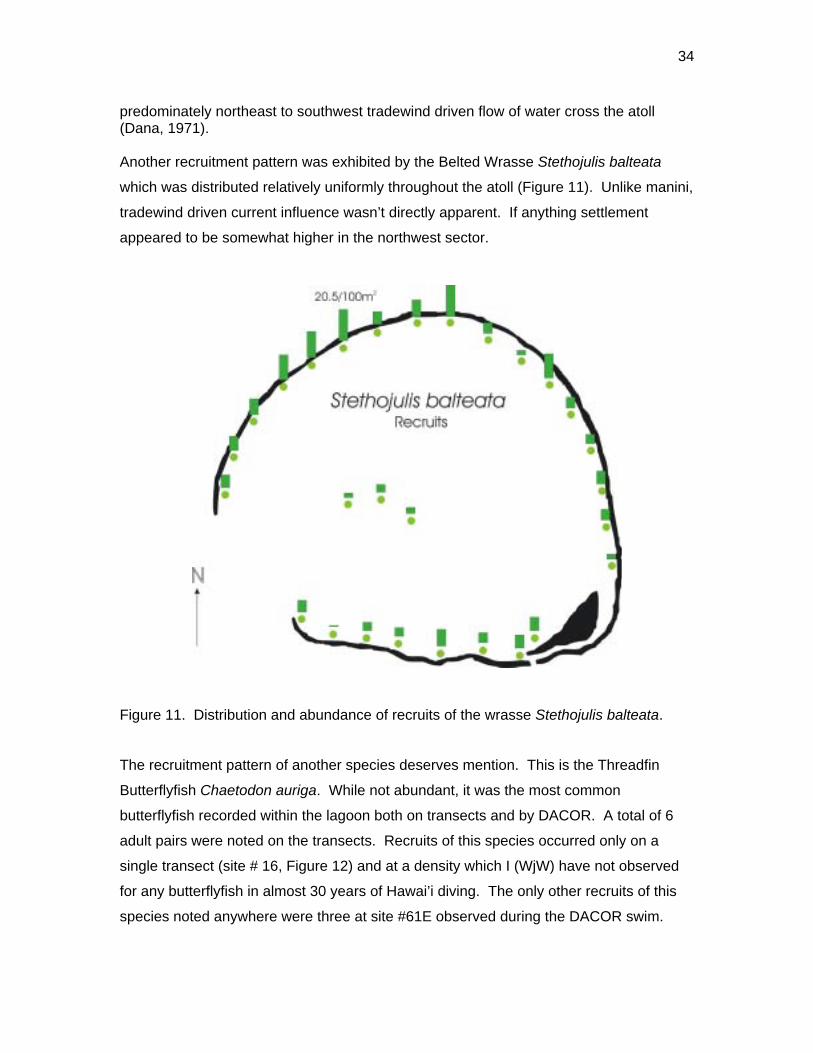
Another recruitment pattern was exhibited by the Belted Wrasse Stethojulis balteata
which was distributed relatively uniformly throughout the atoll (Figure 11). Unlike manini,
tradewind driven current influence wasn’t directly apparent. If anything settlement
appeared to be somewhat higher in the northwest sector.
Figure 11. Distribution and abundance of recruits of the wrasse Stethojulis balteata.
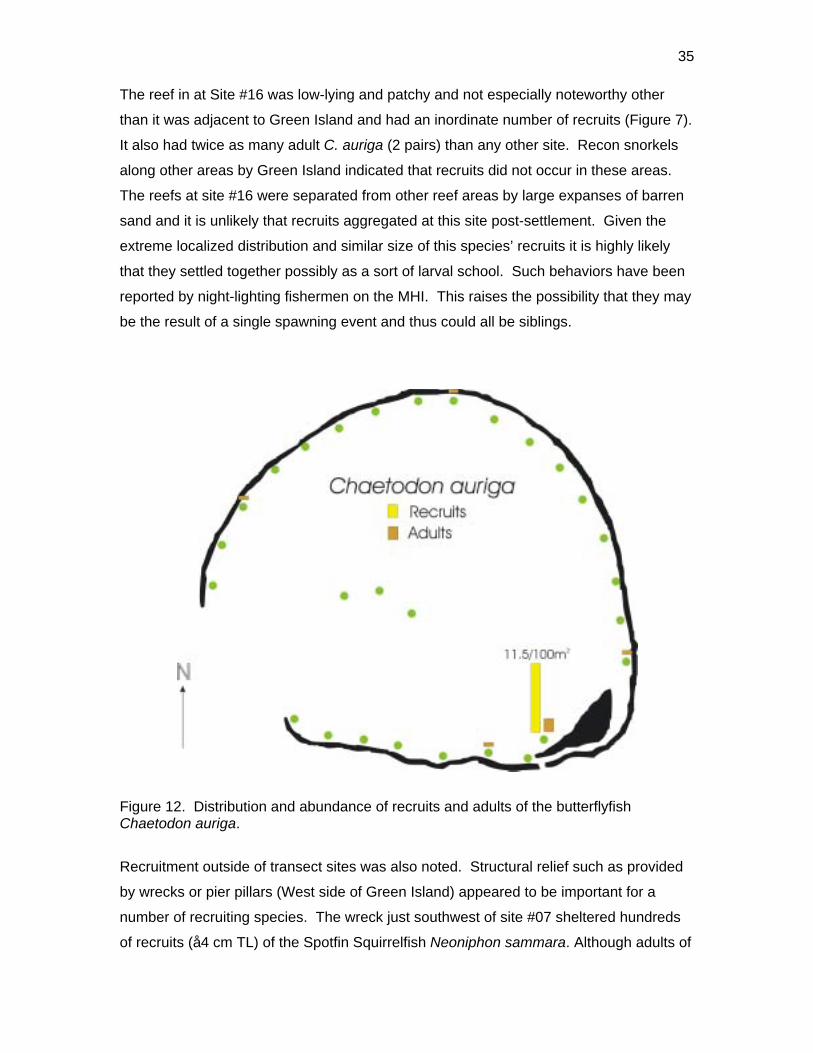
The recruitment pattern of another species deserves mention. This is the Threadfin
Butterflyfish Chaetodon auriga. While not abundant, it was the most common
butterflyfish recorded within the lagoon both on transects and by DACOR. A total of 6
adult pairs were noted on the transects. Recruits of this species occurred only on a
single transect (site # 16, Figure 12) and at a density which I (WjW) have not observed
for any butterflyfish in almost 30 years of Hawai’i diving. The only other recruits of this
species noted anywhere were three at site #61E observed during the DACOR swim.
35
The reef in at Site #16 was low-lying and patchy and not especially noteworthy other
than it was adjacent to Green Island and had an inordinate number of recruits (Figure 7).
It also had twice as many adult C. auriga (2 pairs) than any other site. Recon snorkels
along other areas by Green Island indicated that recruits did not occur in these areas.
The reefs at site #16 were separated from other reef areas by large expanses of barren
sand and it is unlikely that recruits aggregated at this site post-settlement. Given the
extreme localized distribution and similar size of this species’ recruits it is highly likely
that they settled together possibly as a sort of larval school. Such behaviors have been
reported by night-lighting fishermen on the MHI. This raises the possibility that they may
be the result of a single spawning event and thus could all be siblings.
Figure 12. Distribution and abundance of recruits and adults of the butterflyfish Chaetodon auriga.
Recruitment outside of transect sites was also noted. Structural relief such as provided
by wrecks or pier pillars (West side of Green Island) appeared to be important for a
number of recruiting species. The wreck just southwest of site #07 sheltered hundreds
of recruits (å4 cm TL) of the Spotfin Squirrelfish Neoniphon sammara. Although adults of
36
this species were widely distributed at Kure (71% of sites) recruits were observed only at
this wreck. Although no recent recruits of M. vanicolensis were seen on the wrecks,
small individuals (12cm TL) were abundant and likely represent earlier recruitment
events.
The pier by Green Island also harbored substantial numbers of recruits and juveniles of
Ǖholehole (Kuhlia xenura) and moi (Polydactylus sexfilis). While Ǖholehole were fairly
abundant in many areas just below the edge of the beach, they seemed to be more
concentrated in the area around the pier. Small Ǖholehole were not seen in the two
locations where adults were found.
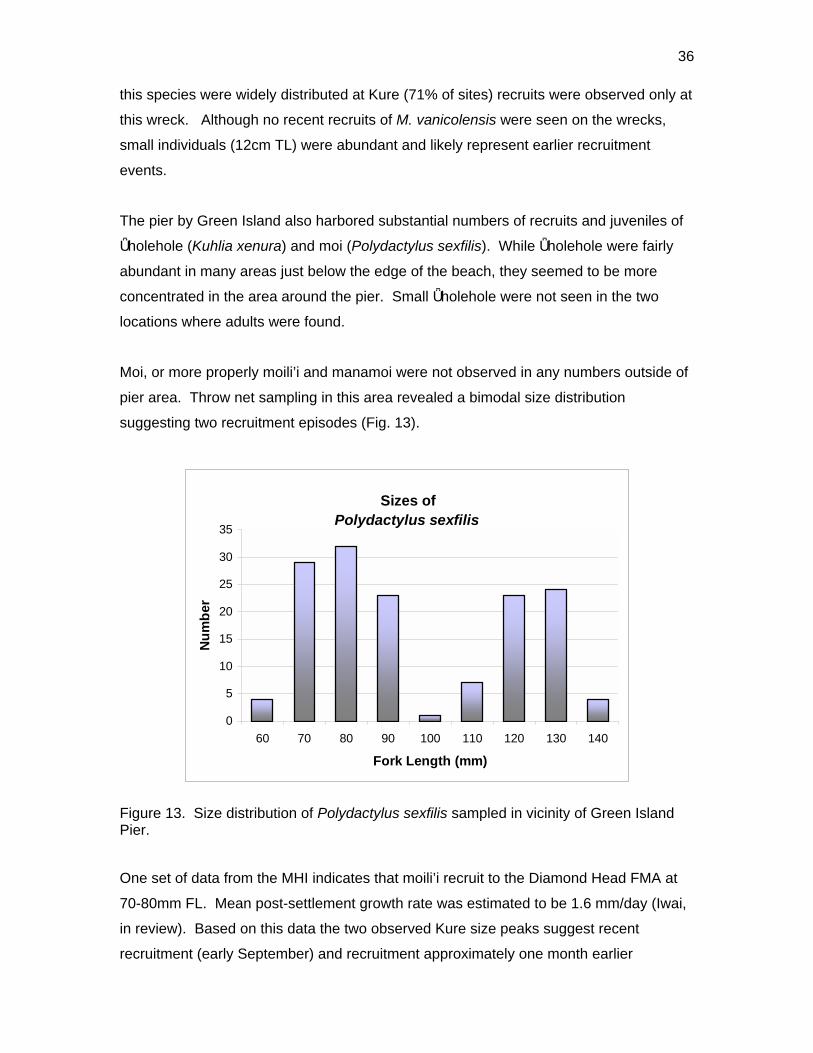
Moi, or more properly moili’i and manamoi were not observed in any numbers outside of
pier area. Throw net sampling in this area revealed a bimodal size distribution
suggesting two recruitment episodes (Fig. 13).
Sizes of Polydactylus sexfilis
0
5
10
15
20
25
30
35
60 70 80 90 100 110 120 130 140
Fork Length (mm)
Num
ber
Figure 13. Size distribution of Polydactylus sexfilis sampled in vicinity of Green Island Pier.
One set of data from the MHI indicates that moili’i recruit to the Diamond Head FMA at
70-80mm FL. Mean post-settlement growth rate was estimated to be 1.6 mm/day (Iwai,
in review). Based on this data the two observed Kure size peaks suggest recent
recruitment (early September) and recruitment approximately one month earlier
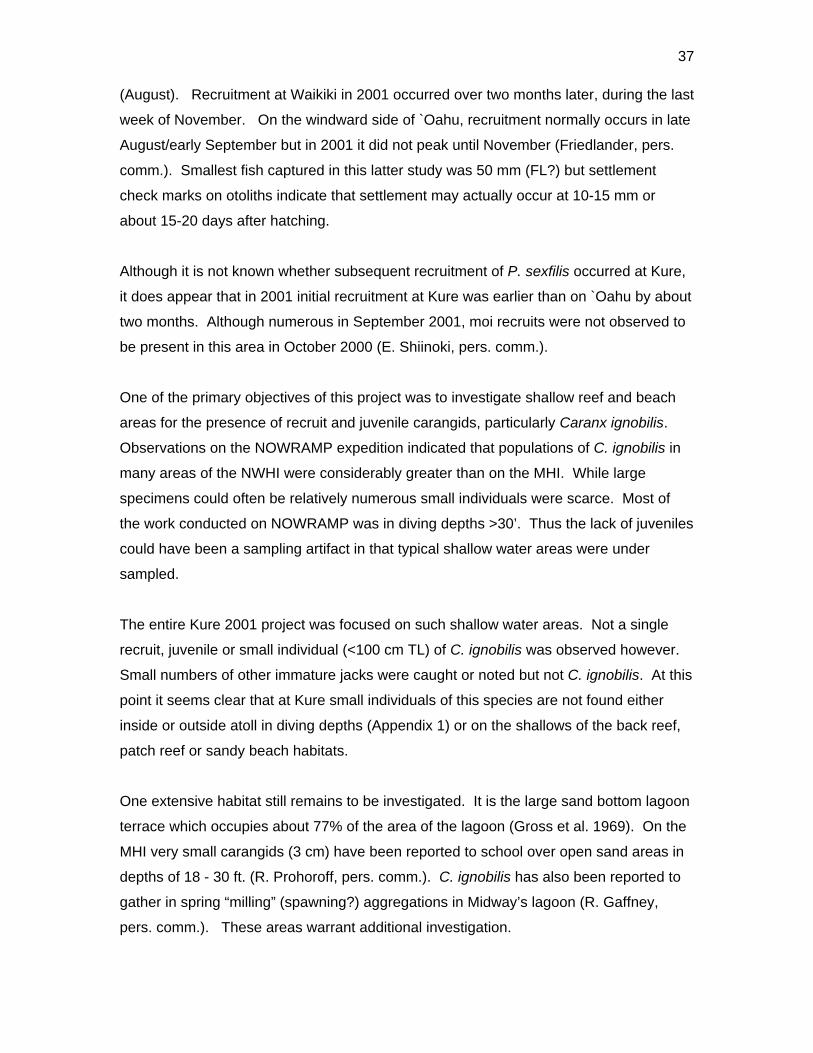
37
(August). Recruitment at Waikiki in 2001 occurred over two months later, during the last
week of November. On the windward side of `Oahu, recruitment normally occurs in late
August/early September but in 2001 it did not peak until November (Friedlander, pers.
comm.). Smallest fish captured in this latter study was 50 mm (FL?) but settlement
check marks on otoliths indicate that settlement may actually occur at 10-15 mm or
about 15-20 days after hatching.
Although it is not known whether subsequent recruitment of P. sexfilis occurred at Kure,
it does appear that in 2001 initial recruitment at Kure was earlier than on `Oahu by about
two months. Although numerous in September 2001, moi recruits were not observed to
be present in this area in October 2000 (E. Shiinoki, pers. comm.).
One of the primary objectives of this project was to investigate shallow reef and beach
areas for the presence of recruit and juvenile carangids, particularly Caranx ignobilis.
Observations on the NOWRAMP expedition indicated that populations of C. ignobilis in
many areas of the NWHI were considerably greater than on the MHI. While large
specimens could often be relatively numerous small individuals were scarce. Most of
the work conducted on NOWRAMP was in diving depths >30’. Thus the lack of juveniles
could have been a sampling artifact in that typical shallow water areas were under
sampled.
The entire Kure 2001 project was focused on such shallow water areas. Not a single
recruit, juvenile or small individual (<100 cm TL) of C. ignobilis was observed however.
Small numbers of other immature jacks were caught or noted but not C. ignobilis. At this
point it seems clear that at Kure small individuals of this species are not found either
inside or outside atoll in diving depths (Appendix 1) or on the shallows of the back reef,
patch reef or sandy beach habitats.
One extensive habitat still remains to be investigated. It is the large sand bottom lagoon
terrace which occupies about 77% of the area of the lagoon (Gross et al. 1969). On the
MHI very small carangids (3 cm) have been reported to school over open sand areas in
depths of 18 - 30 ft. (R. Prohoroff, pers. comm.). C. ignobilis has also been reported to
gather in spring “milling” (spawning?) aggregations in Midway’s lagoon (R. Gaffney,
pers. comm.). These areas warrant additional investigation.
38
Sediment Analysis
During the 2000 NOWRAMP expedition, near-shore sediment samples were collected
from 36 sites at six of the NWHI. Analyses of the samples for over 70 different
potentially toxic contaminants revealed that chemical concentrations were unexpectedly
high at several locations particularly at Midway and Kure. Concentrations are
considered high if they are above the 85th percentile of concentrations measured in the
coastal United States by the NOAA National Status and Trends (NS&T) Program
(Maragos and Gulko 2002). Such high concentrations of contaminants are remarkable
in that these levels were found in sediments that were over 99% sand and gravel, not
fine-grained ones such as those measured by the NS&T Program (D. Turgeon, pers.
comm.)
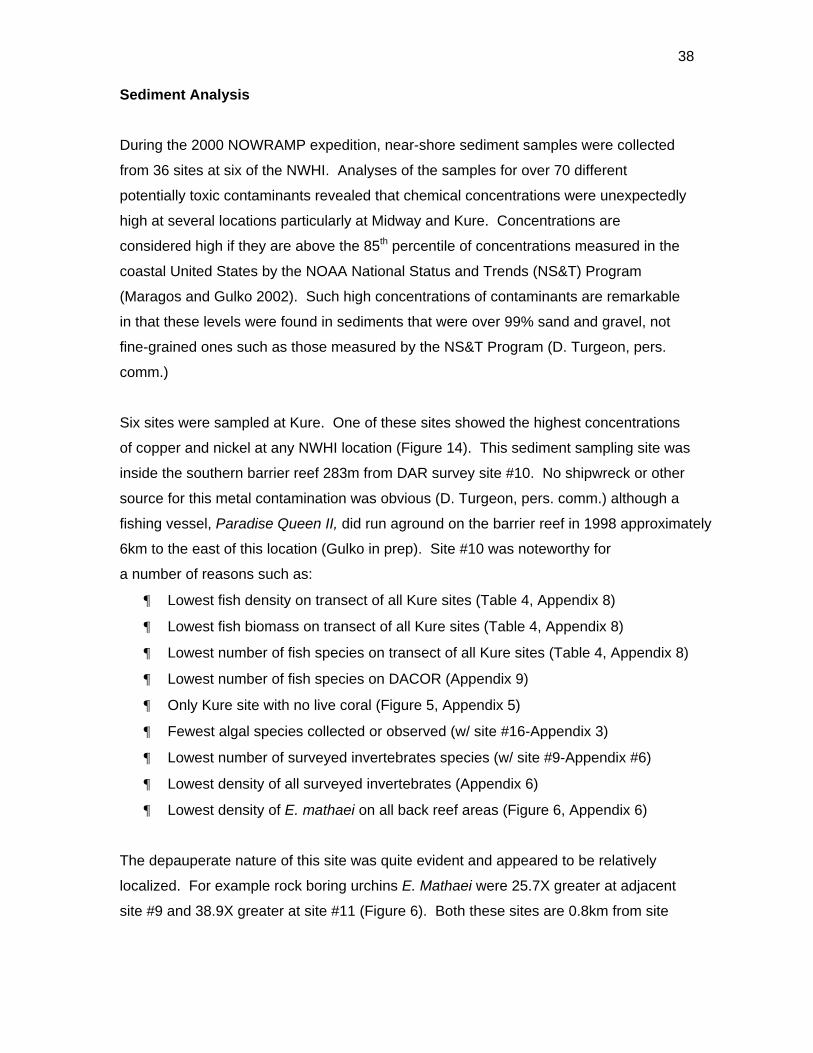
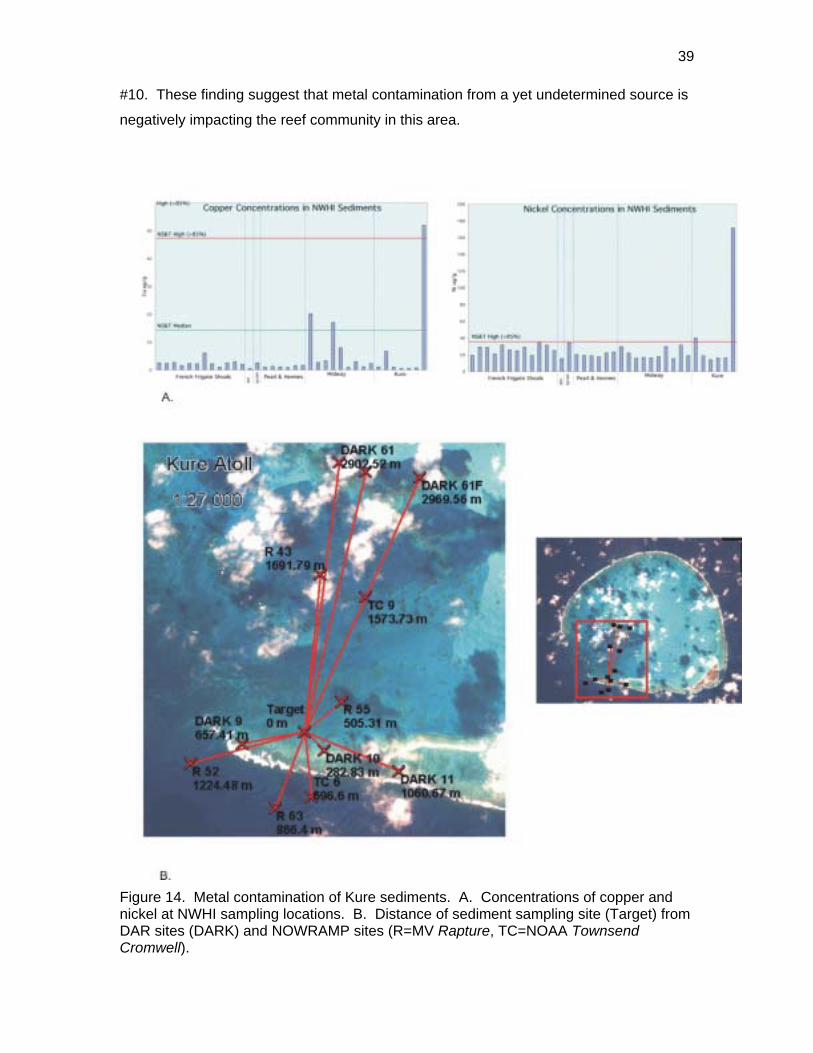
Six sites were sampled at Kure. One of these sites showed the highest concentrations
of copper and nickel at any NWHI location (Figure 14). This sediment sampling site was
inside the southern barrier reef 283m from DAR survey site #10. No shipwreck or other
source for this metal contamination was obvious (D. Turgeon, pers. comm.) although a
fishing vessel, Paradise Queen II, did run aground on the barrier reef in 1998 approximately
6km to the east of this location (Gulko in prep). Site #10 was noteworthy for
a number of reasons such as:
¶ Lowest fish density on transect of all Kure sites (Table 4, Appendix 8)
¶ Lowest fish biomass on transect of all Kure sites (Table 4, Appendix 8)
¶ Lowest number of fish species on transect of all Kure sites (Table 4, Appendix 8)
¶ Lowest number of fish species on DACOR (Appendix 9)
¶ Only Kure site with no live coral (Figure 5, Appendix 5)
¶ Fewest algal species collected or observed (w/ site #16-Appendix 3)
¶ Lowest number of surveyed invertebrates species (w/ site #9-Appendix #6)
¶ Lowest density of all surveyed invertebrates (Appendix 6)
¶ Lowest density of E. mathaei on all back reef areas (Figure 6, Appendix 6)
The depauperate nature of this site was quite evident and appeared to be relatively
localized. For example rock boring urchins E. Mathaei were 25.7X greater at adjacent
site #9 and 38.9X greater at site #11 (Figure 6). Both these sites are 0.8km from site
39
#10. These finding suggest that metal contamination from a yet undetermined source is
negatively impacting the reef community in this area.
Figure 14. Metal contamination of Kure sediments. A. Concentrations of copper and nickel at NWHI sampling locations. B. Distance of sediment sampling site (Target) from DAR sites (DARK) and NOWRAMP sites (R=MV Rapture, TC=NOAA TownsendCromwell).
40
CONCLUSIONS
¶ Low relief, exposed carbonate pavement interspersed with coral rubble and sand
patches were the major structural elements of the atoll’s back reef. Live coral in
these areas was low lying, patchy and uncommon. Although coral coverage was
no greater than 10%, diversity was relatively high and corals appeared healthy.
¶ Patch reefs within the lagoon were characterized by high coral cover, diversity
and spatial complexity. Massive colonies of living Porites compressa grew upon
the skeletal remnants of previous colonies implying long term stability of these
areas and substantial age of the colonies.
¶ Algae dominated the benthic community of Kure Atoll. Fifty-three new algal
records were obtained. Species composition of the algal community differs
considerably from the MHI and there were an unusually high proportion of brown
algae. No alien species were noted and no species could be regarded as being
“invasive.”
¶ The blue green alga, Lyngbya majuscula, appears to have an association with
shipwrecks. This species also occurred as drift material within the lagoon and
may have a source outside the atoll. The abundance of the parchment worm
Chaetopterus sp. may likewise be increased by the nearby presence of a
shipwreck.
¶ Kure’s lagoon showcases algal dominance in a healthy even pristine setting.
This serves as a reminder that not all algal dominated coastal areas around the
MHI should be considered problematic or the result of anthropogenic influences.
¶ Rock-boring urchins were a numerically dominant and conspicuous element of
the invertebrate fauna and important algae consumers and bioeroders. Their
density was within the range found on other coral reefs both within and outside of
Hawai`i.
41
¶ With the exception of urchins and sea cucumbers, most invertebrates were not
visibly abundant at the study sites. Pinctada margaritifera were rare and there
were no sightings of Acanthaster planci.
¶ Green turtles, Chelonia mydas were uncommon even though potential food
resources appeared plentiful. Historical records suggest that they may have
been much more abundant in the past.
¶ Fish populations were diverse and robust especially considering the emphasis
placed on the shallow, low relief, shelter-poor, wave stressed back reef habitat.
Overall biomass was dominated by a small number of species and biomass
density was higher than most MLCDs on Oahu.
¶ Endemic species were an especially important element of the fish fauna being
disproportionately represented in terms of the numbers of species, adult fish,
recruits and biomass. No introduced species were present.
¶ Herbivores and benthic invertebrate feeders predominated among the most
abundant fish species. In contrast to other NWHI sites, piscivores were not a
dominant element of the fish fauna.
¶ Relatively few individuals of the White Ulua, Caranx ignobilis were observed
within the lagoon. A high proportion of them (17%) exhibited evidence of
encounters with fishing gear. Other large piscivores were uncommon.
¶ A number of fish species including carangids, labrids and kyphosids exhibited a
clear tendency to be attracted to and aggregate around divers. In the main
Hawaiian Islands this behavior has been attributed to feeding of fish by humans
but it is now appears to occur even without such influence. Some carangids will
follow a moving boat. C. ignobilis will do so for at least 0.8 km. The tendency of
certain fish to congregate around divers may lead to an overestimation of their
overall abundance.
42
¶ Several species of fish had very limited distributions and were concentrated in a
single or relatively few locations making them extremely vulnerable to
disturbances such as fishing or natural perturbations.
¶ The lagoon as a whole, including both back reef and patch reef habitats, was an
important nursery area for a variety of fish species. Several species appeared to
have distinct settlement patterns and recruitment could be extremely localized.
¶ Seasonality of recruitment for observed species was generally quite similar to
that known for the MHI with the notable exception of moi which seemed to have
recruited up to two months earlier than on `Oahu.
¶ Although efforts were specifically made to locate juvenile and small immature C.
ignobilis, none were observed. Their absence may be due to still insufficient
sampling (i.e. sandy lagoon bottom) or alternatively they may, in fact, be
extremely scarce. If the latter is the case the population of these large predators
may have an atypical, top heavy size distribution and thus be extremely
vulnerable to fishing pressure.
¶ Different assessment methodologies generally provided good agreement in
observed patterns subject to the varying expertise and focus of the observer.
¶ Copper and nickel contamination from an unknown source appears to have
negatively impacted the reef community at a back reef site. The effect of this
contamination seems to be relatively localized.
¶ The overall impression of Kure Atoll was that of a vibrant, healthy, largely pristine
ecosystem whose small size, accessibility and unique biological features make it
highly vulnerable to human impact. If this ecosystem is to remain intact, human
influence must be carefully managed and minimized wherever possible.
43
ACKNOWLEDGEMENTS
A number of people were instrumental in making this project a reality. We’d like to thank
Athline Clark of DAR for her efforts both before during and after. John Kahiapo and
Shelly Alexander of DAR were important additions to the field team. Chris Walsh, Dave
Gulko, Lisa Wedding, Brian Tissot and Noe Puniwai assisted in data analysis. Christian
Kerr provided GIS assistance and Stephani Holzwarth of NMFS was helpful in providing
information on NOWRAMP. Alan Friedlander most graciously provided length/weight
fitting parameters. Fieldwork on Kure was made possible with the enthusiastic
assistance of Ethan Shiinoki of the Division of Forestry and Wildlife (DOFAW/DLNR).
Kudos and aloha to the folks at Midway Phoenix Corporation for their logistic support.
During our stay at Kure our thoughts and sympathies were with those affected by the
maelstrom of September 11th. This research was funded by a grant from the National
Center for Ocean and Coastal Science (NA070A0457).
LITERATURE CITED
Abbott, I. A. 1989. Marine algae from the Northwestern Hawaiian Islands. Pac. Sci. 43:
223-233.
Balazs, G.H., R.R. Rice, N. Hoffman, S.K. Murakawa, D.M. Parker, and R.J.
Shallenberger. (in press). Green turtle foraging and resting habitats at Midway Atoll:
Significant findings over 25 years, 1975-2000. Proceed. 21st. Annual Symposium on
Sea Turtle Biology and Conservation, February 24-28, 2001. 5 pp.
Carreiro-Silva, M. and T.R. McClanahan. 2001. Echinoid bioerosion and herbivory on
Kenyan coral reefs: the role of protection from fishing. Jour. Exp. Mar. Biol. Ecol. 262
(2001):133-153.
Dana, T.F. 1971. On the reef corals of the world’s most northern atoll (Kure: Hawaiian
archipelago). Pac. Sci. 25: 80-87.
44
DeMartini, E.E. (in review). Habitat affinities and endemism of recruits to shallow reef
fish populations at two isolated oceanic atolls. Bull. Mar. Sci.
Doty, M.S. 1968. Biological and physical features of Kealakekua Bay, Hawai`i.
University of Hawai`i, Hawai`i Botanical Science Paper No. 8, 210 pp.
Doty, M. S. 1969. The ecology of Honaunau Bay, Hawai`i. University of Hawai`i, Hawai`i
Botanical Science Paper No. 14, 221 pp.
Friedlander, A.M. 2001. Essential fish habitat and the effective design of marine
reserves: Application for marine ornamental fishes. Aquarium Sciences and
conservation 3: 135-150.
Gross, M.G., J.D. Milliman, J.I. Tracey, Jr., and H.S. Ladd. 1969. Marine Geology of
Kure and Midway Atolls, Hawai`i: A preliminary report. Pac. Sci 23:17-25.
Gulko, D.A. (in prep.). Vessel groundings in Hawai`i: Threats and impacts to nearshore
coral reef ecosystems.
Hobson, E.S. and J.R. Chess. 1979. Zooplankters that emerge from the lagoon floor at
night at Kure and Midway Atolls, Hawai`i. Fish. Bull. 77(1) 275-280.
Iwai, TY Jr., et al. (in review). Preliminary investigation into the enhancement of the
Pacific Threadfin, Moi (Polydactylus sexfilis), population within the Waikiki-Diamond
Head Marine Reserve, Oahu, Hawai`i.
Maragos, J. and D. Gulko. 2002. Coral Reef Ecosystems of the Northwestern Hawaiian
Islands: Interim Results Emphasizing the 2000 Surveys. U.S. Fish and Wildlife Service
and the Hawai`i Department of Land and Natural Resources, Honolulu, Hawai`i. 46 pp.
Morrell, G. Jr. 1841. A narrative of four voyages to the south seas, north and south
Pacific Ocean, Chinese Sea, Ethiopia, and southern Atlantic Ocean, Indian and Antarctic
Ocean from the year 1822 to 1831. Harper Bros. New York. 92 pp.
45
Ogden N.B., J.C. Ogden, and I.A. Abbott. 1989. Distribution, abundance and food of sea
urchins on a leeward Hawaiian reef. Bull. Mar. Sci. 45(2):539-549.
Randall, J.E. 1998. Zoogeography of Shore Fishes of the Indo-Pacific Region.
Zoological Studies 37(4): 227-268.
Russell, D.J. and G.H. Balazs. 2000. Identification manual for dietary vegetation of the
Hawaiian Green Turtle Chelonia mydas. NOAA Technical Memorandum, NOAA-TM-
NMFS-SWFSC-294, 49 pp.
Sale, P.F. 1969. Pertinent stimuli for habitat selection by the juvenile manini,
Acanthurus triostegus sandvicensis. Ecology 50(4):616-623.
Balazs, G. H. 1979. Marine benthic algae collected from Kure Atoll, Maro Reef and
Necker Bank, Northwestern Hawaiian Islands. ‘Elepaio 39: 110-111.
Tsuda, R. T. 1965. Marine algae from Laysan Island with additional notes on the
vascular flora. Atoll Research Bulletin 110: 1-31.
Woodward, P.W. 1972. The natural history of Kure Atoll, Northwestern Hawaiian
Islands. Atoll Research Bull. 164: 1-318.
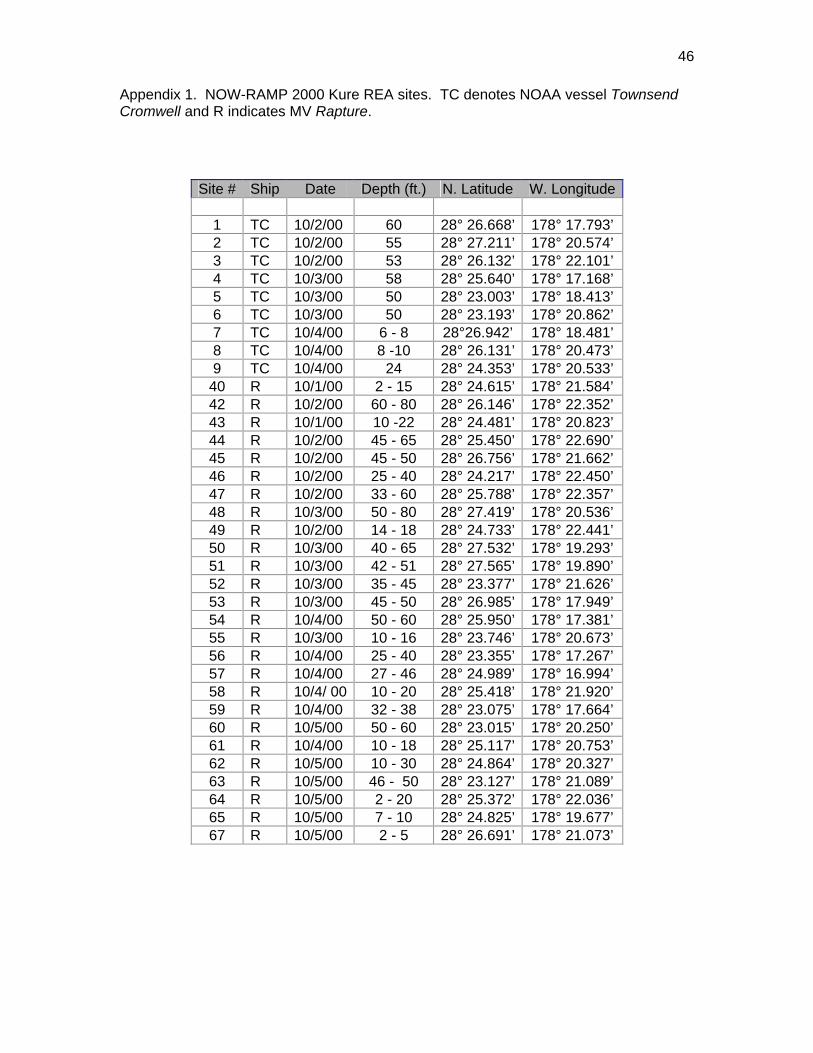
46
Appendix 1. NOW-RAMP 2000 Kure REA sites. TC denotes NOAA vessel Townsend Cromwell and R indicates MV Rapture.
Site # Ship Date Depth (ft.) N. Latitude W. Longitude
1 TC 10/2/00 60 28° 26.668’ 178° 17.793’ 2 TC 10/2/00 55 28° 27.211’ 178° 20.574’ 3 TC 10/2/00 53 28° 26.132’ 178° 22.101’ 4 TC 10/3/00 58 28° 25.640’ 178° 17.168’ 5 TC 10/3/00 50 28° 23.003’ 178° 18.413’ 6 TC 10/3/00 50 28° 23.193’ 178° 20.862’ 7 TC 10/4/00 6 - 8 28°26.942’ 178° 18.481’ 8 TC 10/4/00 8 -10 28° 26.131’ 178° 20.473’ 9 TC 10/4/00 24 28° 24.353’ 178° 20.533’
40 R 10/1/00 2 - 15 28° 24.615’ 178° 21.584’ 42 R 10/2/00 60 - 80 28° 26.146’ 178° 22.352’ 43 R 10/1/00 10 -22 28° 24.481’ 178° 20.823’ 44 R 10/2/00 45 - 65 28° 25.450’ 178° 22.690’ 45 R 10/2/00 45 - 50 28° 26.756’ 178° 21.662’ 46 R 10/2/00 25 - 40 28° 24.217’ 178° 22.450’ 47 R 10/2/00 33 - 60 28° 25.788’ 178° 22.357’ 48 R 10/3/00 50 - 80 28° 27.419’ 178° 20.536’ 49 R 10/2/00 14 - 18 28° 24.733’ 178° 22.441’ 50 R 10/3/00 40 - 65 28° 27.532’ 178° 19.293’ 51 R 10/3/00 42 - 51 28° 27.565’ 178° 19.890’ 52 R 10/3/00 35 - 45 28° 23.377’ 178° 21.626’ 53 R 10/3/00 45 - 50 28° 26.985’ 178° 17.949’ 54 R 10/4/00 50 - 60 28° 25.950’ 178° 17.381’ 55 R 10/3/00 10 - 16 28° 23.746’ 178° 20.673’ 56 R 10/4/00 25 - 40 28° 23.355’ 178° 17.267’ 57 R 10/4/00 27 - 46 28° 24.989’ 178° 16.994’ 58 R 10/4/ 00 10 - 20 28° 25.418’ 178° 21.920’ 59 R 10/4/00 32 - 38 28° 23.075’ 178° 17.664’ 60 R 10/5/00 50 - 60 28° 23.015’ 178° 20.250’ 61 R 10/4/00 10 - 18 28° 25.117’ 178° 20.753’ 62 R 10/5/00 10 - 30 28° 24.864’ 178° 20.327’ 63 R 10/5/00 46 - 50 28° 23.127’ 178° 21.089’ 64 R 10/5/00 2 - 20 28° 25.372’ 178° 22.036’ 65 R 10/5/00 7 - 10 28° 24.825’ 178° 19.677’ 67 R 10/5/00 2 - 5 28° 26.691’ 178° 21.073’
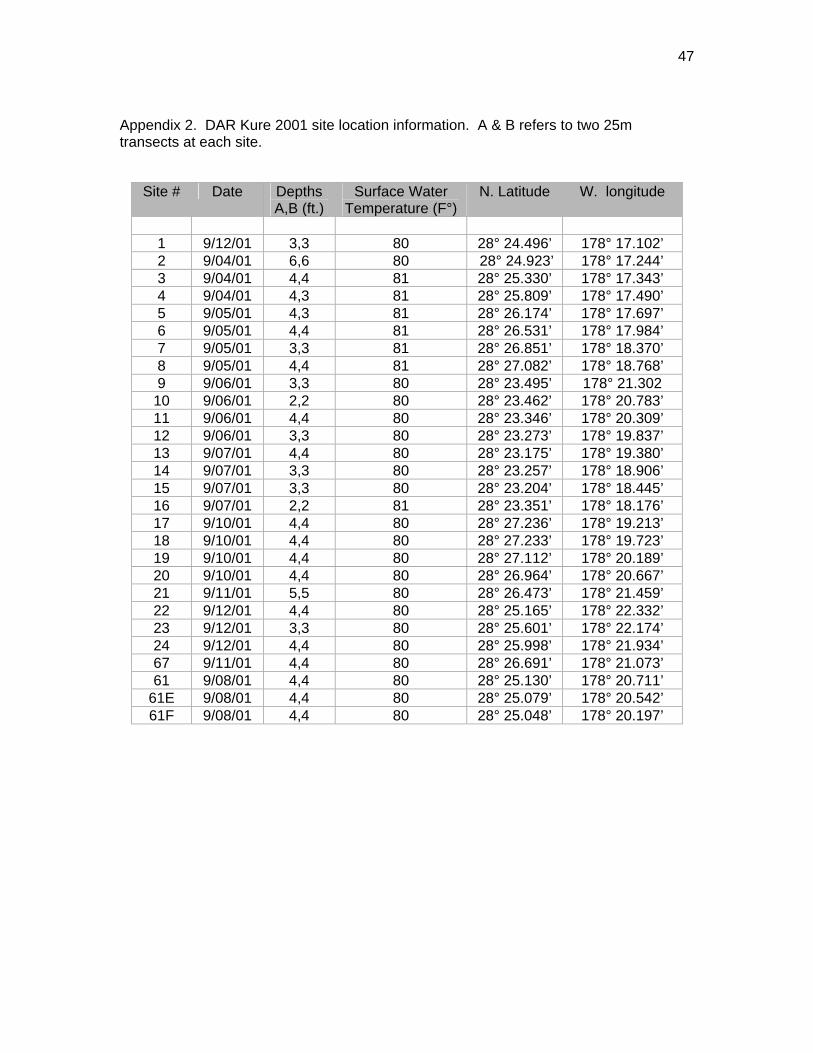
47
Appendix 2. DAR Kure 2001 site location information. A & B refers to two 25m transects at each site.
Site # Date DepthsA,B (ft.)
Surface Water Temperature (F°)
N. Latitude W. longitude
1 9/12/01 3,3 80 28° 24.496’ 178° 17.102’ 2 9/04/01 6,6 80 28° 24.923’ 178° 17.244’ 3 9/04/01 4,4 81 28° 25.330’ 178° 17.343’ 4 9/04/01 4,3 81 28° 25.809’ 178° 17.490’ 5 9/05/01 4,3 81 28° 26.174’ 178° 17.697’ 6 9/05/01 4,4 81 28° 26.531’ 178° 17.984’ 7 9/05/01 3,3 81 28° 26.851’ 178° 18.370’ 8 9/05/01 4,4 81 28° 27.082’ 178° 18.768’ 9 9/06/01 3,3 80 28° 23.495’ 178° 21.302
10 9/06/01 2,2 80 28° 23.462’ 178° 20.783’ 11 9/06/01 4,4 80 28° 23.346’ 178° 20.309’ 12 9/06/01 3,3 80 28° 23.273’ 178° 19.837’ 13 9/07/01 4,4 80 28° 23.175’ 178° 19.380’ 14 9/07/01 3,3 80 28° 23.257’ 178° 18.906’ 15 9/07/01 3,3 80 28° 23.204’ 178° 18.445’ 16 9/07/01 2,2 81 28° 23.351’ 178° 18.176’ 17 9/10/01 4,4 80 28° 27.236’ 178° 19.213’ 18 9/10/01 4,4 80 28° 27.233’ 178° 19.723’ 19 9/10/01 4,4 80 28° 27.112’ 178° 20.189’ 20 9/10/01 4,4 80 28° 26.964’ 178° 20.667’ 21 9/11/01 5,5 80 28° 26.473’ 178° 21.459’ 22 9/12/01 4,4 80 28° 25.165’ 178° 22.332’ 23 9/12/01 3,3 80 28° 25.601’ 178° 22.174’ 24 9/12/01 4,4 80 28° 25.998’ 178° 21.934’ 67 9/11/01 4,4 80 28° 26.691’ 178° 21.073’ 61 9/08/01 4,4 80 28° 25.130’ 178° 20.711’
61E 9/08/01 4,4 80 28° 25.079’ 178° 20.542’ 61F 9/08/01 4,4 80 28° 25.048’ 178° 20.197’
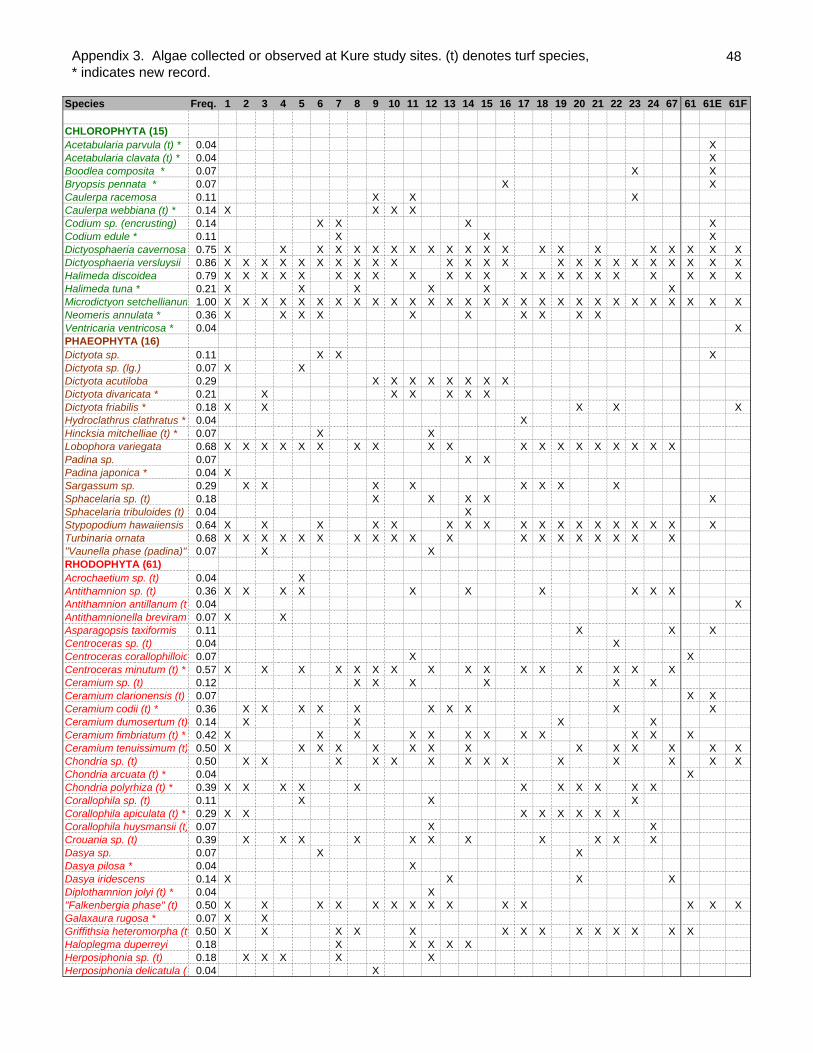
Appendix 3. Algae collected or observed at Kure study sites. (t) denotes turf species, * indicates new record.
48
Species Freq. 1 2 3 4 5 6 7 8 9 10 11 12 13 14 15 16 17 18 19 20 21 22 23 24 67 61 61E 61F
CHLOROPHYTA (15)Acetabularia parvula (t) * 0.04 XAcetabularia clavata (t) * 0.04 XBoodlea composita * 0.07 X XBryopsis pennata * 0.07 X XCaulerpa racemosa 0.11 X X XCaulerpa webbiana (t) * 0.14 X X X XCodium sp. (encrusting) 0.14 X X X XCodium edule * 0.11 X X XDictyosphaeria cavernosa 0.75 X X X X X X X X X X X X X X X X X X X X XDictyosphaeria versluysii 0.86 X X X X X X X X X X X X X X X X X X X X X X X XHalimeda discoidea 0.79 X X X X X X X X X X X X X X X X X X X X X XHalimeda tuna * 0.21 X X X X X XMicrodictyon setchellianum 1.00 X X X X X X X X X X X X X X X X X X X X X X X X X X X XNeomeris annulata * 0.36 X X X X X X X X X XVentricaria ventricosa * 0.04 XPHAEOPHYTA (16)Dictyota sp. 0.11 X X XDictyota sp. (lg.) 0.07 X XDictyota acutiloba 0.29 X X X X X X X XDictyota divaricata * 0.21 X X X X X XDictyota friabilis * 0.18 X X X X XHydroclathrus clathratus * 0.04 XHincksia mitchelliae (t) * 0.07 X XLobophora variegata 0.68 X X X X X X X X X X X X X X X X X X XPadina sp. 0.07 X XPadina japonica * 0.04 XSargassum sp. 0.29 X X X X X X X XSphacelaria sp. (t) 0.18 X X X X XSphacelaria tribuloides (t) 0.04 XStypopodium hawaiiensis 0.64 X X X X X X X X X X X X X X X X X XTurbinaria ornata 0.68 X X X X X X X X X X X X X X X X X X X"Vaunella phase (padina)" 0.07 X XRHODOPHYTA (61)Acrochaetium sp. (t) 0.04 XAntithamnion sp. (t) 0.36 X X X X X X X X X XAntithamnion antillanum (t) 0.04 XAntithamnionella breviramo 0.07 X XAsparagopsis taxiformis 0.11 X X XCentroceras sp. (t) 0.04 XCentroceras corallophilloid 0.07 X XCentroceras minutum (t) * 0.57 X X X X X X X X X X X X X X X XCeramium sp. (t) 0.12 X X X X X XCeramium clarionensis (t) 0.07 X XCeramium codii (t) * 0.36 X X X X X X X X X XCeramium dumosertum (t) 0.14 X X X XCeramium fimbriatum (t) * 0.42 X X X X X X X X X X X XCeramium tenuissimum (t) 0.50 X X X X X X X X X X X X X XChondria sp. (t) 0.50 X X X X X X X X X X X X X XChondria arcuata (t) * 0.04 XChondria polyrhiza (t) * 0.39 X X X X X X X X X X XCorallophila sp. (t) 0.11 X X XCorallophila apiculata (t) * 0.29 X X X X X X X XCorallophila huysmansii (t) 0.07 X XCrouania sp. (t) 0.39 X X X X X X X X X X XDasya sp. 0.07 X XDasya pilosa * 0.04 XDasya iridescens 0.14 X X X XDiplothamnion jolyi (t) * 0.04 X"Falkenbergia phase" (t) 0.50 X X X X X X X X X X X X X XGalaxaura rugosa * 0.07 X XGriffithsia heteromorpha (t) 0.50 X X X X X X X X X X X X X XHaloplegma duperreyi 0.18 X X X X XHerposiphonia sp. (t) 0.18 X X X X XHerposiphonia delicatula (t 0.04 X
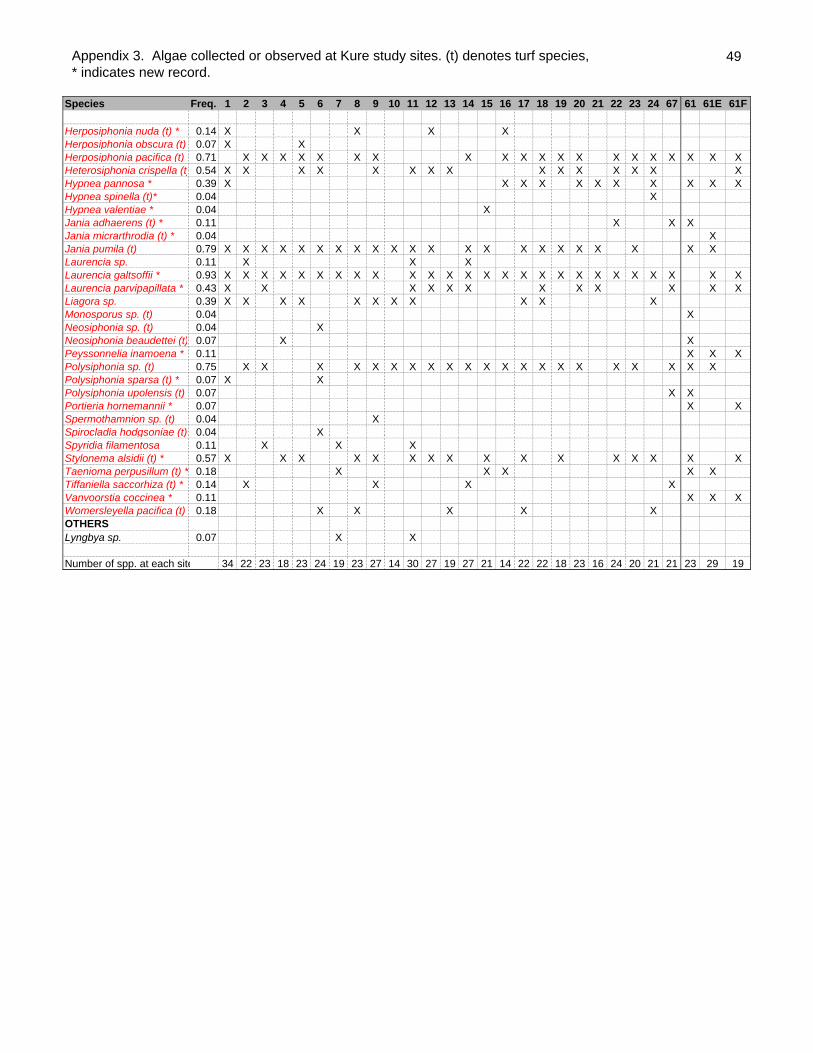
Appendix 3. Algae collected or observed at Kure study sites. (t) denotes turf species, * indicates new record.
49
Species Freq. 1 2 3 4 5 6 7 8 9 10 11 12 13 14 15 16 17 18 19 20 21 22 23 24 67 61 61E 61F
Herposiphonia nuda (t) * 0.14 X X X XHerposiphonia obscura (t) 0.07 X XHerposiphonia pacifica (t) * 0.71 X X X X X X X X X X X X X X X X X X X XHeterosiphonia crispella (t) 0.54 X X X X X X X X X X X X X X XHypnea pannosa * 0.39 X X X X X X X X X X XHypnea spinella (t)* 0.04 XHypnea valentiae * 0.04 XJania adhaerens (t) * 0.11 X X XJania micrarthrodia (t) * 0.04 XJania pumila (t) 0.79 X X X X X X X X X X X X X X X X X X X X X XLaurencia sp. 0.11 X X XLaurencia galtsoffii * 0.93 X X X X X X X X X X X X X X X X X X X X X X X X X XLaurencia parvipapillata * 0.43 X X X X X X X X X X X XLiagora sp. 0.39 X X X X X X X X X X XMonosporus sp. (t) 0.04 XNeosiphonia sp. (t) 0.04 XNeosiphonia beaudettei (t) 0.07 X XPeyssonnelia inamoena * 0.11 X X XPolysiphonia sp. (t) 0.75 X X X X X X X X X X X X X X X X X X X X XPolysiphonia sparsa (t) * 0.07 X XPolysiphonia upolensis (t) 0.07 X XPortieria hornemannii * 0.07 X XSpermothamnion sp. (t) 0.04 XSpirocladia hodgsoniae (t) 0.04 XSpyridia filamentosa 0.11 X X XStylonema alsidii (t) * 0.57 X X X X X X X X X X X X X X X XTaenioma perpusillum (t) * 0.18 X X X X XTiffaniella saccorhiza (t) * 0.14 X X X XVanvoorstia coccinea * 0.11 X X XWomersleyella pacifica (t) 0.18 X X X X XOTHERSLyngbya sp. 0.07 X X
Number of spp. at each site 34 22 23 18 23 24 19 23 27 14 30 27 19 27 21 14 22 22 18 23 16 24 20 21 21 23 29 19
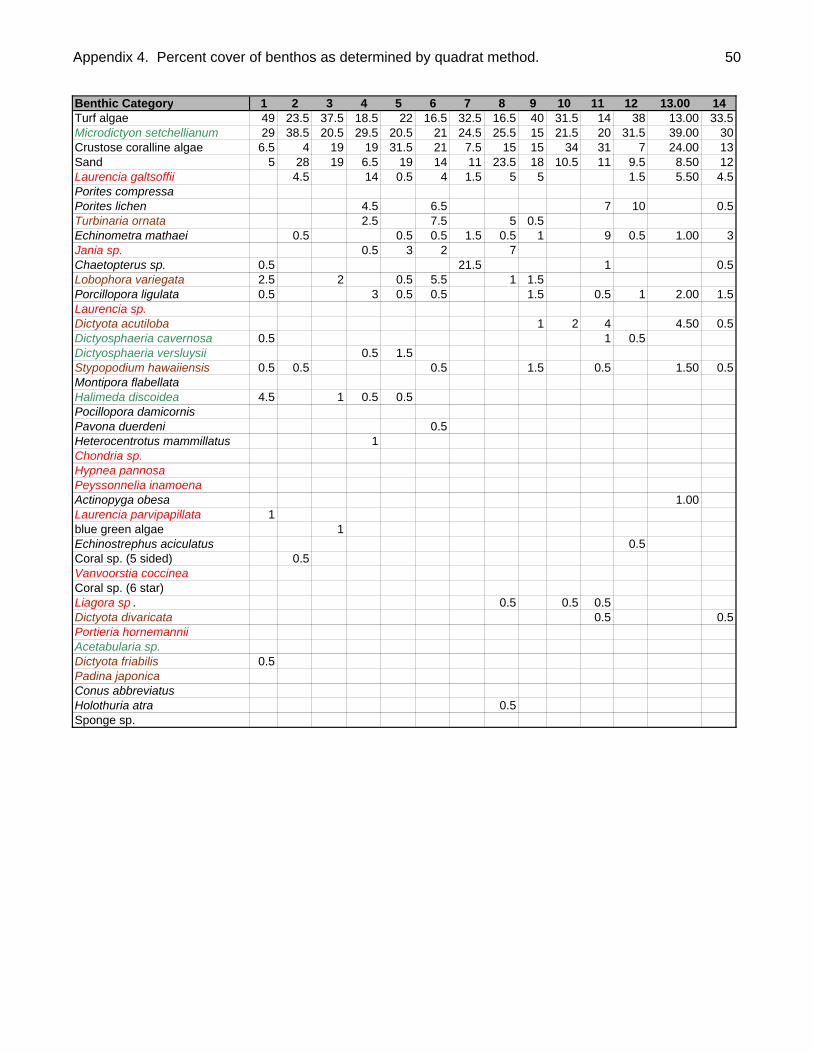
Appendix 4. Percent cover of benthos as determined by quadrat method. 50
Benthic Category 1 2 3 4 5 6 7 8 9 10 11 12 13.00 14Turf algae 49 23.5 37.5 18.5 22 16.5 32.5 16.5 40 31.5 14 38 13.00 33.5Microdictyon setchellianum 29 38.5 20.5 29.5 20.5 21 24.5 25.5 15 21.5 20 31.5 39.00 30Crustose coralline algae 6.5 4 19 19 31.5 21 7.5 15 15 34 31 7 24.00 13Sand 5 28 19 6.5 19 14 11 23.5 18 10.5 11 9.5 8.50 12Laurencia galtsoffii 4.5 14 0.5 4 1.5 5 5 1.5 5.50 4.5Porites compressaPorites lichen 4.5 6.5 7 10 0.5Turbinaria ornata 2.5 7.5 5 0.5Echinometra mathaei 0.5 0.5 0.5 1.5 0.5 1 9 0.5 1.00 3Jania sp. 0.5 3 2 7Chaetopterus sp. 0.5 21.5 1 0.5Lobophora variegata 2.5 2 0.5 5.5 1 1.5Porcillopora ligulata 0.5 3 0.5 0.5 1.5 0.5 1 2.00 1.5Laurencia sp.Dictyota acutiloba 1 2 4 4.50 0.5Dictyosphaeria cavernosa 0.5 1 0.5Dictyosphaeria versluysii 0.5 1.5Stypopodium hawaiiensis 0.5 0.5 0.5 1.5 0.5 1.50 0.5Montipora flabellataHalimeda discoidea 4.5 1 0.5 0.5Pocillopora damicornisPavona duerdeni 0.5Heterocentrotus mammillatus 1Chondria sp.Hypnea pannosaPeyssonnelia inamoenaActinopyga obesa 1.00Laurencia parvipapillata 1blue green algae 1Echinostrephus aciculatus 0.5Coral sp. (5 sided) 0.5Vanvoorstia coccineaCoral sp. (6 star)Liagora sp . 0.5 0.5 0.5Dictyota divaricata 0.5 0.5Portieria hornemanniiAcetabularia sp.Dictyota friabilis 0.5Padina japonicaConus abbreviatusHolothuria atra 0.5Sponge sp.
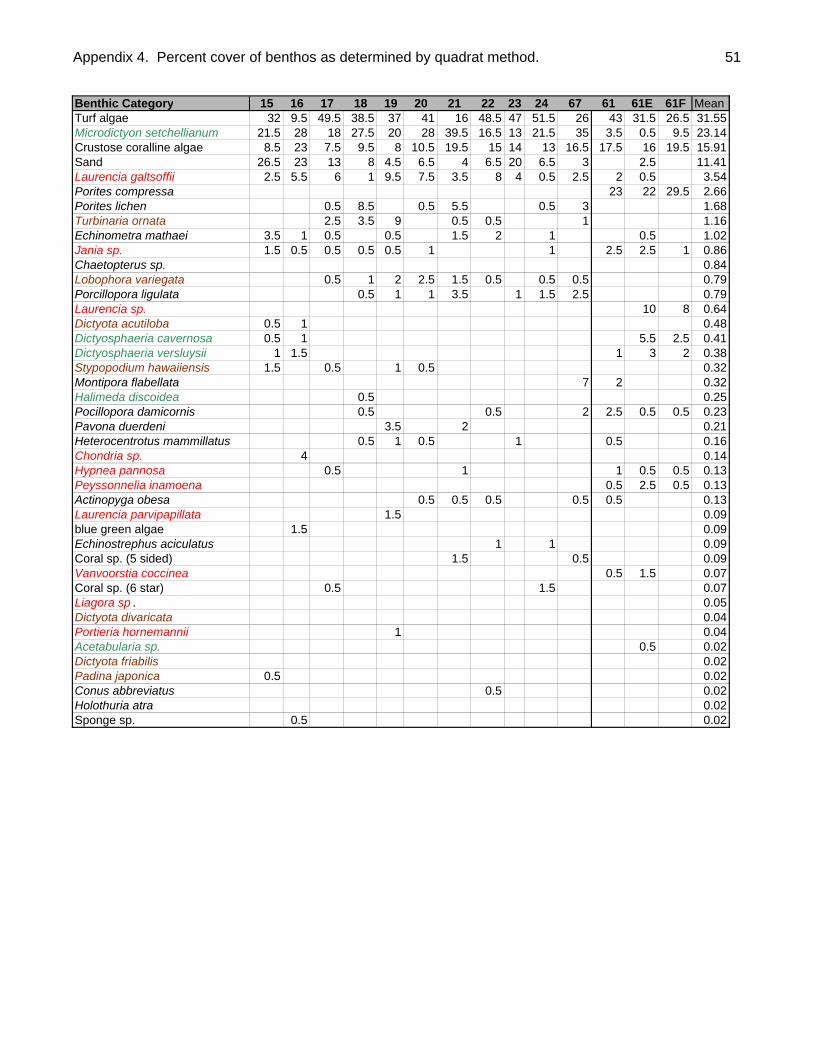
Appendix 4. Percent cover of benthos as determined by quadrat method. 51
Benthic CategoryTurf algaeMicrodictyon setchellianumCrustose coralline algaeSandLaurencia galtsoffiiPorites compressaPorites lichenTurbinaria ornataEchinometra mathaeiJania sp.Chaetopterus sp.Lobophora variegataPorcillopora ligulataLaurencia sp.Dictyota acutilobaDictyosphaeria cavernosaDictyosphaeria versluysiiStypopodium hawaiiensisMontipora flabellataHalimeda discoideaPocillopora damicornisPavona duerdeniHeterocentrotus mammillatusChondria sp.Hypnea pannosaPeyssonnelia inamoenaActinopyga obesaLaurencia parvipapillatablue green algaeEchinostrephus aciculatusCoral sp. (5 sided)Vanvoorstia coccineaCoral sp. (6 star)Liagora sp .Dictyota divaricataPortieria hornemanniiAcetabularia sp.Dictyota friabilisPadina japonicaConus abbreviatusHolothuria atraSponge sp.
15 16 17 18 19 20 21 22 23 24 67 61 61E 61F Mean32 9.5 49.5 38.5 37 41 16 48.5 47 51.5 26 43 31.5 26.5 31.55
21.5 28 18 27.5 20 28 39.5 16.5 13 21.5 35 3.5 0.5 9.5 23.148.5 23 7.5 9.5 8 10.5 19.5 15 14 13 16.5 17.5 16 19.5 15.91
26.5 23 13 8 4.5 6.5 4 6.5 20 6.5 3 2.5 11.412.5 5.5 6 1 9.5 7.5 3.5 8 4 0.5 2.5 2 0.5 3.54
23 22 29.5 2.660.5 8.5 0.5 5.5 0.5 3 1.682.5 3.5 9 0.5 0.5 1 1.16
3.5 1 0.5 0.5 1.5 2 1 0.5 1.021.5 0.5 0.5 0.5 0.5 1 1 2.5 2.5 1 0.86
0.840.5 1 2 2.5 1.5 0.5 0.5 0.5 0.79
0.5 1 1 3.5 1 1.5 2.5 0.7910 8 0.64
0.5 1 0.480.5 1 5.5 2.5 0.41
1 1.5 1 3 2 0.381.5 0.5 1 0.5 0.32
7 2 0.320.5 0.250.5 0.5 2 2.5 0.5 0.5 0.23
3.5 2 0.210.5 1 0.5 1 0.5 0.16
4 0.140.5 1 1 0.5 0.5 0.13
0.5 2.5 0.5 0.130.5 0.5 0.5 0.5 0.5 0.13
1.5 0.091.5 0.09
1 1 0.091.5 0.5 0.09
0.5 1.5 0.070.5 1.5 0.07
0.050.04
1 0.040.5 0.02
0.020.5 0.02
0.5 0.020.02
0.5 0.02
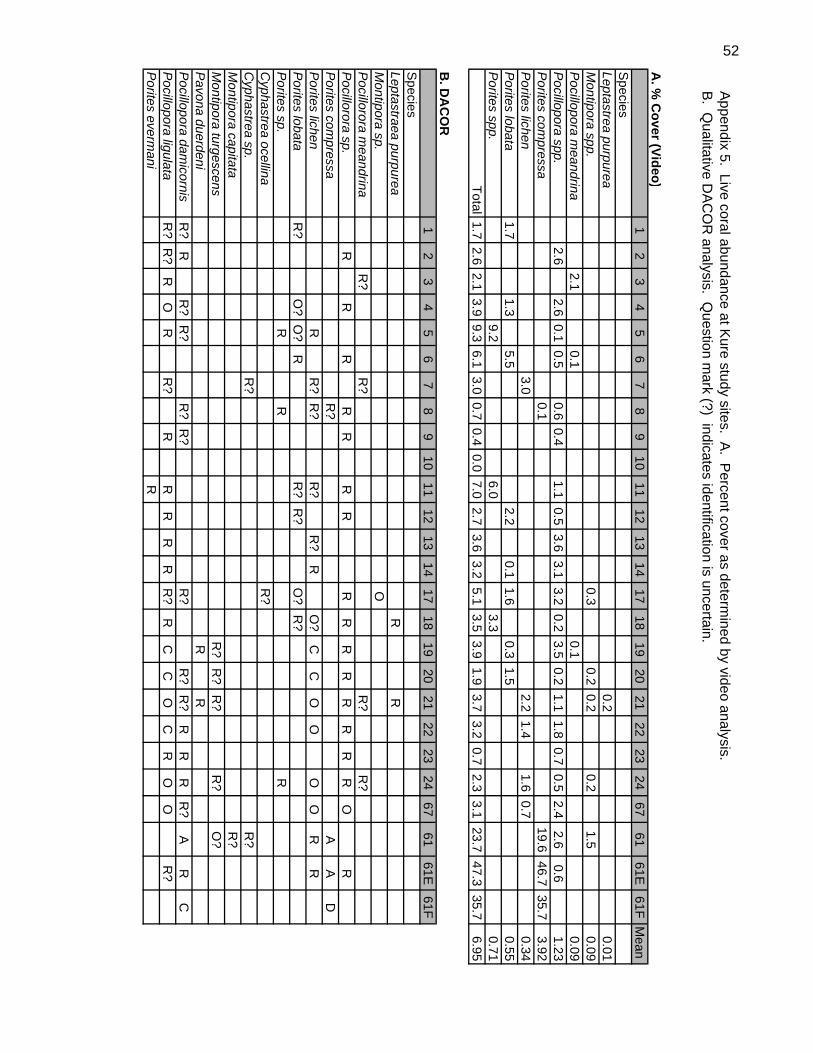
Appendix 5. Live coral abundance at K
ure study sites. A. P
ercent cover as determined by video analysis.
B. Q
ualitative DA
CO
R analysis. Q
uestion mark (?) indicates identification is uncertain.
A. %
Cover (Video)
12
34
56
78
910
1112
1314
1718
1920
2122
2324
6761
61E61F
Mean
Species
Leptastrea purpurea0.2
0.01M
ontipora spp.0.3
0.20.2
0.21.5
0.09P
ocillopora meandrina
2.10.1
0.10.09
Pocillopora spp.
2.62.6
0.10.5
0.60.4
1.10.5
3.63.1
3.20.2
3.50.2
1.11.8
0.70.5
2.42.6
0.61.23
Porites com
pressa0.1
19.646.7
35.73.92
Porites lichen
3.02.2
1.41.6
0.70.34
Porites lobata
1.71.3
5.52.2
0.11.6
0.31.5
0.55P
orites spp.9.2
6.03.3
0.71Total
1.72.6
2.13.9
9.36.1
3.00.7
0.40.0
7.02.7
3.63.2
5.13.5
3.91.9
3.73.2
0.72.3
3.123.7
47.335.7
6.95
B. D
AC
OR
12
34
56
78
910
1112
1314
1718
1920
2122
2324
6761
61E61F
Species
Leptastraea purpureaR
RM
ontipora sp.O
Pocillorora m
eandrinaR
?R
?R
?R
?P
ocillorora sp.R
RR
RR
RR
RR
RR
RR
RR
OR
Porites com
pressaR
?A
AD
Porites lichen
RR
?R
?R
?R
?R
O?
CC
OO
OO
RR
Porites lobata
R?
O?
O?
RR
?R
?O
?R
?P
orites sp. R
RR
Cyphastrea ocellina
R?
Cyphastrea sp.
R?
R?
Montipora capitata
R?
Montipora turgescens
R?
R?
R?
R?
O?
Pavona duerdeni
RR
Pocillopora dam
icornisR
?R
R?
R?
R?
R?
R?
R?
R?
RR
RR
?A
RC
Pocillopora ligulata
R?
R?
RO
RR
?R
RR
RR
R?
RC
CO
CR
OO
R?
Porites everm
aniR
52
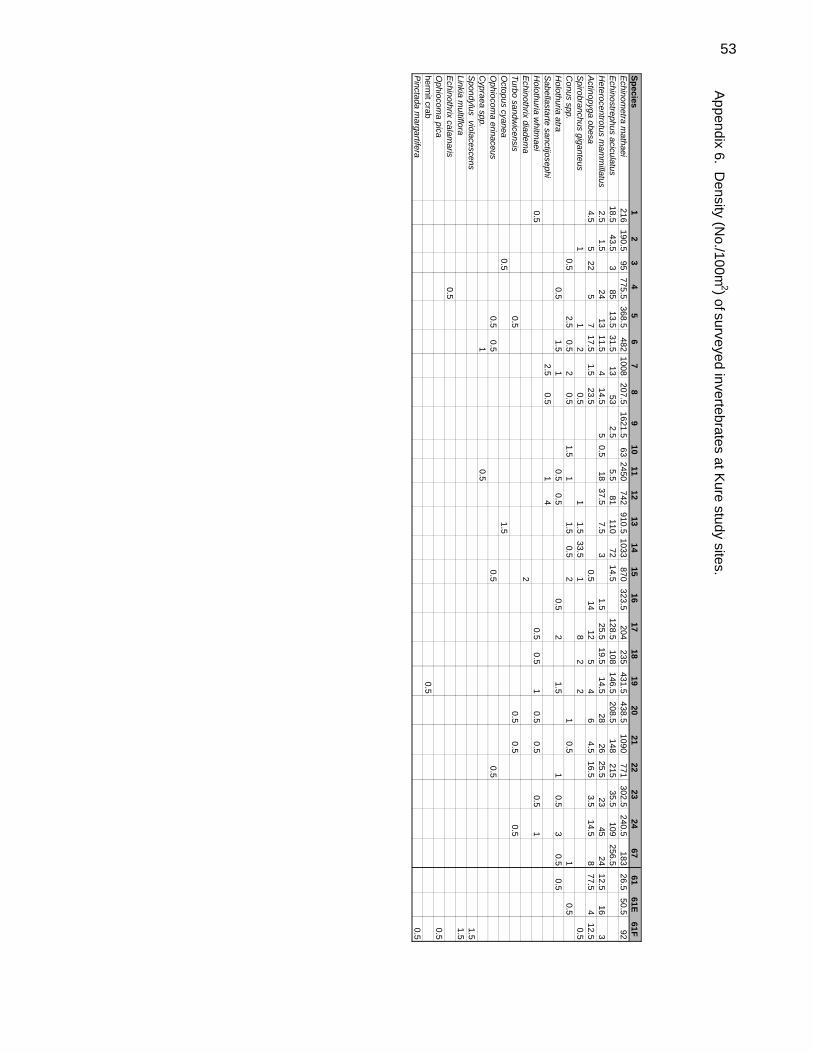
Appendix 6. D
ensity (No./100m
2) ofsurveyed invertebrates at Kure study sites.
Species1
23
45
67
89
1011
1213
1415
1617
1819
2021
2223
2467
6161E
61FE
chinometra m
athaei216
190.595
775.5368.5
4821008
207.51621.5
632450
742910.5
1033870
323.5204
235431.5
438.51090
771302.5
240.5183
26.550.5
92E
chinostrephus aciculatus18.5
43.53
8513.5
31.513
532.5
5.581
11072
14.5128.5
108146.5
208.5148
21535.5
109256.5
Heterocentrotus m
amm
illatus2.5
1.524
1311.5
414.5
50.5
1837.5
7.53
1.525.5
19.514.5
2826
25.523
4524
12.516
3A
ctinopyga obesa4.5
522
57
17.51.5
23.50.5
1412
54
64.5
16.53.5
14.58
77.54
12.5S
pirobranchus giganteus1
12
0.51
1.533.5
18
22
0.5C
onus spp.0.5
2.50.5
20.5
1.51
1.50.5
21
0.51
0.5H
olothuria atra0.5
1.51
0.50.5
0.52
1.51
0.53
0.50.5
Sabellastarte sanctijosephi
2.50.5
14
Holothuria w
hitmaei
0.50.5
0.51
0.50.5
0.51
Echinothrix diadem
a2
Turbo sandwicensis
0.50.5
0.50.5
Octopus cyanea
0.51.5
Ophiocom
a erinaceus0.5
0.50.5
0.5C
ypraea spp.1
0.5S
pondylus violacescens1.5
Linkia multiflora
1.5E
chinothrix calamaris
0.5O
phiocoma pica
0.5herm
it crab0.5
Pinctada m
argartifera0.5
53
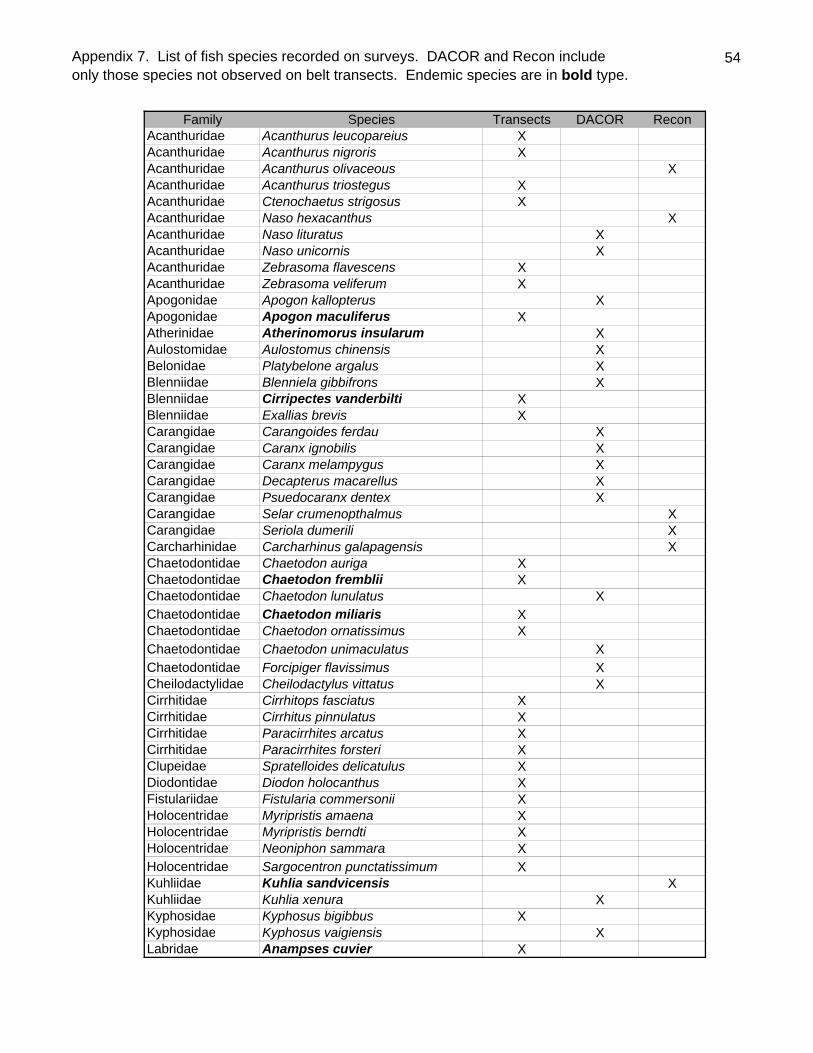
Appendix 7. List of fish species recorded on surveys. DACOR and Recon includeonly those species not observed on belt transects. Endemic species are in bold type.
54
Family Species Transects DACOR ReconAcanthuridae Acanthurus leucopareius XAcanthuridae Acanthurus nigroris XAcanthuridae Acanthurus olivaceous XAcanthuridae Acanthurus triostegus XAcanthuridae Ctenochaetus strigosus XAcanthuridae Naso hexacanthus XAcanthuridae Naso lituratus XAcanthuridae Naso unicornis XAcanthuridae Zebrasoma flavescens XAcanthuridae Zebrasoma veliferum XApogonidae Apogon kallopterus XApogonidae Apogon maculiferus XAtherinidae Atherinomorus insularum XAulostomidae Aulostomus chinensis XBelonidae Platybelone argalus XBlenniidae Blenniela gibbifrons XBlenniidae Cirripectes vanderbilti XBlenniidae Exallias brevis XCarangidae Carangoides ferdau XCarangidae Caranx ignobilis XCarangidae Caranx melampygus XCarangidae Decapterus macarellus XCarangidae Psuedocaranx dentex XCarangidae Selar crumenopthalmus XCarangidae Seriola dumerili XCarcharhinidae Carcharhinus galapagensis XChaetodontidae Chaetodon auriga XChaetodontidae Chaetodon fremblii XChaetodontidae Chaetodon lunulatus XChaetodontidae Chaetodon miliaris XChaetodontidae Chaetodon ornatissimus XChaetodontidae Chaetodon unimaculatus XChaetodontidae Forcipiger flavissimus XCheilodactylidae Cheilodactylus vittatus XCirrhitidae Cirrhitops fasciatus XCirrhitidae Cirrhitus pinnulatus XCirrhitidae Paracirrhites arcatus XCirrhitidae Paracirrhites forsteri XClupeidae Spratelloides delicatulus XDiodontidae Diodon holocanthus XFistulariidae Fistularia commersonii XHolocentridae Myripristis amaena XHolocentridae Myripristis berndti XHolocentridae Neoniphon sammara XHolocentridae Sargocentron punctatissimum XKuhliidae Kuhlia sandvicensis XKuhliidae Kuhlia xenura XKyphosidae Kyphosus bigibbus XKyphosidae Kyphosus vaigiensis XLabridae Anampses cuvier X
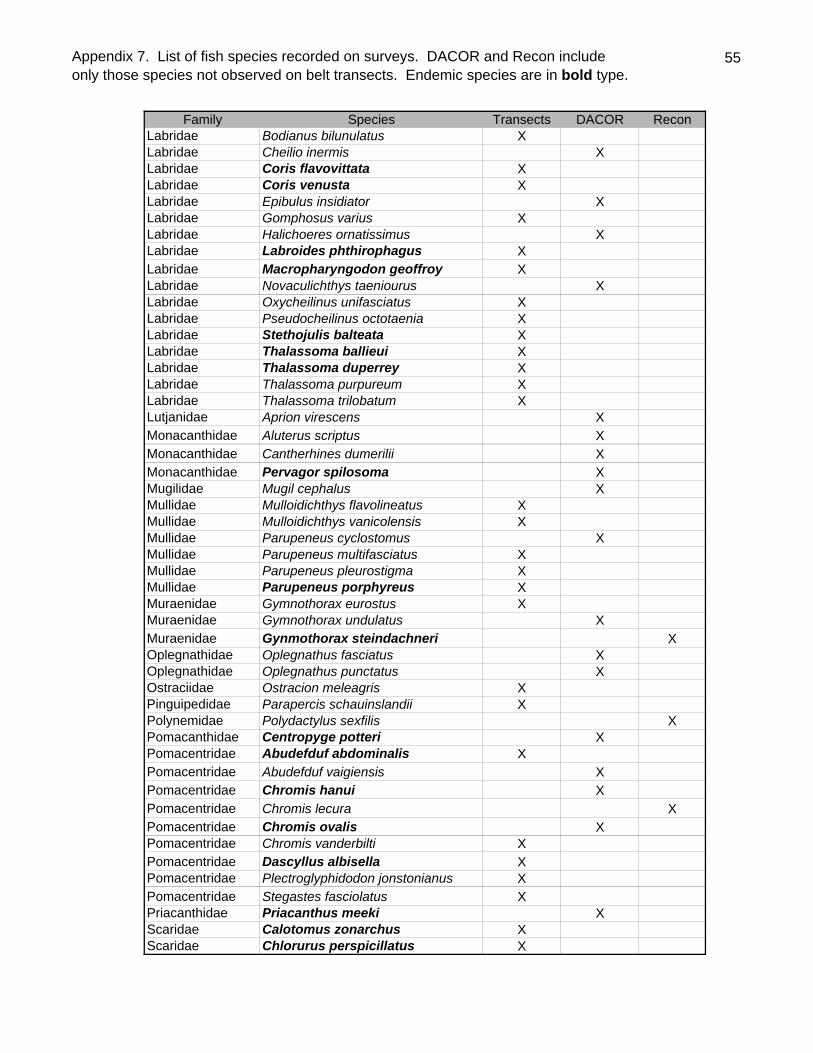
Appendix 7. List of fish species recorded on surveys. DACOR and Recon includeonly those species not observed on belt transects. Endemic species are in bold type.
55
Family Species Transects DACOR ReconLabridae Bodianus bilunulatus XLabridae Cheilio inermis XLabridae Coris flavovittata XLabridae Coris venusta XLabridae Epibulus insidiator XLabridae Gomphosus varius XLabridae Halichoeres ornatissimus XLabridae Labroides phthirophagus XLabridae Macropharyngodon geoffroy XLabridae Novaculichthys taeniourus XLabridae Oxycheilinus unifasciatus XLabridae Pseudocheilinus octotaenia XLabridae Stethojulis balteata XLabridae Thalassoma ballieui XLabridae Thalassoma duperrey XLabridae Thalassoma purpureum XLabridae Thalassoma trilobatum XLutjanidae Aprion virescens XMonacanthidae Aluterus scriptus XMonacanthidae Cantherhines dumerilii XMonacanthidae Pervagor spilosoma XMugilidae Mugil cephalus XMullidae Mulloidichthys flavolineatus XMullidae Mulloidichthys vanicolensis XMullidae Parupeneus cyclostomus XMullidae Parupeneus multifasciatus XMullidae Parupeneus pleurostigma XMullidae Parupeneus porphyreus XMuraenidae Gymnothorax eurostus XMuraenidae Gymnothorax undulatus XMuraenidae Gynmothorax steindachneri XOplegnathidae Oplegnathus fasciatus XOplegnathidae Oplegnathus punctatus XOstraciidae Ostracion meleagris XPinguipedidae Parapercis schauinslandii XPolynemidae Polydactylus sexfilis XPomacanthidae Centropyge potteri XPomacentridae Abudefduf abdominalis XPomacentridae Abudefduf vaigiensis XPomacentridae Chromis hanui XPomacentridae Chromis lecura XPomacentridae Chromis ovalis XPomacentridae Chromis vanderbilti XPomacentridae Dascyllus albisella XPomacentridae Plectroglyphidodon jonstonianus XPomacentridae Stegastes fasciolatus XPriacanthidae Priacanthus meeki XScaridae Calotomus zonarchus XScaridae Chlorurus perspicillatus X
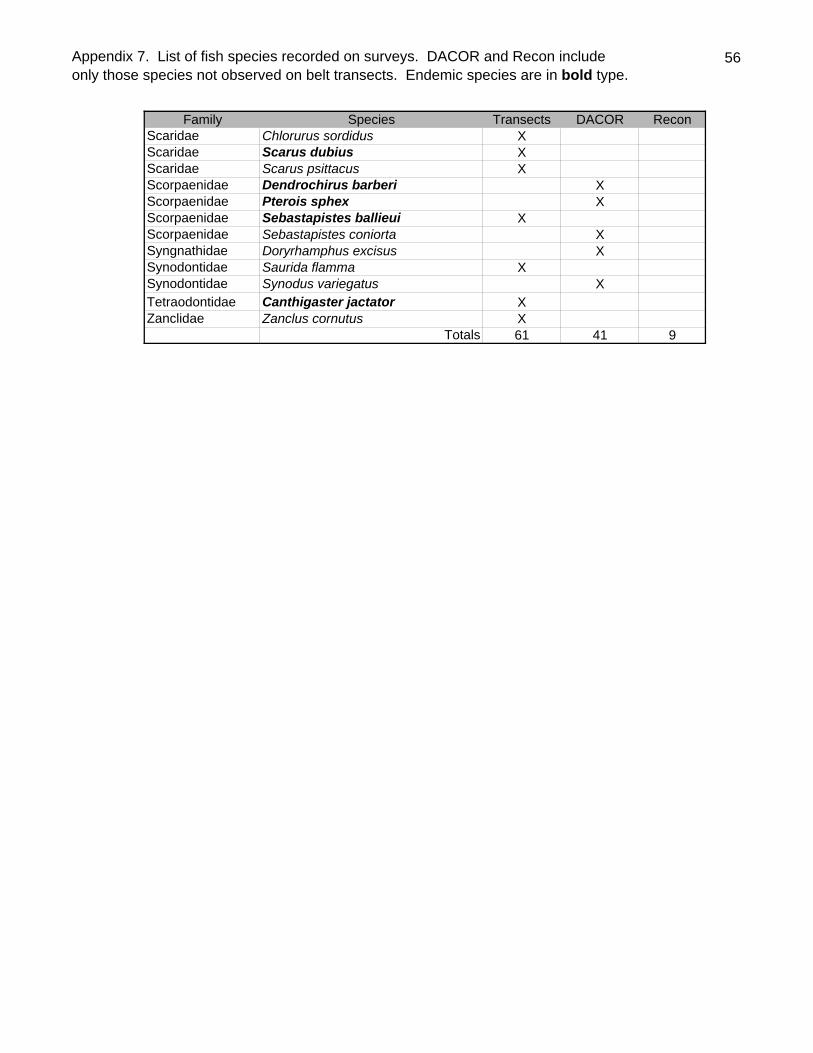
Appendix 7. List of fish species recorded on surveys. DACOR and Recon includeonly those species not observed on belt transects. Endemic species are in bold type.
56
Family Species Transects DACOR ReconScaridae Chlorurus sordidus XScaridae Scarus dubius XScaridae Scarus psittacus XScorpaenidae Dendrochirus barberi XScorpaenidae Pterois sphex XScorpaenidae Sebastapistes ballieui XScorpaenidae Sebastapistes coniorta XSyngnathidae Doryrhamphus excisus XSynodontidae Saurida flamma XSynodontidae Synodus variegatus XTetraodontidae Canthigaster jactator XZanclidae Zanclus cornutus X
Totals 61 41 9
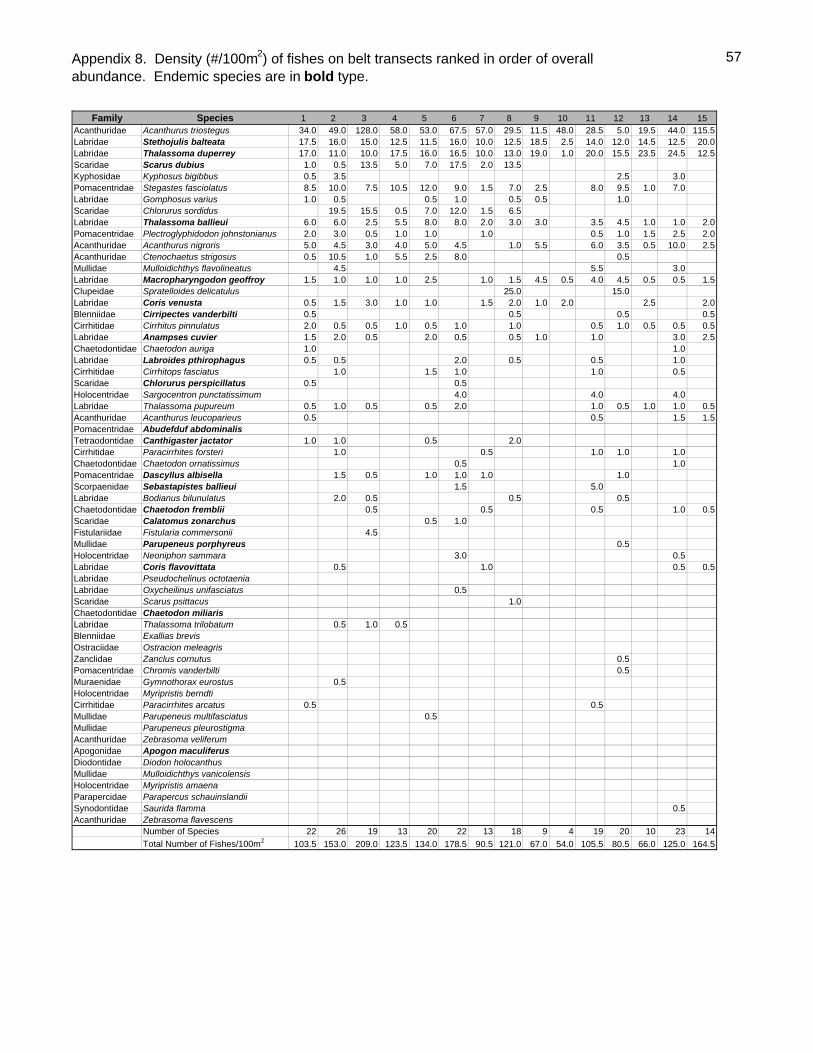
Appendix 8. Density (#/100m2) of fishes on belt transects ranked in order of overallabundance. Endemic species are in bold type.
57
Family Species 1 2 3 4 5 6 7 8 9 10 11 12 13 14 15Acanthuridae Acanthurus triostegus 34.0 49.0 128.0 58.0 53.0 67.5 57.0 29.5 11.5 48.0 28.5 5.0 19.5 44.0 115.5Labridae Stethojulis balteata 17.5 16.0 15.0 12.5 11.5 16.0 10.0 12.5 18.5 2.5 14.0 12.0 14.5 12.5 20.0Labridae Thalassoma duperrey 17.0 11.0 10.0 17.5 16.0 16.5 10.0 13.0 19.0 1.0 20.0 15.5 23.5 24.5 12.5Scaridae Scarus dubius 1.0 0.5 13.5 5.0 7.0 17.5 2.0 13.5Kyphosidae Kyphosus bigibbus 0.5 3.5 2.5 3.0Pomacentridae Stegastes fasciolatus 8.5 10.0 7.5 10.5 12.0 9.0 1.5 7.0 2.5 8.0 9.5 1.0 7.0Labridae Gomphosus varius 1.0 0.5 0.5 1.0 0.5 0.5 1.0Scaridae Chlorurus sordidus 19.5 15.5 0.5 7.0 12.0 1.5 6.5Labridae Thalassoma ballieui 6.0 6.0 2.5 5.5 8.0 8.0 2.0 3.0 3.0 3.5 4.5 1.0 1.0 2.0Pomacentridae Plectroglyphidodon johnstonianus 2.0 3.0 0.5 1.0 1.0 1.0 0.5 1.0 1.5 2.5 2.0Acanthuridae Acanthurus nigroris 5.0 4.5 3.0 4.0 5.0 4.5 1.0 5.5 6.0 3.5 0.5 10.0 2.5Acanthuridae Ctenochaetus strigosus 0.5 10.5 1.0 5.5 2.5 8.0 0.5Mullidae Mulloidichthys flavolineatus 4.5 5.5 3.0Labridae Macropharyngodon geoffroy 1.5 1.0 1.0 1.0 2.5 1.0 1.5 4.5 0.5 4.0 4.5 0.5 0.5 1.5Clupeidae Spratelloides delicatulus 25.0 15.0Labridae Coris venusta 0.5 1.5 3.0 1.0 1.0 1.5 2.0 1.0 2.0 2.5 2.0Blenniidae Cirripectes vanderbilti 0.5 0.5 0.5 0.5Cirrhitidae Cirrhitus pinnulatus 2.0 0.5 0.5 1.0 0.5 1.0 1.0 0.5 1.0 0.5 0.5 0.5Labridae Anampses cuvier 1.5 2.0 0.5 2.0 0.5 0.5 1.0 1.0 3.0 2.5Chaetodontidae Chaetodon auriga 1.0 1.0Labridae Labroides pthirophagus 0.5 0.5 2.0 0.5 0.5 1.0Cirrhitidae Cirrhitops fasciatus 1.0 1.5 1.0 1.0 0.5Scaridae Chlorurus perspicillatus 0.5 0.5Holocentridae Sargocentron punctatissimum 4.0 4.0 4.0Labridae Thalassoma pupureum 0.5 1.0 0.5 0.5 2.0 1.0 0.5 1.0 1.0 0.5Acanthuridae Acanthurus leucoparieus 0.5 0.5 1.5 1.5Pomacentridae Abudefduf abdominalisTetraodontidae Canthigaster jactator 1.0 1.0 0.5 2.0Cirrhitidae Paracirrhites forsteri 1.0 0.5 1.0 1.0 1.0Chaetodontidae Chaetodon ornatissimus 0.5 1.0Pomacentridae Dascyllus albisella 1.5 0.5 1.0 1.0 1.0 1.0Scorpaenidae Sebastapistes ballieui 1.5 5.0Labridae Bodianus bilunulatus 2.0 0.5 0.5 0.5Chaetodontidae Chaetodon fremblii 0.5 0.5 0.5 1.0 0.5Scaridae Calatomus zonarchus 0.5 1.0Fistulariidae Fistularia commersonii 4.5Mullidae Parupeneus porphyreus 0.5Holocentridae Neoniphon sammara 3.0 0.5Labridae Coris flavovittata 0.5 1.0 0.5 0.5Labridae Pseudochelinus octotaeniaLabridae Oxycheilinus unifasciatus 0.5Scaridae Scarus psittacus 1.0Chaetodontidae Chaetodon miliarisLabridae Thalassoma trilobatum 0.5 1.0 0.5Blenniidae Exallias brevisOstraciidae Ostracion meleagrisZanclidae Zanclus cornutus 0.5Pomacentridae Chromis vanderbilti 0.5Muraenidae Gymnothorax eurostus 0.5Holocentridae Myripristis berndtiCirrhitidae Paracirrhites arcatus 0.5 0.5Mullidae Parupeneus multifasciatus 0.5Mullidae Parupeneus pleurostigmaAcanthuridae Zebrasoma veliferumApogonidae Apogon maculiferusDiodontidae Diodon holocanthusMullidae Mulloidichthys vanicolensisHolocentridae Myripristis amaenaParapercidae Parapercus schauinslandiiSynodontidae Saurida flamma 0.5Acanthuridae Zebrasoma flavescens
Number of Species 22 26 19 13 20 22 13 18 9 4 19 20 10 23 14Total Number of Fishes/100m2 103.5 153.0 209.0 123.5 134.0 178.5 90.5 121.0 67.0 54.0 105.5 80.5 66.0 125.0 164.5
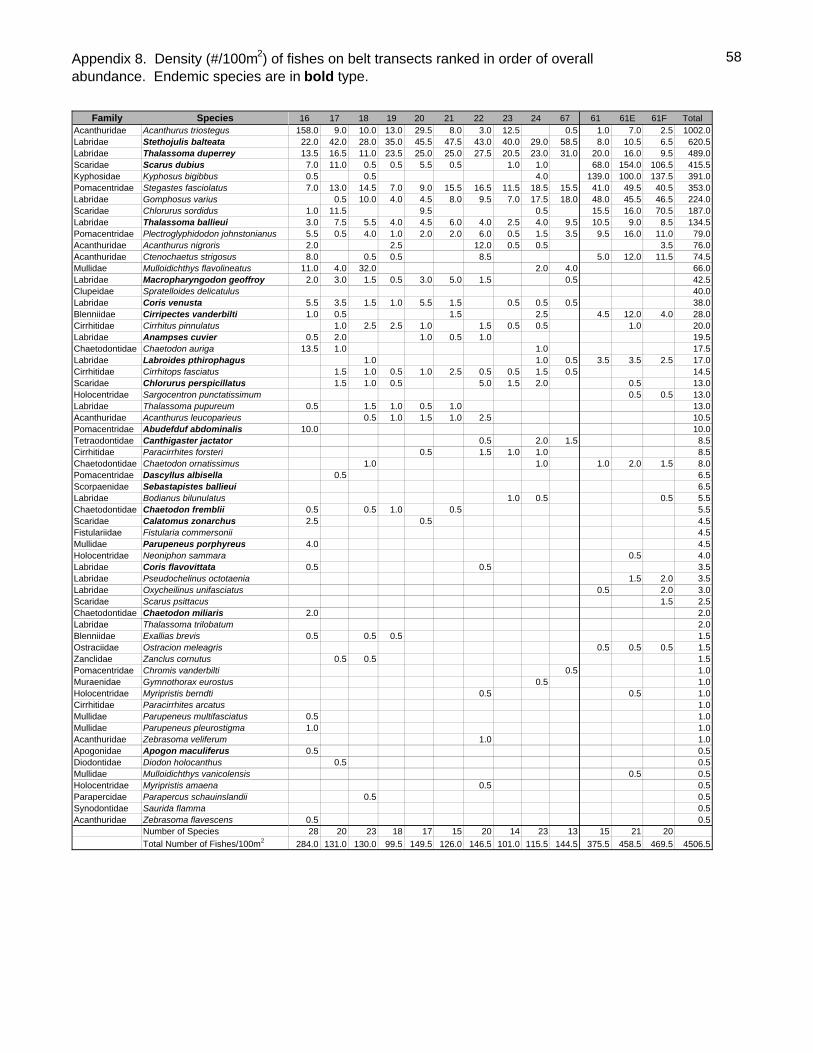
Appendix 8. Density (#/100m2) of fishes on belt transects ranked in order of overallabundance. Endemic species are in bold type.
58
Family SpeciesAcanthuridae Acanthurus triostegusLabridae Stethojulis balteataLabridae Thalassoma duperreyScaridae Scarus dubiusKyphosidae Kyphosus bigibbusPomacentridae Stegastes fasciolatusLabridae Gomphosus variusScaridae Chlorurus sordidusLabridae Thalassoma ballieuiPomacentridae Plectroglyphidodon johnstonianusAcanthuridae Acanthurus nigrorisAcanthuridae Ctenochaetus strigosusMullidae Mulloidichthys flavolineatusLabridae Macropharyngodon geoffroyClupeidae Spratelloides delicatulusLabridae Coris venustaBlenniidae Cirripectes vanderbiltiCirrhitidae Cirrhitus pinnulatusLabridae Anampses cuvierChaetodontidae Chaetodon aurigaLabridae Labroides pthirophagusCirrhitidae Cirrhitops fasciatusScaridae Chlorurus perspicillatusHolocentridae Sargocentron punctatissimumLabridae Thalassoma pupureumAcanthuridae Acanthurus leucoparieusPomacentridae Abudefduf abdominalisTetraodontidae Canthigaster jactatorCirrhitidae Paracirrhites forsteriChaetodontidae Chaetodon ornatissimusPomacentridae Dascyllus albisellaScorpaenidae Sebastapistes ballieuiLabridae Bodianus bilunulatusChaetodontidae Chaetodon frembliiScaridae Calatomus zonarchusFistulariidae Fistularia commersoniiMullidae Parupeneus porphyreusHolocentridae Neoniphon sammaraLabridae Coris flavovittataLabridae Pseudochelinus octotaeniaLabridae Oxycheilinus unifasciatusScaridae Scarus psittacusChaetodontidae Chaetodon miliarisLabridae Thalassoma trilobatumBlenniidae Exallias brevisOstraciidae Ostracion meleagrisZanclidae Zanclus cornutusPomacentridae Chromis vanderbiltiMuraenidae Gymnothorax eurostusHolocentridae Myripristis berndtiCirrhitidae Paracirrhites arcatusMullidae Parupeneus multifasciatusMullidae Parupeneus pleurostigmaAcanthuridae Zebrasoma veliferumApogonidae Apogon maculiferusDiodontidae Diodon holocanthusMullidae Mulloidichthys vanicolensisHolocentridae Myripristis amaenaParapercidae Parapercus schauinslandiiSynodontidae Saurida flammaAcanthuridae Zebrasoma flavescens
Number of SpeciesTotal Number of Fishes/100m2
16 17 18 19 20 21 22 23 24 67 61 61E 61F Total 158.0 9.0 10.0 13.0 29.5 8.0 3.0 12.5 0.5 1.0 7.0 2.5 1002.022.0 42.0 28.0 35.0 45.5 47.5 43.0 40.0 29.0 58.5 8.0 10.5 6.5 620.513.5 16.5 11.0 23.5 25.0 25.0 27.5 20.5 23.0 31.0 20.0 16.0 9.5 489.07.0 11.0 0.5 0.5 5.5 0.5 1.0 1.0 68.0 154.0 106.5 415.50.5 0.5 4.0 139.0 100.0 137.5 391.07.0 13.0 14.5 7.0 9.0 15.5 16.5 11.5 18.5 15.5 41.0 49.5 40.5 353.0
0.5 10.0 4.0 4.5 8.0 9.5 7.0 17.5 18.0 48.0 45.5 46.5 224.01.0 11.5 9.5 0.5 15.5 16.0 70.5 187.03.0 7.5 5.5 4.0 4.5 6.0 4.0 2.5 4.0 9.5 10.5 9.0 8.5 134.55.5 0.5 4.0 1.0 2.0 2.0 6.0 0.5 1.5 3.5 9.5 16.0 11.0 79.02.0 2.5 12.0 0.5 0.5 3.5 76.08.0 0.5 0.5 8.5 5.0 12.0 11.5 74.5
11.0 4.0 32.0 2.0 4.0 66.02.0 3.0 1.5 0.5 3.0 5.0 1.5 0.5 42.5
40.05.5 3.5 1.5 1.0 5.5 1.5 0.5 0.5 0.5 38.01.0 0.5 1.5 2.5 4.5 12.0 4.0 28.0
1.0 2.5 2.5 1.0 1.5 0.5 0.5 1.0 20.00.5 2.0 1.0 0.5 1.0 19.5
13.5 1.0 1.0 17.51.0 1.0 0.5 3.5 3.5 2.5 17.0
1.5 1.0 0.5 1.0 2.5 0.5 0.5 1.5 0.5 14.51.5 1.0 0.5 5.0 1.5 2.0 0.5 13.0
0.5 0.5 13.00.5 1.5 1.0 0.5 1.0 13.0
0.5 1.0 1.5 1.0 2.5 10.510.0 10.0
0.5 2.0 1.5 8.50.5 1.5 1.0 1.0 8.5
1.0 1.0 1.0 2.0 1.5 8.00.5 6.5
6.51.0 0.5 0.5 5.5
0.5 0.5 1.0 0.5 5.52.5 0.5 4.5
4.54.0 4.5
0.5 4.00.5 0.5 3.5
1.5 2.0 3.50.5 2.0 3.0
1.5 2.52.0 2.0
2.00.5 0.5 0.5 1.5
0.5 0.5 0.5 1.50.5 0.5 1.5
0.5 1.00.5 1.0
0.5 0.5 1.01.0
0.5 1.01.0 1.0
1.0 1.00.5 0.5
0.5 0.50.5 0.5
0.5 0.50.5 0.5
0.50.5 0.528 20 23 18 17 15 20 14 23 13 15 21 20
284.0 131.0 130.0 99.5 149.5 126.0 146.5 101.0 115.5 144.5 375.5 458.5 469.5 4506.5
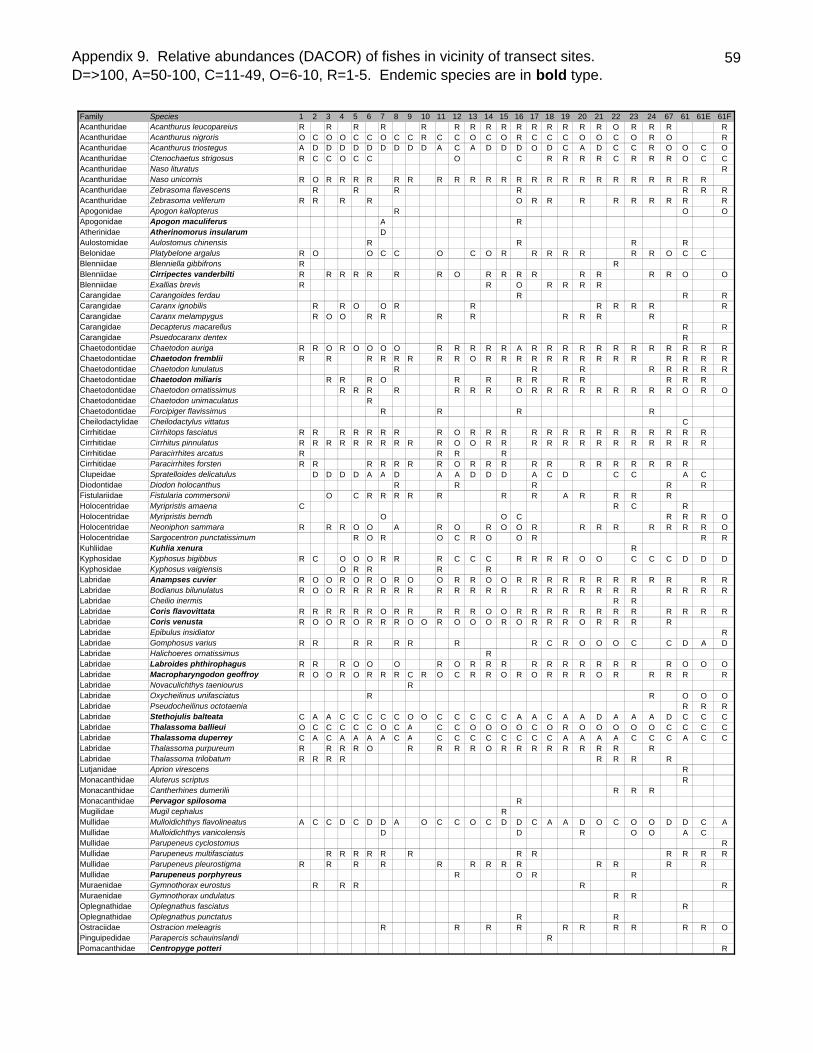
Appendix 9. Relative abundances (DACOR) of fishes in vicinity of transect sites.D=>100, A=50-100, C=11-49, O=6-10, R=1-5. Endemic species are in bold type.
59
Family Species 1 2 3 4 5 6 7 8 9 10 11 12 13 14 15 16 17 18 19 20 21 22 23 24 67 61 61E 61FAcanthuridae Acanthurus leucopareius R R R R R R R R R R R R R R R O R R R RAcanthuridae Acanthurus nigroris O C O O C C O C C R C C O C O R C C C O O C O R O RAcanthuridae Acanthurus triostegus A D D D D D D D D D A C A D D D O D C A D C C R O O C OAcanthuridae Ctenochaetus strigosus R C C O C C O C R R R R C R R R O C CAcanthuridae Naso lituratus RAcanthuridae Naso unicornis R O R R R R R R R R R R R R R R R R R R R R R R RAcanthuridae Zebrasoma flavescens R R R R R R RAcanthuridae Zebrasoma veliferum R R R R O R R R R R R R R RApogonidae Apogon kallopterus R O OApogonidae Apogon maculiferus A RAtherinidae Atherinomorus insularum DAulostomidae Aulostomus chinensis R R R RBelonidae Platybelone argalus R O O C C O C O R R R R R R R O C CBlenniidae Blenniella gibbifrons R RBlenniidae Cirripectes vanderbilti R R R R R R R O R R R R R R R R O OBlenniidae Exallias brevis R R O R R R RCarangidae Carangoides ferdau R R RCarangidae Caranx ignobilis R R O O R R R R R R RCarangidae Caranx melampygus R O O R R R R R R R RCarangidae Decapterus macarellus R RCarangidae Psuedocaranx dentex RChaetodontidae Chaetodon auriga R R O R O O O O R R R R R A R R R R R R R R R R R RChaetodontidae Chaetodon fremblii R R R R R R R R O R R R R R R R R R R R R R RChaetodontidae Chaetodon lunulatus R R R R R R R RChaetodontidae Chaetodon miliaris R R R O R R R R R R R R RChaetodontidae Chaetodon ornatissimus R R R R R R R O R R R R R R R R R O R OChaetodontidae Chaetodon unimaculatus RChaetodontidae Forcipiger flavissimus R R R RCheilodactylidae Cheilodactylus vittatus CCirrhitidae Cirrhitops fasciatus R R R R R R R R O R R R R R R R R R R R R R RCirrhitidae Cirrhitus pinnulatus R R R R R R R R R R O O R R R R R R R R R R R R RCirrhitidae Paracirrhites arcatus R R R RCirrhitidae Paracirrhites forsteri R R R R R R R O R R R R R R R R R R R RClupeidae Spratelloides delicatulus D D D D A A D A A D D D A C D C C A CDiodontidae Diodon holocanthus R R R R RFistulariidae Fistularia commersonii O C R R R R R R R A R R R RHolocentridae Myripristis amaena C R C RHolocentridae Myripristis berndti O O C R R R OHolocentridae Neoniphon sammara R R R O O A R O R O O R R R R R R R R OHolocentridae Sargocentron punctatissimum R O R O C R O O R R RKuhliidae Kuhlia xenura RKyphosidae Kyphosus bigibbus R C O O O R R R C C C R R R R O O C C C D D DKyphosidae Kyphosus vaigiensis O R R R RLabridae Anampses cuvier R O O R O R O R O O R R O O R R R R R R R R R R R RLabridae Bodianus bilunulatus R O O R R R R R R R R R R R R R R R R R R R R R RLabridae Cheilio inermis R RLabridae Coris flavovittata R R R R R R O R R R R R O O R R R R R R R R R R R RLabridae Coris venusta R O O R O R R R O O R O O O R O R R R O R R R RLabridae Epibulus insidiator RLabridae Gomphosus varius R R R R R R R R C R O O O C C D A DLabridae Halichoeres ornatissimus RLabridae Labroides phthirophagus R R R O O O R O R R R R R R R R R R R O O OLabridae Macropharyngodon geoffroy R O O R O R R R C R O C R R O R O R R R O R R R R RLabridae Novaculichthys taeniourus RLabridae Oxycheilinus unifasciatus R R O O OLabridae Pseudocheilinus octotaenia R R RLabridae Stethojulis balteata C A A C C C C C O O C C C C C A A C A A D A A A D C C CLabridae Thalassoma ballieui O C C C C C O C A C C O O O O C O R O O O O O C C C CLabridae Thalassoma duperrey C A C A A A A C A C C C C C C C C A A A A C C C A C CLabridae Thalassoma purpureum R R R R O R R R R O R R R R R R R R RLabridae Thalassoma trilobatum R R R R R R R RLutjanidae Aprion virescens RMonacanthidae Aluterus scriptus RMonacanthidae Cantherhines dumerilii R R RMonacanthidae Pervagor spilosoma RMugilidae Mugil cephalus RMullidae Mulloidichthys flavolineatus A C C D C D D A O C C O C D D C A A D O C O O D D C AMullidae Mulloidichthys vanicolensis D D R O O A CMullidae Parupeneus cyclostomus RMullidae Parupeneus multifasciatus R R R R R R R R R R R RMullidae Parupeneus pleurostigma R R R R R R R R R R R R RMullidae Parupeneus porphyreus R O R RMuraenidae Gymnothorax eurostus R R R R RMuraenidae Gymnothorax undulatus R ROplegnathidae Oplegnathus fasciatus ROplegnathidae Oplegnathus punctatus R ROstraciidae Ostracion meleagris R R R R R R R R R R OPinguipedidae Parapercis schauinslandi RPomacanthidae Centropyge potteri R
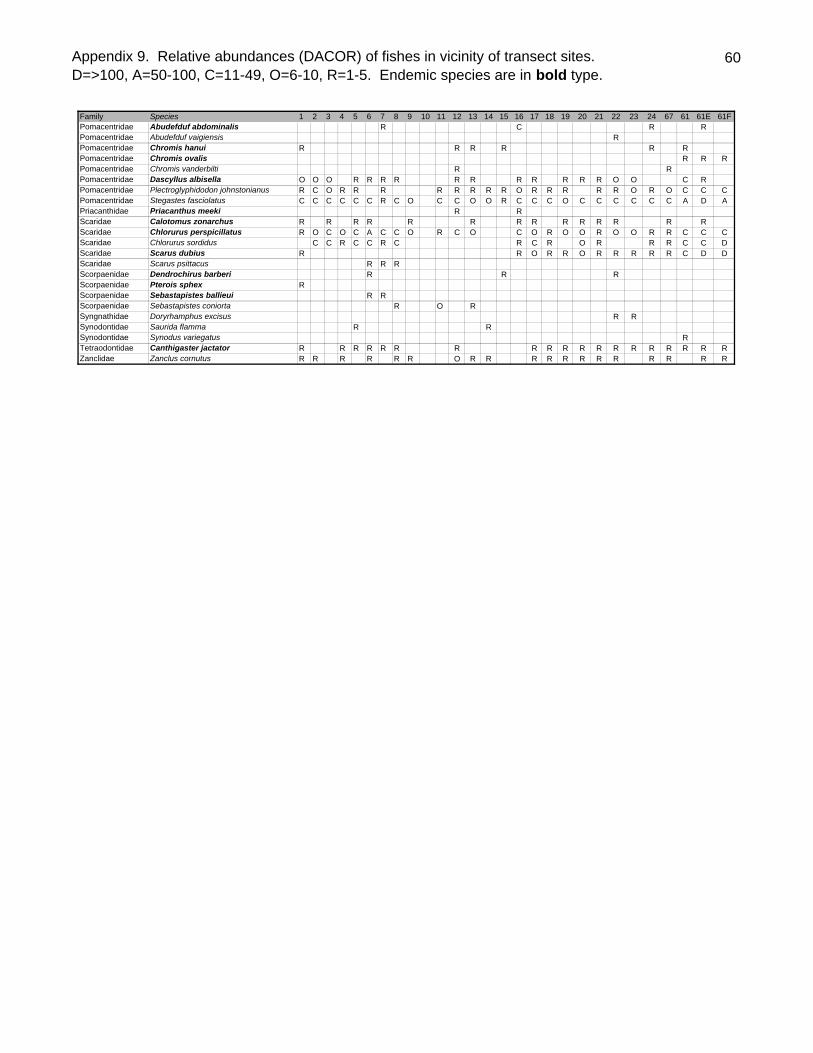
Appendix 9. Relative abundances (DACOR) of fishes in vicinity of transect sites.D=>100, A=50-100, C=11-49, O=6-10, R=1-5. Endemic species are in bold type.
60
Family Species 1 2 3 4 5 6 7 8 9 10 11 12 13 14 15 16 17 18 19 20 21 22 23 24 67 61 61E 61FPomacentridae Abudefduf abdominalis R C R RPomacentridae Abudefduf vaigiensis RPomacentridae Chromis hanui R R R R R RPomacentridae Chromis ovalis R R RPomacentridae Chromis vanderbilti R RPomacentridae Dascyllus albisella O O O R R R R R R R R R R R O O C RPomacentridae Plectroglyphidodon johnstonianus R C O R R R R R R R R O R R R R R O R O C C CPomacentridae Stegastes fasciolatus C C C C C C R C O C C O O R C C C O C C C C C C A D APriacanthidae Priacanthus meeki R RScaridae Calotomus zonarchus R R R R R R R R R R R R R RScaridae Chlorurus perspicillatus R O C O C A C C O R C O C O R O O R O O R R C C CScaridae Chlorurus sordidus C C R C C R C R C R O R R R C C DScaridae Scarus dubius R R O R R O R R R R R C D DScaridae Scarus psittacus R R RScorpaenidae Dendrochirus barberi R R RScorpaenidae Pterois sphex RScorpaenidae Sebastapistes ballieui R RScorpaenidae Sebastapistes coniorta R O RSyngnathidae Doryrhamphus excisus R RSynodontidae Saurida flamma R RSynodontidae Synodus variegatus RTetraodontidae Canthigaster jactator R R R R R R R R R R R R R R R R R R RZanclidae Zanclus cornutus R R R R R R O R R R R R R R R R R R R