Embed Size (px)
Citation preview


Northwest Missouri Regional Water Supply Transmission System Study
Phase V
Final Middle Fork Water Treatment Plant and Reservoir
Condition Technical Memorandum
June 2012
Prepared by: CDM Federal Programs Corporation
9200 Ward Parkway, Suite 500 Kansas City, Missouri 64114
Certificate of Authority: 001431
Bartlett & West, Inc. 250 NE Tudor Road
Lee's Summit, Missouri 64086-5696 Certificate of Authority: 000167

i 6198-YW06_Middle Fork WTP and Reservoir_Final TM_June 2012.docx
Table of Contents
Executive Summary ............................................................................................................................................. ES-1
Section 1 Introduction ........................................................................................................................................... 1-1
1.1 Purpose .............................................................................................................................................................. 1-1 1.2 Middle Fork WTP and Reservoir Description.................................................................................... 1-2
Section 2 Water Treatment Plant Existing Conditions .............................................................................. 2-1
2.1 Introduction ..................................................................................................................................................... 2-1 2.2 Stanberry Lake Intake ................................................................................................................................. 2-1 2.3 Pre-Sedimentation Basin ............................................................................................................................ 2-1 2.4 Rapid Mix, Flocculation, and Sedimentation ...................................................................................... 2-3 2.5 Disinfection ...................................................................................................................................................... 2-3 2.6 Filters .................................................................................................................................................................. 2-4 2.7 Clearwell and High Service Pumps ......................................................................................................... 2-5 2.8 Chemical Feed Systems ............................................................................................................................... 2-5 2.9 Electrical, Plumbing, and Mechanical.................................................................................................... 2-5 2.10 Recommended Improvements and Opinion of Probable Cost ................................................ 2-6
2.10.1 Backup Power .................................................................................................................................. 2-6 2.10.2 Pre-sedimentation Basin Modifications and Maintenance ........................................... 2-6 2.10.3 Raw Water Intake Renovation .................................................................................................. 2-6 2.10.4 Chemical Containment ................................................................................................................. 2-8 2.10.5 High Service Pump Sump/Clearwell Extension ................................................................ 2-8 2.10.6 Filter Rehabilitation and Media Replacement ................................................................... 2-9 2.10.7 Concrete and Coating Repair and Replacement ................................................................ 2-9 2.10.8 Instrumentation and Telemetry .............................................................................................. 2-9 2.10.9 Opinion of Probable Cost .......................................................................................................... 2-10
2.11 2011 Operation and Maintenance Costs ......................................................................................... 2-10
Section 3 Stanberry Lake Existing Conditions .............................................................................................. 3-1
3.1 Dam Description............................................................................................................................................. 3-1 3.1.1 Operations and Maintenance ....................................................................................................... 3-3 3.1.2 MDNR Size Classification ............................................................................................................... 3-3 3.1.3 MDNR Hazard Potential Classification ..................................................................................... 3-3 3.1.4 Pertinent Engineering Data .......................................................................................................... 3-4
3.2 Visual Inspection ............................................................................................................................................ 3-6 3.2.1 Appurtenant Structures ................................................................................................................. 3-9 3.2.2 Downstream Area ............................................................................................................................. 3-9 3.2.3 Reservoir Area .................................................................................................................................... 3-9 3.2.4 Caretaker Interview ......................................................................................................................... 3-9
3.3 Operation and Maintenance Procedures ............................................................................................. 3-9 3.4 Hydraulic and Hydrologic Data .............................................................................................................. 3-10 3.5 Structural and Seepage Stability ........................................................................................................... 3-10 3.6 Recommendations, Maintenance, and Minor Repairs ................................................................. 3-10
3.6.1 Remedial Modification Recommendations .......................................................................... 3-11 3.7 Opinion of Probable Construction Cost .............................................................................................. 3-11

Table of Contents • Middle Fork Water Treatment Plant and Reservoir Condition Technical Memorandum
ii 6198-YW06_Middle Fork WTP and Reservoir_Final TM_June 2012.docx
Section 4 Stanberry Lake Water Supply Analysis........................................................................................ 4-1
4.1 Existing Conditions Analysis ..................................................................................................................... 4-1 4.1.1 Model Validation – Comparison 2001 MDNR Analysis of Stanberry Lake and to
USGS Gauge .......................................................................................................................................... 4-4 4.1.2 Sedimentation Analysis .................................................................................................................. 4-5 4.1.3 Updated Existing Conditions Firm Yield ................................................................................. 4-7
4.2 Evaluation of Alternatives to Increase Firm Yield ........................................................................... 4-7 4.2.1 Raised Dam Scenario Analysis ..................................................................................................... 4-7 4.2.2 Additional Upstream Reservoir Scenario Analysis ............................................................. 4-7
4.3 Results and Recommendations ............................................................................................................. 4-10 4.3.1 Raised Dam versus Additional Upstream Reservoir ....................................................... 4-10 4.3.2 Project Firm Yields ........................................................................................................................ 4-10
Section 5 Middle Fork Reservoir and WTP Expansion Feasibility ........................................................ 5-1
5.1 Stanberry Lake Improvements ................................................................................................................ 5-1 5.1.1 Dam ......................................................................................................................................................... 5-1 5.1.2 Spillway Configuration .................................................................................................................... 5-3 5.1.3 Low-Level Outlet ............................................................................................................................... 5-3 5.1.4 Reservoir Opinion of Probable Cost .......................................................................................... 5-3
5.2 WTP Expansion ............................................................................................................................................... 5-6 5.2.1 Groundwater Sources ...................................................................................................................... 5-6 5.2.2 Potential Expansion Improvements .......................................................................................... 5-7
Section 6 Conclusions ............................................................................................................................................ 6-1
Appendices
Appendix A – Water Quality Data Appendix B – WTP and Reservoir Photos Appendix C – Memorandum from David Williams, dated January 7, 2011 Appendix D – Common Dam Safety Definitions Appendix E – Stanberry Dam Inspection Checklist Appendix F – USGS 2001 Report Appendix G – Opinion of Probable Cost Appendix H – 1993 Layne Report Appendix I – Project References
Table of Contents • Middle Fork Water Treatment Plant and Reservoir Condition Technical Memorandum
iii 6198-YW06_Middle Fork WTP and Reservoir_Final TM_June 2012.docx
Tables
ES.1 MFWC WTP Improvements and Opinion of Probable Cost ..................................................... ES-2 ES.2 Opinion of Probable Construction Cost for Stanberry Lake Repairs .................................. ES-3 ES.3 Water Supply Firm Yield for All Analyses ....................................................................................... ES-3 2.1 Chemical Systems .......................................................................................................................................... 2-5 2.2 Opinion of Probable Cost for Raw Water Intake Renovations ................................................... 2-8 2.3 Opinion of Probable Cost for High Service Pump Sump/Clearwell Extension .................... 2-9 2.4 WTP Existing Conditions Opinion of Probable Cost ..................................................................... 2-10 2.5 Operation and Maintenance Costs ........................................................................................................ 2-10 3.1 Reservoir Elevations, Surface Area, and Storage Volume ............................................................ 3-4 3.2 Reservoir Expanded Elevations ............................................................................................................... 3-4 3.3 Summary Data Table .................................................................................................................................... 3-5 3.4 Opinion of Probable Construction Cost for Stanberry Lake Repairs ..................................... 3-11 4.1 Comparison of Assumptions ..................................................................................................................... 4-4 4.2 Comparison of Storage Volumes for Bathymetric Surveys .......................................................... 4-6 4.3 Sedimentation Occurring between the Years 2000 and 2012 Based on Bathymetric
Survey Data ....................................................................................................................................................... 4-6 4.4 Water Supply Firm Yield for All Analyses ......................................................................................... 4-10 4.5 Projected Water Supply Firm Yield Assuming No Improvement to Existing Reservoir
and Historical Sedimentation Rate ....................................................................................................... 4-11 5.1 Land Acquisition Property Cost Data .................................................................................................... 5-5 5.2 Planning Level Opinion of Probable Construction Costs .............................................................. 5-6 5.3 Groundwater Supply Opinion of Probable Costs ............................................................................. 5-7 5.4 Media Filtration Plant Improvements .................................................................................................. 5-8 5.5 Plant Expansion Membrane Option ....................................................................................................... 5-9 6.1 Feasibility Opinion of Probable Cost for Expansion ....................................................................... 6-1 6.2 Current and Proposed Future Capacity ................................................................................................ 6-1
Figures
ES.1 MFWC WTP Schematic ............................................................................................................................ ES-1 1.1 Stanberry Lake and Water Treatment Plant ...................................................................................... 1-3 2.1 Water Treatment Plant Schematic ......................................................................................................... 2-2 2.2 Pre-Sedimentation Basin Improvements ............................................................................................ 2-7 3.1 Typical Cross Section Through Drop Inlet Spillway – Stanberry Lake Dam ........................ 3-2 3.2 Field Sketch and Notes – Stanberry Lake Dam ................................................................................. 3-7 3.3 Photograph Locations Plan – Stanberry Lake Dam ......................................................................... 3-8 4.1 Location of USGS Gauges ............................................................................................................................ 4-3 4.2 Stanberry Lake with Raised Dam General Location and Layout ............................................... 4-8 4.3 Stanberry Lake with Additional Upstream Reservoir General Location and Layout ....... 4-9 4.4 Project Firm Yield for Stanberry Lake ................................................................................................ 4-11 5.1 Proposed New Dam Cross Section.......................................................................................................... 5-2

Table of Contents • Middle Fork Water Treatment Plant and Reservoir Condition Technical Memorandum
iv 6198-YW06_Middle Fork WTP and Reservoir_Final TM_June 2012.docx
Acronyms/Abbreviations
°F degrees Fahrenheit ACH Aluminum chloride hydroxide sulfate CDM Smith CDM Federal Programs Corporation cfs cubic feet per second Commission Great Northwest Wholesale Water Commission CSR Code of State Regulations CT contact time CY cubic yards DIP ductile iron pipe El. elevation gpd gallons per day gpm gallon per minute H horizontal H&H hydrologic and hydraulic mg million gallons MDNR Missouri Department of Natural Resources MFWC Middle Fork Water Company NAVD88 North American vertical datum 1988 OPC opinion of probable cost PAS Planning Assistance to States ppd pounds per day ppm parts per million PMP Probable Maximum Precipitation PVC polyvinyl chloride RESOP Reservoir Operation Study Computer Program RSMo Revised Statutes Missouri USACE U.S. Army Corps of Engineers USGS U.S. Geologicial Survey SDFP Spillway Design Flood Precipitation Value SWD sidewater depth TM Technical Memorandum V vertical VFDs variable frequency drives WSEs water surface elevations WTP Water Treatment Plant

ES-1 6198-YW06_Middle Fork WTP and Reservoir_Final TM_June 2012.docx
Executive Summary
Under the Planning Assistance to States (PAS) cost share agreement between the U.S. Army Corps of Engineers (USACE) and the Missouri Department of Natural Resources (MDNR) Water Resources Center, CDM Federal Programs Corporation (CDM Smith) was requested to provide engineering and technical support services to the Kansas City District for Phase V of the Northwest Missouri Regional Water Supply Study. The objective of this Technical Memorandum (TM) is to provide a Middle Fork Water Treatment Plant (WTP) and Reservoir Condition Assessment.
The Middle Fork Water Company owns and operates a 700 gallon per minute (gpm) WTP and Stanberry Lake (otherwise known as Lake Elizabeth or Middle Fork Reservoir) in rural Gentry County Missouri, directly supplying the cities of Grant City and Stanberry. Both the Lake and the WTP were constructed in 1992. The WTP system is a single-train conventional clarification plant with rapid-rate dual-media filtration for treating surface water. The plant typically operates 6 to 10 hours daily, producing an average of 321,600 gallons per day(gpd) in 2010. Figure ES-1 illustrates the flow path and treatment chemicals used at the WTP.
Figure ES.1 – MFWC WTP Schematic
In general, the WTP was found to be in good condition for its age with no finished water quality concerns. There were recommended improvements to the facility to address some redundancy and maintenance concerns for the plant. The improvements and opinion of probable cost for those improvements are summarized in Table ES.1.

Executive Summary • Middle Fork Water Treatment Plant and Reservoir Condition Technical Memorandum
ES-2 6198-YW06_Middle Fork WTP and Reservoir_Final TM_June 2012.docx
Table ES.1 – MFWC WTP Improvements and Opinion of Probable Cost
Item Cost
Backup Power $65,000
Partitioning Pre-sedimentation Basin $75,000
Raw Water Intake Renovations $290,000
Chemical Containment $45,000
High Service Pump Sump/Clearwell Extension $132,000
Filter Rehabilitation $32,000
Concrete and Coating Repair $45,000
Instrumentation and Telemetry $350,000
Subtotal $1,034,000
Engineering, Legal, and Contingencies1 $465,000
Total Opinion of Probable Costs $1,500,000 1 Engineering, Legal, and Contingencies assumed to be 45-percent of subtotal.
Stanberry Lake is approximately 155 surface acres, with approximately 1,040 acre-feet of storage at full pool. The earthen dam is approximately 1,000 feet long and 34.5 feet high and is “non-regulated” by the State of Missouri. The contributing watershed is approximately 6.3 square miles of mostly pasture and forested area, with some land in cultivated agricultural use. Also constructed at the lake site is a single 3.5 surface acre earthen pre-sedimentation basin with approximately 20 acre-feet of storage. Stanberry Lake Dam was found to be in satisfactory condition at the time of inspection (November 10, 2011). A dam judged to be in satisfactory condition has minor operational and maintenance deficiencies. Table ES.2 summarizes the recommended improvements and additional studies recommended for Stanberry Lake along with a preliminary opinion of probable cost.

Executive Summary • Middle Fork Water Treatment Plant and Reservoir Condition Technical Memorandum
ES-3 6198-YW06_Middle Fork WTP and Reservoir_Final TM_June 2012.docx
Table ES.2 Opinion of Probable Construction Cost for Stanberry Lake Repairs
Description Cost
Studies and Analyses
Perform a topographic survey $6,000 - $8,000
Complete hydrologic and hydraulic studies $20,000 - $25,000
Evaluate the feasibility of installing a low-level outlet at the primary spillway
$8,000 - $12,000
Recurrent Maintenance Recommendations (Assumed to be performed by MFWC personnel)2
Perform regular maintenance $ N/A
Remove animals and fill burrows $ N/A
Fill voids behind discharge channel sidewalls $ N/A
Place additional riprap on the upstream slope $3,000 - $8,000
Recommendations, Maintenance, and Minor Repair
Backfill areas of erosion $6,000 - $ 10,000
Repair or replace existing precast concrete intake structure $5,000 - $ 20,000
Remedial Modification Recommendations
Remedial measures to address spillway capacity TBD
(based on H/H Analyses)
Subtotal $48,000 - $75,000
Engineering, Legal, Contingencies1 $21,600 - $33,900
Total Opinion of Probable Construction Cost $70,000 - $110,000 1 Engineering, Legal, and Contingencies assumed to be 45-percent of subtotal. 2 Not included in overall project cost.
A model was developed of the upstream drainage area to determine whether expansion of the reservoir was a feasible alternative. Two alternatives were identified for reservoir expansion. First, the existing dam height could be raised to increase the storage volume. The second alternative would be to construct a second dam upstream of the existing reservoir. Table ES.3 summarizes the existing firm yield capacity of Stanberry Lake and the possible increased capacity for the two expansion alternatives.
Table ES.3 Water Supply Firm Yield for All Analyses
Scenario White Cloud Creek Gauge Firm Yield Average GPD*
Existing Conditions 386,000
Raised Dam 558,000
Additional Upstream Reservoir 559,000
* Existing Average Demand is 315,000 gpd.
The opinion of probable cost for the upstream reservoir alternative is $13.05 million.

Executive Summary • Middle Fork Water Treatment Plant and Reservoir Condition Technical Memorandum
ES-4 6198-YW06_Middle Fork WTP and Reservoir_Final TM_June 2012.docx
In additions, a groundwater well is located near the WTP. Preliminary testing indicated that it may be able to produce an additional 300 gallons per minute. The well testing conducted at the time does not meet the current requirements to verify the flow rate. Additional testing and well development would be required before the capacity of the well can be verified. Additionally, the aquifer capacity to serve as a long-term water supply source is unknown. The cost for developing the well, not including aquifer testing, is $673,000. The opinion of probable cost for the WTP to treat the additional capacity of either the groundwater or surface water source is between $1.2 and $3 million, respectively.
Due to the high cost of reservoir improvements and the concerns of non-adequate groundwater, it is not recommended to expand the WTP at this time. Based on the current operation and maintenance costs for the WTP, an estimated $62,500 annual maintenance costs, and debt service to cover the sales cost of the WTP (a range of values was assumed) and the estimated opinion of probable cost, the range of water sales costs anticipated could vary between $3.20 to $3.90 per 1,000 gallons.
A bathymetric study is being conducted to evaluate the state of siltation in the Stanberry Lake. The results of that survey will be presented in a separate report.

1-1 6198-YW06_Middle Fork WTP and Reservoir_Final TM_June 2012.docx
Section 1 Introduction
Under the Planning Assistance to States (PAS) cost share agreement between the U.S. Army Corps of Engineers (USACE) and the Missouri Department of Natural Resources (MDNR) Water Resources Center, CDM Federal Programs Corporation (CDM Smith) was requested to provide engineering and technical support services to the Kansas City District for Phase V of the Northwest Missouri Regional Water Supply Study. The objectives of Phase V are to provide:
Middle Fork Water Treatment Plant (WTP) and Reservoir Condition Assessment Technical Memorandum (TM)
New WTP Feasibility Study TM
Regional Economic Benefit Analysis TM
Stage 1 Pipeline Preliminary Engineering Report Addendum
Stage 1 Pipeline Base Mapping
This TM serves as the Middle Fork WTP and Reservoir Condition Assessment TM prepared for the Great Northwest Wholesale Water Commission (Commission).
Funding for this study was provided through the USACE PAS Program, Section 22 of the Water Resources Development Act of 1974 (Public Law 93-251) as amended to assist the States in the preparation of comprehensive plans for the development, utilization and conservation of water and related land resources, and Section 319 of the Water Resources Development Act of 1990 (Public Law 101-640). The MDNR, as the non-Federal sponsor of the PAS agreement, utilized State general revenue funds for 50-percent of this study’s cost. CDM Smith and Bartlett & West completed the work under this agreement. Special recognition should also be given to the important role the Middle Fork Water Company (MFWC) and the Northwest Regional Council of Governments made by supporting communication with the Commission over the course of the project.
1.1 Purpose This TM is meant to provide information to the Commission regarding the existing conditions of both the Middle Fork WTP and Reservoir, determine if there is enough water supply to expand the facilities, and provide a feasibility level description and cost to expand the facility to maximum capacity.
This TM is broken into the following sections:
Section 2 – Water Treatment Plant Condition Assessment
Section 3 – Stanberry Lake Condition Assessment
Section 4 - Available Water Supply Analysis

Section 1 • Introduction
1-2 6198-YW06_Middle Fork WTP and Reservoir_Final TM_June 2012.docx
Section 5 – WTP and Stanberry Lake Expansion Feasibility
Section 6 - Conclusions
1.2 Middle Fork WTP and Reservoir Description The MFWC operates a 700 gallon per minute (gpm) WTP and Stanberry Lake (otherwise known as Lake Elizabeth or Middle Fork Reservoir) in rural Gentry County Missouri, directly supplying the cities of Grant City and Stanberry. Both the Lake and the WTP were constructed in 1992. The Middle Fork WTP and Stanberry Lake are located in Gentry County at 2961 U.S. Highway 169, Gentry, Missouri, 64453. The dam is located on Linn Creek approximately 1.2 miles upstream of the confluence of Linn Creek and the Middle Fork Grand River. The approximate coordinates of the dam are latitude N 40.2886 degrees and longitude W 94.4325 degrees as shown on Figure 1.1.
The contact information for MFWC, the Owner’s, and care takers of this facility is:
Middle Fork Water Company Brock Pfost, P.E. 2961 U.S. Highway 169 Gentry, Missouri 64453 Phone: 660-448-2111 Emergency Phone: 660-582-2580
The WTP system consists of raw water storage, water treatment, potable water storage, and pumping facilities with transmission and distribution of the finished water performed by the purchasing entities. The average daily use is about 350,000 gallons per day (gpd), with a maximum use of approximately 450,000 gpd.
Stanberry Lake is approximately 155 surface acres, with approximately 1,050 acre-feet of storage at full pool. The earthen dam is approximately 1,000 feet long and 34.5 feet high. The contributing watershed is approximately 6.6 square miles of mostly pasture and forested area, with some land in cultivated agricultural use. Also constructed at the lake site is a single 3.5 surface acre earthen pre-sedimentation basin with approximately 20 acre-feet of storage.
Missouri Dam Safety Laws and Regulations define jurisdictional dams as any artificial or man-made barrier which does or may impound water and is 35 feet or more in height (Section 236.400(5) Revised Statutes Missouri [RSMo]). Dam height is described as the difference in the elevation of either the natural bed of the stream or watercourse, or the lowest point on the toe of the dam and the dam crest elevation (10 Code of State Regulations [CSR] 22-1.020(24)). As such, Stanberry Lake Dam is a non-jurisdictional dam.

Section 1 • Introduction
1-3 6198-YW06_Middle Fork WTP and Reservoir_Final TM_June 2012.docx
Figure 1.1 Stanberry Lake and Water Treatment Plant

Section 1 • Introduction
1-4 6198-YW06_Middle Fork WTP and Reservoir_Final TM_June 2012.docx
This page left blank intentionally

2-1 6198-YW06_Middle Fork WTP and Reservoir_Final TM_June 2012.docx
Section 2 Water Treatment Plant Existing Conditions
2.1 Introduction The WTP is a single-train conventional clarification plant with rapid-rate dual-media filtration for treating surface water constructed in 1992. The plant operates at approximately 700 gpm and typically operates 6 to 10 hours daily, producing an average of 321,600 gpd in 2010. Figure 2.1 illustrates the overall process schematic for the WTP. A summary of raw water quality can be found in Appendix A.
The water distribution system is wholly owned by the purchasing entities starting at the exit of their respective flowmeters. No information was provided regarding current pipe materials, routing, or condition.
The following describes the individual unit processes at the WTP and summarizes the existing condition of each item. Photos of key items at the WTP are included in Appendix B. Data presented was provided by MFWC or observed during the site visit on November 10, 2011.
2.2 Stanberry Lake Intake Elevations in this report are referenced to North American Vertical Datum 1988 (NAVD88), except where otherwise noted. The surface water intake is located near the center of the dam. The wetwell is constructed of a 27-foot-deep, 5-foot-diameter precast concrete manhole with a concrete base. Water is delivered into the wetwell from 12-inch-diameter radial intake pipes located at elevations 894, 879, and 874 feet (5, 10, and 15 feet depth below normal pool, respectively). Each intake pipe end is capped with a 12-inch-diameter wire-wrapped drum screens with 1/8-inch slot spacing. The lowest of the intakes is covered with sediment and is no longer in service. During drought events, the highest intake has been above the pool level, with the middle intake visible from the surface.
Water is pumped from the intake wetwell to the pre-sedimentation basins using a 5-hp low-lift submersible pump rated for approximately 700 gpm. This pump is manually operated as needed to maintain adequate water level in the pre-sedimentation basin.
As described in Section 2.8, potassium permanganate or sodium permanganate can be fed at the intake as needed for taste and odor control.
2.3 Pre-Sedimentation Basin Water is pumped from the reservoir to the pre-sedimentation basin. The intended use of a pre-sedimentation basin is to allow settling of heavy particles and sediment. Proper design and use of a basin reduces the severity and frequency of spikes of poor water quality associated with rain and runoff events. The single earthen basin is approximately 9.15 million gallons (mg), or 3.5 surface acres with a design depth of 6 feet. The detention time is approximately 30 days when the facility is operated at an average treatment rate of 300,000 gpd.

Section 2 • Water Treatment Plant Existing Conditions
2-2 6198-YW06_Middle Fork WTP and Reservoir_Final TM_June 2012.docx
Figure 2.1 Water Treatment Plant Schematic
STANBERRY LAKE

Section 2 • Water Treatment Plant Existing Conditions
2-3 6198-YW06_Middle Fork WTP and Reservoir_Final TM_June 2012.docx
An intake similar in design to the Stanberry Lake intake is located in the southeast corner of the basin. Intake pipes are located at 915, 912, and 908 feet and the normal pool elevation is 916 feet. From the intake, water flows into an 11-foot-deep, 5-foot-diameter precast manhole, where it flows by gravity to the treatment facility through a 12-inch-diameter polyvinyl chloride (PVC) pipeline. The flowrate to the plant is controlled by a modulating valve mounted in the yard piping near the plant building.
2.4 Rapid Mix, Flocculation, and Sedimentation Most chemicals in the treatment process are fed using the primary and secondary rapid mix basins. The primary rapid-mix basin precedes the primary flocculation basin. Aluminum chloride hydroxide sulfate (ACH) is fed into this basin at feed rates ranging from 65 parts per million (ppm) to 111 ppm. At 700 gpm, the contact time in this basin is approximately 35 seconds and a high-energy flash mixer is used to keep the basin well-mixed.
Water leaves the primary rapid-mix basin through a sidewall port and is transferred to the primary flocculation chamber. This rectangular basin is approximately 14 feet long and 20 feet wide, with an average sidewater depth (SWD) of 9-feet 6-inches. At 700 gpm, the contact time in this basin is approximately 30 minutes. A flocculation paddle is installed in this basin to maintain proper energy levels for optimal floc production. The secondary flocculation chamber is of the same size and construction.
From the primary flocculation basin, water passes through a picket baffle fence to a 100-foot-long by 20-foot-wide exterior primary sedimentation basin, with a sloped floor and average SWD of approximately 14 feet. Detention time in this basin is 5 hours at 700 gpm, with an average horizontal flow velocity of 0.33 feet per minute.
The primary sedimentation effluent is collected in a submerged orifice launder and piped back to the secondary rapid mixer in the treatment building. Chlorine dioxide is fed into this basin at feed rates ranging from 0.64 ppm to 0.89 ppm. At 700 gpm, the contact time in this basin is approximately 35 seconds and is the same size as the primary rapid-mix tank. No mixer is currently equipped in this basin. After the rapid mix tank, the water goes to the secondary flocculation basin and then through a picket baffle fence to an exterior secondary sedimentation basin. The primary and secondary sedimentation basins have the same geometry and flow characteristics. Water from this basin is collected using a submerged orifice launderer and piped to the filter influent header.
2.5 Disinfection Primary disinfection in the existing process is achieved using chlorine dioxide. The chlorine dioxide is generated by a chlorine dioxide generator using gas chlorine and liquid sodium chlorite (25-percent by weight). The current feed range for chlorine dioxide is 0.64 to 0.89 ppm, varied seasonally to maintain adequate contact time (CT) values according to raw water temperature.
Secondary (residual) disinfection in the existing system is achieved by feeding gas chlorine from 150-pound cylinders contained in a dedicated storage room. Gas chlorine is fed through bottle-mounted vacuum regulators to an ejector where the chlorine is carried, in partial solution, to the feed points. Chlorine is currently fed into the filter effluent at 3 to 4 ppm (28-32 pounds per day (ppd)), varied seasonally to maintain adequate distribution residual.

Section 2 • Water Treatment Plant Existing Conditions
2-4 6198-YW06_Middle Fork WTP and Reservoir_Final TM_June 2012.docx
Although actual chlorine usage is only 5 to 8 ppd, the current chlorine usage rate is approximately 28 to 32 pounds projected over a 24-hour operation day. This rate is near the recommended maximum withdrawal rate of 40 pounds per 24-hour day from a single 150-pound cylinder. Feeding at a higher rate than recommended encourages excessive cylinder cooling and freezing in the nozzle, eventually creating a self-limiting condition where additional feed rate increases are not possible. If higher rates are required, consideration should be made for operating two cylinders in parallel to prevent cylinder freezing and premature chlorination equipment failure.
2.6 Filters Following sedimentation, the water is filtered using a conventional rapid-rate dual-media filter system. Three filters are used, each 15 feet long by 7 feet 6inches wide to provide an effective filter area of 112.5 square feet. Assuming a process flowrate of 700 gpm, the filtration rate with all three filters in service is approximately 2.1 gpm per square foot. With one filter offline, the filtration rate is 3.1 gpm per square foot. MDNR design criteria currently sets the design filtration rate at 2.0 gpm per square foot. To remain in compliance with this requirement, the filters must be backwashed either when the WTP is not running, or when the WTP production rate is reduced to 350 gpm.
The media bed was originally equipped with 18 inches of media support gravel, followed by 18 inches of filter sand, and capped with 12 inches of anthracite. The overflow edge of the stainless steel washwater collection troughs is located approximately 2 feet 4 -inches above the design media level, allowing for almost 100-percent bed expansion during backwashes.
The underdrain is a header-and-lateral system with an 8-inch-diameter perforated ductile iron pipe (DIP) header running the length of the filter, and 2-inch-diameter perforated PVC laterals connected to the header 8 inches apart. The underdrain system is bedded to the springline with sand-cement grout.
Filter face piping consists of 10-inch-diameter DIP header piping and 8-inch-diameter DIP collector or branch piping to each filter. Each filter effluent outlet also has a 2-inch-diameter filter-to-waste pipe directly connected to the washwater drain piping.
Each filter is equipped with an 8-inch-diameter vent tied into the filter effluent piping. Upon inspection, the vents showed no indication of protection from direct contamination. The vents should be protected from insect and animal entry using a minimum 18-mesh non-corrodible screen, and consideration of using air-vacuum release valves should be examined in this application to protect against possible contamination of finished water.
Filter control is established using the traditional rate-of-flow control methodology. In this method of control, effluent flow from the underdrains is throttled using control valves linked to floats. As filter headloss increases, the effluent control valve opens to allow the flowrate to remain near constant. When the headloss reaches a pre-determined maximum level, the filter is taken offline and backwashed. Backwash is a water-only backwash using a single dedicated backwash pump.
Although a detailed evaluation of the media was not conducted, the facility operator reports the media is original to the plant, so its current service life is about 19 years. Media in service this long becomes rounded and fractured and has typically reached its expected replacement life. Using this rule-of-thumb approach, the media at the Middle Fork facility is likely due for replacement.

Section 2 • Water Treatment Plant Existing Conditions
2-5 6198-YW06_Middle Fork WTP and Reservoir_Final TM_June 2012.docx
2.7 Clearwell and High Service Pumps A 340,000-gallon onsite clearwell stores finished water until it is pumped to the transmission system. The clearwell is a partially buried rectangular tank constructed from cast-in-place reinforced concrete. The tank is configured in such a way that it can be divided nearly in half for maintenance or water age concerns. The original design included vertical turbine lineshaft pumps with their suction and bowls hanging into the clearwell. Only one vertical turbine high service pump and the backwash pump remain in this configuration; the rest have been converted to submersible pumps. Since no sump was provided for the pumps, the clearwell has been limited to the amount of drawdown can be used. With submersible pumps and their bottom-mounted motor, this problem has become even further aggravated, with less than half of the storage available as drawdown.
2.8 Chemical Feed Systems Table 2.1 below outlines the various chemicals fed at the facility. The liquid chemicals are all stored in polyethylene tanks, and all without any secondary spill containment.
Table 2.1 Chemical Systems Chemical Name Use Feed Point Typical Dosage Storage Location
Sodium Permanganate Taste & Odor,
Total Organic Carbon Reduction
Intake 20-25 ppm Intake Chemical
Enclosure
Aluminum Chloride Hydroxide Sulfate
Coagulant Primary Rapid Mix 65-120 ppm Chemical Room
Sodium Chlorite Chlorine Dioxide
Generation Chlorine Dioxide
Generator Chemical Room
Chlorine Dioxide Primary Disinfectant Secondary Rapid Mix 0.6-1.0 ppm N/A
Caustic Soda pH Adjustment Filter Influent 15-20 ppm Secondary
Flocculation Basin
Chlorine Gas Chlorine Dioxide
Generation Chlorine Dioxide
Generator Chlorine Room
Chlorine Gas Secondary Disinfectant Filter Effluent 3-4 ppm Chlorine Room
Sodium Hexametaphosphate Scale Inhibitor Filter Effluent 3-4 ppm Chemical Room
2.9 Electrical, Plumbing, and Mechanical No major electrical issues were uncovered by the field investigation. Any rehabilitation or replacement of the high-service or intake pumps should include variable frequency drives (VFDs) in place of fixed speed starters and pump control valves for pump modulation. Beside the soft-start capabilities provided by VFDs, the efficiencies from running pumps at reduced speeds rather than throttling using valves help reduce energy usage and cause the pumps to run in optimal pump conditions. VFDs also allow the operator to better manage flowrates and optimize pumping schedules.
Plumbing and mechanical systems in the facility are adequate. Mechanical ventilation was provided as required to maintain humidity and temperature control. Humidity in the filter room could be further controlled by using dehumidification or air-conditioning units, if desired. The ventilation system in the high service pump room may need to be modified to accommodate the additional heat created by VFDs, if they’re installed, but if a new high service pumping facility is constructed, this recommendation obviously becomes irrelevant.

Section 2 • Water Treatment Plant Existing Conditions
2-6 6198-YW06_Middle Fork WTP and Reservoir_Final TM_June 2012.docx
2.10 Recommended Improvements and Opinion of Probable Cost The following improvements are recommended to improve the existing condition of the WTP.
2.10.1 Backup Power The present facility doesn’t have an onsite generator or any provisions for a quick connection to a portable unit. Since water is delivered from the pre-sedimentation basin through the entire treatment process without re-pumping, clean water can be put in the clearwell without large electrical inputs. Running the high-service pumps, on the other hand, is necessary to distribute finished water to the system and would require a significant generator. The opinion of probable cost (OPC) below illustrates the costs to add facilities for semi-permanent backup power at the treatment facility. The project would consist of a trailer-mounted generator, a manual transfer switch, and other electrical modifications necessary. The estimated construction cost for this project, including the generator, is approximately $65,000.
2.10.2 Pre-sedimentation Basin Modifications and Maintenance Pre-sedimentation basins with 24 to 48 hours of storage are an asset to most surface WTPs. This amount of storage allows for some turbidity reduction and buffers the process from weather induced or turnover-related spikes in turbidity. As operated, the pre-sedimentation basin provides approximately 30 days of storage. Basins with this much storage often see the water quality revert back to that common in reservoirs due to algae regrowth and wave action mixing.
The figure and OPC below illustrate a project that would partition the existing basin into two smaller basins with 24 to 48 hours of storage each while preserving the full volume of the existing basin. By constructing two smaller basins from the existing large basin, one basin can be out of service for maintenance while the other remains in operation. Sediment accumulation should also be removed from the basins during construction of the partition berm.
Along with this project, a piping modification is recommended that will allow the intake pumps to feed directly to the treatment plant. This piping modification, along with VFD’s running the intake pumps, will allow additional operator flexibility. Using the new bypass piping, operator can choose to feed directly from the reservoir during maintenance or when water quality is found to actually degrade in the pre-sedimentation basins.
The estimated construction cost for this project, including piping, dredging and revetment, and an earthen partition berm is $75,000. See Figure 2.2 for illustration.
2.10.3 Raw Water Intake Renovation As recommended in the January 7, 2011 letter from David Williams to Brock Pfost included in Appendix C, renovations should be constructed at the raw water intake. These renovations should focus on recovering intake flexibility, safely housing chemical storage, and increasing pumping flexibility.
The letter previously referenced recommends a floating intake system. This type of intake prevents issues seen in the current fixed-depth intake system, including intakes being buried in sediment or left out of the water when lake levels decline. Floating intakes can have snorkel-type draft tubes with variable level adjustment for targeting the highest-quality strata in the reservoir.

Section 2 • Water Treatment Plant Existing Conditions
2-7 6198-YW06_Middle Fork WTP and Reservoir_Final TM_June 2012.docx
Figure 2.2 Pre-Sedimentation Basin Improvements

Section 2 • Water Treatment Plant Existing Conditions
2-8 6198-YW06_Middle Fork WTP and Reservoir_Final TM_June 2012.docx
A heated chemical storage facility, at least 150 square feet, should be constructed at the site to prevent ice buildup in the wetwell and protect the pump, chemical storage and feed equipment, and electrical gear. If a building were to be constructed on top of the dam near the intake wetwell, proper care should be taken to ensure adequate foundation design to protect the building foundation and dam integrity. An opinion of probable costs for the intake renovation projects is shown in Table 2.2.
Table 2.2 Opinion of Probable Cost for Raw Water Intake Renovations
Description Unit Price Quantity Units Extension
Floating Intake w/ Adj. Draft Tube $175,000 LUMP SUM $175,000
Chemical Building $65,000 LUMP SUM $65,000
Misc Piping $12,000 LUMP SUM $12,000
VFD $7,500 LUMP SUM $7,500
Electrical $15,000 LUMP SUM $15,000
Instrumentation and Control $15,000 LUMP SUM $15,000
Subtotal $290,000
2.10.4 Chemical Containment In the event of a tank rupture or overfill, secondary chemical containment prevents chemical spills from becoming widespread. This reduces exposure and slipping hazards in the storage room, along with preventing issues from mixing reactive chemicals. Typical design practices utilize containment vessels capable of storing 150 percent of the contained volume. There is currently no secondary chemical containment provided for liquid chemical storage in the facility.
In the chemical room, a raised, grated floor with containment cells below can be constructed. Existing unused equipment, including the unused alum feeder, should be demolished from the room to allow space for the containment modifications. The estimated construction cost for this project, including concrete containment walls and grated platforms is $45,000.
2.10.5 High Service Pump Sump/Clearwell Extension As previously described, due to required pump submergence levels and pump intake elevation, the high service pumps are incapable of accessing the full storage capacity of the clearwell. One solution that has been identified is abandoning the existing high service pumps and constructing an adjacent wetwell property designed for submersible pump installation. Along with construction of a wetwell, the high service pumps would be manifolded together, with their output controlled using variable frequency drives. If submersible pumps continue to be used, a “pitless” style discharge manifold could be created that would help reduce the need for a building over the pumps. An OPC for the project is provided in Table 2.3.

Section 2 • Water Treatment Plant Existing Conditions
2-9 6198-YW06_Middle Fork WTP and Reservoir_Final TM_June 2012.docx
Table 2.3 Opinion of Probable Cost for High Service Pump Sump/Clearwell Extension
Description Unit Price Quantity Units Extension
Concrete Pump Wetwell $65,000 LUMP SUM $65,000
Misc Piping $12,000 LUMP SUM $12,000
VFD $7,500 4 EA $30,000
Electrical $15,000 LUMP SUM $15,000
Instrumentation and Control $10,000 LUMP SUM $10,000
Subtotal $132,000
2.10.6 Filter Rehabilitation and Media Replacement As previously described, the filter media has reached the end of its expected life and is due for replacement. Media replacement projects are rather routine, with only removal and subsequent media placement steps, but any time the media is removed, underdrain, washtrough, and face piping maintenance should be performed. The estimated cost for media replacement and fixed equipment rehabilitation is $32,000.
2.10.7 Concrete and Coating Repair and Replacement Structural reinforced concrete in the facility is generally in good condition, with two notable exceptions. Considerable damage to the loading dock face has occurred, exposing reinforcing steel. The concrete in this area should be scarified to remove loose material and patched to prevent further reinforcing steel corrosion. Dock bumpers should be installed to prevent further damage.
The joint where the secondary clarifier south wall meets the treatment building is exhibiting some basin leakage and damage that is currently cosmetic in nature. The concrete in this area should be repaired and sealed with a patching compound to prevent corrosion to reinforcing steel. External reinforcement of this area may be necessary to prevent future damage.
Coating failure is apparent in many areas of the facility, especially in the humid environment in the filter piping gallery. Piping exhibiting paint failure should be blasted and recoated. Pipe that exhibits more than simple surface corrosion should be replaced. All exposed concrete should be cleaned and brush-blasted prior to coating with a durable epoxy coating. The recoating cost may vary based on the extend of serious pipe corrosion and replacement, but an OPC, assuming no pipe or valve replacement, but including the previously mentioned concrete repairs, is approximately $45,000.
2.10.8 Instrumentation and Telemetry The current facility has very little online instrumentation and no data collection or historian software. Instrumentation, such as platform scales, online chlorine analyzers, pressure transducers, and electric meters, all work together to provide the operator useful information that can be used to optimize process efficiency, chemical usage, and electrical demand. This information should be collected with data logging software and stored to a database. Data from the database can then be queried to provide trend data in the form of graphs and reports.

Section 2 • Water Treatment Plant Existing Conditions
2-10 6198-YW06_Middle Fork WTP and Reservoir_Final TM_June 2012.docx
The cost for such a system varies widely based on the level of service, including the number of sensors deployed, history resolution and retention time, and the level of sophistication provided in reporting, but could be estimated between $150,000 and $350,000.
2.10.9 Opinion of Probable Cost The OPC for the improvements outlined above are summarized in Table 2.4 below.
Table 2.4 WTP Existing Conditions Opinion of Probable Cost
Item Cost
Backup Power $65,000
Partitioning Pre-sedimentation Basin $75,000
Raw Water Intake Renovations $290,000
Chemical Containment $45,000
High Service Pump Sump/Clearwell Extension $132,000
Filter Rehabilitation $32,000
Concrete and Coating Repair $45,000
Instrumentation and Telemetry $350,000
Subtotal $1,034,000
Engineering, Legal, and Contingencies1 $465,000
Total Opinion of Probable Costs $1,500,000 1 Engineering, Legal, and Contingencies assumed to be 45-percent of subtotal.
2.11 2011 Operation and Maintenance Costs MFWC provided the 2011 operation and maintenance costs. These costs were grouped into the following categories and are summarized in Table 2.5
Table 2.5 2011 Operation and Maintenance Costs
2011 Operating and Maintenance Costs
Payroll $50,220
Chemicals $72,398
Power $26,932
Admin $24,378
Maintenance $19,807
Total $193,735

3-1 6198-YW06_Middle Fork WTP and Reservoir_Final TM_June 2012.docx
Section 3 Stanberry Lake Existing Conditions
On November 10, 2011, CDM Smith conducted a visual inspection of the Stanberry Lake Dam located in Gentry, Missouri. This inspection was not intended to substitute for a detailed engineering study and evaluation. In reviewing this report, it should be noted that the reported conditions of the dam are based on field observations of existing conditions at the time of inspection, in addition to other data made available to the inspectors.
It is also important to note that the condition of a dam depends on several internal and external variables, and is constantly changing. It would be inaccurate to assume that the description of dam conditions contained herein will continue to represent the actual conditions of the dam at some point in the future. Thorough care and inspection will help to ensure that unsafe conditions will be detected in the future.
The purpose of the inspection was to make an assessment of the general condition of the dam with respect to safety, based upon available data and visual inspection, in order to evaluate if the dam poses hazards to human life or property. Subsurface explorations, analytical evaluations such as slope stability or hydrologic and hydraulic (H&H) analysis were not done and are beyond the scope of this inspection. Recommendations for required maintenance and repairs are based on the visual inspection. Recommendations for further detailed investigations, if considered required, are also part of this report.
To provide the reader with a better understanding of the report, definitions of commonly used terms associated with dams are provided in Appendix D. Many of these terms may be included in this report. The terms are presented under common categories associated with dams which include: 1) orientation; 2) dam components; 3) size classification; 4) hazard classification; and 5) general. As defined in Appendix D standard terminology for noting orientation of specific observations at dams are referred to as upstream or downstream, and as left or right. The terms left and right refer to the directions observed when looking downstream.
3.1 Dam Description The Stanberry Lake Dam is owned and operated by MFWC and was constructed in 1992 as an earthen dam. The lake is located on a tributary to Middle Fork Grand River about 10 miles northeast of Stanberry, Missouri. Inflow to the upper reservoir is from Linn Creek, with a drainage area of approximately 6.3 square miles.
The dam is approximately 1,000 feet long and the crest of the dam is approximately 20 feet wide. The crest elevation of the earth embankment is elevation (El.) 896.7, with a maximum height of approximately 34.5 feet. Construction drawings indicate that the upstream slope is approximately 2.5 horizontal (H) to 1 vertical (V) (2.5H:1V); however, some areas were measured at 2H:1V. The upstream slope of the dam is typically covered with 6- to 12-inch-diameter riprap. The downstream slope is approximately 3H:1V and is covered with brush and grass approximately 30 inches high. There is a 15-foot-wide bench at about El. 876.8. A typical cross-section of the Dam is shown in Figure 3.1.

Section 3 • Stanberry Lake Existing Conditions
3-2 6198-YW06_Middle Fork WTP and Reservoir_Final TM_June 2012.docx
Figure 3.1 Typical Cross Section Through Drop Inlet Spillway – Stanberry Lake Dam
Outlet
Stanberry Lake Water Elev.
Varies
Dam

Section 3 • Stanberry Lake Existing Conditions
3-3 6198-YW06_Middle Fork WTP and Reservoir_Final TM_June 2012.docx
The water level in the Lake is controlled by a 12-foot by 6-foot concrete drop-inlet (primary) spillway. The primary spillway is located on the upstream slope near the right side of the dam. A 250-foot-long auxiliary spillway is situated at the left abutment of the dam. The total discharge capacity is approximately 4,000 cubic feet per second (cfs).
The drop inlet discharges into a 66-inch-diameter precast concrete pipe, with an upstream invert of 867.0 that runs through the dam and discharges at El. 864.2 to a plunge basin immediately downstream of the dam. The water from the plunge basin flows into Linn Creek through a stone-lined channel. Construction plans show the primary spillway discharge pipe with a filter diaphragm located approximately 32 feet downstream of the center of the embankment crest.
3.1.1 Operations and Maintenance The dam and site are monitored on a daily basis by MFWC personnel. Permanent MFWC staff are responsible for the routine maintenance of the dam and appurtenant structures. The reservoir level is monitored and recorded on 15-minute intervals by U.S. Geological Survey (USGS) gaging station 06896189. The USGS gage datum is the NAVD 88. The gaging station also provides reservoir storage and surface area based on USGS recorded water surface levels. The gaging station period of record began in March 2007.
3.1.2 MDNR Size Classification Missouri Dam Safety Laws and Regulations define jurisdictional dams as any artificial or man-made barrier which does or may impound water and is 35 feet or more in height (Section 236.400(5) RSMo.). The structural height of the Stanberry Lake Dam is approximately 34.5 feet. Stanberry Lake Dam is a non-jurisdictional dam.
3.1.3 MDNR Hazard Potential Classification Laws pertaining to Missouri dam safety are found in Sections 236.400 - 236.500 of the RSMo. - enacted in 1889 and last amended in 1993. Rules are found in 10 CSR 22-1.010 to 10 CSR 22-4.020. The hazard classification criteria are defined in the Rules as the "downstream environmental zone." Three environmental classes are defined:
1. Class I - Contains 10 or more permanent dwellings or any public building
2. Class II - Contains 1 to 9 permanent dwellings or 1 or more campgrounds with permanent water, sewer, and electrical services or 1 or more industrial buildings
3. Class III - Everything else
Although Stanberry Lake Dam is a non-jurisdictional dam under Missouri Laws and Regulations, review of State hazard classification criteria finds the Stanberry Lake Dam to be a Class III hazard potential dam. The dam is located immediately upstream of U.S. Highway 169. It appears that a failure of the dam at maximum pool may cause damage to the highway and utilities located along the highway right-of-way. In addition, a breach would cause significant interruption to the MFWC treatment plant. It appears that a breach of the Stanberry Dam would not impact any permanent dwellings or public buildings. Therefore, Stanberry Lake Dam should be considered a Class III hazard potential dam.

Section 3 • Stanberry Lake Existing Conditions
3-4 6198-YW06_Middle Fork WTP and Reservoir_Final TM_June 2012.docx
3.1.4 Pertinent Engineering Data The pertinent engineering data presented herein are based on observations and measurements performed during the CDM Smith inspection and by data contained in previous reports. Elevations are referenced to NAVD 88.
The following reservoir elevations in Table 3.1, surface area, and storage volumes are estimated based on USGS topographic maps, and existing drawings and studies.
Table 3.1 Reservoir Elevations, Surface Area, and Storage Volume
Condition/Pool Level Elevation
(feet) Surface Area
(acres) Storage Volume
(acre-feet)
Primary Spillway EL (Normal) 889.3* 140 1,00
Auxiliary Spillway EL 893.4 210 1,600
Crest EL (Maximum)** 896.7 280 2.3
* Primary Spillway Elevation taken from survey completed for this task order. ** Surface Area and Volume approximated.
The following elevations in Table 3.2 are based on information included on construction documents and field measurements.
Table 3.2 Reservoir Expanded Elevations
Item Elevation (feet)
Top of Dam 896.7
Spillway Design Flood* 100-year
Normal Pool 890.0
Primary Spillway Crest 890.0
Auxiliary Spillway 893.4
Upstream Water at Time of Inspection 887.2
Discharge Pipe inlet elevation 867.0
Discharge Pipe outlet elevation 864.2
* No hydrologic or hydraulic analyses were completed as part of this study.
Drawings, daily construction reports, and material test reports were provided to CDM Smith at the time of the inspection and are included in Appendix F. Operating records provided for the Stanberry Lake Dam were limited to water level and related storage volumes and impoundment surface.
See Table 3.3 Summary Data Table for summary of pertinent engineering data.

Section 3 • Stanberry Lake Existing Conditions
3-5 6198-YW06_Middle Fork WTP and Reservoir_Final TM_June 2012.docx
Table 3.3 Summary Data Table
Report Data Data Provided by the Inspecting Engineer
National ID # NA
Dam Name Stanberry Lake Dam
Dam Name (Alternate) Lake Elizabeth Dam
River Name Linn Creek
Impoundment Name Stanberry Lake, Lake Elizabeth, Linn Creek
Lake, Middle Fork Reservoir
Hazard Class Class III
Size Class NA
Dam Type Earth Embankment
Dam Purpose Water Supply
Height of Dam (feet) 34.5
Drainage Area (square miles) 6.3
Reservoir Surface Area (sq. mi.) 0.22
Normal Impoundment Volume (acre-feet) 1040
Max Impoundment Volume (top of dam) acre-feet) 1625
SDF Impoundment Volume* (acre-feet) 1353
Primary Spillway Type Drop Inlet
Spillway Length (feet) 45
Freeboard at Normal Pool (feet) 5
Primary Spillway Capacity* (cfs) 400
Auxiliary Spillway Capacity* (cfs) 3,600
Low-Level Outlet Capacity* (cfs) 0
Spillway Design Flood* (flow rate - cfs) 4,000
Winter Drawdown (feet below normal pool) 0
Drawdown Impoundment Vol. (acre-feet) 0
Public Road on Crest No
Public Bridge over Spillway No
EAP Date (if applicable) Not available
Date of Field Inspection 11/10/2011
Consultant Firm Name CDM Smith
Inspecting Engineer William Friers, Stephen Whiteside
Engineer Phone Number 518 782-4513
* Volume approximated

Section 3 • Stanberry Lake Existing Conditions
3-6 6198-YW06_Middle Fork WTP and Reservoir_Final TM_June 2012.docx
3.2 Visual Inspection Stanberry Lake Dam was inspected on November 10, 2011. At the time of the inspection, the weather was clear and the temperature was approximately 45 degrees Fahrenheit (°F). A site sketch and notes are shown on Figure 3.2. Photographs to document the current conditions of the dam were taken during the inspection and are included in Appendix B. The locations of the photographs are shown in Figure 3.3. Underwater areas were not inspected. A copy of the inspection checklist is included in Appendix E.
Stanberry Lake Dam was found to be in SATISFACTORY condition at the time of inspection. A dam judged to be in satisfactory condition has minor operational and maintenance deficiencies. The deficiencies that were noted include:
Areas of erosion on upstream slope observed; 3-feet high x 4-feet deep accompanied by steep embankment slopes (2H:1V)
Slope erosion on the right side and rear of the primary spillway (drop inlet)
Tall grass, brush, and saplings were observed growing in the riprap on the upstream slope
Animal burrows observed on the upstream and downstream slopes
Tire rutting; approximately 8-inches deep on left half of the crest and on downstream bench, with some puddles
There is no low-level outlet for the dam. A low-level outlet would allow the care taker to lower the reservoir below normal pool stage for lake management purposes, routine repairs, or dam safety purposes.
Cracks and deterioration on the exterior of the water intake structure observed near the base of the structure.
Numerous trees, up to 4 inches in diameter, observed on the lower section of the downstream slope
Erosion of material from within the plunge basin, appears to have increased the structural height of the dam
The majority of the crest (Photographs 5, 6, and 7) of the dam was straight with no signs of misalignment, sloughing, or settlement. The upstream slope (Photographs 8, 9, 12, and 15) generally appeared to be stable. Some brush was observed on the upstream slope, but it did not obstruct viewing the slope. The downstream slope (Photographs 4, 16, and 17) above El. 876.8 appeared to be approximately 3H:1V and was covered predominantly with tall brush and grass. A 15-foot-wide bench, at about El. 876.8, had extensive tire ruts, approximately 8 inches deep (Photographs 4, 18, 19, and 22). Otherwise, the bench was generally covered with well established grass. The downstream slope, below El. 876.8 was approximately 3H:1V and was generally overgrown with tall brush, grass, and trees up to 4 inches in diameter (Photograph 20). Several animal burrows were observed on the lower slope (Photograph 21).
An erosion rill was observed on the downstream embankment slope, to the right of the primary spillway outlet (Photograph 26). In addition, a 6-inch-diameter animal burrow was observed on the slope left of the 6-foot-diameter primary spillway outlet pipe (Photograph 23 and 24). The abutment contacts appear to have a good transition into the natural topography (Photographs 1 and 7).

Section 3 • Stanberry Lake Existing Conditions
3-7 6198-YW06_Middle Fork WTP and Reservoir_Final TM_June 2012.docx
Figure 3.2 Field Sketch and Notes - Stanberry Lake Dam

Section 3 • Stanberry Lake Existing Conditions
3-8 6198-YW06_Middle Fork WTP and Reservoir_Final TM_June 2012.docx
Figure 3.3 Photograph Locations Plan - Stanberry Lake Dam

Section 3 • Stanberry Lake Existing Conditions
3-9 6198-YW06_Middle Fork WTP and Reservoir_Final TM_June 2012.docx
The caretaker reported the 6-inch-diameter foundation drain installed along the length of the toe of the downstream slope and the pipe from the filter diaphragm discharge adjacent to the primary spillway outlet pipe. The caretaker indicated that limited water flows have been observed discharging from the pipe intermittently. The foundation drain discharges to the plunge basin, left of the primary spillway discharge pipe (Photograph 28). The drain pipe was not observed during the inspection.
No wet areas were observed at the dam toe or within the downstream area.
3.2.1 Appurtenant Structures The concrete primary spillway on the upstream slope of the dam was in good condition (Photographs 13, and 14). The water level at the time of the inspection was approximately El. 887.75.
The interior of 66-inch-diameter primary spillway discharge pipe was not inspected because of restricted access. The section of exposed pipe seen on the downstream slope of the dam appeared to be in good condition (Photographs 20 and 21). The downstream channel was free of debris. The left and right banks of the discharge channel were eroded approximately 150 feet from the toe of the dam (Photograph 27).
The water supply intake structure, located on the upstream slope of the dam, is approximately 400 feet from the left abutment (Photograph 10). Concrete near the base of the intake has cracked to a depth of approximately 3 inches. It appears as though efforts have been made to patch the damaged area, however the attempted repairs have also failed (Photograph 11).
3.2.2 Downstream Area U.S. Highway 169 is approximately 0.3 mile downstream of the dam. It appears that a failure of the dam at maximum pool may cause damage to the highway and utilities located along the highway right-of-way. In addition, a breach would cause significant interruption to the MFWC treatment plant. It appears that a breach of the Stanberry Lake Dam would not impact any permanent dwellings or public buildings.
3.2.3 Reservoir Area Stanberry Lake’s western shoreline is wooded while the balance is grassland.
3.2.4 Caretaker Interview A caretaker interview was held during the inspection with the MFWC staff who accompanied the inspection team. MFWC staff present during the inspection included Brock Pfost, P.E. and the plant operator. Information collected during discussions with the MFWC personnel are reflected in other pertinent sections of this report.
3.3 Operation and Maintenance Procedures The MFWC staffs the filtration plant located downstream of the dam. Although Stanberry Lake Dam does not have written operating procedures, the dam is observed on a daily basis. MFWC performs general maintenance for the dam, which includes mowing, minor tree removal and removal of debris from the primary spillway and water intake structure. MFWC removes brush and trees from the dam approximately once every year or as needed. Stanberry Lake Dam does not have written operating procedures. An Emergency Action Plan is not in place for Stanberry Lake Dam. An early warning system is in place via daily monitoring by plant staff. MDNR strongly recommends that an operating and energy action plans be prepared.

Section 3 • Stanberry Lake Existing Conditions
3-10 6198-YW06_Middle Fork WTP and Reservoir_Final TM_June 2012.docx
Routine maintenance efforts include those activities that should be performed regularly (monthly and/or annually) and that usually can be completed by the dam owner/caretaker. Typically, no engineering design support is required for these activities. These maintenance efforts and the suggested frequency are as follows:
Within the first quarter of the year and as-needed afterward:
1. Cut brush/vegetation regularly; common methods for control of vegetation include the use of weed trimmers or power brush-cutters and mowers.
2. Regrade the surface of the embankment crest and bench to eliminate ruts, potholes and provide proper drainage, provided that the freeboard is not reduced.
3. All burrowing animals should be removed and all burrow holes backfilled with compacted select fill
4. Place additional riprap on the upstream slope, in areas that have sustained minor damage To restore the original riprap protection
3.4 Hydraulic and Hydrologic Data H&H analyses for Stanberry Lake Dam were not provided to CDM Smith and apparently are not available. CDM Smith recommends that a hydrologic and hydraulic analysis be performed to determine the overtopping potential for the dam for the 100-year flood event.
The dam currently does not have a low-level outlet to lower the reservoir for maintenance or in case of an emergency. It is recommended that the feasibility of constructing a low-level outlet be evaluated or the possibility of doing emergency pumping or siphon to lower the lake level if needed.
3.5 Structural and Seepage Stability During the inspection, areas of uneven slope consisting of erosion rills, and several animal burrows were observed on the downstream slope. A detailed stability or seepage analysis that includes an evaluation of the dam under various loading and existing phreatic conditions was not performed. MDNR recommends these analyses be conducted prior to negotiating a purchase of the lake.
The MFWC caretaker indicated the auxiliary spillway has been activated on several occasions, with depth of flow estimated at approximately 2 feet. It is recommended to conduct an H&H analysis to estimate the potential of overtopping the dam during the 100-year flood event. It is also recommended a topographic survey of the dam be performed to confirm critical elevations of the dam and spillways required for the H & H analysis.
3.6 Recommendations, Maintenance, and Minor Repairs The remaining deficiencies noted are generally considered either maintenance or minor repair items. Correction of the deficiencies typically does not require a dam safety permit.
1. Backfill erosion rills on the downstream slope and erosion of the upstream slope with compacted select fill to mitigate further erosion and to preserve the stability of the embankment.
2. Repair or replace existing precast concrete water supply intake structure.

Section 3 • Stanberry Lake Existing Conditions
3-11 6198-YW06_Middle Fork WTP and Reservoir_Final TM_June 2012.docx
3.6.1 Remedial Modification Recommendations None of the deficiencies are considered to be an immediate threat to the dam. The extent of remedial measures for the dam and spillways should be based on the results of future H&H analyses. No alternatives are presented for the recommendations offered above. It should be noted that some of the recommendations noted above could be undertaken by the MFWC personnel to save cost.
3.7 Opinion of Probable Construction Cost Costs for the repairs are estimated based on comparison with similar repairs for other dams. The actual cost of the repairs can vary depending on contracting procedures required by MFWC as well as other factors. These costs should be considered very preliminary and should be confirmed by obtaining estimates from local contractors. The costs provided are physical costs of the repairs and do not include costs for construction contingencies, engineering services, or permitting.
None of the deficiencies are considered an immediate threat to the dam; however, the issues will likely become worse with time if left unresolved. Table 3.4 summarizes the OPC for this project.
Table 3.4 Opinion of Probable Construction Cost for Stanberry Lake Repairs Description Cost
Studies and Analyses
Perform a topographic survey $6,000 - $8,000
Complete hydrologic and hydraulic studies $20,000 - $25,000
Evaluate the feasibility of installing a low-level outlet at the primary spillway
$8,000 - $12,000
Recurrent Maintenance Recommendations (Assumed to be performed by MFWC personnel)2
Perform regular maintenance $ N/A
Remove animals and fill burrows $ N/A
Fill voids behind discharge channel sidewalls $ N/A
Place additional riprap on the upstream slope $3,000 - $8,000
Recommendations, Maintenance, and Minor Repair
Backfill areas of erosion $6,000 - $ 10,000
Repair or replace existing precast concrete intake structure $5,000 - $ 20,000
Remedial Modification Recommendations
Remedial measures to address spillway capacity TBD
(based on H/H Analyses)
Subtotal $48,000 - $75,000
Engineering, Legal, Contingencies1 $21,600 - 33,900
Total Opinion of Probable Construction Cost $70,000 - $110,000 1 Engineering, Legal, and Contingencies assumed to be 45-percent of subtotal 2 Not included in overall project cost
It is assumed that regular maintenance, removing and filling burrow holes, re-seeding bare areas, and filling voids behind the discharge channel sidewalls could be completed by MFWC personnel and therefore cost estimates for such items were not provided.

Section 3 • Stanberry Lake Existing Conditions
3-12 6198-YW06_Middle Fork WTP and Reservoir_Final TM_June 2012.docx
This page left blank intentionally

4-1 6198-YW06_Middle Fork WTP and Reservoir_Final TM_June 2012.docx
Section 4 Stanberry Lake Water Supply Analysis
This section summarizes the water supply analysis completed for Stanberry Lake in northwest Missouri. The drainage area to the reservoir is 6.3 square miles, and is mostly composed of grassland and cultivated farmland. The lake has a storage volume of 1,040 acre-feet at the assumed primary spillway elevation of 890 feet. A survey was completed after the water supply analysis was completed which reported the spillway elevation to be at 889.2 feet. Because modeling was completed at monthly intervals, it was determined that this difference in spillway elevations did not introduce significant error into the analysis. The average existing water demand from the reservoir is 315,000 gpd.
The goal of this water supply analysis was to evaluate existing conditions and to investigate if the reservoir could be expanded to allow for a higher water demand. To accomplish these goals, a spreadsheet model of Stanberry Lake was created. This model was then used to analyze three scenarios:
Existing conditions, which calculated firm yield for the lake with 2012 survey data incorporated.
Raised dam scenario, which evaluated a scenario in which the existing dam is raised 18 feet.
Additional upstream reservoir scenario, which evaluated a scenario in which a new dam and water supply reservoir is constructed upstream of Stanberry Lake.
The Existing Conditions Analysis was completed for two time periods. The first time period (“Time Period 1”) was from October 1948 until December 1960, and includes the drought of record for northwest Missouri, where Stanberry Lake is located. The second time period (“Time Period 2”) was from July 2002 to December 2011, and represents a normal hydrologic period at Stanberry Lake.
The Raised Dam and Additional Upstream Reservoir scenarios were both modeled for Time Period 1 only. Time Period 2 was used to calibrate the existing conditions model.
4.1 Existing Conditions Analysis The goals of the existing conditions analysis were:
To create a spreadsheet reservoir model and calibrate it to observed water surface elevations (WSEs).
To find firm yield, which is here defined as the maximum water supply demand that does not cause a modeled storage volume of less than 20 acre-feet during the drought of record (Time Period 1). This firm yield was compared to the MDNR water supply study completed in 2001 for verification.
The USGS installed a gauge at Stanberry Lake (Gauge 06896189) which has a record of daily water surface elevations extending from March 31, 2007 to the present day. The WSEs simulated by the model during Time Period 2 were compared to the WSEs observed by the USGS gauge to calibrate the model. The model accounted for losses to seepage, evaporation, the spillway, and water supply demand.

Section 4 • Stanberry Lake Water Supply Analysis
4-2 6198-YW06_Middle Fork WTP and Reservoir_Final TM_June 2012.docx
No streamflow gauge exists to record the quantity of inflows to Stanberry Lake, so the analyses were completed with two different surrogate inflow sources. The locations of these gauges are shown in Figure 4-1. The first was USGS Gauge 06820000 at White Cloud Creek near Maryville, Missouri. The drainage area to this gauge has a similar land use to the drainage area into Stanberry Lake. The drainage area to the gauge is 6.0 square miles and the record from the gauge includes measured streamflow for only Time Period 1.
The other gauge used was USGS Gauge 06897000, located on East Fork Big Creek near Bethany, Missouri. This gauge includes measured streamflow for both Time Period 1 and Time Period 2. As a result, this gauge was used to calibrate the model. This gauge has a drainage area of 95.0 square miles with similar land use as the drainage area to Stanberry Lake. To account for the difference in drainage area size, streamflows were weighted by drainage area acreage.
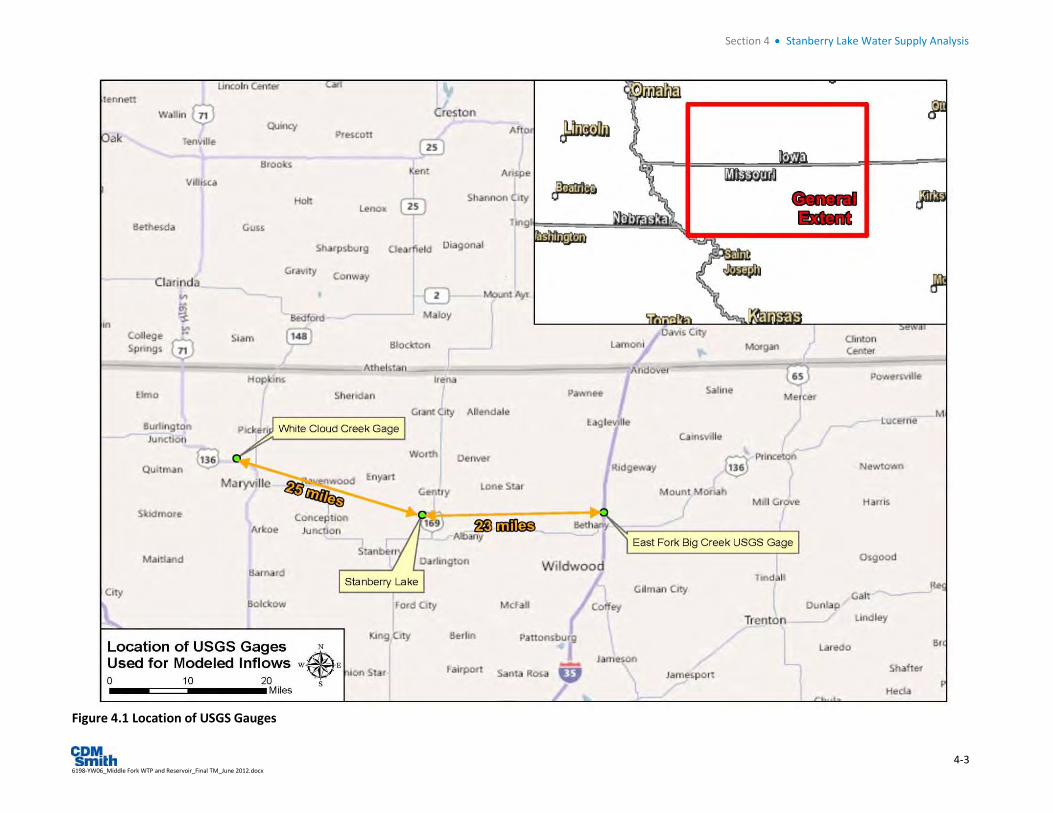
Section 4 • Stanberry Lake Water Supply Analysis
4-3 6198-YW06_Middle Fork WTP and Reservoir_Final TM_June 2012.docx
Figure 4.1 Location of USGS Gauges
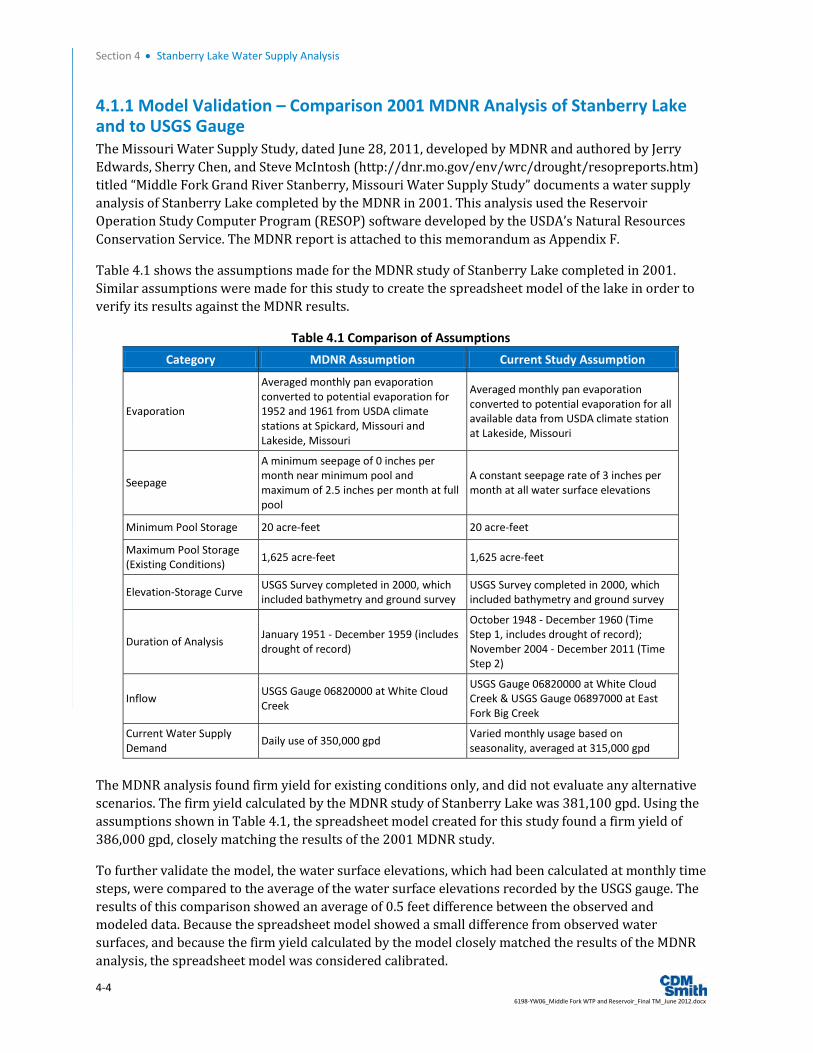
Section 4 • Stanberry Lake Water Supply Analysis
4-4 6198-YW06_Middle Fork WTP and Reservoir_Final TM_June 2012.docx
4.1.1 Model Validation – Comparison 2001 MDNR Analysis of Stanberry Lake and to USGS Gauge The Missouri Water Supply Study, dated June 28, 2011, developed by MDNR and authored by Jerry Edwards, Sherry Chen, and Steve McIntosh (http://dnr.mo.gov/env/wrc/drought/resopreports.htm) titled “Middle Fork Grand River Stanberry, Missouri Water Supply Study” documents a water supply analysis of Stanberry Lake completed by the MDNR in 2001. This analysis used the Reservoir Operation Study Computer Program (RESOP) software developed by the USDA’s Natural Resources Conservation Service. The MDNR report is attached to this memorandum as Appendix F.
Table 4.1 shows the assumptions made for the MDNR study of Stanberry Lake completed in 2001. Similar assumptions were made for this study to create the spreadsheet model of the lake in order to verify its results against the MDNR results.
Table 4.1 Comparison of Assumptions
Category MDNR Assumption Current Study Assumption
Evaporation
Averaged monthly pan evaporation converted to potential evaporation for 1952 and 1961 from USDA climate stations at Spickard, Missouri and Lakeside, Missouri
Averaged monthly pan evaporation converted to potential evaporation for all available data from USDA climate station at Lakeside, Missouri
Seepage
A minimum seepage of 0 inches per month near minimum pool and maximum of 2.5 inches per month at full pool
A constant seepage rate of 3 inches per month at all water surface elevations
Minimum Pool Storage 20 acre-feet 20 acre-feet
Maximum Pool Storage (Existing Conditions)
1,625 acre-feet 1,625 acre-feet
Elevation-Storage Curve USGS Survey completed in 2000, which included bathymetry and ground survey
USGS Survey completed in 2000, which included bathymetry and ground survey
Duration of Analysis January 1951 - December 1959 (includes drought of record)
October 1948 - December 1960 (Time Step 1, includes drought of record); November 2004 - December 2011 (Time Step 2)
Inflow USGS Gauge 06820000 at White Cloud Creek
USGS Gauge 06820000 at White Cloud Creek & USGS Gauge 06897000 at East Fork Big Creek
Current Water Supply Demand
Daily use of 350,000 gpd Varied monthly usage based on seasonality, averaged at 315,000 gpd
The MDNR analysis found firm yield for existing conditions only, and did not evaluate any alternative scenarios. The firm yield calculated by the MDNR study of Stanberry Lake was 381,100 gpd. Using the assumptions shown in Table 4.1, the spreadsheet model created for this study found a firm yield of 386,000 gpd, closely matching the results of the 2001 MDNR study.
To further validate the model, the water surface elevations, which had been calculated at monthly time steps, were compared to the average of the water surface elevations recorded by the USGS gauge. The results of this comparison showed an average of 0.5 feet difference between the observed and modeled data. Because the spreadsheet model showed a small difference from observed water surfaces, and because the firm yield calculated by the model closely matched the results of the MDNR analysis, the spreadsheet model was considered calibrated.

Section 4 • Stanberry Lake Water Supply Analysis
4-5 6198-YW06_Middle Fork WTP and Reservoir_Final TM_June 2012.docx
4.1.2 Sedimentation Analysis The sedimentation of Stanberry Lake was analyzed based on bathymetric data collected in the years 2000 and 2012. The bathymetry survey from 2000 was completed by the USGS in support of a water supply analysis completed by the MDNR. The 2012 survey was completed in March 2012 by Powell & Associates under the Phase V Missouri Regional Water Supply Transmission System Study contract.
The 2012 survey was completed using a boat fitted with a small electric motor, as a larger outboard motor could have introduced error into the survey equipment’s readings. The survey equipment used was a sonar unit manufactured by Ohmex Instrumentation called the SonarMite version 3.1 Echo Sounder. Elevations were established using the Topcon HiPer GPS unit. Data from field equipment were imported for use in a personal computer system using the software Carlson Survey Plus.
To complete the survey of Stanberry Lake, cross sections traversing the lake were first completed. The boat was able to access the entire lake, including shallow areas. To complete the survey, a land survey was completed at the water’s edge to an elevation of approximately 888 feet.
Both sets of data were available in comma delimited format. These datasets included survey points by X and Y coordinates in the Missouri State Plane – West (feet, 1983) projection system and the ground elevation associated with the points. The comma delimited files were imported to ArcGIS version 10 and used to create a digital elevation model using the 3D Analyst extension.
The available data for the 2000 survey included bathymetric elevation data to 884 feet. The USGS developed a curve relating WSE to surface area and another curve relating WSE to storage volume to describe the extent and volume of water able to be impounded by the Stanberry Lake dam. This curve, which was used by the MDNR, extends to an elevation of 893.4 feet, and it is assumed that the USGS completed a land survey to quantify storage from elevation 884 feet to 893.4 feet. These two curves were created again using the 2012 bathymetric survey data. Table 4.2 below compares these curves for the years 2000 and 2012 surveys. The total reduction in storage volume caused by sedimentation at the assumed spillway elevation of 890 feet was calculated based on these curves, and the results are shown in Table 4.3.

Section 4 • Stanberry Lake Water Supply Analysis
4-6 6198-YW06_Middle Fork WTP and Reservoir_Final TM_June 2012.docx
Table 4.2. Comparison of Storage Volumes for Bathymetric Surveys
Elevation, feet
2000 USGS Bathymetry
Survey Surface Area, acres
2012 Bathymetry
Survey Surface Area, acres
2000 USGS Bathymetry
Survey Storage Volume, acre-ft
2012 Bathymetry
Survey Storage Volume, acre-ft
Percent Reduction in Storage Comment
868 0.1 0.01 0.1 0.00 97.0%
870 1.7 0.3 1.0 0.2 81.5%
872 5.7 2.0 7.3 2.1 72.0%
874 14.2 9.8 27.5 12.9 53.2%
874.5 16.8* 11.9* 37.2* 20.0* 46.2%
876 24.4 18.2 65.4 40.6 37.8%
878 35.2 30.4 125.1 90.0 28.0%
880 48.4 41.6 208.9 161.7 22.6%
882 58.9 53.0 316.7 256.9 18.9%
884 69.4 62.4 443.3 372.2 16.0% Limit of 2000 USGS Bathymetric Survey
886 71.4 77.8 599.9 516.0 14.0%
888 86.7 93.4 795.2 687.7 13.5% Limit of 2012
Bathymetric Survey
890** 109.0 118.7 1,040.7 900.0 13.5%
892*** 138.5 175.1 1,170.3 1,352.9 0.0%
893.4*** 175.1 206.1 1,405.6 1,625.0 0.0%
*Values for storage volume at water surface elevation 874.5 feet found by linear interpolation.
**The 2012 storage volumes reported were calculated using the 2000 survey storage value. This value was reduced by 13.5% based on the reduction observed at elevation 888 feet.
***The storage values for the 2000 USGS survey were used in the 2012 bathymetry curve without reduction due to sediment, as the primary spillway, which is at invert 889.2 feet, prevents water surfaces higher than 890 feet for the majority of the year. This limits sedimentation at these elevations.
Table 4.3. Sedimentation Occurring between the Years
2000 and 2012 Based on Bathymetric Survey Data
Survey Storage Volume at Water Surface
Elevation of 890 feet, acre-feet
2000 USGS Survey 1,040
2012 Survey 900
Sedimentation Rate 11.7 acre-feet/year

Section 4 • Stanberry Lake Water Supply Analysis
4-7 6198-YW06_Middle Fork WTP and Reservoir_Final TM_June 2012.docx
4.1.3 Updated Existing Conditions Firm Yield The curves relating WSE to surface area and WSE to storage volume for the 2012 survey were input to the spreadsheet model and firm yield calculated. This resulted in a firm yield of 361,000 gpd, a loss of 25,000 gpd compared to the firm yield of 386,000 previously calculated using the 2000 survey data. This loss indicated that sedimentation has reduced the water supply demand which can be drawn from the lake.
4.2 Evaluation of Alternatives to Increase Firm Yield Two scenarios were analyzed to evaluate their capacity to increase firm yield at Stanberry Lake. The first alternative was to raise the existing dam 18 feet, allowing additional water to be impounded. The second alternative was to construct an additional reservoir upstream of Stanberry Lake.
4.2.1 Raised Dam Scenario Analysis The goal of the Raised Dam Scenario Analysis was to evaluate if a water demand higher than the existing conditions firm yield could be sustained by the reservoir if the top of dam were to be raised to an elevation of 912 feet. This scenario is shown in Figure 4.2. At the maximum water surface of 912 feet, the reservoir inundates an area of 470 acres. This area of inundation is shown in Figure 4.2 as well. This scenario was analyzed by extending the calibrated existing conditions spreadsheet reservoir model to reflect the raised dam based on a 30-meter USGS digital elevation model.
4.2.2 Additional Upstream Reservoir Scenario Analysis The goal of the Additional Upstream Reservoir analysis was to evaluate if a water demand higher than the existing conditions firm yield could be sustained by the existing reservoir if an additional reservoir were constructed upstream. The location and extent of the additional upstream reservoir is shown in Figure 4.3. The area of inundation shown in Figure 4.3 is for the maximum water surface, and encompasses 190 acres.
This analysis was accomplished by modifying the calibrated existing conditions spreadsheet reservoir model. The addition of the upstream reservoir split the drainage area between the two reservoirs. The area draining to the hypothetical, upstream reservoir was 3.74 square miles (57 percent of the total drainage area), and the area draining to the downstream, existing reservoir was 2.86 square miles (43 percent of the total drainage area).
The downstream reservoir was kept at a pool elevation 2 feet below the spillway by discharging stored water to it from the upstream reservoir. When insufficient water was available in the upstream reservoir to keep the downstream reservoir at this pool elevation, all available volume in the upstream reservoir was discharged to the downstream reservoir. If the downstream reservoir received inflows which caused it to have a pool elevation greater than 2 feet below the spillway, the excess volume was assumed to be pumped to the upstream reservoir. Volume escaping the upstream reservoir through the spillway was assumed to be discharged to the downstream reservoir. No other operational rules were applied.

Section 4 • Stanberry Lake Water Supply Analysis
4-8 6198-YW06_Middle Fork WTP and Reservoir_Final TM_June 2012.docx
Figure 4.2 Stanberry Lake with Raised Dam General Location and Layout

Section 4 • Stanberry Lake Water Supply Analysis
4-9 6198-YW06_Middle Fork WTP and Reservoir_Final TM_June 2012.docx
Figure 4.3 Stanberry Lake with Additional Upstream Reservoir General Location and Layout

Section 4 • Stanberry Lake Water Supply Analysis
4-10 6198-YW06_Middle Fork WTP and Reservoir_Final TM_June 2012.docx
4.3 Results and Recommendations The calibrated existing conditions spreadsheet model which used the WSE to surface area and the WSE to storage volume relations calculated from the 2012 survey data was modified to model the Alternatives scenarios. The firm yields for all scenarios, including existing conditions, are summarized in Table 4.4 below.
Table 4.4 Water Supply Firm Yield for All Analyses
Scenario White Cloud Creek Gauge Firm Yield Average GPD*
Existing Conditions 361,000
Raised Dam 560,000
Additional Upstream Reservoir 583,000
*Existing Average Demand is 315,000 gpd.
The firm yields from the White Cloud Creek gauge analysis were lower than for East Fork Big Creek, and are the recommended firm yields to be used to guide further analyses and design. This is because the drainage area to the White Cloud Creek gauge was similar in land use and topology to the drainage area to Stanberry Lake.
In addition, as previously stated, the East Fork Big Creek gauge is likely to reflect baseflow which the White Cloud Creek gauge did not experience due to its smaller acreage. Because the size of the drainage area to Stanberry Lake and the White Cloud Creek gauge are similar, the White Cloud Creek gauge more accurately reflects baseflow to Stanberry Lake.
The White Cloud Creek gauge may therefore give a more realistic firm yield for each modeled scenario, and makes more conservative assumptions that the East Fork Big Creek gauge analyses. It is recommended that increases at Stanberry Lake in water demand use the White Cloud Creek gauge analyses firm yields as a basis for increasing demand as shown in Table 4.4.
4.3.1 Raised Dam versus Additional Upstream Reservoir Firm yields for both scenarios were similar, as both scenarios increase storage capacity. The additional upstream reservoir scenario offered operational flexibility, resulting in a higher firm yield. It must be noted that the operational rules assumed for the Additional Upstream Reservoir scenario were key in obtaining firm yield. If these rules are not followed, a different firm yield is expected and the analysis must be completed again to estimate firm yield for the scenario.
4.3.2 Projected Firm Yields The firm yields for the existing Stanberry Lake scenario were projected 30 years into the future. This analysis assumed that neither of the alternatives outlined in Sections 2.3 and 2.4 were implemented, and that sedimentation continues to occur at the rates observed between the years 2000 and 2012. The results of this analysis are reported in Table 4.5 and shown in Figure 4.4. The analysis shows that sedimentation will reduce firm yield such that the lake will not be able to meet existing daily demand sometime between 2022 and 2032.

Section 4 • Stanberry Lake Water Supply Analysis
4-11 6198-YW06_Middle Fork WTP and Reservoir_Final TM_June 2012.docx
Table 4.5 Projected Water Supply Firm Yield Assuming No Improvement to Existing Reservoir and
Historical Sedimentation Rate
Scenario White Cloud Creek Gauge Firm Yield Average GPD*
Existing Conditions 361,000
Projected 2022 Firm Yield Based on Sedimentation Rate in Table 4.2
336,000
Projected 2032 Firm Yield Based on Sedimentation Rate in Table 4.2
290,000
Projected 2042 Firm Yield Based on Sedimentation Rate in Table 4.2
222,000
*Existing Average Demand is 315,000 gpd.
Figure 4.4 Projected Firm Yield for Stanberry Lake

Section 4 • Stanberry Lake Water Supply Analysis
4-12 6198-YW06_Middle Fork WTP and Reservoir_Final TM_June 2012.docx
This page left blank intentionally
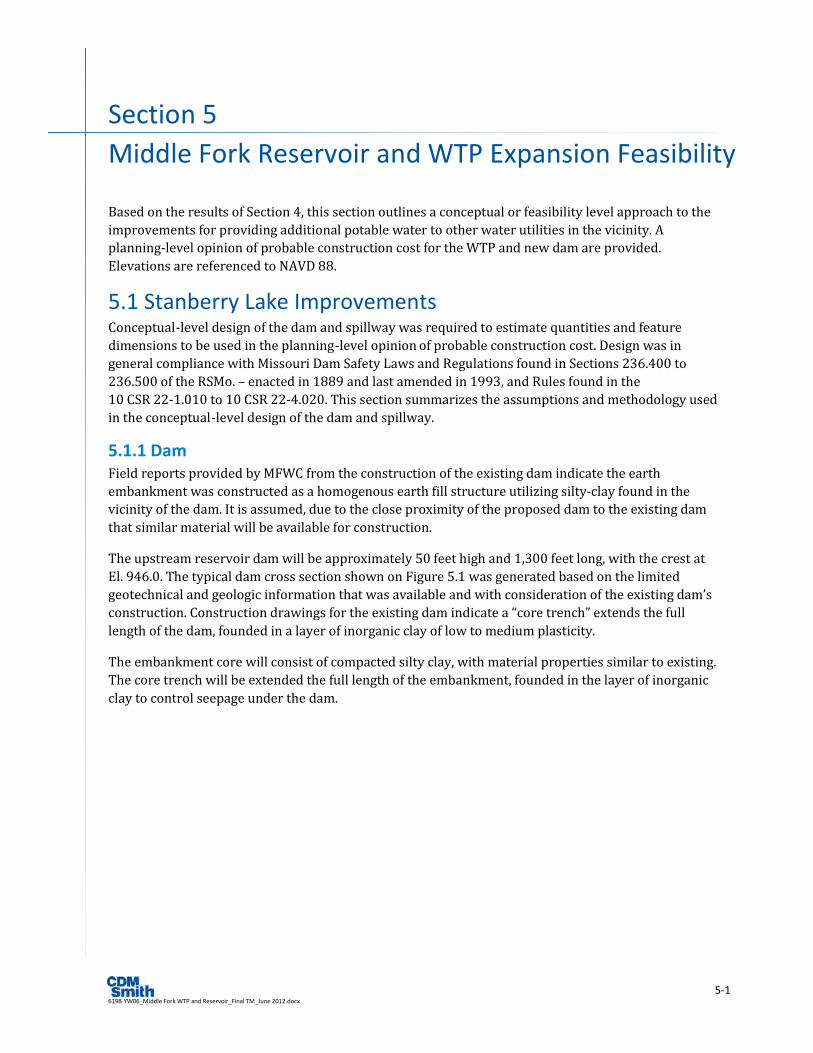
5-1 6198-YW06_Middle Fork WTP and Reservoir_Final TM_June 2012.docx
Section 5 Middle Fork Reservoir and WTP Expansion Feasibility
Based on the results of Section 4, this section outlines a conceptual or feasibility level approach to the improvements for providing additional potable water to other water utilities in the vicinity. A planning-level opinion of probable construction cost for the WTP and new dam are provided. Elevations are referenced to NAVD 88.
5.1 Stanberry Lake Improvements Conceptual-level design of the dam and spillway was required to estimate quantities and feature dimensions to be used in the planning-level opinion of probable construction cost. Design was in general compliance with Missouri Dam Safety Laws and Regulations found in Sections 236.400 to 236.500 of the RSMo. – enacted in 1889 and last amended in 1993, and Rules found in the 10 CSR 22-1.010 to 10 CSR 22-4.020. This section summarizes the assumptions and methodology used in the conceptual-level design of the dam and spillway.
5.1.1 Dam Field reports provided by MFWC from the construction of the existing dam indicate the earth embankment was constructed as a homogenous earth fill structure utilizing silty-clay found in the vicinity of the dam. It is assumed, due to the close proximity of the proposed dam to the existing dam that similar material will be available for construction.
The upstream reservoir dam will be approximately 50 feet high and 1,300 feet long, with the crest at El. 946.0. The typical dam cross section shown on Figure 5.1 was generated based on the limited geotechnical and geologic information that was available and with consideration of the existing dam’s construction. Construction drawings for the existing dam indicate a “core trench” extends the full length of the dam, founded in a layer of inorganic clay of low to medium plasticity.
The embankment core will consist of compacted silty clay, with material properties similar to existing. The core trench will be extended the full length of the embankment, founded in the layer of inorganic clay to control seepage under the dam.

Section 5 • Middle Fork Reservoir and WTP Expansion Feasibility
5-2 6198-YW06_Middle Fork WTP and Reservoir_Final TM_June 2012.docx

Section 5 • Middle Fork Reservoir and WTP Expansion Feasibility
5-3 6198-YW06_Middle Fork WTP and Reservoir_Final TM_June 2012.docx
5.1.2 Spillway Configuration The upstream reservoir dam will have a drop-inlet primary spillway and an auxiliary spillway. The primary spillway will be sized to convey flows resulting from the 100-year storm event, as required by Missouri CSR’s for an environmental class III dam. The spillway crest will be at El. 940.0 and sized to achieve a 2-foot or greater freeboard from the maximum water surface elevation for the 100-year storm event. For planning purposes it is assumed that the primary spillway will be similar to the existing Stanberry Lake Dam’s primary spillway. The length of the primary spillway is 60 feet and the length of the auxiliary spillway is 150 feet.
The primary spillway consists of a gate house with 100-foot-long footbridge extending from the dam to the gate house. The intake structure will run vertically to a free -flow conduit under the dam embankment. A terminal structure is located at the downstream end of the free -flow conduit.
Missouri, 10 CRS 22-2.040(1) states if conditions change in a zone and the environmental class is changed, the dam owner must meet the new standards and criteria. The Spillway Design Flood Precipitation Value (SDFP) for an environmental Class I dam is 0.75 of the Probable Maximum Precipitation (PMP) and the SPFD for an environmental Class II dam is 0.5 PMP. The required design acceleration for earthquake design for new dams greater than 50 feet in height are 0.75, 0.5 and 0.4 probable maximum acceleration for Class I, Class II, and Class III dams respectively. Accordingly, if the environmental class of the dam changes in the future as the result of development in the environmental zone, the more-stringent design criteria will become effective.
5.1.3 Low-Level Outlet The primary spillway would include a low-level outlet conduit located at the base of the structure. The conveyance conduit is estimated to be constructed of reinforced concrete. The low-level outlet is to be used to lower the reservoir below normal pool stage during construction and for lake management purposes, routine repairs, or dam safety purposes. The low-level outlet will include a vertical slide gate located upstream of the inlet of the primary spillway drain pipe.
5.1.4 Reservoir Opinion of Probable Cost The OPC includes costs for the materials and labor involved in completing the following activities.
Site Preparation - Activities performed as part of site preparation include mobilization and demobilization, temporary diversion of water around the construction area, clearing, grubbing, and demolition of structures within the project area.
Mobilization and Demobilization - Mobilization and demobilization includes the costs associated with getting the necessary equipment and materials to the site. Mobilization and demobilization costs were included as part of the planning-level contingency.
Temporary Diversion - Provisions must be made for diverting water around the work site during construction. Provisions must be made for diverting water around the dam during construction. Diversion of water is typically provided by an earthen cofferdam with a conveyance structure around the dam during construction of the spillway and outlet structure. The cofferdam is sized to control both low flows and flood flows from the 5-, 10-, or 25-year frequency floods. For the purposes of this planning-level cost estimate, the cost of temporary diversion was estimated as a lump sum about of $1.0 million. This estimate was based on estimated costs for temporary diversion for similar reservoir projects.

Section 5 • Middle Fork Reservoir and WTP Expansion Feasibility
5-4 6198-YW06_Middle Fork WTP and Reservoir_Final TM_June 2012.docx
Clearing, Grubbing, and Demolition - Site preparation includes clearing, grubbing, and grading for a construction access road and along the dam length. Site preparation also involves the cutting of vegetation within the footprint of the permanent pool. The area of the footprint of the permanent pool consists of those lands integral with the reservoir below the proposed normal water level El. 940.0’. The area of clearing for the dam was calculated for a dam crest width of 20 feet; and embankment slopes of 3H:1V (downstream) and 2.5H:1V (upstream) slope. The calculated dam width was then multiplied by the length of dam to arrive at the area of clearing.
Erosion and Sedimentation Control - Erosion and sedimentation control measures are required to reduce the potential for the discharge of sediment from the site downstream. Erosion and sedimentation controls include silt fence installation, sedimentation basins, and grassing. The length of silt fence installation was estimated based on the length of the dam. Area of grassing was estimated as the area of clearing for the dam plus an area equal to 15 acres to reflect grassing around the perimeter of the open water area.
Excavation and Compacted Fill - The extent of earthwork required for the spillway construction was determined based on soil boring logs included on the Middle Fork Water Company construction plans for the existing dam. Fill material is required for construction of the homogenous earthfill structure. The embankment will consist of compacted silty-clay with a calculated volume of approximately 385,000 cubic yards (CY). Volume is the in-place estimate of volume and was increased in the cost estimate to account for compaction. The in-place volumes were multiplied by 1.4 and 1.2 for imported material and on-site material, respectively. A larger multiplier is used for imported material because of the loss of volume that occurs during transport. Imported material is assumed to have a haul distance of less than 4 miles.
Dam Face Protection - Riprap rock will be required at the upstream face of the dam to protect it from wave erosion. The quantity of rock was calculated using the length of the dam, riprap thickness of 3 feet, and length of upstream slope from the top of dam to 10 feet below the normal pool elevation.
Primary Spillway and Low-Level Outlet - The cost estimate of the construction of the drop-inlet primary spillway was determined for a spillway configuration similar to the existing Stanberry Lake drop inlet spillway, utilizing cast-in-place concrete construction. The spillway estimate includes a stilling basin at the lower end of the spillway to dissipate the energy of the water, and cast-in-place abutment walls. The cost estimate also included construction of the low-level outlet with a vertical slide gate located upstream of the inlet of the primary spillway drain pipe, and a gate house with a 100-foot-long footbridge extending from the dam to the gate house.
Excavation and Fill - The extent of earthwork required for the spillway construction was determined based on soil boring logs included on the MFWC construction plans for the existing dam. The bottom of the spillway is to be founded in a layer of inorganic clay of low to medium plasticity, approximately 6 feet below existing grade.
Miscellaneous Instrumentation - Miscellaneous instrumentation should be installed to monitor the function and safety of the dam after construction and during operations. The following amount and type of measurement and control instrumentation was estimated: 3 benchmarks, 10 piezometers, 3 inclinometers, and 5 settlement plates.

Section 5 • Middle Fork Reservoir and WTP Expansion Feasibility
5-5 6198-YW06_Middle Fork WTP and Reservoir_Final TM_June 2012.docx
Other Costs - Other costs associated with the construction of new reservoirs typically include the cost of land acquisition, transportation infrastructure relocation, home and private structure buyout, electric transmission line, and gas pipeline relocation.
Land Acquisition Costs - Acquisition of some land within the permanent pool and around the perimeter of the lake within the elevation of the top of dam will still be required. The quantity of land to be acquired was determined by using a ground elevation model obtained from the USGS of the area surrounding the reservoir. Areas were calculated at two-foot intervals from El. 912 to 946 using the 3D Analyst extension in ARCGIS 9.3.1. Land values from Gentry County in which the land acquisition areas are located were used to create an estimated land acquisition cost. The estimated land acquisition costs were determined using real estate websites (the referenced websites are listed at the bottom of Table 3 -7) to find properties with acreage for sale in Gentry County. The purchase cost per acre was based upon undeveloped properties listed for sale. The list price was divided by the property acreage to determine an approximate cost per acre for each property. The median cost for all the counties were averaged this value was used as the cost per acreage for all land acquisitions. Table 5.1 shows the sizes of listed properties, list price, price per acre and the median price per acre, for Gentry County. The estimated cost of land acquisition is based on the total acreage of the reservoirs footprint multiplied by the overall average cost of acreage of the combined counties.
Table 5.1 Land Acquisition Property Cost Data
County Property Size Acres List Price Total Cost per Acre
Gentry1,2
120 $240,000 $2,000
106 $243,000 $2,300
160 $287,200 $1,800
340 $833,000 $1,600
105 $262,000 $2,500
197 $492,500 $2,500
Median Cost per Acre $2,150 1 Source:www.landwatch.com 2 Source:www.landwatch.com
Relocations - The footprint of the proposed new reservoir will inundate three residences; two on 495 Road, and one south of 280 Street. A 0.1-mile section of 280 Street will inundated by the reservoir. The reservoir project will require construction of a bridge to span 280 Street over the reservoir. No federal or state highways will require rerouting as a result of the reservoir project.
Table 5.2 summarizes the results of the planning-level opinion of probable cost. Construction costs were estimated using a unit cost for fill material where 25 percent of the material for dam construction is imported and 75 percent is available within the project site. Appendix G includes the detailed breakdown on the construction cost estimate. Cost opinions reflect the following assumptions:
No excavation in rock is required.
2011 dollars (rounded to two significant figures).
No property acquisition estimated for replacement of transportation facilities and utilities.

Section 5 • Middle Fork Reservoir and WTP Expansion Feasibility
5-6 6198-YW06_Middle Fork WTP and Reservoir_Final TM_June 2012.docx
Dam volume based on topographic map provided by MFWC.
Quantities were considered in-place volume and factors were applied to indicate compaction. Cost of compensation for the loss of current and future oil and gas production profits were not estimated. Values of the rights or extraction of resources were not considered when determining land value.
Table 5.2 Planning Level Opinion of Probable Construction Costs
Item Probable Cost
Reservoir Site Preparation $1,230,000
Erosion and Sediment Control $58,000
Excavation $82,000
Dam $5,560,000
Spillway Structure $570,000
Chimney, Toe & Blanket Drains $1,400,000
Miscellaneous Instrumentation $50,000
Mobilization $50,000
Subtotal $9,000,000
Engineering, Legal, and Contingencies1 $4,050,000
Total Opinion of Probable Cost $13,050,000 1 Engineering, Legal, and Contingencies assumed to be 45-percent of subtotal.
5.2 WTP Expansion With the raised dam or second reservoir, the additional supply capacity could be used to serve Commission members in Northwestern Missouri. In addition to the surface water supply, MFWC also provided information on a potential groundwater supply in the area.
5.2.1 Groundwater Sources Previous groundwater investigations in the area have revealed an alluvial groundwater supply along the Middle Fork of the Grand River. The drilling report estimates a safe yield from this supply of 300 gpm. No geochemistry analysis was conducted, but from accounts of other groundwater supplies in the area, it appears the only potential contaminant concerns are iron and manganese. Upon review by MDNR, it was determined that the additional well yield test does not meet current requirements. A new draw down test would be required to verify this capacity. Further, the long-term viability of the aquifer in this location is unknown and in the region is considered questionable. Testing to verify the aquifer viability would also be recommended prior to developing a groundwater well in this location. See Appendix H for a copy of the 1993 Layne Report.
Development of additional capacity using this source could be an inexpensive method for providing additional finished water to the system. If iron and manganese are indeed the only pollutants, pre-oxidation of dissolved constituents can be started at the wellhead using chlorine.

Section 5 • Middle Fork Reservoir and WTP Expansion Feasibility
5-7 6198-YW06_Middle Fork WTP and Reservoir_Final TM_June 2012.docx
The oxidized water can then be fed into a dedicated clarifier, with or without softening, then to the filter influent, with filtration of remaining iron and manganese solids taking place in the existing media filters. This would also provide a barrier against other contamination risks that may develop in the source water.
Although a large amount of uncertainly still exists regarding a groundwater supply, an opinion of probable costs for groundwater well development and transmission piping is shown below. Additional investigation, including possible transmission pipe routing, test pumping and preliminary well design, and a detailed examination of groundwater chemistry would need to be conducted to further develop a more reliable cost opinion provided in Table 5.3.
Table 5.3 Groundwater Supply Opinion of Probable Costs
Description Unit Price Quantity Units Extension
Groundwater Well (<100' Deep) $90,000 2 Ea $180,000
Pitless Adapter, Submersible Pump, Electrical $25,000 2 Ea $50,000
8" dia. Cl. 160 PVC Transmission Pipeline $6.50 5000 Feet $33,000
Access Road, Sitework, Fencing $30,000 2 Sites $60,000
Electrical, including Standby Generator $65,000 LUMP SUM $65,000
Subtotal $388,000
Hydrogeologic Investigation and Test Pumping $75,000
Engineering, Legal, Contingencies1 $210,000
Total Opinion of Probable Construction Cost $673,000 1 Engineering, Legal, and Contingencies assumed to be 45 percent of subtotal.
5.2.2 Potential Expansion Improvements As shown in Section 4.2, potential exists to expand the safe yield of the surface water supply from a present average day capacity of 386,000 gpd to 558,000 gpd. Assuming a peak day to average day ratio of 2.0, the expanded capacity of 775 gpm, a gain of 240 gpm from present day peak day capacity, just exceeds the 24-hour design capacity of the treatment plant. These relatively meager gains in capacity, along with the cost outlined in Table 5.2 for expansion of the surface water supply result in a high cost per gpm of additional capacity.
A comparable gain in firm raw water capacity may be achieved for less cost by utilizing groundwater. Given the poor track record of groundwater supplies in Northwest Missouri, it won’t likely be identified as a primary supply, but rather as a supplemental and emergency supply source to be used during maintenance of surface water treatment portions of the plant and when demand requires its use. If testing proves 300 gpm to be a safe yield from the groundwater supply, the total peak day capacity when used in conjunction with surface water would be 835 gpm. If reservoir yield is evaluated on an annual basis, with groundwater utilized to offset surface water usage during off peak times to maximize reservoir storage, this rate could be even higher.

Section 5 • Middle Fork Reservoir and WTP Expansion Feasibility
5-8 6198-YW06_Middle Fork WTP and Reservoir_Final TM_June 2012.docx
Additional capacity would require expansion of the physical plant. Dedicated groundwater clarification/sedimentation capacity could be constructed using a solids contact basin. Sized for a conservative 0.5 gpm per square feet surface overflow, the solids contact basin would be 30-feet diameter. Solids contact basins combine mixing, flocculation, and clarification steps in one basin by use of a zoned tank. The solids contact basin would be designed to achieve partial iron and manganese removal, and if desired, softening, by clarification. Water from the new solids contact basin would then be combined with surface water secondary clarifier effluent for filtration.
Additional filter capacity could be gained in a number of ways. First, additional media filters, similar in design to the existing filters, could be constructed. If the same filter configuration were to be used, with a per-filter area of 112.5 square feet and observing a 2.0 gpm per square foot filter rate with one filter out of service, five filters would be required. Two filters would be operated along with the existing three filters to provide the added capacity.
Another alternative to constructing additional filters is to use the existing filter tanks with submerged membranes. These use vacuum pumps to pull filtrate through the semi-permeable membrane and typically require less footprint per unit of output as compared to media filters. For the purposes of this study, it is assumed that two racks of membranes could be operated, in a redundant fashion, to produce 835 gpm of treatment capacity. These units would be constructed inside of the existing filter cells, eliminating the requirement to expand the building footprint to gain filter capacity.
OPCs are provided for each alternative as follows in Tables 5.4 and Table 5.5.
Table 5.4 Media Filtration Plant Improvements Description Unit Price Quantity Units Extension
Solids Contact Basin Concrete $175,000 LUMP SUM $175,000
Solids Contact Basin Equipment $340,000 LUMP SUM $340,000
Solids Contact Basin Piping $15,000 LUMP SUM $15,000
Filter Concrete $85,000 LUMP SUM $85,000
Filter Building - Steel Frame $140.00 500 SF $70,000
Filter Equipment and Media $275.00 224 SF $60,000
Filter Piping $25,000 LUMP SUM $25,000
Misc Piping $5,000 LUMP SUM $5,000
Electrical $26,000 LUMP SUM $26,000
Instrumentation and Control $45,000 LUMP SUM $45,000
Subtotal $848,000
Engineering, Legal, Contingencies1 $382,000
Total Opinion of Probable Construction Cost $1,230,000 1 Engineering, Legal, and Contingencies assumed to be 45-percent of subtotal.

Section 5 • Middle Fork Reservoir and WTP Expansion Feasibility
5-9 6198-YW06_Middle Fork WTP and Reservoir_Final TM_June 2012.docx
Table 5.5 Plant Expansion Membrane Option Description Unit Price Quantity Units Extension
Solids Contact Basin Concrete $175,000 LUMP SUM $175,000
Solids Contact Basin Equipment $340,000 LUMP SUM $340,000
Solids Contact Basin Piping $15,000 LUMP SUM $15,000
Submerged Membrane Filters $650,000 2 EA $1,300,000
Filter Permeate Pumps $25,000 2 EA $50,000
Ancillary Filter Equipment $75,000 LUMP SUM $75,000
Filter Piping $25,000 LUMP SUM $25,000
Misc Piping $5,000 LUMP SUM $5,000
Existing Primary Basin Conversion $17,500 LUMP SUM $18,000
Electrical $44,000 LUMP SUM $44,000
Instrumentation and Control $45,000 LUMP SUM $45,000
Subtotal $2,090,000
Engineering, Legal, Contingencies1 $940,000
Total Opinion of Probable Construction Cost $3,030,000 1 Engineering, Legal, and Contingencies assumed to be 45-percent of subtotal.

Section 5 • Middle Fork Reservoir and WTP Expansion Feasibility
5-10 6198-YW06_Middle Fork WTP and Reservoir_Final TM_June 2012.docx
This page left blank intentionally

6-1 6198-YW06_Middle Fork WTP and Reservoir_Final TM_June 2012.docx
Section 6 Conclusions
Generally, the WTP and reservoir are in good condition and well-maintained for the age of the facilities. The OPC to address the WTP improvements for the existing conditions is $1.5 million. The OPC to address the reservoir improvements is up to $110,000. For a total OPC to the WTP and Reservoir of $1.61 million dollars to maintain the current capacity.
If the Commission purchases MFWC and expands the facility to maximize the water supply source, the feasibility level opinion of probable cost is provided in Table 6.1 below:
Table 6.1 Feasibility Opinion of Probable Cost for Expansion Item Cost
Groundwater Well Installation $673,000
Upstream Reservoir $13,050,000
Plant Expansion Option 1 – Media Filtration $1,230,000
Plant Expansion Option 2 – Membrane Filtration $3,030,000
Table 6.2 provides the current and proposed future yield of the reservoir and plant.
Table 6.2 Current and Proposed Future Capacity
Water Supply Yield
(gpd) WTP Finished Water
Yield (gpd)1
Current 386,000 347,000
Expansion 558,000 502,000 1 Finished water yield is assumed to be 90-percent of the water supply yield
Due to the questions regarding long term viability of groundwater in the area and the high cost for reservoir expansion for such a small capacity increase, it is not recommended to invest in further expanding the plant.
Should the Commission consider purchasing and operating the Middle Fork Water Company Reservoir and WTP, an anticipated cost of service would vary between $3.20 and $3.90 per 1,000 gallons based on the following assumptions:
Financing the debt service and recommended repairs through MDNR State Revolving Fund Loan program at 2-percent interest over 20 years.
The operation costs were increased by 5-percent.
Maintenance costs were assumed to be $62,500 per year.

Section 6 • Conclusions
6-2 6198-YW06_Middle Fork WTP and Reservoir_Final TM_June 2012.docx
These costs were based on an assumed average daily water sale of 350,000 gpd.
A range of sale prices were used to determine the range in sale costs. The actual sale cost should be determined through negotiations with MFWC and the costs for selling water re-calculated.

Appendix A Water Quality Data


Appendix B WTP and Reservoir Photos


Rapid Rate Filters Filter Face Piping
Treatment Building – From Southwest Loading Dock – Note Damage
Lab Counter and Online Chlorine and Turbidity Analyzer
Reservoir and Intake Wetwell

Chlorine Dioxide Generator Secondary Sedimentation Basin – From East
Rapid Mix Basins High Service Pump Pipe Manifold
Chlorine Vacuum Regulators

Stanberry Lake Dam Gentry, MO.
Photograph 1: Overview of dam from upstream
Photograph 2: Overview of auxiliary spillway

Stanberry Lake Dam Gentry, MO.
Photograph 3: Overview of dam from downstream
Photograph 4: Downstream slope and bench looking north

Stanberry Lake Dam Gentry, MO.
Photograph 5: Crest looking south
Photograph 6: Crest looking north

Stanberry Lake Dam Gentry, MO.
Photograph 7: Crest contact with right abutment.
Photograph 8: Upstream slope looking north

Stanberry Lake Dam Gentry, MO.
Photograph 9: Vegetation on upstream slope
Photograph 10: Intake structure
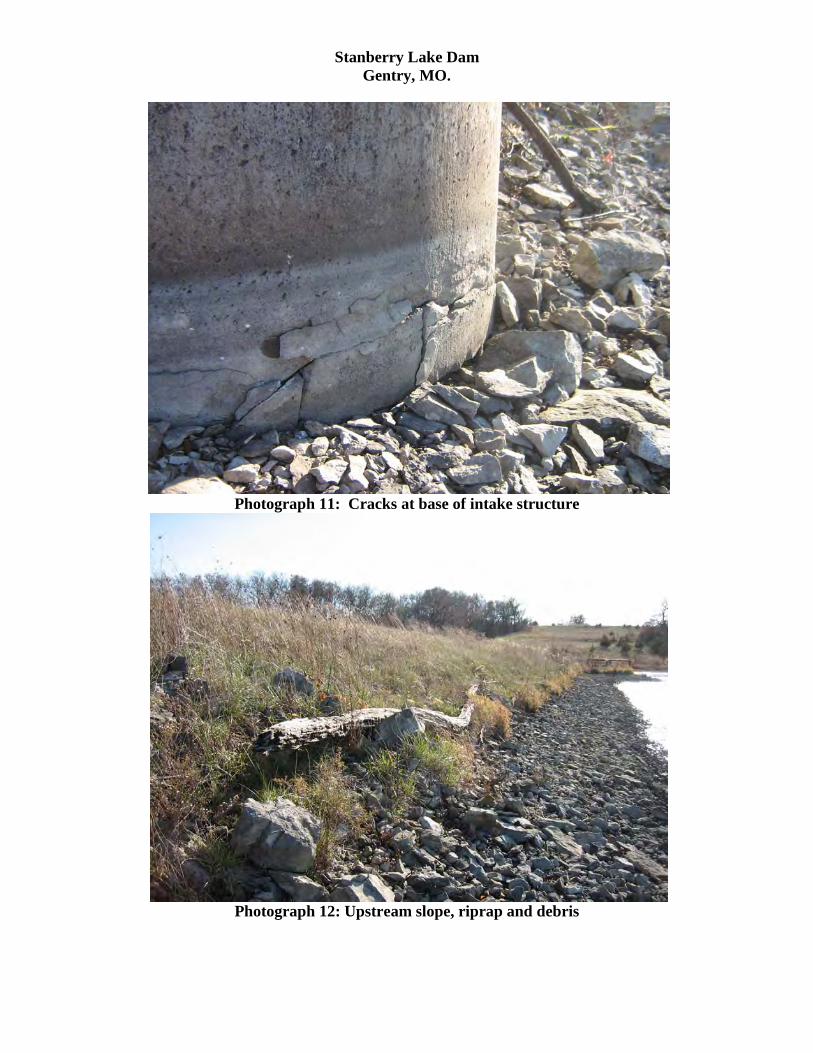
Stanberry Lake Dam Gentry, MO.
Photograph 11: Cracks at base of intake structure
Photograph 12: Upstream slope, riprap and debris

Stanberry Lake Dam Gentry, MO.
Photograph 13: Primary spillway looking south
Photograph 14: Primary spillway looking north

Stanberry Lake Dam Gentry, MO.
Photograph 15: Animal burrows on upstream slope
Photograph 16: Overview of downstream area

Stanberry Lake Dam Gentry, MO.
Photograph 17: Downstream slope looking south
Photograph 18: Bench looking north

Stanberry Lake Dam Gentry, MO.
Photograph 19: Bench looking south
Photograph 20: Vegetation on lower downstream slope

Stanberry Lake Dam Gentry, MO.
Photograph 21: Animal burrow on lower downstream slope
Photograph 22: Overview of plunge basin
Animal burrow

Stanberry Lake Dam Gentry, MO.
Photograph 23: Restored plunge basin embankment and outlet channel
Photograph 24: Primary spillway outlet to plunge basin

Stanberry Lake Dam Gentry, MO.
Photograph 25: Animal burrow in embankment
Photograph 26: Erosion rill in downstream slope above plunge basin

Stanberry Lake Dam Gentry, MO.
Photograph 27: Downstream channel
Photograph 28: Foundation drain discharge
6-inch-diameter foundation drain

Appendix C Memorandum from David Williams, dated January 7, 2011


Appendix D Common Dam Safety Definitions

D‐1 6198‐YW06_Middle Fork WTP and Reservoir Draft TM_Appendix D_February 2012.docx
Appendix D
Common Dam Safety Definitions
The words and terms listed below, as used in this plan, shall have the following meanings, unless the context clearly indicates otherwise.
Orientation Upstream – Shall mean the side of the dam that borders the impoundment.
Downstream – Shall mean the high side of the dam, the side opposite the upstream side.
Right – Shall mean the area to the right when looking in the downstream direction.
Left – Shall mean the area to the left when looking in the downstream direction.
Dam Components Dam – Shall mean any artificial barrier, including appurtenant works, which impounds or diverts water.
Dam Height – Shall mean the difference in the elevation of either the natural bed of the stream or watercourse, or the lowest point on the toe of the dam and the dam crest elevation.
Embankment – Shall mean the fill material, usually earth or rock, placed with sloping sides, such that it forms a permanent barrier that impounds water.
Crest – Shall mean the top of the dam, usually provides a road or path across the dam.
Abutment – Shall mean that part of a valley side against which a dam is constructed. An artificial abutment is sometimes constructed as a concrete gravity section, to take the thrust of an arch dam where there is no suitable natural abutment.
Appurtenant Works – Shall mean structures, either in dams or separate there from. including but not be limited to, spillways; reservoirs and their rims; low level outlet works; and water conduits including tunnels, pipelines, or penstocks, either through the dams or their abutments.
Spillway – Shall mean a structure over or through which water flows are discharged. If the flow is controlled by gates or boards, it is a controlled spillway; if the fixed elevation of the spillway crest controls the level of the impoundment, it is an uncontrolled spillway.
Jurisdictional – Missouri Dam Safety Laws and Regulations define jurisdictional dams as any artificial or man‐made barrier which does or may impound water and is 35 feet or more in height (Section 236.400(5) RS Missouri).

Appendix D Common Dam Safety Definitions
D‐2 6198‐YW06_Middle Fork WTP and Reservoir Draft TM_Appendix D_February 2012.docx
Hazard Classification High Hazard (Class I) – Shall mean dams located where failure will likely cause loss of life and serious damage to home(s), industrial or commercial facilities, important public utilities, main highway(s) or railroad(s).
Significant Hazard (Class II – Shall mean dams located where failure may cause loss of life and damage to home(s), industrial or commercial facilities, secondary highway(s) or railroad(s), or cause the interruption of the use or service of relatively important facilities.
Low Hazard (Class III) – Dams located where failure may cause minimal property damage to others. Loss of life is not expected.
General EAP – Emergency Action Plan ‐ Shall mean a predetermined plan of action to be taken to reduce the potential for property damage and/or loss of life in an area affected by an impending dam break
Freeboard – Shall mean the vertical distance between the reservoir surface elevation and the top of the dam
Owner/Operator – Person/entity, who owns, controls, operates, maintains, and manages the dam
O&M Manual – Operations and Maintenance Manual; A document identifying routine maintenance and operational procedures under normal and storm conditions
Normal Pool – Shall mean the elevation of the impoundment during normal operating conditions
Acrefoot – Shall mean a unit of volumetric measure that would cover one acre to a depth of one foot. It is equal to 43,560 cubic feet. On million U.S. gallons = 3.068 acre feet
Height of Dam – Shall mean the vertical distance from the lowest portion of the natural ground, including any stream channel, along the downstream toe of the dam to the crest of the dam
Spillway Design Flood (SDF) – Shall mean the flood used in the design of a dam and its appurtenant works particularly for sizing the spillway and outlet works, and for determining maximum temporary storage and height of dam requirements
Condition Rating Unsafe – Major structural, operational, and maintenance deficiencies exist under normal operating conditions.
Poor – Significant structural, operation and maintenance deficiencies are clearly recognized for normal loading conditions.
Fair – Significant operational and maintenance deficiencies, no structural deficiencies. Potential deficiencies exist under unusual loading conditions that may realistically occur. This rating can be used when uncertainties exist as to critical parameters.
Satisfactory – Minor operational and maintenance deficiencies.
Good – No existing or potential deficiencies recognized. Safe performance is expected under all loading including SDF.

Appendix E Stanberry Dam Inspection Checklist


0 No#N/A
12. Spillway Capacity (% SDF)E1. Design Methodology: 3 E7. Low-Level Discharge Capacity: 0E2. Level of Maintenance: 3 E8. Low-Level Outlet Physical Condition: 4E3. Emergency Action Plan: 2 E9. Spillway Design Flood Capacity: 1E4. Embankment Seepage: 5 E10. Overall Physical Condition of the Dam: 4E5. Embankment Condition: 4 E11. Estimated Repair Cost: $0E6. Concrete Condition: 3
E1: DESIGN METHODOLOGY E7: LOW-LEVEL OUTLET DISCHARGE CAPACITY 1. Unknown Design – no design records available 1. No low level outlet, no provisions (e.g. pumps, siphons) for emptying pond 2. No design or post-design analyses 2. No operable outlet, plans for emptying pond, but no equipment 3. No analyses, but dam features appear suitable 3. Outlet with insufficient drawdown capacity, pumping equipment available 4. Design or post design analysis show dam meets most criteria 4. Operable gate with sufficient drawdown capacity 5. State of the art design – design records available & dam meets all criteria 5. Operable gate with capacity greater than necessaryE2: LEVEL OF MAINTENANCE E8: LOW-LEVEL OUTLET PHYSICAL CONDITION 1. Dam in disrepair, no evidence of maintenance, no O&M manual 1. Outlet inoperative needs replacement, non-existent or inaccessible 2. Dam in poor level of upkeep, very little maintenance, no O&M manual 2. Outlet inoperative needs repair 3. Dam in fair level of upkeep, some maintenance and standard procedures 3. Outlet operable but needs repair 4. Adequate level of maintenance and standard procedures 4. Outlet operable but needs maintenance 5. Dam well maintained, detailed maintenance plan that is executed 5. Outlet and operator operable and well maintainedE3: EMERGENCY ACTION PLAN E9: SPILLWAY DESIGN FLOOD CAPACITY 1. No plan or idea of what to do in the event of an emergency 1. 0 - 50% of the SDF or unknown 2. Some idea but no written plan 2. 50-90% of the SDF 3. No formal plan but well thought out 3. 90 - 100% of the SDF 4. Available written plan that needs updating 4. >100% of the SDF with actions required by caretaker (e.g. open outlet) 5. Detailed, updated written plan available and filed with MADCR, annual training 5. >100% of the SDF with no actions required by caretakerE4: SEEPAGE (Embankments, Foundations, & Abutments) E10: OVERALL PHYSICAL CONDITION OF DAM 1. Severe piping and/or seepage with no monitoring 1. UNSAFE – Major structural, operational, and maintenance deficiencies 2. Evidence of monitored piping and seepage exist under normal operating conditions 3. No piping but uncontrolled seepage 2. POOR - Significant structural, operation and maintenance deficiencies 4. Minor seepage or high volumes of seepage with filtered collection are clearly recognized under normal loading conditions 5. No seepage or minor seepage with filtered collection 3. FAIR - Significant operational and maintenance deficiencies, no structuralE5: EMBANKMENT CONDITION (See Note 1) deficiencies. Potential deficiencies exist under unusual loading conditions 1. Severe erosion and/or large trees that may realistically occur. Can be used when uncertainties exist as to 2. Significant erosion or significant woody vegetation critical parameters 3. Brush and exposed embankment soils, or moderate erosion 4. SATISFACTORY - Minor operational and maintenance deficiencies. 4. Unmaintained grass, rodent activity and maintainable erosion Infrequent hydrologic events would probably result In deficiencies. 5. Well maintained healthy uniform grass cover 5. GOOD - No existing or potential deficiencies recognized. Safe performanceE6: CONCRETE CONDITION (See Note 2) is expected under all loading including SDF 1. Major cracks, misalignment, discontinuities causing leaks, E11: ESTIMATED REPAIR COST seepage or stability concerns Estimation of the total cost to address all identified structural, operational, 2. Cracks with misalignment inclusive of transverse cracks with no maintenance deficiencies. Cost shall be developed utilizing standard misalignment but with potential for significant structural degradation estimating guides and procedures 3. Significant longitudinal cracking and minor transverse cracking 4. Spalling and minor surface cracking 5. No apparent deficiencies
11. Overall Physical Condition of Dam:
Evaluation Description
Changes/Deviations to Database Information since Last Inspection
10. Insp. Frequency:0-50% of the SDF or Unknown
Dam Evaluation Summary Detail Sheet
NA1. NID ID:
9. Hazard Code:
3. Dam Location:
9a. Is Hazard Code Change Requested?:
6. Next Inspection:
NAStanberry Lake Dam
4. Inspection Date: November 10, 2011
SATISFACTORY
7. Inspector:8. Consultant:
William J. FriersCDM
5. Last Insp. Date:2. Dam Name:November 10, 2016#REF!

Commonwealth of Massachusetts DCR Dam Safety Inspection Checklist
Instructions
This spreadsheet contains macros to facilitate correct data entry. You must enable macros in Excel for the spreadsheet to function properly. If you did not enable macros when opening this spreadsheet, do so now by selecting Tools - Macro - Security, Medium, then close and restart Excel. Click on Enable Macros when opening the checklist.
All of the worksheets (tabs) are protected to restrict data entry to the proper cells. If you need to make modifications, select Tools - Protection - Unprotect Sheet; a password is not required.
Enter data on Sheets 1, 2 and 3 first in that order. In general, data are entered only once, on the first sheet on which they appear. Repeated data entries on subsequent sheets are generated automatically. In cases where two data items are linked (e.g., Condition Code and Condition Description), only one data item can be entered, the other is generated automatically. The entire Summary Detail sheet (to be inserted at the front of the Phase I report) is generated automatically. Most of the Dam Data Summary Sheet (Summary Data Table in Section 1 of the report) is generated automatically. The remaining sheets can be completed in any order.
Be careful to only check one box when using the checkboxes.
Contact Tom Famulari at the Office of Dam Safety if you have any questions about using this checklist. Tom can be reached at 617-626-1367, [email protected]

Dam Name and Town Date of Inspection: Date
Required Phase I Report Data Data Provided by the Inspecting EngineerNational ID # NADam Name Stanberry Lake DamDam Name (Alternate) Lake Elizabeth DamRiver Name Linn CreekImpoundment Name Stanberry Lake, Lake Elizabeth, Linn Creek LakeHazard Class 0Size Class 0Dam Type Earth EmbankmentDam Purpose Water SupplyStructural Height of Dam (feet) 34.5Hydraulic Height of Dam (feet) 32Drainage Area (sq. mi.) 6.3Reservoir Surface Area (sq. mi.) 0.22Normal Impoundment Volume (acre-feet) 1040Max Impoundment Volume ((top of dam) acre-feet) 1625SDF Impoundment Volume* (acre-feet) 1040Spillway Type Drop InletSpillway Length (feet) 45Freeboard at Normal Pool (feet) 5Principal Spillway Capacity* (cfs) 400Auxiliary Spillway Capacity* (cfs) 3600Low-Level Outlet Capacity* (cfs) 0Spillway Design Flood* (flow rate - cfs) UnknownWinter Drawdown (feet below normal pool) 0Drawdown Impoundment Vol. (acre-feet) 0Latitude 40.2886Longitude 94.4325City/Town Gentry, MOCounty Name GentryPublic Road on Crest NoPublic Bridge over Spillway NoEAP Date (if applicable) None availableOwner Name Middle Fork Water CompanyOwner Address 2961 U.S. Highway 169Owner Town Gentry, MO 64453Owner Phone (660) 448-2111Owner Emergency Phone (660) 582-2580Owner Type PrivateCaretaker Name Brock Pfost, P.E.Caretaker Address 2961 U.S. Highway 169Caretaker Town Gentry, MO 64453Caretaker Phone (660) 448-2111Caretaker Emergency Phone (660) 582-2580Date of Field Inspection 11/10/2011Consultant Firm Name CDMInspecting Engineer William Friers, Stephen WhitesideEngineer Phone Number 518 782-4513
*In the event a hydraulic and hydrologic analysis has not been completed for the dam, indicate "No H&H" in this table, recommendation section shall include specific recommendation to hire a qualified dam engineering consultant to conduct analysis to determine spillway adequacy in conformance with 302 CMR 10.00.
1.1 Summary Data Table

Dam Name Stanberry Lake DamNID ID # NA
Copy and paste to this spreadsheet the dam deficiencies enumerated in Section 3of the Phase I Dam Safety Inspection Report. Put each deficiency in a separatecell. This sheet does not need to be printed out. It is for the internal use of DCR.This Excel spreadsheet must be submitted on a CD with the PDF of the report.
Deficiency No. Description
1 Areas of erosion on upstream slope observed; 3 feet high x 4 feet deep accompanied by steep embankment slopes (2H:1V)
2 Upstream slope erosion around the perimeter of the primary spillway.
3 Animal burrows observed on the upstream and downstream embankment slopes
4 Tire rutting; approximately 8 inches deep on left half of the crest and on downstream embankment bench , with some puddles
5 There is no low-level outlet for the dam.
6 Tall grass, brush and saplings were observed to be growing in the riprap on the upstream slope.
7Concrete cracks and deterioration on the exterior of the water intake structure observed near the base of the structure. Cracks extend approximately 3 inches in depth.
8 Numerous trees up to 4-inch-diameter are present on the lower section of the downstream embankment slope
9 Erosion of material from within the plunge basin appears to have increased the structural height of the dam.
DAM DEFICIENCIES
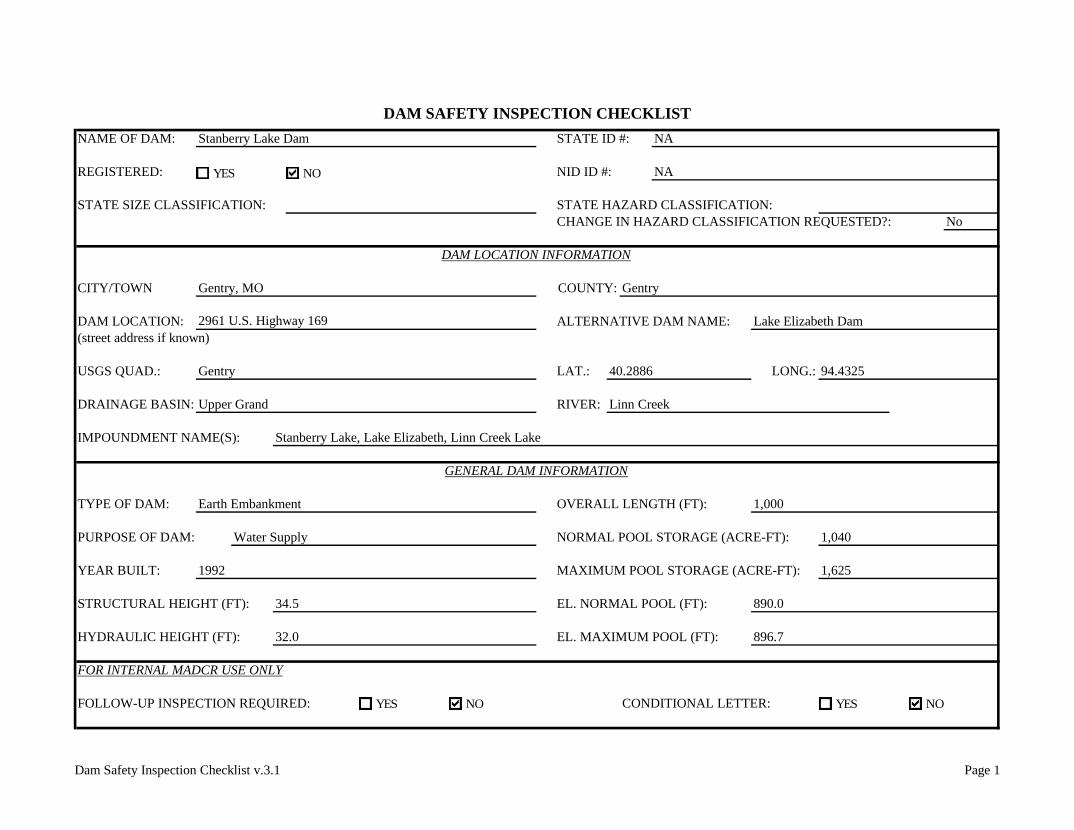
Dam Safety Inspection Checklist v.3.1 Page 1
NAME OF DAM: STATE ID #:
REGISTERED:
CHANGE IN HAZARD CLASSIFICATION REQUESTED?: No
DAM LOCATION: ALTERNATIVE DAM NAME:(street address if known)
USGS QUAD.: LAT.: LONG.:
DRAINAGE BASIN: RIVER:
TYPE OF DAM: OVERALL LENGTH (FT):
YEAR BUILT:
STRUCTURAL HEIGHT (FT): EL. NORMAL POOL (FT):
HYDRAULIC HEIGHT (FT): EL. MAXIMUM POOL (FT):
FOR INTERNAL MADCR USE ONLY
FOLLOW-UP INSPECTION REQUIRED: CONDITIONAL LETTER:
Upper Grand Linn Creek
Gentry 40.2886 94.4325
896.7
PURPOSE OF DAM: Water Supply
34.5
1992 MAXIMUM POOL STORAGE (ACRE-FT): 1,625
890.0
32.0
NORMAL POOL STORAGE (ACRE-FT): 1,040
IMPOUNDMENT NAME(S): Stanberry Lake, Lake Elizabeth, Linn Creek Lake
GENERAL DAM INFORMATION
Earth Embankment 1,000
DAM SAFETY INSPECTION CHECKLISTStanberry Lake Dam NA
NANID ID #:
STATE SIZE CLASSIFICATION:
Lake Elizabeth Dam
CITY/TOWN Gentry, MO
DAM LOCATION INFORMATION
STATE HAZARD CLASSIFICATION:
Gentry
2961 U.S. Highway 169
COUNTY:
YES NO
YES NO YES NO

Dam Safety Inspection Checklist v.3.1 Page 2
NAME OF DAM: STATE ID #:
INSPECTION DATE: NID ID #:
DATE OF INSPECTION: DATE OF PREVIOUS INSPECTION:
ARMY CORPS PHASE I: If YES, date
CONSULTANT: PREVIOUS DCR PHASE I: If YES, date
OVERALL PHYSICALCONDITION OF DAM: DATE OF LAST REHABILITATION:
SPILLWAY CAPACITY:
EL. POOL DURING INSP.: EL. TAILWATER DURING INSP.:
Click on box to select E-code Click on box to select E-codeE1) 4E2) 1E3) 4E4)E5) NOE6) NOE7) LOW-LEVEL OUTLET CAPACITY
NAME OF INSPECTING ENGINEER: SIGNATURE:
TEMPERATURE/WEATHER: 45° F; Windy; Clear
CDM
Stanberry Lake Dam NA
INSPECTION SUMMARY
NA
November 10, 2011 NA
BENCHMARK/DATUM: MSL
SATISFACTORY Unknown
NA
PERSONS PRESENT AT INSPECTION
0-50% of the SDF or Unknown
887.25
NAME TITLE/POSITION REPRESENTINGStephen Whiteside VP Geotechnical Services CDMWilliam Friers Sr. Civil Engineer CDMDanny Plant Operator Middle Fork Water Co.
EVALUATION INFORMATION
TYPE OF DESIGN 3 E8) LOW-LEVEL OUTLET CONDITION LEVEL OF MAINTENANCE 3 E9) SPILLWAY DESIGN FLOOD CAPACITY EMERGENCY ACTION PLAN 2 E10) OVERALL PHYSICAL CONDITION
ROADWAY OVER CREST CONCRETE CONDITION 3
EMBANKMENT SEEPAGE 5 E11) ESTIMATED REPAIR COST
William J. Friers
November 10, 2011
BRIDGE NEAR DAM EMBANKMENT CONDITION 4
YES NO
YES NO

Dam Safety Inspection Checklist v.3.1 Page 3
NAME OF DAM: STATE ID #:
INSPECTION DATE: NID ID #:
OWNER: CARETAKER:
EMERGENCY PH. # EMERGENCY PH. #FAXEMAILOWNER TYPE
SPILLWAY LENGTH (FT) SPILLWAY CAPACITY (CFS)
AUXILIARY SPILLWAY TYPE AUX. SPILLWAY CAPACITY (CFS)
NUMBER OF OUTLETS OUTLET(S) CAPACITY (CFS)
TYPE OF OUTLETS TOTAL DISCHARGE CAPACITY (CFS)
DRAINAGE AREA (SQ MI) SPILLWAY DESIGN FLOOD (PERIOD/CFS)
HAS DAM BEEN BREACHED OR OVERTOPPED IF YES, PROVIDE DATE(S)
FISH LADDER (LIST TYPE IF PRESENT)
DOES CREST SUPPORT PUBLIC ROAD? IF YES, ROAD NAME:
PUBLIC BRIDGE WITHIN 50' OF DAM? IF YES, ROAD/BRIDGE NAME:MHD BRIDGE NO. (IF APPLICABLE)
Stanberry Lake Dam NA
ORGANIZATION ORGANIZATION Middle Fork Water Company
NA
Middle Fork Water Company
November 10, 2011
NAME/TITLE Brock Pfost, P.E. NAME/TITLE Brock Pfost, P.E.STREET 2961 U.S. Highway 169 STREET 2961 U.S. Highway 169TOWN, STATE, ZIP Gentry, MO 64453 TOWN, STATE, ZIP Gentry, MO 64453PHONE (660) 448-2111 PHONE (660) 448-2111
(660) 582-4115 FAX (660) [email protected] EMAIL [email protected]
None
(660) 582-2580 (660) 582-2580
NA
6.3
0
4,000
Unknown
PRIMARY SPILLWAY TYPE Drop Inlet
Private
400
3,600
45
Side Channel
YES NO
YES NO
YES NO

Dam Safety Inspection Checklist v.3.1 Page 4
NAME OF DAM: STATE ID #:
INSPECTION DATE: NID ID #:
AREAINSPECTED
CREST
ADDITIONAL COMMENTS:
NO
AC
TIO
N
MO
NIT
OR
REP
AIR
Tire rutting; approximately 8 inches deep on left half of the crest, with some puddlesEstablished turf; grass cut to approximately 4 inchesGood
Crest width = 20 feet; Crest slopes slightly towards upstream sideVehicle access to the crest is restricted to authorized personnel with a cable barrier on left side of embankment and a swing gate located near the center of the dam
NoNoGoodGood
Stanberry Lake Dam
November 10, 2011
NA
NA
CONDITION OBSERVATIONS
Grass covered
EMBANKMENT (CREST)
7. VEGETATION (PRESENCE/CONDITION)8. ABUTMENT CONTACT
1. SURFACE TYPE2. SURFACE CRACKING3. SINKHOLES, ANIMAL BURROWS4. VERTICAL ALIGNMENT (DEPRESSIONS)5. HORIZONTAL ALIGNMENT6. RUTS AND/OR PUDDLES

Dam Safety Inspection Checklist v.3.1 Page 5
NAME OF DAM: STATE ID #:
INSPECTION DATE: NID ID #:
AREAINSPECTED
x
D/SSLOPE x
xx
ADDITIONAL COMMENTS:
NO
AC
TIO
N
MO
NIT
OR
REP
AIR
None observedNone observedUpper embankment slope and bench covered with brush & grass (to 30-inches-high)
EMBANKMENT (D/S SLOPE)
Stanberry Lake Dam
November 10, 2011
NA
NA
to 4-inch-diameter
CONDITION OBSERVATIONS
Area immediately below toe has some standing water; likely surface run-offNone observedNone observedGoodTwo burrows observed in lower embankment slope.
1. WET AREAS (NO FLOW)2. SEEPAGE3. SLIDE, SLOUGH, SCARP4. EMB.-ABUTMENT CONTACT5. SINKHOLE/ANIMAL BURROWS6. EROSION
Lower embankment slope covered with brush and brambles with numerous trees up
7. UNUSUAL MOVEMENT8. VEGETATION (PRESENCE/CONDITION)

Dam Safety Inspection Checklist v.3.1 Page 6
NAME OF DAM: STATE ID #:
INSPECTION DATE: NID ID #:
AREAINSPECTED
xx
U/SSLOPE x x
x
ADDITIONAL COMMENTS:
None
6" to 12" riprap armoring; sparse in areasSeveral small animal burrows observed on the upper third of the embankment slopeGoodAreas of erosion (3 feet high x 4 feet deep) between El. 890 and 893
None
Grass and brush to 30 inches high; a cluster of 2-inch-diameter saplings
Sapling cluster located to the left of the USGS gage. Design slope is 2.5H:1V; Slope of 2H:1V observed in some areas to the left of the intake structure
EMBANKMENT (U/S SLOPE)
Stanberry Lake Dam
November 10, 2011
NA
NA
CONDITION OBSERVATIONS NO
AC
TIO
N
MO
NIT
OR
REP
AIR
1. SLIDE, SLOUGH, SCARP2. SLOPE PROTECTION TYPE AND COND.3. SINKHOLE/ANIMAL BURROWS4. EMB.-ABUTMENT CONTACT5. EROSION6. UNUSUAL MOVEMENT7. VEGETATION (PRESENCE/CONDITION)

Dam Safety Inspection Checklist v.3.1 Page 7
NAME OF DAM: STATE ID #:
INSPECTION DATE: NID ID #:
AREAINSPECTED
INSTR.
ADDITIONAL COMMENTS:
2. OBSERVATION WELLS
USGS records the Lake's water surface elevation on 15-minute intervals.
5. INCLINOMETERS
CONDITION OBSERVATIONS
USGS Gage Station 06896189 is located near the center of the dam.
NO
AC
TIO
N
Stanberry Lake Dam
November 10, 2011
NA
NA
3. STAFF GAGE AND RECORDER4. WEIRS
INSTRUMENTATION
MO
NIT
OR
REP
AIR
1. PIEZOMETERS
6. SURVEY MONUMENTS7. DRAINS8. FREQUENCY OF READINGS9. LOCATION OF READINGS

Dam Safety Inspection Checklist v.3.1 Page 8
NAME OF DAM: STATE ID #:
INSPECTION DATE: NID ID #:
AREAINSPECTED
D/S WALLS min: max: avg:
ADDITIONAL COMMENTS:
9. UNUSUAL MOVEMENT
DOWNSTREAM MASONRY WALLS
10. WET AREAS AT TOE OF WALL
MO
NIT
OR
REP
AIR
3. WALL CONDITION
5. SEEPAGE OR LEAKAGE
8. ANIMAL BURROWS
Stanberry Lake Dam
November 10, 2011
NA
NA
4. HEIGHT: TOP OF WALL TO MUDLINE
6. ABUTMENT CONTACT
1. WALL TYPE2. WALL ALIGNMENT
CONDITION OBSERVATIONS NO
AC
TIO
N
No masonry walls
7. EROSION/SINKHOLES BEHIND WALL

Dam Safety Inspection Checklist v.3.1 Page 9
NAME OF DAM: STATE ID #:
INSPECTION DATE: NID ID #:
AREAINSPECTED
U/S WALLS min: max: avg:
ADDITIONAL COMMENTS:
3. WALL CONDITION
No masonry walls
CONDITION OBSERVATIONS NO
AC
TIO
N
MO
NIT
OR
Stanberry Lake Dam
November 10, 2011
NA
NA
4. HEIGHT: TOP OF WALL TO MUDLINE5. ABUTMENT CONTACT
UPSTREAM MASONRY WALLS
REP
AIR
1. WALL TYPE2. WALL ALIGNMENT
6. EROSION/SINKHOLES BEHIND WALL7. ANIMAL BURROWS8. UNUSUAL MOVEMENT

Dam Safety Inspection Checklist v.3.1 Page 10
NAME OF DAM: STATE ID #:
INSPECTION DATE: NID ID #:
AREAINSPECTED
D/SAREA x
ADDITIONAL COMMENTS:
None available
MO
NIT
OR
REP
AIR
Brush and trees
No
NoFoundation drainage system shown on plans, with discharge to plunge basin.
U.S. Highway 169 is approximately 0.3 miles southeast of the dam.
NO
AC
TIO
N
No
NA
Access over bench on downstream slope and ATV trails from 300 Street
Stanberry Lake Dam
November 10, 2011
NA
CONDITION OBSERVATIONS
No
No
9. DOWNSTREAM HAZARD DESCRIPTION
1. ABUTMENT LEAKAGE2. FOUNDATION SEEPAGE3. SLIDE, SLOUGH, SCARP4. WEIRS5. DRAINAGE SYSTEM6. INSTRUMENTATION7. VEGETATION8. ACCESSIBILITY
DOWNSTREAM AREA
10. DATE OF LAST EAP UPDATE
Caretaker reported periodic water discharge from drainage system; not observed during inspection

Dam Safety Inspection Checklist v.3.1 Page 11
NAME OF DAM: STATE ID #:
INSPECTION DATE: NID ID #:
AREAINSPECTED
MISC.
WHAT: DATE: DATE: DATE:
DATE:DATE:
PURPOSE:
ADDITIONAL COMMENTS:
Access road from U.S. 169 is unpaved and rough with large potholesCable across left end of crest limits vehicle access to authorized personnel; Swing gate on crest
Daily construction reports were provided by the Owner with soil data including embankment material classification, in-place
5. SECURITY DEVICES6. VANDALISM OR TRESPASS
10. AVAILABILITY OF O&M MANUAL
near center of the dam. Water is pumped from the reservoir to the pre-sed basin approximately 1,000 feet to the north Raw water intake located in the reservoir consists of a pre-cast concrete pipe section with three manually operated valves, located
None available
2. RESERVOIR SHORELINE3. RESERVOIR SLOPES
9. AVAILABILITY OF EAP/LAST UPDATE
density, moisture content and percent compaction.
12. CONFINED SPACE ENTRY REQUIRED
7. AVAILABILITY OF PLANS
November 10, 201111. CARETAKER/OWNER AVAILABLE
4. ACCESS ROADS
11/19/1991
Stanberry Lake Dam
November 10, 2011
NA
NA
8. AVAILABILITY OF DESIGN CALCS
Approximately 2H:1V
MISCELLANEOUS
CONDITION OBSERVATIONS
Bathymetric survey July 2000; Average depth approximately 10 feetVegetated; brush and trees
1. RESERVOIR DEPTH (AVG)
YES NOYES NOYES NOYES NOYES NOYES NOYES NO

Dam Safety Inspection Checklist v.3.1 Page 12
NAME OF DAM: STATE ID #:
INSPECTION DATE: NID ID #:
AREAINSPECTED
SPILLWAY
ADDITIONAL COMMENTS:
Drop InletSPILLWAY TYPE
NO
AC
TIO
N
MO
NIT
OR
REP
AIR
No
12-inch-wide crestSome scour observed around inlet structure NoNone
Stanberry Lake Dam NA
November 10, 2011 NA
CONDITION OBSERVATIONS
PRIMARY SPILLWAY
UNUSUAL MOVEMENTAPPROACH AREADISCHARGE AREADEBRIS
Minor woody debris around base of inlet structurePipe discharges to plunge basin, approximately 70 feet long
WATER LEVEL AT TIME OF INSPECTION
debris around the downstream face of the basin, with the intention of reducing the height of the dam.
WEIR TYPESPILLWAY CONDITIONTRAINING WALLSSPILLWAY CONTROLS AND CONDITION
Missouri DNR performed a visual inspection of the dam earlier this year and advised the Owner that erosion of the plunge basin had increased to effective structural height of the dam to over 40 feet. Owner subsequently placed concrete wall/slab demolition
No887.25

Dam Safety Inspection Checklist v.3.1 Page 13
NAME OF DAM: STATE ID #:
INSPECTION DATE: NID ID #:
AREAINSPECTED
SPILLWAY
ADDITIONAL COMMENTS:
OBSERVATIONSCONDITION
NoneClearGenerally clear; a 36-inch-diameter tree located approximatey 200 feet downstream
Side channel
None
250-foot-wide open field to discharge areaGoodBerm on the right side terminates upstream of the toe of the dam
Stanberry Lake Dam NA
November 10, 2011 NA
SPILLWAY TYPEWEIR TYPE
AUXILIARY SPILLWAY
NO
AC
TIO
N
MO
NIT
OR
REP
AIR
SPILLWAY CONDITIONTRAINING WALLSSPILLWAY CONTROLS AND CONDITIONUNUSUAL MOVEMENTAPPROACH AREADISCHARGE AREADEBRISWATER LEVEL AT TIME OF INSPECTION
None887.25

Dam Safety Inspection Checklist v.3.1 Page 14
NAME OF DAM: STATE ID #:
INSPECTION DATE: NID ID #:
AREAINSPECTED
OUTLETWORKS
ADDITIONAL COMMENTS: No low-level outlet.
NO
AC
TIO
N
MO
NIT
OR
REP
AIR
SEEPAGE/LEAKAGE
Stanberry Lake Dam
November 10, 2011
NA
NA
TYPEINTAKE STRUCTURE
CONDITION OBSERVATIONS
TRASHRACKPRIMARY CLOSURE
DOWNSTREAM AREA
SECONDARY CLOSURECONDUITOUTLET STRUCTURE/HEADWALLEROSION ALONG TOE OF DAM
OUTLET WORKS
MISCELLANEOUS
DEBRIS/BLOCKAGEUNUSUAL MOVEMENT

Dam Safety Inspection Checklist v.3.1 Page 15
NAME OF DAM: STATE ID #:
INSPECTION DATE: NID ID #:
AREAINSPECTED
GENERAL
ADDITIONAL COMMENTS:
SEEPAGE GALLERYUNUSUAL MOVEMENT
NA
CONCRETE/MASONRY DAMS
TYPEAVAILABILITY OF PLANSAVAILABILITY OF DESIGN CALCSPIEZOMETERS
Stanberry Lake Dam
November 10, 2011
NA
NA
CONDITION OBSERVATIONS
REP
AIR
OBSERVATION WELLSINCLINOMETERS
NO
AC
TIO
N
MO
NIT
OR

Dam Safety Inspection Checklist v.3.1 Page 16
NAME OF DAM: STATE ID #:
INSPECTION DATE: NID ID #:
AREAINSPECTED
CREST
ADDITIONAL COMMENTS: NA
NO
AC
TIO
N
MO
NIT
OR
REP
AIR
Stanberry Lake Dam
November 10, 2011
NA
NA
TYPESURFACE CONDITIONS
CONDITION OBSERVATIONS
CONDITIONS OF JOINTSUNUSUAL MOVEMENTHORIZONTAL ALIGNMENTVERTICAL ALIGNMENT
CONCRETE/MASONRY DAMS (CREST)

Dam Safety Inspection Checklist v.3.1 Page 17
NAME OF DAM: STATE ID #:
INSPECTION DATE: NID ID #:
AREAINSPECTED
D/SFACE
ADDITIONAL COMMENTS: NA
CONCRETE/MASONRY DAMS (DOWNSTREAM FACE)
TYPESURFACE CONDITIONSCONDITIONS OF JOINTSUNUSUAL MOVEMENT
Stanberry Lake Dam
November 10, 2011
NA
NA
CONDITION OBSERVATIONS
REP
AIR
ABUTMENT CONTACTLEAKAGE
NO
AC
TIO
N
MO
NIT
OR

Dam Safety Inspection Checklist v.3.1 Page 18
NAME OF DAM: STATE ID #:
INSPECTION DATE: NID ID #:
AREAINSPECTED
U/SFACE
ADDITIONAL COMMENTS: NA
NO
AC
TIO
N
MO
NIT
OR
REP
AIR
Stanberry Lake Dam
November 10, 2011
NA
NA
TYPESURFACE CONDITIONS
CONDITION OBSERVATIONS
CONDITIONS OF JOINTSUNUSUAL MOVEMENTABUTMENT CONTACTS
CONCRETE/MASONRY DAMS (UPSTREAM FACE)

Appendix F USGS 2001 Report


Middle Fork Grand River Stanberry, Missouri Water Supply Study
Middle Fork Lake is privately owned by “Middle Fork Water Company” to supply water to Stanberry andother communities, as well as rural water district. The lake is located on a tributary to Middle Fork GrandRiver about 10 miles north east of Stanberry.
The average daily use is about 350,000 gallons per day.
The drainage area of the lake is 4037 acres (6.3 square miles).
Middle Fork Lake analysis consisted of using the NRCS's computer program called "RESOP". Followingis the data and procedures for input to the program.
STO-AREA Elevation-Storage and Elevation-Area data were determined from July 26, 2000 survey made by USGS.
Middle Fork Grand River Lake Elevation Area Storage (feet) (acres) (ac-ft) 868.0 0.12 0.08 870.0 1.70 0.99 Intake elevation 872.0 5.70 7.32 874.0 14.23 27.49 876.0 24.36 65.35 878.0 35.20 125.05 880.0 48.37 208.90 882.0 58.86 316.71 884.0 69.36 443.30 884.1 71.44 450.30 Water Surface on 7/26/2000 886.0 86.65 599.87 888.0 108.97 794.15 890.0 138.51 1040.67 892.0 175.09 1352.91 893.4 206.11 1625.01
Spillway Elevation = 893.4 Feet mean sea level Intake Elevation = 870. Feet mean sea level
LIMITS Maximum Pool storage 1625 Ac.Ft. Minimum Pool storage 20 Ac.Ft.
Starting storage was considered at measured pool (7/26/2000).
The drainage area of the lake is 4037 acres (6.3 square miles).
GENERAL The adjustment to convert from pan evaporation to lake evaporation was made for thecontrol word EVAP. The factors were monthly values. As a result a factor of 100 wasused.
The record period of drought is in the 1950's. Analysis began in January 1951 and ended December 1959.
SEEPAGE The reservoir seepage varied from 0 seepage near empty to a maximum of 2.5 inch permonth when at full pool. The material in the dam is compacted earth of clayey soils.

RAINFALL Rainfall data came from the White Cloud Creek near Maryville, MO. rain gage for theperiod 1952 through 1960.
RUNOFF This is the runoff into the lake from its drainage area. Monthly runoff volumes inwatershed inches were determined at the White Cloud Creek stream gage. The drainagearea is 6.0 square miles. White Cloud Creek gage is located west of Maryville.
EVAP. -- Pan evaporation at the Lakeside gaging station were used as a base because it has datafor year around evaporation. This data was updated with gage data from stations atSpickard. The average data from 1952 and 1961 were used when there are no dataavailable from both stations. The monthly adjustment factors to convert from pan to lakeevaporation was applied at this step.
DEMAND Determined from city records. The average daily use is about 350,000 gallons per dayand maximum is 450,000 GPD. (from Bill Hills)

MIDDLE FORK GRAND RIVERWater Supply Study
Regional Water Supply LakeStorage Volume
865
870
875
880
885
890
895
0 200 400 600 800 1000 1200 1400 1600 1800
Storage in Acre Feet
Elev
atio
n in
Fee
t
Storage Volume (Acre Feet)
Spillway Elevation = 893.4 FeetIntake Elevation = 870.0 Feet
Water Surface on 7/2/2000 = 884.1 Feet
Figure 21.1.a

Middle Fork Grand River Regional Water Supply Lake
Missouri RESOP Water Supply AnalysisSurface Area
865
870
875
880
885
890
895
0 50 100 150 200 250
Surface Area in Acres
Elev
atio
n in
Fee
t
Spillway Elevation = 893.4 FeetIntake Elevation = 870.0 Feet
Water Surface on 7/2/2000 = 884.1 Feet
Area
Figure 21.1.b

Middle Fork Grand RiverWater Supply Study
Regional Water Supply LakeLake Storage
0
100
200
300
400
500
600
700
800
900
1000
1952 1953 1954 1955 1956 1957 1958 1959 1960
Year
Stor
age
in A
cre
Feet
Minimum Available Storage = 20 Acre Feet
Optimized Yield = 381,100 GPD
Current Demand = 350,000 GPD
Maximum Storage = 915 Acre Feet
Figure 21.2

Middle Fork Grand RiverMiddle Fork Water Company
Missouri RESOP Water Supply AnalysisWater Use
0.20
0.22
0.24
0.26
0.28
0.30
0.32
0.34
0.36
0.38
0.40
1996 1997 1998 1999 2000 2001Year
Dem
and
in M
GD
This Lake also serves Stanberry
2001 Demand = 140,000,000 gallons (0.384 million gallons per day)
Used 0.350 million gallons per day for RESOP analysis
Figure 21.3

Table 6. Lake elevations and respectivesurface areas and volumes. Top of spill-way structure is 893.4 feet. Datum is sealevel.
Elevation Area Volume(feet) (acres) (acre-ft)
868.0 0.2 0.1870.0 1.7 1.2872.0 5.7 7.6874.0 14.4 27.9876.0 24.6 66.2878.0 35.7 126.6880.0 49.1 211.6882.0 59.9 321.4884.0 68.5 449.6884.1 72.3 456.5886.0 87.0 607.2888.0 108.8 801.6890.0 138.4 1,047.9892.0 175.1 1,360.0893.4 206.1 1,632.1
0 75 150 225 300
METERS
FEET
0 25 50 75 100
STANBERRY LAKE
Figure 6. Bathymetric map and area/volume table of Middle Fork Water Company Lake Intake near Stanberry, Missouri.
890
870
884884 880880
890
890
890
884
880
880
LOCATION MAP
GentryCounty
MISSOURI
BATHYMETRIC CONTOUR—Shows altitude of the reservoir bottom.Contour interval 2 feet. Datum is sea level
WATER SURFACE—Shows approximate elevation of water surface,July 26, 2000 (actual is 884.1 feet, table 4). Datum is sea level.
U. S. GEOLOGICAL SURVEY REFERENCE MARKER—Chiseled arrowlocated on north side of concrete spillway. Elevation 893.4 feet. Datum issea level.
884
890
EXPLANATION


Appendix G Opinion of Probable Cost


UnitTakeoff
QuantityUnit Cost Total Amount
20
01000
20.01000.3105 Stormwater Management ls 1 $1,000,000 $1,000,000
01000 Temporary Diversion
02230
20.02230.3105 Clear & Grub Along Dam Embankment Acre 7 $6,275 $43,925
20.02230.3110 Clear & Grub Under Permanent Pool Acre 210 $895 $187,950
20.02230.3115 Property Acquisition Acre 0 $0
02230 Clearing and Grubbing
02235
20.02235.3105 Demo Local/Rural Roads mi 0.0 $420,000 $0
20.02235.3110 Demo Federal Roads mi 0 N/A $0
20.02235.3115 Demo Railroads mi 0 N/A $0
20.02235.3120 Demo Electric Transmission mi 0.0 $65,000 $0
02235 Demo Roads, Railroads etc
20 $1,231,875
25
02850
25.02850.3105 Silt Fence lf 3,100 $2.55 $7,905
02850 Erosion and Sediment Control
02950
25.02950.3110 Grassing sf 1,002,000 $0.05 $50,100
02950 Site Restoration & Rehabilitation
25 EROSION AND SEDIMENT CONTROL TOTAL $58,005
30
02300
30.02300.3105 Excavation ‐ Stripping cy 15,200 $3.20 $48,640
30.02300.3110 Excavation ‐ Dam cy 5,200 $3.45 $17,940
30.02300.3120 Excavation ‐ Spillway cy 100 $3.45 $345
30.02300.3125 Excavation ‐ Auxillary Spillway cy 5,600 $2.60 $14,560
30.02300.31325 Excavation ‐ Presedimentaion Basin Removal cy 0 $3.45 $0
02300 Earthwork
30 $81,485
35
02300
35.02300.3105 Compacted Fill ‐ Random (75% On Site Material) cy 288,750 $4.60 $1,328,250
35.02300.3106 Compacted Fill ‐ Random (25% Import Material) cy 96,250 $29.60 $2,849,000
35.02300.3115 Dam Face Protection (Riprap) cy 19,500 $70.80 $1,380,600
02300 Earthwork
35 $5,557,850
40
02450
40.02450.3105 Prestressed Concrete Piles & Pile Caps ea 0 $22 $0
40.02450.3115 12" Precast Piling ea 0 $3,725 $0
02450 Foundation & Load Bearing Elements
03000
EXCAVATION TOTAL
COMPACTED FILL TOTAL
Concrete Spillway Structure
$0
Upstream Reservoir Dam
Planning Level Opinion of Probable Construction Costs
Temporary Diversion
$1,000,000
Foundation & Load Bearing Elements
$50,100
$81,485
Earthwork
Earthwork
COMPACTED FILL
SPILLWAY STRUCTURE
$5,557,850
Spreadsheet Level
RESERVOIR SITE PREPARATION
$231,875
EXCAVATION
Demo Roads, Railroads etc
Clearing and Grubbing
Erosion and Sediment Control
Site Restoration & Rehabilitation
$0
$7,905
EROSION AND SEDIMENT CONTROL
RESERVOIR SITE PREPARATION TOTAL

40.03000.3105 Cast‐in‐place concrete spillway cy 190 $500 $95,000
40.03000.3115 6‐foot‐diameter Concrete Pipe lf 430 $525 $225,750
40.03000.3125 Stilling basin cy 330 $500 $165,000
03000 Concrete Spillway Structure
03001
40.03001.3105 Outlet structure cy 0 $750 $0
40.03001.3115 Downstream retaining wall cy 0 $500 $0
40.03001.3125 Gate house cy 15 $500 $7,500
40.03001.3135 Access Bridge to Gate house cy 21 $500 $10,500
030010 Concrete; Low‐level outlet
11280 Gates
40.11280.3105 6' x 6' Sluice Gate ea 1 $65,000 $65,000
11280 Gates
40 $568,750
45
2700 Flexible Base
45.02700.3105 Toe Drain lf 1,300 $24 $31,200
45.02700.3110 Chimney Drain cy 9,250 $50 $462,500
45.02700.3115 Blanket Drain cy 18,100 $50 $905,000
2700 Flexible Base
45 $1,398,700
50 MISCELLANEOUS INSTRUMENTATION
13400 Measurement and control Instrumentation
50.13400.3105 Benchmarks ea 2 675 $1,350
50.13400.3110 Piezometers ea 10 $3,400 $34,000
50.13400.3115 Inclinometers ea 3 $3,400 $10,200
50.13400.3120 Settlement Plates ea 5 $200 $1,000
13400 Measurement and control Instrumentation
50 $46,550
$8,993,215
$899,322
$179,864
$377,715
$50,000
$899,322
$2,697,965
$14,097,402
CHIMNEY, TOE & BLANKET DRAINS
CHIMNEY, TOE & BLANKET DRAINS
$1,398,700
MISCELLANEOUS INSTRUMENTATION TOTAL
SPILLWAY STRUCTURE
$46,550
$65,000
Concrete; Low‐level outlet
$18,000
$485,750
Contingency (30%)
Total
Subtotal
Engineering (10%)
Permitting (2%)
Sales Tax (4.2 %)
Mobilization
Contractor Markup (10%)

Appendix H 1993 Layne Report


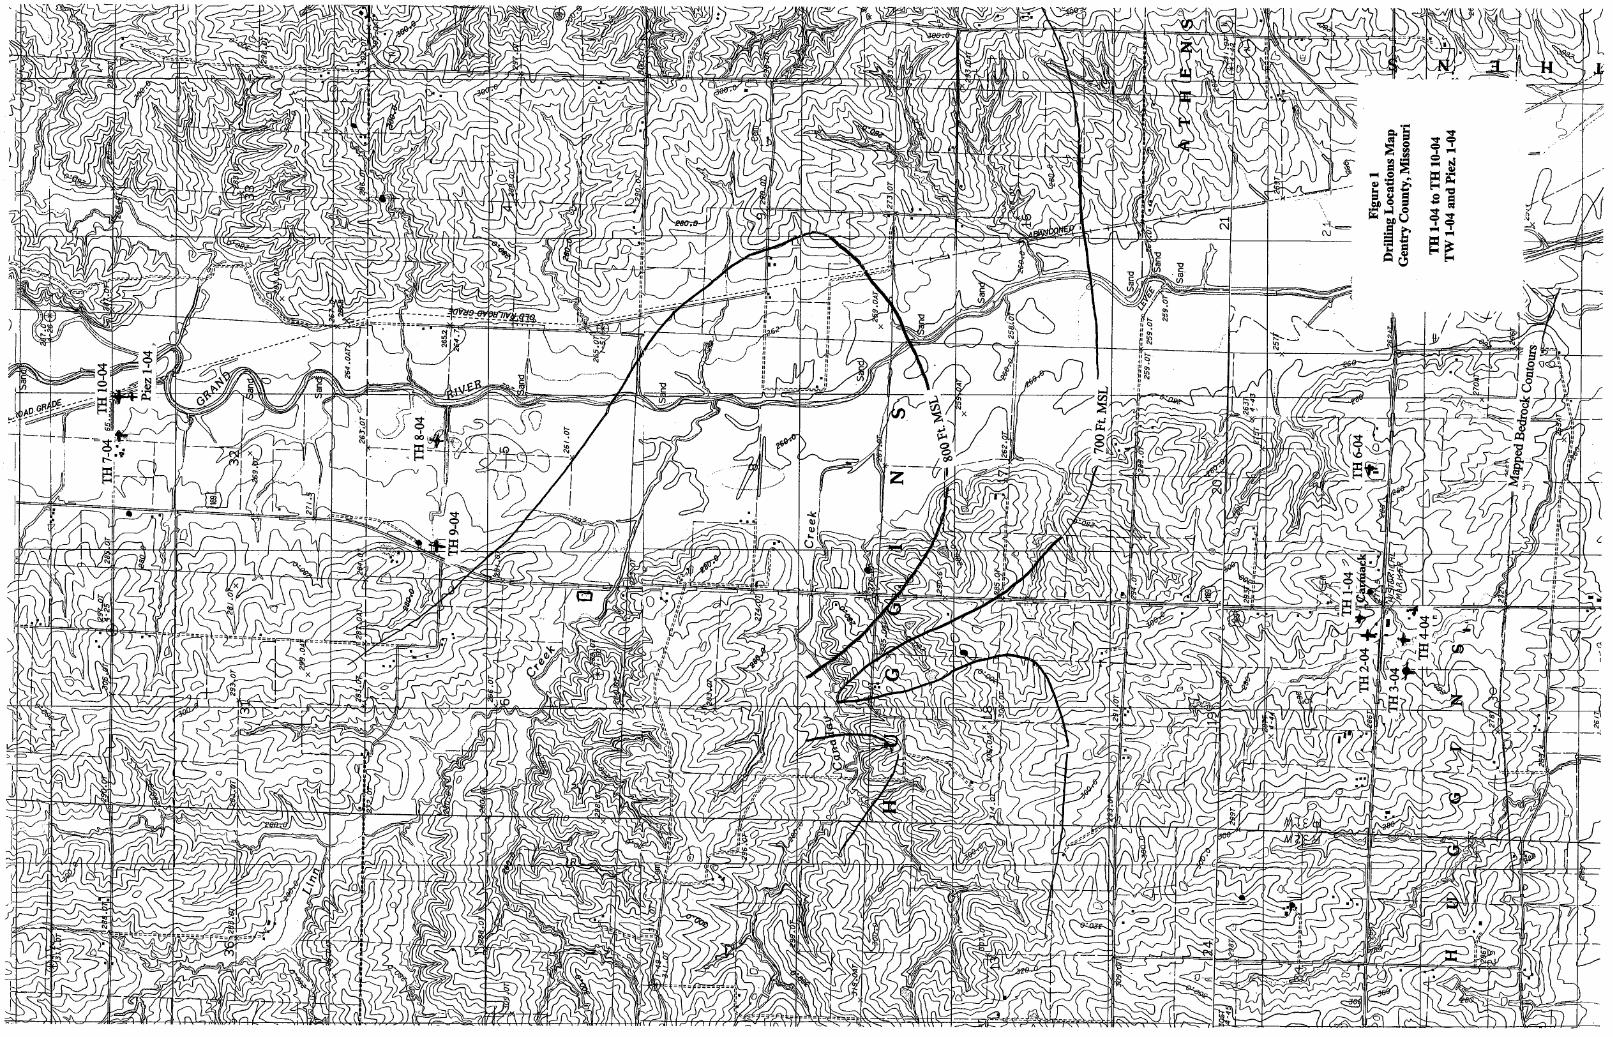


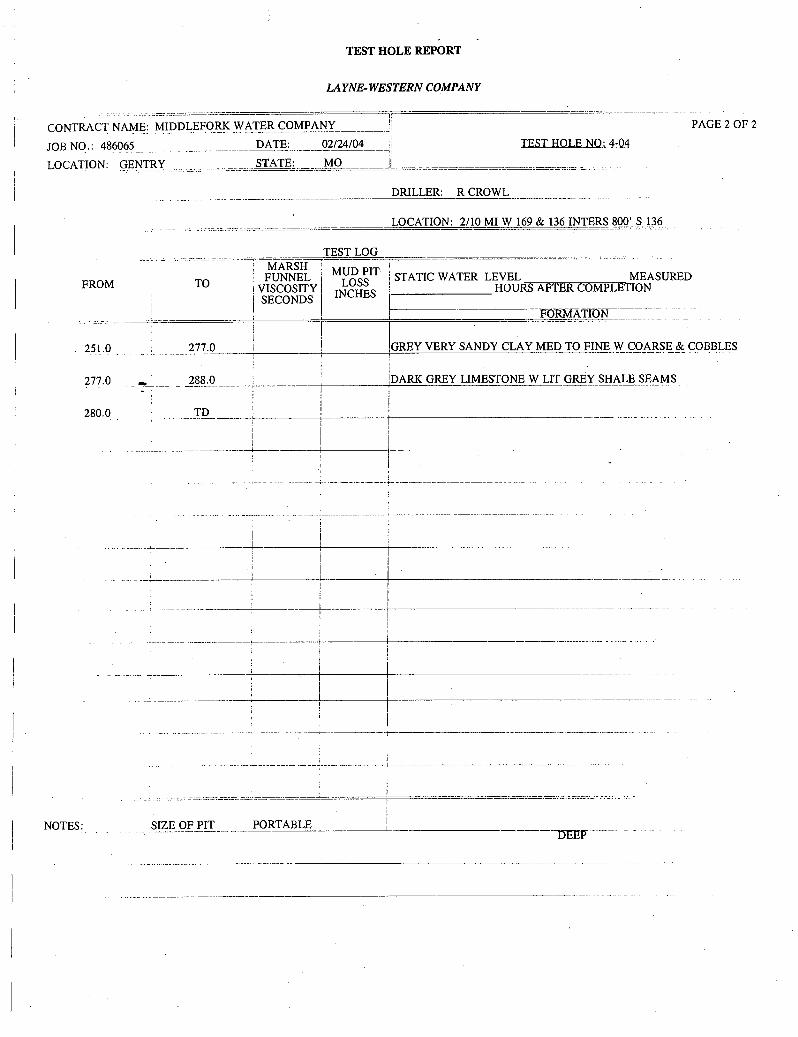


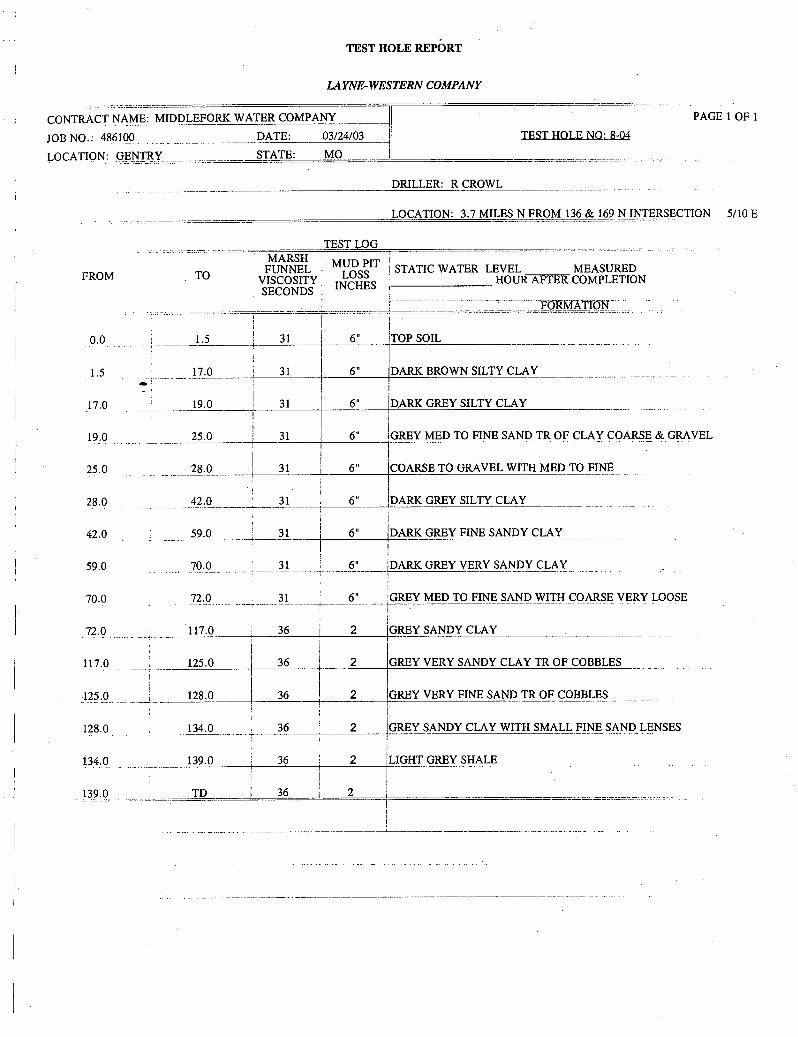


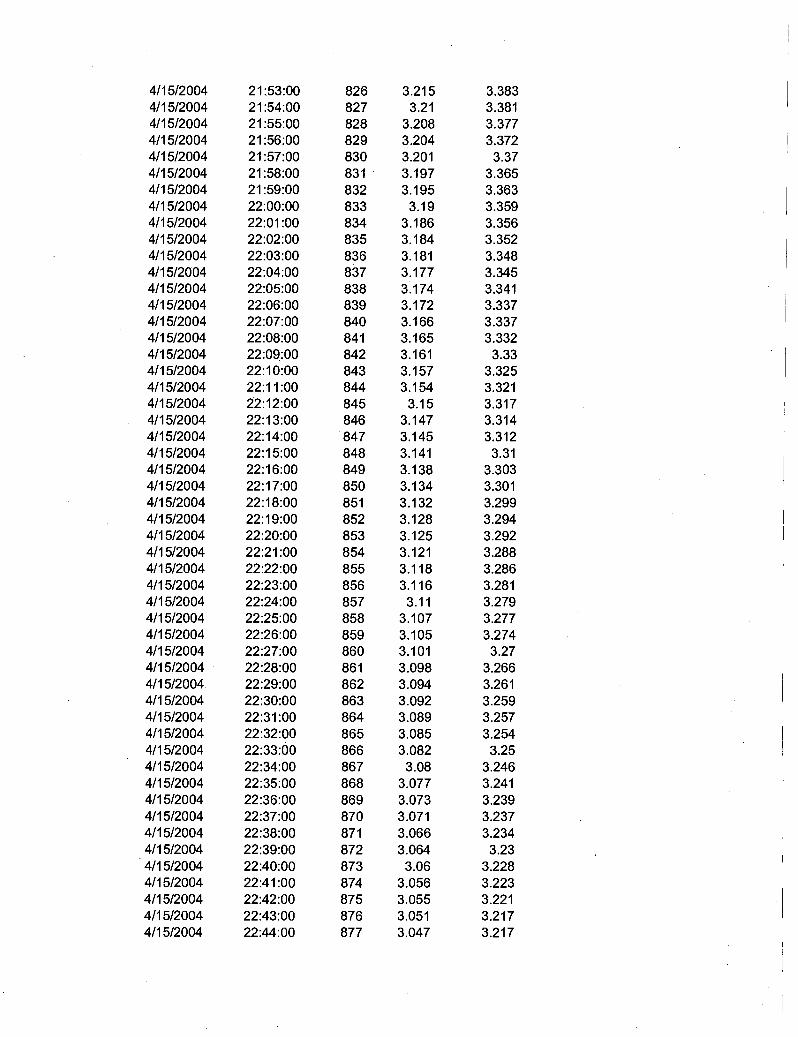


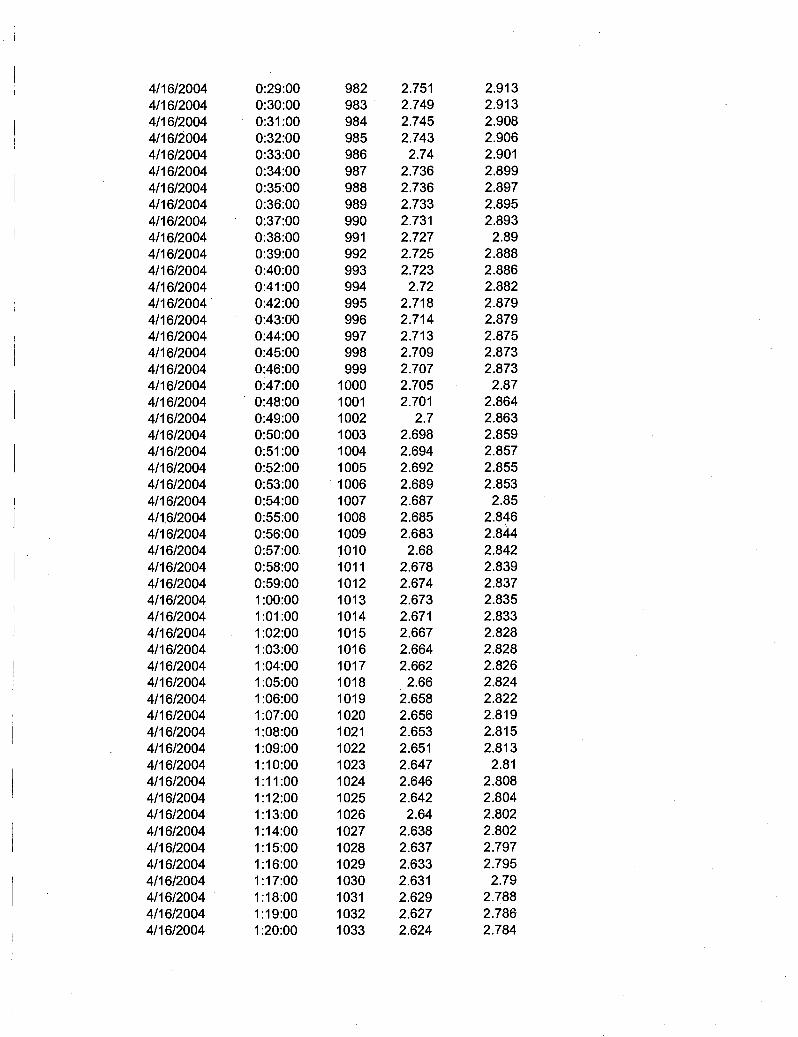


Appendix I Project References


I‐1 6198‐YW06_Middle Fork WTP and Reservoir_Final TM_Appendix I_June 2012.docx
Appendix I
Project References
The following is a list of references that were located during the file review and were utilized during the preparation of this report and the development of the recommendations presented herein:
Milkon Corporation Consulting Engineers, Daily Job Reports: July 10, 1992; July 27, 1992; July 31, 1992; August 4, 1992; August 14, 1992; August 20, 1992
Milkon Corporation Consulting Engineers, Laboratory Compaction Tests: July 13, 1992 (A & B); August 3, 1992 (C)
Construction Specification for Linn Creek Dam and Reservoir
Construction Plans for Linn Creek dam and Reservoir, November 1991
Donaldson Engineering and Const. Co., Project Location and Site Plan, Sheet 1 of 23, December 1991
USGS Water Data Report 2010, for 06896189 Stanberry Lake, near Gentry, Missouri

Appendix I Project References
I‐2 6198‐YW06_Middle Fork WTP and Reservoir_Final TM_Appendix I_June 2012.docx
This page left blank intentionally