Embed Size (px)
Citation preview
ClickHere
for
FullArticle
Northern Hemisphere winter snow anomalies: ENSO, NAOand the winter of 2009/10
R. Seager,1 Y. Kushnir,1 J. Nakamura,1 M. Ting,1 and N. Naik1
Received 1 May 2010; revised 10 June 2010; accepted 22 June 2010; published 24 July 2010.
[1] Winter 2009/10 had anomalously large snowfall in thecentral parts of the United States and in northwesternEurope. Connections between seasonal snow anomaliesand the large scale atmospheric circulation are explored.An El Niño state is associated with positive snowfallanomalies in the southern and central United States andalong the eastern seaboard and negative anomalies to thenorth. A negative NAO causes positive snow anomaliesacross eastern North America and in northern Europe. It isargued that increased snowfall in the southern U.S. iscontributed to by a southward displaced storm track butfurther north, in the eastern U.S. and northern Europe,positive snow anomalies arise from the cold temperatureanomalies of a negative NAO. These relations are usedwith observed values of NINO3 and the NAO to concludethat the negative NAO and El Niño event were responsiblefor the northern hemisphere snow anomalies of winter2009/10.Citation: Seager, R., Y. Kushnir, J. Nakamura,M. Ting,and N. Naik (2010), Northern Hemisphere winter snow anomalies:ENSO, NAO and the winter of 2009/10, Geophys. Res. Lett., 37,L14703, doi:10.1029/2010GL043830.
1. Introduction
[2] The winter season of 2009–2010 had anomalouslylarge snowfall in the mid‐Atlantic states of the United States.December’s snowcover in the contiguous U.S. was thegreatest ever for that month while, for example, Dulles Air-port, Washington DC (73.2''), Baltimore (80.4'') and Phila-delphia (78.7'') had their snowiest winters ever. Much ofnorthwestern Europe also had an anomalously cold andsnowy winter (see http://www.ncdc,noaa.gov/special‐reports/2009–2010‐cold‐season.html and http://www.knmi.nl/cms/content/79165/ for U.S. and European climate summaries).The wintry winter has encouraged deniers of global warming,and those opposed to restrictions on greenhouse gas emis-sions, to mock climate change science. While these attacksconfuse climate and weather and take a very geographicallylimited view (for example much of the Pacific Northwest hadbelow normal snowfall), it is worth examining the causes forthe winter’s snowfall anomalies. Such knowledge can beuseful in climate prediction. In addition, explanations forclimate and weather events that are in the news can helpeducate the public and diminish the effectiveness of efforts toexploit events to undermine the credibility of the science ofclimate change. In this paper we extend prior work by usingdata for both snow fall and snow water equivalent (SWE),
taking a hemispheric perspective and relating snow anoma-lies to mean and transient circulation anomalies. We showthat snow anomalies across the northern hemisphere this pastwinter are typical of winters with a negative North AtlanticOscillation (NAO) and an El Niño and are related to meantemperature and storm track anomalies.
2. Data Sets Used
[3] We examine data sets of snowfall and SWE. Twoground station snow fall data sets were used: for the period1950 to 1999 from the National Climatic Data Center (http://iridl.ldeo.columbia.edu/SOURCES/.NOAA/.NCDC/.DAILY/.FSOD/.SNOW/.) and for the post 2003 period fromthe National Operational Hydrologic Remote Sensing Center(NOHRSC, http://www.nohrsc.noaa.gov) and both are forthe U.S. only. The SWE data cover 1979 to 2007, are frommicrowave satellite readings and are global [Armstrong etal., 2005]. (See http://nsidc.org/data/nsidc‐0271.html for adiscussion of limitations and errors of the SWE measure-ments associated with topography, land surface type etc.)The National Center for Environmental Prediction‐NationalCenter for Atmospheric Research (NCEP‐NCAR) Reanaly-sis [Kistler et al., 2001] is used to analyze temperature andstorm track anomalies.
3. Relation Between Observed Snowfall, SnowWater Equivalent and ENSO and the NAO
[4] Our hypothesis is that snowy winters in the mid‐Atlantic region, and, more broadly, the continental andhemispheric scale snow anomalies are, in part, caused by acombination of El Niño and a negative NAO. El Niño eventsare associated with a southward shifted storm track in both thePacific and Atlantic sectors [e.g., Seager et al., 2005, 2010]while a negative NAO causes cold in eastern North Americaand northern Europe [Hurrell, 1995]. Such a combinationcould cause increased snow as increased storminess impactsthe central and southern latitudes of the U.S. while the NAOprovides sufficient cold air for the precipitation to fall assnow. We therefore regress and correlate the snow data withthe NINO3 sea surface temperature (SST) index (SST aver-aged 5°−5°N, 150°W−90°W), the NAO index provided by theClimate Prediction Center (CPC, the principal component ofthe Atlantic centered rotated EOF of 500mb height north of20°N). Since we expect seasons with both an El Niño and anegative NAO would favor positive snow anomalies in themid‐Atlantic U.S., we also use a third index, the normalizedNINO3 index minus the normalized NAO index (NINO‐NAO), that represents the combined effect.[5] Figure 1 shows the correlation of snowfall with the
NINO3 index and the NAO index times minus one and theregression and correlation with the NINO‐NAO index for
1Lamont Doherty Earth Observatory, Earth Institute at ColumbiaUniversity, Palisades, New York, USA.
Copyright 2010 by the American Geophysical Union.0094‐8276/10/2010GL043830
GEOPHYSICAL RESEARCH LETTERS, VOL. 37, L14703, doi:10.1029/2010GL043830, 2010
L14703 1 of 6
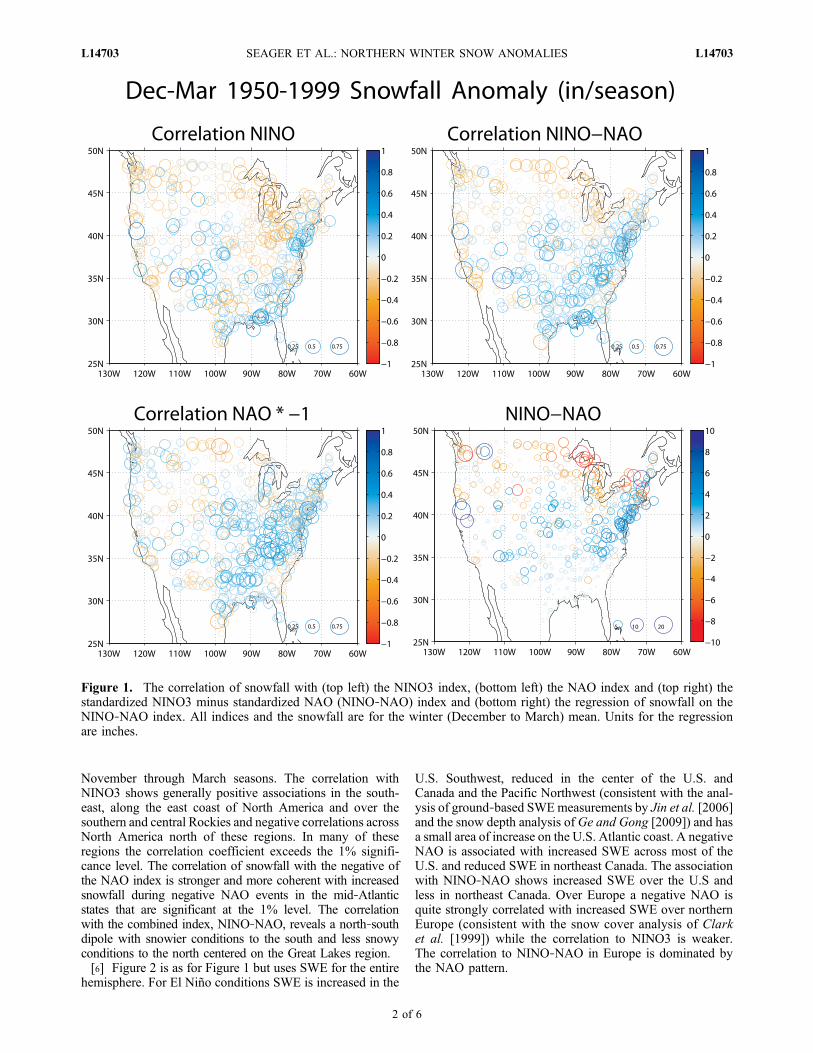
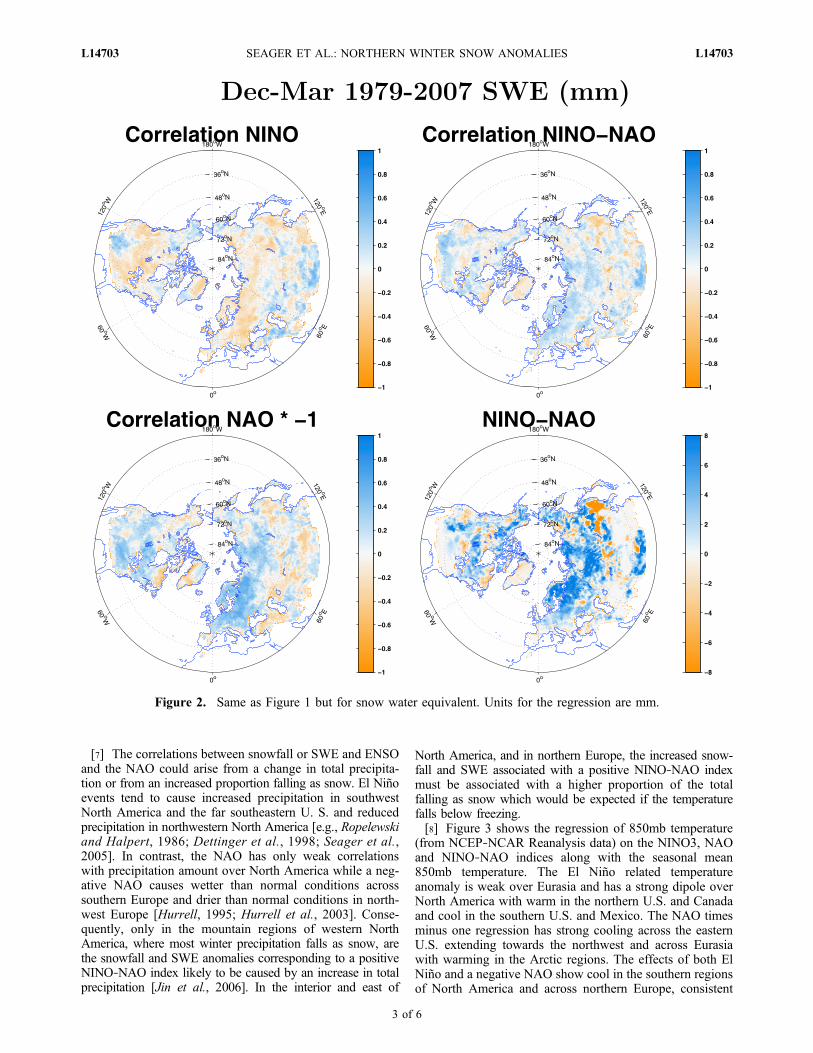
November through March seasons. The correlation withNINO3 shows generally positive associations in the south-east, along the east coast of North America and over thesouthern and central Rockies and negative correlations acrossNorth America north of these regions. In many of theseregions the correlation coefficient exceeds the 1% signifi-cance level. The correlation of snowfall with the negative ofthe NAO index is stronger and more coherent with increasedsnowfall during negative NAO events in the mid‐Atlanticstates that are significant at the 1% level. The correlationwith the combined index, NINO‐NAO, reveals a north‐southdipole with snowier conditions to the south and less snowyconditions to the north centered on the Great Lakes region.[6] Figure 2 is as for Figure 1 but uses SWE for the entire
hemisphere. For El Niño conditions SWE is increased in the
U.S. Southwest, reduced in the center of the U.S. andCanada and the Pacific Northwest (consistent with the anal-ysis of ground‐based SWEmeasurements by Jin et al. [2006]and the snow depth analysis of Ge and Gong [2009]) and hasa small area of increase on the U.S. Atlantic coast. A negativeNAO is associated with increased SWE across most of theU.S. and reduced SWE in northeast Canada. The associationwith NINO‐NAO shows increased SWE over the U.S andless in northeast Canada. Over Europe a negative NAO isquite strongly correlated with increased SWE over northernEurope (consistent with the snow cover analysis of Clarket al. [1999]) while the correlation to NINO3 is weaker.The correlation to NINO‐NAO in Europe is dominated bythe NAO pattern.
Figure 1. The correlation of snowfall with (top left) the NINO3 index, (bottom left) the NAO index and (top right) thestandardized NINO3 minus standardized NAO (NINO‐NAO) index and (bottom right) the regression of snowfall on theNINO‐NAO index. All indices and the snowfall are for the winter (December to March) mean. Units for the regressionare inches.
SEAGER ET AL.: NORTHERN WINTER SNOW ANOMALIES L14703L14703
2 of 6
[7] The correlations between snowfall or SWE and ENSOand the NAO could arise from a change in total precipita-tion or from an increased proportion falling as snow. El Niñoevents tend to cause increased precipitation in southwestNorth America and the far southeastern U. S. and reducedprecipitation in northwestern North America [e.g., Ropelewskiand Halpert, 1986; Dettinger et al., 1998; Seager et al.,2005]. In contrast, the NAO has only weak correlationswith precipitation amount over North America while a neg-ative NAO causes wetter than normal conditions acrosssouthern Europe and drier than normal conditions in north-west Europe [Hurrell, 1995; Hurrell et al., 2003]. Conse-quently, only in the mountain regions of western NorthAmerica, where most winter precipitation falls as snow, arethe snowfall and SWE anomalies corresponding to a positiveNINO‐NAO index likely to be caused by an increase in totalprecipitation [Jin et al., 2006]. In the interior and east of
North America, and in northern Europe, the increased snow-fall and SWE associated with a positive NINO‐NAO indexmust be associated with a higher proportion of the totalfalling as snow which would be expected if the temperaturefalls below freezing.[8] Figure 3 shows the regression of 850mb temperature
(from NCEP‐NCAR Reanalysis data) on the NINO3, NAOand NINO‐NAO indices along with the seasonal mean850mb temperature. The El Niño related temperatureanomaly is weak over Eurasia and has a strong dipole overNorth America with warm in the northern U.S. and Canadaand cool in the southern U.S. and Mexico. The NAO timesminus one regression has strong cooling across the easternU.S. extending towards the northwest and across Eurasiawith warming in the Arctic regions. The effects of both ElNiño and a negative NAO show cool in the southern regionsof North America and across northern Europe, consistent
Figure 2. Same as Figure 1 but for snow water equivalent. Units for the regression are mm.
SEAGER ET AL.: NORTHERN WINTER SNOW ANOMALIES L14703L14703
3 of 6
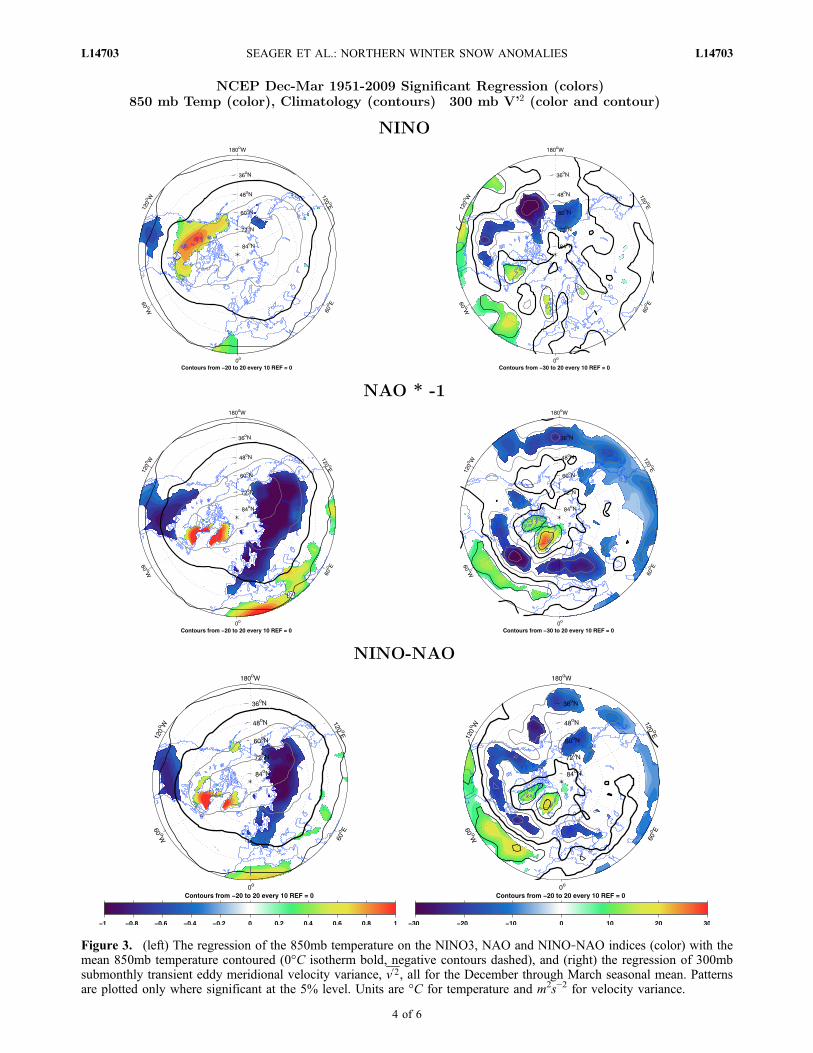
Figure 3. (left) The regression of the 850mb temperature on the NINO3, NAO and NINO‐NAO indices (color) with themean 850mb temperature contoured (0°C isotherm bold, negative contours dashed), and (right) the regression of 300mbsubmonthly transient eddy meridional velocity variance, v02, all for the December through March seasonal mean. Patternsare plotted only where significant at the 5% level. Units are °C for temperature and m2s−2 for velocity variance.
SEAGER ET AL.: NORTHERN WINTER SNOW ANOMALIES L14703L14703
4 of 6
with the snowfall anomalies (Figure 1). Where the anoma-lies tend to move the total temperature below freezing anincreased proportion of precipitation will fall as snow, e.g.,in the southeast U.S. and mid‐Atlantic states [Serreze et al.,1998] and northwestern Europe. In regions where the meantemperature is well below freezing (e.g., most of Canada)all precipitation typically falls as snow and a strong corre-lation between the snowfall and the climate indices is notexpected.[9] Figure 3 also shows the correlations of the three cli-
mate indices to the 300mb submonthly transient eddy
meridional velocity variance, v02, as calculated from theNCEP‐NCAR Reanalysis daily data for 1950 to 2009, takento be a measure of the mid‐latitude storm tracks. El Niño isassociated with a southward shifted storm track over thePacific‐North America sector. A negative NAO also causesincreased storminess over the southeast U.S. and the sub-tropical Atlantic Ocean and reduced storminess overnorthern Europe. For the mid‐Atlantic states and northeastU.S., El Niño and a negative NAO cause reduced stormi-ness. Consequently, changes in storminess may help explainsnow anomalies in western North America and the southeast
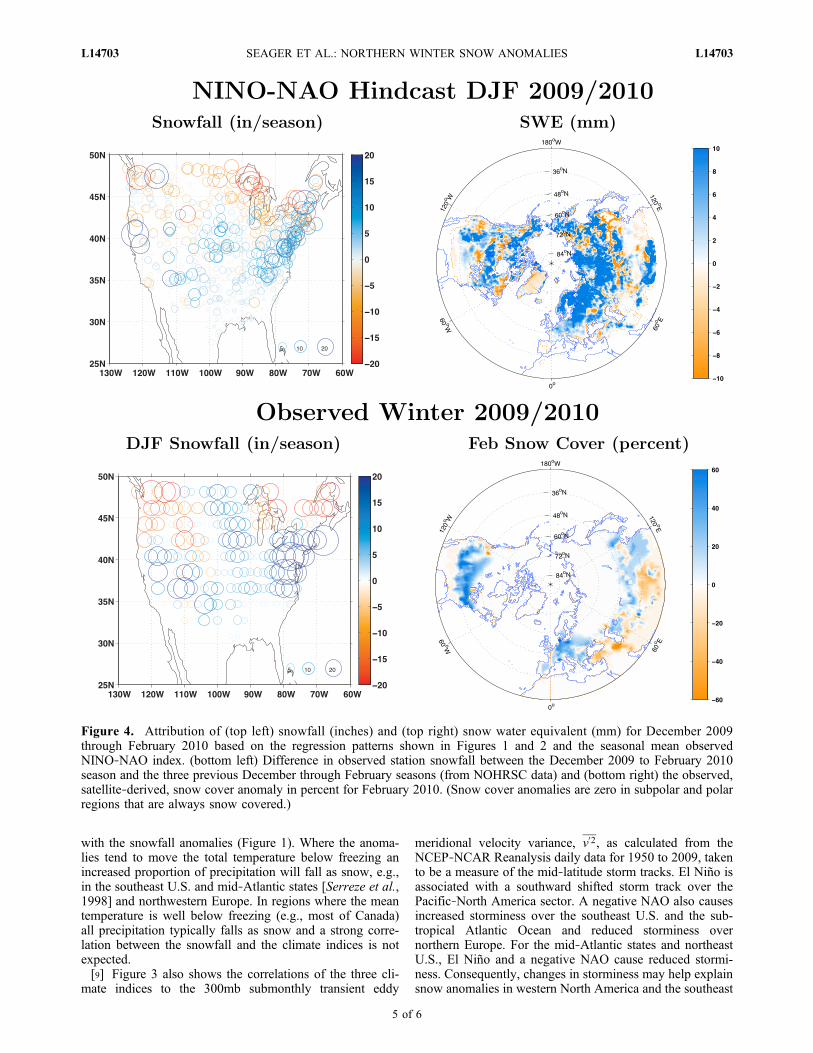
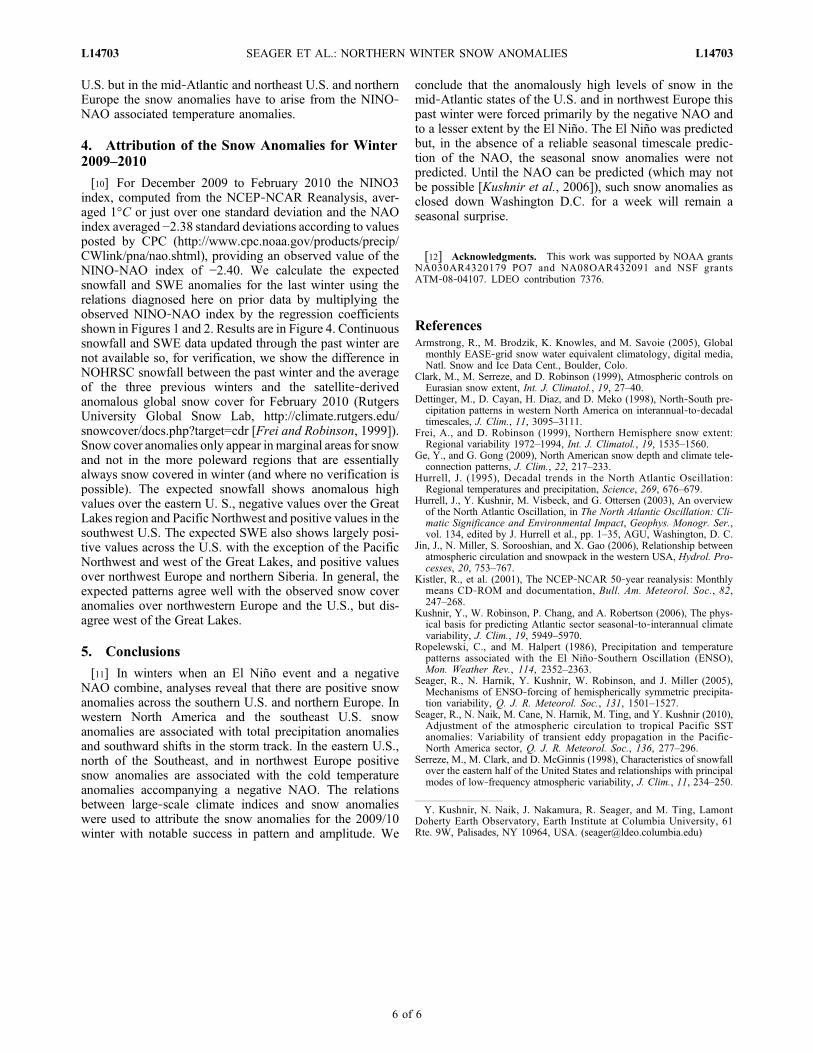
Figure 4. Attribution of (top left) snowfall (inches) and (top right) snow water equivalent (mm) for December 2009through February 2010 based on the regression patterns shown in Figures 1 and 2 and the seasonal mean observedNINO‐NAO index. (bottom left) Difference in observed station snowfall between the December 2009 to February 2010season and the three previous December through February seasons (from NOHRSC data) and (bottom right) the observed,satellite‐derived, snow cover anomaly in percent for February 2010. (Snow cover anomalies are zero in subpolar and polarregions that are always snow covered.)
SEAGER ET AL.: NORTHERN WINTER SNOW ANOMALIES L14703L14703
5 of 6
U.S. but in the mid‐Atlantic and northeast U.S. and northernEurope the snow anomalies have to arise from the NINO‐NAO associated temperature anomalies.
4. Attribution of the Snow Anomalies for Winter2009–2010
[10] For December 2009 to February 2010 the NINO3index, computed from the NCEP‐NCAR Reanalysis, aver-aged 1°C or just over one standard deviation and the NAOindex averaged −2.38 standard deviations according to valuesposted by CPC (http://www.cpc.noaa.gov/products/precip/CWlink/pna/nao.shtml), providing an observed value of theNINO‐NAO index of −2.40. We calculate the expectedsnowfall and SWE anomalies for the last winter using therelations diagnosed here on prior data by multiplying theobserved NINO‐NAO index by the regression coefficientsshown in Figures 1 and 2. Results are in Figure 4. Continuoussnowfall and SWE data updated through the past winter arenot available so, for verification, we show the difference inNOHRSC snowfall between the past winter and the averageof the three previous winters and the satellite‐derivedanomalous global snow cover for February 2010 (RutgersUniversity Global Snow Lab, http://climate.rutgers.edu/snowcover/docs.php?target=cdr [Frei and Robinson, 1999]).Snow cover anomalies only appear inmarginal areas for snowand not in the more poleward regions that are essentiallyalways snow covered in winter (and where no verification ispossible). The expected snowfall shows anomalous highvalues over the eastern U. S., negative values over the GreatLakes region and Pacific Northwest and positive values in thesouthwest U.S. The expected SWE also shows largely posi-tive values across the U.S. with the exception of the PacificNorthwest and west of the Great Lakes, and positive valuesover northwest Europe and northern Siberia. In general, theexpected patterns agree well with the observed snow coveranomalies over northwestern Europe and the U.S., but dis-agree west of the Great Lakes.
5. Conclusions
[11] In winters when an El Niño event and a negativeNAO combine, analyses reveal that there are positive snowanomalies across the southern U.S. and northern Europe. Inwestern North America and the southeast U.S. snowanomalies are associated with total precipitation anomaliesand southward shifts in the storm track. In the eastern U.S.,north of the Southeast, and in northwest Europe positivesnow anomalies are associated with the cold temperatureanomalies accompanying a negative NAO. The relationsbetween large‐scale climate indices and snow anomalieswere used to attribute the snow anomalies for the 2009/10winter with notable success in pattern and amplitude. We
conclude that the anomalously high levels of snow in themid‐Atlantic states of the U.S. and in northwest Europe thispast winter were forced primarily by the negative NAO andto a lesser extent by the El Niño. The El Niño was predictedbut, in the absence of a reliable seasonal timescale predic-tion of the NAO, the seasonal snow anomalies were notpredicted. Until the NAO can be predicted (which may notbe possible [Kushnir et al., 2006]), such snow anomalies asclosed down Washington D.C. for a week will remain aseasonal surprise.
[12] Acknowledgments. This work was supported by NOAA grantsNA030AR4320179 PO7 and NA08OAR432091 and NSF grantsATM‐08‐04107. LDEO contribution 7376.
ReferencesArmstrong, R., M. Brodzik, K. Knowles, and M. Savoie (2005), Global
monthly EASE‐grid snow water equivalent climatology, digital media,Natl. Snow and Ice Data Cent., Boulder, Colo.
Clark, M., M. Serreze, and D. Robinson (1999), Atmospheric controls onEurasian snow extent, Int. J. Climatol., 19, 27–40.
Dettinger, M., D. Cayan, H. Diaz, and D. Meko (1998), North‐South pre-cipitation patterns in western North America on interannual‐to‐decadaltimescales, J. Clim., 11, 3095–3111.
Frei, A., and D. Robinson (1999), Northern Hemisphere snow extent:Regional variability 1972–1994, Int. J. Climatol., 19, 1535–1560.
Ge, Y., and G. Gong (2009), North American snow depth and climate tele-connection patterns, J. Clim., 22, 217–233.
Hurrell, J. (1995), Decadal trends in the North Atlantic Oscillation:Regional temperatures and precipitation, Science, 269, 676–679.
Hurrell, J., Y. Kushnir, M. Visbeck, and G. Ottersen (2003), An overviewof the North Atlantic Oscillation, in The North Atlantic Oscillation: Cli-matic Significance and Environmental Impact, Geophys. Monogr. Ser.,vol. 134, edited by J. Hurrell et al., pp. 1–35, AGU, Washington, D. C.
Jin, J., N. Miller, S. Sorooshian, and X. Gao (2006), Relationship betweenatmospheric circulation and snowpack in the western USA, Hydrol. Pro-cesses, 20, 753–767.
Kistler, R., et al. (2001), The NCEP‐NCAR 50‐year reanalysis: Monthlymeans CD‐ROM and documentation, Bull. Am. Meteorol. Soc., 82,247–268.
Kushnir, Y., W. Robinson, P. Chang, and A. Robertson (2006), The phys-ical basis for predicting Atlantic sector seasonal‐to‐interannual climatevariability, J. Clim., 19, 5949–5970.
Ropelewski, C., and M. Halpert (1986), Precipitation and temperaturepatterns associated with the El Niño‐Southern Oscillation (ENSO),Mon. Weather Rev., 114, 2352–2363.
Seager, R., N. Harnik, Y. Kushnir, W. Robinson, and J. Miller (2005),Mechanisms of ENSO‐forcing of hemispherically symmetric precipita-tion variability, Q. J. R. Meteorol. Soc., 131, 1501–1527.
Seager, R., N. Naik, M. Cane, N. Harnik, M. Ting, and Y. Kushnir (2010),Adjustment of the atmospheric circulation to tropical Pacific SSTanomalies: Variability of transient eddy propagation in the Pacific‐North America sector, Q. J. R. Meteorol. Soc., 136, 277–296.
Serreze, M., M. Clark, and D. McGinnis (1998), Characteristics of snowfallover the eastern half of the United States and relationships with principalmodes of low‐frequency atmospheric variability, J. Clim., 11, 234–250.
Y. Kushnir, N. Naik, J. Nakamura, R. Seager, and M. Ting, LamontDoherty Earth Observatory, Earth Institute at Columbia University, 61Rte. 9W, Palisades, NY 10964, USA. ([email protected])
SEAGER ET AL.: NORTHERN WINTER SNOW ANOMALIES L14703L14703
6 of 6