Embed Size (px)
Citation preview

United StatesDepartment ofAgriculture
Forest Service
Northeastern AreaState & PrivateForesty
Timber BridgeInformationResource Center
A HierarchicalAnalysis of BridgeDecision Makers
Morgantown, WV
NA-TP-04-95
The Role of New TechnologyAdoption in the Timber BridgeMarket: Special ProjectFiscal Year 1992
PREFACE
This publication is a technology transfer effort by the USDA Forest Service,Timber Bridge Information Resource Center, in cooperation with the Centerfor Forest Products Marketing, Department of Wood Science and ForestProducts, at Virginia Polytechnic Institute and State University, under a grantfrom the USDA Forest Service.
This publication examines the process used to characterize the bridgematerial selection by design engineers and local highway officials. TheAnalytical Hierarchy Process is used to quantify factors that affect decisioncriteria and materials selected. Strategies are recommended for promotingtimber as a bridge material.
Edward T. CesaTimber Bridge Information Resource CenterUSDA-Forest Service
Other publications in this five-part series are:
Factors Influencing the Adoption of Timber Bridges (Literature Review),NA-TP-02-95 (Part I)
A Perceptional Investigation into the Adoption of Timber Bridges,NA-TP-03-95 (Part II)
Marketing Practices in the Timber Bridge Industry: 1993, NA-TP-05-95(Part IV)
A Strategic Evaluation of Factors Affecting the Adoption of TimberBridges, NA-TP-06-95 (Part V)
Editor: Brenda L. WilkinsDesign: Tinathan A. Coger
Production: James H. Knotts
This document is disseminated under the sponsorship of the USDA Forest Service, Timber BridgeInformation Resource Center, in the interest of information exchange. The United States Governmentassumes no liability for its contents or use thereof. This booklet does not constitute a standard,specification, or regulation.
The United States Government does not endorse products or manufacturers. Trade and manufacturers’names appear in this document only because they are considered essential to the object of thedocument.
The United States Department of Agriculture (USDA) Forest Service is a diverse organization committed to equalopportunity in employment and program delivery. USDA prohibits discrimination on the basis of race, color, nationalorigin, sex, religion, age, disability, political affiliation and familial status. Persons believing they have been discrimi-nated against should contact the Secretary, U. S. Department of Agriculture, Washington, DC 20250, or call 202-720-7327 (voice) or 202-720-1127 (TTY).
Timber Bridge Information Resource CenterTECHNOLOGYTRANSFER
The Role of New Technology Adoption in the Timber
Bridge Market: Special Project Fiscal Year 1992
A Hierarchical Analysis of BridgeDecision Makers
Prepared for:
Timber Bridge Information Resource Center
Prepared by:
Robert L. Smith, Assistant Professor/Extension SpecialistRobert J. Bush, Assistant ProfessorVirginia Polytechnic Institute and State UniversityCenter for Forest products MarketingDepartment of Wood Science and Forest ProductsBlacksburg, VirginiaandDaniel Schmoldt, Research ScientistUSDA Forest Service, southeastern Forest Experiment StationBlacksburg, Virginia
August 1995
Northeastern AreaState & Private
Forestry
TABLE OF CONTENTS
Abstract ................................................................................................................................. 1Introduction ............................................................................................................................ 1
Timber Bridges .................................................................................................................... 2Background ............................................................................................................................. 3
The Bridge Decision Problem ................................................................................................. 3The Analytical Hierarchy Process (AHP) ................................................................................... 3
Methods .................................................................................................................................. 4Data Collection ................................................................................................................... 4States ................................................................................................................................. 6
Results .................................................................................................................................... 7The AHP for Wisconsin Counties ........................................................................................... 7
Conclusions ............................................................................................................................. 9
Literature Cited ...................................................................................................................... 10
TABLES
1.2.3.4.
5.6.
7.
8.9.
Criteria in Determination of Bridge Material ........................................................................... 13States Surveyed for Important Bridge Factors .......................................................................... 13Importance of Criteria in the Bridge Material Decision Process .................................................. 14Geometric Mean of Paired Comparisons of Bridge Factors asRated by Nine Wisconsin Highway Officials ........................................................................... 15Vector of Priorities for Wisconsin Counties ............................................................................. 15Matrix of Paired Comparisons for Preferences of Bridge MaterialsUnder the Bridge Factor (Past Performance) for Wisconsin Counties ........................................... 16Vector of Priorities for Bridge Materials under PastPerformance for Wisconsin Counties ...................................................................................... 16Summary of AHP Models by State and Decision-Making Level ................................................... 17Statistical Comparisons between Decision-making Groups and States ........................................... 18
FIGURES
1.2.3.4.
Analytic Hierarchy Model for the Choice of a Bridge Material ................................................... 19AHP Computation of the Choice of a Bridge Material .............................................................. 20Decision Model for Wisconsin County Decision Makers ............................................................ 21Choice of a Bridge Material by State and Decision Level ............................................................ 22
i
ABSTRACT
Bridge design engineers and local highway officials make bridge replacement decisions across theUnited States. The Analytical Hierarchy Process was used to characterize the bridge material selec-tion decision of these individuals. State Department of Transportation engineers, private consultingengineers, and local highway officials were personally interviewed in Mississippi, Virginia, Wash-ington, and Wisconsin to identify how important factors determine their choice of a bridge material.The Analytical Hierarchy Process allowed us to quantify this subjective material selection decisionfor different groups of decision makers. Based on the importance of various decision criteria andhow well the material alternatives (steel, reinforced concrete, prestressed concrete, and timber) meetthem, strategies are recommended for those promoting timber as a bridge material.
INTRODUCTION
The disciplines of Management and Marketing have evolved into separate sciences over the years.Management is organization driven, wherein the effective manager must determine the purpose anddirection of the organization, foster and manage change, and conduct operations so that the organiza-tion and its people function efficiently and effectively (Levitt 1991). Levitt states that managersmake decisions. Decisions deal with choices. Choices involve alternatives, which include prospectsfor making, avoiding, resisting, and creating change. Drucker ( 1983) states that effective manage-ment requires precise analysis, rigorous allocation of resources, and timely decision making. Manag-ers are accountable to stockholders, financial backers, employees, and customers, so choices must benot only the best, but also justifiable.
Marketing has been called a philosophy. It is a total system of business activities which is designedto determine customers’ needs and desires, to plan and develop products to meet those needs anddesires, and to determine the best way to price, promote, distribute, and service the customer(Stanton 1978). This is often referred to as the marketing concept. Sinclair (1992) states that amarketing-oriented firm designs its products and service offerings to meet customer needs at a profit.Marketing is the income-generating activity of the firm, the process by which the organizationreaches out to its customers, and the means by which customers reach in to the firm.
Management often utilizes decision-analysis tools to more effectively run their organizations. Mar-keting departments rely upon research methods involving customer surveys, purchasing activities, ordemographics to understand and meet customer needs. Yet, as Drucker ( 1984, p. 1) states, “Market-ing is so basic it cannot be considered a separate function...It is the whole business seen from thepoint of view of its final result, the customer. ” Following on this idea, this study crosses the bound-ary between modern management decision analysis and the marketing concept. This study examineshow particular criteria affect material-selection decisions for rural bridges. Quantification of thisdecision process should allow manufacturers of bridge materials to improve their ability to meetdesign engineers’ and highway officials’ needs.
1
Timber Bridges
Highway officials and engineers across the United States have been asked to reevaluate their positionon the use of timber as a bridge material. In 1989, the Timber Bridge Initiative (TBI) began anextensive promotion and training program (TBI 1990) to inform and educate bridge engineers andhighway officials concerning the benefits of the modern timber bridge. It is believed that with anincrease in the use of timber, local economies can be stimulated and the rural infrastructure rebuilt.
Since its inception, the TBI has sponsored the construction of over 272 modern timber bridges in 48states and assisted in 17 million dollars of research, educational, and bridge-supported activities(USDA 1993). However, the long-term viability of timber bridges will depend not only upon thistechnology push, but the competitiveness and acceptance in the marketplace, the market pull.
Unfortunately, bridge engineers across the United States often have negative perceptions of timber asa bridge material. Studies by Clapp (1990) and Luppold (1990) have confirmed that engineers arenot ready to place timber in the same bridge material classification as prestressed concrete, steel, orreinforced concrete. Engineers have stated that timber is short lived, difficult to inspect, expensive,high in maintenance, and low in strength. Yet, numerous factors are known to affect the perfor-mance of bridge materials. Ritter (1990) states that poor design, poor construction, and poor man-agement practices lead to performance problems with timber in bridges. Yet, little is known aboutnon-structural factors influencing the bridge selection process and their effect upon the final deci-sion.
The choice of a material is the most important decision bridge designers make, and it has long-termconsequences for the owner of the structure (Johnson 1990). Bridge material selection is a complexdecision, with many individuals involved, and many factors of bridge design, use, and maintenanceto be considered. It is not uncommon to have state Department of Transportation (DOT) officials,private consultants, and local officials work together on a bridge replacement decision. Each ofthese groups may have their own preferences concerning bridge materials. Often a consensus isnecessary to determine the best material to use at a given location.
Ellen et al. (1991) indicate that humans or organizations tend to avoid change by favoring the currentsituation or status quo, unless an alternative is presented which is excessively attractive or verypressuring. Decision making tends to be based upon previous solutions and past successes, unlessthey are no longer viable. With over 93% of recent bridges being built out of prestressed concrete,reinforced concrete, or steel (FHWA 1992), decision makers appear reluctant to try timber in ruralbridge replacement.
One of the primary reasons for new product failure is inadequate market research. Three studiesundertaken over 25 years reveal that inadequate market analysis remains the primary cause of newproduct failure (National Industrial Conference Board 1964, Hopkins and Bailey 1971, Hopkins1980). Cooper (1988) states that the list of reasons for failure includes lack of thoroughness inidentifying real needs of the customer and competitors’ reactions in the marketplace. The moderntimber bridge can be classified as anew product. To effectively market this new product, the timberbridge industry must understand the current bridge material selection process. Once this decisionprocess has been explained, customers’ needs can be effectively addressed.
2
Scott and Keiser (1984) state that much of the research that is done in industrial markets to identifyand evaluate new opportunities is quantitative and unstructured. We demonstrate in this study thatqualitative and structured analysis of decision makers can be a useful tool for understanding custom-ers and their perceptions. We develop a behavioral model of bridge material selection for severalstates and for several levels of decision makers.
In this study, important non-structural factors (criteria) in the bridge material selection process weresolicited from highway officials in 28 states. We used the highest rated six factors in the AnalyticHierarchy Process (AHP) to determine the placement preference for steel, prestressed concrete,reinforced concrete, and timber by bridge design engineers and highway officials in four selectedstates. The AHP model helped us analyze how important decision criteria directly influence theoverall bridge material decision. From this developed recommendations for marketing strategiesthat can be used to increase the knowledge and application of timber as a bridge material.
BACKGROUND
The Bridge Decision Problem
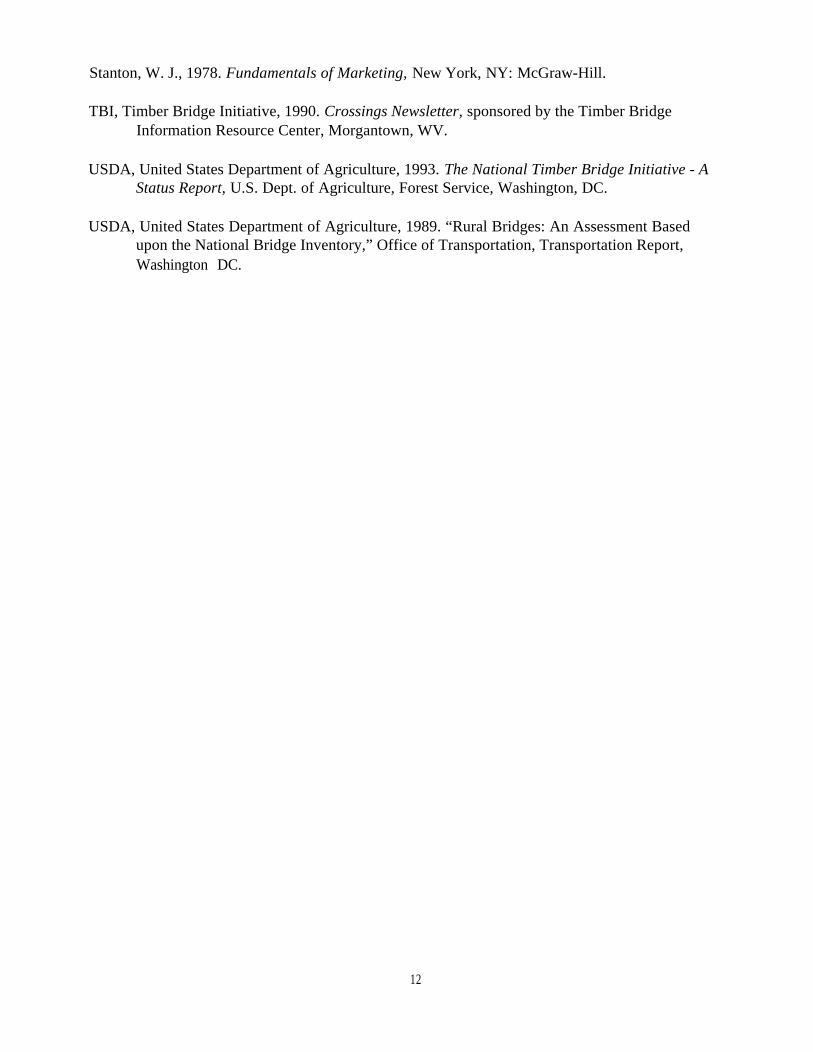
Many factors are known to affect the choice of a bridge material. Physical characteristics or site-specific factors include: roadway alignment, length of clear span, clearance above waterway, hy-draulic capacity requirements, and required loading capabilities. There are numerous non-structuralcharacteristics of bridge materials such as initial cost and maintenance (Table 1) that may alsoinfluence this decision. These are the areas which manufacturers can address in trying to influencethe choice of bridge material by design engineers. The four principal bridge materials, which,according to the FHWA (1992) represent 99% of the bridges built in the United States since 1982,are prestressed concrete, steel, timber, and reinforced concrete.
The Analytical Hierarchy Process (AHP)
Although various techniques exist for modeling decision making, the AHP was chosen for thisstudy. The AHP can be used as both a behavioral and normative model of decision making. That is,it can be used to model an existing decision-making process or to prescribe what decision oneshould make in a particular situation. It has the advantage of utilizing qualitative, as well as quanti-tative data. Qualitative data is important in this research because of the necessity to determine theunderlying (i.e., subjective) reasons for the decline in timber bridges in the United States and theslow rate of adoption of current timber bridge technology. Only by asking the people who make thedecisions can appropriate answers be discovered and strategies formulated to change the currentpatterns. Qualitative inquiry cultivates the most useful of all human capacities—the capacity tolearn from others (Patton 1990).
The Analytic Hierarchy Process, developed by Thomas Saaty in the early 1970s, allows us to quan-tify and aggregate subjective opinions. Saaty (1980) states that the practice of decision making isconcerned with weighing alternatives which fulfill a set of desired objectives. This multi criterion,
3
multiperson model structures the decision process into a hierarchy. Through a set of pair wisecomparisons at each level of the hierarchy, a matrix can be developed, where the entities indicate thestrength with which one element dominates another with respect to a given criterion.
Harker and Vargas (1987) indicate that there are three principles used in the AHP for problemsolving: (1) decomposition - structures the elements of the problem into a hierarchy, (2) compara-tive judgments - generates a matrix of pair wise comparisons of all elements in a level with respect toeach related element in the level immediately above it where the principal right eigenvector of thematrix provides ratio-scaled priority ratings for the set of elements compared, and (3) Synthesis ofpriorities - generates the global or composite priority of the elements at the lowest level of thehierarchy, i.e., the alternatives. The four basic axioms that the AHP is based upon is summarized byHarker (1989) as follows:
Axiom 1. Given any two alternatives (or sub-criteria) i and j out of the set of alternatives A, thedecision maker is able to provide a pair wise comparison aij of these alternatives under any criterionc from the set of criteria C on a ratio scale which is reciprocal; i.e., aji = 1 / aij for all i, j, & A.
Axiom 2. When comparing any two elements i, j, & A, the decision maker never judges one to beinfinitely better than another under any criterion c & C; i.e., aij ≠ for all i, j, & A.
Axiom 3. One can formulate the decision process as a hierarchy.
Axiom 4. All criteria and alternatives which impact the given decision problem are represented by ahierarchy. That is, all the decision-maker’s intuition must be represented, or excluded, in terms ofcriteria and alternatives in the structure and be assigned priorities which are compatible with theintuition.
METHODS
Data Collection
Primary data
A disguised mail questionnaire was sent to over 1300 decision makers to collect primary data con-cerning important non-structural factors (criteria) that influence the bridge material decision. Par-ticipants were asked to assume the bridge site allowed for equal choice of material. This was meantto eliminate physical or site-specific characteristics that may influence the material choice.
Decision makers in 28 states were classified into five distinct geographic regions (Table 2) and threedecision-making groups. The groups were state DOT engineers, private consulting engineers, andlocal highway officials. Survey respondents were asked to rate 23 non-structural criteria in theselection of a bridge material (Table 1). The questionnaire used rating scales from 1 to 7 to measurethe importance of the criteria. Criteria were selected by an extensive secondary literature search,discussions with civil engineers across the United States, and interviews with University personnel.
4
A pretest was conducted with bridge engineers in various decision groups in Virginia, Wisconsin,and Minnesota. After minor clarification of question wording, the questionnaire was sent out inApril 1993. No correspondence stated that the study was being conducted by the Department ofWood Science at Virginia Tech since it was believed this may bias some results or have an undesir-able effect on the response rate. After two mailings, a total of 848 surveys were returned, 751 ofwhich were usable, resulting in an adjusted response rate of 61%.
Non-Response - In order to test for non-response bias, 50 non-respondents were contacted by tele-phone and asked to answer selected questions. These individuals represented the three primarydecision-making groups. They were asked questions concerning material preference, ratings ofimportant bridge material factors, timber design education, and job duties. Multivariate Analysis ofVariance (MANOVA) was utilized to determine if significant differences existed between respon-dents and non-respondents on the selected parameters. In no case could the hypothesis of no differ-ence between respondents and non-respondents be rejected = .05).
Personal Interviews
During August, September, and October of 1993, semi-structured interviews were conducted with73 design engineers and highway officials in four selected states: Mississippi, Virginia, Washing-ton, and Wisconsin. These states were chosen based on their geographic differences, timber re-sources, and bridge decision-making protocol. Participating in this were state department of trans-portation engineers involved in preliminary design or local bridge maintenance/replacement deci-sions, private consulting engineers involved with local bridge design, and county highway officials.Interviews with county officials and private consultants were limited to one engineer per location.
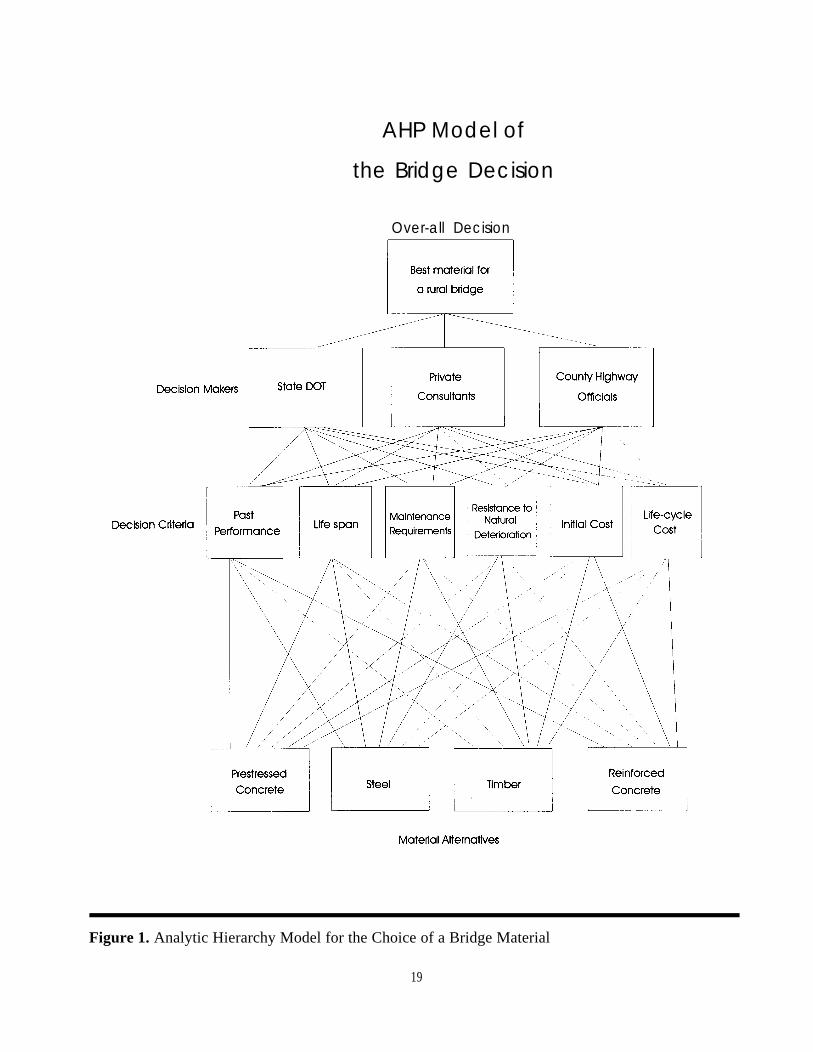
Composite AHP models were developed for each group of decision makers in the four separatestates (Figure 1). A questionnaire was designed for participants to use for completion of the AHPmodel. This questionnaire consisted of paired comparisons among the six highest ranked criteriainvolved in the decision process (Table 3) as determined by the initial survey. It also includedcomparisons among the different types of bridge material with respect to each criteria. A ratingscale from 1 to 7, as recommended by Saaty (1980), was used for the paired comparisons. TheNumber 1 value indicated that compared factors were equal in importance and Number 7 indicatedthat one factor was extremely more important than another. This questionnaire was reviewed byqualified personnel at Virginia Tech and pretested with private consultants and state DOT engineersin Virginia.
Each decision maker made 51 paired comparisons to complete their individual AHP model. Thecomputer program, Expert Choice (1992), assisted in development and analysis of the models. Alap-top computer was used to input the data to Expert Choice as each official responded to thequestionnaire. This allowed immediate feedback to the decision maker on his/her preferences andoverall choice of a bridge material. Individual results were then combined as geometric means toproduce group decisions representing the separate decision-making groups in each state.
5
The balance of the interview was exploratory in nature. Responses were recorded for interpretationand analysis. Specific areas of interest included: bridge costs, best locations for timber bridges,concerns with timber as a bridge material, guidelines on timber use, amount of bridge work in state,best material for short span bridges, reasons the state doesn’t use more timber in bridges, biddingprocesses within the state, and factors that would allow the state to use more timber bridges.
States
Mississippi - This state is located in the heart of the southern pine resource and is one of the stateshaving the highest number of timber bridges (more than 3,500) (FHWA 1993). Design decisionmakers in Mississippi include state DOT and county engineers. The county engineer is a privateconsultant hired by the county board of supervisors for a 4-year term. This consultant sometimesserves as many as five different counties. All bridges utilizing Federal Highway bridge replacementfunds or state funds must be designed by the county engineer. The Mississippi DOT, which admin-isters funding and reviews bridge plans, is divided into two sections: (1) the secondary roads divi-sion which directs the local roads program and (2) the DOT which directs state and federal highwayprograms. Both divisions are strong supporters of standardized bridge plans, which at the time of theinterviews did not include plans for timber. More than 70% of the nearly 12,000 state bridges fallunder local/county jurisdiction (USDA 1989).
Virginia - This Mid-Atlantic state has a large eastern hardwood and southern pine timber resourcebase and is one of the states with the lowest number of timber bridges (less than 60) (FHWA 1993).The state DOT maintains more than 97% of the state’s bridges. Virginia is divided into nine high-way districts, with a chief bridge engineer directing maintenance and replacement activities withineach district. Private consultants are used occasionally when the work load is too great for thedistrict engineers to handle. Virginia utilizes standard bridge plans that do not include completeplans for timber bridges. Temporary structures and timber plank on steel stringers are the onlystandard type plans available.
Washington - Located in the Pacific-Northwest, Washington has a large softwood timber resource.Yet, only 600 of the state’s nearly 7,000 bridges are timber. Three decision-making groups areinvolved in bridge replacement in Washington. The state DOT has a local program engineer whoworks with counties on bridge replacements, and a staff of engineers in the central office that designstate and federal highway bridges. Private consulting engineers are often hired by counties to designtheir rural bridges. Each county in Washington is required to have a registered civil engineer on staffto oversee local highway maintenance. This engineer or his/her assistant will often design a ruralbridge. Sixty-five percent of the state’s bridges fall under local control. Washington utilizes stan-dard plans; however, the only plans for timber are for temporary structures, such as detours.
Wisconsin - Located in the upper Midwest, Wisconsin is one of only five states that has shown anincrease in timber bridges from 1986 to 1992 (FHWA 1992). Over 500 of the state’s nearly 12,000bridges are classified as timber. Three groups of decision makers are involved in design decisions inWisconsin. The state Department of Transportation (DOT) is divided into eight highway districts,each with a bridge engineer that works with counties on maintenance and replacement. Privateconsultants are hired by counties to design rural bridges. County highway commissioners are re-
6
RESULTS
sponsible for maintenance of local, state, and Federal highways within their county boundaries. Thecounty highway commissioner does not have to be an engineer, but the trend is to hire engineers inthat position. The commissioner, in most cases, is appointed by the board of supervisors for a 2- or4-year term. Wisconsin has standard bridge plans that do include plans for timber bridges.
The most important non-structural factors (criteria) rated by all decision-making groups across everyregion of the United States include: expected life of material, material’s past performance, mainte-nance requirements, resistance to natural deterioration, initial cost, and life-cycle cost of material(Table 3). Six criteria were chosen because of their importance, statistical significance from theremaining factors (p < .01), and to keep the number of paired comparisons (51) for the respondentsto a minimum. These decision criteria are areas in which timber manufacturers need to address theirefforts to promote timber bridges more successfully. All six criteria were used in the models subse-quently developed using the AHP.
To determine if the four selected states (Mississippi, Virginia, Washington, and Wisconsin) wererepresentative of their respective geographic regions, a Multivariate Analysis of Variance(MANOVA) was run on the selected criteria between the individual state and its region. No signifi-cant difference = .05) between each state and its region on these six factors was apparent. Analysisof Variance was used to determine if the states differed from others in the respective regions basedon perceptions of timber as a bridge material. Again, no statistical differences could be shown.These results indicate that each state is representative of the region in which it is located and shouldprovide a good indicator of bridge decision making in that region.
The AHP for Wisconsin Counties
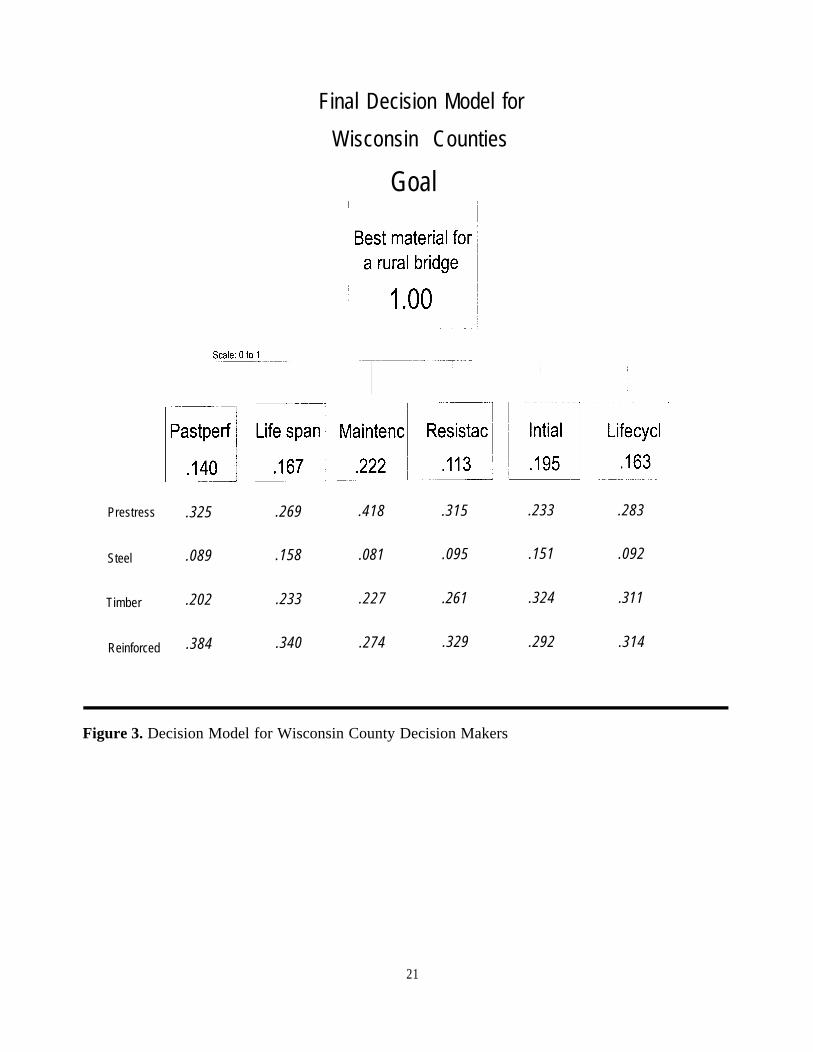
To demonstrate how an AHP model is developed, an example based on county decision makers inWisconsin is provided. In August 1993, nine county highway commissioners/engineers agreed toparticipate in completing the paired comparison questionnaire. The counties were geographicallydispersed across Wisconsin, and respondents were either county engineers or county highway com-missioners. The purpose of the interview was explained and as the official filled out the question-naire, the responses were entered into a personal computer using the program, Expert Choice. First,paired comparisons were made among the six important bridge criteria. Under each criteria, pairedcomparisons were made for preferences of bridge materials. Exploratory questions regarding bridgereplacement decisions were discussed at that time. At the completion of the nine interviews, indi-vidual results were geometrically averaged, and one composite matrix was developed (Table 4)representing county decision makers in Wisconsin.
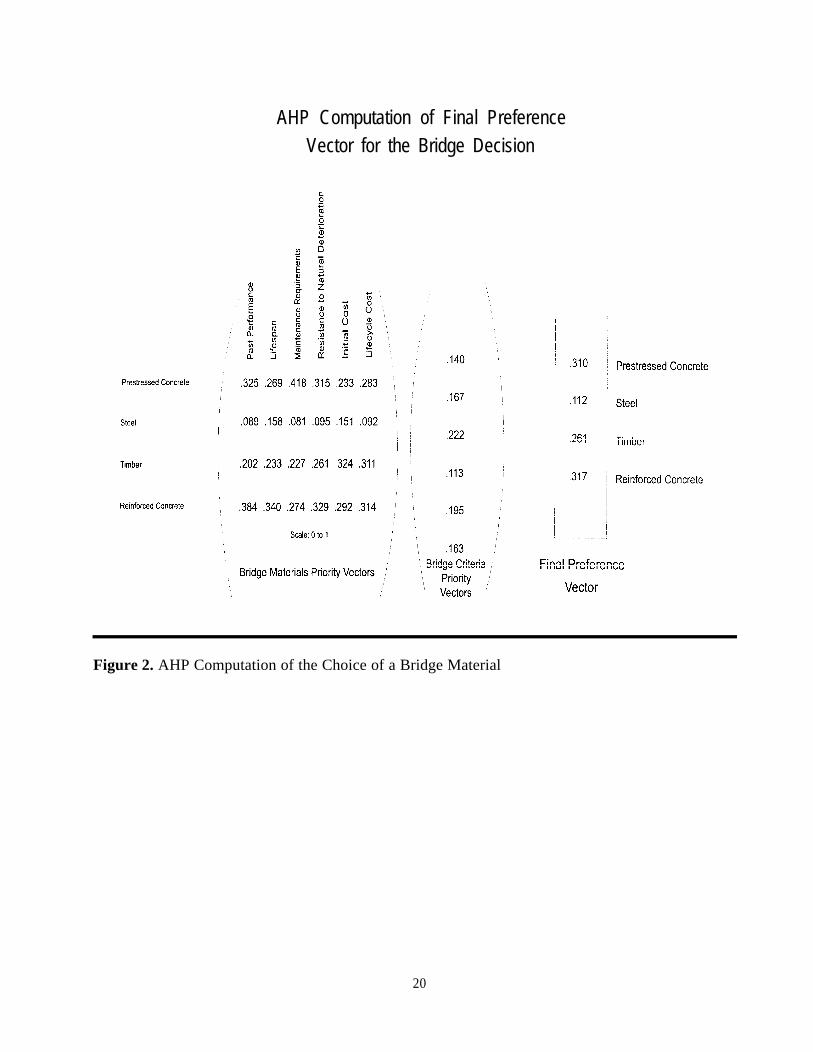
Calculation of a final priority vector for bridge material preference proceeds in the following way.First, the data in the bridge criteria matrix are normalized by column. Second, the values in each roware averaged to produce a vector of priorities for each bridge criterion (Table 5). Third, similarcalculations are then repeated for each matrix of material preference under a given bridge criterion
7
(Tables 6-7). Upon completion of these steps, the final composite preference vector for bridgematerial is the matrix product of (1) the matrix composed of bridge material preference vectors and(2) the vector of bridge criteria (Figure 2). This is the choice of bridge material for the decisionmaker (in this case, county highway commissioners/engineers in Wisconsin) based upon the criteriameasured (Figure 3).
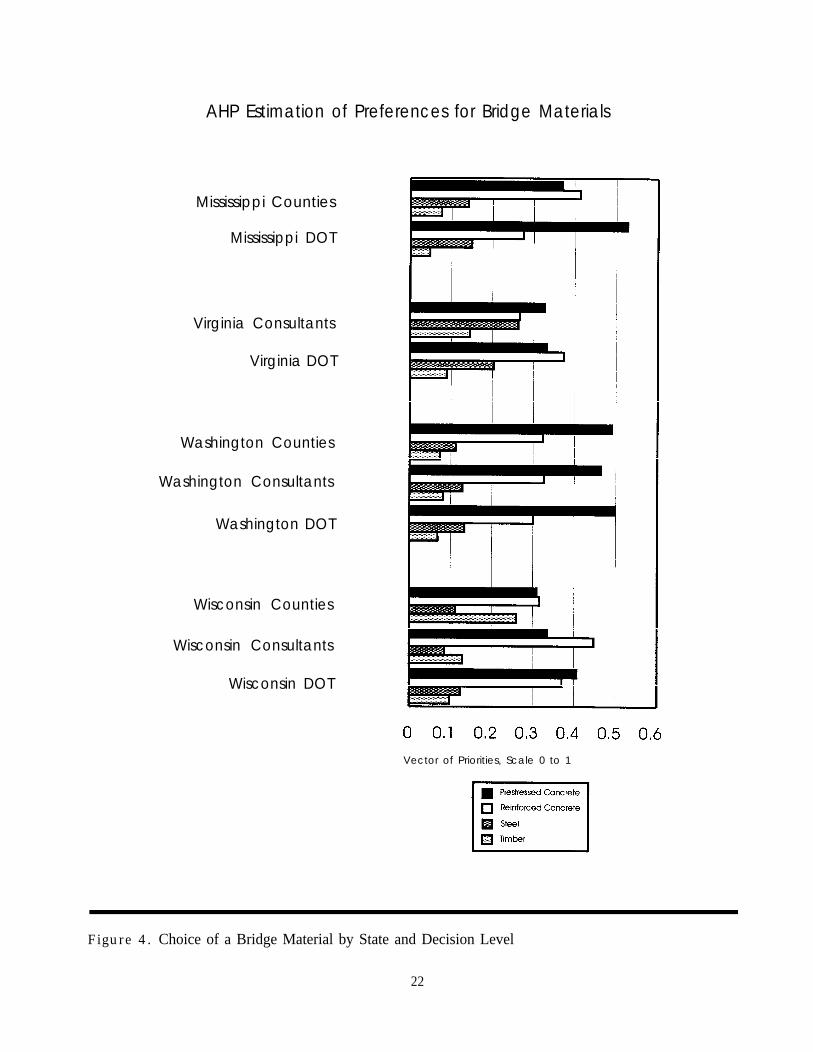
This process was repeated with engineers and highway officials in the four selected states. Compos-ite models were developed for each group in each state. Overall material decisions were calculatedfor each decision maker by state (Figure 4). Expert Choice also calculates an inconsistency ratio,which is a measure of how consistent a respondent is with the paired comparisons. That is, forcomparisons among entities A, B, and C, the preference of A over C should equal the product of thepreference of A over B and the preference of B over C, for the judgments to be consistent. Saaty(1980) states that an inconsistency ratio of less than 0.1 is excellent. Nevertheless, some inconsis-tency is inherent in most decision processes and should not necessarily be eliminated. The inconsis-tency ratios for aggregate responses of these decision-maker groups were all much less than 0.1.Table 8 summarizes the results of each state’s models.
Individual decision models can be combined arithmetically to perform statistical analysis (Saaty1993). To determine if differences existed between states or decision-making groups, non-paramet-ric statistical procedures were utilized. Non-parametric procedures are recommended when samplesize is small or the distribution of the population from which the data is obtained is uncertain (Hol-lander and Wolfe 1973). The importance of the six major criteria in the bridge decision are quiteuniform across decision-making groups and between states (Table 9). Only for the criteria of main-tenance did significant differences < .05) exist between the four states. This agrees with earlierfindings by the authors that major criteria are similar by groups and regions.
Among the three major decision groups (DOT, private engineers, and local officials) aggregatedacross the four states, differences existed in the choices of steel and timber. Among the four statesand the three decision groups, only reinforced concrete was not statistically different. In the states ofVirginia and Wisconsin, differences existed between decision makers’ preferences for timber. Bothprestressed concrete and reinforced concrete were deemed to have different preferences acrossdecision groups in Mississippi. Only in Washington were the preferences for bridge materials notstatistically different by decision group. These results indicate that even though decision criteria areviewed similarly, the extent to which various bridge materials are perceived as meeting those criteriavaries between states and between decision-making groups.
Sensitivity analysis was run on each model’s bridge decision criteria to determine if increasingefforts in one or more areas would affect the bridge decision. Department of Transportation engi-neers favored prestressed concrete. This may be attributed to their exposure to state and federalhighway bridges and a lack of familiarity with timber design. Private consultants and county offi-cials favored prestressed and reinforced concrete for rural bridges.
In Mississippi, only if initial cost became extremely important would county engineers considerusing timber instead of steel in their decisions. No changes would affect the Mississippi DOTengineers’ decisions concerning timber. Virginia private consultants would choose timber above allother materials if initial cost became very important. Nothing would affect the decision of DOT
8
engineers in Virginia. In Washington, as initial cost became more important, local engineers andprivate consultants favored timber over steel, but never over concrete. Again, no changes wouldaffect the decision of Washington DOT engineers. Wisconsin local engineers would prefer timberas initial cost became very important, and DOT engineers favored timber over steel when mainte-nance became increasingly important. Nothing affected Wisconsin private consultants’ decision.
CONCLUSIONS
Decision-making applications of this research indicate that the Analytic Hierarchy Process can beutilized in a group situation to assist highway officials in their choice of a bridge material. Thismodel reflects the current bridge situation in the United States, with prestressed and reinforcedconcrete being the major bridge material chosen over seventy percent of the time by highwayofficials.
Decision makers are in agreement about criteria that are important in the design decision from thelist provided. Across the United States, these individuals rated the most important criteria similarlyby region and decision group. Maintenance requirements, initial cost, and past performance werethe most influential criteria in choosing a bridge material. However, these criteria, when applied tothe AHP decision models, influenced the choice of bridge material differently. Nevertheless, pre-stressed concrete and reinforced concrete were the materials of choice by every group in each state.
These results indicate that initial cost may be a competitive advantage for timber in bridge design.However, timber is rated so low, based upon the other five criteria, that it will very seldom bechosen as a rural bridge material. AS little can be done with the criteria of past performance of abridge material, educational efforts are needed emphasizing that modern designed timber bridges arenot the same as timber bridges built 40 to 50 years ago. Modern prestressed composites of steel andtimber can perform as well, if not better, than other materials. In addressing the criteria of mainte-nance, modern composites of steel and wood should reduce deflection and movement in timberbridges, which may have caused many of the past problems. Resistance to natural deterioration canbe improved by building structures with water-shedding joints, good preservative treatments, andwaterproof surfaces. Stressed-type timber bridge systems should reduce the amount of water move-ment between wood members. Realistic comparisons of all bridge materials need to be made basedon past design and construction practices. Concrete and steel structures may be performing better,because more of them have been built to modern standards than timber. Life span and life-cycle costwill both improve as timber lasts longer and becomes more competitive in the marketplace.
During interviews, questions were also asked about the problems with timber. In Mississippi,Virginia, and Washington a primary concern was life span. Engineers in each state indicated thattreated timber is being replaced after 25 to 30 years in service. Initial cost of timber was a factor inmost states. Timber is not perceived as cost competitive. Cost of timber, therefore, cannot influ-ence the decision over other bridge materials. Because timber decays from the inside to the outside,inspection is more difficult for untrained engineers. This also increases the risk of using timber inbridge design as perceived by the highway official. The maintenance requirements of timber com-
9
pared to the other materials were seen as a deterrent to its use. Environmental concerns with woodpreservatives and the timber resource supply were raised by Washington and Mississippi highwayofficials.
With state DOT engineers controlling the allocation of Federal highway funds, efforts must be madeto convince the opinion leaders in this group that timber is a viable bridge material. Since this groupchose timber the least in the bridge decision, every effort is needed to demonstrate the attributes oftimber used in modern designs for rural bridges. To improve timber’s perception by engineers,manufacturers need to address timber’s short life span and maintenance requirements in a bridgesituation.
Marketing applications of this work indicate that timber manufacturers may need to address othercriteria besides those measured in this study to increase timber’s market share. Other importantbridge criteria that timber may compete on include ease of repair, time of traffic interruption, resis-tance to deicing chemicals, and aesthetics. Rural roads with county control offer the greatest oppor-tunity for timber use, since individuals responsible for making these bridge decisions choose timbermore often than DOT engineers. Manufacturers may want to look at other areas in which timbermay be successful. Railroads, footbridges, light traffic bridges, and scenic covered bridges may offerfurther opportunities for timber in bridge applications.
LITERATURE CITED
Clapp, V., 1990. “Timber Bridges in the Real World,” Wood Design Focus, Fall: 19-20.
Cooper, R., 1988. “Predevelopment Activities Determine New Product Success,” IndustrialMarketing Management 17:237-247.
Day, R. and Herbig, P., 1990. “How the Diffusion of Industrial Innovations is Different from NewRetail Products,” Industrial Marketing Management, 19:261-266.
Drucker, P., 1984. Marketing Management, 5th Edition, Englewood Cliffs, NJ: Prentice Hall, p. 1.
Drucker, P., 1983. “Managing for Business Effectiveness,” Strategic Management, New York, NY,John Wiley and Sons Inc., pp. 64-77.
Ellen, P., Bearden, W., and Sharma, S., 1991. “Resistance to Technological Innovations: AnExamination of the Role of Self-Efficacy and Performance Satisfaction,” Journal ofMarketing Research, Vol. 19(4):297-307.
Expert Choice, 1992. Decision Support Software, Expert Choice Inc., Pittsburgh, PA, Version 8.
10
FHWA, Federal Highway Administration, 1992. “National Bridge Inventory Data,” U.S. Departmentof Transportation, Federal Highway Administration.
FHWA, Federal Highway Administration, 1993. “National Bridge Inventory Data,” U.S. Departmentof Transportation, Federal Highway Administration.
Harker, P. and Vargas, L., 1987. “The Theory of Ratio Scaled Estimation: Saaty’s AnalyticHierarchy Process,” Management Science, Vol.33 (11):1383-1403.
Harker, P., 1989. “The Art and Science of Decision Making: The Analytic Hierarchy Process,” TheAnalytic Hierarchy Process: Applications and Studies, New York, NY: Springer-Verlag, pp.2-28.
Hollander, M., and Wolfe, D., 1973. Nonparametric Statistics, New York, NY: John Wiley andSons Inc.
Hopkins, D.S. and Bailey, E. L., 1971. New Pressures, Conference Board Record 8, pp. 16-24.
Hopkins, D. L., 1980. New Products Winners and Losers, Report #773, The Conference Board.
Johnson, K., 1990. Timber Bridge Design, Engineering and Construction Manual produced byWheeler Consolidated, St. Louis Park, MN. 4th edition.
Levitt, T., 1991. Thinking About Management, New York, NY: The Free Press.
Luppold, H.M. and Associates, 1990. Southern Pine Usage and Timber Bridge Status of Ten
NCIB,
Southeastern State Highway Departments, Holly Hill, SC.
National Industrial Conference Board, 1964. Why New Products Fail, The NationalIndustrial Conference Board Record, New York.
Patton, M., 1990. Qualitative Evaluation and Research Methods, Sage Publications, 2nd edition,Newbury Park.
Ritter, M., 1990. Timber Bridges: Design, Construction, Inspection, and Maintenance, WashingtonDC., p. 13-1.
Saaty, J., 1993. Expert Choice: Decision Support Software User Manual, Expert Choice Inc.,Pittsburgh, PA, Version 8, p. 90.
Saaty, T., 1980. The Analytic Hierarchy Process, New York, NY: McGraw Hill.
Scott, J. and Keiser, S., 1984. “Forecasting Acceptance of New Industrial Products with JudgmentModeling,” Journal of Marketing, 48, (Spring) :54-67.
Sinclair, S., 1992. Forest Products Marketing, New York, NY: McGraw Hill, Inc., 403p.
11
Stanton, W. J., 1978. Fundamentals of Marketing, New York, NY: McGraw-Hill.
TBI, Timber Bridge Initiative, 1990. Crossings Newsletter, sponsored by the Timber BridgeInformation Resource Center, Morgantown, WV.
USDA, United States Department of Agriculture, 1993. The National Timber Bridge Initiative - AStatus Report, U.S. Dept. of Agriculture, Forest Service, Washington, DC.
USDA, United States Department of Agriculture, 1989. “Rural Bridges: An Assessment Basedupon the National Bridge Inventory,” Office of Transportation, Transportation Report,Washington DC.
12
Table 1. Criteria in Determination of Bridge Material
Government researchefforts
Life-cycle cost ofmaterial
Resistance to naturaldeterioration
Expected life of material
Length of trafficinterruption
Maintenance requirements
Initial cost of material
Bridge loading variations
Standards specifiedby AASHTO
Past performance of thematerial in bridges
Contractor’s familiaritywith material
Bridge ownership(state, county, town)
Designers familiaritywith material
Industrial promotionalefforts
Aesthetics
Daily traffic count
Material preferenceof local officials
Availability of designinformation
Resistance tode-icing chemicals
Regular inspectionrequirements
Impact on local economy
Environmentalconsiderations
Ease of repair
Table 2. States Surveyed for Important Bridge Factors
West South Mid-Atlantic Northeast Midwest
California Alabama Kentucky Maine IndianaIdaho Arkansas North Carolina Massachusetts IllinoisMontana Florida Tennessee New York IowaOregon Louisiana Virginia Pennsylvania MichiganWashington Mississippi West Virginia Vermont Minnesota
Texas OhioWisconsin
13
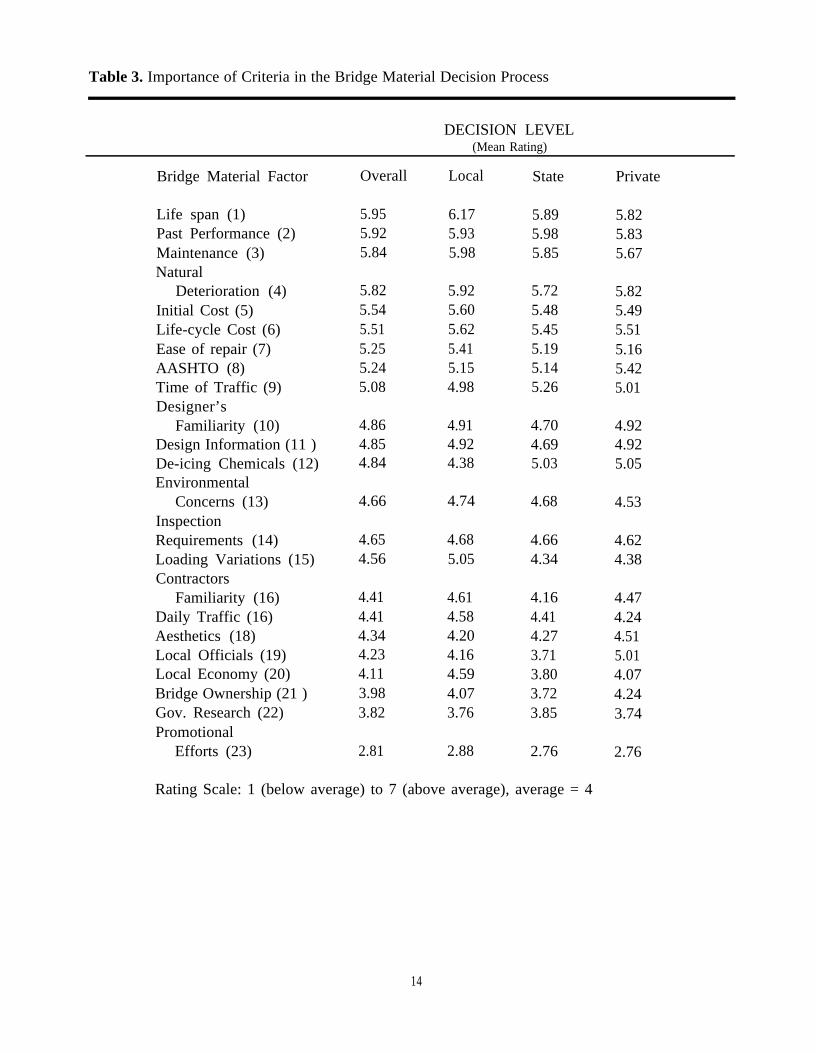
Table 3. Importance of Criteria in the Bridge Material Decision Process
DECISION LEVEL(Mean Rating)
Bridge Material Factor
Life span (1)Past Performance (2)Maintenance (3)Natural
Deterioration (4)Initial Cost (5)Life-cycle Cost (6)Ease of repair (7)AASHTO (8)Time of Traffic (9)Designer’s
Familiarity (10)Design Information (11 )De-icing Chemicals (12)Environmental
Concerns (13)InspectionRequirements (14)Loading Variations (15)Contractors
Familiarity (16)Daily Traffic (16)Aesthetics (18)Local Officials (19)Local Economy (20)Bridge Ownership (21 )Gov. Research (22)Promotional
Efforts (23)
Overall
5.955.925.84
5.825.545.515.255.245.08
4.864.854.84
4.66
4.654.56
4.414.414.344.234.113.983.82
2.81
Local
6.175.935.98
5.925.605.625.415.154.98
4.914.924.38
4.74
4.685.05
4.614.584.204.164.594.073.76
2.88
State
5.895.985.85
5.725.485.455.195.145.26
4.704.695.03
4.68
4.664.34
4.164.414.273.713.803.723.85
2.76
Private
5.825.835.67
5.825.495.515.165.425.01
4.924.925.05
4.53
4.624.38
4.474.244.515.014.074.243.74
2.76
Rating Scale: 1 (below average) to 7 (above average), average = 4
14
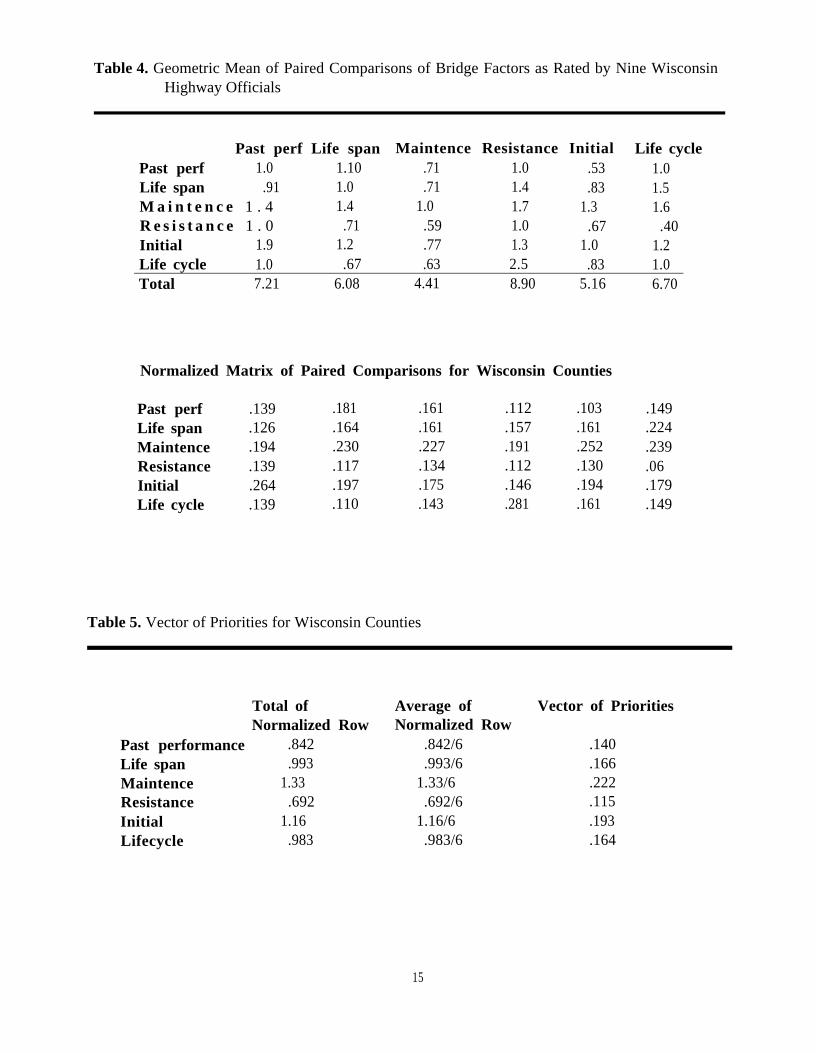
Table 4. Geometric Mean of Paired Comparisons of Bridge Factors as Rated by Nine WisconsinHighway Officials
Past perf Life span Maintence Resistance Initial Life cyclePast perf 1.0 1.10 .71 1.0 .53 1.0Life span .91 1.0 .71 1.4 .83 1.5M a i n t e n c e 1 . 4 1.4 1.0 1.7 1.3 1.6R e s i s t a n c e 1 . 0 .71 .59 1.0 .67 .40Initial 1.9 1.2 .77 1.3 1.0 1.2Life cycle 1.0 .67 .63 2.5 .83 1.0Total 7.21 6.08 4.41 8.90 5.16 6.70
Normalized Matrix of Paired Comparisons for Wisconsin Counties
Past perf .139 .181 .161 .112 .103 .149Life span .126 .164 .161 .157 .161 .224Maintence .194 .230 .227 .191 .252 .239Resistance .139 .117 .134 .112 .130 .06Initial .264 .197 .175 .146 .194 .179Life cycle .139 .110 .143 .281 .161 .149
Table 5. Vector of Priorities for Wisconsin Counties
Total ofNormalized Row
Past performance .842Life span .993Maintence 1.33Resistance .692Initial 1.16Lifecycle .983
Average of Vector of PrioritiesNormalized Row
.842/6 .140
.993/6 .1661.33/6 .222.692/6 .115
1.16/6 .193.983/6 .164
15
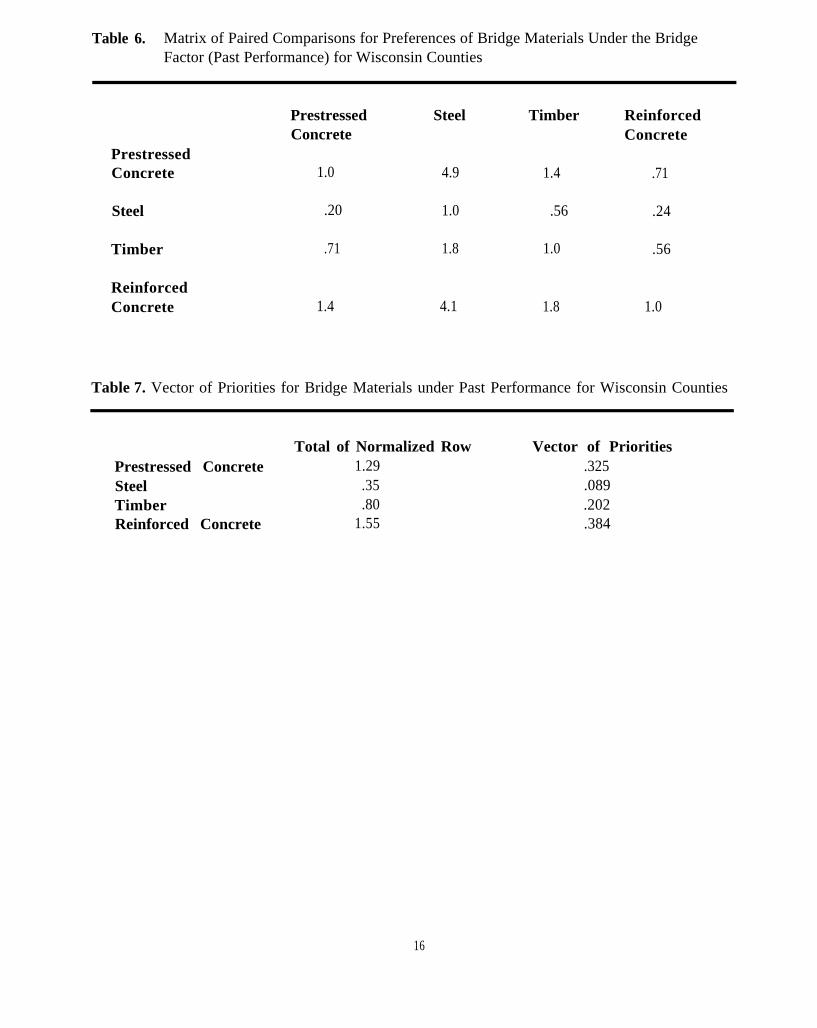
Table 6. Matrix of Paired Comparisons for Preferences of Bridge Materials Under the BridgeFactor (Past Performance) for Wisconsin Counties
.20
.71
4.9 1.4
Prestressed Steel Timber ReinforcedConcrete Concrete
PrestressedConcrete 1.0 .71
Steel
Timber
ReinforcedConcrete 1.4 4.1 1.8 1.0
1.0
1.8
.56
1.0
.24
.56
Table 7. Vector of Priorities for Bridge Materials under Past Performance for Wisconsin Counties
Total of Normalized Row Vector of PrioritiesPrestressed Concrete 1.29 .325Steel .35 .089Timber .80 .202Reinforced Concrete 1.55 .384
16
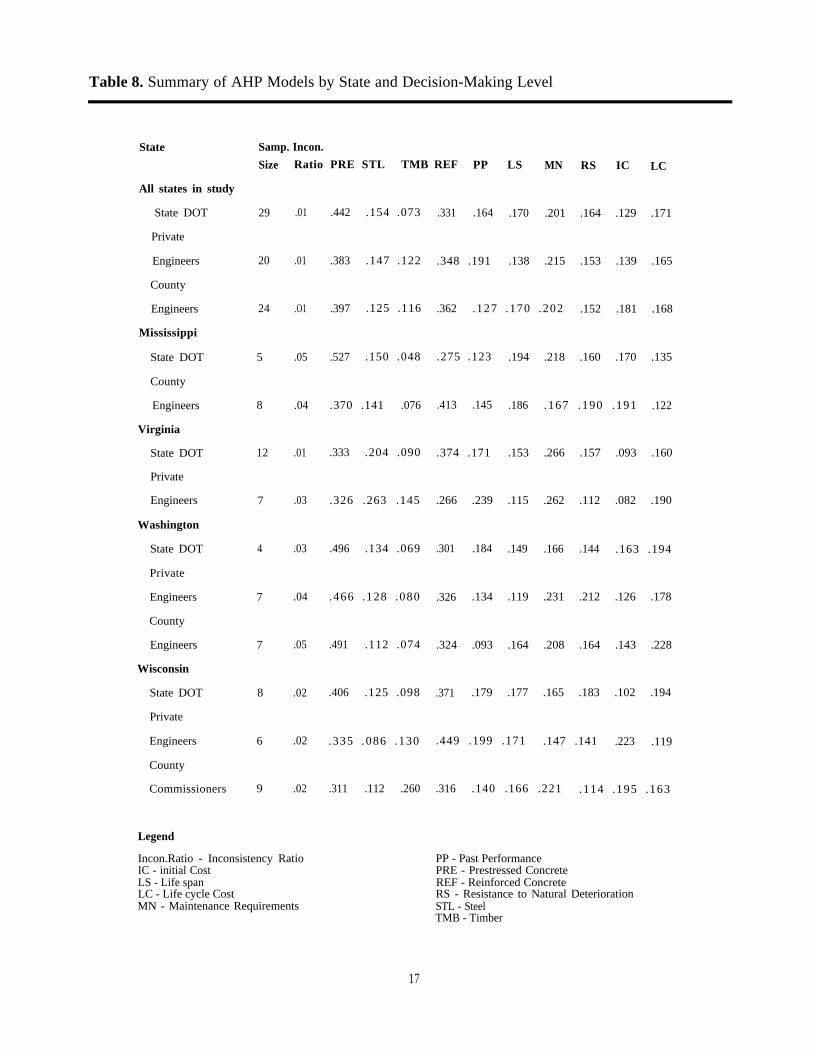
Table 8. Summary of AHP Models by State and Decision-Making Level
State
All states in study
State DOT
Private
Engineers
County
Engineers
Mississippi
State DOT
County
Engineers
Virginia
State DOT
Private
Engineers
Washington
State DOT
Private
Engineers
County
Engineers
Wisconsin
State DOT
Private
Engineers
County
Commissioners
Legend
Samp. Incon.
Size
29
20
24
5
8
12
7
4
7
7
8
6
9
Ratio PRE STL TMB REF PP LS MN RS IC LC
.01
.01
.O1
.05
.04
.01
.03
.03
.04
.05
.02
.02
.02
Incon.Ratio - Inconsistency RatioIC - initial CostLS - Life spanLC - Life cycle CostMN - Maintenance Requirements
.442 .154 .073
.383 .147 .122
.397 .125 .116
.527 .150 .048
.370 .141 .076
.333 .204 .090
.326 .263 .145
.496 .134 .069
.466 .128 .080
.491 .112 .074
.406 .125 .098
.335 .086 .130
.311 .112 .260
.331 .164 .170 .201 .164 .129 .171
.348 .191 .138 .215 .153 .139 .165
.362 .127 .170 .202 .152 .181 .168
.275 .123 .194 .218 .160 .170 .135
.413 .145 .186 .167 .190 .191 .122
.374 .171 .153 .266 .157 .093 .160
.266 .239 .115 .262 .112 .082 .190
.301 .184 .149 .166 .144 .163 .194
.326 .134 .119 .231 .212 .126 .178
.324 .093 .164 .208 .164 .143 .228
.371 .179 .177 .165 .183 .102 .194
.449 .199 .171 .147 .141 .223 .119
.316 .140 .166 .221 .114 .195 .163
PP - Past PerformancePRE - Prestressed ConcreteREF - Reinforced ConcreteRS - Resistance to Natural DeteriorationSTL - SteelTMB - Timber
17
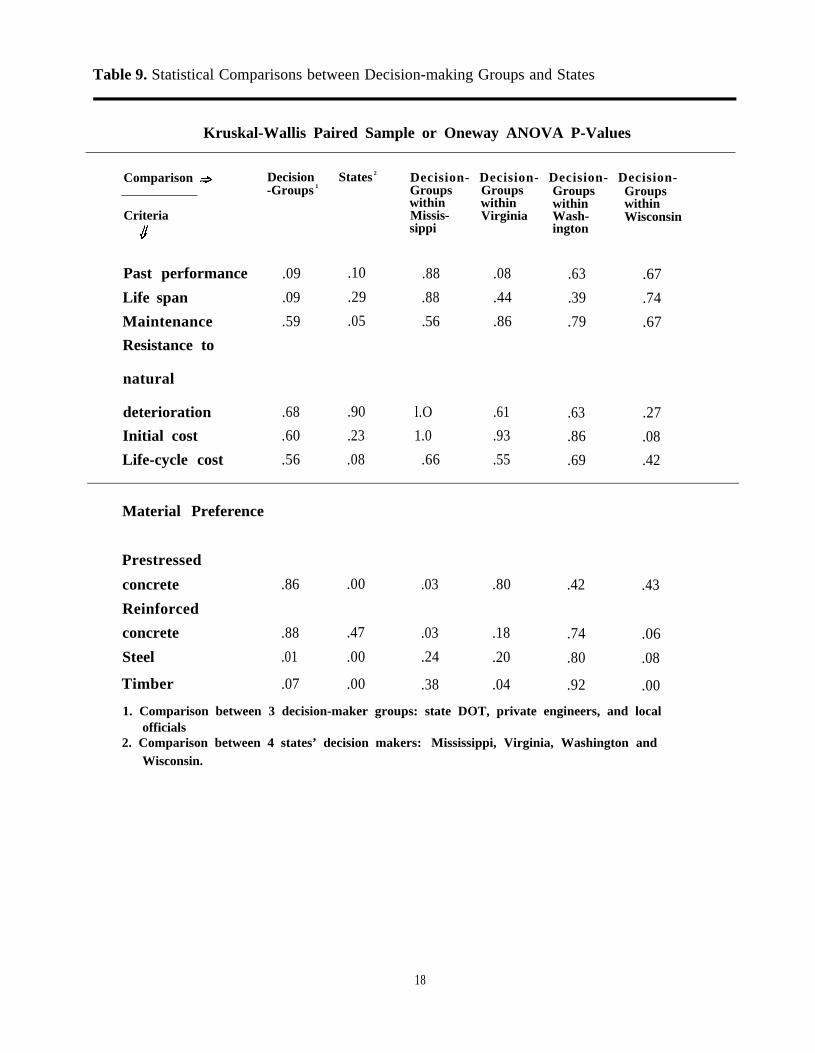
Table 9. Statistical Comparisons between Decision-making Groups and States
Kruskal-Wallis Paired Sample or Oneway ANOVA P-Values
Comparison Decision States 2 Decision- Decision- Decision- Decision--Groups 1 Groups Groups Groups Groups
within within within withinCriteria Missis- Virginia Wash- Wisconsin
sippi ington
Past performance .09 .10 .88 .08 .63 .67
Life span .09 .29 .88 .44 .39 .74
Maintenance .59 .05 .56 .86 .79 .67
Resistance to
natural
deterioration .68 .90 l.O .61 .63 .27
Initial cost .60 .23 1.0 .93 .86 .08
Life-cycle cost .56 .08 .66 .55 .69 .42
Material Preference
Prestressed
concrete .86 .00 .03 .80 .42 .43
Reinforced
concrete .88 .47 .03 .18 .74 .06
Steel .01 .00 .24 .20 .80 .08
Timber .07 .00 .38 .04 .92 .00
1. Comparison between 3 decision-maker groups: state DOT, private engineers, and localofficials
2. Comparison between 4 states’ decision makers: Mississippi, Virginia, Washington andWisconsin.
18
AHP Model of
the Bridge Decision
Over-all Decision
Figure 1. Analytic Hierarchy Model for the Choice of a Bridge Material
19
AHP Computation of Final PreferenceVector for the Bridge Decision
Figure 2. AHP Computation of the Choice of a Bridge Material
20
Final Decision Model for
Wisconsin Counties
Prestress
Steel
Timber
Reinforced
.325
.089
.202
.384
.269
.158
.233
.340
Goal
.418
.081
.227
.274
.315
.095
.261
.329
.233
.151
.324
.292
.283
.092
.311
.314
Figure 3. Decision Model for Wisconsin County Decision Makers
21
AHP Estimation of Preferences for Bridge Materials
Mississippi Counties
Mississippi DOT
Virginia Consultants
Virginia DOT
Washington Counties
Washington Consultants
Washington DOT
Wisconsin Counties
Wisconsin Consultants
Wisconsin DOT
Vector of Priorities, Scale 0 to 1
Figure 4. Choice of a Bridge Material by State and Decision Level
22

For more information contact:
Program DirectorUSDA Forest Service
Timber Bridge Information Resource Center180 Canfield Street
Morgantown, WV 26505Phone: 304-285-1651


![SEAlang Projects · North-East India as a linguistic area Dipankar MORAL Gauhati University 1. Introduction l.] Language situation in the northeastern part of India The northeastern](https://img.pdfslide.us/doc/110x75/604a30c4ea5e0c56533df3e5/sealang-north-east-india-as-a-linguistic-area-dipankar-moral-gauhati-university.jpg)