Embed Size (px)
Citation preview
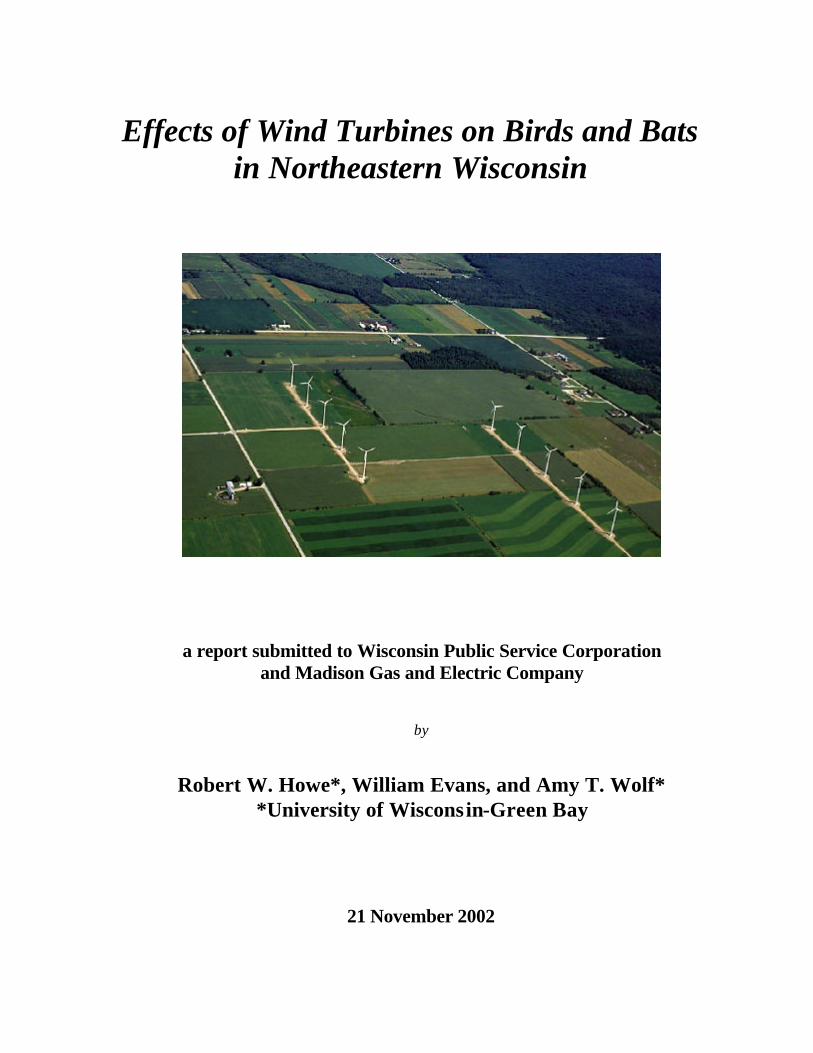
Effects of Wind Turbines on Birds and Bats in Northeastern Wisconsin
a report submitted to Wisconsin Public Service Corporation and Madison Gas and Electric Company
by
Robert W. Howe*, William Evans, and Amy T. Wolf* *University of Wisconsin-Green Bay
21 November 2002
i
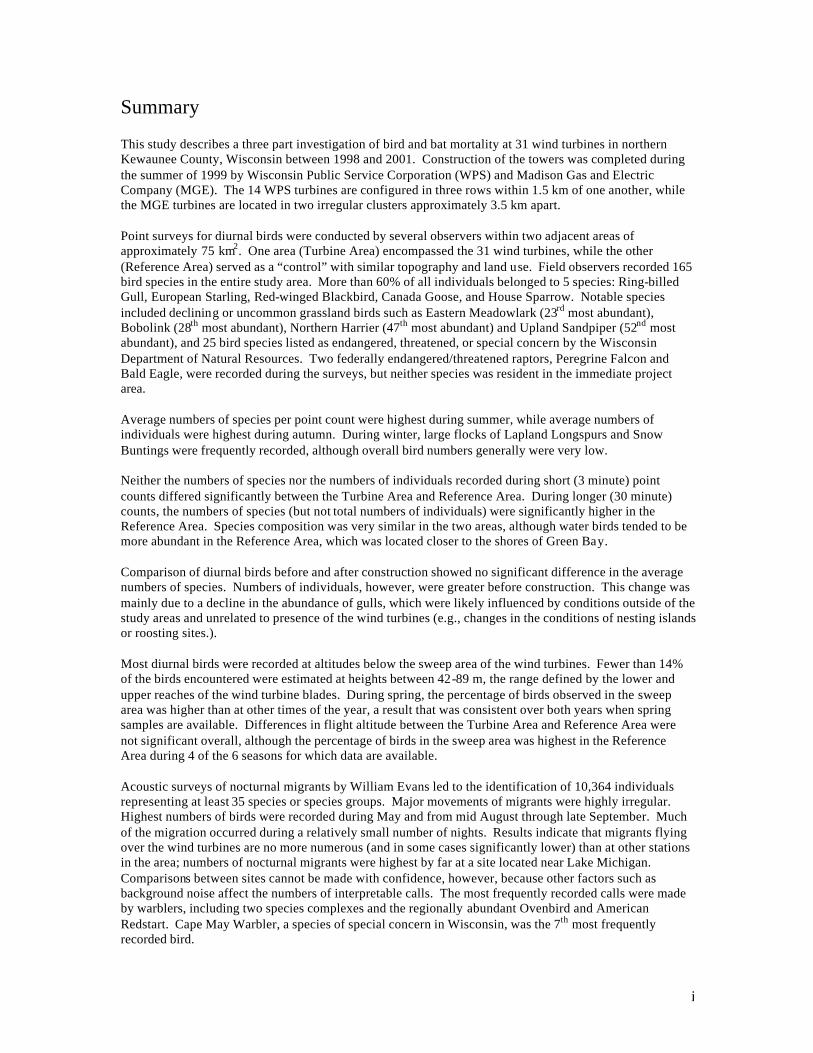
Summary This study describes a three part investigation of bird and bat mortality at 31 wind turbines in northern Kewaunee County, Wisconsin between 1998 and 2001. Construction of the towers was completed during the summer of 1999 by Wisconsin Public Service Corporation (WPS) and Madison Gas and Electric Company (MGE). The 14 WPS turbines are configured in three rows within 1.5 km of one another, while the MGE turbines are located in two irregular clusters approximately 3.5 km apart. Point surveys for diurnal birds were conducted by several observers within two adjacent areas of approximately 75 km2. One area (Turbine Area) encompassed the 31 wind turbines, while the other (Reference Area) served as a “control” with similar topography and land use. Field observers recorded 165 bird species in the entire study area. More than 60% of all individuals belonged to 5 species: Ring-billed Gull, European Starling, Red-winged Blackbird, Canada Goose, and House Sparrow. Notable species included declining or uncommon grassland birds such as Eastern Meadowlark (23rd most abundant), Bobolink (28th most abundant), Northern Harrier (47th most abundant) and Upland Sandpiper (52nd most abundant), and 25 bird species listed as endangered, threatened, or special concern by the Wisconsin Department of Natural Resources. Two federally endangered/threatened raptors, Peregrine Falcon and Bald Eagle, were recorded during the surveys, but neither species was resident in the immediate project area. Average numbers of species per point count were highest during summer, while average numbers of individuals were highest during autumn. During winter, large flocks of Lapland Longspurs and Snow Buntings were frequently recorded, although overall bird numbers generally were very low. Neither the numbers of species nor the numbers of individuals recorded during short (3 minute) point counts differed significantly between the Turbine Area and Reference Area. During longer (30 minute) counts, the numbers of species (but not total numbers of individuals) were significantly higher in the Reference Area. Species composition was very similar in the two areas, although water birds tended to be more abundant in the Reference Area, which was located closer to the shores of Green Bay. Comparison of diurnal birds before and after construction showed no significant difference in the average numbers of species. Numbers of individuals, however, were greater before construction. This change was mainly due to a decline in the abundance of gulls, which were likely influenced by conditions outside of the study areas and unrelated to presence of the wind turbines (e.g., changes in the conditions of nesting islands or roosting sites.). Most diurnal birds were recorded at altitudes below the sweep area of the wind turbines. Fewer than 14% of the birds encountered were estimated at heights between 42-89 m, the range defined by the lower and upper reaches of the wind turbine blades. During spring, the percentage of birds observed in the sweep area was higher than at other times of the year, a result that was consistent over both years when spring samples are available. Differences in flight altitude between the Turbine Area and Reference Area were not significant overall, although the percentage of birds in the sweep area was highest in the Reference Area during 4 of the 6 seasons for which data are available. Acoustic surveys of nocturnal migrants by William Evans led to the identification of 10,364 individuals representing at least 35 species or species groups. Major movements of migrants were highly irregular. Highest numbers of birds were recorded during May and from mid August through late September. Much of the migration occurred during a relatively small number of nights. Results indicate that migrants flying over the wind turbines are no more numerous (and in some cases significantly lower) than at other stations in the area; numbers of nocturnal migrants were highest by far at a site located near Lake Michigan. Comparisons between sites cannot be made with confidence, however, because other factors such as background noise affect the numbers of interpretable calls. The most frequently recorded calls were made by warblers, including two species complexes and the regionally abundant Ovenbird and American Redstart. Cape May Warbler, a species of special concern in Wisconsin, was the 7th most frequently recorded bird.
ii
Altitude of nocturnal migrants was evaluated for 7 nights with the highest frequency of calls. Most birds flew above the sweep area of the turbine blades; based on time delays in recordings from two different microphones, approximately 20% -22% of the calls were made by birds flying within the sweep area of the turbines. The distributions of calls were highly variable yet were not clearly related to cloud cover or storms. Variations in numbers of birds flying overhead during migration are consistent with the episodic nature of bird mortality at communications towers; if any significant bird mortality occurs at wind turbines, we might expect it to be similarly episodic based on these results. No large episodes of mortality were recorded during this study period, however. During more than 1200 hr of field investigation (equally distributed among turbines) 25 bird carcasses were recovered, 13 at the WPS turbines and 12 at the MGE turbines. Two listed species were found, an immature Loggerhead Shrike (state endangered) along a road near one of the turbines and a Grasshopper Sparrow, a species of special concern in Wisconsin. The shrike was probably killed by a motor vehicle collision. Mortality was seasonal, with all but 4 carcasses appearing during the migration periods of April-May and August-October. Bat mortality at the wind turbines was nearly 3 times higher than bird mortality (72 vs. 25 specimens). Nearly all carcasses were found between mid-August and mid -September, indicating a highly seasonal pattern. All but 7 of the specimens belonged to 3 migratory species (Hoary Bat, Red Bat, and Silver-haired Bat). The spatial distribution of bird and bat carcasses suggested that the sampling area did not cover the entire area in which turbine-caused mortalities might be found. Collections along the access roads were used to adjust for this bias. Predator/scavenger removal experiments and observer efficiency experiments also were conducted to account for specimens that were overlooked. In fields where vegetation height was low (less than about 0.25 m) observer efficiency ranged from 20-72%. Predator/scavenger removal followed a fairly consistent probability of about .16 per night. By 20-22 days, all of the planted carcasses were gone. Adjusting for a larger sampling area and the bias of searching inefficiency, we estimated that the number of carcasses recovered by observers represented only about 25% of all fatal collisions. This leads to actual mortality estimates of 1.29 birds / turbine / year and 4.26 bats / turbine / year. The bird estimate is slightly lower than a national estimate of 2.19 birds based on meta-analysis (Erickson et al. 2001), while the bat estimate is similar to results from a preliminary analysis of 3 wind turbines in Tennessee (Erickson et al. 2002). Compared with other sources of human-caused bird mortality, the annual numb ers of deaths caused by the Kewaunee County wind turbines are negligible, assuming that 1999-2000 and 2000-2001 were typical years. A catastrophic mortality episode during spring or autumn migration periods is not beyond the realm of possibility, of course, especially if mortality events at communications towers serve as a guide. Because the wind turbines are lower than communications towers and wires are not used for support, the probability of such a catastrophe is nevertheless low compared with the probability of catastrophes at tall communication towers. The significance of bat mortality is less clear. Proximity of riparian forest might help explain the relatively high rates of bat mortality observed in our study compared with other recent investigations. Estimated mortality rates in Kewaunee County are similar to results from a predominantly forested landscape in Tennessee. As with birds, this level of mortality might be negligible compared with annual mortality from other sources, including human-caused mortality. Bats tend to be longer-lived and have lower reproductive rates than songbirds, however, so the effects of human-caused mortality might be correspondingly greater for bats than for birds. Nevertheless, Erickson et al. (2002) have argued that reported rates of bat mortality at wind turbines represent only a very small fraction of migratory or local bat numbers.
iii
TABLE OF CONTENTS SUMMARY …………….................................................................................….... i TABLE OF CONTENTS..................................................................................….... iii LIST OF TABLES ...............................................................................................…. iv LIST OF FIGURES ................................................................................................. v ACKNOWLEDGEMENTS …………………………............................................. vii INTRODUCTION ………………………………................................................... 1 OBJECTIVES ………….......................................................................................... 3 STUDY AREA …………………….....................................................................… 4 METHODS ………………….................................................................................. 9 Diurnal Birds ……………………………………………………………… 9 Nocturnal Migratory Birds ……………………………………………..… 14 Mortality Assessment ………………………..…………………………… 21 RESULTS ......................................................................................................…….. 24 Diurnal Birds ……………………………………………………………… 24 Nocturnal Migratory Birds ………………………………………………... 48 Mortality Assessment ………………………..…………………………… 56 DISCUSSION ………………………..................................................................... 67 BIBLIOGRAPHY …………………………………................................................ 78 APPENDIX A. Range estimates of microphones ............………................................. 84 APPENDIX B Examples of spectrographs …..............……......................................... 85 APPENDIX C Bird species observed during diurnal surveys ...……….......................... 86 APPENDIX D Rank abundance of bird species observed during short counts ………….... 91 APPENDIX E Comparison of birds between Reference Area and Turbine Area ………….. 95 APPENDIX F Frequency of birds observed within, above, and below turbine sweep area .... 99 APPENDIX G Frequency of birds recorded during nocturnal acoustic recordings ………….. 102 APPENDIX H Summary of bat specimens collected……….......................................... 103

iv
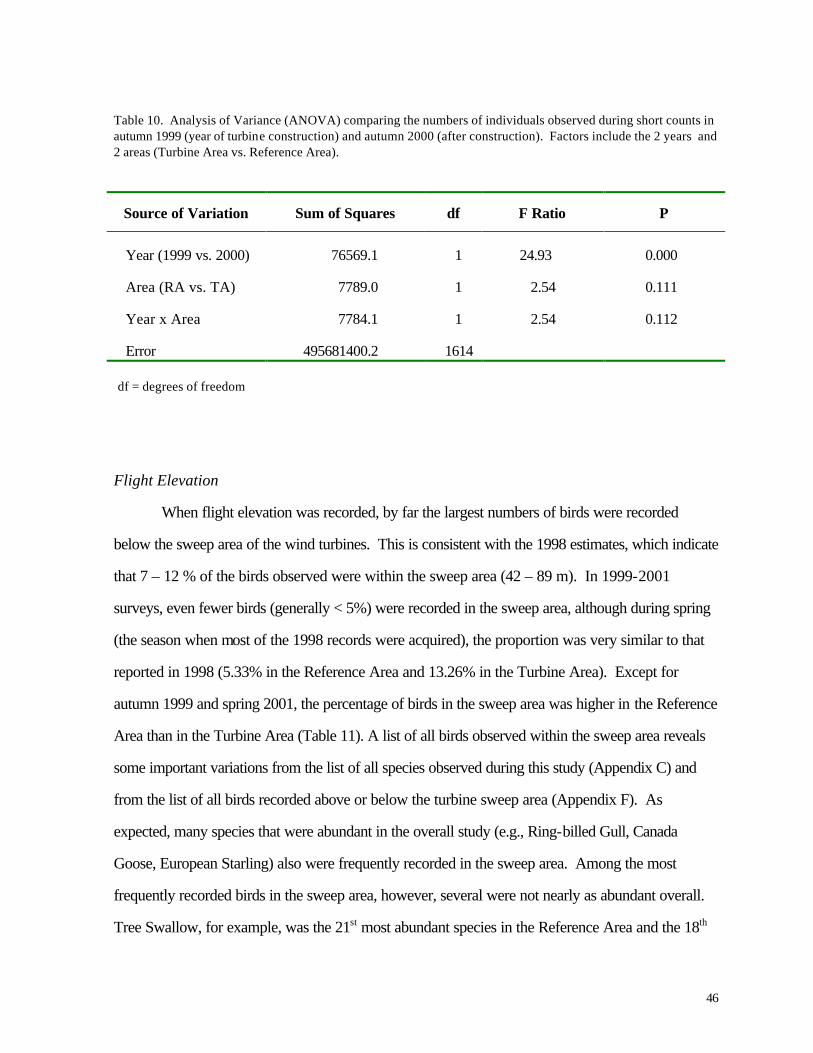
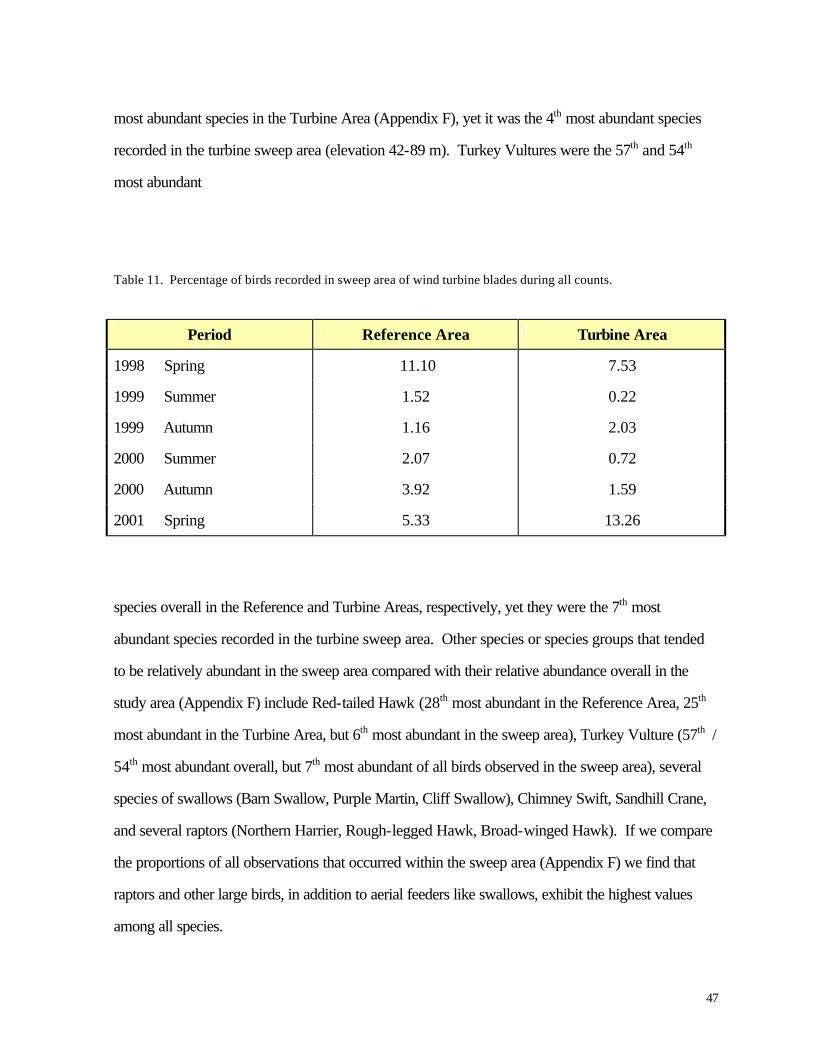
LIST OF TABLES (page numbers in parentheses) Table 1. (12) Season and year when counts of diurnal birds were conducted. Table 2. (25) Endangered, threatened, and special concern species observed during diurnal bird surveys. Table 3. (35) Analysis of Variance (ANOVA) comparing the numbers of species observed during short counts between 1999-2001. Table 4. (36) Analysis of Variance (ANOVA) comparing the numbers of individuals observed during short counts between 1999-2001. Table 5. (38) Analysis of Variance (ANOVA) comparing the numbers of species observed during short counts in spring 1998 (before turbine construction) and spring 2001 (after construction). Table 6. (38) Analysis of Variance (ANOVA) comparing the numbers of individuals observed during short counts in spring 1998 (before turbine construction) and spring 2001 (after construction). Table 7. (44) Analysis of Va riance (ANOVA) comparing the numbers of species observed during short counts in summer (June) 1998 (before turbine construction) and summer (June) 2000 (after construction). Table 8. (44) Analysis of Variance (ANOVA) comparing the numbers of individuals observed during short counts in summer (June) 1998 (before turbine construction) and summer (June) 2000 (after construction). Table 9. (45) Analysis of Variance (ANOVA) comparing the numbers of species observed during short counts in autumn 1999 (year of turbine construction) and autumn 2000 (after construction). Table 10. (46) Analysis of Variance (ANOVA) comparing the numbers of individuals observed during short counts in autumn 1999 (year of turbine construction) and autumn 2000 (after construction). Table 11. (47) Percentage of birds recorded in sweep area of wind turbine blades during all counts. Table 12. (57) Summary of bird specimens collected at all wind turbine sites. Table 13. (68) Distribution of bat carcasses recovered during 1999 and 2000 at two wind turbine localities. Appendix A. (84) Range estimates of microphones used for acoustic monitoring of nocturnal migrants. Appendix B. (85) Examples of spectrographs from recordings of nocturnal migrant birds.
Appendix C. (86) List of all birds observed during diurnal bird surveys between 1998-2001. Appendix D. (91) Total number of individuals and rank abundance for species observed during short counts in spring (April-May), summer (June-July), and autumn (August-November). Appendix E. (95) Comparison of species abundances between Reference Area and Turbine Area during diurnal bird surveys between 1999-2001. Appendix F. (99) Ranked frequency of bird species observed within (40 – 90 m), above (>90), and below < 40 m) the sweep area of wind turbine blades during all counts, 1999-2001. Appendix G. (102) Frequency of nocturnal birds as identified by analysis of acoustic flight calls. Appendix H. (103) Summary of bat specimens collected at MGE and WPS wind turbines.
v
LIST OF FIGURES Figure 1. (5) Map of wind turbine study area. Figure 2. (7) Configuration of wind turbines at MGE and WPS study areas. Figure 3. (8) Photograph of wind turbine at the WPS wind farm in Kewaunee County. Figure 4. (10) Map of Turbine Area and Reference Area used for analysis of diurnal birds. Figure 5. (11) Map of points where 3 minute short counts of diurnal birds were conducted during 1998-2001. Figure 6. (13) Map of points where 30 minute long counts of diurnal birds were conducted between 1998-2001. Figure 7. (15) Map of audio recording sites for nocturnal migrant birds. Figure 8. (16) Photograph of microphone mounted on meteorological tower near MGE wind turbines. Figure 9. (17) Spectrographic example of the time delay of a bird call recorded from the two microphones on the MG&E tower. Figure 10. (20) Two-dimensional representation of acoustic monitoring scheme. Figure 11. (27) Standardized data form used for investigation of bird and bat mortality. Figure 12. (27) Map of Northern Harrier records from diurnal bird surveys. Size of each circle corresponds to numbers of counts when species was observed. Figure 13. (28) Map of Upland Sandpiper records from diurnal bird surveys. Size of each circle corresponds to numbers of counts when species was observed. Figure 14. (29) Map of Western Meadowlark records from diurnal bird surveys. Size of each circle corresponds to numbers of counts when species was observed. Figure 15. (31) Seasonal variation in species richness during diurnal bird surveys (short counts), 1999-2001. Figure 16. (32) Seasonal variation in numbers of individuals during diurnal bird surveys (short counts), 1999-2001. Figure 17. (33) Seasonal variation in species richness during diurnal bird surveys (long counts), 1999-2001. Figure 18. (34) Seasonal variation in numbers of individuals during diurnal bird surveys (long counts), 1999-2001. Figure 19. (37) Average numbers of species and individuals observed during short counts before (1998), during (1999), and after (2000-01) turbine construction. Sample sizes (n) are given above each column. Figure 20. (40) Average numbers of Ring-billed Gulls observed during short counts. Figure 21. (41) Average numbers of Canada Geese observed during short counts.
vi
Figure 22. (42) Average numbers of bird species and individuals observed during spring and summer short counts before and after turbine construction. Figure 23. (43) Average numbers of bird species and individuals observed during autumn short counts before and after turbine construction.
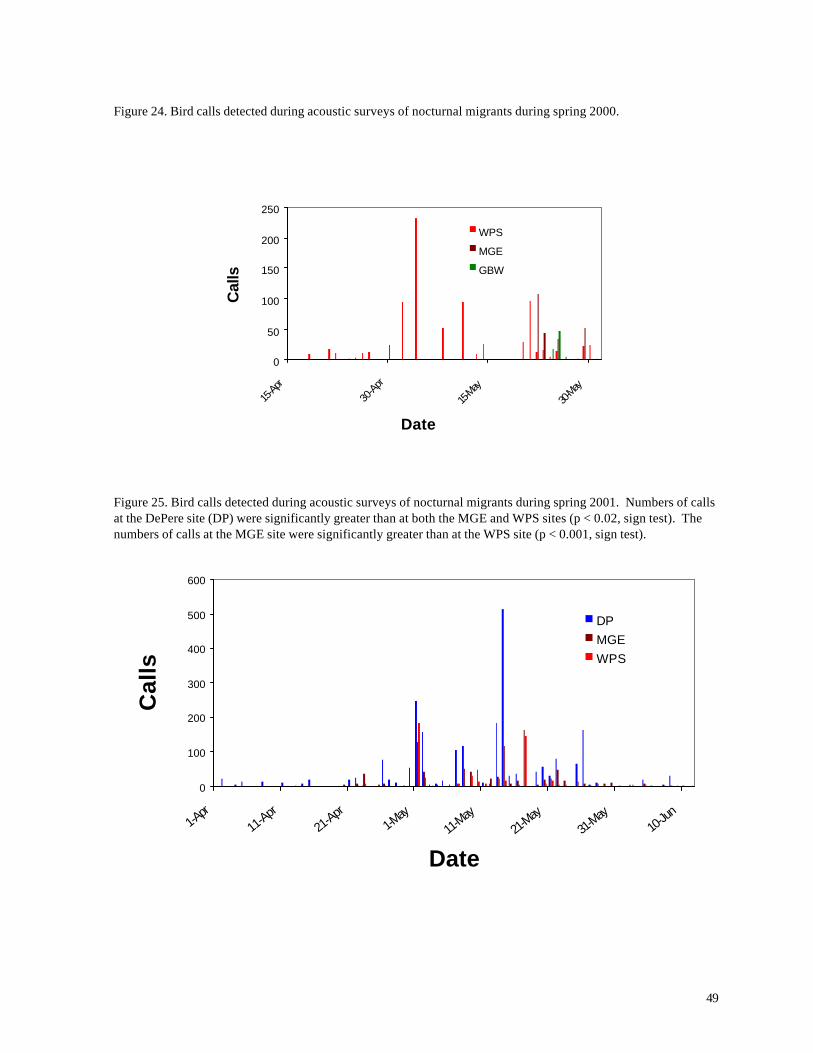
Figure 24. (49) Bird calls detected during acoustic surveys of nocturnal migrants during spring 2000.
Figure 25. (49) Bird calls detected during acoustic surveys of nocturnal migrants during spring 2001.
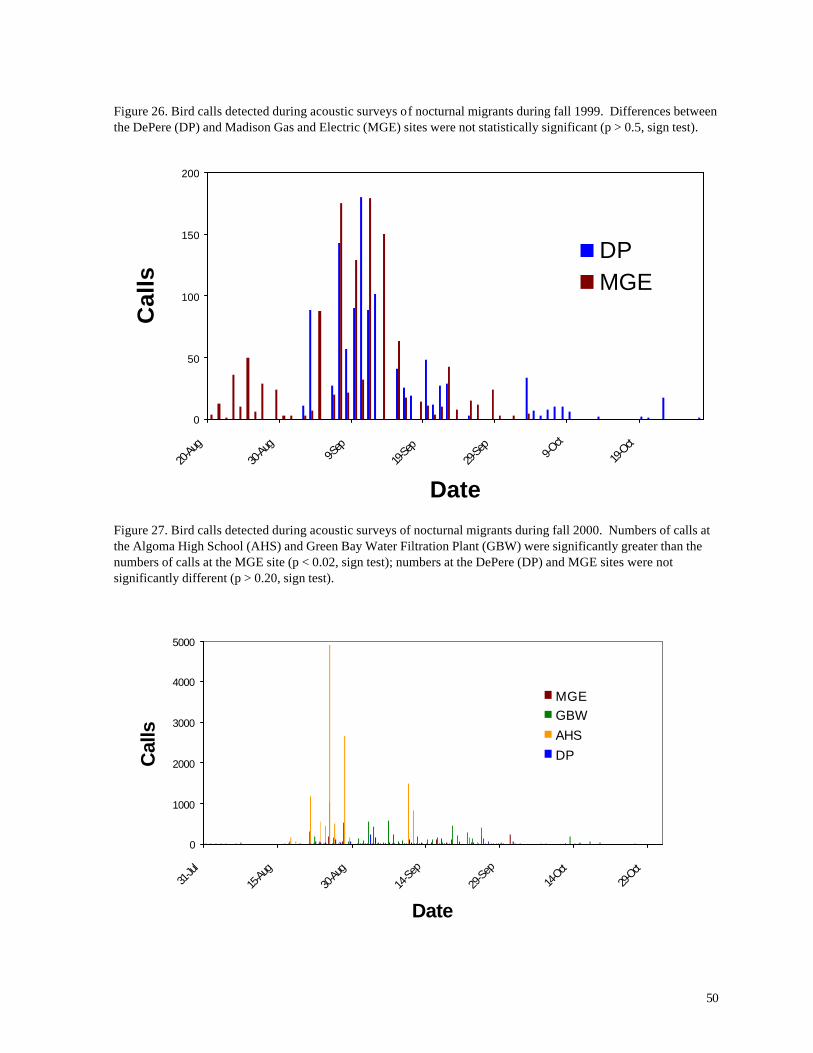
Figure 26. (50) Bird calls detected during acoustic surveys of nocturnal migrants during fall 1999.
Figure 27. (50) Bird calls detected during acoustic surveys of nocturnal migrants during fall 2000.
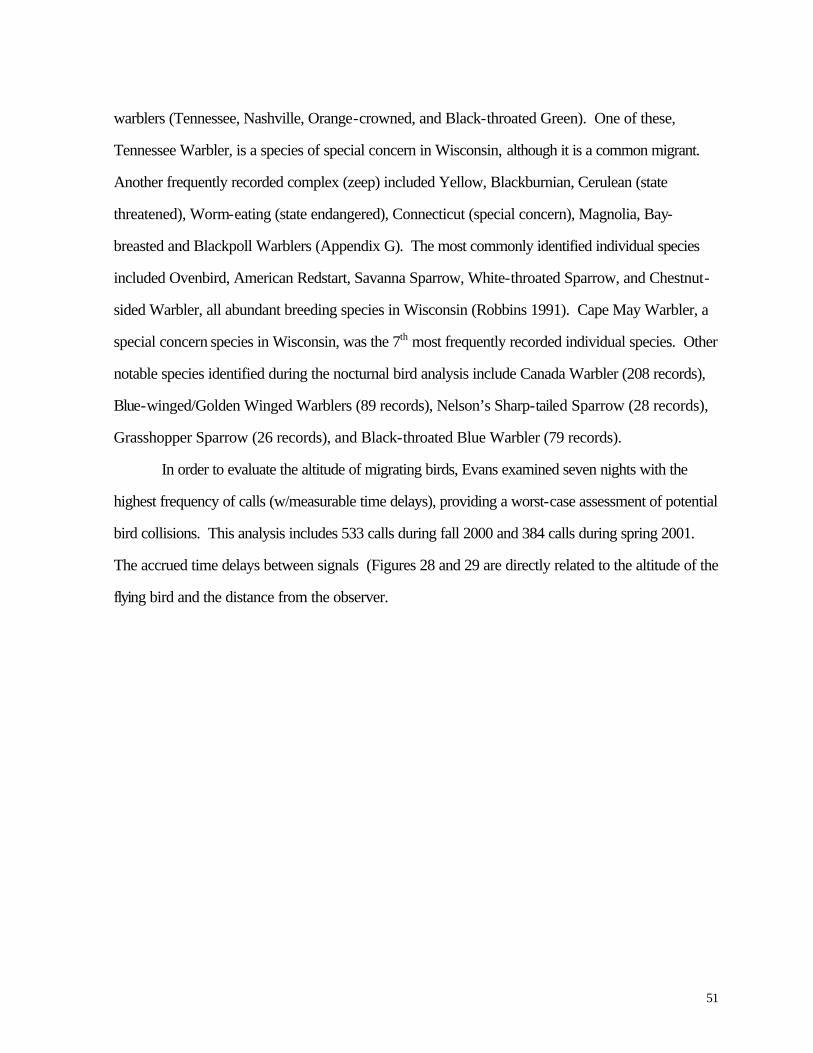
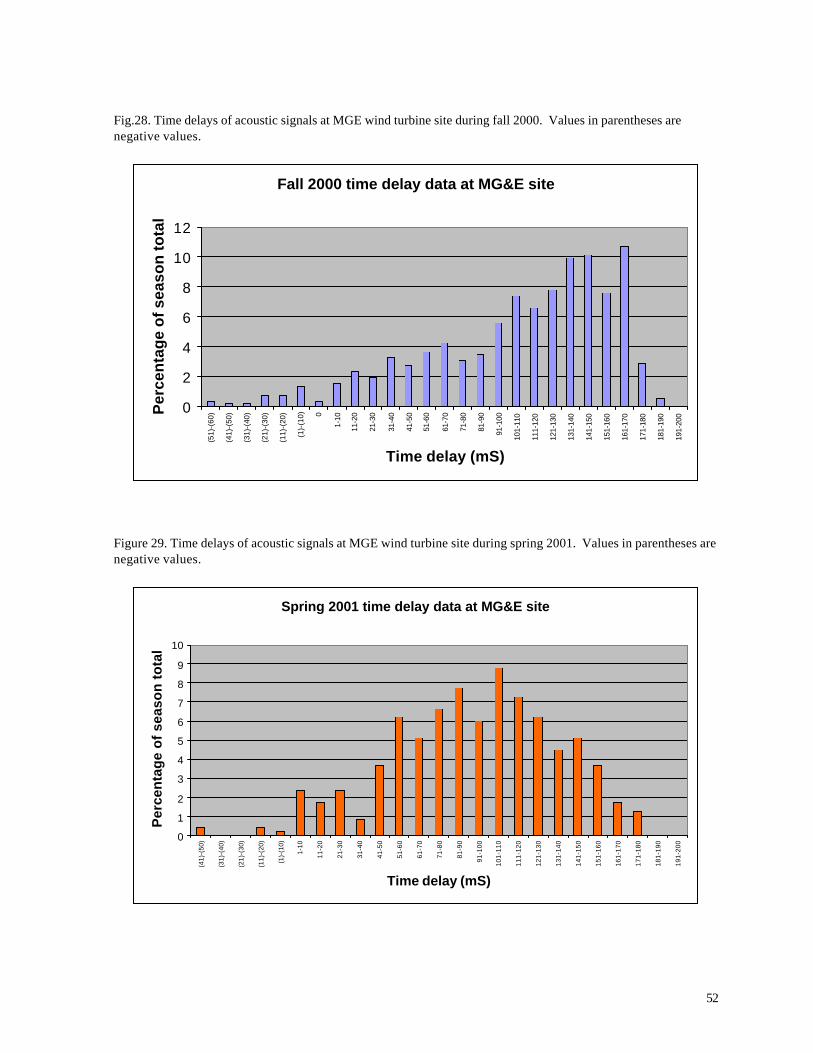
Figure 28. (52) Time delays of acoustic signals at MGE wind turbine site during fall 2000. Values in parentheses are negative values. Figure 29. (52) Time delays of acoustic signals at MGE wind turbine site during spring 2001. Values in parentheses are negative values.
Figure 30. (53) Time delays of acoustic signals during nights with largest flights of nocturnal migrant birds.
Figure 31. (54) Contrasting time delays of acoustic signals during two nights in fall 2000.
Figure 32. (55) Comparison of time delays for Catharus thrushes (blue) and warblers and sparrows (red) on the night of 16-17 May 2001.
Figure 33. (56) Schedule of sampling dates for assessing bird and bat mortality at MGS and WPS wind turbines. Figure 34. (58) Monthly distribution of bird specimens collected at all wind turbines.
Figure 35. (60) Bat specimens collected at the WPS and MGE wind turbine sites. Figure 36. (61) Distribution of bat carcasses relative to the base of the wind turbine.
Figure 37. (63) Recovery of artific ial animal “specimens” (pvc tubes) placed in fields with different substrates during July 2001 Figure 38. (64) Removal of bird carcasses during field trials at WPS wind turbine facilities in April 2000. Figure 39. (65) Distribution of carcasses recovered along access roads leading to the base of wind turbines. Figure 40. (66) Diagram of sampling area and access roads used for mortality searches. The solid circle in the center of the diagram represents the base of a wind turbine.

vii
ACKNOWLEDGEMENTS Funding for this project was provided by Wisconsin Public Service Corporation and Madison Gas and Electric Company. Logistic support for the mortality analysis was provided by the University of Wisconsin-Green Bay. Staff specialists Shawn Puzen (WPS) and Jeff Ford (MGE) participated in the planning and coordination of the field investigations. Other contributors to the research design include Bill Fannucchi (Public Service Commission of Wisconsin), Steve Ugoretz (Wisconsin Department of Natural Resources) and Brian Keeley (Bat Conservation International). Field workers included Karen Smith, Tom Erdman, David Marks, Steven Engels, Daniel Joppe, Erica Sisel, and Nikki Echard. Erdman was responsible for identification of specimens, which have been deposited in the Richter Natural History Museum at the University of Wisconsin-Green Bay. We are grateful for the cooperation of numerous landowners and custodians, including John Leick, Algoma High School, Green Bay Water Utility, and numerous landowners in Lincoln and Red River Township. Other contributors to various aspects of the study include Greg Egtvedt, Darin Brink, Lidia Nonn, Michael Marinetti, Barb Maenpaa, Jeff Selner, and Ryan Atwater. We acknowledge the important contributions made by all of these individuals.
1
INTRODUCTION
The use of wind turbines for generating electricity is becoming increasingly desirable as
demands for clean, inexpensive power are beginning to outstrip the availability or acceptability of
traditional power sources. Large-scale construction of wind turbines was initiated in California nearly
two decades ago (Orloff and Flannery 1992), and by the end of 2000 nearly 15,000 commercial
wind turbines had been erected in 22 states, with additional facilities planned in 4 others (Erickson et
al. 2001). Wind generation capacity in the United States increased dramatically in 2001 to over
4200 megawatts (MW), enough to meet the energy supply of more than 1 million US homes
(American Wind Energy Association 2001). Worldwide, wind generation capacity exceeds 20,000
MW, led by ambitious programs in Denmark and Germany. Germany is on schedule to produce
22,000 MW of wind power by 2010 while Denmark, which already generates more than 10% of its
energy from wind turbines, aims to satisfy half of its energy from renewable energy by 2030 (AWEA
2001).
Despite the clear benefits of a clean, domestic, and increasingly cost-effective energy source,
wind power has not been without its detractors. Noise disturbance and visual impacts on the
landscape have been the source of complaints at some wind power facilities, including those in
Wisconsin. Another potential impact is the collision of birds and bats with wind turbines.
Human-made structures are reported to cause an estimated 100 million to over 1 billion bird
deaths annually in the U.S. (Banks 1979, Avery et al. 1980, Klem 1990, Evans and Manville 2000,
Manville 2000, Erickson et al. 2001). The majority of these deaths occur when birds strike
windows of buildings (Klem 1979), but recent studies have shown that wind turbines can be a major
source of fatal collisions, especially for migratory passerines, waterfowl, and diurnal raptors
(Winkleman 1985, California Energy Commission 1989, Orloff 1992, Walcott 1995). Other
indirect sources of mortality associated with human populations include predation by pets or feral
animals, impacts of toxic chemicals, and habitat destruction.
Research at Altamont Pass near Livermore, California, concluded that more than 500
2
raptors (hawks, eagles, and owls) might have died over a two year period as a result of collisions
with wind turbines (Orloff and Flannery 1992). A separate study by KENETECH Windpower
estimated slightly lower but still significant rates of mortality (Curry 1993). Altogether 841 bird
mortalities have been reported from studies of wind turbines in California (Erickson et al. 2001).
Diurnal raptors comprised 41.5% of the victims, followed by native passerines (20.1%), owls
(11.1%) and non-native House Sparrow, European Starling, and Rock Dove (16.6%).
Investigations of bird mortality at other wind power sites reveal a generally low rate of bird
mortality. Erickson et al. (2001) summarize bird mortality estimates from reports that take into
account observer error and removal of carcasses by scavengers. They concluded that the average
number of avian fatalities due to collisions with wind turbines is approximately 2.19 birds per turbine
per year. Considering the number of wind turbines in the U.S. during 2001, Erickson et al. (2001)
project an annual mortality of about 33,000 birds (range between 10,000-40,000), a fraction of the
4 million or more birds that are believed killed by collisions with all human-made structures each
year. Erickson et al. (2001) estimate that wind turbines kill approximately 488 raptors annually,
almost all in California.
A study of bird activity at Buffalo Ridge in southwestern Minnesota (Nelson 1993)
concluded that most migratory birds fly at elevations well above the height of wind turbines. Walcott
(1995) argued that the most vulnerable groups of birds at existing wind power facilities are raptors
and waterfowl (Walcott 1995), although more recent studies have shown that wind turbines do
occasionally kill migrating passerines (Erickson et al. 2001). The largest single mortality event was
reported at Buffalo Ridge in Minnesota, where 14 nocturnal migrating passerines (warblers, vireos,
and flycatchers) were killed during a single night (Johnson et al. 2000). Mortality of migrating birds
at communications towers is known to be highly episodic (Kemper 1996), so additional, long term
studies may be needed to verify the low rates of mortality reported at wind power facilities today.
An unexpected outcome of searches for bird mortality at wind turbines has been the
discovery of bat carcasses (Johnson et al. 2001). Although little is known about movement patterns
of bats compared with knowledge about bird migration, these results suggest that bat mortality might

3
be an impact of wind power facilities.
This report describes comprehensive studies of bird and bat mortality at 31 wind turbines in
Kewaunee County, Wisconsin, representing (at the time of construction) the largest U.S. wind power
facilities east of the Mississippi River. Funding for the project was provided by the two participating
utility companies (Madison Gas and Electric Company and Wisconsin Public Service Corporation)
with guidance from the Public Service Commission of Wisconsin, and the Wisconsin Department of
Natural Resources. Research was conducted under independent contracts with the University of
Wisconsin-Green Bay, William Evans, Astur, Inc., and Karen Smith. The investigation is motivated
by concerns about wildlife mortality caused by wind turbines.
OBJECTIVES
Our analysis is designed to address three objectives: 1) to describe the diurnal (day-active)
avifauna in the vicinity of the wind turbines, thereby providing a perspective of potential bird
mortality, 2) to evaluate the phenology and altitude of nocturnal migrant birds near the wind turbines,
and 3) to directly assess bird and bat mortality during the first two years after construction of the
turbines. Bird assemblages in the region were studied before, during, and after construction,
providing an opportunity to evaluate changes in bird distributions as a result of wind turbine
operation. We also analyze the effectiveness of bird mortality assessments and the sources of error
for estimating long term risks of wildlife mortality at wind turbines in the Midwestern U.S. Results of
this analysis will help guide standardized monitoring of bird and bat mortality at other sites.
4
STUDY AREA
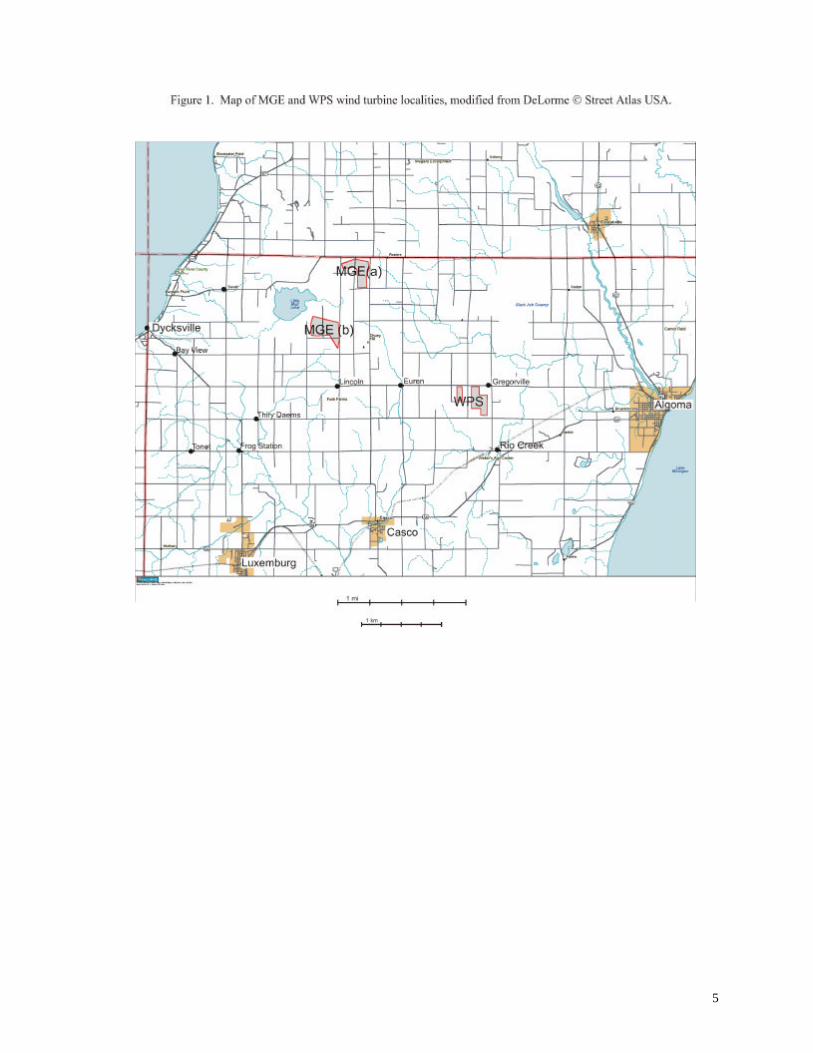
Construction of the wind turbines was completed in June 1999 in the townships of Lincoln
and Red River in Kewaunee County, Wisconsin (Figure 1). The turbines are configured in three
clusters (Figure 2), two groups (MGEa, MGEb) totaling 17 turbines owned by Madison Gas and
Electric Company and the other group of 14 turbines (WPS) owned by Wisconsin Public Service
Corporation. Land use in this region is dominated by dairy farms and rural/suburban homes, but
extensive lowland forests lie within 2 km of all turbines. Notable forest areas include the Black Ash
Swamp, a 22 km2 tract approximately 850 m east of the WPS turbines, and Duvall Swamp, a
reticulate 24 km2 tract approximately 1 km west of MGEa and 250 m west of MGEb. The wind
turbines (elevation 240 – 270 m) are located on ridges of glacial till rising 30-60 m above the nearby
lowlands. The landscape reaches its highest elevations near the MGE turbines, and then slopes more
or less gently toward the east, interrupted by the aforementioned lowland forests.
Before European settlement during the 1800’s, uplands in this area were covered by mixed
conifer/hardwood forest (Finley 1976) dominated by sugar maple (Acer saccharum), American
beech (Fagus grandifolia), yellow birch (Betula alleghaniensis), eastern hemlock (Tsuga
canadensis), northern red oak (Quercus rubra) white pine (Pinus strobus), and red pine (Pinus
resinosa). Very little of this mature forest remains today (Frelich 1995), most of it in tiny woodlots
that are managed for firewood or small-scale forestry. Lowlands were characterized by swamp
conifers including northern white cedar (Thuja occidentalis), black spruce (Picea mariana),
tamarack (Larix laricina) and eastern hemlock According to General Land Office land survey
records during the mid-1800’s (Finley 1976), lowland conifers were much more extensive than they
are today in this region. Today, the most extensive remnant forest in the vicinity of the wind turbines
(Black Ash Swamp) is dominated by lowland hardwoods, including black ash (Fraxinus nigra) and
eastern cottonwood (Populus deltoides).
The configurations of wind turbines at the MGE and WPS sites provide an interesting
5
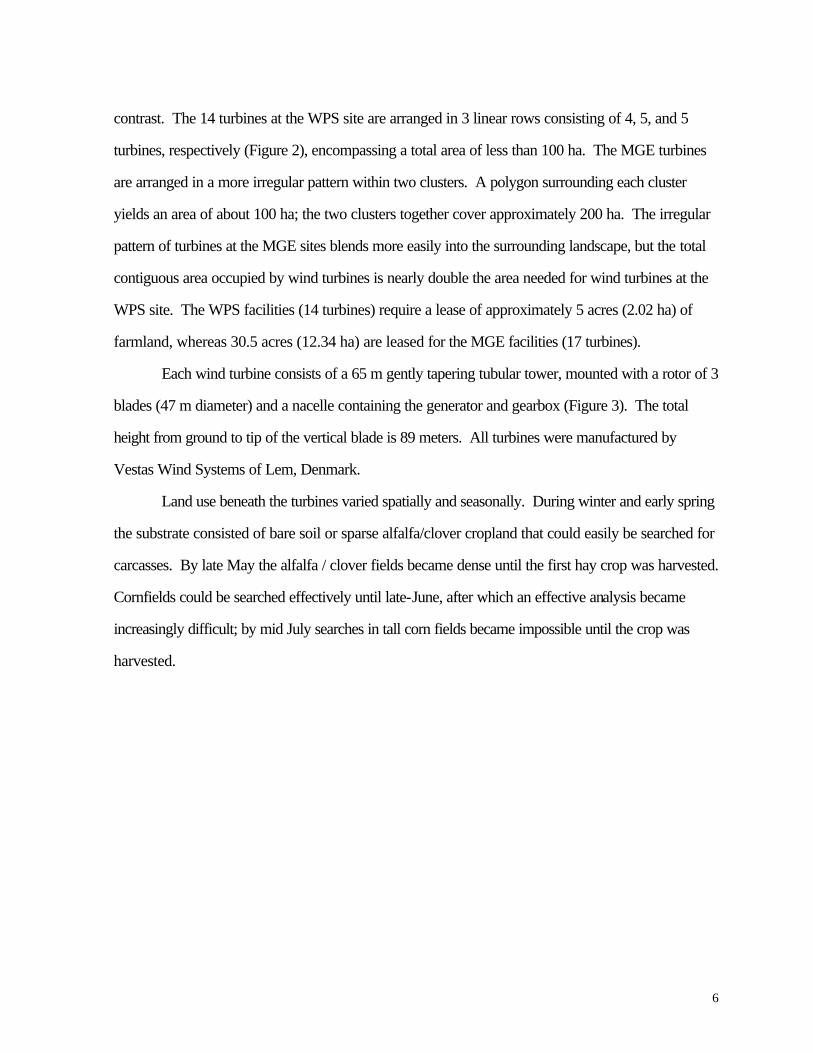
6
contrast. The 14 turbines at the WPS site are arranged in 3 linear rows consisting of 4, 5, and 5
turbines, respectively (Figure 2), encompassing a total area of less than 100 ha. The MGE turbines
are arranged in a more irregular pattern within two clusters. A polygon surrounding each cluster
yields an area of about 100 ha; the two clusters together cover approximately 200 ha. The irregular
pattern of turbines at the MGE sites blends more easily into the surrounding landscape, but the total
contiguous area occupied by wind turbines is nearly double the area needed for wind turbines at the
WPS site. The WPS facilities (14 turbines) require a lease of approximately 5 acres (2.02 ha) of
farmland, whereas 30.5 acres (12.34 ha) are leased for the MGE facilities (17 turbines).
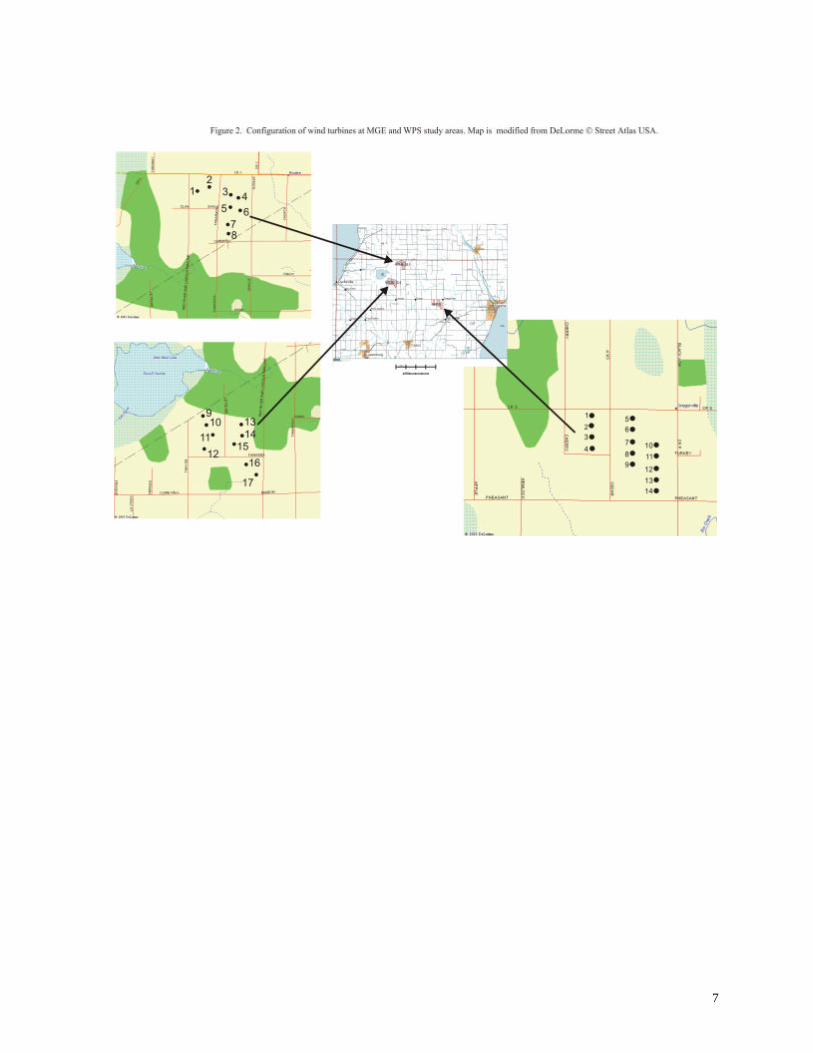
Each wind turbine consists of a 65 m gently tapering tubular tower, mounted with a rotor of 3
blades (47 m diameter) and a nacelle containing the generator and gearbox (Figure 3). The total
height from ground to tip of the vertical blade is 89 meters. All turbines were manufactured by
Vestas Wind Systems of Lem, Denmark.
Land use beneath the turbines varied spatially and seasonally. During winter and early spring
the substrate consisted of bare soil or sparse alfalfa/clover cropland that could easily be searched for
carcasses. By late May the alfalfa / clover fields became dense until the first hay crop was harvested.
Cornfields could be searched effectively until late-June, after which an effective analysis became
increasingly difficult; by mid July searches in tall corn fields became impossible until the crop was
harvested.
7
8
Figure 3. Photograph of wind turbine at MGE study site.
9
METHODS
Diurnal Birds
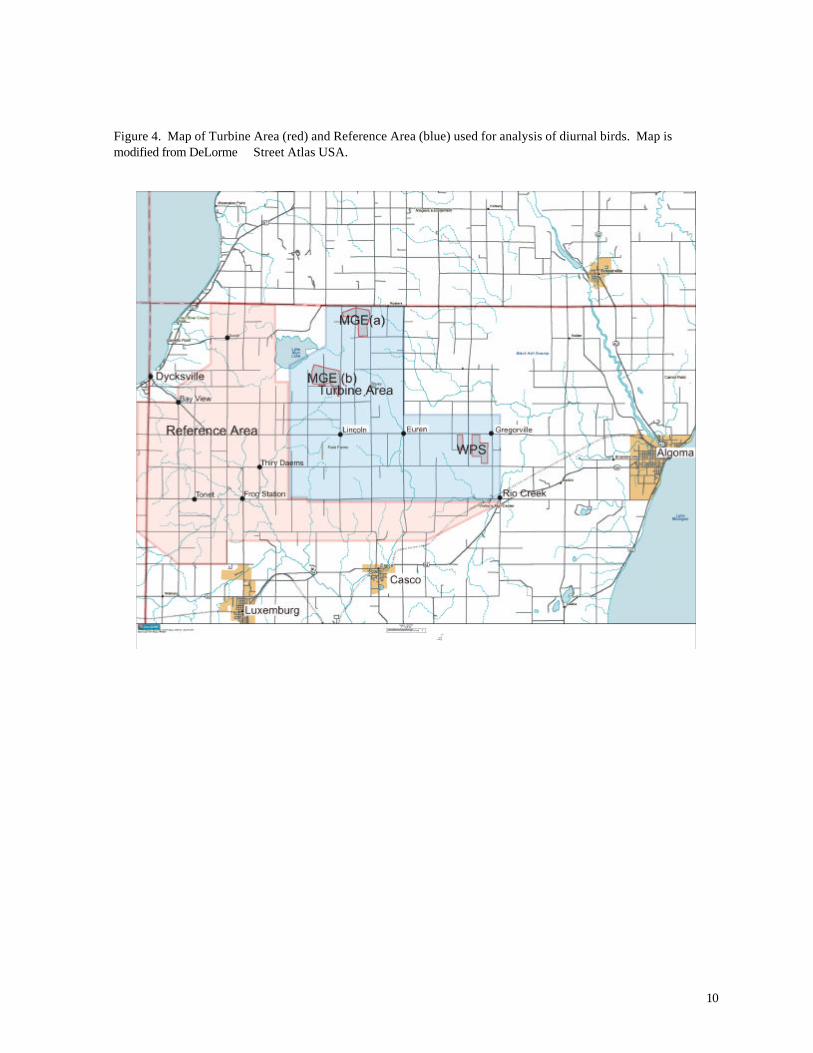
An assessment of bird mortality risks must begin with a general description of the avifauna
occurring in the study area. Surveys of birds in the vicinity of the Kewaunee County wind turbines
were initiated in 1998, modeled after a protocol used at the Madison Gas and Electric Company
Wind Farm Site at Stockbridge, WI (Erdman 1998). Two research areas were established for
comparison: 1) the Turbine Area, a 25 mi2 area encompassing all 31 wind turbines and 66 miles of
public roads in the Township of Lincoln and eastern Red River Township, and 2) an adjacent
Reference Area consisting of 32 mi2 of similar habitat and 73 miles of public roads (Figure 4) in the
Towns of Red River, Luxemburg, and Casco. Land use in both areas is predominantly agricultural,
with scattered woodlots and brushy riparian corridors or fencerows. The Turbine Area lies east of
the Reference Area at a generally higher elevation. Both study areas border Duvall Swamp, but
neither includes extensive forest.
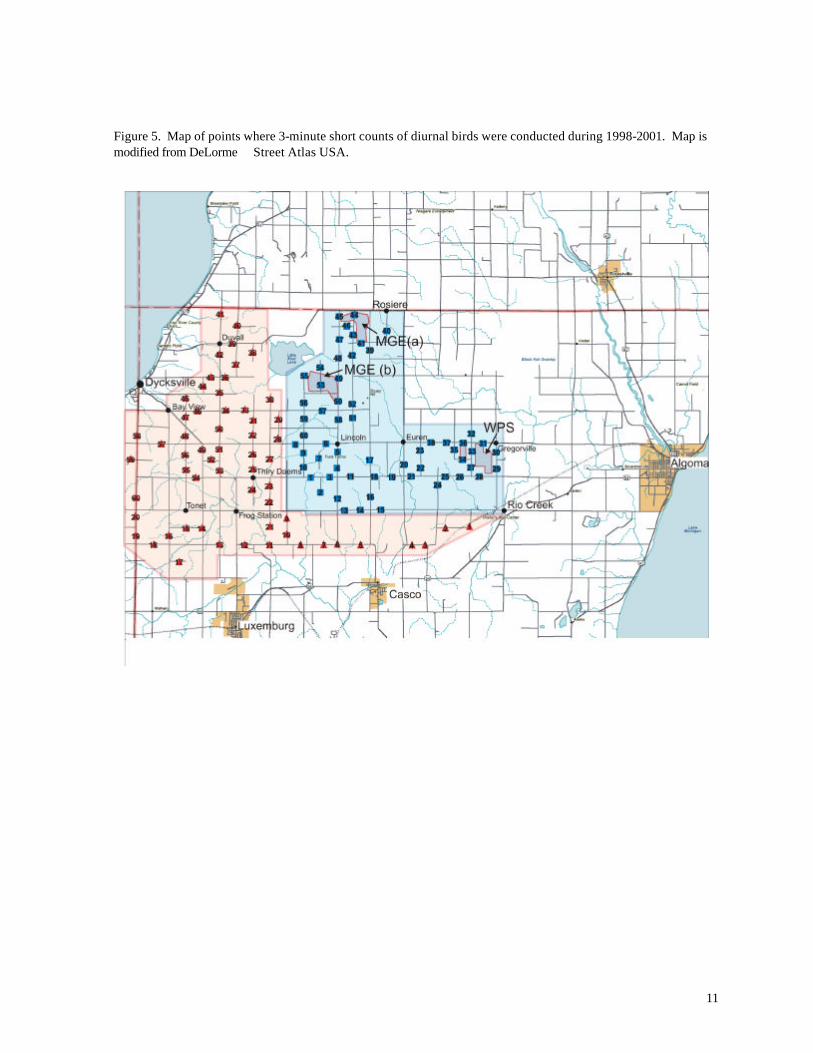
Two types of surveys were employed during spring, summer, and autumn. The Short
Counts consisted of 3 minute, unlimited-radius point counts patterned after the North American
Breeding Bird Survey (Robbins et al. 1986). Observers recorded all birds seen or heard within ¼
mile from each point, located along a secondary or tertiary road at least 0.5 mi from other points.
Most of the counts were conducted during morning hours, but afternoon counts were also included.
Altogether 60 points were established in the Reference Area and 60 points in the Turbine Area
(Figure 5). Short counts were conducted at these sites during 1998, 1999, 2000, and 2001.
Results were obtained from 3214 point samples on 160 dates, including 1056 sample points on 28
field days reported by Erdman (1998). Typically, only 1/3 of the designated 120 points were
sampled during a single day, but 12 of the points (6 in the Reference Area, 6 in the Turbine Area)
were sampled during nearly every visit, providing a more complete assessment of temporal variation
in bird abundance. Except for the data reported in Erdman (1998), all point counts were conducted
by a single observer (Karen Smith).
10
Figure 4. Map of Turbine Area (red) and Reference Area (blue) used for analysis of diurnal birds. Map is modified from DeLorme Street Atlas USA.
11
Figure 5. Map of points where 3-minute short counts of diurnal birds were conducted during 1998-2001. Map is modified from DeLorme Street Atlas USA.
12
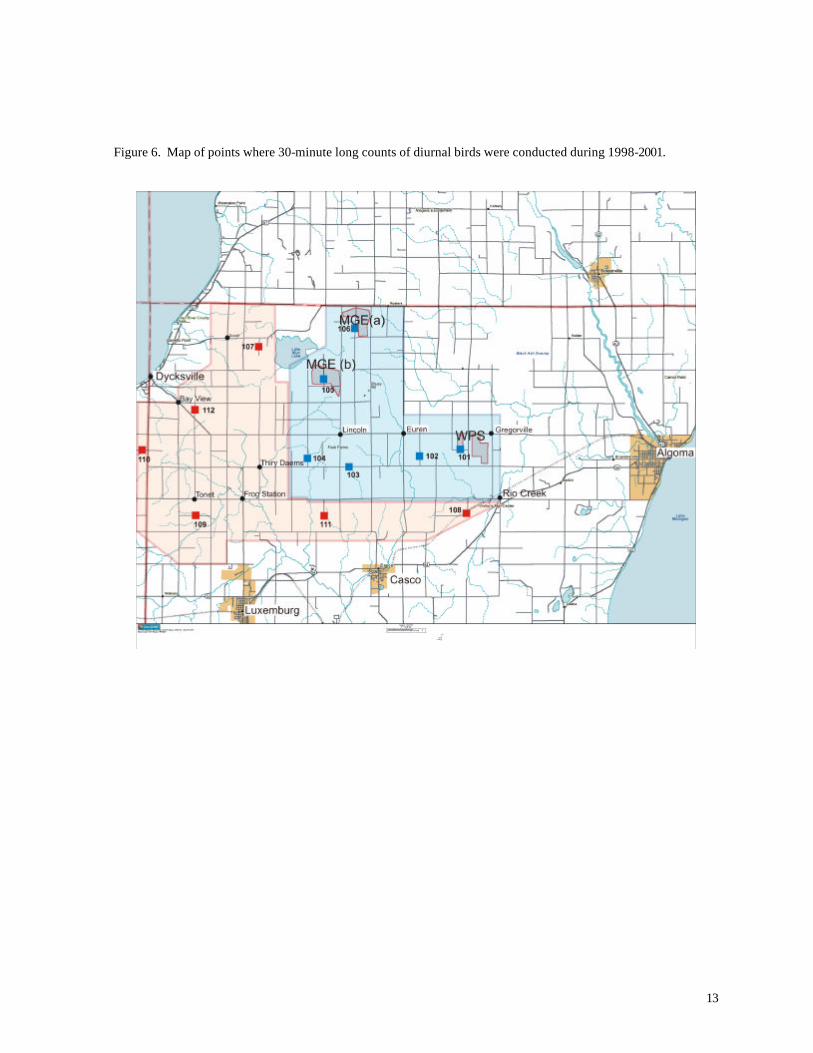
Long Counts were established in order to acquire more detailed information about the
vertical distribution of birds and their behavior within the study areas. These counts of 30 minutes
duration were completed at 6 stations in the Turbine Area and 6 in the Reference Area (Figure 6).
For each bird or flock, observers recorded the numbers of individuals, distance from observer,
approximate height of the bird above ground, and direction of flight. Flight height was estimated with
reference to the height of the wind turbines; birds were recorded as being within or outside the
sweep area of the turbine blades (approximately 40 m – 90 m).
In order to reduce bias, starting points for daily surveys were rotated between the
Reference Area and Turbine Area. Weather conditions were recorded for each field visit, although
surveys were not conducted during strong winds or heavy rain.
A third protocol was used during winter, when numbers of birds in the study areas were
generally very low. These winter surveys followed the same route as for the Short Counts, but all
birds observed from the vehicle were recorded, whether they were present at the designated points
or between points. The vehicle’s odometer reading was recorded for each observation. These
counts are not directly comparable to results from the other seasons, but results can be compared
between study areas or between years.
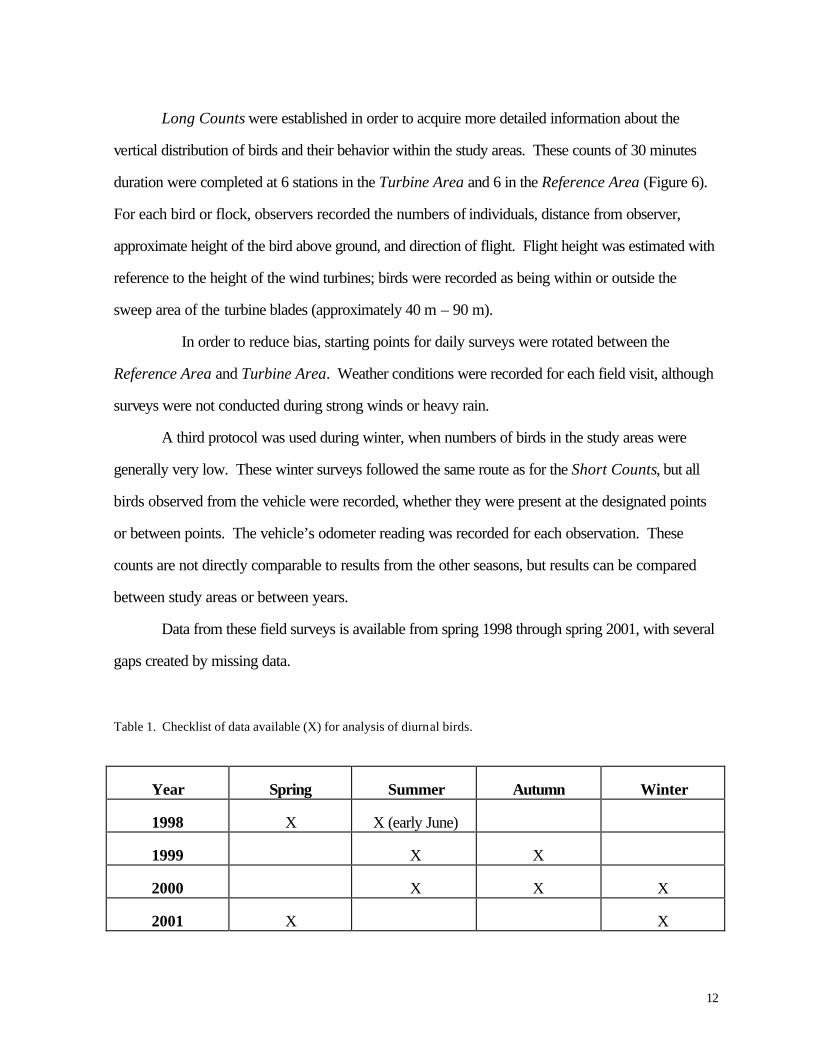
Data from these field surveys is available from spring 1998 through spring 2001, with several
gaps created by missing data.
Table 1. Checklist of data available (X) for analysis of diurnal birds.
Year Spring Summer Autumn Winter
1998 X X (early June)
1999 X X
2000 X X X
2001 X X
13
Figure 6. Map of points where 30-minute long counts of diurnal birds were conducted during 1998-2001.
14
Nocturnal Migratory Birds
Most bird migration in North America happens at night and many species give short
vocalizations while flying. The calling is thought to help maintain flock contact and help birds work
out flight spacing so mid-air collisions are avoided. By looking at the arrival time difference of bird
calls at two vertically displaced microphones, information on the height of the bird when it vocalized
may be gained. Evans has used this technique to learn basic characteristics of the altitude of night
migrating warbler and sparrows in the vicinity of wind turbines at both the MG & E and WPS sites.
In particular, we were interested in finding what proportion of the calling birds were flying below the
height of the turbines.
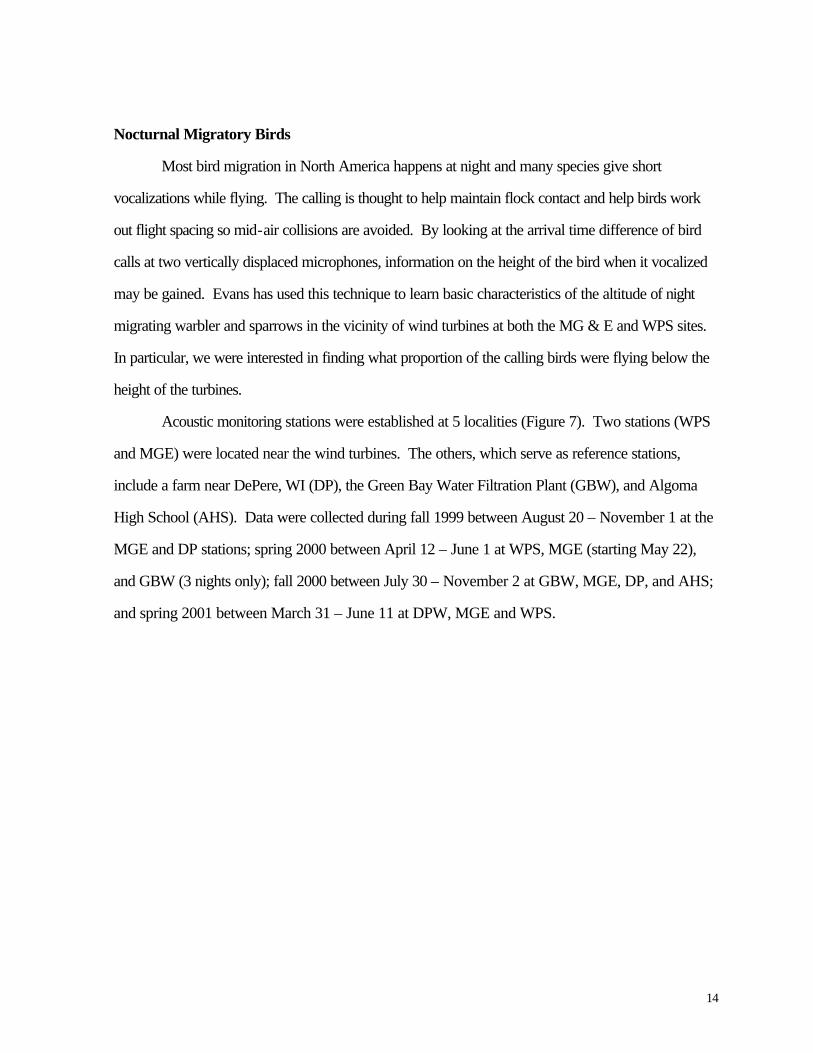
Acoustic monitoring stations were established at 5 localities (Figure 7). Two stations (WPS
and MGE) were located near the wind turbines. The others, which serve as reference stations,
include a farm near DePere, WI (DP), the Green Bay Water Filtration Plant (GBW), and Algoma
High School (AHS). Data were collected during fall 1999 between August 20 – November 1 at the
MGE and DP stations; spring 2000 between April 12 – June 1 at WPS, MGE (starting May 22),
and GBW (3 nights only); fall 2000 between July 30 – November 2 at GBW, MGE, DP, and AHS;
and spring 2001 between March 31 – June 11 at DPW, MGE and WPS.
15
Figure 7. Map of audio recording stations for nocturnal migratory birds. MGE and WPS = wind turbine facilities described in text; AHS = Algoma High School; GBW = Green Bay Water Treatment Plant; DP = DePere Farm. Base map was derived from DeLorme Street Atlas USA.
16
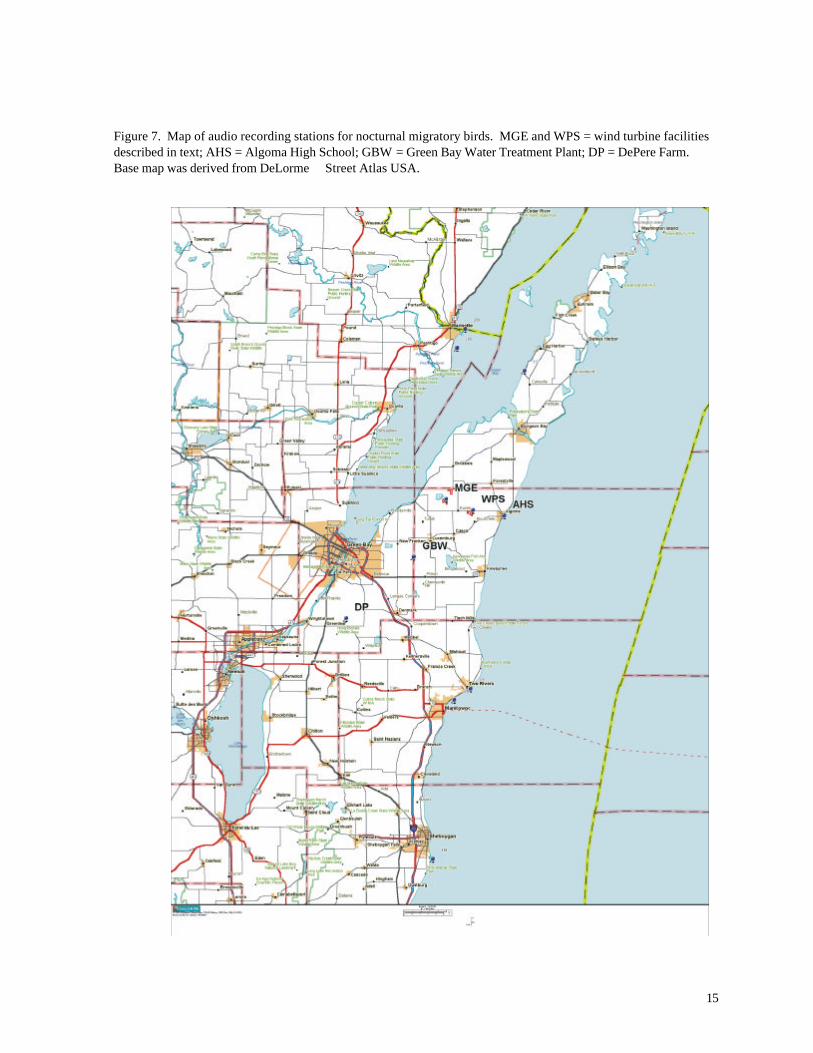
Specially designed directional microphones were mounted on a 67-meter meteorological
tower located 150-meters west of one of the Madison Gas and Electric (MGE) wind turbines
(Figure 8). The microphone design may be found at www.oldbird.org. The microphone has a
spherical sensitivity pattern but with roughly a 60 degree expanding cone of enhanced sensitivity in
the direction it is aimed (see Appendix A).
One microphone was mounted near the top of the tower (~67 meters above ground level)
and the other was mounted ~6.0 meter above ground level. Canare L-4E6S audio cable was used to
transport the audio signal to a recording station near the base of the tower. The recording station
consisted of an RCA SCT-86 audio cassette player and a Sony SLV 660 hi-fi
Figure 8. Microphone mounted near the top of 67-meter high meteorological tower. Note farmhouse in lower left.
videocassette recorder (VCR). The audio cassette player served as an amplifier to boost the
microphone-level signal to line-level. The audio signals were recorded on the VCR’s soundtracks.
The VCR was programmed to record for 8 hours each evening, typically beginning at 8:30PM –
17
4:30AM CT. Data was acquired during the fall 2000 and spring 2001 migration seasons. University
of Wisconsin-Green Bay field workers changed VCR tapes daily.
Tapes were sent to W. Evans for analysis. Automatic bird call detection software developed
by Old Bird, Inc (Tseepo, see www.oldbird.org) was run on the lower microphone channel to find
warbler and sparrow calls on the tape. Once calls were detected, both channels were
spectrographically analyzed to reveal whether the call was recorded on both channels. If so, the
arrival time delay was measured using software called Canary developed by the Cornell Lab of
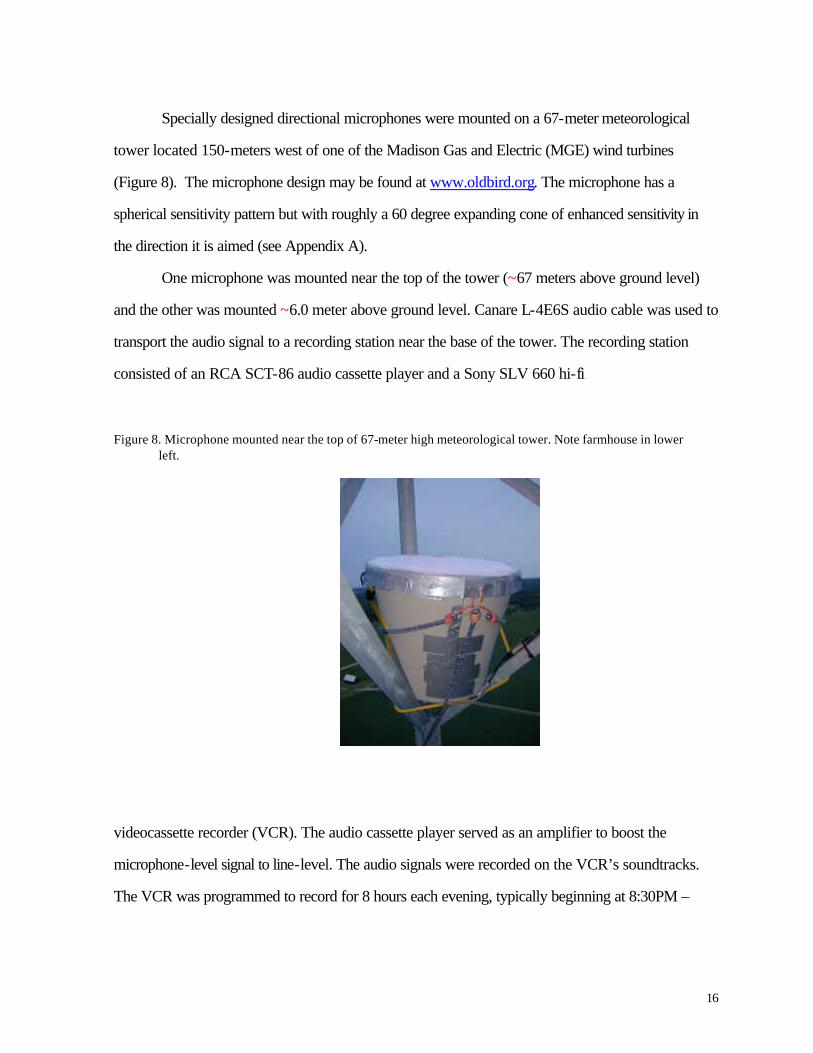
Ornithology’s Bioacosutics Research Program. Figure 9 illustrates this process (see Appendix B for
more examples).
Figure 9. Spectrographic example of the time delay of a bird call recorded from the two microphones on the MG&E tower. The time delay in this example is 150.3 mS.
Figure 9 shows the same bird call recorded by the upper (bottom spectrogram) and lower
(top spectrogram) microphone. The arrival time difference of the call at the two microphones is a
18
function of the bird’s position in space. The vertical measurement lines are positioned on a distinctive
structure of the call to determine the arrival time delay. The darker banding in the bottom half of the
spectrograms represents different species of insect song. The lower mike (top spectrogram) shows
darker bands because it is closer to the ground where insects are calling. The other component of the
dark area in the lower half of the spectrograms is noise from the wind turbines. This bird call was
recorded at the MG&E recording station at ~ 2:40AM in the early morning of August 24, 2000.
The spectrogram indicates that the call is a species in the double-banded upsweep complex
that includes Tennessee Warbler, Nashville Warbler, and Black-throated Green Warbler (Evans and
O'Brien, 2002). Due to the early date, typical migration timing suggests the call may be from a
Tennessee Warbler (Vermivora peregrina). The call arrives at the top mike (lower spectrogram)
first and arrives at the lower mike (top spectrogram) 150.3 mS later. In the example here, the quality
of the recording and structure of the call allow for human accuracy in measuring the time delay of the
call to better than +/- 1 mS. The majority of calls measured during this study were measured with
such accuracy.
There are limited possibilities for the location of the bird based on a 150.3 time delay. A
simple way to conceive of where the bird call could emanate from is to think about it in two
dimensions and calculate where on the tower the bird would have to be to cause a 150.3 mS time
delay. Assume there is a 200-ft vertical separation between the two microphones, that sound travels
~1000 ft per second, and the bird landed on the tower 25-ft below the top mike. The bird calls and
when the sound has traveled 25-ft to reach to the top mike it has also traveled 25-ft down toward
the lower mike. The sound is now roughly 150-ft from the lower mike and at ~1000-ft/sec it takes
approximately 150 mS to reach it. However, in reality, we do not know where the bird is so we must
calculate all the possible points in space that could yield a 150.3 mS time delay. The definition of a
hyperbola is the locus of points where the difference in their distance from two fixed points is
constant. Here we are looking for such a set of points where the time delay will remain 150.3 mS.
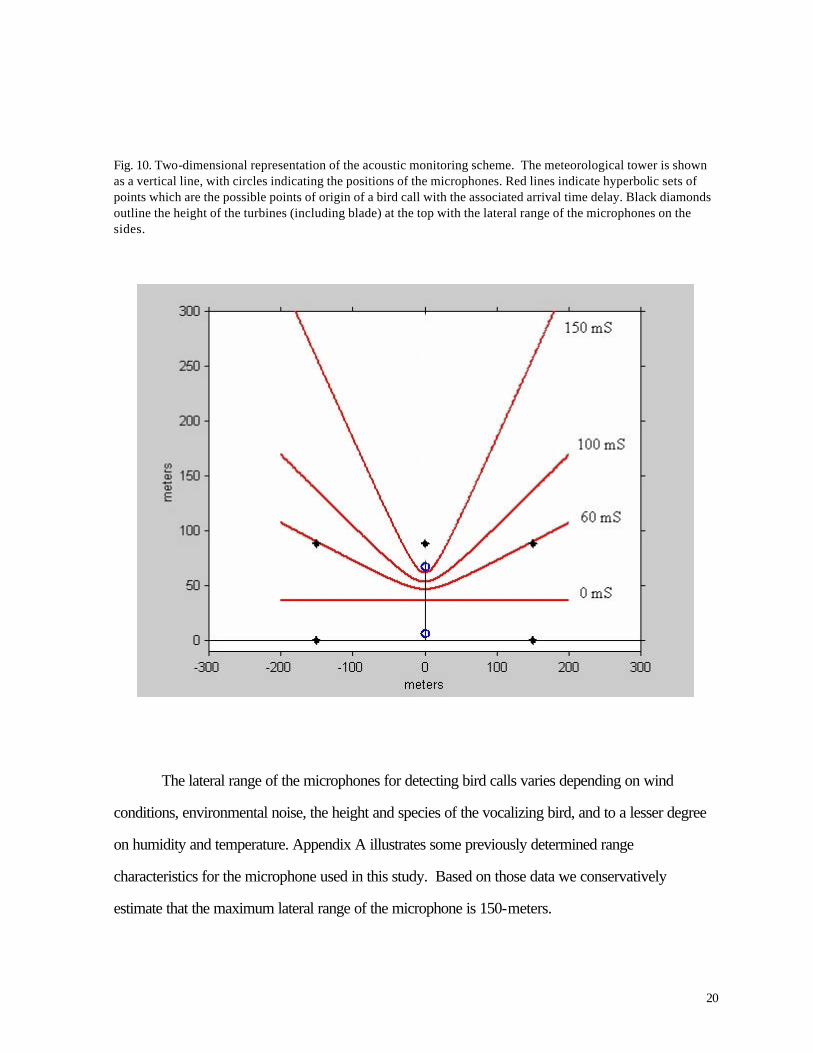
Figure 10 shows a rough rendition of what such a set of points might look like (see red line labeled
150 mS). The blue vertical line represents the tower with the two red circles representing the
19
microphones. The red hyperbolic lines represent the two dimensional sets of points where the
difference in the distance between any one of the points on the line and each of the two microphones
is the same. Each line is labeled with the time delay it represents. Note that a zero time delay is a
perpendicular line that bisects the distance between the two microphones (all the points on the line
are equidistant from the two microphones). Conversely, if a bird calls directly above the
microphones, using a standard speed of sound of 1100-ft/sec and assuming the mikes are 200-ft
apart, the time delay in the sound arriving at the lower mike would be ~181 mS.
In this study we are able to evaluate three dimensions. The set of points from which a bird
call could originate and have a 150 mS time delay is shaped like an inverted cone with a rounded
point. As the time delay gets larger the shape of the cone narrows and the bird's possible positions
become localized more over the top of the tower. As the time delay lowers, the bird's possible
positions become less localized over the top of the tower and may actually be below the tower. A
call with a zero time delay (arriving at both the microphones at the same time) must fall on the plane
that bisects the midpoint between the two microphones on the tower.
20
Fig. 10. Two-dimensional representation of the acoustic monitoring scheme. The meteorological tower is shown as a vertical line, with circles indicating the positions of the microphones. Red lines indicate hyperbolic sets of points which are the possible points of origin of a bird call with the associated arrival time delay. Black diamonds outline the height of the turbines (including blade) at the top with the lateral range of the microphones on the sides.
The lateral range of the microphones for detecting bird calls varies depending on wind
conditions, environmental noise, the height and species of the vocalizing bird, and to a lesser degree
on humidity and temperature. Appendix A illustrates some previously determined range
characteristics for the microphone used in this study. Based on those data we conservatively
estimate that the maximum lateral range of the microphone is 150-meters.
21
Mortality Assessment
Intensive searches for bird carcasses at the wind turbines began in late July 1999 and
continued through September 2000. During this period researchers visited all localities approximately
twice weekly except during the peak of spring migration (April and May) and fall migration (late
August and September) 2000, when the sites were visited every day. Weekly visits continued through
March, 2001, followed by another intensive (daily) schedule during April and May, 2001. Additional
visits (approximately 3 per week) were completed during June and July 2001 as part of experiments to
assess observer efficiency. At each separate wind turbine (sample), the observer walked a series of 9
linear 60 m transects separated by approximately 15 m. Altogether the sample area encompassed a 60
m x 60 m area centered on one of the wind turbines. Results were recorded on standardized data
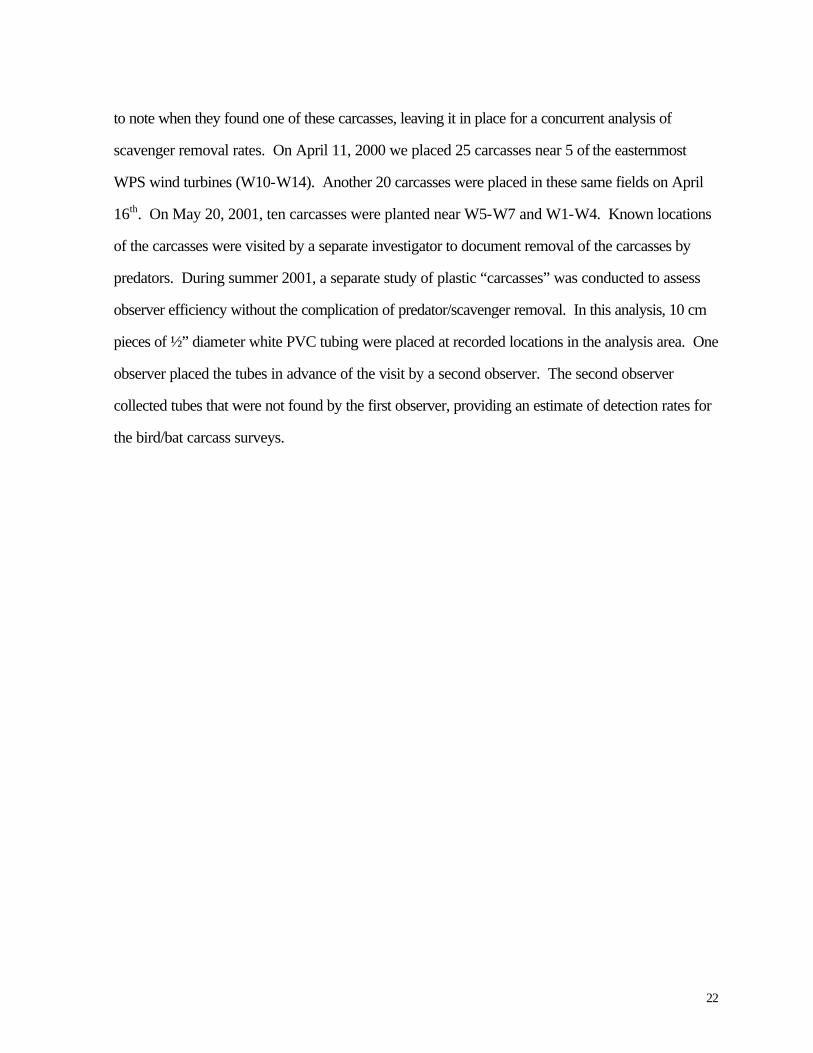
forms (Figure 11), which documented the pattern of animal mortality with respect to the turbine.
During 2001, observers also looked for carcasses along the access roads, providing a means to assess
mortality beyond 60 m from the base of the turbine. Surveys were conducted primarily between
sunrise and 11:00 a.m. All bird carcasses and bird parts encountered along the route were collected,
labeled, and brought to the Richter Museum of Natural History at UW-Green Bay for identification.
Field observers also recorded birds observed within 100 m of the tower. In addition to bird data, land
use within the 120 m x 120 m area was recorded on standardized forms during 1999.
In order to gain a meaningful estimate of actual mortality at the wind turbines, the observed
numbers of carcasses must be adjusted to account for specimens that were overlooked or removed
by scavengers. House cats were seen frequently in the area, and tracks of raccoons, rodents, and
skunks also were observed by field workers. We conducted several sampling efficiency experiments
to help quantify observer efficiency and scavenger removal. During two separate periods (April
2000 and May 2001), bird carcasses obtained from the Richter Museum of Natural History were
placed in the fields surrounding a subset of the turbines. These carcasses represented a variety of
species, ranging in size from warblers (e.g., Nashville Warbler, Ovenbird, Common Yellowthroat) to
Vireos (mostly Red-eyed) and small sparrows (e.g., Swamp Sparrow). Observers were instructed
22
to note when they found one of these carcasses, leaving it in place for a concurrent analysis of
scavenger removal rates. On April 11, 2000 we placed 25 carcasses near 5 of the easternmost
WPS wind turbines (W10-W14). Another 20 carcasses were placed in these same fields on April
16th. On May 20, 2001, ten carcasses were planted near W5-W7 and W1-W4. Known locations
of the carcasses were visited by a separate investigator to document removal of the carcasses by
predators. During summer 2001, a separate study of plastic “carcasses” was conducted to assess
observer efficiency without the complication of predator/scavenger removal. In this analysis, 10 cm
pieces of ½” diameter white PVC tubing were placed at recorded locations in the analysis area. One
observer placed the tubes in advance of the visit by a second observer. The second observer
collected tubes that were not found by the first observer, providing an estimate of detection rates for
the bird/bat carcass surveys.
23
Figure 11. Standardized data form used for investigation of bird and bat mortality.
Windtower Mortality Study
Date
Start End
Observer
Temp.
Wind
Sky
Notes
0 = no wind 1 = 1-3 mph 2 = 4-7 mph 3 = 8-12 mph 4 = > 12 mph 0 = < 10% clouds 1 = partly cloudy 2 = mostly cloudy 3 = overcast 4 = raining
Specimens Collected
Code
Species
Tower
Direction
(Ε)
Distance
Time
Substrate
Notes
1
2
3
4
5
6
7
8
9
10
Towers Visited: WPS 1 2 3 4 5 6 7 8 9 10 11 12 13 14 Roads (distance): ___ ___ ___ ___ ___ ___ ___ ___ ___ ___ ___ ___ ___ ___ Towers Visited: MGE 1 2 3 4 5 6 7 8 9 10 11 12 13 14 15 16 17 Roads (distance): ___ ___ ___ ___ ___ ___ ___ ___ ___ ___ ___ ___ ___ ___ ___ ___ ___
Raptors / Notable Observations
Code
Species
Time
Tower
Notes
1
2
3
4
5
24
RESULTS
Diurnal Birds
Overall, 165 bird species were reported during the diurnal field surveys (Appendix C),
including 124 species reported by during 1998 (Erdman 1998). Consistent with the typical
lognormal distribution of species abundances (Preston 1962), most of these species were uncommon
or rare. Indeed, more than 60% of all individuals recorded during this study belonged to just 5
species (Ring-billed Gull, European Starling, Red-winged Blackbird, Canada Goose, and House
Sparrow). All 5 of these abundant species sometimes reach pest levels of abundance in the Great
Lakes region, although Canada Goose also is a popular game bird. Among the 20 most common
species (accounting for nearly 90% of all bird observations), several species are notable. Eastern
Meadowlark, the 23th most abundant species, is a grassland bird that is declining across much of its
range (Sample and Mossman 1998). Together with Bobolink (the 28th most abundant species),
Eastern Meadowlarks are a legitimate conservation concern (see below), and the relatively high
numbers recorded during this study suggest that suitable grassland habitat is extensive in northern
Kewaunee County.
Observers recorded 24 bird species that are listed as endangered, threatened, or special
concern by the Wisconsin Department of Natural Resources or U.S Fish and Wildlife Service (Table
2). Most prominent among these is Peregrine Falcon, a federally endangered species that was
observed during two stops on June 3, 1999 in the “Turbine Area,” approximately 2 miles from the
wind turbines. Two state threatened species, Great Egret and Osprey, were observed on a small
number of occasions during migration and in one case (Great Egret) during the breeding season on
22 June 2001. The Bald Eagle, formerly federally threatened but now de-listed in Wisconsin and
certain other parts of its range, was observed once during diurnal bird surveys and twice by field
workers conducting mortality assessments. All of the remaining listed birds are designated as
Wisconsin “species of special concern,” a designation that carries no legal protection under
endangered/threatened species legislation. Most of these species, however, deserve attention
25
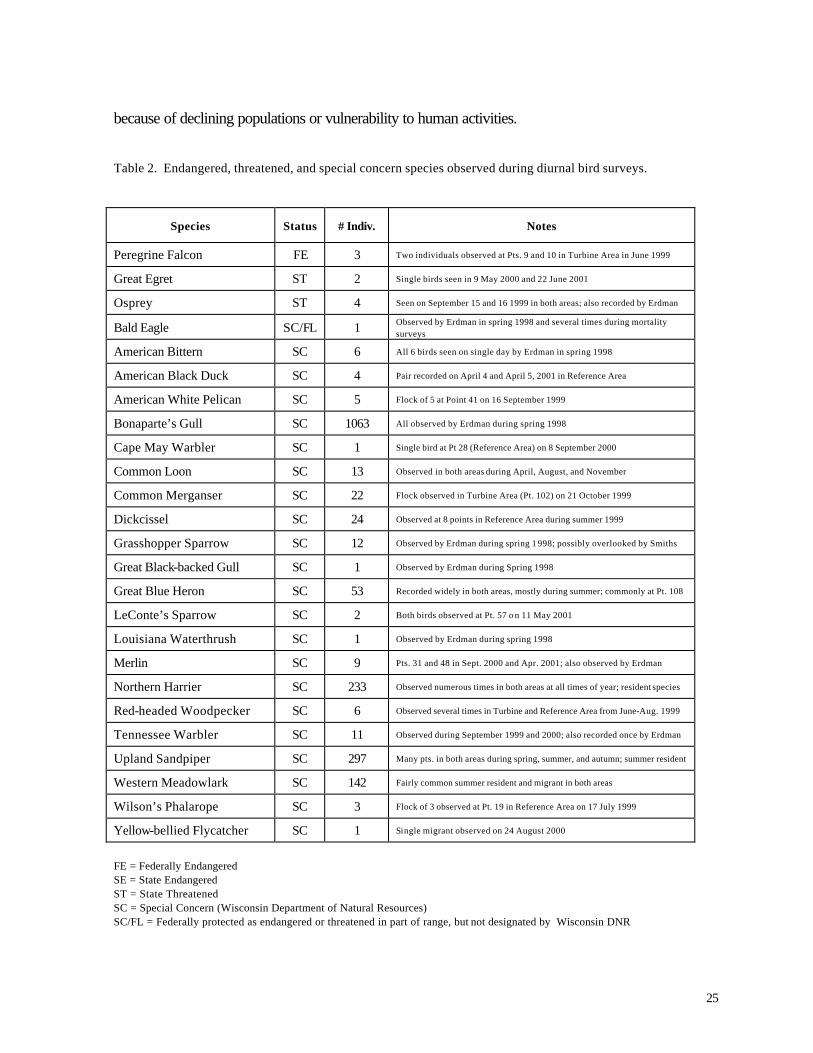
because of declining populations or vulnerability to human activities. Table 2. Endangered, threatened, and special concern species observed during diurnal bird surveys.
Species Status # Indiv. Notes
Peregrine Falcon FE 3 Two individuals observed at Pts. 9 and 10 in Turbine Area in June 1999
Great Egret ST 2 Single birds seen in 9 May 2000 and 22 June 2001
Osprey ST 4 Seen on September 15 and 16 1999 in both areas; also recorded by Erdman
Bald Eagle SC/FL 1 Observed by Erdman in spring 1998 and several times during mortality surveys
American Bittern SC 6 All 6 birds seen on single day by Erdman in spring 1998
American Black Duck SC 4 Pair recorded on April 4 and April 5, 2001 in Reference Area
American White Pelican SC 5 Flock of 5 at Point 41 on 16 September 1999
Bonaparte’s Gull SC 1063 All observed by Erdman during spring 1998
Cape May Warbler SC 1 Single bird at Pt 28 (Reference Area) on 8 September 2000
Common Loon SC 13 Observed in both areas during April, August, and November
Common Merganser SC 22 Flock observed in Turbine Area (Pt. 102) on 21 October 1999
Dickcissel SC 24 Observed at 8 points in Reference Area during summer 1999
Grasshopper Sparrow SC 12 Observed by Erdman during spring 1 998; possibly overlooked by Smiths
Great Black-backed Gull SC 1 Observed by Erdman during Spring 1998
Great Blue Heron SC 53 Recorded widely in both areas, mostly during summer; commonly at Pt. 108
LeConte’s Sparrow SC 2 Both birds observed at Pt. 57 o n 11 May 2001
Louisiana Waterthrush SC 1 Observed by Erdman during spring 1998
Merlin SC 9 Pts. 31 and 48 in Sept. 2000 and Apr. 2001; also observed by Erdman
Northern Harrier SC 233 Observed numerous times in both areas at all times of year; resident species
Red-headed Woodpecker SC 6 Observed several times in Turbine and Reference Area from June-Aug. 1999
Tennessee Warbler SC 11 Observed during September 1999 and 2000; also recorded once by Erdman
Upland Sandpiper SC 297 Many pts. in both areas during spring, summer, and autumn; summer resident
Western Meadowlark SC 142 Fairly common summer resident and migrant in both areas
Wilson’s Phalarope SC 3 Flock of 3 observed at Pt. 19 in Reference Area on 17 July 1999
Yellow-bellied Flycatcher SC 1 Single migrant observed on 24 August 2000
FE = Federally Endangered SE = State Endangered ST = State Threatened SC = Special Concern (Wisconsin Department of Natural Resources) SC/FL = Federally protected as endangered or threatened in part of range, but not designated by Wisconsin DNR
26
Bonaparte’s Gull, a coastal migrant of special concern, was reported by Erdman (1998)
during late April. These gulls searched for food behind farmers’ plows, a behavior that is frequently
exhibited by Ring-billed Gulls throughout this region. Bonaparte’s Gulls, which do not breed
regularly in Wisconsin (Robbins 1991), were not observed during subsequent breeding seasons or
during April 2001.
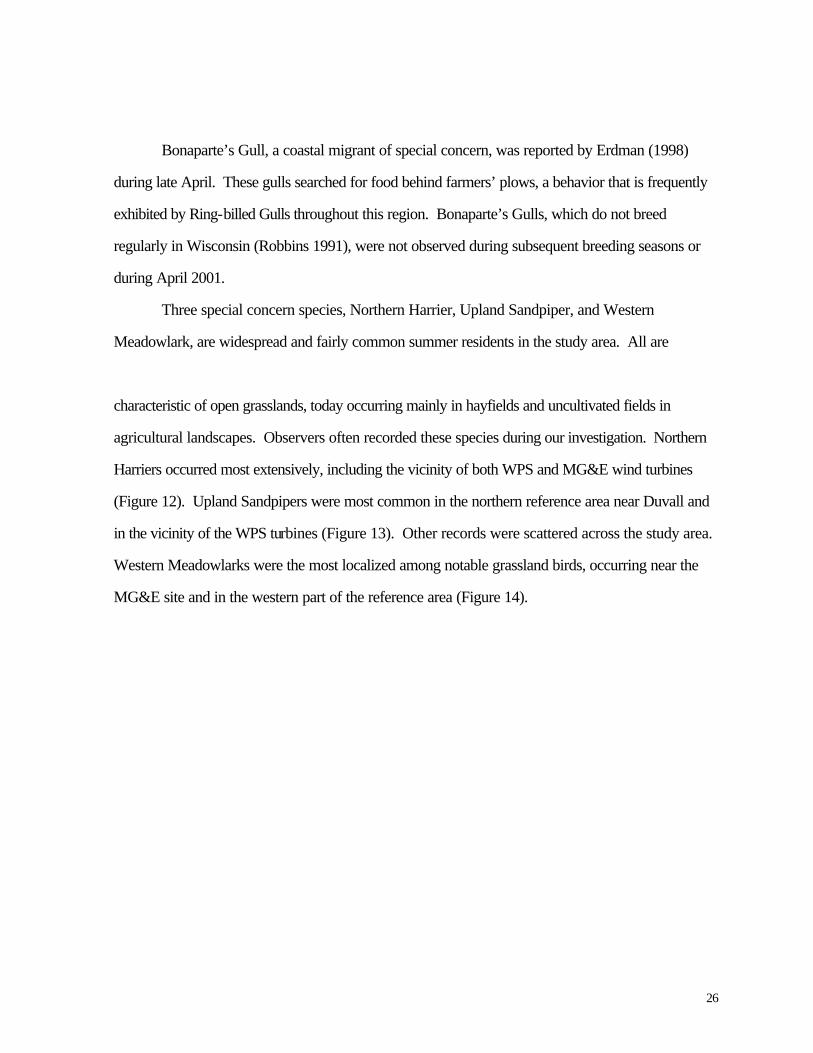
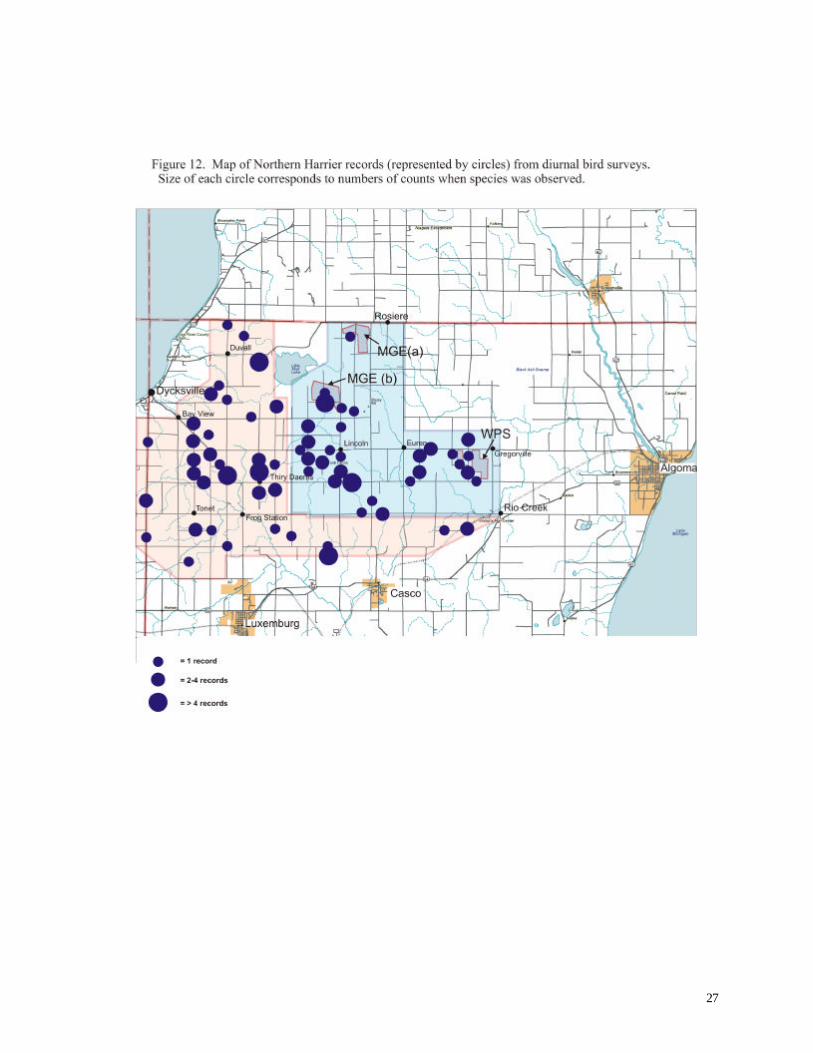
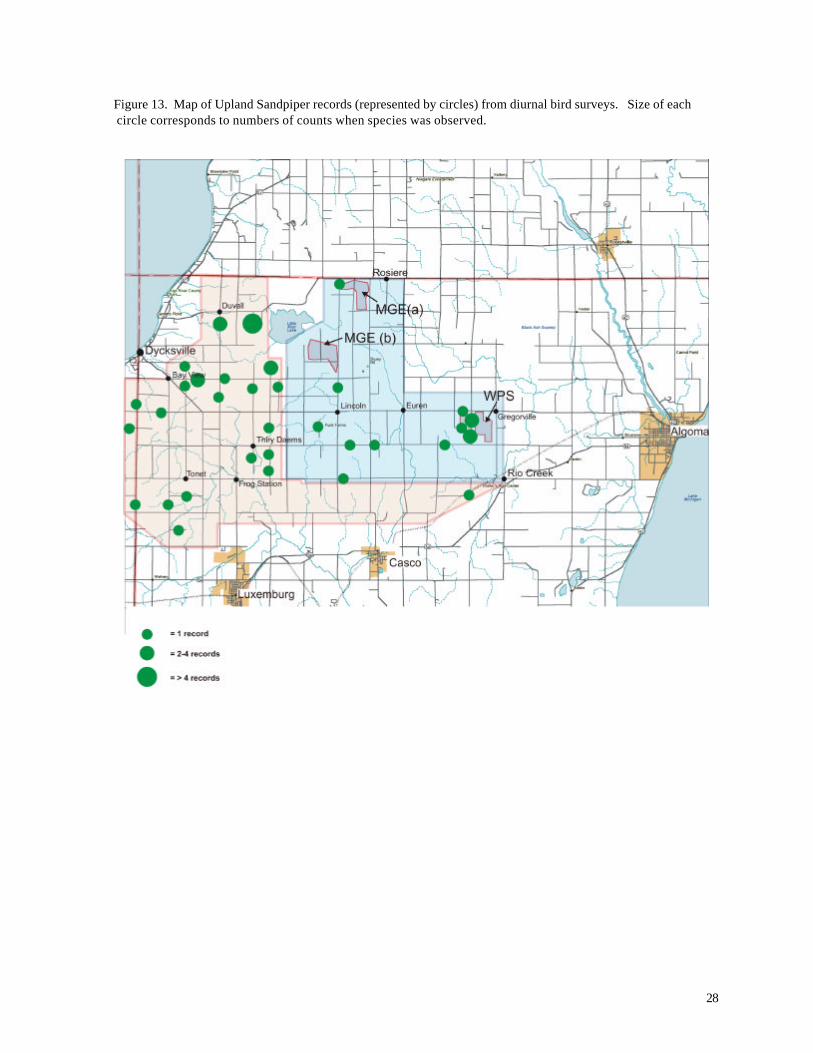
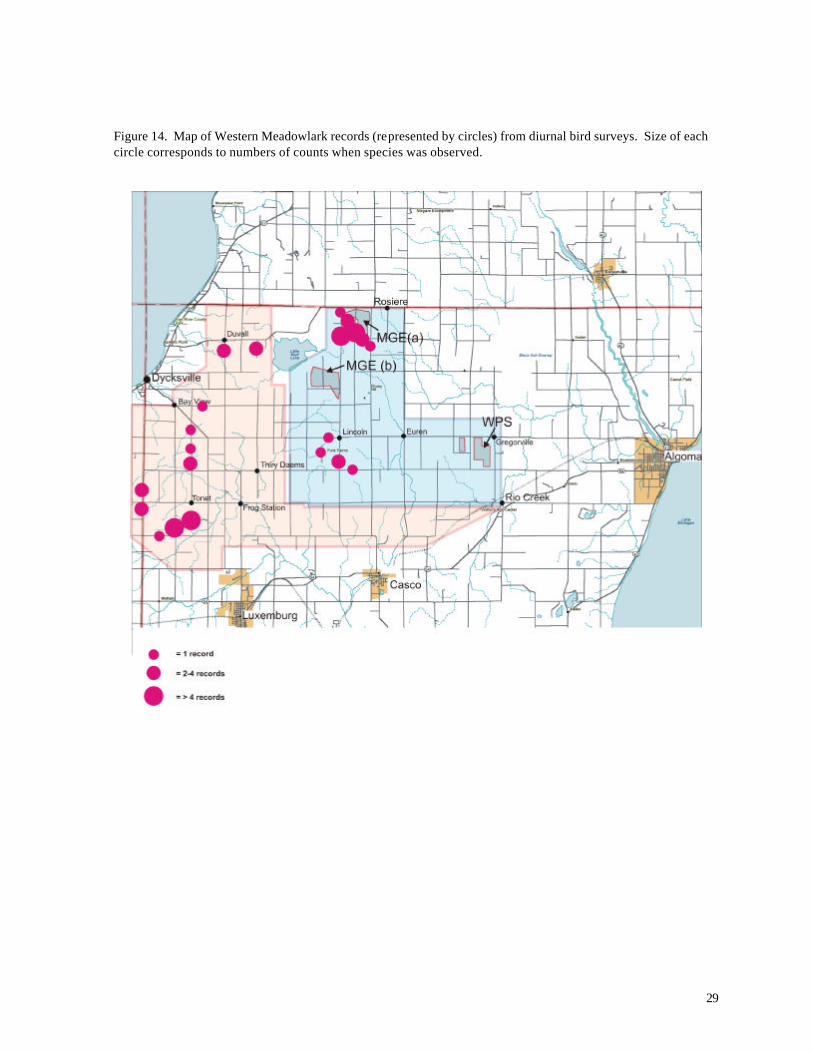
Three special concern species, Northern Harrier, Upland Sandpiper, and Western
Meadowlark, are widespread and fairly common summer residents in the study area. All are
characteristic of open grasslands, today occurring mainly in hayfields and uncultivated fields in
agricultural landscapes. Observers often recorded these species during our investigation. Northern
Harriers occurred most extensively, including the vicinity of both WPS and MG&E wind turbines
(Figure 12). Upland Sandpipers were most common in the northern reference area near Duvall and
in the vicinity of the WPS turbines (Figure 13). Other records were scattered across the study area.
Western Meadowlarks were the most localized among notable grassland birds, occurring near the
MG&E site and in the western part of the reference area (Figure 14).
27
28
Figure 13. Map of Upland Sandpiper records (represented by circles) from diurnal bird surveys. Size of each circle corresponds to numbers of counts when species was observed.
29
Figure 14. Map of Western Meadowlark records (represented by circles) from diurnal bird surveys. Size of each circle corresponds to numbers of counts when species was observed.
30
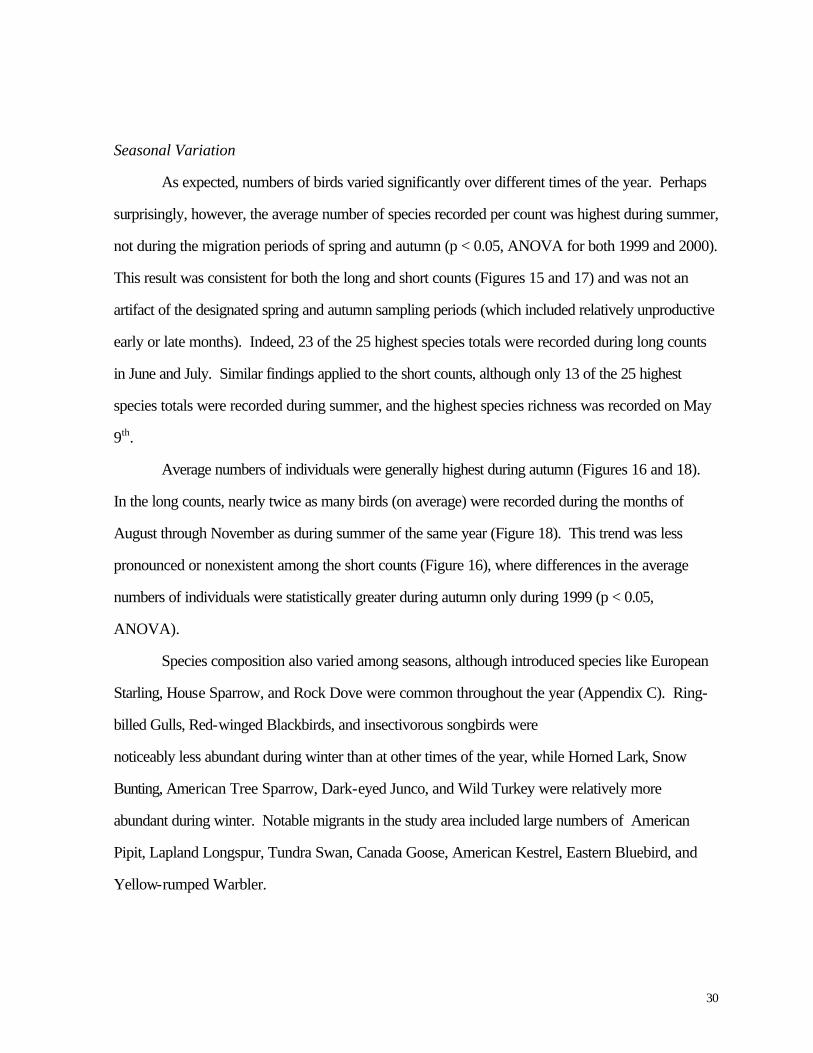
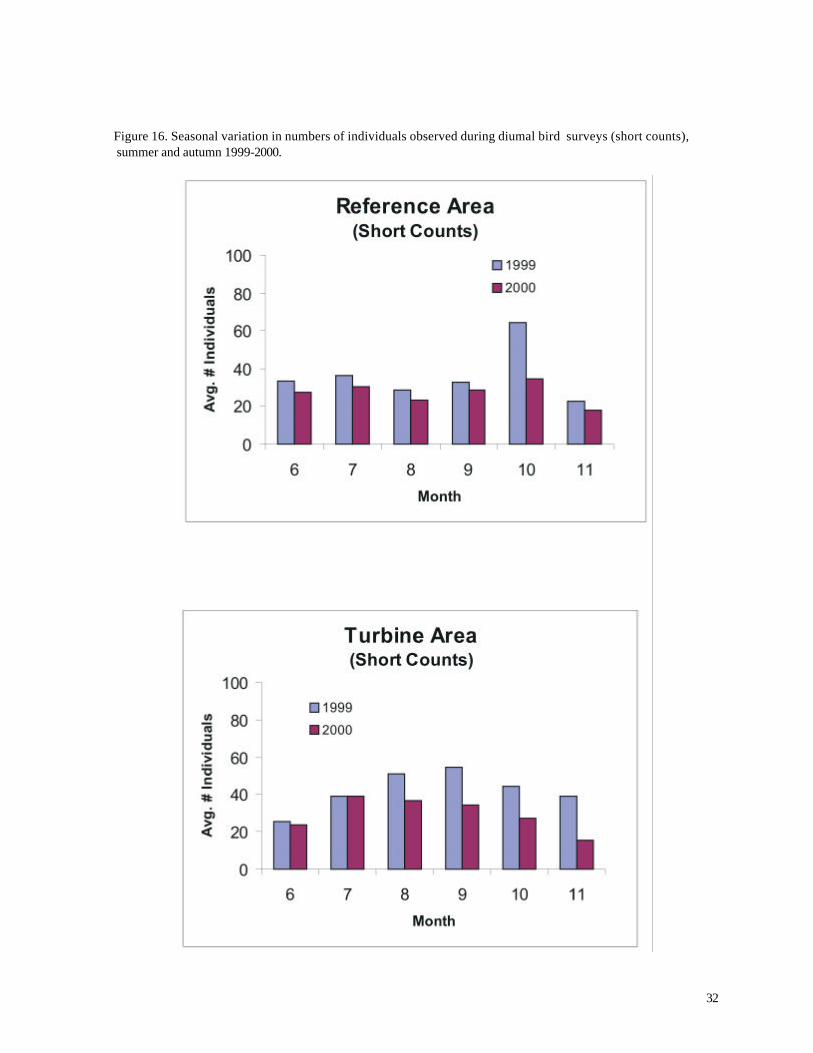
Seasonal Variation
As expected, numbers of birds varied significantly over different times of the year. Perhaps
surprisingly, however, the average number of species recorded per count was highest during summer,
not during the migration periods of spring and autumn (p < 0.05, ANOVA for both 1999 and 2000).
This result was consistent for both the long and short counts (Figures 15 and 17) and was not an
artifact of the designated spring and autumn sampling periods (which included relatively unproductive
early or late months). Indeed, 23 of the 25 highest species totals were recorded during long counts
in June and July. Similar findings applied to the short counts, although only 13 of the 25 highest
species totals were recorded during summer, and the highest species richness was recorded on May
9th.
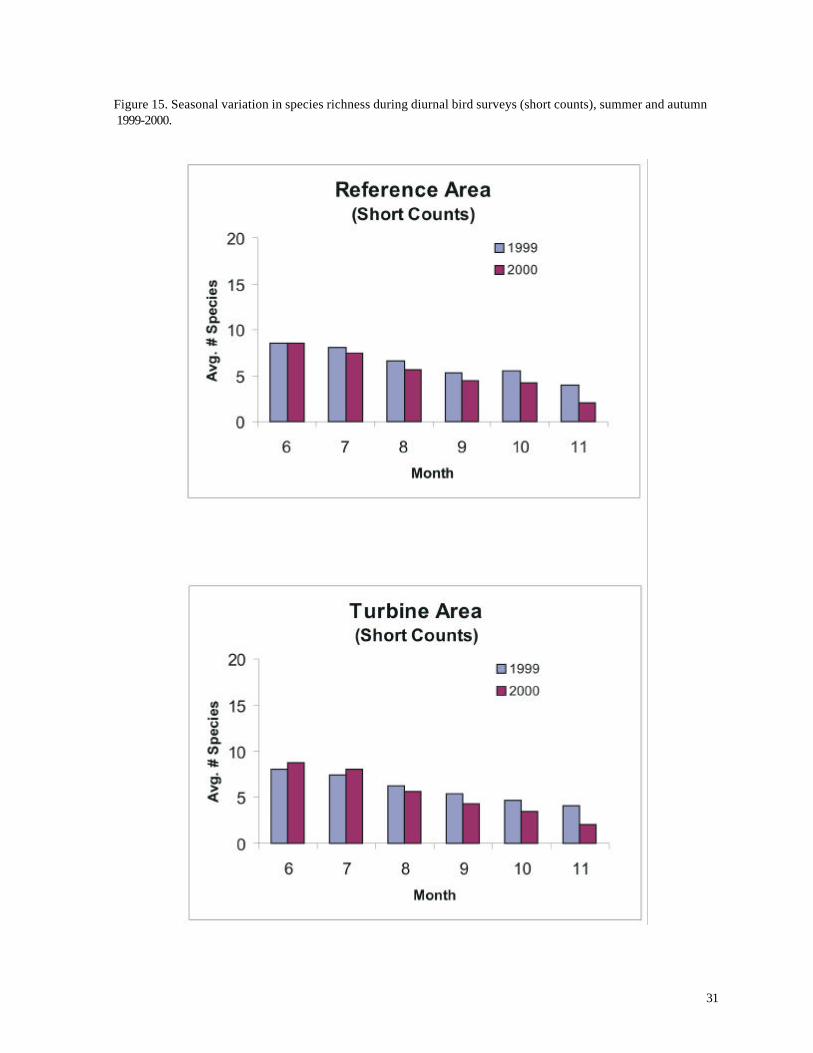
Average numbers of individuals were generally highest during autumn (Figures 16 and 18).
In the long counts, nearly twice as many birds (on average) were recorded during the months of
August through November as during summer of the same year (Figure 18). This trend was less
pronounced or nonexistent among the short counts (Figure 16), where differences in the average
numbers of individuals were statistically greater during autumn only during 1999 (p < 0.05,
ANOVA).
Species composition also varied among seasons, although introduced species like European
Starling, House Sparrow, and Rock Dove were common throughout the year (Appendix C). Ring-
billed Gulls, Red-winged Blackbirds, and insectivorous songbirds were
noticeably less abundant during winter than at other times of the year, while Horned Lark, Snow
Bunting, American Tree Sparrow, Dark-eyed Junco, and Wild Turkey were relatively more
abundant during winter. Notable migrants in the study area included large numbers of American
Pipit, Lapland Longspur, Tundra Swan, Canada Goose, American Kestrel, Eastern Bluebird, and
Yellow-rumped Warbler.
31
Figure 15. Seasonal variation in species richness during diurnal bird surveys (short counts), summer and autumn 1999-2000.
32
Figure 16. Seasonal variation in numbers of individuals observed during diurnal bird surveys (short counts), summer and autumn 1999-2000.
33
Figure 17. Seasonal variation in species richness during diurnal bird surveys (long counts), summer and autumn 1999-2000.
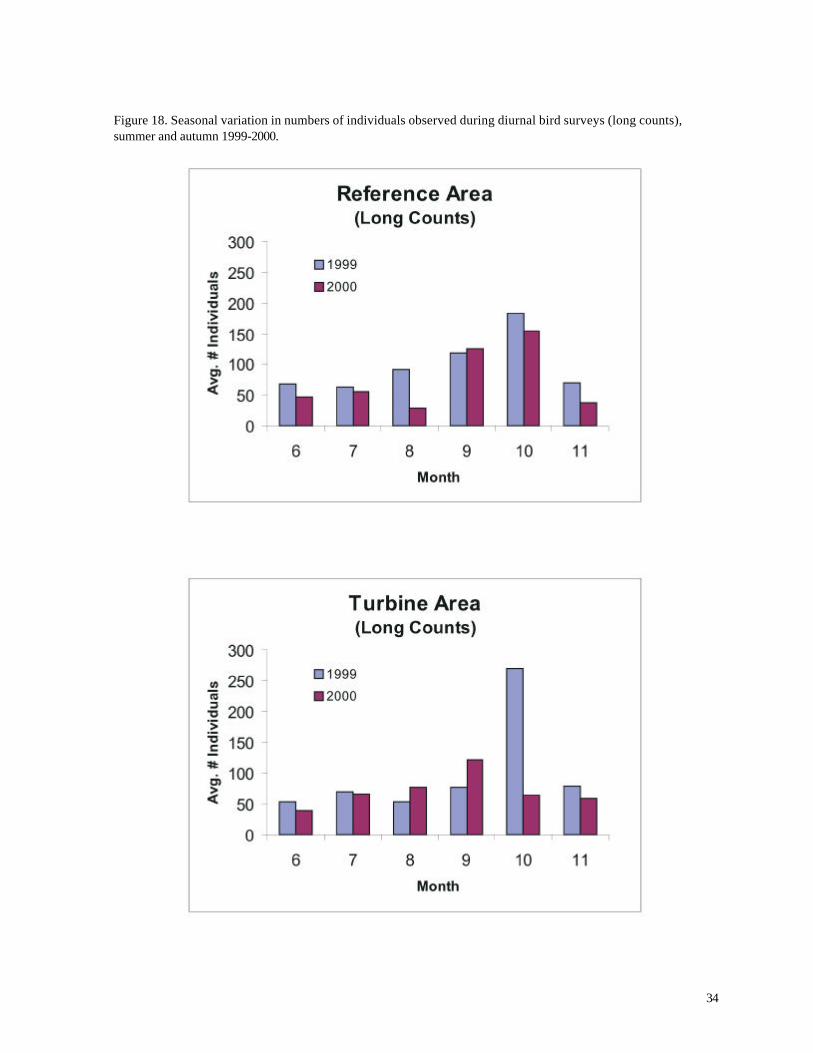
34
Figure 18. Seasonal variation in numbers of individuals observed during diurnal bird surveys (long counts), summer and autumn 1999-2000.
35
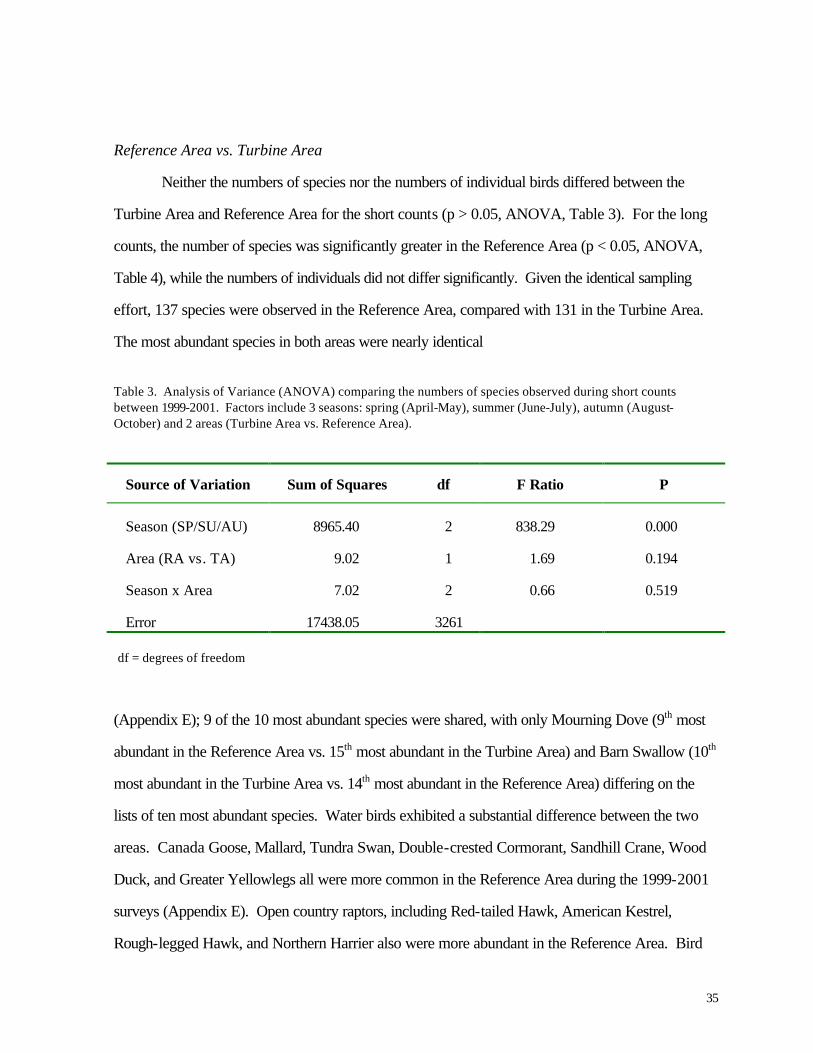
Reference Area vs. Turbine Area
Neither the numbers of species nor the numbers of individual birds differed between the
Turbine Area and Reference Area for the short counts (p > 0.05, ANOVA, Table 3). For the long
counts, the number of species was significantly greater in the Reference Area (p < 0.05, ANOVA,
Table 4), while the numbers of individuals did not differ significantly. Given the identical sampling
effort, 137 species were observed in the Reference Area, compared with 131 in the Turbine Area.
The most abundant species in both areas were nearly identical
Table 3. Analysis of Variance (ANOVA) comparing the numbers of species observed during short counts between 1999-2001. Factors include 3 seasons: spring (April-May), summer (June-July), autumn (August-October) and 2 areas (Turbine Area vs. Reference Area).
Source of Variation Sum of Squares df F Ratio P
Season (SP/SU/AU) 8965.40 2 838.29 0.000
Area (RA vs. TA) 9.02 1 1.69 0.194
Season x Area 7.02 2 0.66 0.519
Error 17438.05 3261
df = degrees of freedom
(Appendix E); 9 of the 10 most abundant species were shared, with only Mourning Dove (9th most
abundant in the Reference Area vs. 15th most abundant in the Turbine Area) and Barn Swallow (10th
most abundant in the Turbine Area vs. 14th most abundant in the Reference Area) differing on the
lists of ten most abundant species. Water birds exhibited a substantial difference between the two
areas. Canada Goose, Mallard, Tundra Swan, Double-crested Cormorant, Sandhill Crane, Wood
Duck, and Greater Yellowlegs all were more common in the Reference Area during the 1999-2001
surveys (Appendix E). Open country raptors, including Red-tailed Hawk, American Kestrel,
Rough-legged Hawk, and Northern Harrier also were more abundant in the Reference Area. Bird
36
species that were more common in the Turbine Area included Ring-billed Gull, European Starling,
House Sparrow, Common Grackle, Cedar Waxwing, Yellow Warbler, and Alder Flycatcher.
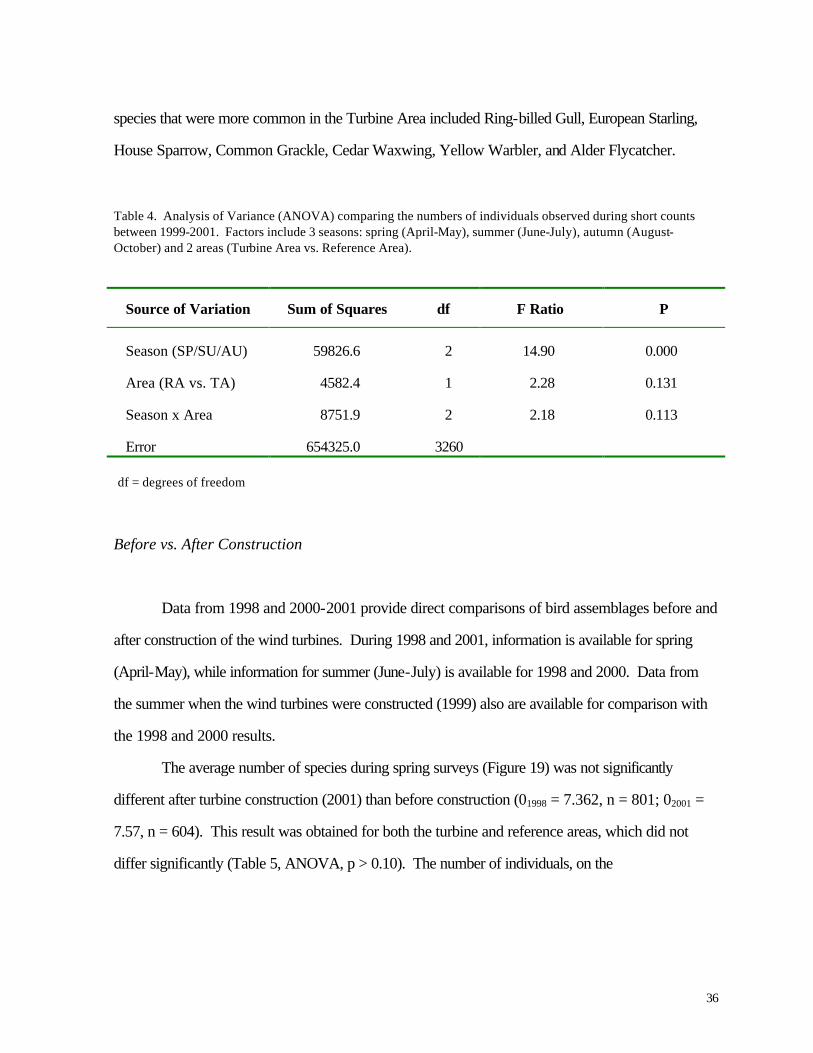
Table 4. Analysis of Variance (ANOVA) comparing the numbers of individuals observed during short counts between 1999-2001. Factors include 3 seasons: spring (April-May), summer (June-July), autumn (August-October) and 2 areas (Turbine Area vs. Reference Area).
Source of Variation Sum of Squares df F Ratio P
Season (SP/SU/AU) 59826.6 2 14.90 0.000
Area (RA vs. TA) 4582.4 1 2.28 0.131
Season x Area 8751.9 2 2.18 0.113
Error 654325.0 3260
df = degrees of freedom
Before vs. After Construction
Data from 1998 and 2000-2001 provide direct comparisons of bird assemblages before and
after construction of the wind turbines. During 1998 and 2001, information is available for spring
(April-May), while information for summer (June-July) is available for 1998 and 2000. Data from
the summer when the wind turbines were constructed (1999) also are available for comparison with
the 1998 and 2000 results.
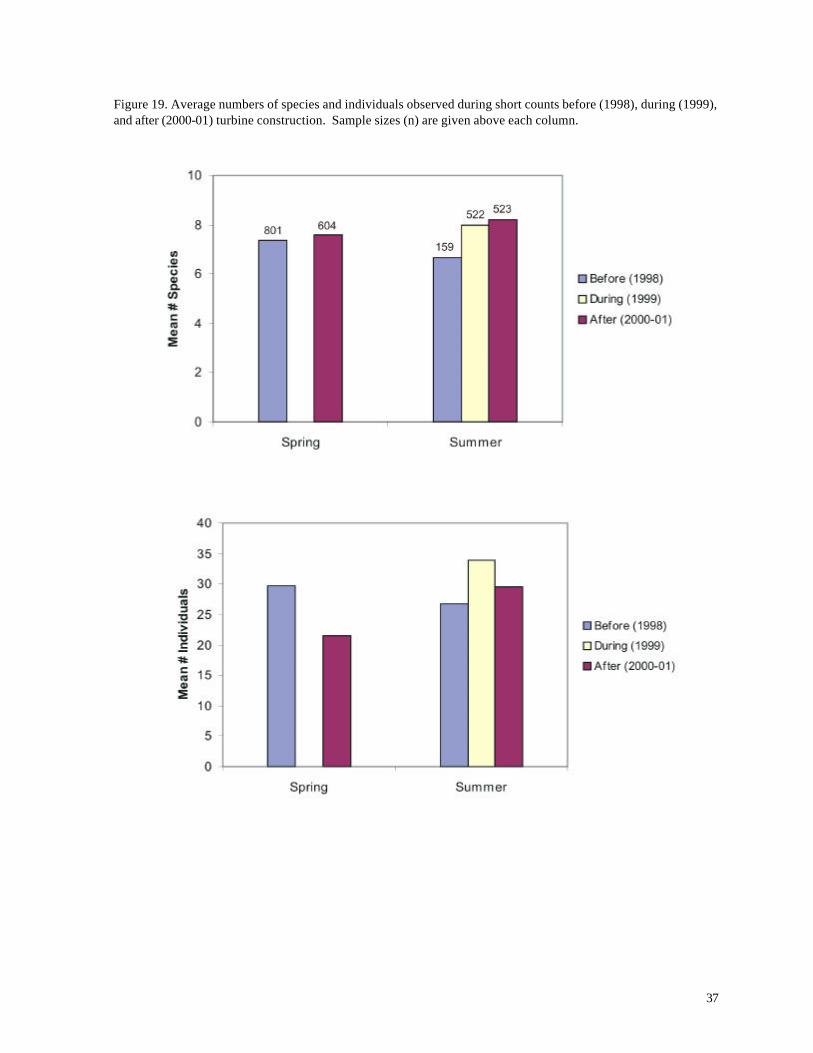
The average number of species during spring surveys (Figure 19) was not significantly
different after turbine construction (2001) than before construction (01998 = 7.362, n = 801; 02001 =
7.57, n = 604). This result was obtained for both the turbine and reference areas, which did not
differ significantly (Table 5, ANOVA, p > 0.10). The number of individuals, on the
37
Figure 19. Average numbers of species and individuals observed during short counts before (1998), during (1999), and after (2000-01) turbine construction. Sample sizes (n) are given above each column.
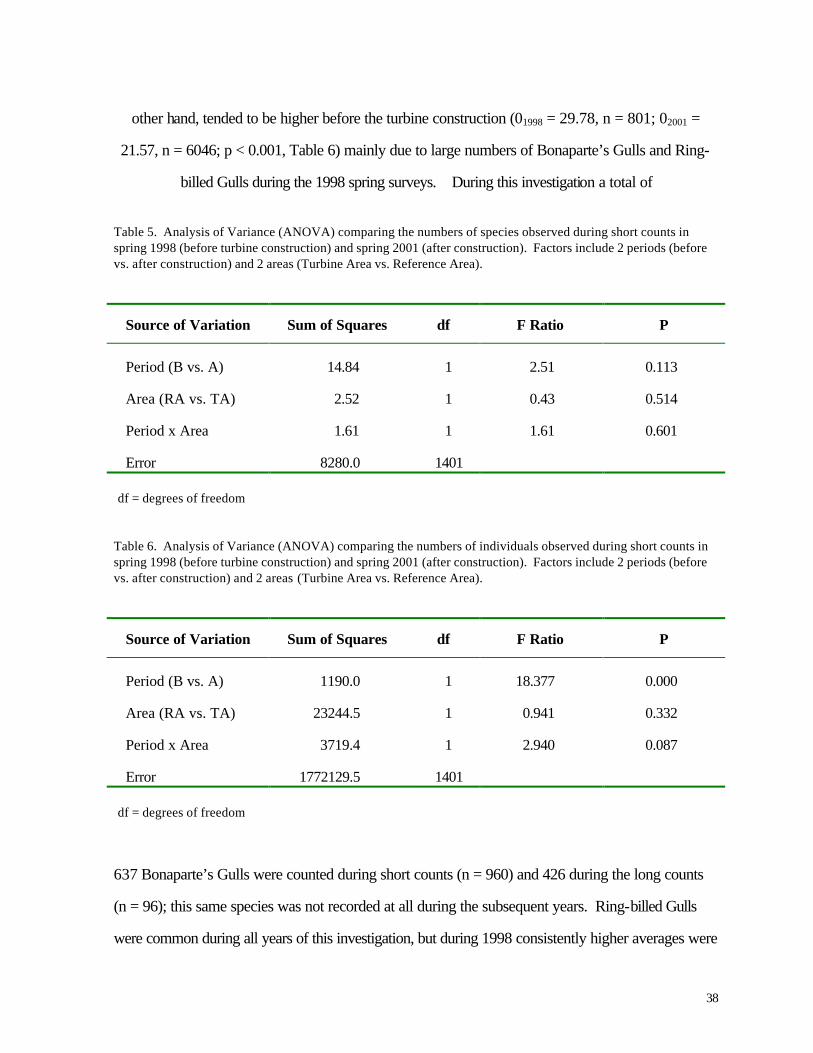
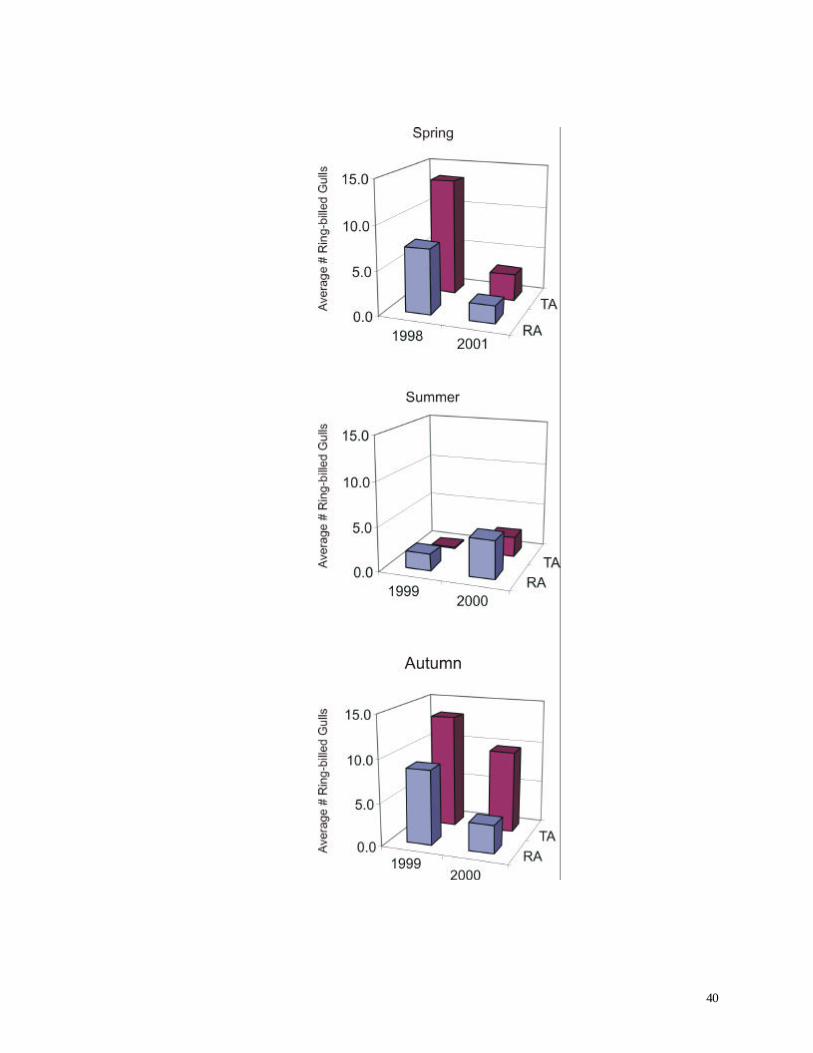
38
other hand, tended to be higher before the turbine construction (01998 = 29.78, n = 801; 02001 =
21.57, n = 6046; p < 0.001, Table 6) mainly due to large numbers of Bonaparte’s Gulls and Ring-
billed Gulls during the 1998 spring surveys. During this investigation a total of
Table 5. Analysis of Variance (ANOVA) comparing the numbers of species observed during short counts in spring 1998 (before turbine construction) and spring 2001 (after construction). Factors include 2 periods (before vs. after construction) and 2 areas (Turbine Area vs. Reference Area).
Source of Variation Sum of Squares df F Ratio P
Period (B vs. A) 14.84 1 2.51 0.113
Area (RA vs. TA) 2.52 1 0.43 0.514
Period x Area 1.61 1 1.61 0.601
Error 8280.0 1401
df = degrees of freedom
Table 6. Analysis of Variance (ANOVA) comparing the numbers of individuals observed during short counts in spring 1998 (before turbine construction) and spring 2001 (after construction). Factors include 2 periods (before vs. after construction) and 2 areas (Turbine Area vs. Reference Area).
Source of Variation Sum of Squares df F Ratio P
Period (B vs. A) 1190.0 1 18.377 0.000
Area (RA vs. TA) 23244.5 1 0.941 0.332
Period x Area 3719.4 1 2.940 0.087
Error 1772129.5 1401
df = degrees of freedom
637 Bonaparte’s Gulls were counted during short counts (n = 960) and 426 during the long counts
(n = 96); this same species was not recorded at all during the subsequent years. Ring-billed Gulls
were common during all years of this investigation, but during 1998 consistently higher averages were
39
recorded at both the turbine and reference areas (Fig. 20). Apparently gulls were particularly
abundant in the study area during 1998. No significant difference was observed between the turbine
and reference areas (Table 6, ANOVA, p > .30).
Unlike the result from spring surveys, the number of species during summer was significantly
greater after turbine construction than before construction (01998 = 6.67, n = 159; 02001 = 8.631, n =
282, p < 0.001, t-test). This result applied to both the reference and turbine areas, which did not
differ significantly in numbers of species (p > 0.25, ANOVA). Sampling period might have
contributed to this difference; the 1998 summer surveys were completed during early June, whereas
surveys during the later years included all of June and July. The average number of species during
the year of construction (1999) was similar to the average after construction (Figure 19).
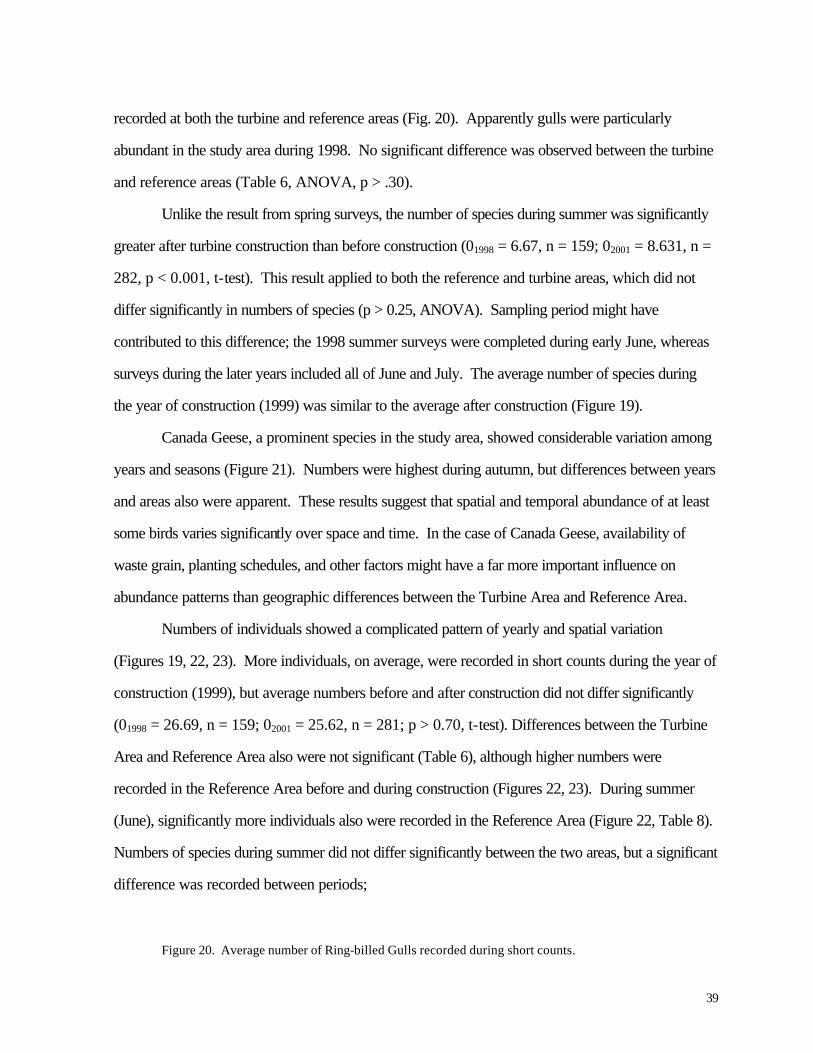
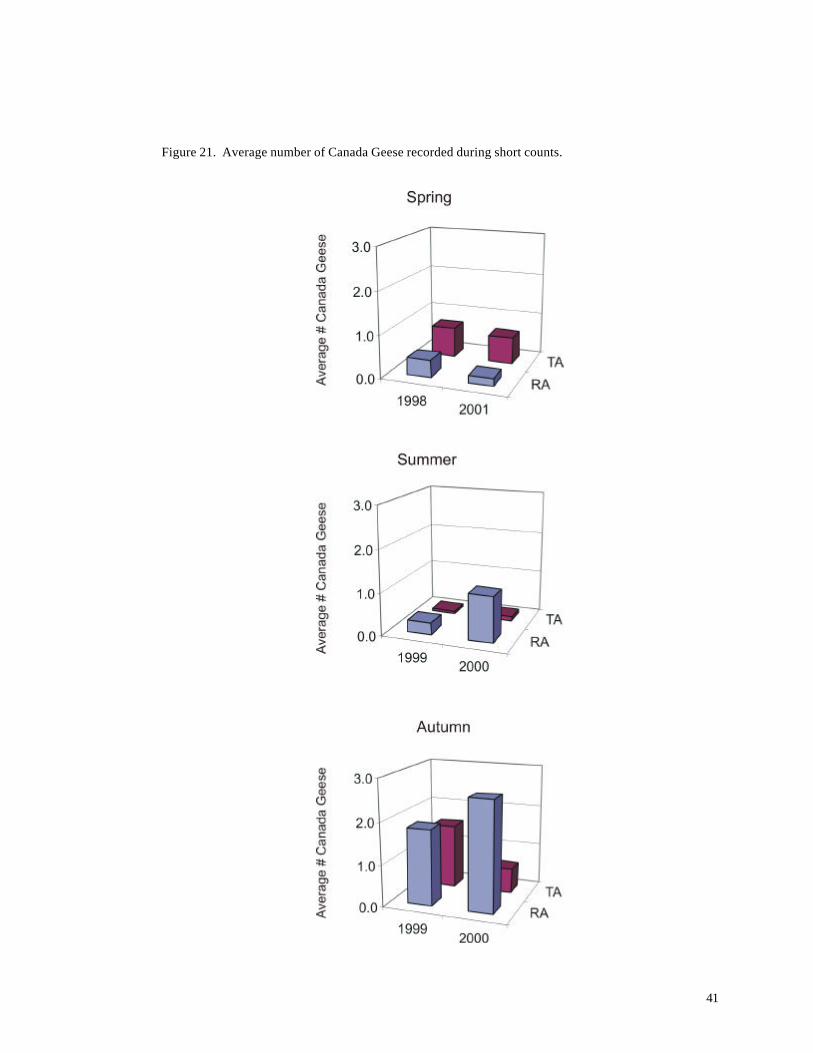
Canada Geese, a prominent species in the study area, showed considerable variation among
years and seasons (Figure 21). Numbers were highest during autumn, but differences between years
and areas also were apparent. These results suggest that spatial and temporal abundance of at least
some birds varies significantly over space and time. In the case of Canada Geese, availability of
waste grain, planting schedules, and other factors might have a far more important influence on
abundance patterns than geographic differences between the Turbine Area and Reference Area.
Numbers of individuals showed a complicated pattern of yearly and spatial variation
(Figures 19, 22, 23). More individuals, on average, were recorded in short counts during the year of
construction (1999), but average numbers before and after construction did not differ significantly
(01998 = 26.69, n = 159; 02001 = 25.62, n = 281; p > 0.70, t-test). Differences between the Turbine
Area and Reference Area also were not significant (Table 6), although higher numbers were
recorded in the Reference Area before and during construction (Figures 22, 23). During summer
(June), significantly more individuals also were recorded in the Reference Area (Figure 22, Table 8).
Numbers of species during summer did not differ significantly between the two areas, but a significant
difference was recorded between periods;
Figure 20. Average number of Ring-billed Gulls recorded during short counts.
40
41
Figure 21. Average number of Canada Geese recorded during short counts.
42
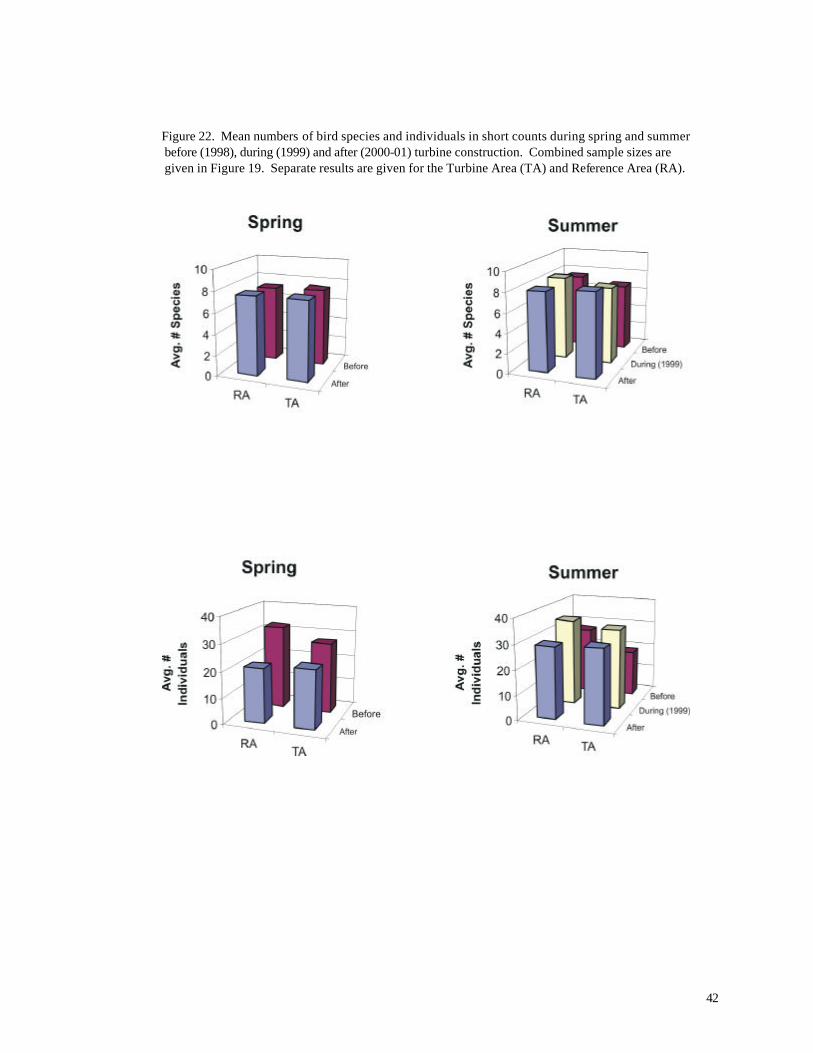
Figure 22. Mean numbers of bird species and individuals in short counts during spring and summer before (1998), during (1999) and after (2000-01) turbine construction. Combined sample sizes are given in Figure 19. Separate results are given for the Turbine Area (TA) and Reference Area (RA).
43
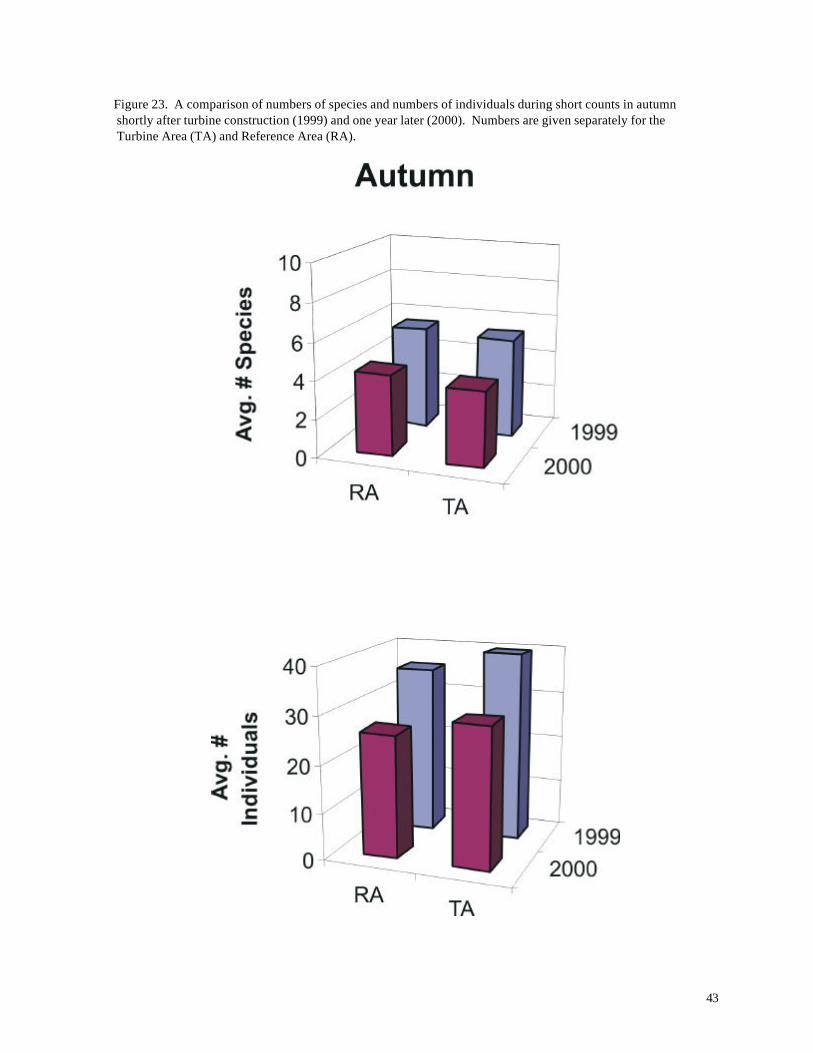
Figure 23. A comparison of numbers of species and numbers of individuals during short counts in autumn shortly after turbine construction (1999) and one year later (2000). Numbers are given separately for the Turbine Area (TA) and Reference Area (RA).
44
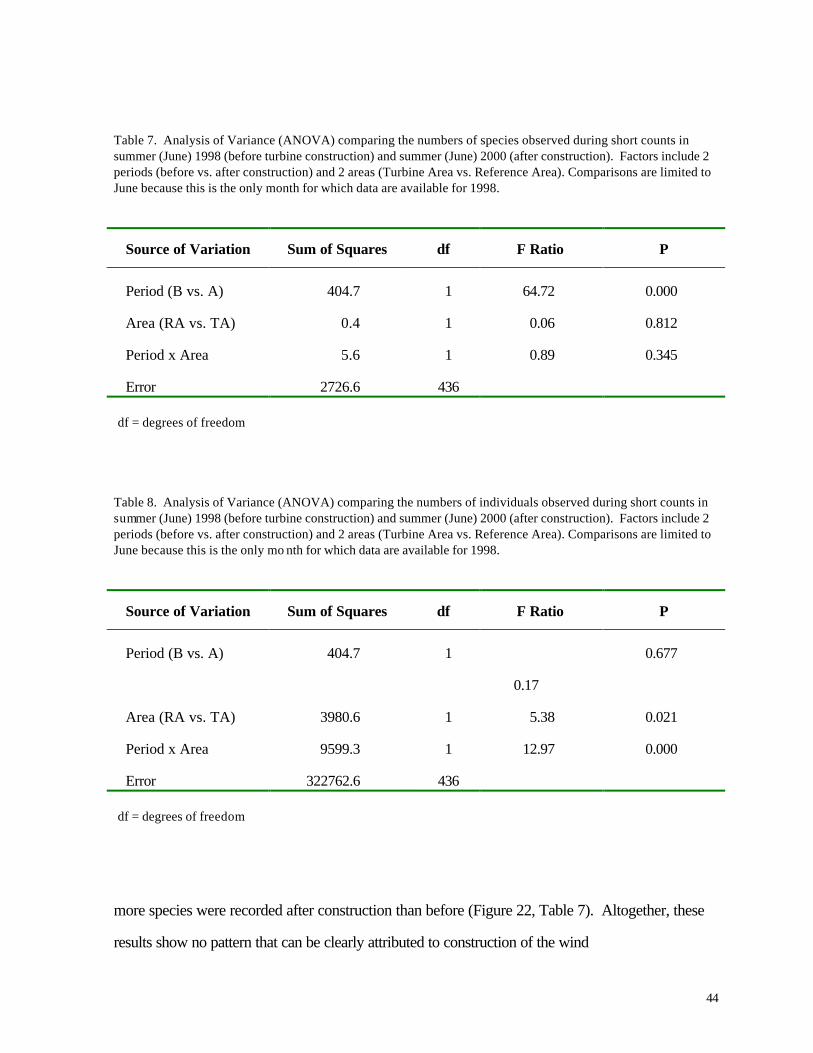
Table 7. Analysis of Variance (ANOVA) comparing the numbers of species observed during short counts in summer (June) 1998 (before turbine construction) and summer (June) 2000 (after construction). Factors include 2 periods (before vs. after construction) and 2 areas (Turbine Area vs. Reference Area). Comparisons are limited to June because this is the only month for which data are available for 1998.
Source of Variation Sum of Squares df F Ratio P
Period (B vs. A) 404.7 1 64.72 0.000
Area (RA vs. TA) 0.4 1 0.06 0.812
Period x Area 5.6 1 0.89 0.345
Error 2726.6 436
df = degrees of freedom
Table 8. Analysis of Variance (ANOVA) comparing the numbers of individuals observed during short counts in summer (June) 1998 (before turbine construction) and summer (June) 2000 (after construction). Factors include 2 periods (before vs. after construction) and 2 areas (Turbine Area vs. Reference Area). Comparisons are limited to June because this is the only mo nth for which data are available for 1998.
Source of Variation Sum of Squares df F Ratio P
Period (B vs. A) 404.7 1
0.17
0.677
Area (RA vs. TA) 3980.6 1 5.38 0.021
Period x Area 9599.3 1 12.97 0.000
Error 322762.6 436
df = degrees of freedom
more species were recorded after construction than before (Figure 22, Table 7). Altogether, these
results show no pattern that can be clearly attributed to construction of the wind
45
turbines. June 1998 surveys were conducted only during the early part of the month, perhaps
accounting for the lower number of species compared with June 2000. Differences between the
Turbine Area and Reference Area are more difficult to explain, but it is quite clear that during spring
and summer neither the numbers of species or numbers of individuals declined significantly in the
Turbine Area relative to the Reference Area.
Comparisons for autumn reveal a somewhat different picture. No significant differences
were observed between the Turbine Area and Reference Area, but significantly fewer species and
individuals were recorded during 2000 (p < 0.01, ANOVA; Figure 23,
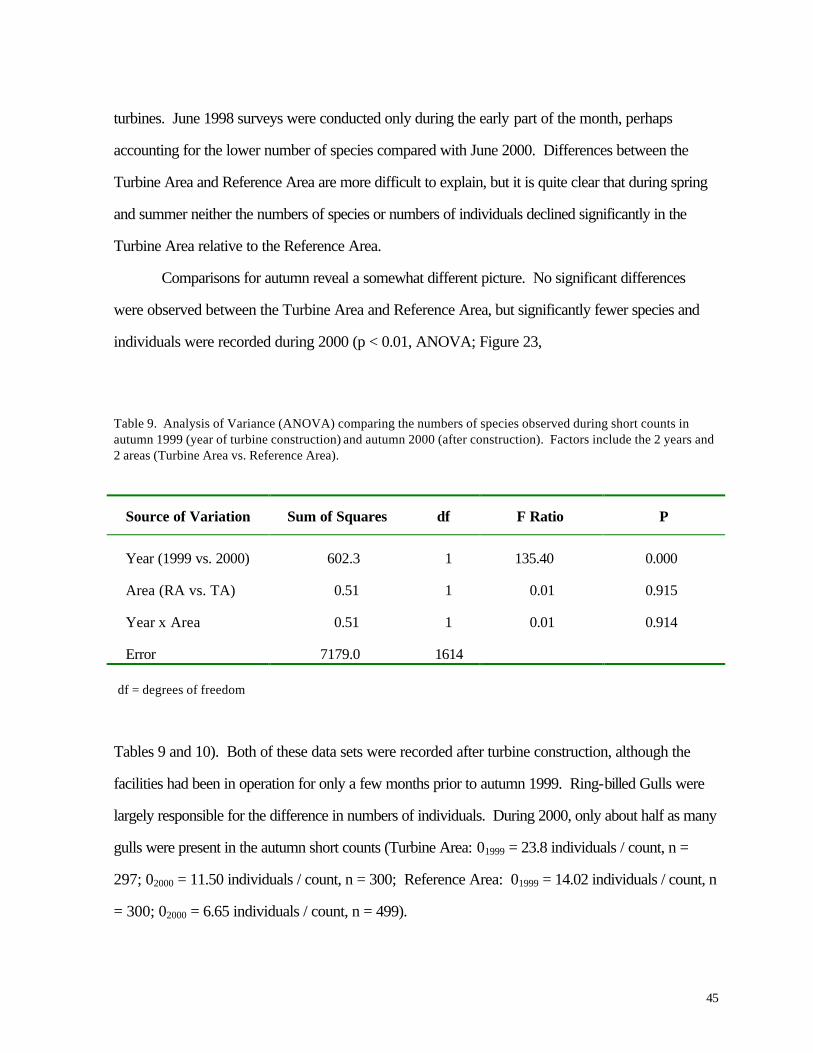
Table 9. Analysis of Variance (ANOVA) comparing the numbers of species observed during short counts in autumn 1999 (year of turbine construction) and autumn 2000 (after construction). Factors include the 2 years and 2 areas (Turbine Area vs. Reference Area).
Source of Variation Sum of Squares df F Ratio P
Year (1999 vs. 2000) 602.3 1 135.40 0.000
Area (RA vs. TA) 0.51 1 0.01 0.915
Year x Area 0.51 1 0.01 0.914
Error 7179.0 1614
df = degrees of freedom
Tables 9 and 10). Both of these data sets were recorded after turbine construction, although the
facilities had been in operation for only a few months prior to autumn 1999. Ring-billed Gulls were
largely responsible for the difference in numbers of individuals. During 2000, only about half as many
gulls were present in the autumn short counts (Turbine Area: 01999 = 23.8 individuals / count, n =
297; 02000 = 11.50 individuals / count, n = 300; Reference Area: 01999 = 14.02 individuals / count, n
= 300; 02000 = 6.65 individuals / count, n = 499).
46
Table 10. Analysis of Variance (ANOVA) comparing the numbers of individuals observed during short counts in autumn 1999 (year of turbine construction) and autumn 2000 (after construction). Factors include the 2 years and 2 areas (Turbine Area vs. Reference Area).
Source of Variation Sum of Squares df F Ratio P
Year (1999 vs. 2000) 76569.1 1 24.93 0.000
Area (RA vs. TA) 7789.0 1 2.54 0.111
Year x Area 7784.1 1 2.54 0.112
Error 495681400.2 1614
df = degrees of freedom
Flight Elevation
When flight elevation was recorded, by far the largest numbers of birds were recorded
below the sweep area of the wind turbines. This is consistent with the 1998 estimates, which indicate
that 7 – 12 % of the birds observed were within the sweep area (42 – 89 m). In 1999-2001
surveys, even fewer birds (generally < 5%) were recorded in the sweep area, although during spring
(the season when most of the 1998 records were acquired), the proportion was very similar to that
reported in 1998 (5.33% in the Reference Area and 13.26% in the Turbine Area). Except for
autumn 1999 and spring 2001, the percentage of birds in the sweep area was higher in the Reference
Area than in the Turbine Area (Table 11). A list of all birds observed within the sweep area reveals
some important variations from the list of all species observed during this study (Appendix C) and
from the list of all birds recorded above or below the turbine sweep area (Appendix F). As
expected, many species that were abundant in the overall study (e.g., Ring-billed Gull, Canada
Goose, European Starling) also were frequently recorded in the sweep area. Among the most
frequently recorded birds in the sweep area, however, several were not nearly as abundant overall.
Tree Swallow, for example, was the 21st most abundant species in the Reference Area and the 18th
47
most abundant species in the Turbine Area (Appendix F), yet it was the 4th most abundant species
recorded in the turbine sweep area (elevation 42-89 m). Turkey Vultures were the 57th and 54th
most abundant
Table 11. Percentage of birds recorded in sweep area of wind turbine blades during all counts.
Period Reference Area Turbine Area
1998 Spring 11.10 7.53
1999 Summer 1.52 0.22
1999 Autumn 1.16 2.03
2000 Summer 2.07 0.72
2000 Autumn 3.92 1.59
2001 Spring 5.33 13.26
species overall in the Reference and Turbine Areas, respectively, yet they were the 7th most
abundant species recorded in the turbine sweep area. Other species or species groups that tended
to be relatively abundant in the sweep area compared with their relative abundance overall in the
study area (Appendix F) include Red-tailed Hawk (28th most abundant in the Reference Area, 25th
most abundant in the Turbine Area, but 6th most abundant in the sweep area), Turkey Vulture (57th /
54th most abundant overall, but 7th most abundant of all birds observed in the sweep area), several
species of swallows (Barn Swallow, Purple Martin, Cliff Swallow), Chimney Swift, Sandhill Crane,
and several raptors (Northern Harrier, Rough-legged Hawk, Broad-winged Hawk). If we compare
the proportions of all observations that occurred within the sweep area (Appendix F) we find that
raptors and other large birds, in addition to aerial feeders like swallows, exhibit the highest values
among all species.
48
Nocturnal Migratory Birds
Acoustic surveys of nocturnal birds resulted in the identification of at least 10,364 individuals
representing 35 species or species groups. As expected, the temporal distribution of activity varied
during the migration period. During spring, nocturnal migrants were most numerous during the month
of May (Figures 24 and 25). Major movements past the monitoring stations were highly episodic,
with certain nights yielding hundreds of birds, while others were nearly silent. Fall migration was
somewhat more protracted, with highest numbers of bird calls occurring from mid-late August to late
September (Figures 26 and 27). Peak numbers occurred earlier (late August) during fall 2001 than
in fall 1999, when greatest numbers were recorded during mid-September.
Largest concentrations of migrants (by far) were recorded at the Algoma High School site, located
closer to Lake Michigan than any of the other stations. High numbers also were recorded at the
Green Bay Water Filtration Plant (Figure 27) and during spring 2001 at the DePere farm (Figure
25). Although adequate sample size is available only for spring 2001, more birds were recorded at
the MGE site than at the WPS site. These numbers indicate that unusual concentrations of nocturnal
migrants do not occur at the wind turbine localities; if anything, numbers of migrants are less than at
other localities in the region.
The most frequently identified nocturnal call (DpUp) during spring 2000, fall 2001, and
spring 2001 (when identification was consistent) was attributed to an assemblage of
49
Figure 24. Bird calls detected during acoustic surveys of nocturnal migrants during spring 2000.
0
50
100
150
200
250
15-Ap
r
30-A
pr
15-May
30-May
Date
Cal
lsWPS
MGE
GBW
Figure 25. Bird calls detected during acoustic surveys of nocturnal migrants during spring 2001. Numbers of calls at the DePere site (DP) were significantly greater than at both the MGE and WPS sites (p < 0.02, sign test). The numbers of calls at the MGE site were significantly greater than at the WPS site (p < 0.001, sign test).
0
100
200
300
400
500
600
1-Apr
11-Apr
21-Apr
1-May
11-May
21-May
31-May
10-Jun
Date
Cal
ls
DPMGEWPS
50
Figure 26. Bird calls detected during acoustic surveys of nocturnal migrants during fall 1999. Differences between the DePere (DP) and Madison Gas and Electric (MGE) sites were not statistically significant (p > 0.5, sign test).
0
50
100
150
200
20-Au
g30
-Aug
9-Sep
19-Se
p29
-Sep
9-Oct
19-O
ct
Date
Cal
ls
DPMGE
Figure 27. Bird calls detected during acoustic surveys of nocturnal migrants during fall 2000. Numbers of calls at the Algoma High School (AHS) and Green Bay Water Filtration Plant (GBW) were significantly greater than the numbers of calls at the MGE site (p < 0.02, sign test); numbers at the DePere (DP) and MGE sites were not significantly different (p > 0.20, sign test).
0
1000
2000
3000
4000
5000
31-Ju
l
15-Au
g30
-Aug
14-Se
p
29-Se
p14-
Oct29-
Oct
Date
Cal
ls
MGEGBWAHSDP
51
warblers (Tennessee, Nashville, Orange-crowned, and Black-throated Green). One of these,
Tennessee Warbler, is a species of special concern in Wisconsin, although it is a common migrant.
Another frequently recorded complex (zeep) included Yellow, Blackburnian, Cerulean (state
threatened), Worm-eating (state endangered), Connecticut (special concern), Magnolia, Bay-
breasted and Blackpoll Warblers (Appendix G). The most commonly identified individual species
included Ovenbird, American Redstart, Savanna Sparrow, White-throated Sparrow, and Chestnut-
sided Warbler, all abundant breeding species in Wisconsin (Robbins 1991). Cape May Warbler, a
special concern species in Wisconsin, was the 7th most frequently recorded individual species. Other
notable species identified during the nocturnal bird analysis include Canada Warbler (208 records),
Blue-winged/Golden Winged Warblers (89 records), Nelson’s Sharp-tailed Sparrow (28 records),
Grasshopper Sparrow (26 records), and Black-throated Blue Warbler (79 records).
In order to evaluate the altitude of migrating birds, Evans examined seven nights with the
highest frequency of calls (w/measurable time delays), providing a worst-case assessment of potential
bird collisions. This analysis includes 533 calls during fall 2000 and 384 calls during spring 2001.
The accrued time delays between signals (Figures 28 and 29 are directly related to the altitude of the
flying bird and the distance from the observer.
52
Fig.28. Time delays of acoustic signals at MGE wind turbine site during fall 2000. Values in parentheses are negative values.
Fall 2000 time delay data at MG&E site
0
2
4
6
8
10
12(5
1)-(
60)
(41)
-(50
)
(31)
-(40
)
(21)
-(30
)
(11)
-(20
)
(1)-
(10) 0
1-10
11-2
0
21-3
0
31-4
0
41-5
0
51-6
0
61-7
0
71-8
0
81-9
0
91-1
00
101-
110
111-
120
121-
130
131-
140
141-
150
151-
160
161-
170
171-
180
181-
190
191-
200
Time delay (mS)
Per
cen
tag
e o
f sea
son
tota
l
Figure 29. Time delays of acoustic signals at MGE wind turbine site during spring 2001. Values in parentheses are negative values.
Spring 2001 time delay data at MG&E site
0
1
2
3
4
5
6
7
8
9
10
(41)
-(50
)
(31)
-(40
)
(21)
-(30
)
(11)
-(20
)
(1)-
(10)
1-10
11-2
0
21-3
0
31-4
0
41-5
0
51-6
0
61-7
0
71-8
0
81-9
0
91-1
00
101-
110
111-
120
121-
130
131-
140
141-
150
151-
160
161-
170
171-
180
181-
190
191-
200
Time delay (mS)
Per
cen
tag
e o
f se
aso
n t
ota
l
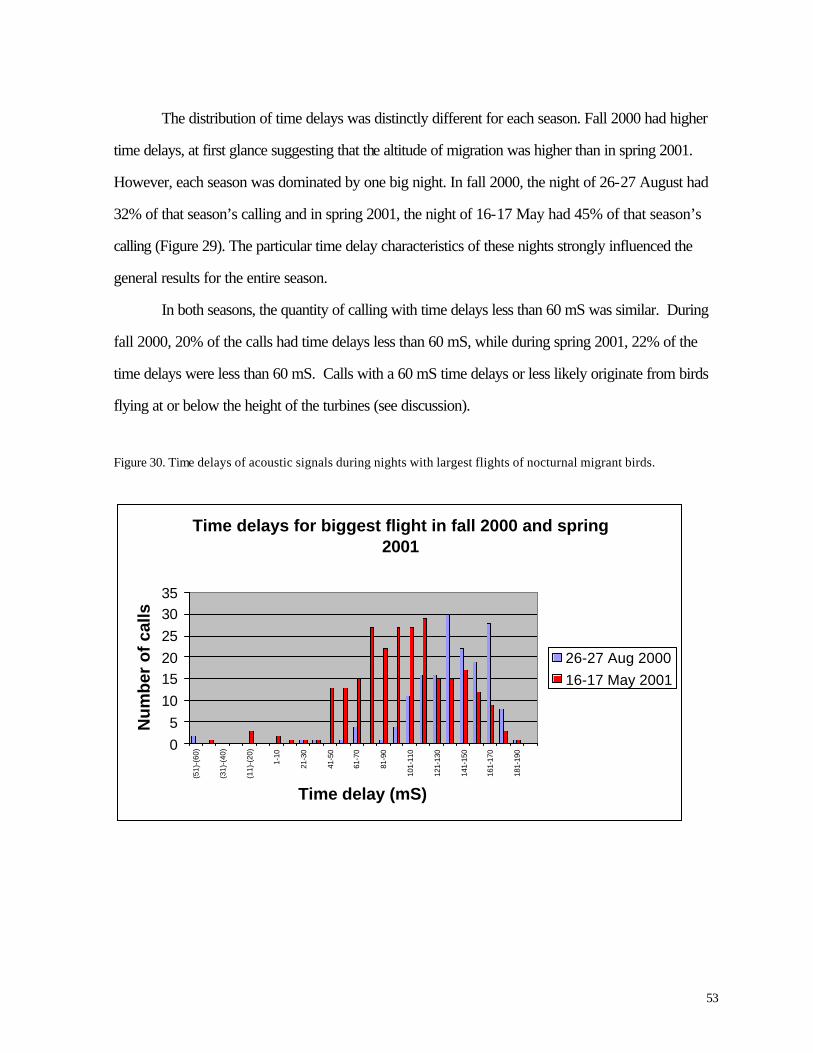
53
The distribution of time delays was distinctly different for each season. Fall 2000 had higher
time delays, at first glance suggesting that the altitude of migration was higher than in spring 2001.
However, each season was dominated by one big night. In fall 2000, the night of 26-27 August had
32% of that season’s calling and in spring 2001, the night of 16-17 May had 45% of that season’s
calling (Figure 29). The particular time delay characteristics of these nights strongly influenced the
general results for the entire season.
In both seasons, the quantity of calling with time delays less than 60 mS was similar. During
fall 2000, 20% of the calls had time delays less than 60 mS, while during spring 2001, 22% of the
time delays were less than 60 mS. Calls with a 60 mS time delays or less likely originate from birds
flying at or below the height of the turbines (see discussion).
Figure 30. Time delays of acoustic signals during nights with largest flights of nocturnal migrant birds.
Time delays for biggest flight in fall 2000 and spring 2001
05
101520253035
(51)
-(60
)
(31)
-(40
)
(11)
-(20
)
1-10
21-3
0
41-5
0
61-7
0
81-9
0
101-
110
121-
130
141-
150
161-
170
181-
190
Time delay (mS)
Nu
mb
er o
f ca
lls
26-27 Aug 200016-17 May 2001
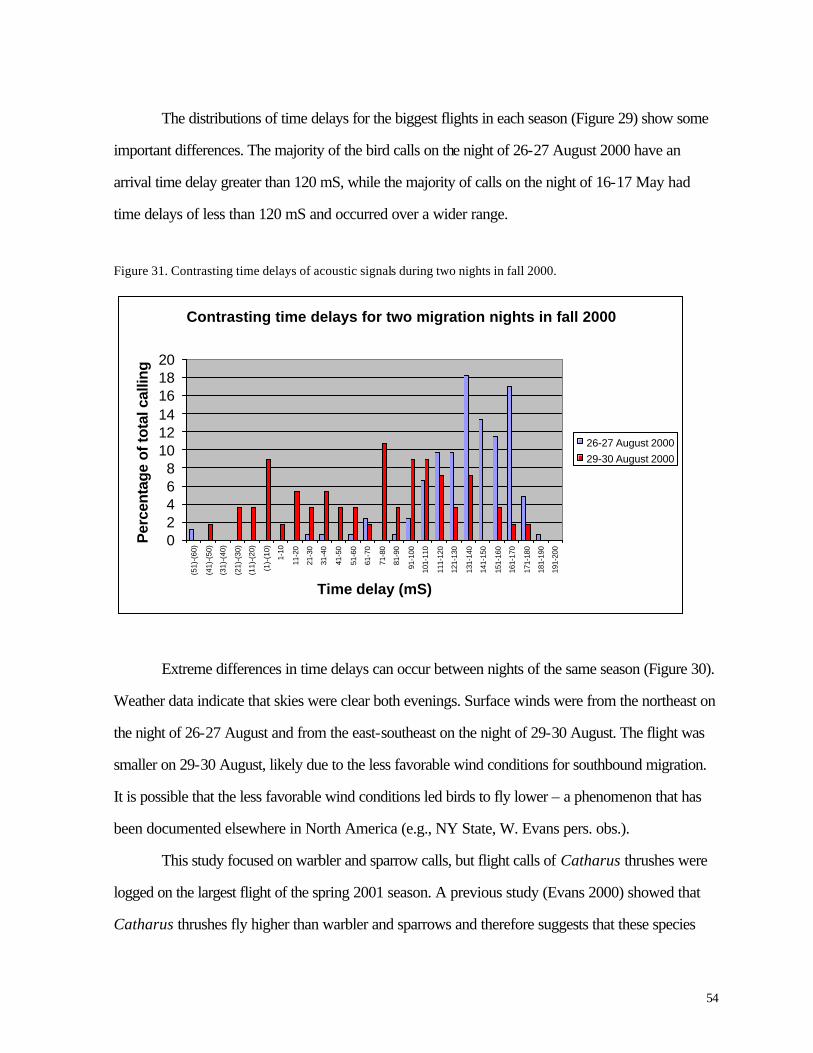
54
The distributions of time delays for the biggest flights in each season (Figure 29) show some
important differences. The majority of the bird calls on the night of 26-27 August 2000 have an
arrival time delay greater than 120 mS, while the majority of calls on the night of 16-17 May had
time delays of less than 120 mS and occurred over a wider range.
Figure 31. Contrasting time delays of acoustic signals during two nights in fall 2000.
Contrasting time delays for two migration nights in fall 2000
02468
101214161820
(51)
-(60
)
(41)
-(50
)
(31)
-(40
)
(21)
-(30
)
(11)
-(20
)
(1)-
(10)
1-10
11-2
0
21-3
0
31-4
0
41-5
0
51-6
0
61-7
0
71-8
0
81-9
0
91-1
00
101-
110
111-
120
121-
130
131-
140
141-
150
151-
160
161-
170
171-
180
181-
190
191-
200
Time delay (mS)
Per
cent
age
of to
tal c
allin
g
26-27 August 2000
29-30 August 2000
Extreme differences in time delays can occur between nights of the same season (Figure 30).
Weather data indicate that skies were clear both evenings. Surface winds were from the northeast on
the night of 26-27 August and from the east-southeast on the night of 29-30 August. The flight was
smaller on 29-30 August, likely due to the less favorable wind conditions for southbound migration.
It is possible that the less favorable wind conditions led birds to fly lower – a phenomenon that has
been documented elsewhere in North America (e.g., NY State, W. Evans pers. obs.).
This study focused on warbler and sparrow calls, but flight calls of Catharus thrushes were
logged on the largest flight of the spring 2001 season. A previous study (Evans 2000) showed that
Catharus thrushes fly higher than warbler and sparrows and therefore suggests that these species
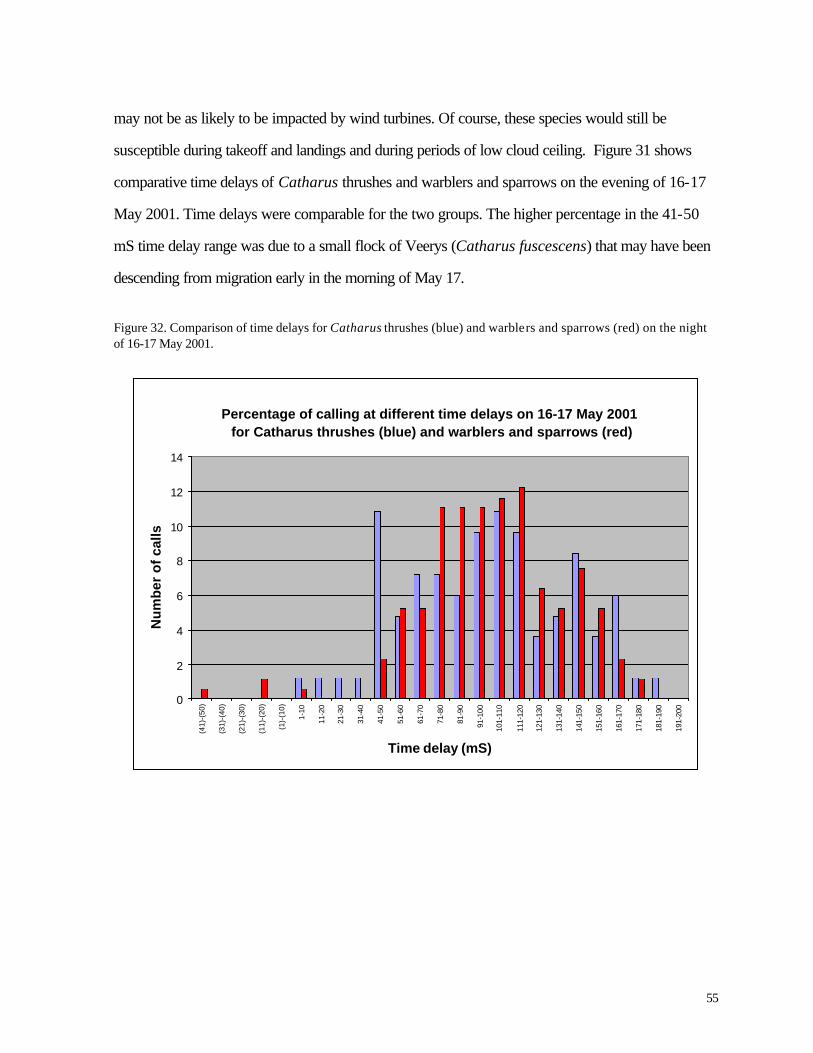
55
may not be as likely to be impacted by wind turbines. Of course, these species would still be
susceptible during takeoff and landings and during periods of low cloud ceiling. Figure 31 shows
comparative time delays of Catharus thrushes and warblers and sparrows on the evening of 16-17
May 2001. Time delays were comparable for the two groups. The higher percentage in the 41-50
mS time delay range was due to a small flock of Veerys (Catharus fuscescens) that may have been
descending from migration early in the morning of May 17.
Figure 32. Comparison of time delays for Catharus thrushes (blue) and warblers and sparrows (red) on the night of 16-17 May 2001.
Percentage of calling at different time delays on 16-17 May 2001 for Catharus thrushes (blue) and warblers and sparrows (red)
0
2
4
6
8
10
12
14
(41)
-(50
)
(31)
-(40
)
(21)
-(30
)
(11)
-(20
)
(1)-
(10)
1-10
11-2
0
21-3
0
31-4
0
41-5
0
51-6
0
61-7
0
71-8
0
81-9
0
91-1
00
101-
110
111-
120
121-
130
131-
140
141-
150
151-
160
161-
170
171-
180
181-
190
191-
200
Time delay (mS)
Nu
mb
er o
f ca
lls
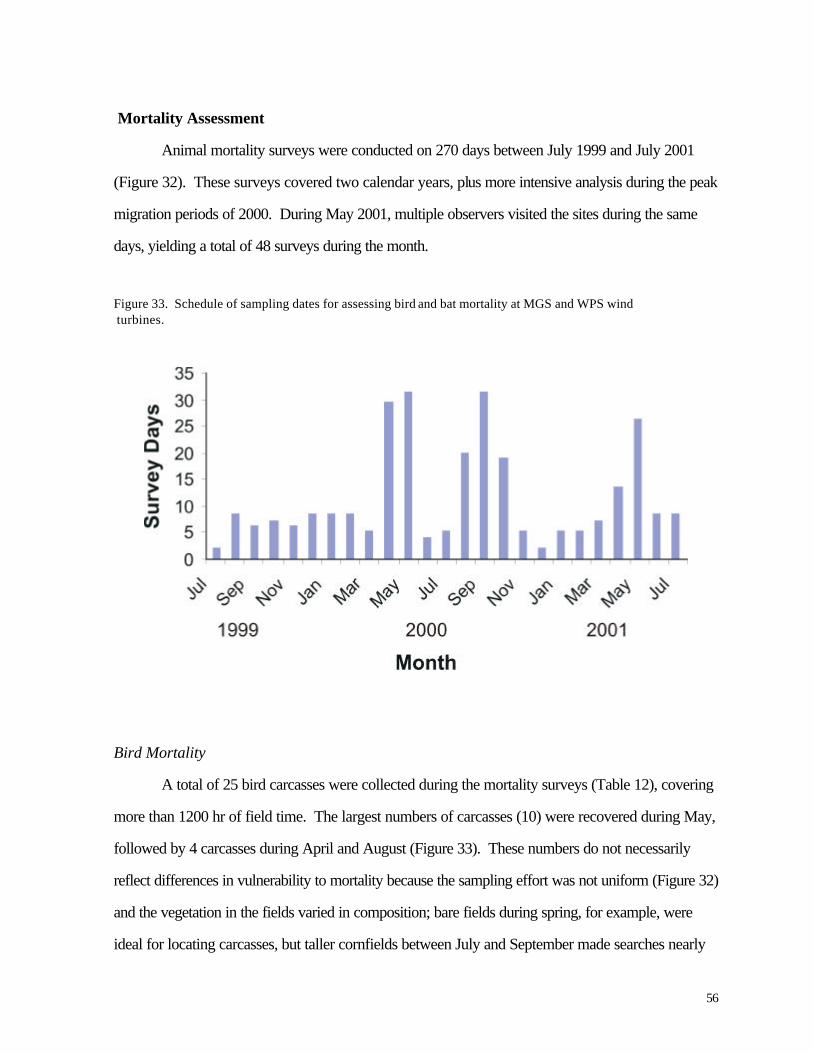
56
Mortality Assessment
Animal mortality surveys were conducted on 270 days between July 1999 and July 2001
(Figure 32). These surveys covered two calendar years, plus more intensive analysis during the peak
migration periods of 2000. During May 2001, multiple observers visited the sites during the same
days, yielding a total of 48 surveys during the month.
Figure 33. Schedule of sampling dates for assessing bird and bat mortality at MGS and WPS wind turbines.
Bird Mortality
A total of 25 bird carcasses were collected during the mortality surveys (Table 12), covering
more than 1200 hr of field time. The largest numbers of carcasses (10) were recovered during May,
followed by 4 carcasses during April and August (Figure 33). These numbers do not necessarily
reflect differences in vulnerability to mortality because the sampling effort was not uniform (Figure 32)
and the vegetation in the fields varied in composition; bare fields during spring, for example, were
ideal for locating carcasses, but taller cornfields between July and September made searches nearly
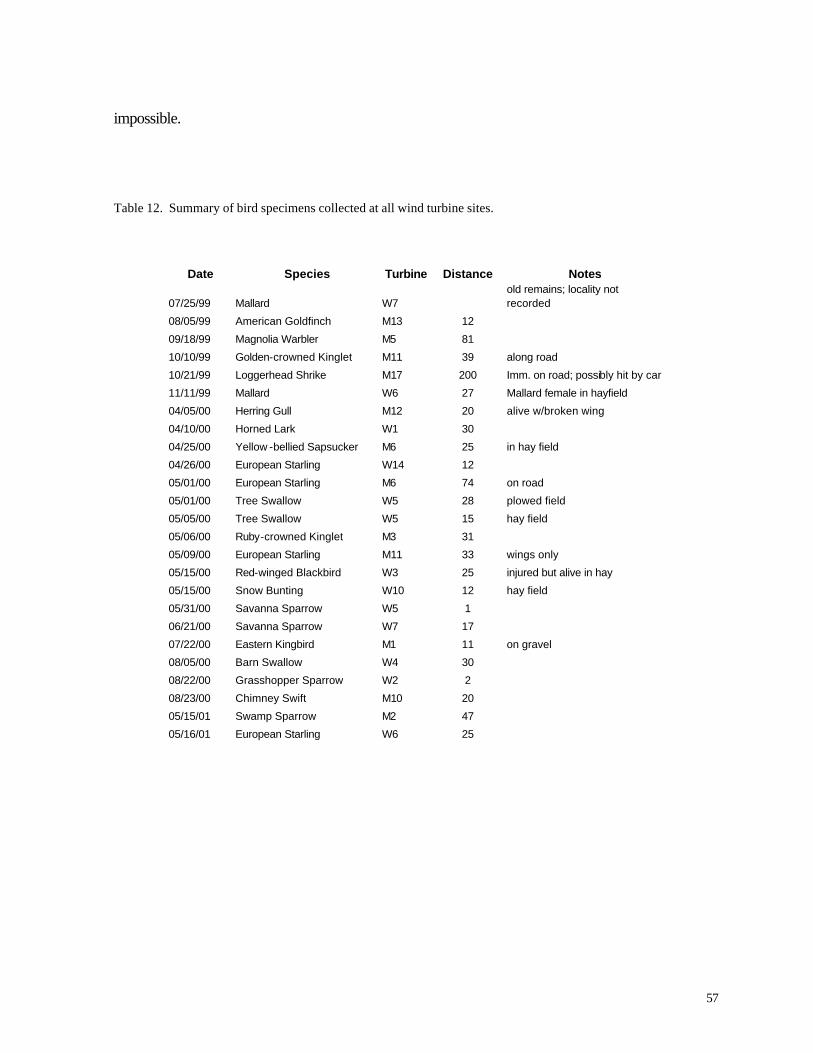
57
impossible.
Table 12. Summary of bird specimens collected at all wind turbine sites.
Date Species Turbine Distance Notes
07/25/99 Mallard W7 old remains; locality not recorded
08/05/99 American Goldfinch M13 12
09/18/99 Magnolia Warbler M5 81
10/10/99 Golden-crowned Kinglet M11 39 along road
10/21/99 Loggerhead Shrike M17 200 Imm. on road; possibly hit by car
11/11/99 Mallard W6 27 Mallard female in hayfield
04/05/00 Herring Gull M12 20 alive w/broken wing
04/10/00 Horned Lark W1 30
04/25/00 Yellow -bellied Sapsucker M6 25 in hay field
04/26/00 European Starling W14 12
05/01/00 European Starling M6 74 on road
05/01/00 Tree Swallow W5 28 plowed field
05/05/00 Tree Swallow W5 15 hay field
05/06/00 Ruby-crowned Kinglet M3 31
05/09/00 European Starling M11 33 wings only
05/15/00 Red-winged Blackbird W3 25 injured but alive in hay
05/15/00 Snow Bunting W10 12 hay field
05/31/00 Savanna Sparrow W5 1
06/21/00 Savanna Sparrow W7 17
07/22/00 Eastern Kingbird M1 11 on gravel
08/05/00 Barn Swallow W4 30
08/22/00 Grasshopper Sparrow W2 2
08/23/00 Chimney Swift M10 20
05/15/01 Swamp Sparrow M2 47
05/16/01 European Starling W6 25
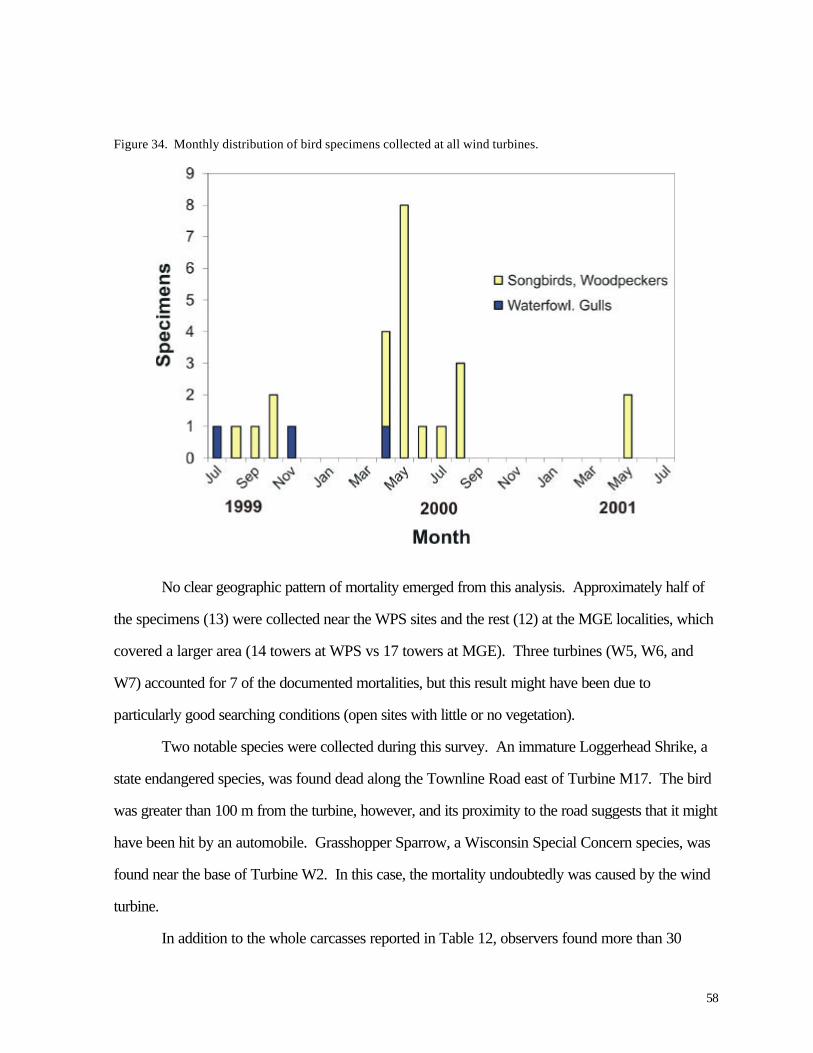
58
Figure 34. Monthly distribution of bird specimens collected at all wind turbines.
No clear geographic pattern of mortality emerged from this analysis. Approximately half of
the specimens (13) were collected near the WPS sites and the rest (12) at the MGE localities, which
covered a larger area (14 towers at WPS vs 17 towers at MGE). Three turbines (W5, W6, and
W7) accounted for 7 of the documented mortalities, but this result might have been due to
particularly good searching conditions (open sites with little or no vegetation).
Two notable species were collected during this survey. An immature Loggerhead Shrike, a
state endangered species, was found dead along the Townline Road east of Turbine M17. The bird
was greater than 100 m from the turbine, however, and its proximity to the road suggests that it might
have been hit by an automobile. Grasshopper Sparrow, a Wisconsin Special Concern species, was
found near the base of Turbine W2. In this case, the mortality undoubtedly was caused by the wind
turbine.
In addition to the whole carcasses reported in Table 12, observers found more than 30
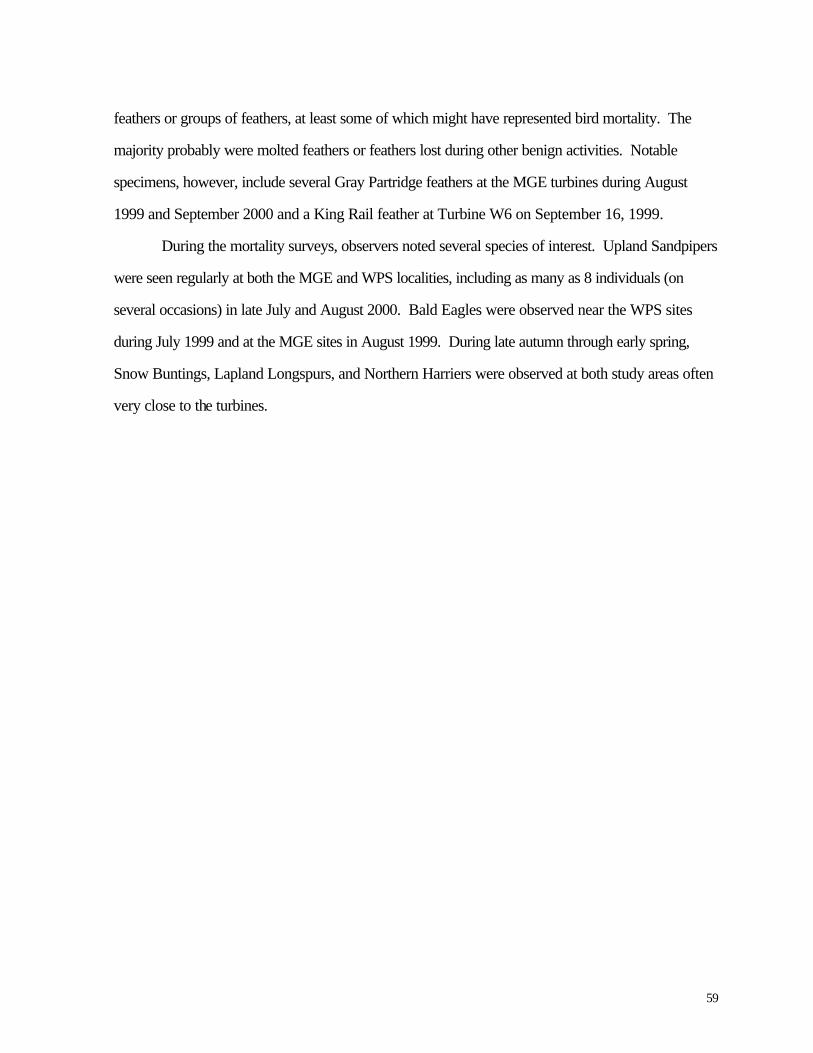
59
feathers or groups of feathers, at least some of which might have represented bird mortality. The
majority probably were molted feathers or feathers lost during other benign activities. Notable
specimens, however, include several Gray Partridge feathers at the MGE turbines during August
1999 and September 2000 and a King Rail feather at Turbine W6 on September 16, 1999.
During the mortality surveys, observers noted several species of interest. Upland Sandpipers
were seen regularly at both the MGE and WPS localities, including as many as 8 individuals (on
several occasions) in late July and August 2000. Bald Eagles were observed near the WPS sites
during July 1999 and at the MGE sites in August 1999. During late autumn through early spring,
Snow Buntings, Lapland Longspurs, and Northern Harriers were observed at both study areas often
very close to the turbines.
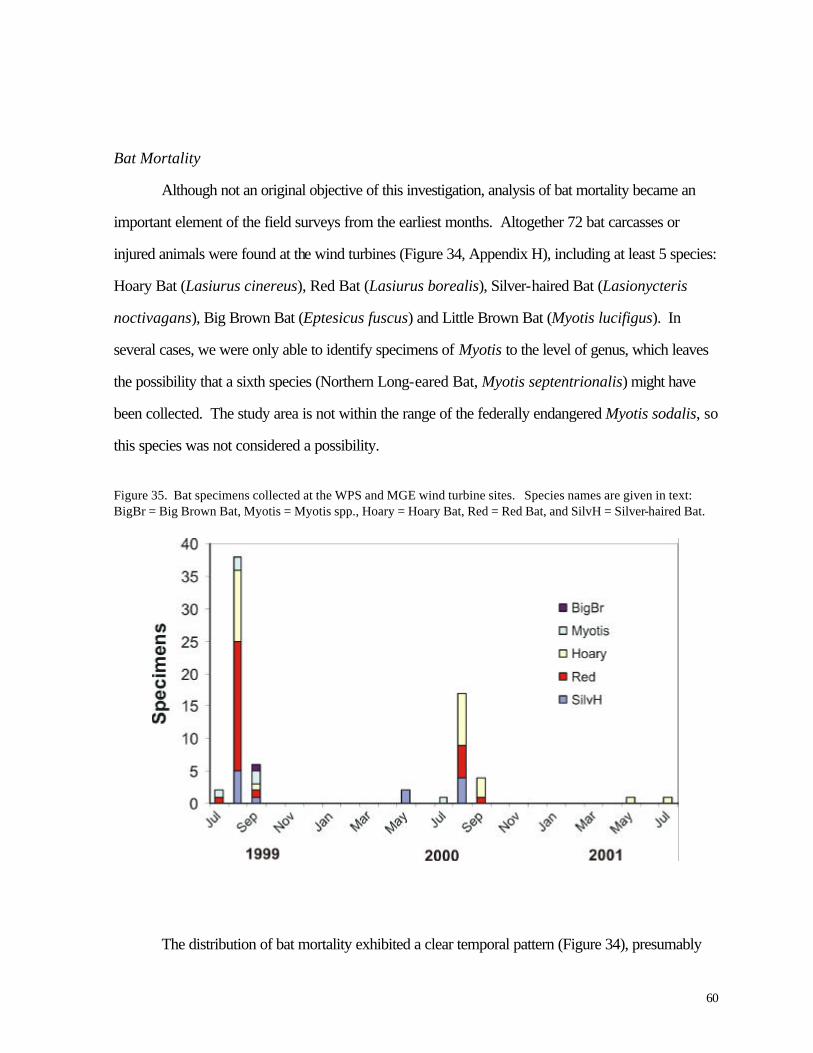
60
Bat Mortality
Although not an original objective of this investigation, analysis of bat mortality became an
important element of the field surveys from the earliest months. Altogether 72 bat carcasses or
injured animals were found at the wind turbines (Figure 34, Appendix H), including at least 5 species:
Hoary Bat (Lasiurus cinereus), Red Bat (Lasiurus borealis), Silver-haired Bat (Lasionycteris
noctivagans), Big Brown Bat (Eptesicus fuscus) and Little Brown Bat (Myotis lucifigus). In
several cases, we were only able to identify specimens of Myotis to the level of genus, which leaves
the possibility that a sixth species (Northern Long-eared Bat, Myotis septentrionalis) might have
been collected. The study area is not within the range of the federally endangered Myotis sodalis, so
this species was not considered a possibility.
Figure 35. Bat specimens collected at the WPS and MGE wind turbine sites. Species names are given in text: BigBr = Big Brown Bat, Myotis = Myotis spp., Hoary = Hoary Bat, Red = Red Bat, and SilvH = Silver-haired Bat.
The distribution of bat mortality exhibited a clear temporal pattern (Figure 34), presumably
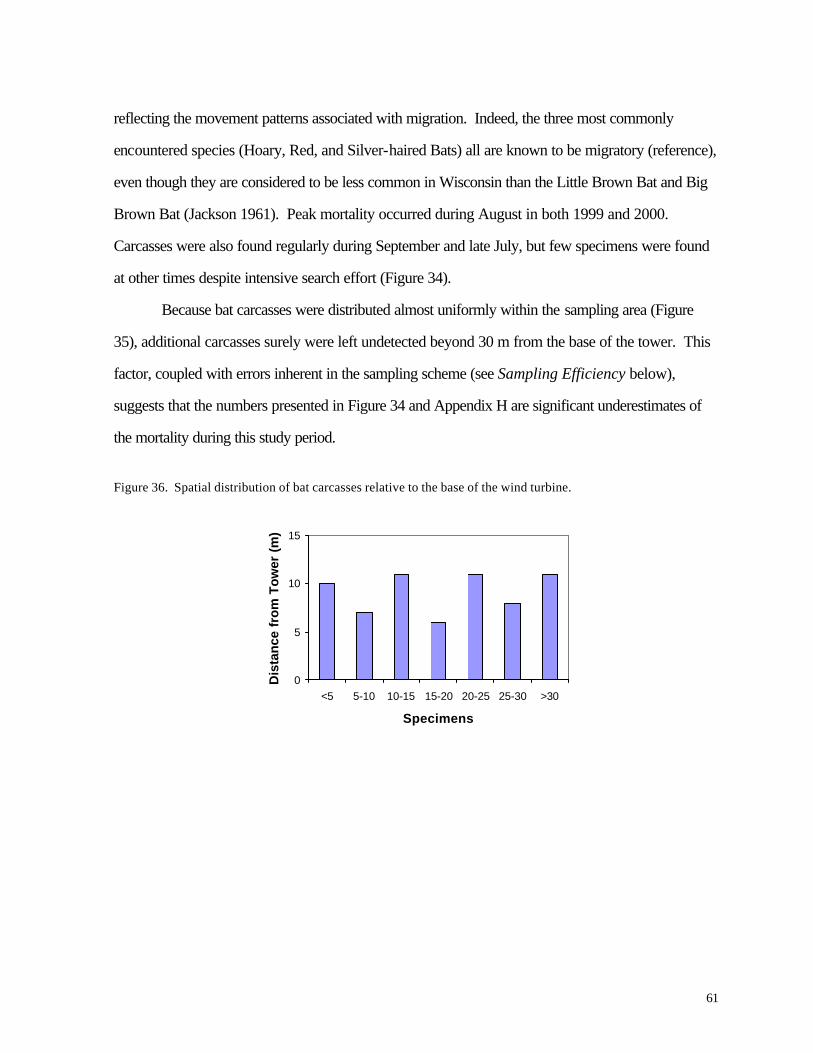
61
reflecting the movement patterns associated with migration. Indeed, the three most commonly
encountered species (Hoary, Red, and Silver-haired Bats) all are known to be migratory (reference),
even though they are considered to be less common in Wisconsin than the Little Brown Bat and Big
Brown Bat (Jackson 1961). Peak mortality occurred during August in both 1999 and 2000.
Carcasses were also found regularly during September and late July, but few specimens were found
at other times despite intensive search effort (Figure 34).
Because bat carcasses were distributed almost uniformly within the sampling area (Figure
35), additional carcasses surely were left undetected beyond 30 m from the base of the tower. This
factor, coupled with errors inherent in the sampling scheme (see Sampling Efficiency below),
suggests that the numbers presented in Figure 34 and Appendix H are significant underestimates of
the mortality during this study period.
Figure 36. Spatial distribution of bat carcasses relative to the base of the wind turbine.
0
5
10
15
<5 5-10 10-15 15-20 20-25 25-30 >30
Specimens
Dis
tan
ce f
rom
To
wer
(m
)
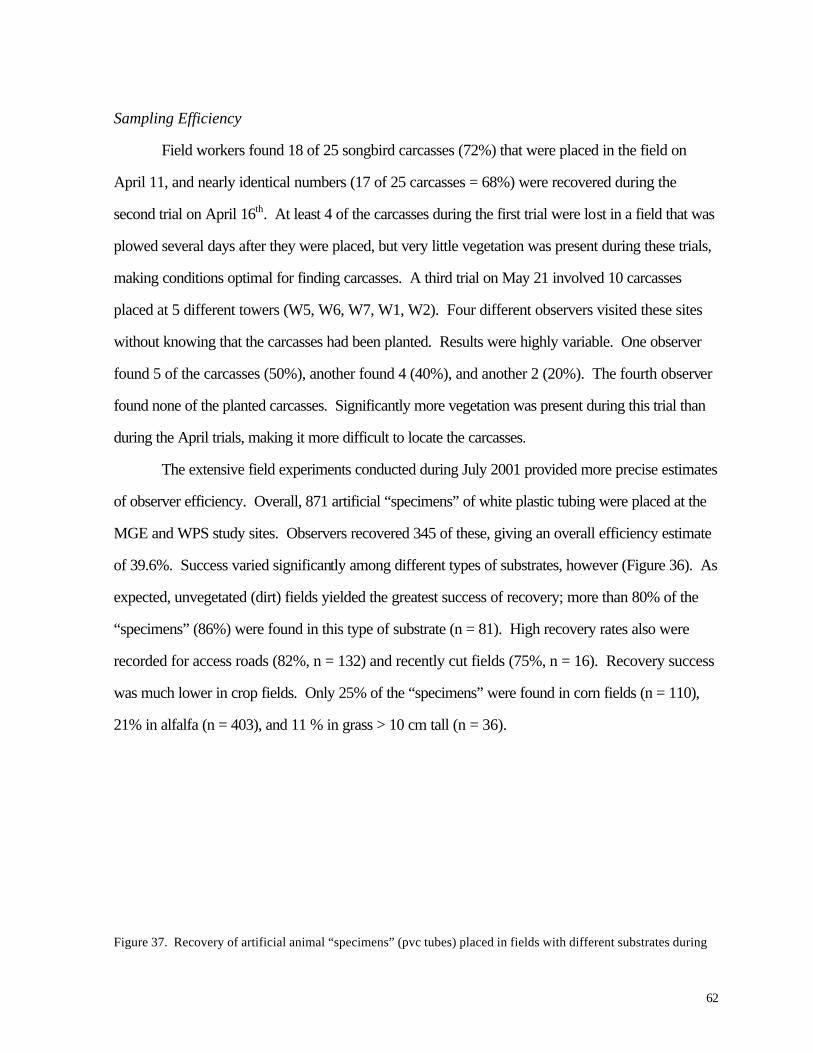
62
Sampling Efficiency
Field workers found 18 of 25 songbird carcasses (72%) that were placed in the field on
April 11, and nearly identical numbers (17 of 25 carcasses = 68%) were recovered during the
second trial on April 16th. At least 4 of the carcasses during the first trial were lost in a field that was
plowed several days after they were placed, but very little vegetation was present during these trials,
making conditions optimal for finding carcasses. A third trial on May 21 involved 10 carcasses
placed at 5 different towers (W5, W6, W7, W1, W2). Four different observers visited these sites
without knowing that the carcasses had been planted. Results were highly variable. One observer
found 5 of the carcasses (50%), another found 4 (40%), and another 2 (20%). The fourth observer
found none of the planted carcasses. Significantly more vegetation was present during this trial than
during the April trials, making it more difficult to locate the carcasses.
The extensive field experiments conducted during July 2001 provided more precise estimates
of observer efficiency. Overall, 871 artificial “specimens” of white plastic tubing were placed at the
MGE and WPS study sites. Observers recovered 345 of these, giving an overall efficiency estimate
of 39.6%. Success varied significantly among different types of substrates, however (Figure 36). As
expected, unvegetated (dirt) fields yielded the greatest success of recovery; more than 80% of the
“specimens” (86%) were found in this type of substrate (n = 81). High recovery rates also were
recorded for access roads (82%, n = 132) and recently cut fields (75%, n = 16). Recovery success
was much lower in crop fields. Only 25% of the “specimens” were found in corn fields (n = 110),
21% in alfalfa (n = 403), and 11 % in grass > 10 cm tall (n = 36).
Figure 37. Recovery of artificial animal “specimens” (pvc tubes) placed in fields with different substrates during
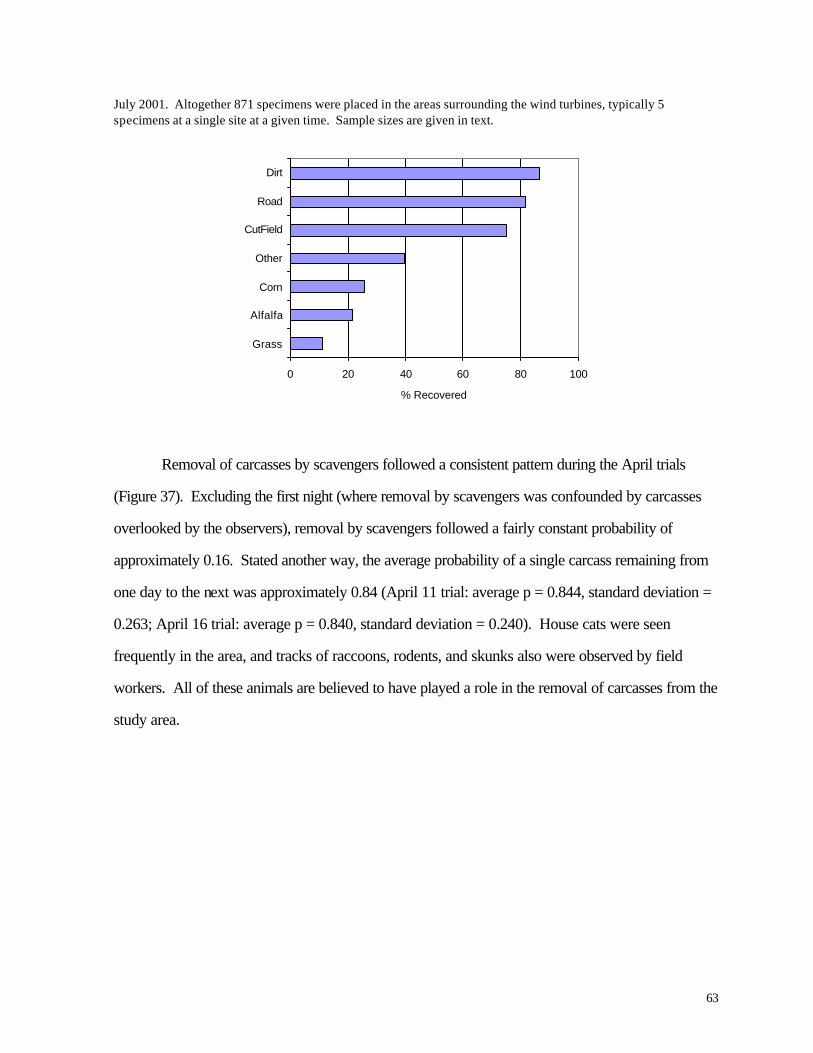
63
July 2001. Altogether 871 specimens were placed in the areas surrounding the wind turbines, typically 5 specimens at a single site at a given time. Sample sizes are given in text.
0 20 40 60 80 100
Grass
Alfalfa
Corn
Other
CutField
Road
Dirt
% Recovered
Removal of carcasses by scavengers followed a consistent pattern during the April trials
(Figure 37). Excluding the first night (where removal by scavengers was confounded by carcasses
overlooked by the observers), removal by scavengers followed a fairly constant probability of
approximately 0.16. Stated another way, the average probability of a single carcass remaining from
one day to the next was approximately 0.84 (April 11 trial: average p = 0.844, standard deviation =
0.263; April 16 trial: average p = 0.840, standard deviation = 0.240). House cats were seen
frequently in the area, and tracks of raccoons, rodents, and skunks also were observed by field
workers. All of these animals are believed to have played a role in the removal of carcasses from the
study area.
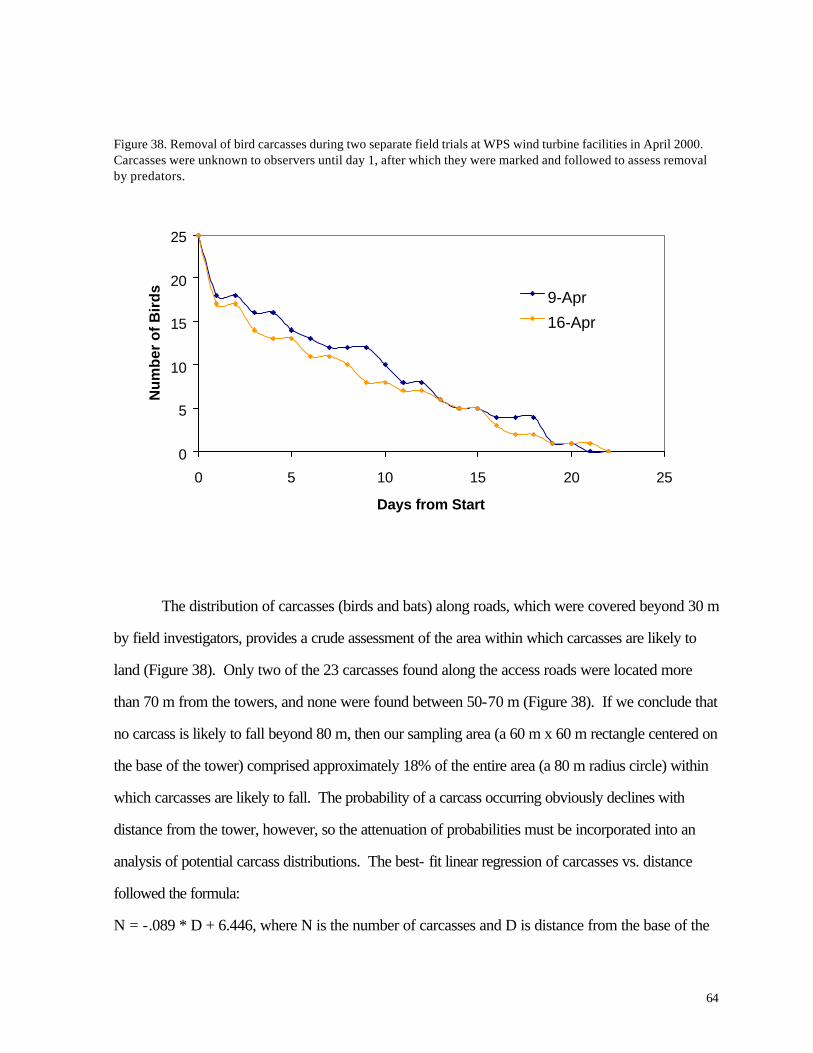
64
Figure 38. Removal of bird carcasses during two separate field trials at WPS wind turbine facilities in April 2000. Carcasses were unknown to observers until day 1, after which they were marked and followed to assess removal by predators.
0
5
10
15
20
25
0 5 10 15 20 25
Days from Start
Nu
mb
er o
f B
ird
s
9-Apr
16-Apr
The distribution of carcasses (birds and bats) along roads, which were covered beyond 30 m
by field investigators, provides a crude assessment of the area within which carcasses are likely to
land (Figure 38). Only two of the 23 carcasses found along the access roads were located more
than 70 m from the towers, and none were found between 50-70 m (Figure 38). If we conclude that
no carcass is likely to fall beyond 80 m, then our sampling area (a 60 m x 60 m rectangle centered on
the base of the tower) comprised approximately 18% of the entire area (a 80 m radius circle) within
which carcasses are likely to fall. The probability of a carcass occurring obviously declines with
distance from the tower, however, so the attenuation of probabilities must be incorporated into an
analysis of potential carcass distributions. The best- fit linear regression of carcasses vs. distance
followed the formula:
N = -.089 * D + 6.446, where N is the number of carcasses and D is distance from the base of the
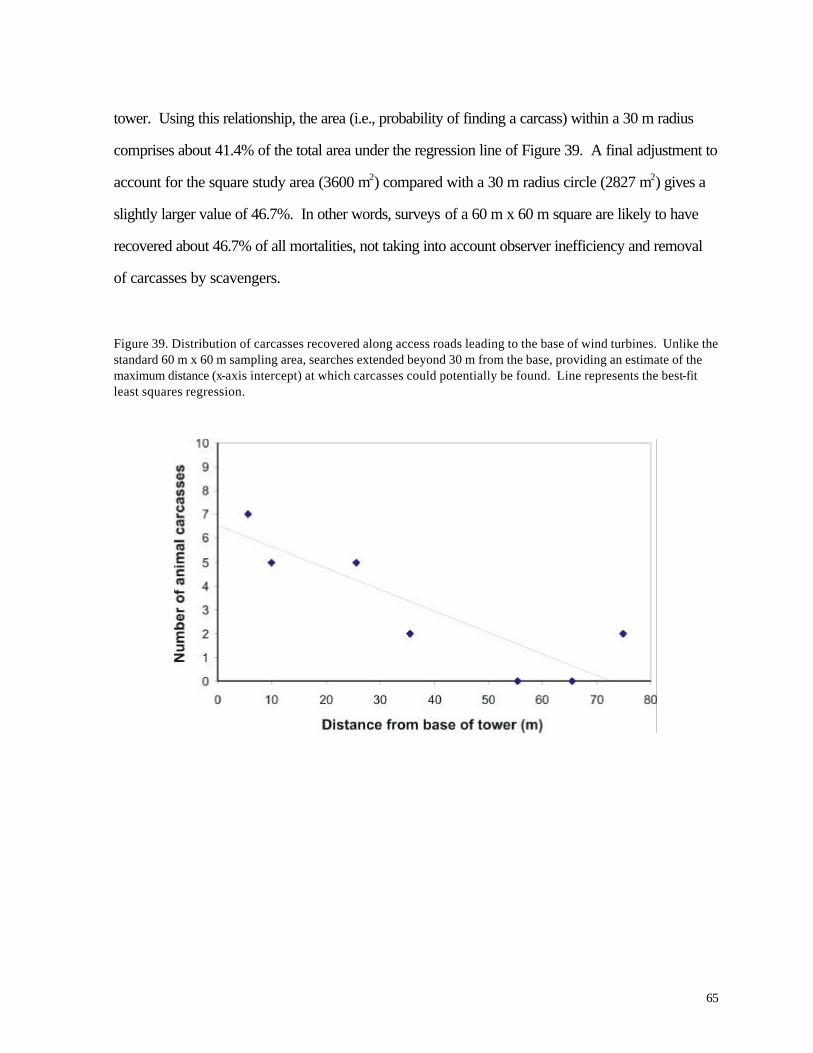
65
tower. Using this relationship, the area (i.e., probability of finding a carcass) within a 30 m radius
comprises about 41.4% of the total area under the regression line of Figure 39. A final adjustment to
account for the square study area (3600 m2) compared with a 30 m radius circle (2827 m2) gives a
slightly larger value of 46.7%. In other words, surveys of a 60 m x 60 m square are likely to have
recovered about 46.7% of all mortalities, not taking into account observer inefficiency and removal
of carcasses by scavengers.
Figure 39. Distribution of carcasses recovered along access roads leading to the base of wind turbines. Unlike the standard 60 m x 60 m sampling area, searches extended beyond 30 m from the base, providing an estimate of the maximum distance (x-axis intercept) at which carcasses could potentially be found. Line represents the best-fit least squares regression.
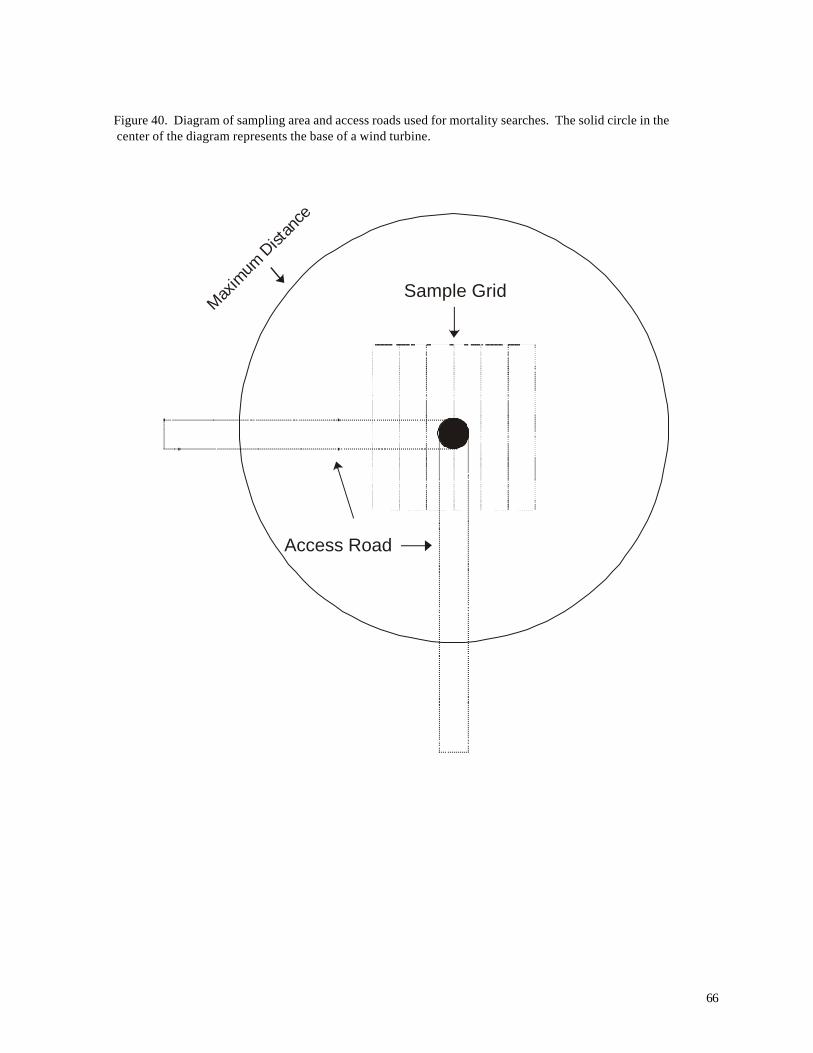
66
Figure 40. Diagram of sampling area and access roads used for mortality searches. The solid circle in the center of the diagram represents the base of a wind turbine.
Access Road
Sample GridM
axim
um Dist
ance
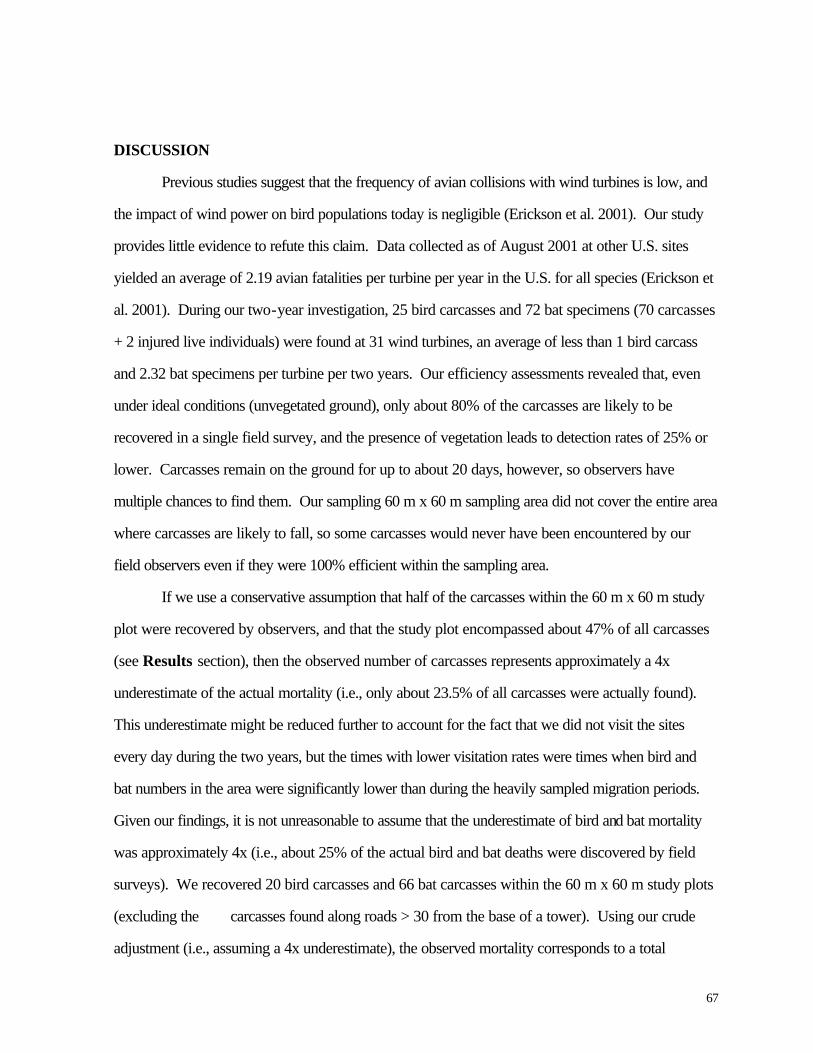
67
DISCUSSION
Previous studies suggest that the frequency of avian collisions with wind turbines is low, and
the impact of wind power on bird populations today is negligible (Erickson et al. 2001). Our study
provides little evidence to refute this claim. Data collected as of August 2001 at other U.S. sites
yielded an average of 2.19 avian fatalities per turbine per year in the U.S. for all species (Erickson et
al. 2001). During our two-year investigation, 25 bird carcasses and 72 bat specimens (70 carcasses
+ 2 injured live individuals) were found at 31 wind turbines, an average of less than 1 bird carcass
and 2.32 bat specimens per turbine per two years. Our efficiency assessments revealed that, even
under ideal conditions (unvegetated ground), only about 80% of the carcasses are likely to be
recovered in a single field survey, and the presence of vegetation leads to detection rates of 25% or
lower. Carcasses remain on the ground for up to about 20 days, however, so observers have
multiple chances to find them. Our sampling 60 m x 60 m sampling area did not cover the entire area
where carcasses are likely to fall, so some carcasses would never have been encountered by our
field observers even if they were 100% efficient within the sampling area.
If we use a conservative assumption that half of the carcasses within the 60 m x 60 m study
plot were recovered by observers, and that the study plot encompassed about 47% of all carcasses
(see Results section), then the observed number of carcasses represents approximately a 4x
underestimate of the actual mortality (i.e., only about 23.5% of all carcasses were actually found).
This underestimate might be reduced further to account for the fact that we did not visit the sites
every day during the two years, but the times with lower visitation rates were times when bird and
bat numbers in the area were significantly lower than during the heavily sampled migration periods.
Given our findings, it is not unreasonable to assume that the underestimate of bird and bat mortality
was approximately 4x (i.e., about 25% of the actual bird and bat deaths were discovered by field
surveys). We recovered 20 bird carcasses and 66 bat carcasses within the 60 m x 60 m study plots
(excluding the carcasses found along roads > 30 from the base of a tower). Using our crude
adjustment (i.e., assuming a 4x underestimate), the observed mortality corresponds to a total
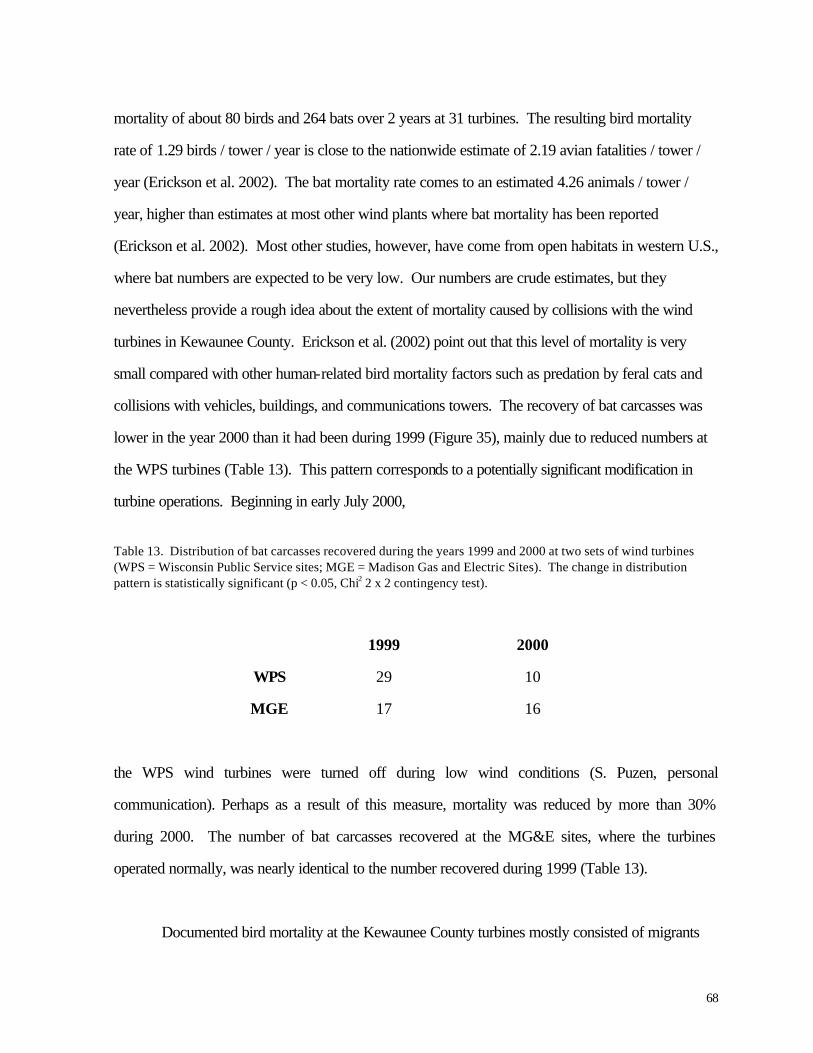
68
mortality of about 80 birds and 264 bats over 2 years at 31 turbines. The resulting bird mortality
rate of 1.29 birds / tower / year is close to the nationwide estimate of 2.19 avian fatalities / tower /
year (Erickson et al. 2002). The bat mortality rate comes to an estimated 4.26 animals / tower /
year, higher than estimates at most other wind plants where bat mortality has been reported
(Erickson et al. 2002). Most other studies, however, have come from open habitats in western U.S.,
where bat numbers are expected to be very low. Our numbers are crude estimates, but they
nevertheless provide a rough idea about the extent of mortality caused by collisions with the wind
turbines in Kewaunee County. Erickson et al. (2002) point out that this level of mortality is very
small compared with other human-related bird mortality factors such as predation by feral cats and
collisions with vehicles, buildings, and communications towers. The recovery of bat carcasses was
lower in the year 2000 than it had been during 1999 (Figure 35), mainly due to reduced numbers at
the WPS turbines (Table 13). This pattern corresponds to a potentially significant modification in
turbine operations. Beginning in early July 2000,
Table 13. Distribution of bat carcasses recovered during the years 1999 and 2000 at two sets of wind turbines (WPS = Wisconsin Public Service sites; MGE = Madison Gas and Electric Sites). The change in distribution pattern is statistically significant (p < 0.05, Chi2 2 x 2 contingency test).
1999 2000
WPS 29 10
MGE 17 16
the WPS wind turbines were turned off during low wind conditions (S. Puzen, personal
communication). Perhaps as a result of this measure, mortality was reduced by more than 30%
during 2000. The number of bat carcasses recovered at the MG&E sites, where the turbines
operated normally, was nearly identical to the number recovered during 1999 (Table 13).
Documented bird mortality at the Kewaunee County turbines mostly consisted of migrants
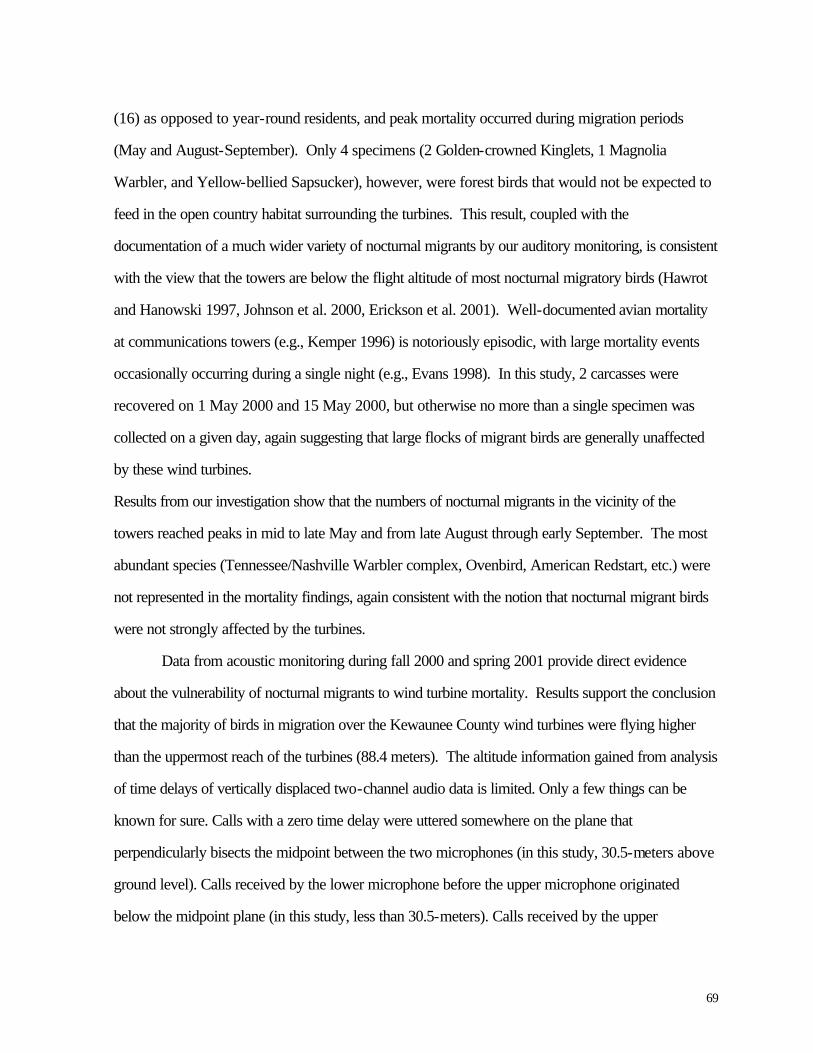
69
(16) as opposed to year-round residents, and peak mortality occurred during migration periods
(May and August-September). Only 4 specimens (2 Golden-crowned Kinglets, 1 Magnolia
Warbler, and Yellow-bellied Sapsucker), however, were forest birds that would not be expected to
feed in the open country habitat surrounding the turbines. This result, coupled with the
documentation of a much wider variety of nocturnal migrants by our auditory monitoring, is consistent
with the view that the towers are below the flight altitude of most nocturnal migratory birds (Hawrot
and Hanowski 1997, Johnson et al. 2000, Erickson et al. 2001). Well-documented avian mortality
at communications towers (e.g., Kemper 1996) is notoriously episodic, with large mortality events
occasionally occurring during a single night (e.g., Evans 1998). In this study, 2 carcasses were
recovered on 1 May 2000 and 15 May 2000, but otherwise no more than a single specimen was
collected on a given day, again suggesting that large flocks of migrant birds are generally unaffected
by these wind turbines.
Results from our investigation show that the numbers of nocturnal migrants in the vicinity of the
towers reached peaks in mid to late May and from late August through early September. The most
abundant species (Tennessee/Nashville Warbler complex, Ovenbird, American Redstart, etc.) were
not represented in the mortality findings, again consistent with the notion that nocturnal migrant birds
were not strongly affected by the turbines.
Data from acoustic monitoring during fall 2000 and spring 2001 provide direct evidence
about the vulnerability of nocturnal migrants to wind turbine mortality. Results support the conclusion
that the majority of birds in migration over the Kewaunee County wind turbines were flying higher
than the uppermost reach of the turbines (88.4 meters). The altitude information gained from analysis
of time delays of vertically displaced two-channel audio data is limited. Only a few things can be
known for sure. Calls with a zero time delay were uttered somewhere on the plane that
perpendicularly bisects the midpoint between the two microphones (in this study, 30.5-meters above
ground level). Calls received by the lower microphone before the upper microphone originated
below the midpoint plane (in this study, less than 30.5-meters). Calls received by the upper
70
microphone before the lower microphone originated above the midpoint plane (in this study, greater
than 30.5-meters above ground level).
However, additional altitude information may be deduced. In this study, we are interested in
how much nocturnal migration of small songbirds is occurring below the 88.4-meter height of the
wind turbines (includes blade). We presume that on take-off and landing from nocturnal migration
birds are flying within this height range and are therefore potentially at risk of a strike in this portion of
their migration. One question we are trying to determine is whether birds, once they have reached
their migration altitude, are actively migrating below the height of the turbines. If such migration is
occurring through the full duration of the night then there is a longer period when the turbines pose a
potential risk to these migrants.
Considering the limited range of the microphones (see Appendix A) and the hyperbolic
restrictions of location associated with a specific time delay, time delays below 60 mS are
theoretically from birds flying below 88.4-meters above ground level. This was determined by
looking at what time delay hyperbola intersected the plane of the wind turbine tower height at the
150-meter lateral sensitivity limit of the microphone (see Figure 10). The proximity of the values in
the less than 60 mS range each season, 20% in 2000 and 22% in 2001, is worth noting but
additional seasons of data would be needed to substantiate any pattern. Weather variations seem
likely to alter this figure from season to season. Conversely, each season had roughly 80% of the
time delays above 60 mS. As time delays rise above 60 mS it is more likely that the flight altitudes
are above 88.4-meters. Though large time delays do not necessarily mean that birds are flying above
88.4-meters.
We assume in this study that calling of nocturnal migrants occurs at a laterally uniform rate in
the atmosphere; in other words, calling does not just occur in the vicinity of the tower. This is
validated by other recording stations in the region that were running simultaneously. Data on the
timing and quantity of calling for several stations in the region indicated that, while calling behavior
may sometimes be influenced by weather and artificial lighting, consistent calling patterns across time
71
and space occur. This has been confirmed in other studies across eastern North America (Evans and
Rosenberg 2000, Evans 2000, Larkin et al 2002).
The data for both seasons indicate that around 20% of the nocturnal migrants were flying less
than 88.4-meters above ground level and that bird migration at these low altitudes occurred
throughout the course of the evening, not just during ascent to and descent from migration.
However, some component of the 20% was undoubtedly due to ascending or descending birds.
Data from both spring and fall migration show that variation in flight altitude occurred from one night
to another, presumably due to variations in weather.
Analysis of nocturnal flight calls reveals significant differences in the numbers of nocturnal
birds passing overhead at different localities. Both the MGE and WPS localities appeared to be
traversed by low numbers of migrants compared with the Lake Michigan coastal location (Algoma
High School), in particular. Comparisons like this need to be treated cautiously, however, because
differences could have been caused by differences in the amount of background noise (making it
more difficult to detect bird vocalizations), perhaps even caused by the wind turbines themselves.
Despite this consideration, our study provides no evidence that the wind turbine localities are
channels for unusually large numbers of migrants.
Analysis of diurnal birds reveals several differences between the wind turbine localities and
the adjacent landscape. The Reference Area yielded greater numbers of waterfowl and raptors,
perhaps due to differences in habitat, but the Reference Area is closer to the shore of Green Bay,
where large numbers of Canada Geese and Mallards are expected to occur. It is possible, however,
that birds like Canada Geese altered their flight patterns to avoid the wind turbines. During the 1998
surveys, Canada Geese were more abundant in the Turbine Area than in the Reference Area
(Erdman 1998); this relationship was reversed during 1999 and 2000. During 2001, when most of
the surveys were conducted during spring (like the 1998 study), Canada Geese were again more
abundant in the Turbine Area. These differences between areas and between years cannot be
considered strong evidence of impacts caused by the wind turbines because the sample size is small
and vulnerable to the effects of just a few aberrant samples. The difference in Canada Geese
72
observed in 1998, for example, was caused by large numbers of geese in just a few of the long
counts; if we examine only the short counts (a larger number of sample points), the numbers of
Canada Geese were greater in the Reference Area than in the Turbine Area.
Gulls were consistently more common in the Turbine Area than in the Reference Area,
consistent with the proximity to breeding colonies and roosting sites along the Lake Michigan
coastline. Likewise, the absence of Bonaparte’s Gull and changes in abundance of Ring-billed Gulls
after 1998 reflected shifts in the roosting localities of flocks along Lake Michigan, unrelated to
conditions in the wind turbine study area.
Despite the inevitable shortcomings of a short-term study, surveys of diurnal birds during
1998-2001 identify potential risks of bird mortality at the Kewaunee County wind turbines. Some of
the most common species birds appear to clearly avoid the towers; no Ring-billed Gulls, Canada
Geese, or raptors were found during carcass searches, despite the fact that they were quite common
in the area. Significant levels of raptor mortality were reported from wind turbines in California (e.g.,
Howell and Noone 1992), but this result has not been repeated elsewhere (Erickson et al. 2001).
The possibility still exists that raptor mortality could occur at the Kewaunee County wind turbines
given the diversity of species and abundance of special concern species like Northern Harrier, but
we can provide no evidence that such mortality occurred during the first 2 years of operation.
Relatively high numbers of raptors like Red-tailed Hawk and Turkey Vulture were observed within
the sweep area of the turbines, further emphasizing the risk of occasional raptor mortality.
Waterfowl mortality has been identified as a potential impact of wind turbines by Winkleman
(1990), Walcott (1995), and others. Again the potential exists at Kewaunee County given the large
numbers of Canada Geese observed in the area. Two Mallard carcasses were discovered during the
mortality surveys, but post-mortem analysis suggests that these birds were possibly killed by farm
equipment or some other factor. Efficiency of searches inevitably is biased toward larger birds, so it
is very unlikely that this study would have overlooked significant mortality of raptors, waterfowl, or
other large bird species.
73
Other vulnerable groups of species include swallows and grassland birds, including winter
visitors like Snow Bunting and Lapland Longspur. Swallows were disproportionately common in the
turbine sweep area (Appendix F), and the 25 documented bird mortalities included 2 Tree
Swallows, 1 Barn Swallow, and 1 Chimney Swift. Grassland Birds also were well represented in the
list of mortalities. Nearly 1/3 of the recovered carcasses (7 of 25) were birds of open grasslands,
including Eastern Kingbird, Horned Lark, Savanna Sparrow (2), Grasshopper Sparrow, American
Goldfinch, and Snow Bunting. Large flocks of Snow Buntings and Lapland Longspurs were
observed commonly in the study area during winter, perhaps for the same reason that the area is
desirable for generation of wind power: High winds during winter erode much of the snow cover in
this area, exposing seeds for feeding by flocks of longspurs and buntings. Although not represented
in the documented mortalities, Upland Sandpiper, Eastern and Western Meadowlark, and Bobolink
were regularly observed in the study area, often very close to the wind turbines. These species have
declined over much of their geographic ranges (Sample and Mossman 2000); consequently,
collisions with wind turbines could become a serious issue for grassland bird conservation in
Wisconsin. Fortunately, most of the activity for these sensitive grassland species appears to take
place below the sweep area of the wind turbines. Leddy et al. (1999) recommend that wind turbines
be placed in cropland rather than Conservation Reserve Program (CRP) grasslands to minimize the
mortality of grassland bird species. Given a choice of habitats to place the turbines, the cropland
obviously would be less likely to yield bird mortalities. However, the level of mortality is likely to be
small, and the benefits of maintaining grassland habitat as opposed to open, monoculture cropland
might outweigh the potential loss of birds due to collision with the wind turbines.
The mortality of bats appears to be strongly associated with migration periods. Appearance
of carcasses below the wind turbines showed a strong and consistent seasonality (Figure 34), and the
composition of species did not mirror the relative abundance of local species. Of 72 bat carcasses,
only one was a Big Brown Bat, a common resident species that is believed to be abundant in
northeastern Wisconsin (Jackson 1961, Kurta 1995). Only 6 of the specimens were members of the
genus Myotis, which includes the abundant Little Brown Bat. The supposedly less common Hoary
74
Bat (Kurta 1995), on the other hand, was represented by 25 specimens. Like the Red Bat (27
specimens) and Silver-haired Bat (13 specimens), the Hoary Bat is known to migrate through
Wisconsin. Similar results have been reported in other areas. Erickson et al. (2002) summarized
recent studies of bat mortality at wind turbines in the U.S., where collision mortality is “virtually non-
existent” during the breeding season, despite the presence of nearby bat populations. They also
concluded that bat mortality during migration affects only a small fraction of the bats which pass by
the wind turbines. Adjusted estimates of bat mortality summarized in their study, however (also see
Johnson et al. 1999) were approximately 3 times lower than the estimates provided here. One
exception is bat mortality reported at Buffalo Mountain, Tennessee, where unadjusted mortality was
10 bats / turbine / year, a number even greater than the 4.26 bats / turbine / year reported from
Kewaunee County. Observations from lowland habitats near the study area (Puzen pers. com.)
suggest that a very large bat population exists here during the summer months, and a total mortality of
less than 150 bats per year is not a large percentage of the population.
Although we have accounted for some of the sources of error in adjusting estimates of bird
and bat mortality, the composition of the substrate adds additional uncertainty. During mid-summer,
for example, tall vegetation in cornfields and unharvested hay fields made effective searches nearly
impossible. Significant areas of exposed ground were always available along access roads and
around the base of each tower, but some additional adjustment is necessary to account for vegetation
cover. During the efficiency assessment experiments, the vegetation was lower than it was during
mid-late summer. We have not attempted to quantify the loss of efficiency due to this factor except
to acknowledge that our mortality estimates are surely underestimates of the actual mortality caused
by the wind turbines.
The wind turbines in Kewaunee County caused mortality of some birds and, to a greater
extent, migratory bats. Potential exists for mortality of a wide variety of bird species, including a few
endangered or threatened species and several species of special concern in Wisconsin.
Observations of diurnal birds, however, showed that most day-active birds occur at elevations below
the sweep area of the turbines, while acoustic monitoring revealed that most nocturnal migrants fly

75
above the sweep area. Low numbers of bird carcasses recovered below the 31 turbines are
consistent with these conclusions. Comparison of diurnal bird distributions before and after
construction of the wind turbines suggests that some changes in avian activity might have occurred,
but this result is confounded by seasonal variation and was reversed during spring 2001. Evidence
for any shifts in bird distributions are at best inconclusive.
Our research is consistent with the pattern emerging from other wildlife impact assessments
at wind turbine facilities (Erickson et al. 2001). While bird collisions do occur, the impacts on global
populations appear to be relatively minor, especially in comparison with other human-related causes
of mortality such as communications towers, collisions with buildings, and vehicle collisions. This is
particularly true for small scale facilities like the MGE and WPS wind farms in Kewaunee County.
Highest risks appear to exist for resident and wintering grassland bird species, which are widespread
in the study area. Some of these species (e.g., Upland Sandpiper, Horned Lark, Eastern and
Western Meadowlarks, Bobolink, and Grasshopper Sparrow) have declined alarmingly during the
past 30 years due to factors that are poorly understood (Sample and Mossman 1998, Sauer et al.
2001), and even modest levels of mortality could have an impact on local populations. Habitat
management and monitoring of grassland bird populations in this region would help insure that the
wind turbines have minimal effects on these birds.
Given the documented effects of wind turbines on raptors in California (Orloff and Flannery
1992), the potential for impacts of Kewaunee County wind facilities on endangered, threatened, or
special concern species like Northern Harrier, Bald Eagle, Merlin, and Peregrine Falcon (all of which
were observed during this study) cannot be ignored. The fact that the wind turbines in Kewaunee
County represent a different design (tubular vs. lattice tower) and are spaced differently than the
California turbines (Erickson et al. 2001), however, account for a lower incidence of collisions (none
documented) in this study. Likewise, lack of significant raptor mortality at other recent wind power
facilities in the Midwestern U.S. (e.g., Johnson et al. 1999) suggests that the risk of significant raptor
mortality is relatively small.
76
Bat mortality at the Kewaunee County turbines was almost 3 times greater than bird
mortality. The predominance of migratory forest species (Hoary Bat, Red Bat, and Silver-haired
Bat) and the strong seasonal pattern imply that most of this mortality was associated with annual
(mainly autumn) migration. No continental monitoring program exists for bats like it does for birds,
so the impacts of this mortality are unknown. According to echolocation studies reported by
Erickson et al. (2002), observed levels of mortality similar to those at Kewaunee County affect only
a small fraction of bats passing by the wind turbines. This conclusion will require critical review. Our
adjusted levels of bat mortality are higher than estimates from open habitats in western North
America (Erickson et al. 2002), so the proximity of lowland forest areas might make the Kewaunee
County locality particularly vulnerable to bat mortality. Bat mortality has been reported in Australia
(Hall and Richards 1972), Minnesota (Osborn et al. 2000), and Tennessee (TVA 2002) and is
summarized by Erickson et al. (2002). Causes and impacts of bat mortality at wind turbines certainly
deserve future investigation, especially in semi-forested landscapes. An even higher level of bat
mortality (8.53 / turbine / year, unadjusted for search bias) has been reported at Buffalo

77
Mountain, Tennessee (TVA 2002). This site, near Oak Ridge in Anderson County, lies within 5
miles of extensively forested areas, including Frozen Head State Natural Area and the Cumberland
Trail. Large scale monitoring of bat populations in northeastern Wisconsin can help establish a
context for observed and potential mortality at wind power facilities. Technology to detect bat
ultrasound is now widely available, making a systematic monitoring program both feasible and
affordable.
78
BIBLIOGRAPHY
American Wind Energy Association (AWEA). 1995. Avian interactions with wind energy facilities: a summary. Prepared by Colson & Associates for AWEA, Washington, D.C. Anderson, R., M. Morrison, K. Sinclair and D. Strickland. 1999. Studying wind energy/bird interactions: A guidance document. National Wind Coordinating Committee/RESOLVE, Washington, D.C. 87pp. Avery, M.L., P.F. Springer, and J.F. Cassel. 1977. Weather influences on nocturnal bird mortality at a North Dakota tower. Wilson Bulletin 89(2):291-299. Avery, M., P. Springer, and N. Dailey. 1980. Avian mortality at man-made structures: an annotated bibliography. U.S. Fish and Wildlife Service, Biological Services Program, National Power Plant Team, FWS/OBS-80/54. 152 pp. Banks, R.C. 1979. Human related mortality of birds in the United States. U.S. Fish and Wildlife Service Special Scientific Report - Wildlife No. 215. 16 pp. California Energy Commission. 1989. Avian Mortality at Large Wind Energy Facilities in California: Identification of a Problem. August 1989. California Energy Commission. 1992. Wind Turbine Effects on Avian Activity, Habitat Use, and Mortality in Altamont Pass and Solano County Wind Resource Areas 1989-1991. Final Report. March 1992. Cooper, B.A., R.H. Day, R.J. Ritchie, and C.L. Cranor. 1991. An improved marine radar system for studies of bird migration. Journal of Field Ornithology 62(3): 367-377. Crawford, R.L. 1981. Weather migration and autumn bird kills at a north Florida TV tower. Wilson Bulletin 93(2):189-195. Curry, R. C. 1993. KENETECH Windpower Avian Research Program. October. Demastes, J. W. and J. M. Trainer. 2000. Avian risk, fatality, and disturbance at the IDWGP Wind Farm, Algona, Iowa. Final report submitted by University of Northern Iowa, Cedar Falls, IA. 21pp. Dirkson, S. 1998. A review of Recent Development in Wind Energy and Bird Research in Western Europe. Paper presented at the San Diego National Avian Wind Power Interaction Workshop III. May 27-29, 1998. Erdman, T.C. 1998. Spring 1998 bird surveys: Rosiere Wind Farm, Kewaunee County, WI. Madison Gas and Electric Co. , Madison, WI Erickson, W. P., Strickland, D., Johnson, G. D., and Kern, J.W. 1998. Examples of Statistical Methods to Assess Risk of Impacts to Birds from Windplants. Paper presented at the San Diego National Avian Wind Power Interaction Workshop III. May 27-29, 1998. Erickson, W.P., G.D. Johnson, M.D. Strickland, D.P. Young, Jr., K.J. Sernka, and R.E. Good. 2001. Avian collisions with wind turbines: a summary of existing studies and comparisons to other sources of avian collision mortality in the United States. Western Ecosystems Technology, Inc. National Wind Coordinating Committee Research Document. Washington, DC. Erickson, W. P., G. D. Johnson, M. D. Strickland and K. Kronner. 2000b. Avian and bat mortality associated

79
with the Vansycle Wind Project, Umatilla County, Oregon: 1999 study year. Technical Report prepared by WEST, Inc. for Umatilla County Department of Resource Services and Development, Pendleton, Oregon. 21pp. Erickson, W., G. Johnson, D. Young, D. Strickland, R. Good, M. Bourassa, and K.B. 2002. Synthesis and comparison of baseline avian and bat use, raptor nesting and mortality information from proposed and existing wind developments. Draft Report. West, Inc. Cheyenne, WY. Evans, W. R., and A. M. Manville, II (eds.). 2000. Avian mortality at communication towers. Transcripts of Proceedings of the Workshop on Avian Mortality at Communication Towers, August 11, 1999, Cornell University, Ithaca, NY. Published on the internet at <http://www.towerkill.com/> and <http://migratorybirds.fws.gov/issues/towers/agenda.html>
Evans, W.R. and M. O’Brien. 2002. Flight calls of migratory birds, North American landbirds. Old Bird, Inc. www.oldbird.org
Evans, W.R. 2000. Applications of acoustic bird monitoring for the wind power industry PNAWPPM-III. 2000. Proceedings of National Avian - Wind Power Planning Meeting III, San Diego, California, May 1998. Prepared for the Avian Subcommittee of the National Wind Coordinating Committee by LGL Ltd., King City, Ont. 202 p. http://www.nationalwind.org/pubs/avian98/default.htm. Evans, W.R. and K.V. Rosenberg. 2000. Acoustic monitoring of night-migrating birds: a progress report. In Bonney, Rick, David N. Pashley, Robert J. Cooper, and Larry Niles, eds. Strategies of Bird Conservation: The Partners in Flight Planning Process. Proceedings of the 3rd Partners in Flight Workshop; 1995 October 1-5; Cape May, NJ. Proceedings RMRS-P-16. Ogden, UT: U.S. Department of Agriculture, Forest Service, Rocky Mountain Research Station. http://birds.cornell.edu/pifcapemay/evans_rosenberg.htm Finley, R.W. 1976. Map. Original vegetation cover of Wisconsin, compiled from U.S. General Land Office notes. Madison, WI: University of Wisconsin Extension. map (1:500,000). Frelich, L.E. 1995. Old forest in the Lake States today and before European settlement. Natural Areas Journal 15(2):157-167.
Gauthreaux, S. A. 1995. Standardized assessment and monitoring protocols. Pp, 53-59.In Proceedings of the National Avian-Wind Power Planning Meeting. Report DE95-004090. RESOLVE, Inc. Washington, DC.
Hall, L.S. and G.C. Richards. 1972. Notes on Tadarida australis (Chiroptera:Molossidae). Australian Mammalogy 1:46. Hanowski, J. 1998. Avian Population Analysis for Wind Power in Western Minnesota. Paper presented at the San Diego National Avian Wind Power Interaction Workshop III. May 27-29, 1998.
Higgins, K.F., R.E. Usgaard, and C.D. Dieter. 1996. Monitoring Seasonal Bird Activity and Mortality at the Buffalo Ridge Windplant, MN. KENETECH Windpower, Inc. Cooperative Fish and Wildlife Research Unit, South Dakota State Univ., Brookings, South Dakota. Howe, R.W., Erdman, T.C. and Kruse, K.D. 1995. Potential Avian Mortality at Wind Generation Towers in Southeastern Brown County. A report submitted to Wisconsin Public Service Corporation. November 8, 1995. Howell, Judd A., Keane, John J. and DiDonato, Joseph E. 1988. Avian Use Monitoring Related to Wind Turbine Siting, Montezuma Hills, Solano County, California Fall, 1987 to Spring, 1988. Submitted to: Solano County Department of Environmental Management. Fairfield, CA. April 15, 1988.

80
Howell, Judd A. and DiDonato, Joseph E. 1988. Crepuscular Avian Use Monitoring Related to Wind Turbine Siting, Montezuma Hills, Solano County, California Spring, 1988. Submitted to: Solano County Department of Environmental Management Fairfield, CA. May 1, 1988. Howell, Judd A. and DiDonato, Joseph E. 1990. Assessment of Avian Use and Mortality Related to Wind Turbine Operations Altamont Pass, Alameda and Contra Costa Counties, California. September 1988 through August 1989. Submitted to U.S. Windpower, Inc. May 15, 1990. Howell, Judd A., Noone, Jennifer and Wardner, Catherine. 1991. Avian Use and Mortality Study. U.S. Windpower, Wind Energy Site Development Montezuma Hills, Solano County, California Post Construction Spring, 1990 to Spring 1991. Submitted to: Solano County Department of Environmental Management Fairfield, CA. June 1, 1991. Howell, J.A. and Noone, J. 1992. Examination of Avian Use and Mortality at a U.S. Windpower, Wind Energy Development Site Montezuma Hills, Solano County, California. Final Report. Submitted to: Solano County Department of Environmental Management Fairfield, CA. September 10, 1992. Ivanov, K.P. and E.V. Sedunova. 1993. Effect of Wind-driven Power Generators on Bird Fauna. Ekologiya (Moscow) 5:46-53. Jacobs, M.B. 1993. Avian mortality and windpower in the northeast. Massachusetts Department of Public Utilities, Boston, MA. Jackson, H.H.T. 1961. Mammals of Wisconsin. University of Wisconsin Press, Madison WI. Janss, Guyonne. 1998. Study of Bird Behavior in a Wind Farm and Adjacent Areas in Tarifa (Spain). Paper presented at the San Diego National Avian Wind Power Interaction Workshop III. May 27-29, 1998. Johnson, G. D., D. P. Young, Jr., W. P. Erickson, C. E. Derby, M. D. Strickland, and R. E. Good. 2000a. Wildlife Monitoring Studies: SeaWest Windpower Project, Carbon County, Wyoming: 1995-1999. Tech. Report prepared by WEST, Inc. for SeaWest Energy Corporation and Bureau of Land Management. 195pp. Johnson, G. D., W. P. Erickson, M. D. Strickland, M. F. Shepherd and D. A. Shepherd. 2000. Avian Monitoring Studies at the Buffalo Ridge Wind Resource Area, Minnesota: Results of a 4-year study. Technical Report prepared for Northern States Power Co., Minneapolis, MN. 212pp. Johnson, G. D., D. P. Young, Jr., W. P. Erickson, M. D. Strickland, R. E. Good and P. Becker. 2001. Avian and bat mortality associated with the initial phase of the Foote Creek Rim Windpower Project, Carbon County, Wyoming: November 3, 1998 - October 31, 2000. Tech. Report prepared by WEST, Inc. for SeaWest Energy Corporation and Bureau of Land Management. 32pp. Jones and Stokes, Associates, Inc. 1994. Klickitat County Avian Study Plan. Report submitted to R.W. Beck and Associates, Seattle, WA.
Keeley, B., S. Ugoretz, & D. Strickland. 2001. Bat ecology and wind turbine considerations. Pp. 135-146 In S. S. Schwartz, (ed.) Proceedings of the National Avian- Wind Planning Meeting IV. Prepared for the Avian Subcommittee of the National Wind Coordinating Committee by RESOLVE, Inc. Washington, DC.
Kemper, C. 1996. A study of bird mortality at a west central Wisconsin TV tower from 1957-1995. The Passenger Pigeon 58: 219-235. Kerlinger, Paul. 1998. An assessment of the impacts of Green Mountain Power Corps. Searsburg, VT Wind Power Facility on Breeding and Migrating Birds. Paper presented at the San Diego National Avian Wind Power Interaction Workshop III. May 27-29, 1998.

81
Kerlinger, P. 1997. A study of avian fatalities at the Green Mountain Power Corporation's Searsburg, Vermont, windpower facility 1997. Prepared for Vermont Department of Public Service, Green Mountain Power Corporation, National Renewable Energy Laboratory and Vermont Environmental Research Associates. 12pp. Kerlinger, P. and R. Curry. 2000. Avian risk studies at the Ponnequin Wind Energy Project, Weld County, Colorado: Status of field studies - 1999 - report for Technical Review Committee. Report prepared for Public Service Company of Colorado. Kerlinger, P. 2000. Avian mortality at communication towers: a review of recent literature, research, and methodology. Unpublished report prepared for the U.S. Fish and Wildlife Service, Office of Migratory Bird Management. Klem, D. Jr. 1979. Biology of collisions between birds and windows. Ph.D. Thesis, Southern Illinois University, Carbondale, IL. Kurta, A. 1995. Mammals of the Great Lakes region. University of Michigan Press, Ann Arbor, MI. 376 pp. Larkin, R.P., Evans, W.R., and Diehl, R.H. 2002. Nocturnal flight calls of Dickcissels and Doppler radar echoes over south Texas in spring. Journal of Field Ornithology 73:2-8. Leddy, K.L., K.F. Higgins, and D.E. Naugle. 1999. Effects of wind turbines on upland nesting birds in conservation reserve program grasslands. Wilson Bulletin 111:100-104. Lowther, Stewart. European Perspective. 1998. Paper presented at the San Diego National Avian Wind Power Interaction Workshop III. May 27-29, 1998.
Manville, A. M. II. 2000. The ABCs of avoiding bird collisions at communication towers: the next steps. Proceedings of the Avian Interactions Workshop, December 2, 1999, Charleston, SC. Electric Power Research Institute. http://www.towerkill.com/
McCrary, M.D., R.L. McKernan, R.E. Landry, W.D. Wagner, and R.W. Schreiber. 1984. Nocturnal avian migration assessment of the San Gorgonio Wind Resource Study Area, Spring 1982. Report prepared for Research and Development, Southern California Edison Company, Rosemead, CA. Morrison, Michael L., Pollock, Kenneth H., Oberg, Ann L., and Sinclair, Karin C. 1998. Predicting the Response of Bird Populations to Wind Energy-Related Deaths. Paper presented at the 36th AIAA Aerospace Sciences Meeting and Exhibit. Reno, NV. January 12-15, 1998. National Renewable Energy Laboratory (NREL). 1995. Proceedings of National Avian-Wind Power Planning Meeting. Denver, Colorado. July 20-21, 1994. Minutes published February 24, 1995. National Renewable Energy Laboratory (NREL). 1998. Proceedings of National Avian-Wind Power Planning Meeting II. Palm Springs, California. September 20-22, 1995. Minutes published February 1998. Nelson, H.K. 1993. A biological reconnaissance of Buffalo Ridge, Lincoln and Pipestone Counties, Minnesota. Wind River Power Company, Davenport, IA. Nelson, H.K. and R.C. Curry. 1995. Assessing Avian Interactions with Windplant Development and Operation. Trans. N. Am. Wildl. Nat. Res. Conf. 60:266-277. Orloff, S. 1992. Tehachapi Wind Resource Area avian collision baseline study. California Energy
82
Commission, Sacramento, CA. Orloff, S. & A. Flannery. 1992. Wind turbine effects on avian activity, habitat use, and mortality in Altamont Pass and Solano County WRAs. Prepared by BioSystems Analysis, Inc. (Tiberon, CA) for California Energy Commission. Osborn, R. G., K. F. Higgins, R. E. Usgaard, C. D. Dieter and R. G. Neiger. 2000. Bird mortality associated with wind turbines at the Buffalo Ridge Wind Resource Area, Minnesota. Am. Midl. Nat. 143:41-52. Pederson, M.B. and E. Poulson. 1991. Avian Responses to the Implementation of the Tjaereborg Wind Turbine at the Danish Wadden Sea. Dan. Wildtundersogelser 47:1-44. Preston, F.W. 1962. The canonical distribution of commonness and rarity. Ecology 43:185-215. Robbins, C. S., D. Bystrak, and P. H. Geissler. 1986. The breeding bird survey: its first fifteen years, 1965-1979. U.S. Fish and Wildlife Service Resource Publications 157. Robbins, S. D. Jr. 1991. Wisconsin birdlife: population and distribution past and present. University of Wisconsin Press. Madison, WI. 702 pp. Sample, D.W. and M.J. Mossman. 1997. Managing habitat for grassland birds: a guide for Wisconsin. Wisconsin Department of Natural Resources. Madison, WI. Sauer, J. R., J. E. Hines, and J. Fallon. 2001. The North American Breeding Bird Survey, Results and Analysis 1966 - 2000. Version 2001.2, USGS Patuxent Wildlife Research Center, Laurel, MD. Somerhage, M. 1994. Bird Observations in the Massenhaeuser Hoehe Region: Planned Site of Wind Power Plants. Vogelkundliche Hefte Edertal (20): 27-36. Strickland, M. Dale, Erickson, Wallace P. 1998. A study of the Effects of Bird Deterrent Methods Applied to Wind Turbines at the CARES Wind Power Site in Washington. Paper presented at the San Diego National Avian Wind Power Interaction Workshop III. May 27-29, 1998. Strickland, M. Dale, Johnson, Gregory D., and Erickson, Wallace P. 1998. Avian use, Flight Behavior and Mortality on the Buffalo Ridge, Minnesota Wind Resource Area. Paper presented at the San Diego National Avian Wind Power Interaction Workshop III. May 27-29, 1998. Strickland, M. Dale, Young, David P. Jr., Johnson, Gregory D., Derby, Clayton E., Erickson, Wallace P., and Kern, John W. 1998. Wildlife Monitoring Studies for the Seawest Windpower Development, Carbon County, Wyoming. Paper presented at the San Diego National Avian Wind Power Interaction Workshop III. May 27- 29, 1998. Tennessee Valley Authority (TVA). 2002. Final environmental assessment 20-MW windfarm and associated energy storage facility. Knoxville, TN 37917. Thelander, C. G. and L. Rugge. 2000a. Avian risk behavior and fatalities at the Altamont Wind Resource Area March 1998 to February 1999. Prepared by BioResource Consultants for the National Renewable Energy Laboratory, Subcontract No. TAT-8-18209-01, NREL/SR-500-27545. Golden, CO. 23pp. Thelander, C. G. and L. Rugge. 2000b. Bird risk behaviors and fatalities at the Altamont Wind Resource Area. Pages 5-14 in Proceedings of the National Avian-Wind Power Planning Meeting III. National Wind Coordinating Committee/RESOLVE. Washington, D.C.

83
Trapp, J. L. 1998. Bird kills at towers and other man-made structures: An annotated partial bibliography (1960- 1998). http://migratorybirds.fws.gov/issues/tower.html. Walcott, C. 1995. Tilting at windmills. Living Bird (Summer 1995):11-15. Winkleman, J.E. 1985. Bird impact by middle-sized wind turbines on flight behavior, victims, and disturbance. Limosa 58:117-121. Winkleman, J.E. 1990. Impact of the Wind Park near Urk, Netherlands, on Birds: Bird Collision Victims and Disturbance of Wintering Fowl. Acta XX Congressus Internationis Ornithologici: 402-403. Winkleman, J. E. 1995. Bird/wind turbine investigations in Europe. Pages 43-47 in Proceedings of the National Avian-Windpower Planning Meeting. National Wind Coordinating Committee/RESOLVE. Washington, D.C.
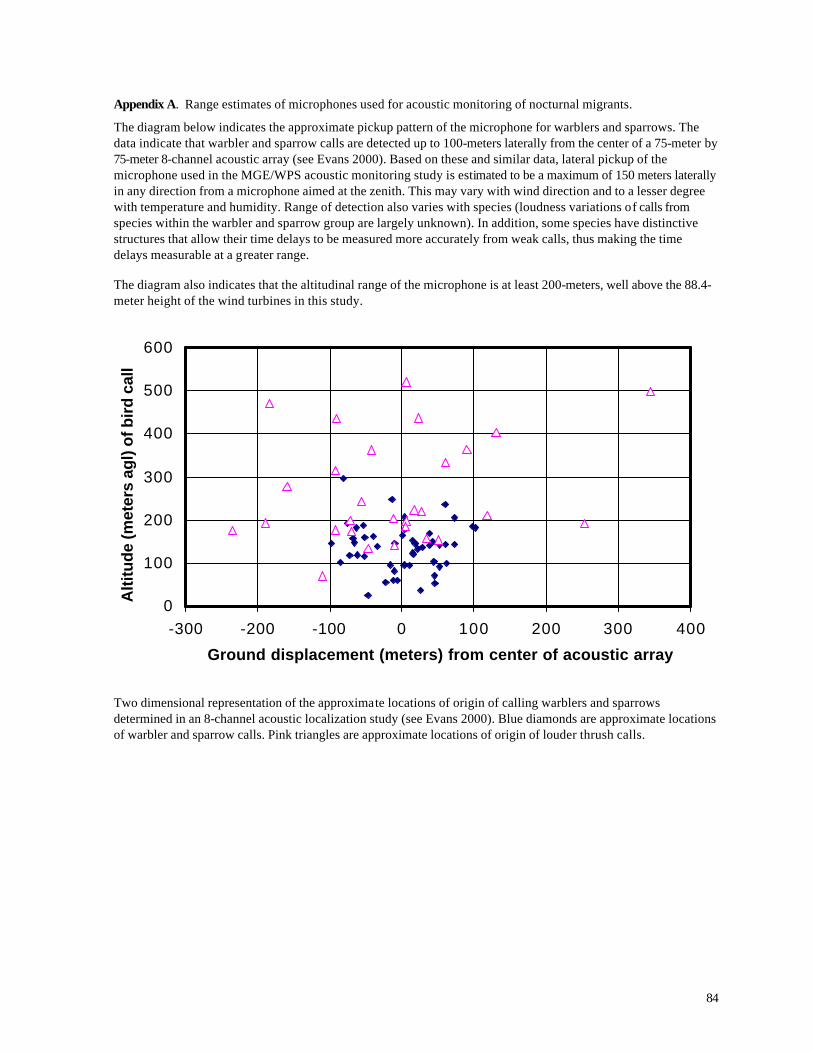
84
Appendix A. Range estimates of microphones used for acoustic monitoring of nocturnal migrants.
The diagram below indicates the approximate pickup pattern of the microphone for warblers and sparrows. The data indicate that warbler and sparrow calls are detected up to 100-meters laterally from the center of a 75-meter by 75-meter 8-channel acoustic array (see Evans 2000). Based on these and similar data, lateral pickup of the microphone used in the MGE/WPS acoustic monitoring study is estimated to be a maximum of 150 meters laterally in any direction from a microphone aimed at the zenith. This may vary with wind direction and to a lesser degree with temperature and humidity. Range of detection also varies with species (loudness variations of calls from species within the warbler and sparrow group are largely unknown). In addition, some species have distinctive structures that allow their time delays to be measured more accurately from weak calls, thus making the time delays measurable at a greater range.
The diagram also indicates that the altitudinal range of the microphone is at least 200-meters, well above the 88.4-meter height of the wind turbines in this study.
0
100
200
300
400
500
600
-300 -200 -100 0 100 200 300 400
Ground displacement (meters) from center of acoustic array
Alti
tude
(met
ers
agl)
of b
ird
call
Two dimensional representation of the approximate locations of origin of calling warblers and sparrows determined in an 8-channel acoustic localization study (see Evans 2000). Blue diamonds are approximate locations of warbler and sparrow calls. Pink triangles are approximate locations of origin of louder thrush calls.
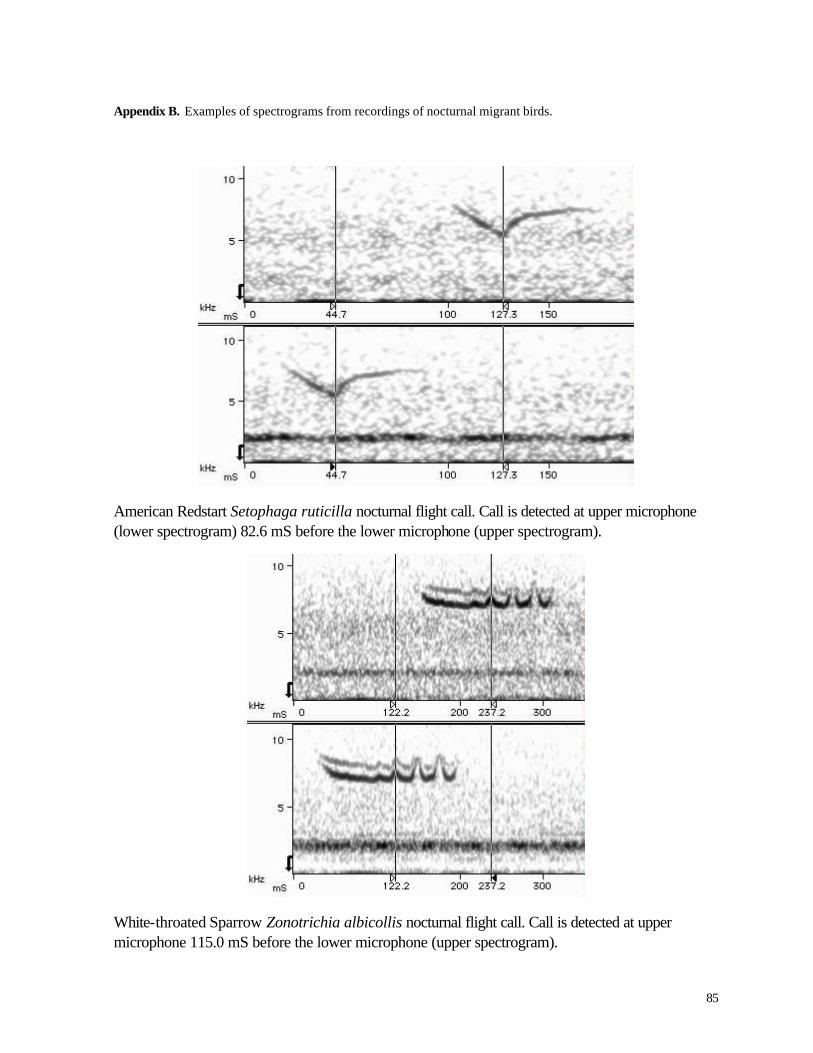
85
Appendix B. Examples of spectrograms from recordings of nocturnal migrant birds.
American Redstart Setophaga ruticilla nocturnal flight call. Call is detected at upper microphone (lower spectrogram) 82.6 mS before the lower microphone (upper spectrogram).
White-throated Sparrow Zonotrichia albicollis nocturnal flight call. Call is detected at upper microphone 115.0 mS before the lower microphone (upper spectrogram).
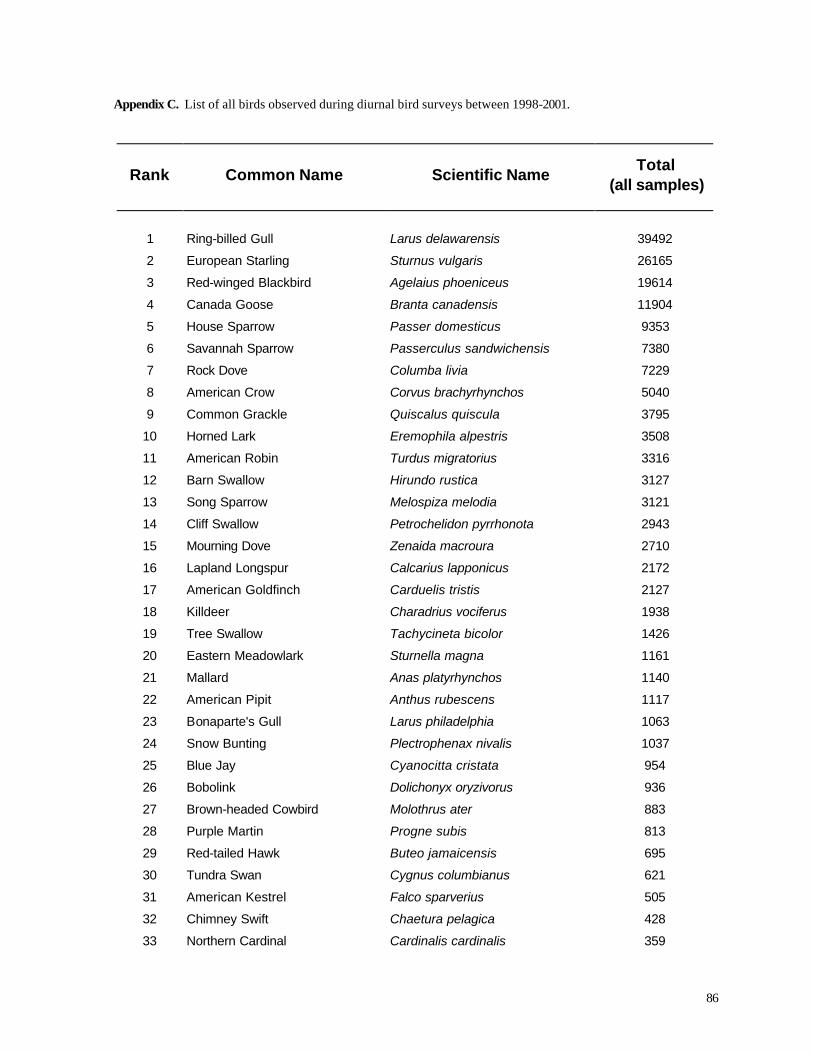
86
Appendix C. List of all birds observed during diurnal bird surveys between 1998-2001.
Rank Common Name Scientific Name Total
(all samples)
1 Ring-billed Gull Larus delawarensis 39492
2 European Starling Sturnus vulgaris 26165
3 Red-winged Blackbird Agelaius phoeniceus 19614
4 Canada Goose Branta canadensis 11904
5 House Sparrow Passer domesticus 9353
6 Savannah Sparrow Passerculus sandwichensis 7380
7 Rock Dove Columba livia 7229
8 American Crow Corvus brachyrhynchos 5040
9 Common Grackle Quiscalus quiscula 3795
10 Horned Lark Eremophila alpestris 3508
11 American Robin Turdus migratorius 3316
12 Barn Swallow Hirundo rustica 3127
13 Song Sparrow Melospiza melodia 3121
14 Cliff Swallow Petrochelidon pyrrhonota 2943
15 Mourning Dove Zenaida macroura 2710
16 Lapland Longspur Calcarius lapponicus 2172
17 American Goldfinch Carduelis tristis 2127
18 Killdeer Charadrius vociferus 1938
19 Tree Swallow Tachycineta bicolor 1426
20 Eastern Meadowlark Sturnella magna 1161
21 Mallard Anas platyrhynchos 1140
22 American Pipit Anthus rubescens 1117
23 Bonaparte's Gull Larus philadelphia 1063
24 Snow Bunting Plectrophenax nivalis 1037
25 Blue Jay Cyanocitta cristata 954
26 Bobolink Dolichonyx oryzivorus 936
27 Brown-headed Cowbird Molothrus ater 883
28 Purple Martin Progne subis 813
29 Red-tailed Hawk Buteo jamaicensis 695
30 Tundra Swan Cygnus columbianus 621
31 American Kestrel Falco sparverius 505
32 Chimney Swift Chaetura pelagica 428
33 Northern Cardinal Cardinalis cardinalis 359
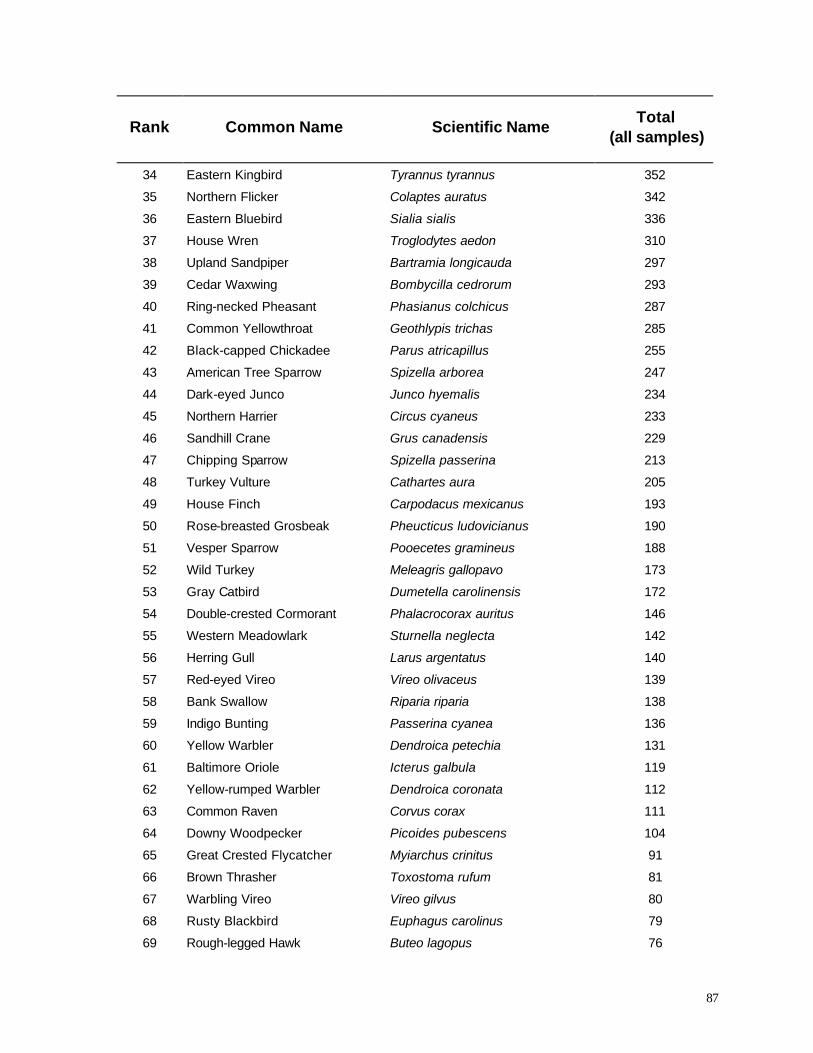
87
Rank Common Name Scientific Name Total
(all samples)
34 Eastern Kingbird Tyrannus tyrannus 352
35 Northern Flicker Colaptes auratus 342
36 Eastern Bluebird Sialia sialis 336
37 House Wren Troglodytes aedon 310
38 Upland Sandpiper Bartramia longicauda 297
39 Cedar Waxwing Bombycilla cedrorum 293
40 Ring-necked Pheasant Phasianus colchicus 287
41 Common Yellowthroat Geothlypis trichas 285
42 Black-capped Chickadee Parus atricapillus 255
43 American Tree Sparrow Spizella arborea 247
44 Dark-eyed Junco Junco hyemalis 234
45 Northern Harrier Circus cyaneus 233
46 Sandhill Crane Grus canadensis 229
47 Chipping Sparrow Spizella passerina 213
48 Turkey Vulture Cathartes aura 205
49 House Finch Carpodacus mexicanus 193
50 Rose-breasted Grosbeak Pheucticus ludovicianus 190
51 Vesper Sparrow Pooecetes gramineus 188
52 Wild Turkey Meleagris gallopavo 173
53 Gray Catbird Dumetella carolinensis 172
54 Double-crested Cormorant Phalacrocorax auritus 146
55 Western Meadowlark Sturnella neglecta 142
56 Herring Gull Larus argentatus 140
57 Red-eyed Vireo Vireo olivaceus 139
58 Bank Swallow Riparia riparia 138
59 Indigo Bunting Passerina cyanea 136
60 Yellow Warbler Dendroica petechia 131
61 Baltimore Oriole Icterus galbula 119
62 Yellow-rumped Warbler Dendroica coronata 112
63 Common Raven Corvus corax 111
64 Downy Woodpecker Picoides pubescens 104
65 Great Crested Flycatcher Myiarchus crinitus 91
66 Brown Thrasher Toxostoma rufum 81
67 Warbling Vireo Vireo gilvus 80
68 Rusty Blackbird Euphagus carolinus 79
69 Rough-legged Hawk Buteo lagopus 76
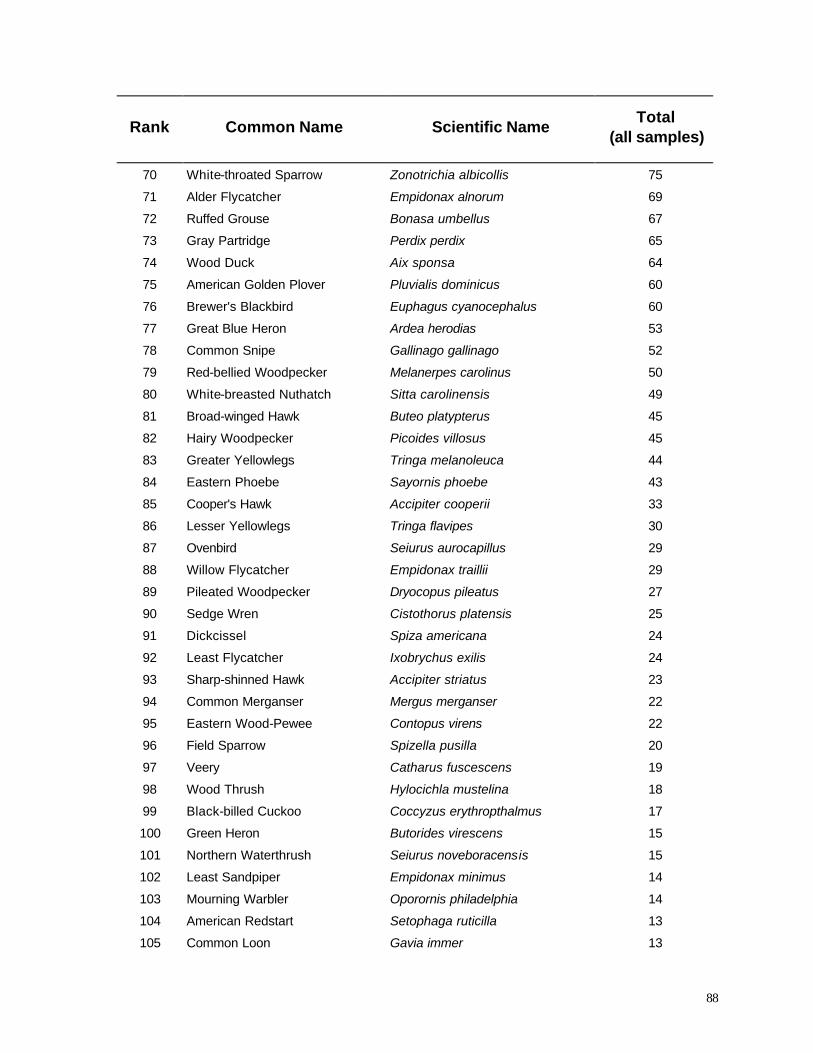
88
Rank Common Name Scientific Name Total
(all samples)
70 White-throated Sparrow Zonotrichia albicollis 75
71 Alder Flycatcher Empidonax alnorum 69
72 Ruffed Grouse Bonasa umbellus 67
73 Gray Partridge Perdix perdix 65
74 Wood Duck Aix sponsa 64
75 American Golden Plover Pluvialis dominicus 60
76 Brewer's Blackbird Euphagus cyanocephalus 60
77 Great Blue Heron Ardea herodias 53
78 Common Snipe Gallinago gallinago 52
79 Red-bellied Woodpecker Melanerpes carolinus 50
80 White-breasted Nuthatch Sitta carolinensis 49
81 Broad-winged Hawk Buteo platypterus 45
82 Hairy Woodpecker Picoides villosus 45
83 Greater Yellowlegs Tringa melanoleuca 44
84 Eastern Phoebe Sayornis phoebe 43
85 Cooper's Hawk Accipiter cooperii 33
86 Lesser Yellowlegs Tringa flavipes 30
87 Ovenbird Seiurus aurocapillus 29
88 Willow Flycatcher Empidonax traillii 29
89 Pileated Woodpecker Dryocopus pileatus 27
90 Sedge Wren Cistothorus platensis 25
91 Dickcissel Spiza americana 24
92 Least Flycatcher Ixobrychus exilis 24
93 Sharp-shinned Hawk Accipiter striatus 23
94 Common Merganser Mergus merganser 22
95 Eastern Wood-Pewee Contopus virens 22
96 Field Sparrow Spizella pusilla 20
97 Veery Catharus fuscescens 19
98 Wood Thrush Hylocichla mustelina 18
99 Black-billed Cuckoo Coccyzus erythropthalmus 17
100 Green Heron Butorides virescens 15
101 Northern Waterthrush Seiurus noveboracensis 15
102 Least Sandpiper Empidonax minimus 14
103 Mourning Warbler Oporornis philadelphia 14
104 American Redstart Setophaga ruticilla 13
105 Common Loon Gavia immer 13
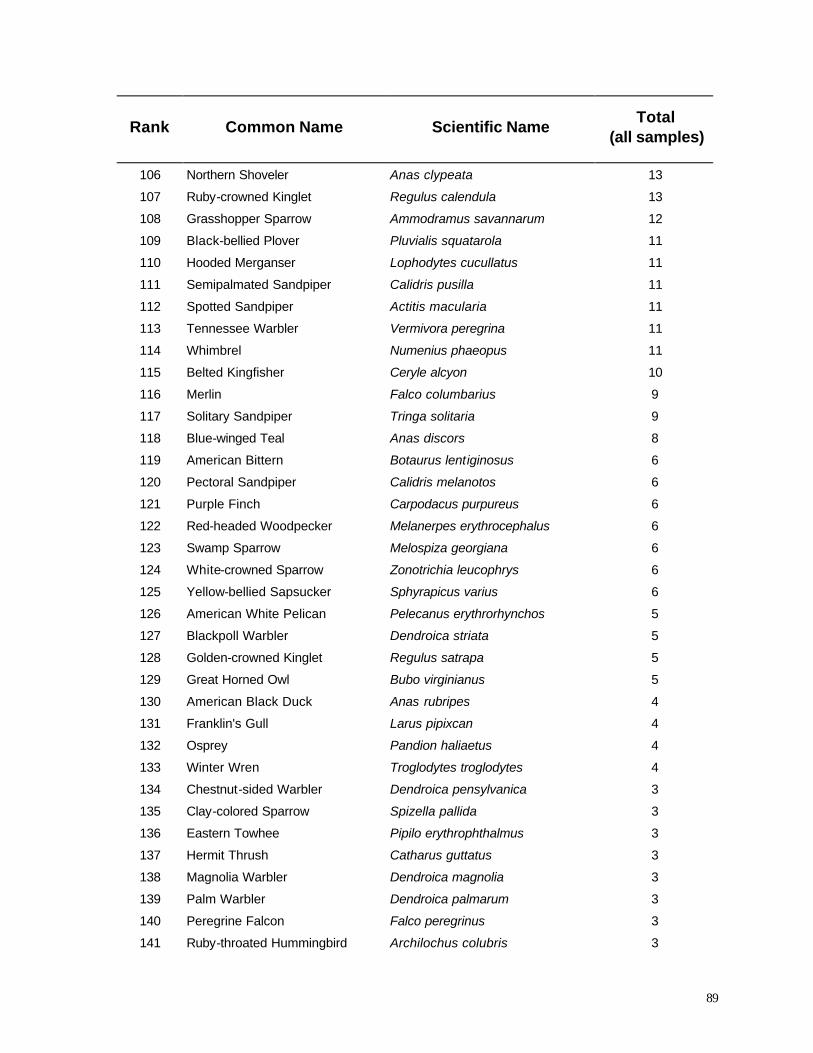
89
Rank Common Name Scientific Name Total
(all samples)
106 Northern Shoveler Anas clypeata 13
107 Ruby-crowned Kinglet Regulus calendula 13
108 Grasshopper Sparrow Ammodramus savannarum 12
109 Black-bellied Plover Pluvialis squatarola 11
110 Hooded Merganser Lophodytes cucullatus 11
111 Semipalmated Sandpiper Calidris pusilla 11
112 Spotted Sandpiper Actitis macularia 11
113 Tennessee Warbler Vermivora peregrina 11
114 Whimbrel Numenius phaeopus 11
115 Belted Kingfisher Ceryle alcyon 10
116 Merlin Falco columbarius 9
117 Solitary Sandpiper Tringa solitaria 9
118 Blue-winged Teal Anas discors 8
119 American Bittern Botaurus lentiginosus 6
120 Pectoral Sandpiper Calidris melanotos 6
121 Purple Finch Carpodacus purpureus 6
122 Red-headed Woodpecker Melanerpes erythrocephalus 6
123 Swamp Sparrow Melospiza georgiana 6
124 White-crowned Sparrow Zonotrichia leucophrys 6
125 Yellow-bellied Sapsucker Sphyrapicus varius 6
126 American White Pelican Pelecanus erythrorhynchos 5
127 Blackpoll Warbler Dendroica striata 5
128 Golden-crowned Kinglet Regulus satrapa 5
129 Great Horned Owl Bubo virginianus 5
130 American Black Duck Anas rubripes 4
131 Franklin's Gull Larus pipixcan 4
132 Osprey Pandion haliaetus 4
133 Winter Wren Troglodytes troglodytes 4
134 Chestnut-sided Warbler Dendroica pensylvanica 3
135 Clay-colored Sparrow Spizella pallida 3
136 Eastern Towhee Pipilo erythrophthalmus 3
137 Hermit Thrush Catharus guttatus 3
138 Magnolia Warbler Dendroica magnolia 3
139 Palm Warbler Dendroica palmarum 3
140 Peregrine Falcon Falco peregrinus 3
141 Ruby-throated Hummingbird Archilochus colubris 3
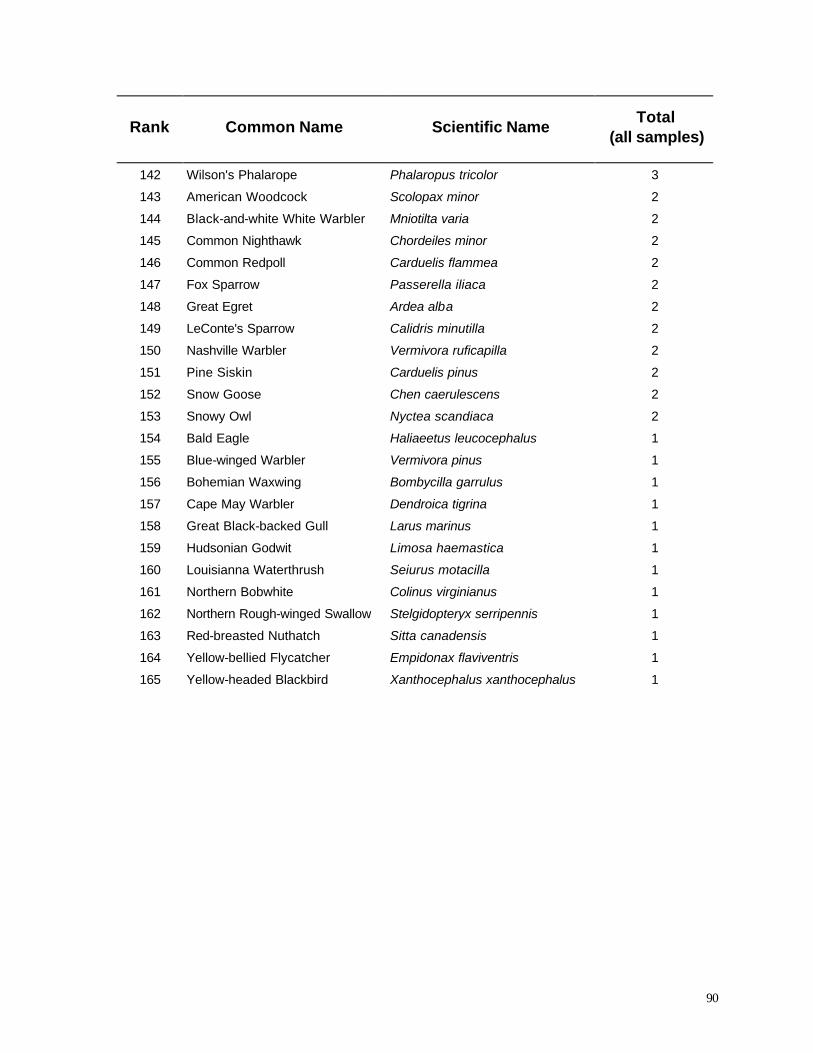
90
Rank Common Name Scientific Name Total
(all samples)
142 Wilson's Phalarope Phalaropus tricolor 3
143 American Woodcock Scolopax minor 2
144 Black-and-white White Warbler Mniotilta varia 2
145 Common Nighthawk Chordeiles minor 2
146 Common Redpoll Carduelis flammea 2
147 Fox Sparrow Passerella iliaca 2
148 Great Egret Ardea alba 2
149 LeConte's Sparrow Calidris minutilla 2
150 Nashville Warbler Vermivora ruficapilla 2
151 Pine Siskin Carduelis pinus 2
152 Snow Goose Chen caerulescens 2
153 Snowy Owl Nyctea scandiaca 2
154 Bald Eagle Haliaeetus leucocephalus 1
155 Blue-winged Warbler Vermivora pinus 1
156 Bohemian Waxwing Bombycilla garrulus 1
157 Cape May Warbler Dendroica tigrina 1
158 Great Black-backed Gull Larus marinus 1
159 Hudsonian Godwit Limosa haemastica 1
160 Louisianna Waterthrush Seiurus motacilla 1
161 Northern Bobwhite Colinus virginianus 1
162 Northern Rough-winged Swallow Stelgidopteryx serripennis 1
163 Red-breasted Nuthatch Sitta canadensis 1
164 Yellow-bellied Flycatcher Empidonax flaviventris 1
165 Yellow-headed Blackbird Xanthocephalus xanthocephalus 1
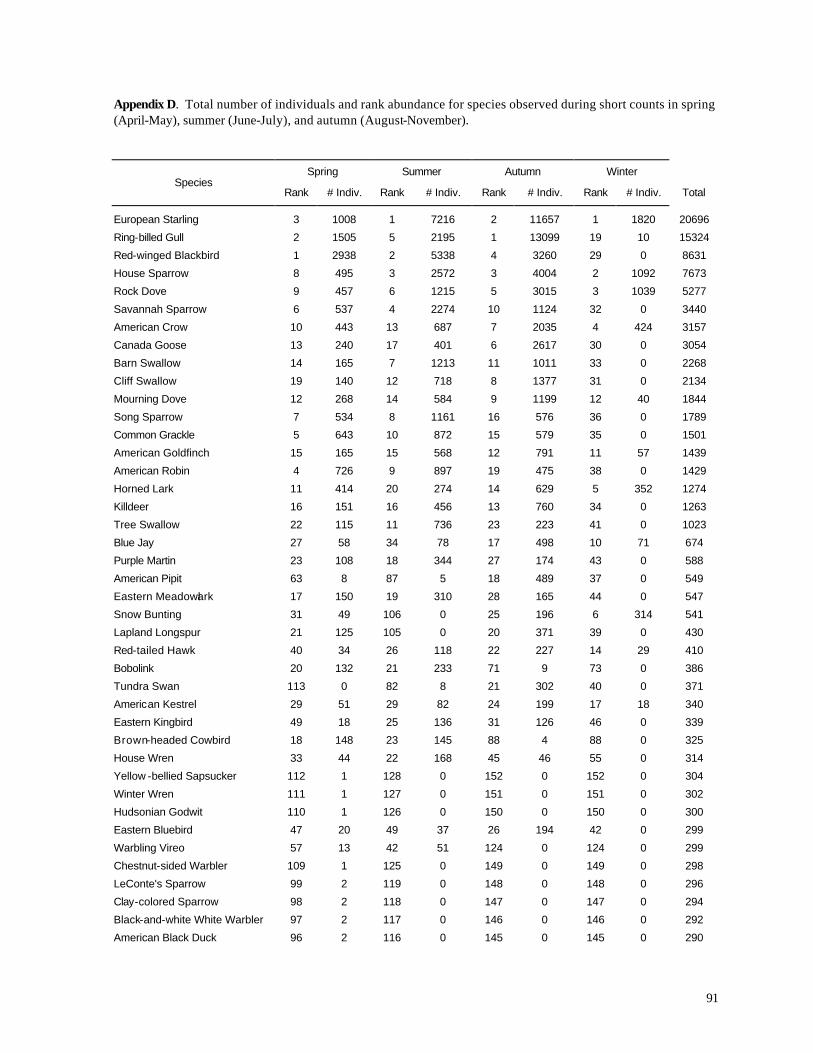
91
Appendix D. Total number of individuals and rank abundance for species observed during short counts in spring (April-May), summer (June-July), and autumn (August-November).
Spring Summer Autumn Winter Species
Rank # Indiv. Rank # Indiv. Rank # Indiv. Rank # Indiv. Total
European Starling 3 1008 1 7216 2 11657 1 1820 20696
Ring-billed Gull 2 1505 5 2195 1 13099 19 10 15324
Red-winged Blackbird 1 2938 2 5338 4 3260 29 0 8631
House Sparrow 8 495 3 2572 3 4004 2 1092 7673
Rock Dove 9 457 6 1215 5 3015 3 1039 5277
Savannah Sparrow 6 537 4 2274 10 1124 32 0 3440
American Crow 10 443 13 687 7 2035 4 424 3157
Canada Goose 13 240 17 401 6 2617 30 0 3054
Barn Swallow 14 165 7 1213 11 1011 33 0 2268
Cliff Swallow 19 140 12 718 8 1377 31 0 2134
Mourning Dove 12 268 14 584 9 1199 12 40 1844
Song Sparrow 7 534 8 1161 16 576 36 0 1789
Common Grackle 5 643 10 872 15 579 35 0 1501
American Goldfinch 15 165 15 568 12 791 11 57 1439
American Robin 4 726 9 897 19 475 38 0 1429
Horned Lark 11 414 20 274 14 629 5 352 1274
Killdeer 16 151 16 456 13 760 34 0 1263
Tree Swallow 22 115 11 736 23 223 41 0 1023
Blue Jay 27 58 34 78 17 498 10 71 674
Purple Martin 23 108 18 344 27 174 43 0 588
American Pipit 63 8 87 5 18 489 37 0 549
Eastern Meadowlark 17 150 19 310 28 165 44 0 547
Snow Bunting 31 49 106 0 25 196 6 314 541
Lapland Longspur 21 125 105 0 20 371 39 0 430
Red-tailed Hawk 40 34 26 118 22 227 14 29 410
Bobolink 20 132 21 233 71 9 73 0 386
Tundra Swan 113 0 82 8 21 302 40 0 371
American Kestrel 29 51 29 82 24 199 17 18 340
Eastern Kingbird 49 18 25 136 31 126 46 0 339
Brown-headed Cowbird 18 148 23 145 88 4 88 0 325
House Wren 33 44 22 168 45 46 55 0 314
Yellow -bellied Sapsucker 112 1 128 0 152 0 152 0 304
Winter Wren 111 1 127 0 151 0 151 0 302
Hudsonian Godwit 110 1 126 0 150 0 150 0 300
Eastern Bluebird 47 20 49 37 26 194 42 0 299
Warbling Vireo 57 13 42 51 124 0 124 0 299
Chestnut-sided Warbler 109 1 125 0 149 0 149 0 298
LeConte's Sparrow 99 2 119 0 148 0 148 0 296
Clay-colored Sparrow 98 2 118 0 147 0 147 0 294
Black-and-white White Warbler 97 2 117 0 146 0 146 0 292
American Black Duck 96 2 116 0 145 0 145 0 290
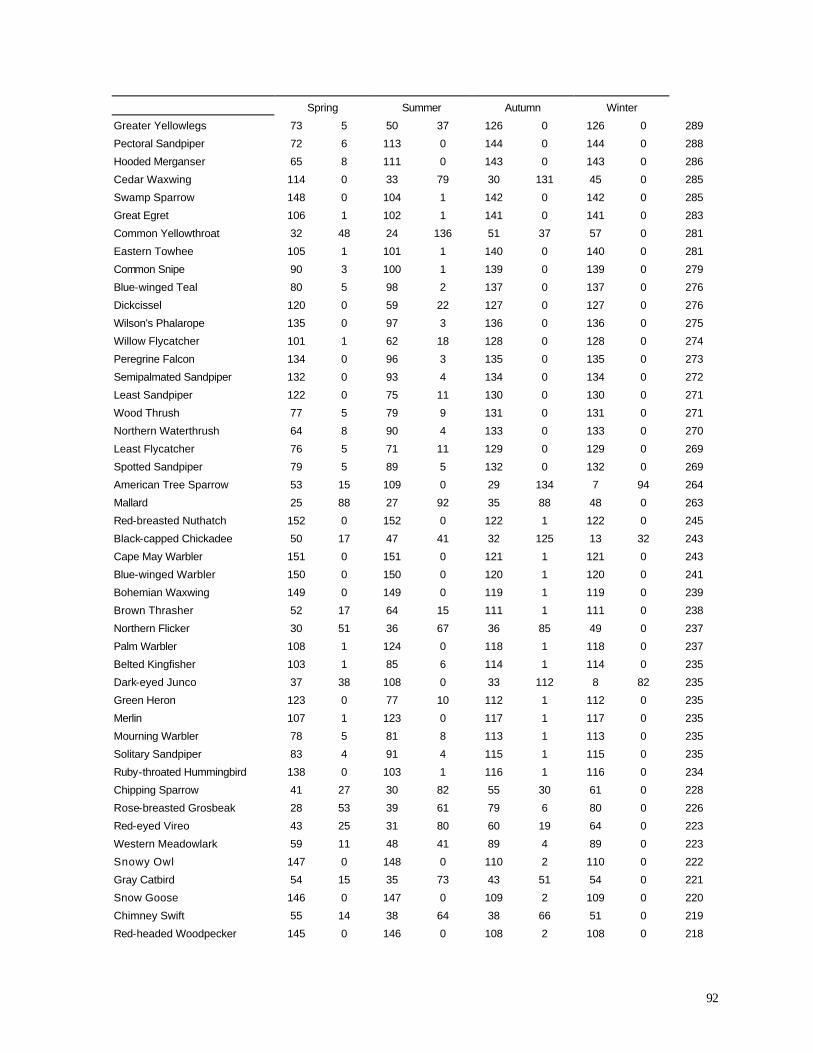
92
Spring Summer Autumn Winter Greater Yellowlegs 73 5 50 37 126 0 126 0 289
Pectoral Sandpiper 72 6 113 0 144 0 144 0 288
Hooded Merganser 65 8 111 0 143 0 143 0 286
Cedar Waxwing 114 0 33 79 30 131 45 0 285
Swamp Sparrow 148 0 104 1 142 0 142 0 285
Great Egret 106 1 102 1 141 0 141 0 283
Common Yellowthroat 32 48 24 136 51 37 57 0 281
Eastern Towhee 105 1 101 1 140 0 140 0 281
Common Snipe 90 3 100 1 139 0 139 0 279
Blue-winged Teal 80 5 98 2 137 0 137 0 276
Dickcissel 120 0 59 22 127 0 127 0 276
Wilson's Phalarope 135 0 97 3 136 0 136 0 275
Willow Flycatcher 101 1 62 18 128 0 128 0 274
Peregrine Falcon 134 0 96 3 135 0 135 0 273
Semipalmated Sandpiper 132 0 93 4 134 0 134 0 272
Least Sandpiper 122 0 75 11 130 0 130 0 271
Wood Thrush 77 5 79 9 131 0 131 0 271
Northern Waterthrush 64 8 90 4 133 0 133 0 270
Least Flycatcher 76 5 71 11 129 0 129 0 269
Spotted Sandpiper 79 5 89 5 132 0 132 0 269
American Tree Sparrow 53 15 109 0 29 134 7 94 264
Mallard 25 88 27 92 35 88 48 0 263
Red-breasted Nuthatch 152 0 152 0 122 1 122 0 245
Black-capped Chickadee 50 17 47 41 32 125 13 32 243
Cape May Warbler 151 0 151 0 121 1 121 0 243
Blue-winged Warbler 150 0 150 0 120 1 120 0 241
Bohemian Waxwing 149 0 149 0 119 1 119 0 239
Brown Thrasher 52 17 64 15 111 1 111 0 238
Northern Flicker 30 51 36 67 36 85 49 0 237
Palm Warbler 108 1 124 0 118 1 118 0 237
Belted Kingfisher 103 1 85 6 114 1 114 0 235
Dark-eyed Junco 37 38 108 0 33 112 8 82 235
Green Heron 123 0 77 10 112 1 112 0 235
Merlin 107 1 123 0 117 1 117 0 235
Mourning Warbler 78 5 81 8 113 1 113 0 235
Solitary Sandpiper 83 4 91 4 115 1 115 0 235
Ruby-throated Hummingbird 138 0 103 1 116 1 116 0 234
Chipping Sparrow 41 27 30 82 55 30 61 0 228
Rose-breasted Grosbeak 28 53 39 61 79 6 80 0 226
Red-eyed Vireo 43 25 31 80 60 19 64 0 223
Western Meadowlark 59 11 48 41 89 4 89 0 223
Snowy Owl 147 0 148 0 110 2 110 0 222
Gray Catbird 54 15 35 73 43 51 54 0 221
Snow Goose 146 0 147 0 109 2 109 0 220
Chimney Swift 55 14 38 64 38 66 51 0 219
Red-headed Woodpecker 145 0 146 0 108 2 108 0 218
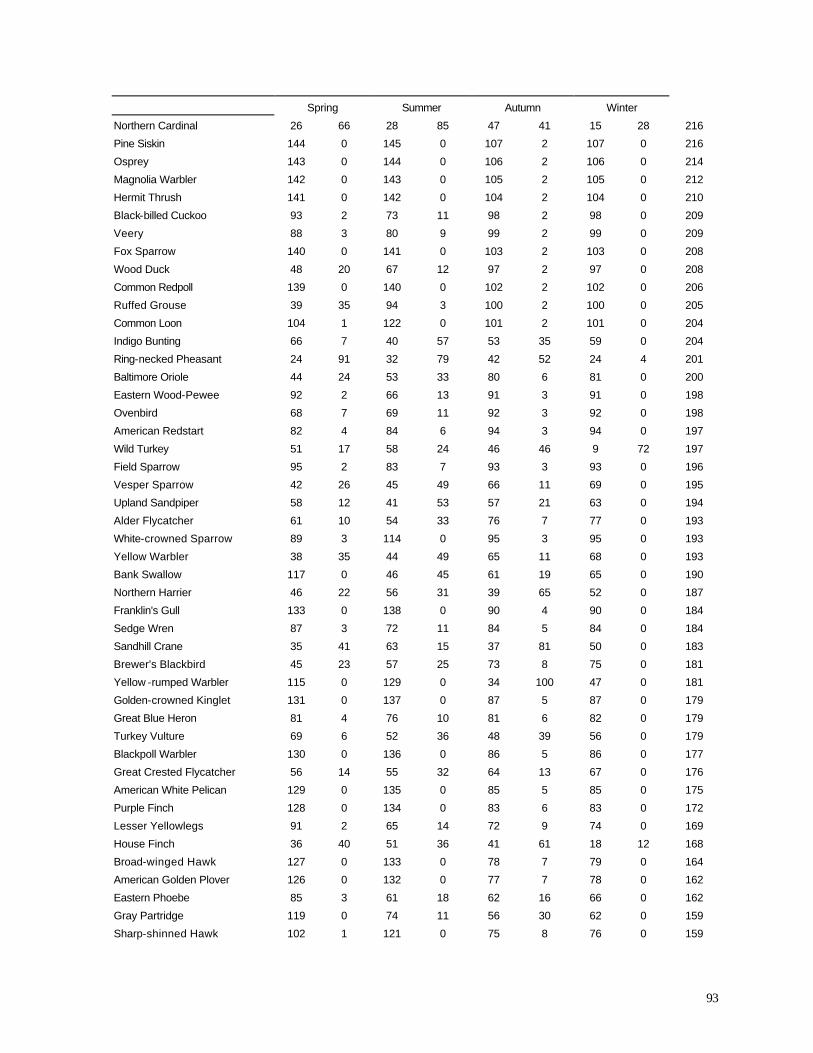
93
Spring Summer Autumn Winter Northern Cardinal 26 66 28 85 47 41 15 28 216
Pine Siskin 144 0 145 0 107 2 107 0 216
Osprey 143 0 144 0 106 2 106 0 214
Magnolia Warbler 142 0 143 0 105 2 105 0 212
Hermit Thrush 141 0 142 0 104 2 104 0 210
Black-billed Cuckoo 93 2 73 11 98 2 98 0 209
Veery 88 3 80 9 99 2 99 0 209
Fox Sparrow 140 0 141 0 103 2 103 0 208
Wood Duck 48 20 67 12 97 2 97 0 208
Common Redpoll 139 0 140 0 102 2 102 0 206
Ruffed Grouse 39 35 94 3 100 2 100 0 205
Common Loon 104 1 122 0 101 2 101 0 204
Indigo Bunting 66 7 40 57 53 35 59 0 204
Ring-necked Pheasant 24 91 32 79 42 52 24 4 201
Baltimore Oriole 44 24 53 33 80 6 81 0 200
Eastern Wood-Pewee 92 2 66 13 91 3 91 0 198
Ovenbird 68 7 69 11 92 3 92 0 198
American Redstart 82 4 84 6 94 3 94 0 197
Wild Turkey 51 17 58 24 46 46 9 72 197
Field Sparrow 95 2 83 7 93 3 93 0 196
Vesper Sparrow 42 26 45 49 66 11 69 0 195
Upland Sandpiper 58 12 41 53 57 21 63 0 194
Alder Flycatcher 61 10 54 33 76 7 77 0 193
White-crowned Sparrow 89 3 114 0 95 3 95 0 193
Yellow Warbler 38 35 44 49 65 11 68 0 193
Bank Swallow 117 0 46 45 61 19 65 0 190
Northern Harrier 46 22 56 31 39 65 52 0 187
Franklin's Gull 133 0 138 0 90 4 90 0 184
Sedge Wren 87 3 72 11 84 5 84 0 184
Sandhill Crane 35 41 63 15 37 81 50 0 183
Brewer's Blackbird 45 23 57 25 73 8 75 0 181
Yellow -rumped Warbler 115 0 129 0 34 100 47 0 181
Golden-crowned Kinglet 131 0 137 0 87 5 87 0 179
Great Blue Heron 81 4 76 10 81 6 82 0 179
Turkey Vulture 69 6 52 36 48 39 56 0 179
Blackpoll Warbler 130 0 136 0 86 5 86 0 177
Great Crested Flycatcher 56 14 55 32 64 13 67 0 176
American White Pelican 129 0 135 0 85 5 85 0 175
Purple Finch 128 0 134 0 83 6 83 0 172
Lesser Yellowlegs 91 2 65 14 72 9 74 0 169
House Finch 36 40 51 36 41 61 18 12 168
Broad-winged Hawk 127 0 133 0 78 7 79 0 164
American Golden Plover 126 0 132 0 77 7 78 0 162
Eastern Phoebe 85 3 61 18 62 16 66 0 162
Gray Partridge 119 0 74 11 56 30 62 0 159
Sharp-shinned Hawk 102 1 121 0 75 8 76 0 159
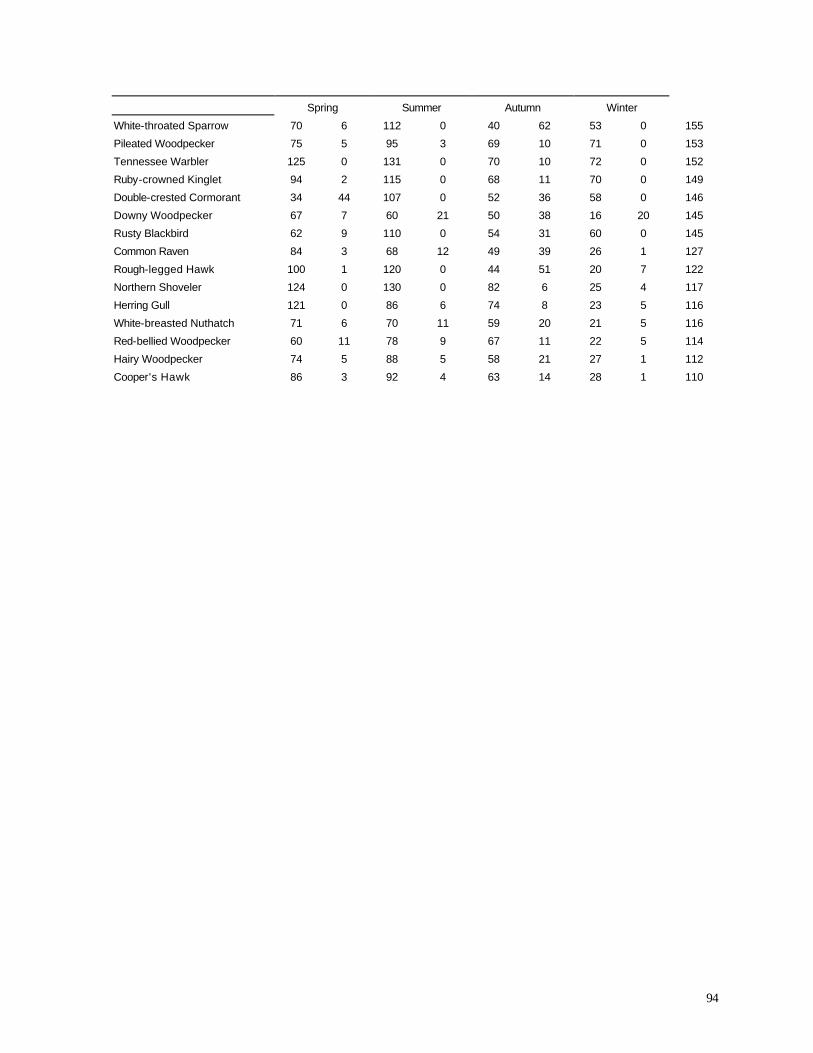
94
Spring Summer Autumn Winter White-throated Sparrow 70 6 112 0 40 62 53 0 155
Pileated Woodpecker 75 5 95 3 69 10 71 0 153
Tennessee Warbler 125 0 131 0 70 10 72 0 152
Ruby-crowned Kinglet 94 2 115 0 68 11 70 0 149
Double-crested Cormorant 34 44 107 0 52 36 58 0 146
Downy Woodpecker 67 7 60 21 50 38 16 20 145
Rusty Blackbird 62 9 110 0 54 31 60 0 145
Common Raven 84 3 68 12 49 39 26 1 127
Rough-legged Hawk 100 1 120 0 44 51 20 7 122
Northern Shoveler 124 0 130 0 82 6 25 4 117
Herring Gull 121 0 86 6 74 8 23 5 116
White-breasted Nuthatch 71 6 70 11 59 20 21 5 116
Red-bellied Woodpecker 60 11 78 9 67 11 22 5 114
Hairy Woodpecker 74 5 88 5 58 21 27 1 112
Cooper's Hawk 86 3 92 4 63 14 28 1 110
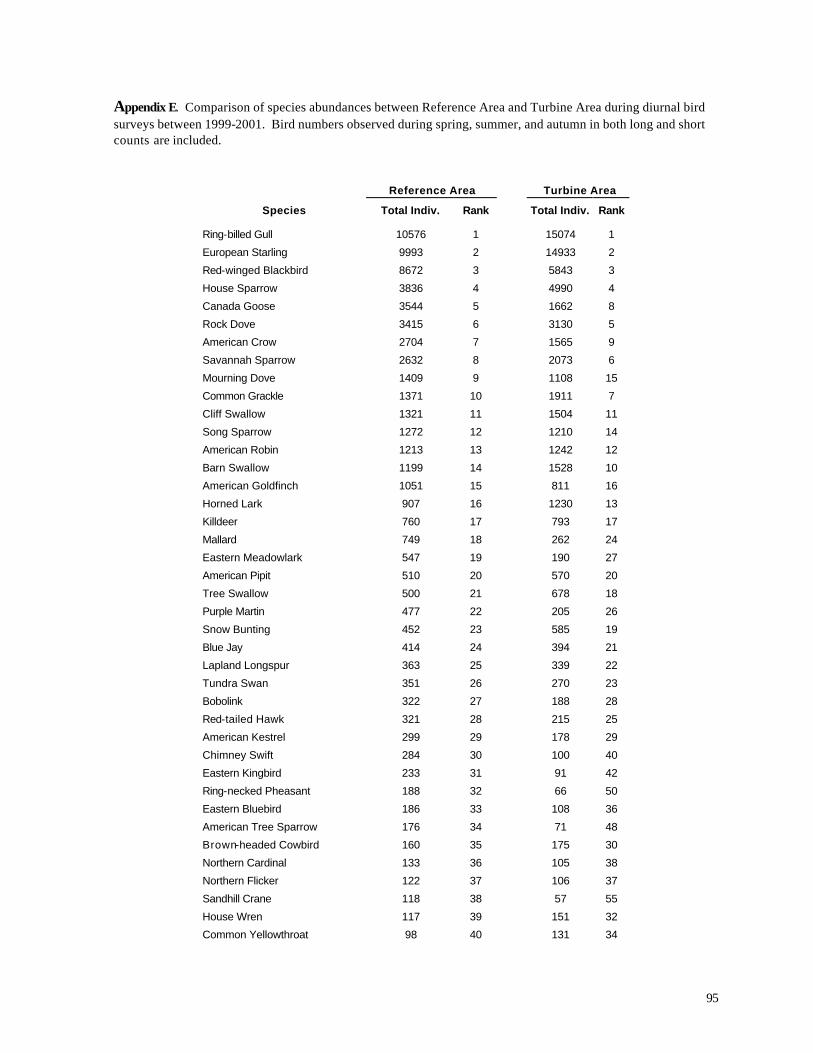
95
Appendix E. Comparison of species abundances between Reference Area and Turbine Area during diurnal bird surveys between 1999-2001. Bird numbers observed during spring, summer, and autumn in both long and short counts are included.
Reference Area Turbine Area
Species Total Indiv. Rank Total Indiv. Rank
Ring-billed Gull 10576 1 15074 1
European Starling 9993 2 14933 2
Red-winged Blackbird 8672 3 5843 3
House Sparrow 3836 4 4990 4
Canada Goose 3544 5 1662 8
Rock Dove 3415 6 3130 5
American Crow 2704 7 1565 9
Savannah Sparrow 2632 8 2073 6
Mourning Dove 1409 9 1108 15
Common Grackle 1371 10 1911 7
Cliff Swallow 1321 11 1504 11
Song Sparrow 1272 12 1210 14
American Robin 1213 13 1242 12
Barn Swallow 1199 14 1528 10
American Goldfinch 1051 15 811 16
Horned Lark 907 16 1230 13
Killdeer 760 17 793 17
Mallard 749 18 262 24
Eastern Meadowlark 547 19 190 27
American Pipit 510 20 570 20
Tree Swallow 500 21 678 18
Purple Martin 477 22 205 26
Snow Bunting 452 23 585 19
Blue Jay 414 24 394 21
Lapland Longspur 363 25 339 22
Tundra Swan 351 26 270 23
Bobolink 322 27 188 28
Red-tailed Hawk 321 28 215 25
American Kestrel 299 29 178 29
Chimney Swift 284 30 100 40
Eastern Kingbird 233 31 91 42
Ring-necked Pheasant 188 32 66 50
Eastern Bluebird 186 33 108 36
American Tree Sparrow 176 34 71 48
Brown-headed Cowbird 160 35 175 30
Northern Cardinal 133 36 105 38
Northern Flicker 122 37 106 37
Sandhill Crane 118 38 57 55
House Wren 117 39 151 32
Common Yellowthroat 98 40 131 34
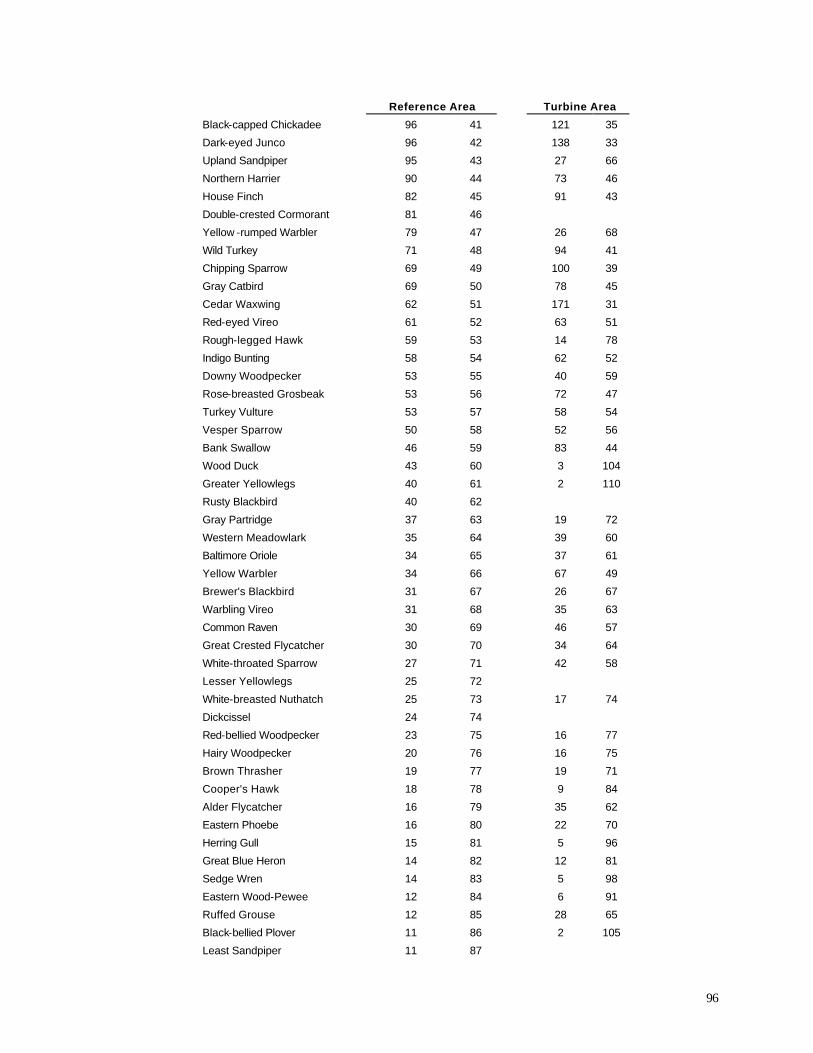
96
Reference Area Turbine Area
Black-capped Chickadee 96 41 121 35
Dark-eyed Junco 96 42 138 33
Upland Sandpiper 95 43 27 66
Northern Harrier 90 44 73 46
House Finch 82 45 91 43
Double-crested Cormorant 81 46 Yellow -rumped Warbler 79 47 26 68
Wild Turkey 71 48 94 41
Chipping Sparrow 69 49 100 39
Gray Catbird 69 50 78 45
Cedar Waxwing 62 51 171 31
Red-eyed Vireo 61 52 63 51
Rough-legged Hawk 59 53 14 78
Indigo Bunting 58 54 62 52
Downy Woodpecker 53 55 40 59
Rose-breasted Grosbeak 53 56 72 47
Turkey Vulture 53 57 58 54
Vesper Sparrow 50 58 52 56
Bank Swallow 46 59 83 44
Wood Duck 43 60 3 104
Greater Yellowlegs 40 61 2 110
Rusty Blackbird 40 62 Gray Partridge 37 63 19 72
Western Meadowlark 35 64 39 60
Baltimore Oriole 34 65 37 61
Yellow Warbler 34 66 67 49
Brewer's Blackbird 31 67 26 67
Warbling Vireo 31 68 35 63
Common Raven 30 69 46 57
Great Crested Flycatcher 30 70 34 64
White-throated Sparrow 27 71 42 58
Lesser Yellowlegs 25 72 White-breasted Nuthatch 25 73 17 74
Dickcissel 24 74 Red-bellied Woodpecker 23 75 16 77
Hairy Woodpecker 20 76 16 75
Brown Thrasher 19 77 19 71
Cooper's Hawk 18 78 9 84
Alder Flycatcher 16 79 35 62
Eastern Phoebe 16 80 22 70
Herring Gull 15 81 5 96
Great Blue Heron 14 82 12 81
Sedge Wren 14 83 5 98
Eastern Wood-Pewee 12 84 6 91
Ruffed Grouse 12 85 28 65
Black-bellied Plover 11 86 2 105
Least Sandpiper 11 87
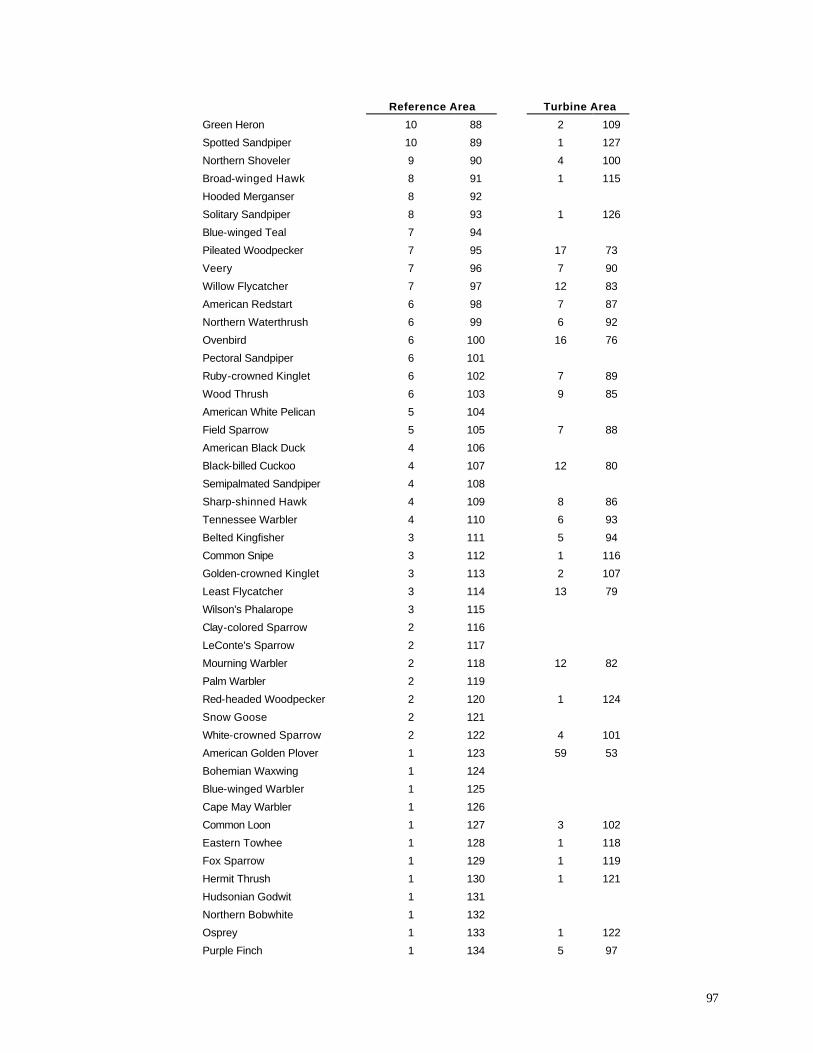
97
Reference Area Turbine Area
Green Heron 10 88 2 109
Spotted Sandpiper 10 89 1 127
Northern Shoveler 9 90 4 100
Broad-winged Hawk 8 91 1 115
Hooded Merganser 8 92 Solitary Sandpiper 8 93 1 126
Blue-winged Teal 7 94 Pileated Woodpecker 7 95 17 73
Veery 7 96 7 90
Willow Flycatcher 7 97 12 83
American Redstart 6 98 7 87
Northern Waterthrush 6 99 6 92
Ovenbird 6 100 16 76
Pectoral Sandpiper 6 101 Ruby-crowned Kinglet 6 102 7 89
Wood Thrush 6 103 9 85
American White Pelican 5 104 Field Sparrow 5 105 7 88
American Black Duck 4 106 Black-billed Cuckoo 4 107 12 80
Semipalmated Sandpiper 4 108 Sharp-shinned Hawk 4 109 8 86
Tennessee Warbler 4 110 6 93
Belted Kingfisher 3 111 5 94
Common Snipe 3 112 1 116
Golden-crowned Kinglet 3 113 2 107
Least Flycatcher 3 114 13 79
Wilson's Phalarope 3 115 Clay-colored Sparrow 2 116 LeConte's Sparrow 2 117 Mourning Warbler 2 118 12 82
Palm Warbler 2 119 Red-headed Woodpecker 2 120 1 124
Snow Goose 2 121 White-crowned Sparrow 2 122 4 101
American Golden Plover 1 123 59 53
Bohemian Waxwing 1 124 Blue-winged Warbler 1 125 Cape May Warbler 1 126 Common Loon 1 127 3 102
Eastern Towhee 1 128 1 118
Fox Sparrow 1 129 1 119
Hermit Thrush 1 130 1 121
Hudsonian Godwit 1 131 Northern Bobwhite 1 132 Osprey 1 133 1 122
Purple Finch 1 134 5 97
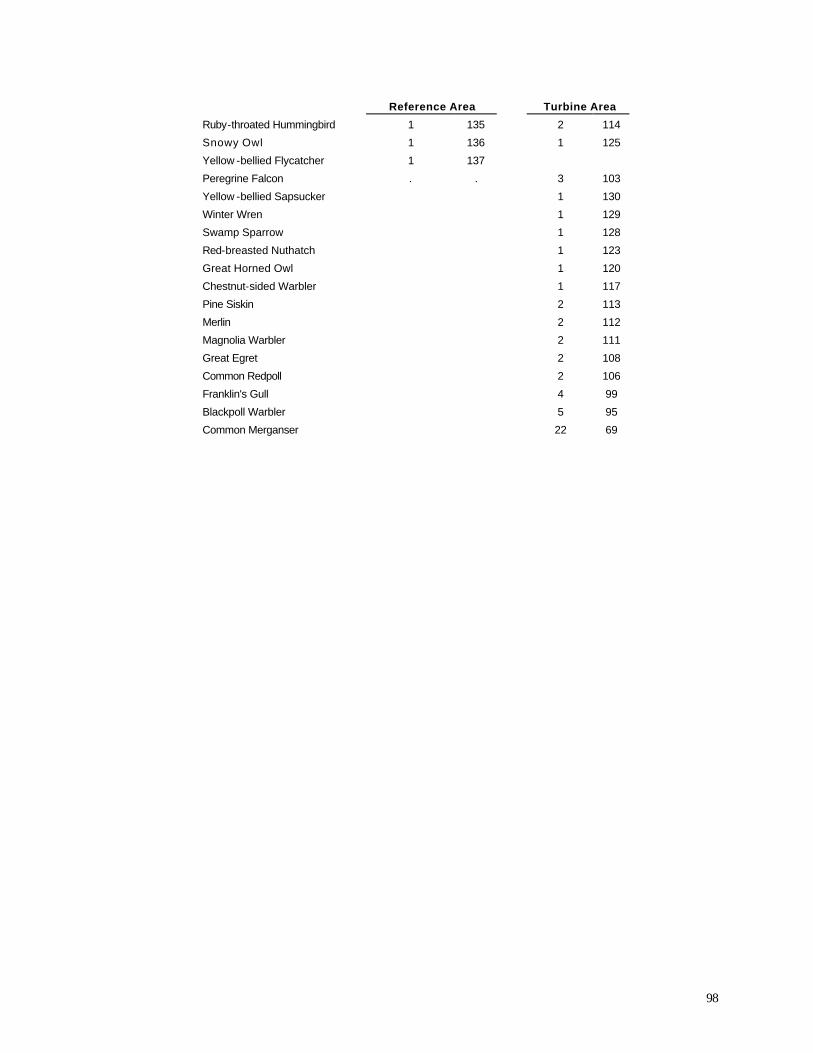
98
Reference Area Turbine Area
Ruby-throated Hummingbird 1 135 2 114
Snowy Owl 1 136 1 125
Yellow -bellied Flycatcher 1 137 Peregrine Falcon . . 3 103
Yellow -bellied Sapsucker 1 130
Winter Wren 1 129
Swamp Sparrow 1 128
Red-breasted Nuthatch 1 123
Great Horned Owl 1 120
Chestnut-sided Warbler 1 117
Pine Siskin 2 113
Merlin 2 112
Magnolia Warbler 2 111
Great Egret 2 108
Common Redpoll 2 106
Franklin's Gull 4 99
Blackpoll Warbler 5 95
Common Merganser 22 69
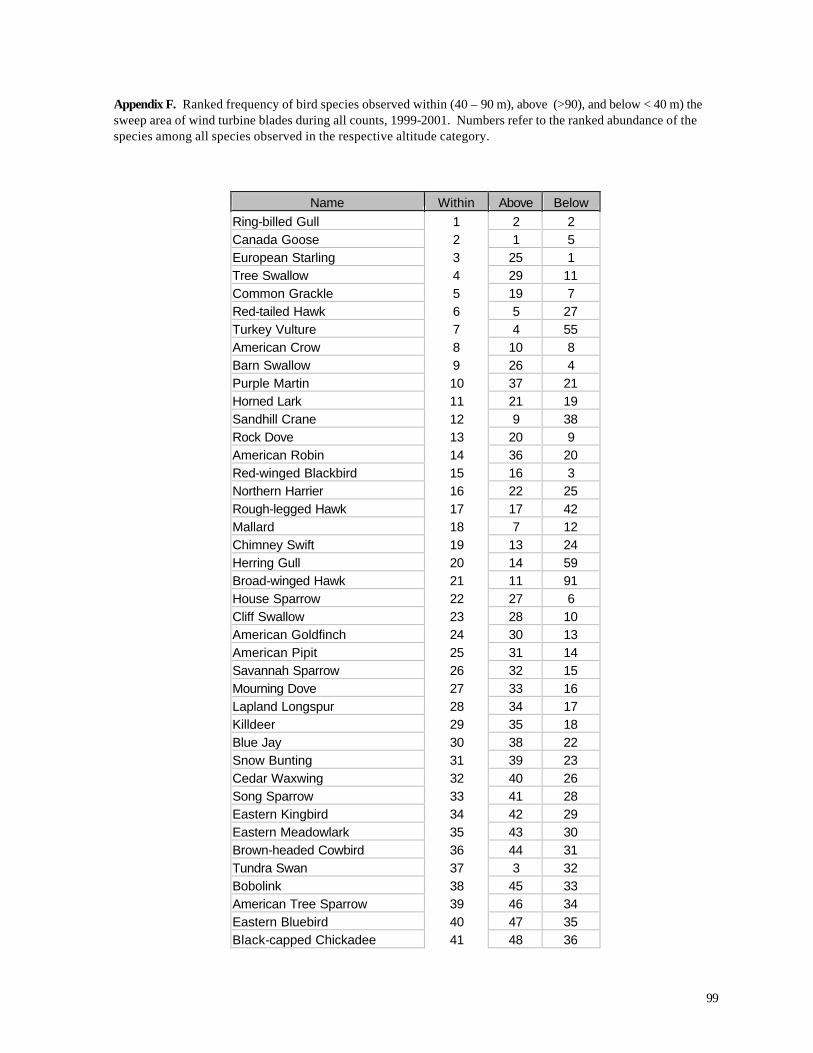
99
Appendix F. Ranked frequency of bird species observed within (40 – 90 m), above (>90), and below < 40 m) the sweep area of wind turbine blades during all counts, 1999-2001. Numbers refer to the ranked abundance of the species among all species observed in the respective altitude category.
Name Within Above Below Ring-billed Gull 1 2 2 Canada Goose 2 1 5 European Starling 3 25 1 Tree Swallow 4 29 11 Common Grackle 5 19 7 Red-tailed Hawk 6 5 27 Turkey Vulture 7 4 55 American Crow 8 10 8 Barn Swallow 9 26 4 Purple Martin 10 37 21 Horned Lark 11 21 19 Sandhill Crane 12 9 38 Rock Dove 13 20 9 American Robin 14 36 20 Red-winged Blackbird 15 16 3 Northern Harrier 16 22 25 Rough-legged Hawk 17 17 42 Mallard 18 7 12 Chimney Swift 19 13 24 Herring Gull 20 14 59 Broad-winged Hawk 21 11 91 House Sparrow 22 27 6 Cliff Swallow 23 28 10 American Goldfinch 24 30 13 American Pipit 25 31 14 Savannah Sparrow 26 32 15 Mourning Dove 27 33 16 Lapland Longspur 28 34 17 Killdeer 29 35 18 Blue Jay 30 38 22 Snow Bunting 31 39 23 Cedar Waxwing 32 40 26 Song Sparrow 33 41 28 Eastern Kingbird 34 42 29 Eastern Meadowlark 35 43 30 Brown-headed Cowbird 36 44 31 Tundra Swan 37 3 32 Bobolink 38 45 33 American Tree Sparrow 39 46 34 Eastern Bluebird 40 47 35 Black-capped Chickadee 41 48 36
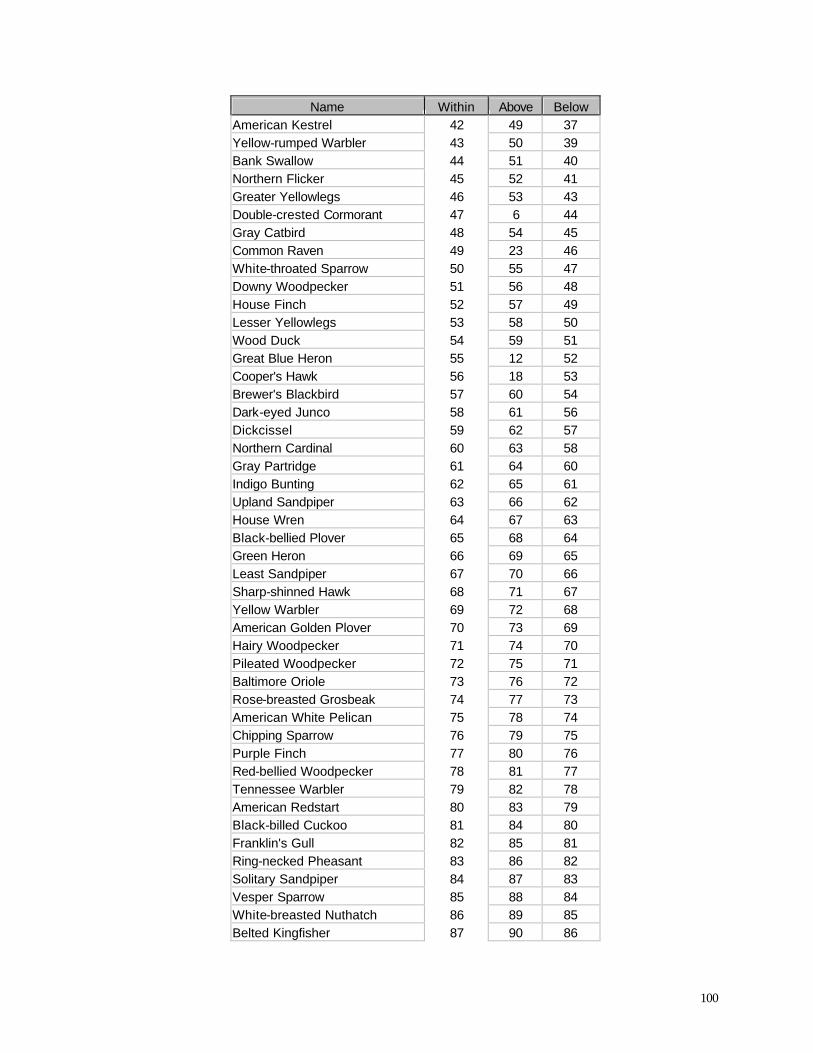
100
Name Within Above Below American Kestrel 42 49 37 Yellow-rumped Warbler 43 50 39 Bank Swallow 44 51 40 Northern Flicker 45 52 41 Greater Yellowlegs 46 53 43 Double-crested Cormorant 47 6 44 Gray Catbird 48 54 45 Common Raven 49 23 46 White-throated Sparrow 50 55 47 Downy Woodpecker 51 56 48 House Finch 52 57 49 Lesser Yellowlegs 53 58 50 Wood Duck 54 59 51 Great Blue Heron 55 12 52 Cooper's Hawk 56 18 53 Brewer's Blackbird 57 60 54 Dark-eyed Junco 58 61 56 Dickcissel 59 62 57 Northern Cardinal 60 63 58 Gray Partridge 61 64 60 Indigo Bunting 62 65 61 Upland Sandpiper 63 66 62 House Wren 64 67 63 Black-bellied Plover 65 68 64 Green Heron 66 69 65 Least Sandpiper 67 70 66 Sharp-shinned Hawk 68 71 67 Yellow Warbler 69 72 68 American Golden Plover 70 73 69 Hairy Woodpecker 71 74 70 Pileated Woodpecker 72 75 71 Baltimore Oriole 73 76 72 Rose-breasted Grosbeak 74 77 73 American White Pelican 75 78 74 Chipping Sparrow 76 79 75 Purple Finch 77 80 76 Red-bellied Woodpecker 78 81 77 Tennessee Warbler 79 82 78 American Redstart 80 83 79 Black-billed Cuckoo 81 84 80 Franklin's Gull 82 85 81 Ring-necked Pheasant 83 86 82 Solitary Sandpiper 84 87 83 Vesper Sparrow 85 88 84 White-breasted Nuthatch 86 89 85 Belted Kingfisher 87 90 86
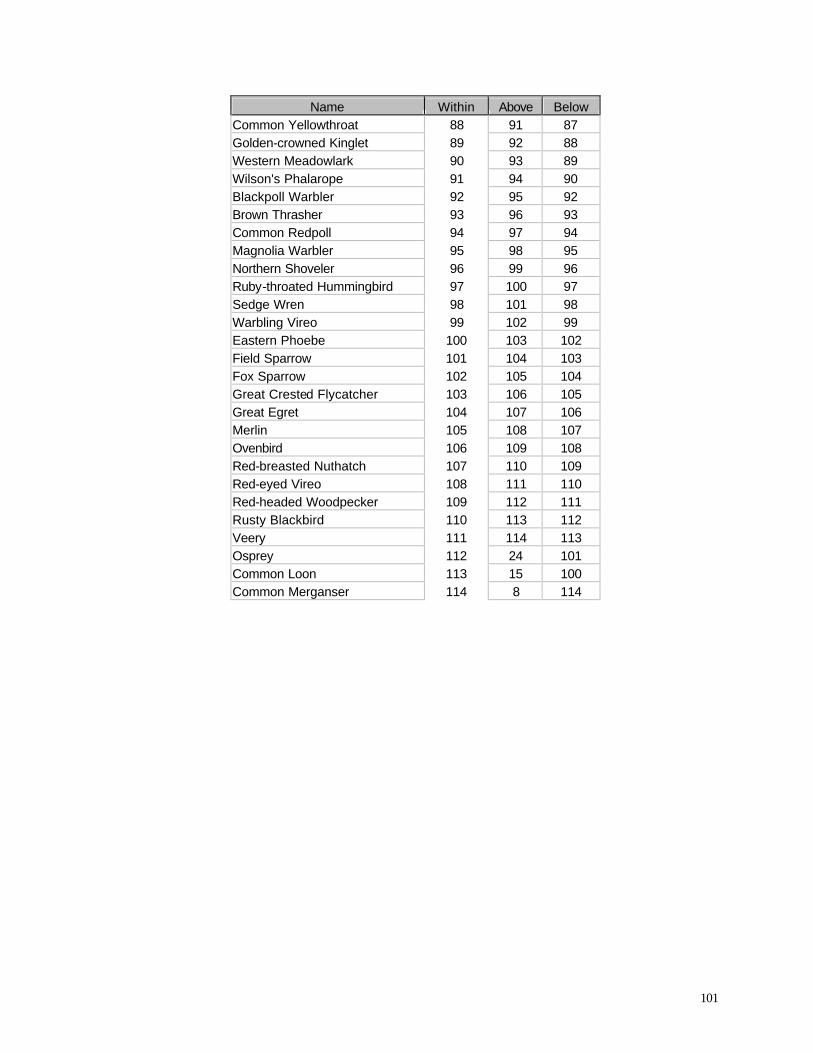
101
Name Within Above Below Common Yellowthroat 88 91 87 Golden-crowned Kinglet 89 92 88 Western Meadowlark 90 93 89 Wilson's Phalarope 91 94 90 Blackpoll Warbler 92 95 92 Brown Thrasher 93 96 93 Common Redpoll 94 97 94 Magnolia Warbler 95 98 95 Northern Shoveler 96 99 96 Ruby-throated Hummingbird 97 100 97 Sedge Wren 98 101 98 Warbling Vireo 99 102 99 Eastern Phoebe 100 103 102 Field Sparrow 101 104 103 Fox Sparrow 102 105 104 Great Crested Flycatcher 103 106 105 Great Egret 104 107 106 Merlin 105 108 107 Ovenbird 106 109 108 Red-breasted Nuthatch 107 110 109 Red-eyed Vireo 108 111 110 Red-headed Woodpecker 109 112 111 Rusty Blackbird 110 113 112 Veery 111 114 113 Osprey 112 24 101 Common Loon 113 15 100 Common Merganser 114 8 114
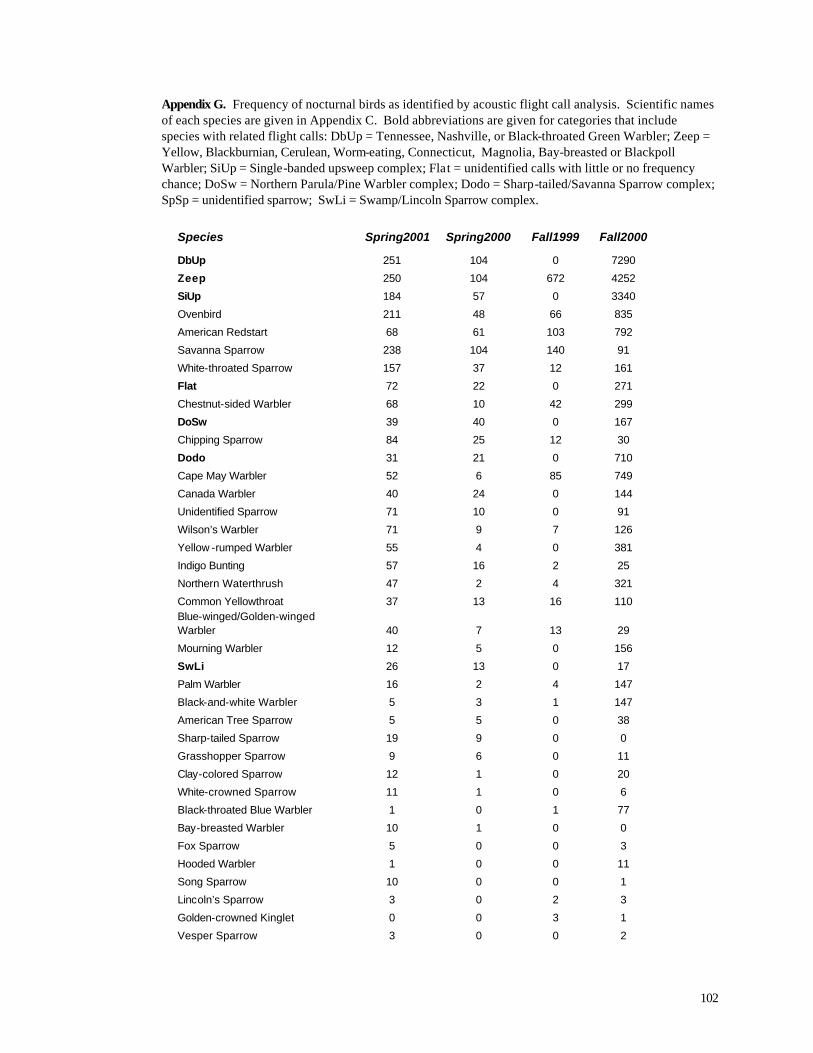
102
Appendix G. Frequency of nocturnal birds as identified by acoustic flight call analysis. Scientific names of each species are given in Appendix C. Bold abbreviations are given for categories that include species with related flight calls: DbUp = Tennessee, Nashville, or Black-throated Green Warbler; Zeep = Yellow, Blackburnian, Cerulean, Worm-eating, Connecticut, Magnolia, Bay-breasted or Blackpoll Warbler; SiUp = Single-banded upsweep complex; Flat = unidentified calls with little or no frequency chance; DoSw = Northern Parula/Pine Warbler complex; Dodo = Sharp-tailed/Savanna Sparrow complex; SpSp = unidentified sparrow; SwLi = Swamp/Lincoln Sparrow complex.
Species Spring2001 Spring2000 Fall1999 Fall2000
DbUp 251 104 0 7290
Zeep 250 104 672 4252
SiUp 184 57 0 3340
Ovenbird 211 48 66 835
American Redstart 68 61 103 792
Savanna Sparrow 238 104 140 91
White-throated Sparrow 157 37 12 161
Flat 72 22 0 271
Chestnut-sided Warbler 68 10 42 299
DoSw 39 40 0 167
Chipping Sparrow 84 25 12 30
Dodo 31 21 0 710
Cape May Warbler 52 6 85 749
Canada Warbler 40 24 0 144
Unidentified Sparrow 71 10 0 91
Wilson’s Warbler 71 9 7 126
Yellow -rumped Warbler 55 4 0 381
Indigo Bunting 57 16 2 25
Northern Waterthrush 47 2 4 321
Common Yellowthroat 37 13 16 110 Blue-winged/Golden-winged Warbler 40 7 13 29
Mourning Warbler 12 5 0 156
SwLi 26 13 0 17
Palm Warbler 16 2 4 147
Black-and-white Warbler 5 3 1 147
American Tree Sparrow 5 5 0 38
Sharp-tailed Sparrow 19 9 0 0
Grasshopper Sparrow 9 6 0 11
Clay-colored Sparrow 12 1 0 20
White-crowned Sparrow 11 1 0 6
Black-throated Blue Warbler 1 0 1 77
Bay-breasted Warbler 10 1 0 0
Fox Sparrow 5 0 0 3
Hooded Warbler 1 0 0 11
Song Sparrow 10 0 0 1
Lincoln’s Sparrow 3 0 2 3
Golden-crowned Kinglet 0 0 3 1
Vesper Sparrow 3 0 0 2
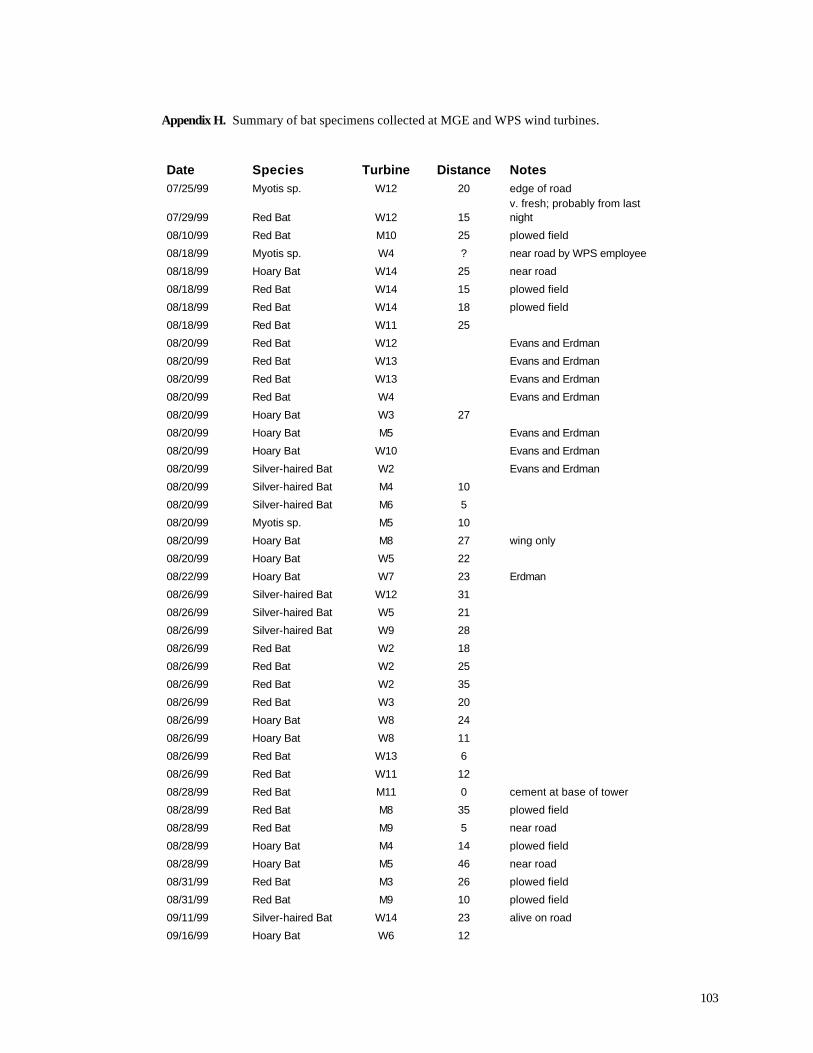
103
Appendix H. Summary of bat specimens collected at MGE and WPS wind turbines.
Date Species Turbine Distance Notes 07/25/99 Myotis sp. W12 20 edge of road
07/29/99 Red Bat W12 15 v. fresh; probably from last night
08/10/99 Red Bat M10 25 plowed field
08/18/99 Myotis sp. W4 ? near road by WPS employee
08/18/99 Hoary Bat W14 25 near road
08/18/99 Red Bat W14 15 plowed field
08/18/99 Red Bat W14 18 plowed field
08/18/99 Red Bat W11 25
08/20/99 Red Bat W12 Evans and Erdman
08/20/99 Red Bat W13 Evans and Erdman
08/20/99 Red Bat W13 Evans and Erdman
08/20/99 Red Bat W4 Evans and Erdman
08/20/99 Hoary Bat W3 27
08/20/99 Hoary Bat M5 Evans and Erdman
08/20/99 Hoary Bat W10 Evans and Erdman
08/20/99 Silver-haired Bat W2 Evans and Erdman
08/20/99 Silver-haired Bat M4 10
08/20/99 Silver-haired Bat M6 5
08/20/99 Myotis sp. M5 10
08/20/99 Hoary Bat M8 27 wing only
08/20/99 Hoary Bat W5 22
08/22/99 Hoary Bat W7 23 Erdman
08/26/99 Silver-haired Bat W12 31
08/26/99 Silver-haired Bat W5 21
08/26/99 Silver-haired Bat W9 28
08/26/99 Red Bat W2 18
08/26/99 Red Bat W2 25
08/26/99 Red Bat W2 35
08/26/99 Red Bat W3 20
08/26/99 Hoary Bat W8 24
08/26/99 Hoary Bat W8 11
08/26/99 Red Bat W13 6
08/26/99 Red Bat W11 12
08/28/99 Red Bat M11 0 cement at base of tower
08/28/99 Red Bat M8 35 plowed field
08/28/99 Red Bat M9 5 near road
08/28/99 Hoary Bat M4 14 plowed field
08/28/99 Hoary Bat M5 46 near road
08/31/99 Red Bat M3 26 plowed field
08/31/99 Red Bat M9 10 plowed field
09/11/99 Silver-haired Bat W14 23 alive on road
09/16/99 Hoary Bat W6 12
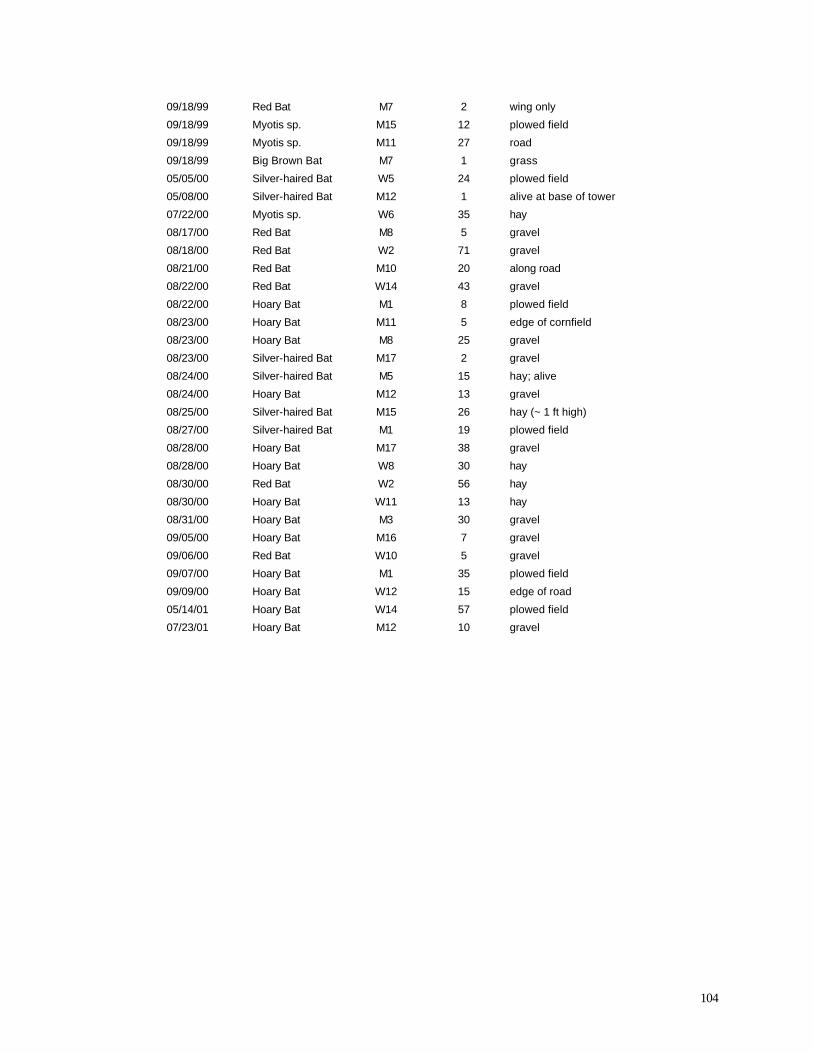
104
09/18/99 Red Bat M7 2 wing only
09/18/99 Myotis sp. M15 12 plowed field
09/18/99 Myotis sp. M11 27 road
09/18/99 Big Brown Bat M7 1 grass
05/05/00 Silver-haired Bat W5 24 plowed field
05/08/00 Silver-haired Bat M12 1 alive at base of tower
07/22/00 Myotis sp. W6 35 hay
08/17/00 Red Bat M8 5 gravel
08/18/00 Red Bat W2 71 gravel
08/21/00 Red Bat M10 20 along road
08/22/00 Red Bat W14 43 gravel
08/22/00 Hoary Bat M1 8 plowed field
08/23/00 Hoary Bat M11 5 edge of cornfield
08/23/00 Hoary Bat M8 25 gravel
08/23/00 Silver-haired Bat M17 2 gravel
08/24/00 Silver-haired Bat M5 15 hay; alive
08/24/00 Hoary Bat M12 13 gravel
08/25/00 Silver-haired Bat M15 26 hay (~ 1 ft high)
08/27/00 Silver-haired Bat M1 19 plowed field
08/28/00 Hoary Bat M17 38 gravel
08/28/00 Hoary Bat W8 30 hay
08/30/00 Red Bat W2 56 hay
08/30/00 Hoary Bat W11 13 hay
08/31/00 Hoary Bat M3 30 gravel
09/05/00 Hoary Bat M16 7 gravel
09/06/00 Red Bat W10 5 gravel
09/07/00 Hoary Bat M1 35 plowed field
09/09/00 Hoary Bat W12 15 edge of road
05/14/01 Hoary Bat W14 57 plowed field
07/23/01 Hoary Bat M12 10 gravel