Embed Size (px)
Citation preview

NorthCoast International:A CAN SLIM® strategy
Investor Presentation
2 0 3 . 5 3 2 . 7 0 0 0I N F O @ N O R T H C O A S TA M . C O M
2
N O RT H C O A S T A S S E T M A N A G E M E N T
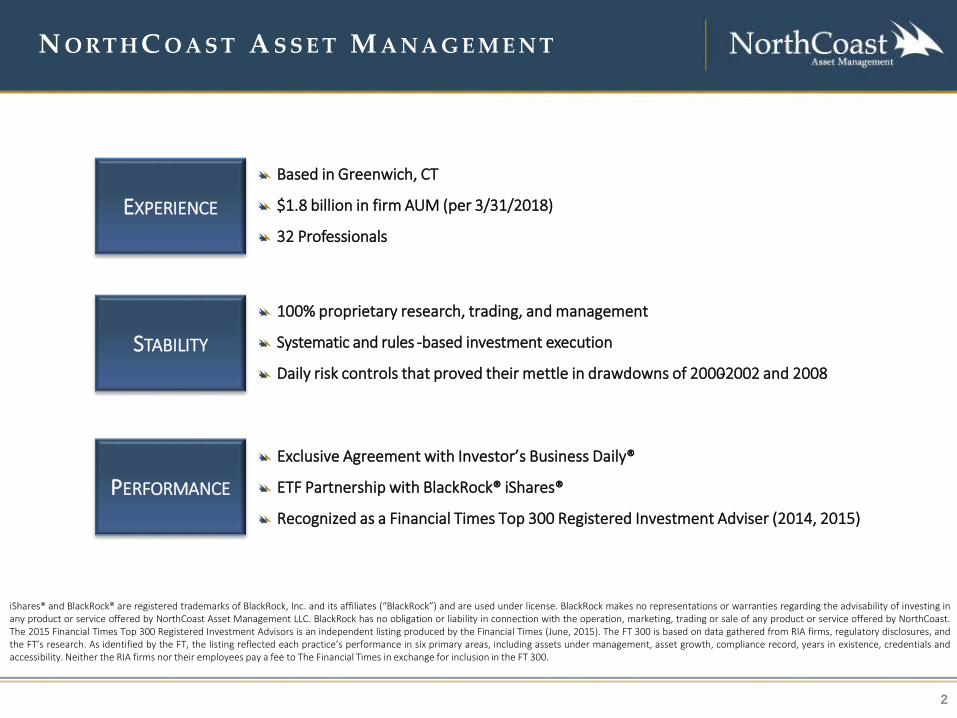
Based in Greenwich, CT
$1.8 billion in firm AUM (per 3/31/2018)
32 Professionals
100% proprietary research, trading, and management
Systematic and rules -based investment execution
Daily risk controls that proved their mettle in drawdowns of 2000-2002 and 2008
EXPERIENCE
STABILITY
PERFORMANCE
Exclusive Agreement with Investor’s Business Daily®
ETF Partnership with BlackRock® iShares®
Recognized as a Financial Times Top 300 Registered Investment Adviser (2014, 2015)
iShares® and BlackRock® are registered trademarks of BlackRock, Inc. and its affiliates (“BlackRock”) and are used under license. BlackRock makes no representations or warranties regarding the advisability of investing inany product or service offered by NorthCoast Asset Management LLC. BlackRock has no obligation or liability in connection with the operation, marketing, trading or sale of any product or service offered by NorthCoast.The 2015 Financial Times Top 300 Registered Investment Advisors is an independent listing produced by the Financial Times (June, 2015). The FT 300 is based on data gathered from RIA firms, regulatory disclosures, andthe FT’s research. As identified by the FT, the listing reflected each practice’s performance in six primary areas, including assets under management, asset growth, compliance record, years in existence, credentials andaccessibility. Neither the RIA firms nor their employees pay a fee to The Financial Times in exchange for inclusion in the FT 300.
I N V E S T M E N T P H I L O S O P H Y
3
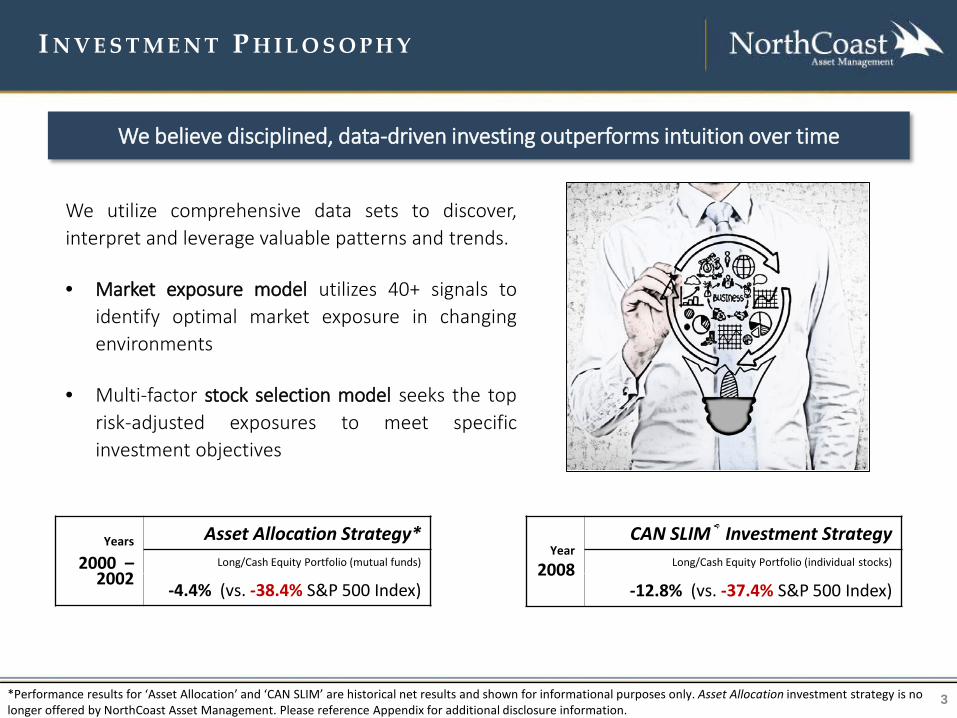
We utilize comprehensive data sets to discover,interpret and leverage valuable patterns and trends.
• Market exposure model utilizes 40+ signals toidentify optimal market exposure in changingenvironments
• Multi-factor stock selection model seeks the toprisk-adjusted exposures to meet specificinvestment objectives
We believe disciplined, data-driven investing outperforms intuition over time
Years
2000 –2002
Asset Allocation Strategy*Long/Cash Equity Portfolio (mutual funds)
-4.4% (vs. -38.4% S&P 500 Index)
Year2008
CAN SLIM® Investment StrategyLong/Cash Equity Portfolio (individual stocks)
-12.8% (vs. -37.4% S&P 500 Index)
*Performance results for ‘Asset Allocation’ and ‘CAN SLIM’ are historical net results and shown for informational purposes only. Asset Allocation investment strategy is no longer offered by NorthCoast Asset Management. Please reference Appendix for additional disclosure information.
I N V E S T M E N T T E A M
4
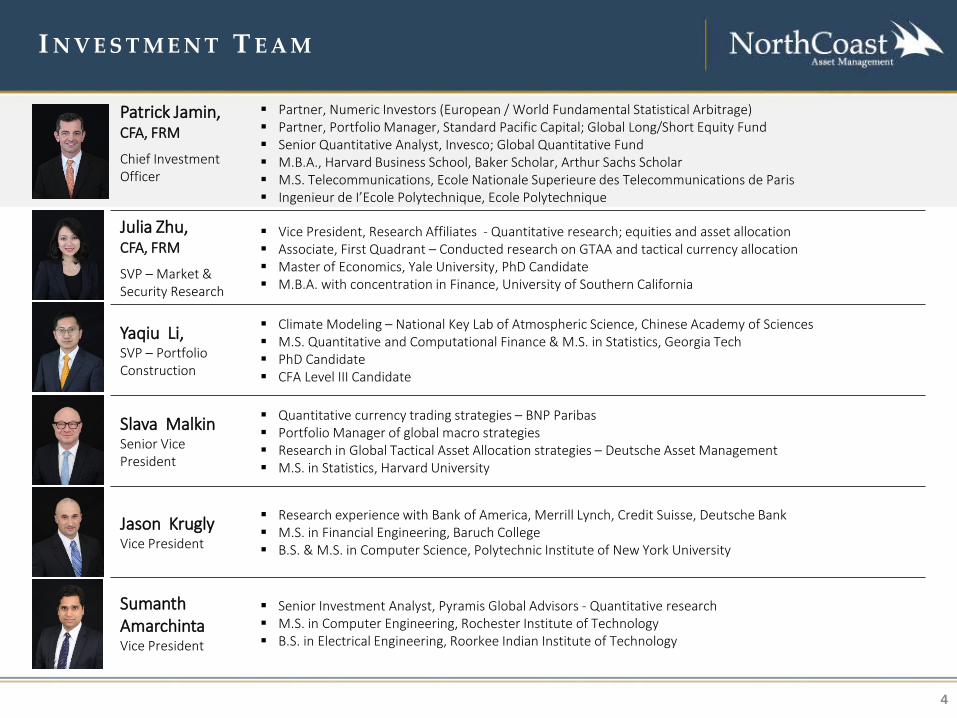
Patrick Jamin, CFA, FRM
Chief Investment Officer
Partner, Numeric Investors (European / World Fundamental Statistical Arbitrage) Partner, Portfolio Manager, Standard Pacific Capital; Global Long/Short Equity Fund Senior Quantitative Analyst, Invesco; Global Quantitative Fund M.B.A., Harvard Business School, Baker Scholar, Arthur Sachs Scholar M.S. Telecommunications, Ecole Nationale Superieure des Telecommunications de Paris Ingenieur de I’Ecole Polytechnique, Ecole Polytechnique
Julia Zhu,CFA, FRM
SVP – Market & Security Research
Vice President, Research Affiliates - Quantitative research; equities and asset allocation Associate, First Quadrant – Conducted research on GTAA and tactical currency allocation Master of Economics, Yale University, PhD Candidate M.B.A. with concentration in Finance, University of Southern California
Yaqiu Li, SVP – Portfolio Construction
Climate Modeling – National Key Lab of Atmospheric Science, Chinese Academy of Sciences M.S. Quantitative and Computational Finance & M.S. in Statistics, Georgia Tech PhD Candidate CFA Level III Candidate
Slava MalkinSenior VicePresident
Quantitative currency trading strategies – BNP Paribas Portfolio Manager of global macro strategies Research in Global Tactical Asset Allocation strategies – Deutsche Asset Management M.S. in Statistics, Harvard University
Jason Krugly Vice President
Research experience with Bank of America, Merrill Lynch, Credit Suisse, Deutsche Bank M.S. in Financial Engineering, Baruch College B.S. & M.S. in Computer Science, Polytechnic Institute of New York University
Sumanth Amarchinta Vice President
Senior Investment Analyst, Pyramis Global Advisors - Quantitative research M.S. in Computer Engineering, Rochester Institute of Technology B.S. in Electrical Engineering, Roorkee Indian Institute of Technology
5
S T R AT E G Y E X PA N S I O N
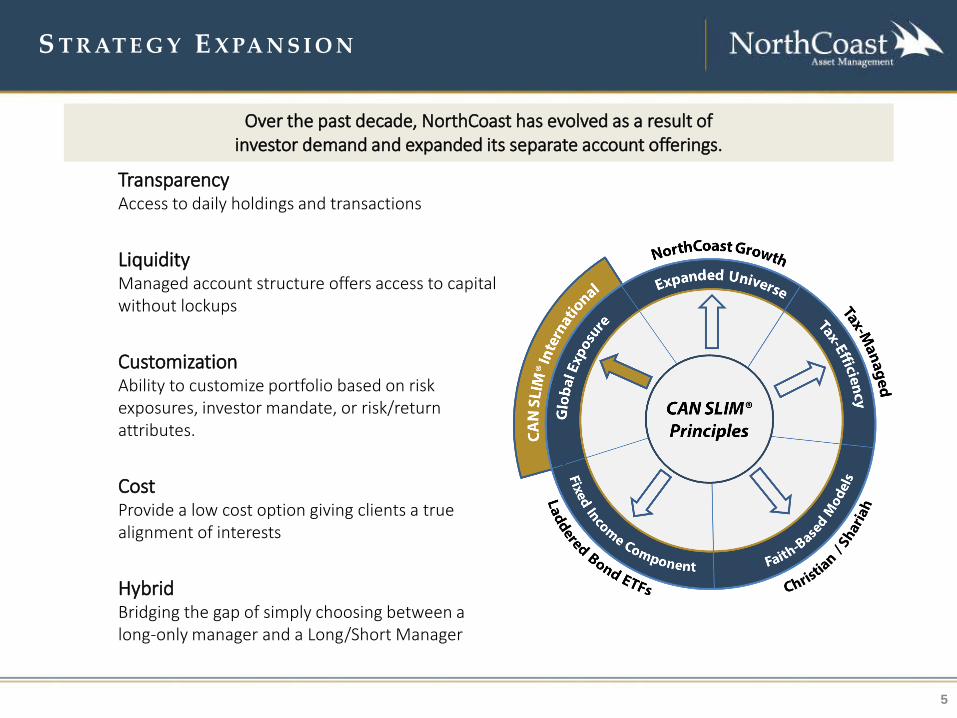
Over the past decade, NorthCoast has evolved as a result of investor demand and expanded its separate account offerings.
TransparencyAccess to daily holdings and transactions
LiquidityManaged account structure offers access to capital without lockups
CustomizationAbility to customize portfolio based on risk exposures, investor mandate, or risk/return attributes.
CostProvide a low cost option giving clients a true alignment of interests
HybridBridging the gap of simply choosing between a long-only manager and a Long/Short Manager
Market Outlook
Stock Selection
PortfolioConstruction
RiskManagement
6
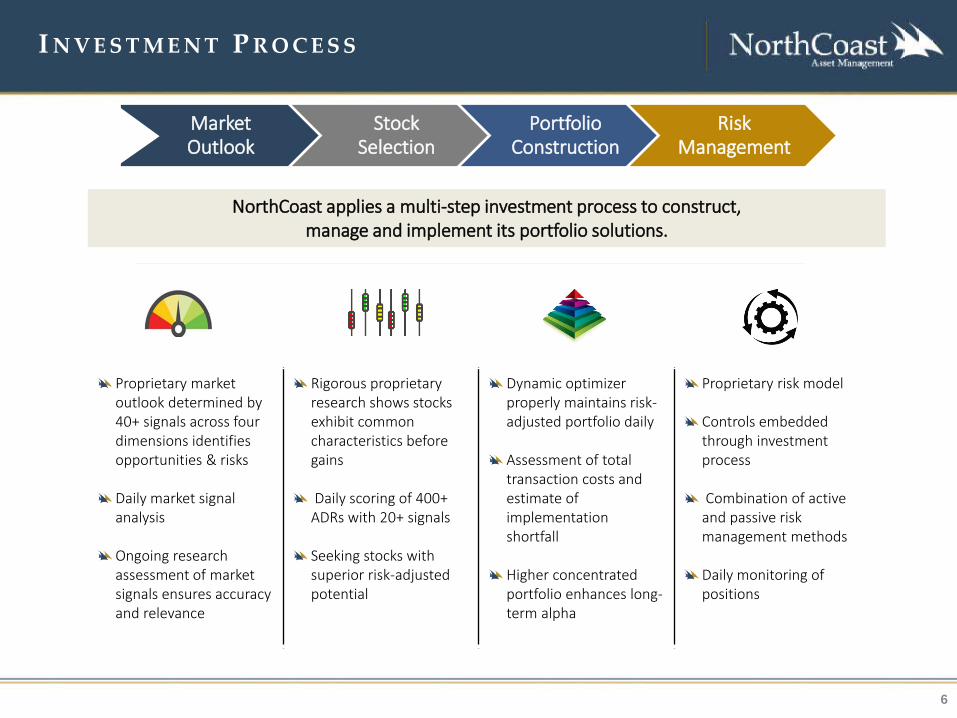
I N V E S T M E N T P R O C E S S
Proprietary market outlook determined by 40+ signals across four dimensions identifies opportunities & risks
Daily market signal analysis
Ongoing research assessment of market signals ensures accuracy and relevance
Rigorous proprietary research shows stocks exhibit common characteristics before gains
Daily scoring of 400+ ADRs with 20+ signals
Seeking stocks with superior risk-adjusted potential
Dynamic optimizer properly maintains risk-adjusted portfolio daily
Assessment of total transaction costs and estimate of implementation shortfall
Higher concentrated portfolio enhances long-term alpha
Proprietary risk model
Controls embedded through investment process
Combination of active and passive risk management methods
Daily monitoring of positions
NorthCoast applies a multi-step investment process to construct, manage and implement its portfolio solutions.
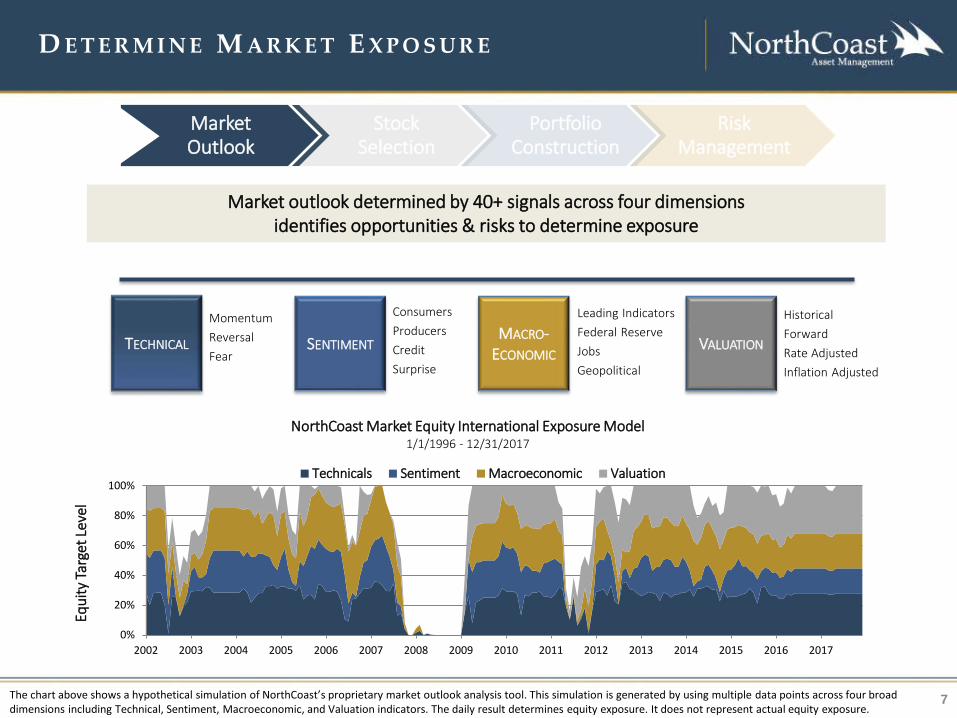
D E T E R M I N E M A R K E T E X P O S U R E
7The chart above shows a hypothetical simulation of NorthCoast’s proprietary market outlook analysis tool. This simulation is generated by using multiple data points across four broad dimensions including Technical, Sentiment, Macroeconomic, and Valuation indicators. The daily result determines equity exposure. It does not represent actual equity exposure.
Leading IndicatorsFederal ReserveJobsGeopolitical
ConsumersProducersCreditSurprise
MomentumReversalFear
HistoricalForwardRate AdjustedInflation Adjusted
MACRO-ECONOMIC
SENTIMENTTECHNICAL VALUATION
Market outlook determined by 40+ signals across four dimensions identifies opportunities & risks to determine exposure
Market Outlook
Stock Selection
PortfolioConstruction
RiskManagement
0%
20%
40%
60%
80%
100%
2002 2003 2004 2005 2006 2007 2008 2009 2010 2011 2012 2013 2014 2015 2016 2017
Equi
ty Ta
rget
Leve
l
NorthCoast Market Equity International Exposure Model1/1/1996 - 12/31/2017
Technicals Sentiment Macroeconomic Valuation
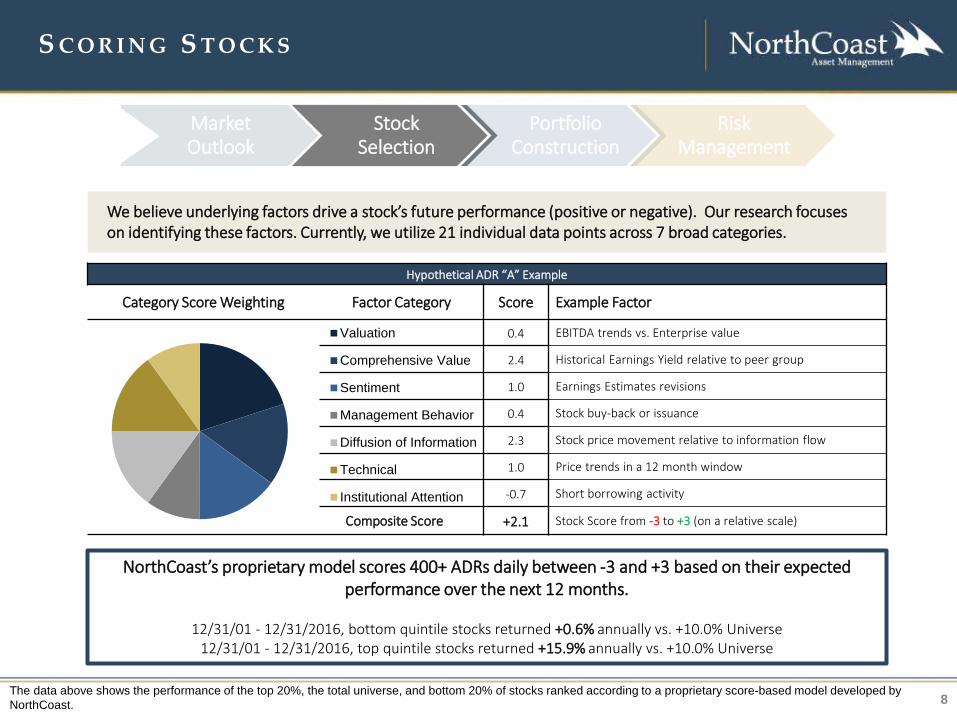
Hypothetical ADR “A” Example
Category Score Weighting Factor Category Score Example Factor
0.4 EBITDA trends vs. Enterprise value
2.4 Historical Earnings Yield relative to peer group
1.0 Earnings Estimates revisions
0.4 Stock buy-back or issuance
2.3 Stock price movement relative to information flow
1.0 Price trends in a 12 month window
-0.7 Short borrowing activity
Composite Score +2.1 Stock Score from -3 to +3 (on a relative scale)
Valuation
Comprehensive Value
Sentiment
Management Behavior
Diffusion of Information
Technical
Institutional Attention
S C O R I N G S T O C K S
8
NorthCoast’s proprietary model scores 400+ ADRs daily between -3 and +3 based on their expected performance over the next 12 months.
12/31/01 - 12/31/2016, bottom quintile stocks returned +0.6% annually vs. +10.0% Universe 12/31/01 - 12/31/2016, top quintile stocks returned +15.9% annually vs. +10.0% Universe
The data above shows the performance of the top 20%, the total universe, and bottom 20% of stocks ranked according to a proprietary score-based model developed by NorthCoast.
We believe underlying factors drive a stock’s future performance (positive or negative). Our research focuses on identifying these factors. Currently, we utilize 21 individual data points across 7 broad categories.
Market Outlook
Stock Selection
PortfolioConstruction
RiskManagement
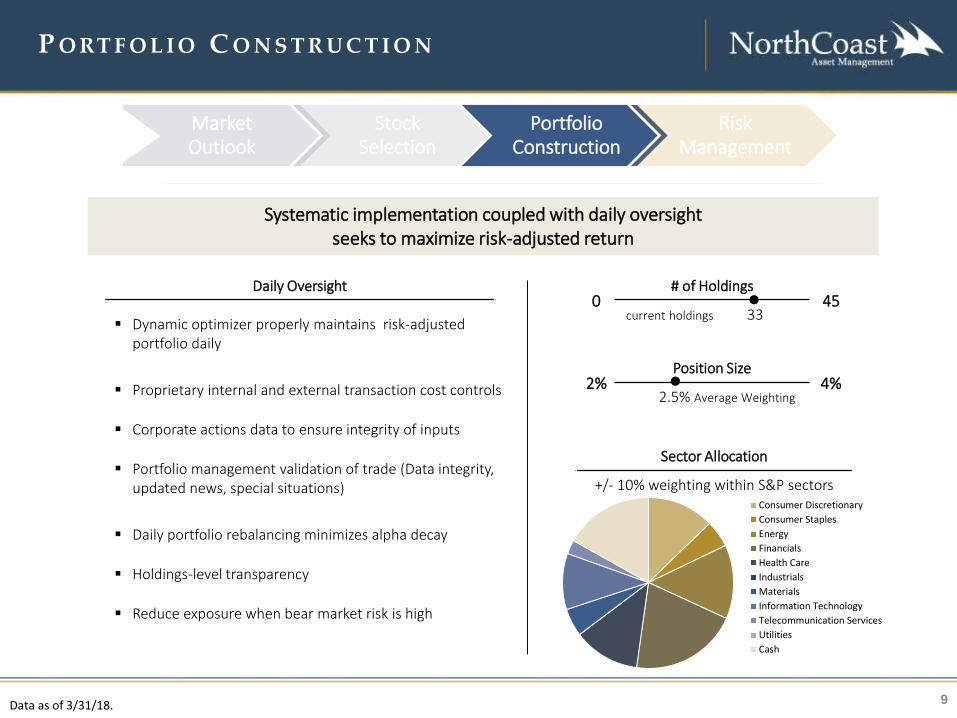
P O RT F O L I O C O N S T R U C T I O N
9
Market Outlook
Stock Selection
PortfolioConstruction
RiskManagement
Daily Oversight0
# of Holdings45
current holdings 33
Sector Allocation
+/- 10% weighting within S&P sectors
Dynamic optimizer properly maintains risk-adjusted portfolio daily
Proprietary internal and external transaction cost controls
Corporate actions data to ensure integrity of inputs
Portfolio management validation of trade (Data integrity,updated news, special situations)
Daily portfolio rebalancing minimizes alpha decay
Holdings-level transparency
Reduce exposure when bear market risk is high
Systematic implementation coupled with daily oversight seeks to maximize risk-adjusted return
2%Position Size
4%2.5% Average Weighting
Data as of 3/31/18.
Consumer DiscretionaryConsumer StaplesEnergyFinancialsHealth CareIndustrialsMaterialsInformation TechnologyTelecommunication ServicesUtilitiesCash
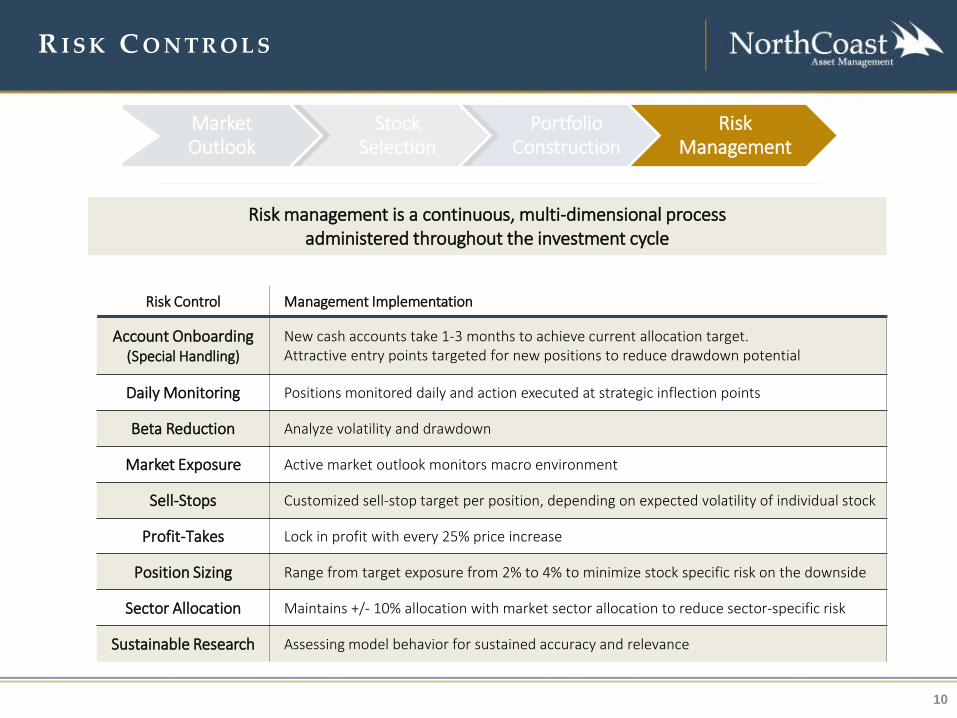
R I S K C O N T R O L S
10
Risk Control Management Implementation
Account Onboarding(Special Handling)
New cash accounts take 1-3 months to achieve current allocation target. Attractive entry points targeted for new positions to reduce drawdown potential
Daily Monitoring Positions monitored daily and action executed at strategic inflection points
Beta Reduction Analyze volatility and drawdown
Market Exposure Active market outlook monitors macro environment
Sell-Stops Customized sell-stop target per position, depending on expected volatility of individual stock
Profit-Takes Lock in profit with every 25% price increase
Position Sizing Range from target exposure from 2% to 4% to minimize stock specific risk on the downside
Sector Allocation Maintains +/- 10% allocation with market sector allocation to reduce sector-specific risk
Sustainable Research Assessing model behavior for sustained accuracy and relevance
Risk management is a continuous, multi-dimensional process administered throughout the investment cycle
Market Outlook
Stock Selection
PortfolioConstruction
RiskManagement
11
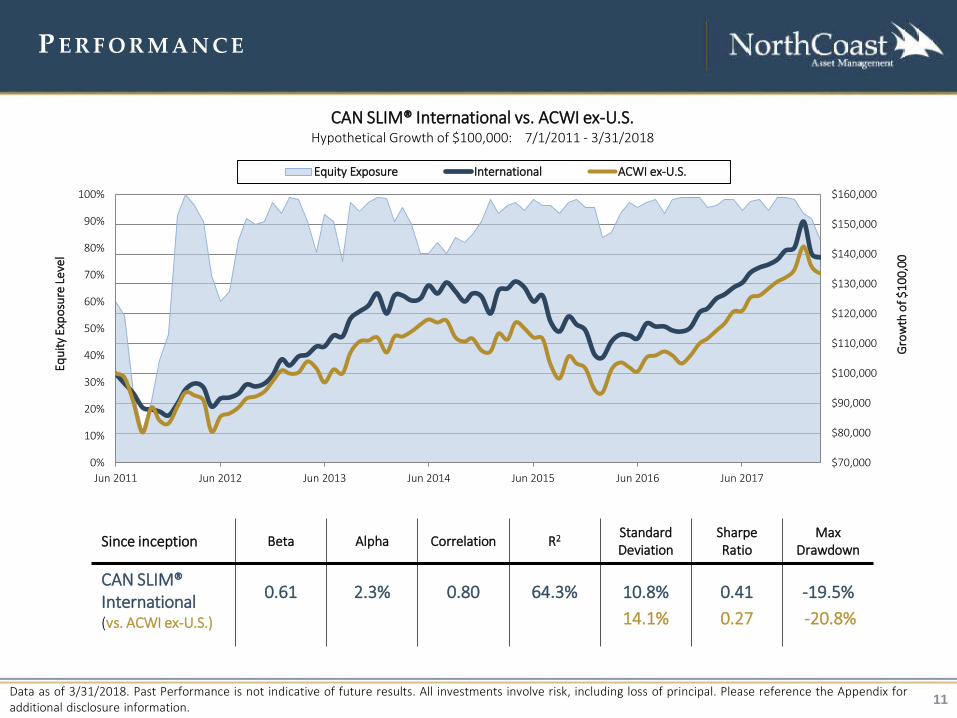
P E R F O R M A N C E
Since inception Beta Alpha Correlation R2 StandardDeviation
Sharpe Ratio
Max Drawdown
CAN SLIM® International (vs. ACWI ex-U.S.)
0.61 2.3% 0.80 64.3% 10.8%14.1%
0.410.27
-19.5% -20.8%
Data as of 3/31/2018. Past Performance is not indicative of future results. All investments involve risk, including loss of principal. Please reference the Appendix foradditional disclosure information.
0%
10%
20%
30%
40%
50%
60%
70%
80%
90%
100%
$70,000
$80,000
$90,000
$100,000
$110,000
$120,000
$130,000
$140,000
$150,000
$160,000
Jun 2011 Jun 2012 Jun 2013 Jun 2014 Jun 2015 Jun 2016 Jun 2017
Gro
wth
of $
100,
00
Equi
ty E
xpos
ure
Leve
l
CAN SLIM® International vs. ACWI ex-U.S.Hypothetical Growth of $100,000: 7/1/2011 - 3/31/2018
Equity Exposure International ACWI ex-U.S.
12
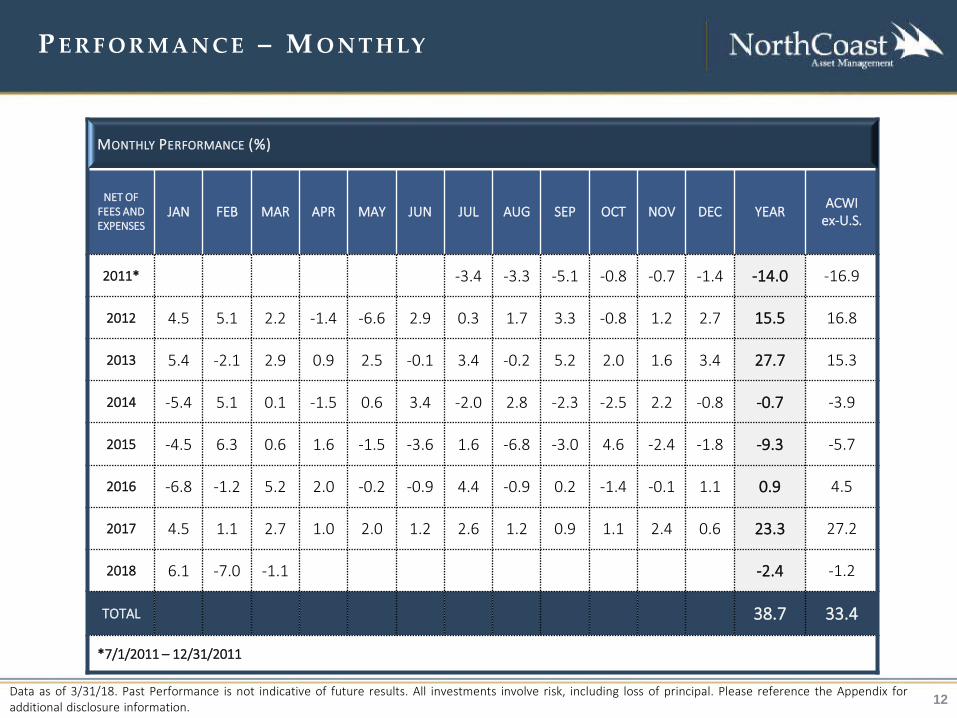
P E R F O R M A N C E – M O N T H LY
Data as of 3/31/18. Past Performance is not indicative of future results. All investments involve risk, including loss of principal. Please reference the Appendix foradditional disclosure information.
MONTHLY PERFORMANCE (%)
NET OF FEES AND EXPENSES
JAN FEB MAR APR MAY JUN JUL AUG SEP OCT NOV DEC YEAR ACWI ex-U.S.
2011* -3.4 -3.3 -5.1 -0.8 -0.7 -1.4 -14.0 -16.9
2012 4.5 5.1 2.2 -1.4 -6.6 2.9 0.3 1.7 3.3 -0.8 1.2 2.7 15.5 16.8
2013 5.4 -2.1 2.9 0.9 2.5 -0.1 3.4 -0.2 5.2 2.0 1.6 3.4 27.7 15.3
2014 -5.4 5.1 0.1 -1.5 0.6 3.4 -2.0 2.8 -2.3 -2.5 2.2 -0.8 -0.7 -3.9
2015 -4.5 6.3 0.6 1.6 -1.5 -3.6 1.6 -6.8 -3.0 4.6 -2.4 -1.8 -9.3 -5.7
2016 -6.8 -1.2 5.2 2.0 -0.2 -0.9 4.4 -0.9 0.2 -1.4 -0.1 1.1 0.9 4.5
2017 4.5 1.1 2.7 1.0 2.0 1.2 2.6 1.2 0.9 1.1 2.4 0.6 23.3 27.2
2018 6.1 -7.0 -1.1 -2.4 -1.2
TOTAL 38.7 33.4
*7/1/2011 – 12/31/2011
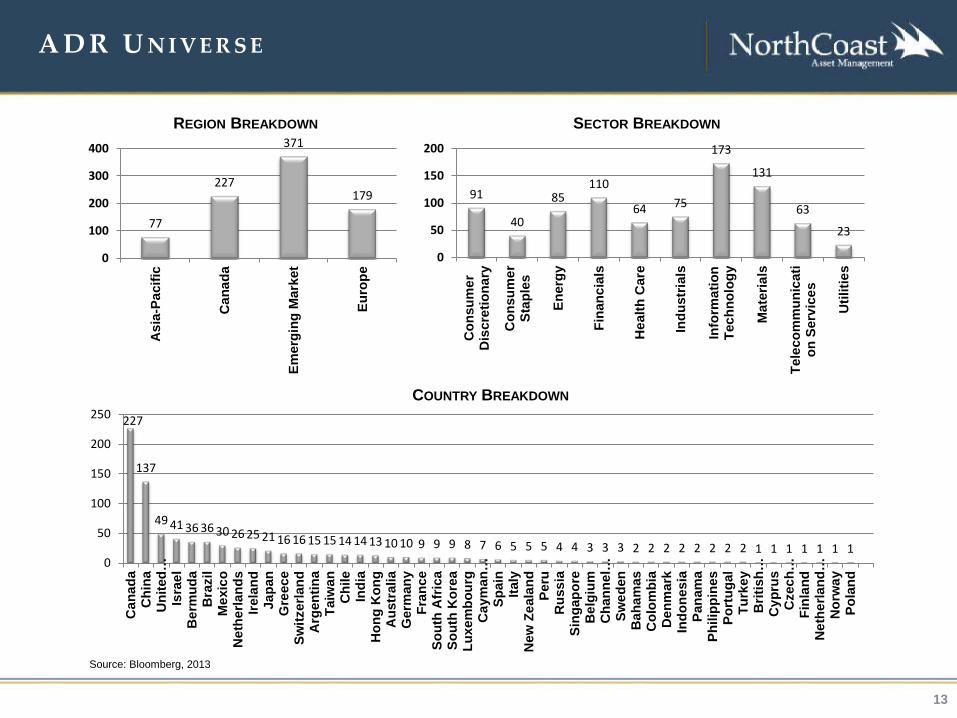
77
227
371
179
0
100
200
300
400A
sia-
Paci
fic
Can
ada
Emer
ging
Mar
ket
Euro
pe
REGION BREAKDOWN
91
40
85110
64 75
173
131
63
23
0
50
100
150
200
Con
sum
erD
iscr
etio
nary
Con
sum
erSt
aple
s
Ener
gy
Fina
ncia
ls
Hea
lth C
are
Indu
stria
ls
Info
rmat
ion
Tech
nolo
gy
Mat
eria
ls
Tele
com
mun
icat
ion
Ser
vice
s
Util
ities
SECTOR BREAKDOWN
227
137
49 41 36 36 30 26 25 21 16 16 15 15 14 14 13 10 10 9 9 9 8 7 6 5 5 5 4 4 3 3 3 2 2 2 2 2 2 2 2 1 1 1 1 1 1 10
50
100
150
200
250
Can
ada
Chi
naU
nite
d…Is
rael
Ber
mud
aB
razi
lM
exic
oN
ethe
rland
sIre
land
Japa
nG
reec
eSw
itzer
land
Arg
entin
aTa
iwan
Chi
leIn
dia
Hon
g K
ong
Aus
tral
iaG
erm
any
Fran
ceSo
uth
Afr
ica
Sout
h K
orea
Luxe
mbo
urg
Cay
man
…Sp
ain
Italy
New
Zea
land
Peru
Rus
sia
Sing
apor
eB
elgi
umC
hann
el…
Swed
enB
aham
asC
olom
bia
Den
mar
kIn
done
sia
Pana
ma
Phili
ppin
esPo
rtug
alTu
rkey
Brit
ish…
Cyp
rus
Cze
ch…
Finl
and
Net
herla
nd…
Nor
way
Pola
nd
COUNTRY BREAKDOWN
A D R U N I V E R S E
13
Source: Bloomberg, 2013
14
15
E N H A N C E M E N T S T O S T R AT E G Y F O U N D AT I O N
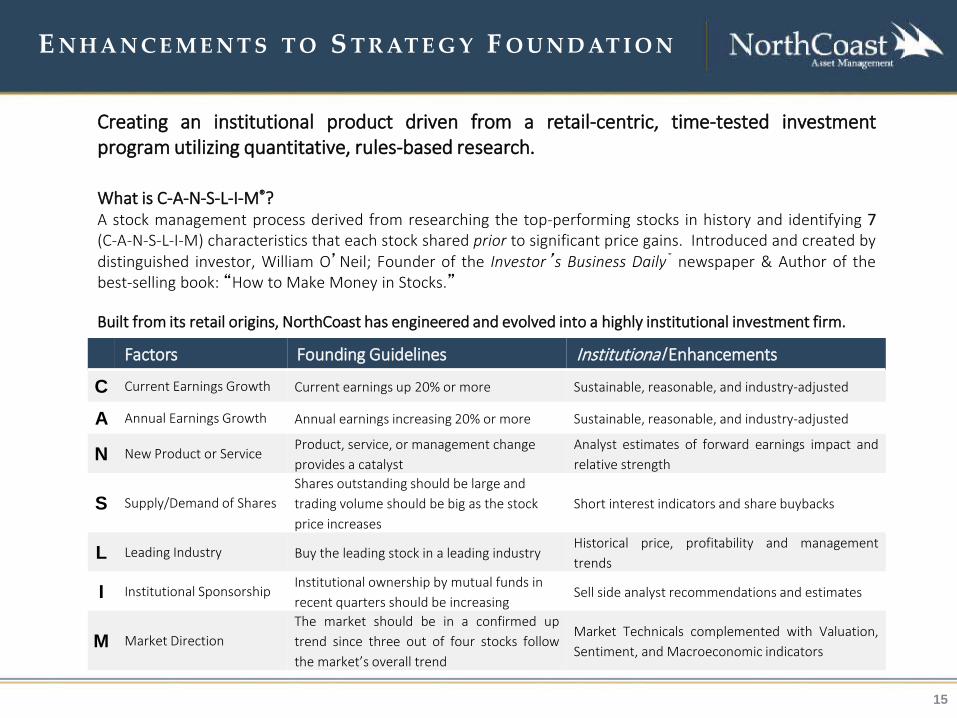
Creating an institutional product driven from a retail-centric, time-tested investmentprogram utilizing quantitative, rules-based research.
What is C-A-N-S-L-I-M®?A stock management process derived from researching the top-performing stocks in history and identifying 7(C-A-N-S-L-I-M) characteristics that each stock shared prior to significant price gains. Introduced and created bydistinguished investor, William O’Neil; Founder of the Investor’s Business Daily® newspaper & Author of thebest-selling book: “How to Make Money in Stocks.”
Built from its retail origins, NorthCoast has engineered and evolved into a highly institutional investment firm.
Factors Founding Guidelines Institutional Enhancements
C Current Earnings Growth Current earnings up 20% or more Sustainable, reasonable, and industry-adjusted
A Annual Earnings Growth Annual earnings increasing 20% or more Sustainable, reasonable, and industry-adjusted
N New Product or ServiceProduct, service, or management change provides a catalyst
Analyst estimates of forward earnings impact andrelative strength
S Supply/Demand of SharesShares outstanding should be large and trading volume should be big as the stock price increases
Short interest indicators and share buybacks
L Leading Industry Buy the leading stock in a leading industry Historical price, profitability and managementtrends
I Institutional SponsorshipInstitutional ownership by mutual funds in recent quarters should be increasing
Sell side analyst recommendations and estimates
M Market DirectionThe market should be in a confirmed uptrend since three out of four stocks followthe market’s overall trend
Market Technicals complemented with Valuation,Sentiment, and Macroeconomic indicators
16
R E S E A R C H P I P E L I N E
-
-
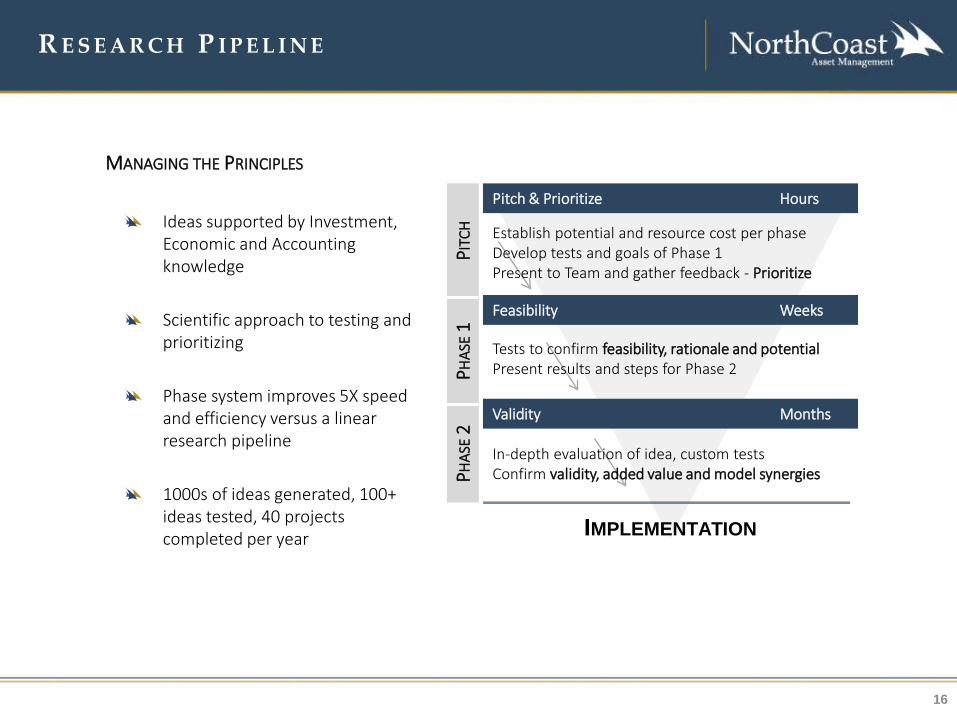
Pitch & Prioritize Hours
Feasibility Weeks
Validity Months
PITC
HPH
ASE
1PH
ASE
2
IMPLEMENTATION
MANAGING THE PRINCIPLES
Ideas supported by Investment, Economic and Accounting knowledge
Scientific approach to testing and prioritizing
Phase system improves 5X speed and efficiency versus a linear research pipeline
1000s of ideas generated, 100+ ideas tested, 40 projects completed per year
Establish potential and resource cost per phaseDevelop tests and goals of Phase 1Present to Team and gather feedback - Prioritize
Tests to confirm feasibility, rationale and potentialPresent results and steps for Phase 2
In-depth evaluation of idea, custom testsConfirm validity, added value and model synergies
17
D I S C L O S UR E I N F O R M AT I O N
Past Performance is not indicative of future results. All investments involve risk, including loss of principal.
The firm is defined as NorthCoast Asset Management LLC. NCAM was established in 1988 and is an independent Registered Investment Advisor (RIA) registered with theSecurities and Exchange Commission (SEC). The firm is a full service investment management company. The firm specializes in quantitative investment programs. NCAM islocated in Greenwich, CT, and is not affiliated with any parent organization and has no other offices operating under the same brand name.
Returns are presented net-of-fees. Net-of-fee returns are reduced by trading costs and the portfolio’s actual management fee. Valuations are computed and performanceis reported in U.S. dollars. A complete list of composite descriptions is available upon request. Policies for valuing portfolios, calculating performance, and preparingcompliant presentations are available upon request. To obtain a compliant presentation for the associated strategy, please contact one of our advisors at 800.274.5448.
This information contained herein has been prepared by NCAM on the basis of publicly available information, internally developed data and other third party sources believedto be reliable. This material is for informational and illustrative purposes only and should not be viewed as a recommendation or a solicitation to buy or sell any securities orinvestment products or to adopt any investment strategy.
The CAN SLIM® International investment program is a tactical, long-term growth strategy focused on capital appreciation with a secondary objective of downside protection.The strategy invests in leading international growth equities in the form of American Depository Receipts (ADRs) and Exchange-Traded Funds (ETFs) during favorable equityenvironments and scales to cash to preserve gains when bear market risk is high. Positions are managed (purchased and liquidated) through a combination of CAN SLIM®guidelines and a proprietary security scoring system designed to build a comprehensive growth portfolio.
The Benchmark is the MSCI ACWI ex-U.S. Index. The ACWI ex-U.S. index is a market-capitalization-weighted index maintained by Morgan Stanley Capital International (MSCI)and designed to provide a broad measure of stock performance throughout the world, with the exception of U.S.-based companies. The MSCI All Country World Index Ex-U.S.includes both developed and emerging markets
18
This information contained herein has been prepared by NorthCoast Asset Management, LLC ("NorthCoast") on the basis of publicly available information, internallydeveloped data and other third party sources believed to be reliable. NorthCoast has not sought to independently verify information obtained from public and third partysources and makes no representations or warranties as to accuracy, completeness or reliability of such information. All opinions and views constitute judgments as of the dateof writing without regard to the date on which the reader may receive or access the information, and are subject to change at any time without notice and with no obligationto update. This material is for informational and illustrative purposes only and is intended solely for the information of those to whom it is distributed by NorthCoast. No partof this material may be reproduced or retransmitted in any manner without the prior written permission of NorthCoast. NorthCoast does not represent, warrant or guaranteethat this information is suitable for any investment purpose and it should not be used as a basis for investment decisions.
PAST PERFORMANCE DOES NOT GUARANTEE OR INDICATE FUTURE RESULTS.
This material should not be viewed as a current or past recommendation or a solicitation of an offer to buy or sell any securities or investment products or to adopt anyinvestment strategy. The reader should not assume that any investments in companies, securities, sectors, strategies and/or markets identified or described herein were orwill be profitable and no representation is made that any investor will or is likely to achieve results comparable to those shown or will make any profit or will be able to avoidincurring substantial losses. Performance differences for certain investors may occur due to various factors, including timing of investment. Investment return will fluctuateand may be volatile, especially over short time horizons.
INVESTING ENTAILS RISKS, INCLUDING POSSIBLE LOSS OF SOME OR ALL OF THE INVESTOR'S PRINCIPAL.
The investment views and market opinions/analyses expressed herein may not reflect those of NorthCoast as a whole and different views may be expressed based ondifferent investment styles, objectives, views or philosophies. To the extent that these materials contain statements about the future, such statements are forward lookingand subject to a number of risks and uncertainties.
D I S C L O S UR E I N F O R M AT I O N