Embed Size (px)
Citation preview
Northavimet
User Guide
2
Table of Contents
Welcome to Northavimet! ............................................................................................................................ 4
Your start page –“The Dashboard”................................................................................................................ 5
TAF/METAR ................................................................................................................................................ 6
Commands ................................................................................................................................................. 6
Wind component ....................................................................................................................................... 7
Macros ....................................................................................................................................................... 7
Northavimet macro ................................................................................................................................... 8
Private macro ............................................................................................................................................ 8
The graphical TAF presentation ..................................................................................................................... 9
SIGMET ........................................................................................................................................................ 10
Chart Products ............................................................................................................................................. 11
Upper Winds /SIGWX .............................................................................................................................. 11
Analysis / Forecasts ................................................................................................................................. 12
SIGWX chart guide ................................................................................................................................... 12
Briefing Package ...................................................................................................................................... 12
Radar............................................................................................................................................................ 13
Denmark/Sweden .................................................................................................................................... 13
Europe ..................................................................................................................................................... 14
Satellite ........................................................................................................................................................ 15
Geostationary satellites ........................................................................................................................... 15
Day color .................................................................................................................................................. 16
Night color ............................................................................................................................................... 16
Visual ....................................................................................................................................................... 16
IR .............................................................................................................................................................. 16
Polar orbiting satellites ............................................................................................................................ 17
Observations ................................................................................................................................................ 18
Visibility and ceiling ................................................................................................................................. 18
Wind/weather ......................................................................................................................................... 19
Low Level Forecast - "LLF" ........................................................................................................................... 20
Purpose .................................................................................................................................................... 20
Areas ........................................................................................................................................................ 20
3
Naming example ...................................................................................................................................... 21
Forecast parameters ................................................................................................................................ 21
Time slice buttons .................................................................................................................................... 22
Preliminary forecast ................................................................................................................................ 22
Heights and units ..................................................................................................................................... 22
Background maps and navigation ........................................................................................................... 23
Run-down of the different parameters available in the LLF-forecast: .................................................... 24
Forecast ................................................................................................................................................... 24
Visibility ................................................................................................................................................... 25
Cloud base ............................................................................................................................................... 26
Surface wind ............................................................................................................................................ 27
Icing ......................................................................................................................................................... 28
Turbulence .............................................................................................................................................. 29
High level winds and temperature .......................................................................................................... 29
Model data .................................................................................................................................................. 31
Weather maps ......................................................................................................................................... 31
Model data parameters ........................................................................................................................... 32
Meteogram .............................................................................................................................................. 34
Info-menu .................................................................................................................................................... 35
Contact .................................................................................................................................................... 35
Briefing and consultation ........................................................................................................................ 35
User guide ................................................................................................................................................ 35
My Northavimet .......................................................................................................................................... 35
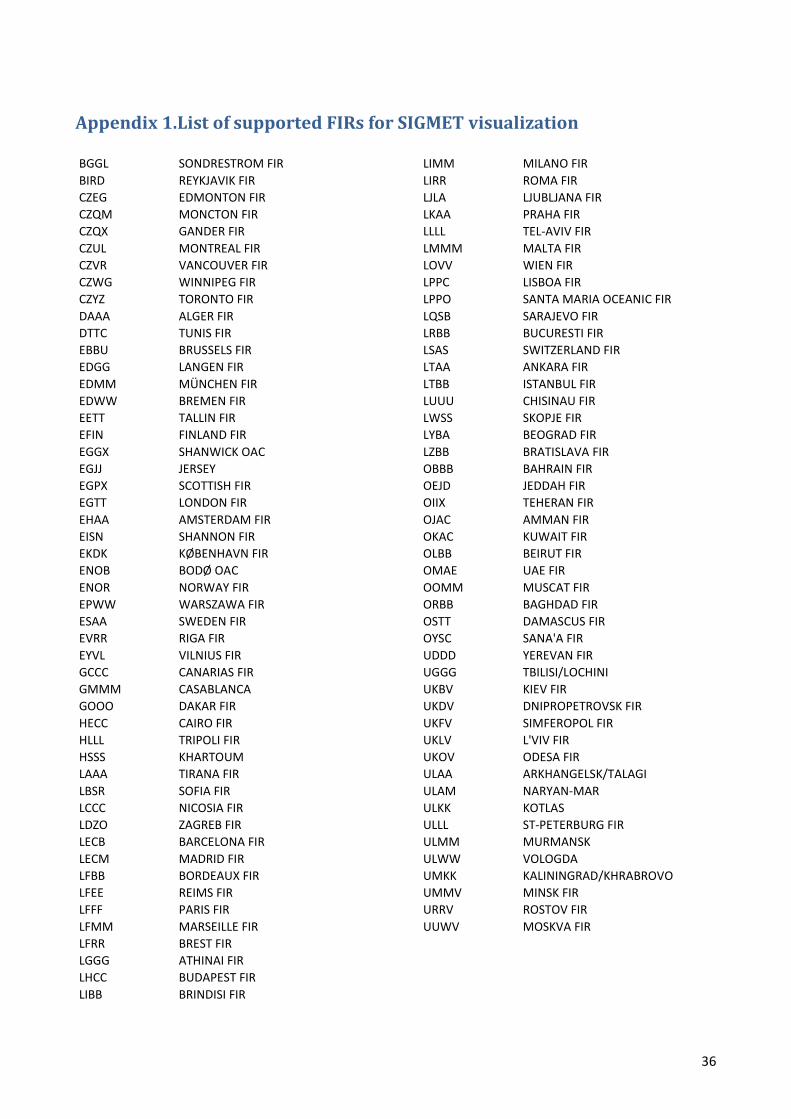
Appendix 1.List of supported FIRs for SIGMET visualization ........................................................................... 36
4
Welcome to Northavimet!
Northavimet is a self-briefing portal for aviation users within the NAMCON region.
Northavimet is currently supported by the following browsers:
• Windows explorer 10 or newer • Mozilla Firefox • Chrome • Safari
On mobile devices, standard browsers running on the following systems are supported:
• Android version 4.x and later • IOS 7.x and later • Windows 8.x and later mobile devices.
5
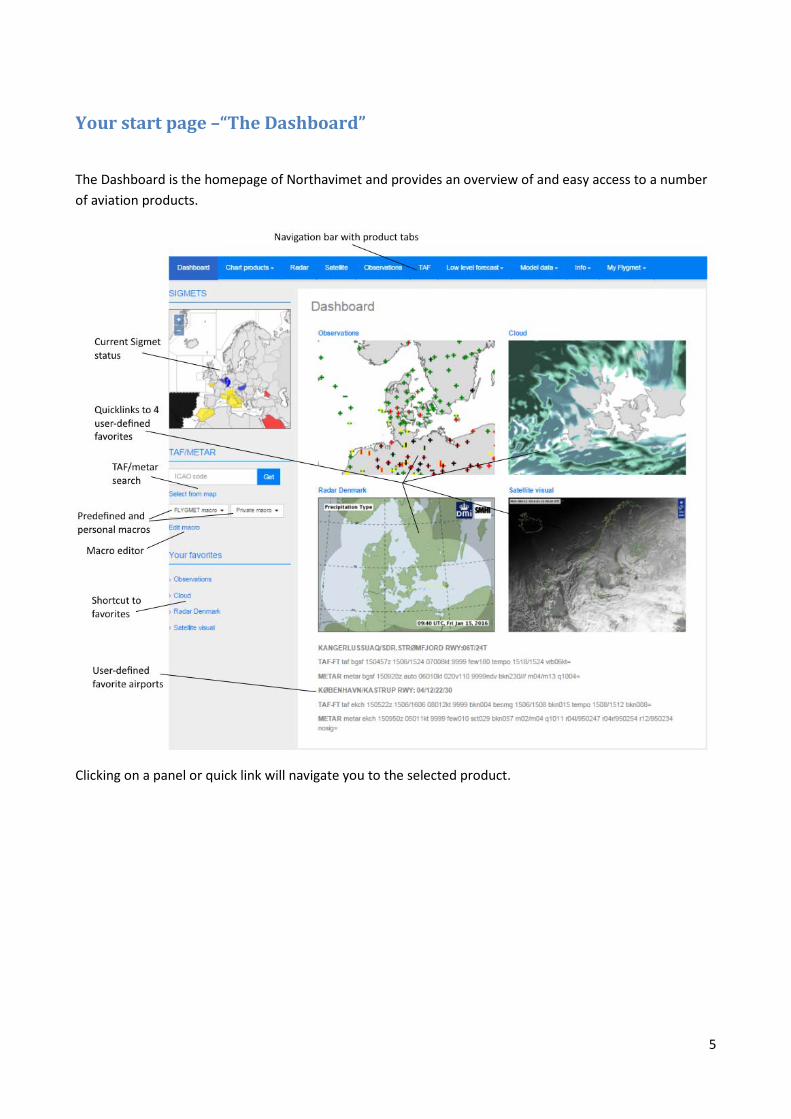
Your start page –“The Dashboard”
The Dashboard is the homepage of Northavimet and provides an overview of and easy access to a number of aviation products.
Clicking on a panel or quick link will navigate you to the selected product.
6
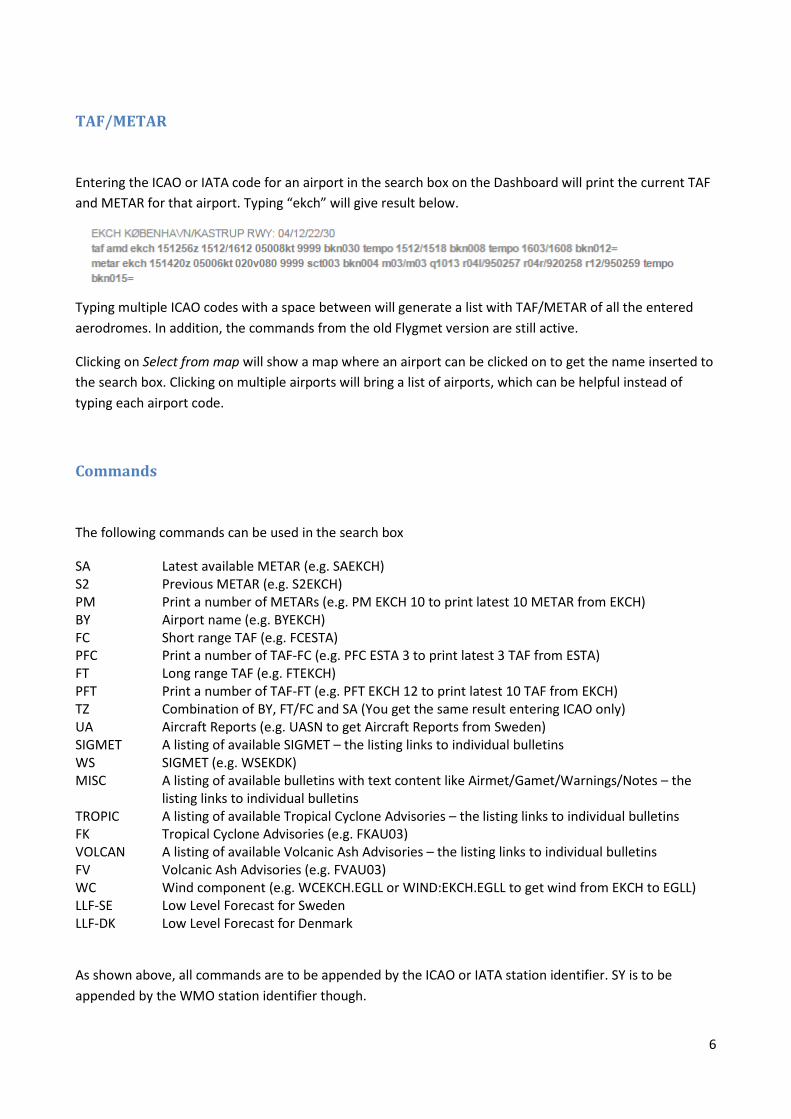
TAF/METAR
Entering the ICAO or IATA code for an airport in the search box on the Dashboard will print the current TAF and METAR for that airport. Typing “ekch” will give result below.
Typing multiple ICAO codes with a space between will generate a list with TAF/METAR of all the entered aerodromes. In addition, the commands from the old Flygmet version are still active.
Clicking on Select from map will show a map where an airport can be clicked on to get the name inserted to the search box. Clicking on multiple airports will bring a list of airports, which can be helpful instead of typing each airport code.
Commands
The following commands can be used in the search box
SA Latest available METAR (e.g. SAEKCH) S2 Previous METAR (e.g. S2EKCH) PM Print a number of METARs (e.g. PM EKCH 10 to print latest 10 METAR from EKCH) BY Airport name (e.g. BYEKCH) FC Short range TAF (e.g. FCESTA) PFC Print a number of TAF-FC (e.g. PFC ESTA 3 to print latest 3 TAF from ESTA) FT Long range TAF (e.g. FTEKCH) PFT Print a number of TAF-FT (e.g. PFT EKCH 12 to print latest 10 TAF from EKCH) TZ Combination of BY, FT/FC and SA (You get the same result entering ICAO only) UA Aircraft Reports (e.g. UASN to get Aircraft Reports from Sweden) SIGMET A listing of available SIGMET – the listing links to individual bulletins WS SIGMET (e.g. WSEKDK) MISC A listing of available bulletins with text content like Airmet/Gamet/Warnings/Notes – the
listing links to individual bulletins TROPIC A listing of available Tropical Cyclone Advisories – the listing links to individual bulletins FK Tropical Cyclone Advisories (e.g. FKAU03) VOLCAN A listing of available Volcanic Ash Advisories – the listing links to individual bulletins FV Volcanic Ash Advisories (e.g. FVAU03) WC Wind component (e.g. WCEKCH.EGLL or WIND:EKCH.EGLL to get wind from EKCH to EGLL) LLF-SE Low Level Forecast for Sweden LLF-DK Low Level Forecast for Denmark
As shown above, all commands are to be appended by the ICAO or IATA station identifier. SY is to be appended by the WMO station identifier though.
7
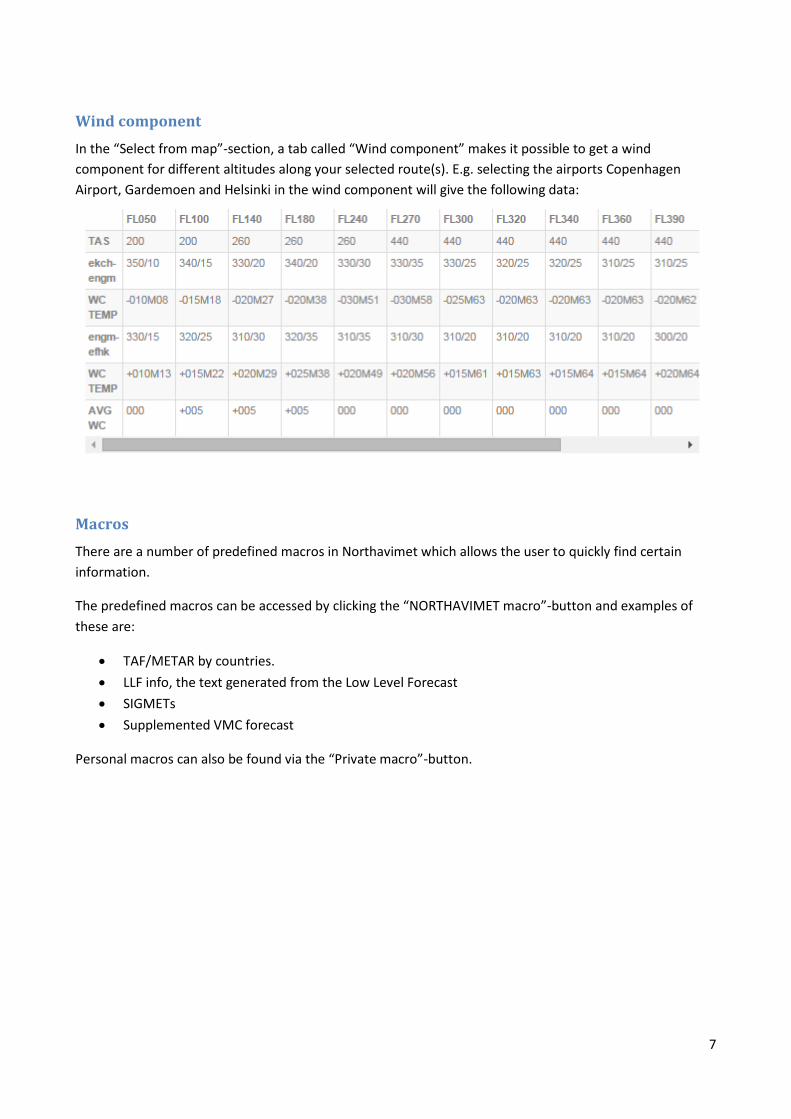
Wind component
In the “Select from map”-section, a tab called “Wind component” makes it possible to get a wind component for different altitudes along your selected route(s). E.g. selecting the airports Copenhagen Airport, Gardemoen and Helsinki in the wind component will give the following data:
Macros
There are a number of predefined macros in Northavimet which allows the user to quickly find certain information.
The predefined macros can be accessed by clicking the “NORTHAVIMET macro”-button and examples of these are:
• TAF/METAR by countries. • LLF info, the text generated from the Low Level Forecast • SIGMETs • Supplemented VMC forecast
Personal macros can also be found via the “Private macro”-button.
8
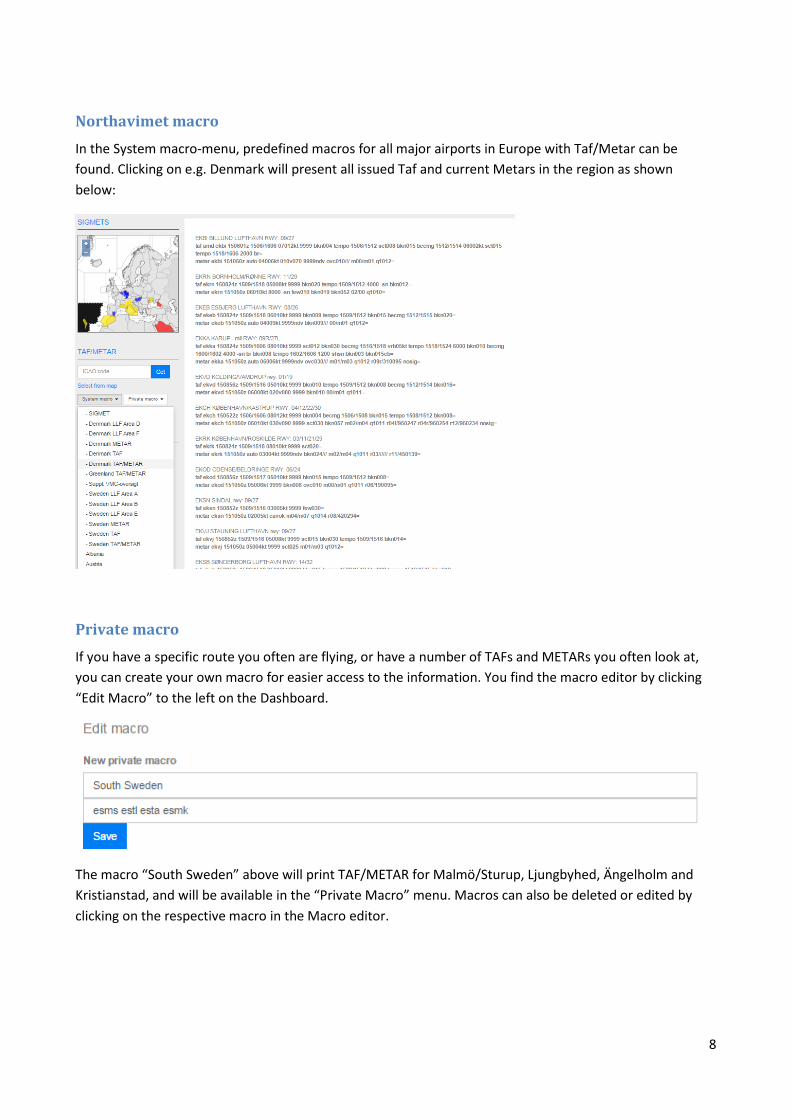
Northavimet macro
In the System macro-menu, predefined macros for all major airports in Europe with Taf/Metar can be found. Clicking on e.g. Denmark will present all issued Taf and current Metars in the region as shown below:
Private macro
If you have a specific route you often are flying, or have a number of TAFs and METARs you often look at, you can create your own macro for easier access to the information. You find the macro editor by clicking “Edit Macro” to the left on the Dashboard.
The macro “South Sweden” above will print TAF/METAR for Malmö/Sturup, Ljungbyhed, Ängelholm and Kristianstad, and will be available in the “Private Macro” menu. Macros can also be deleted or edited by clicking on the respective macro in the Macro editor.
9
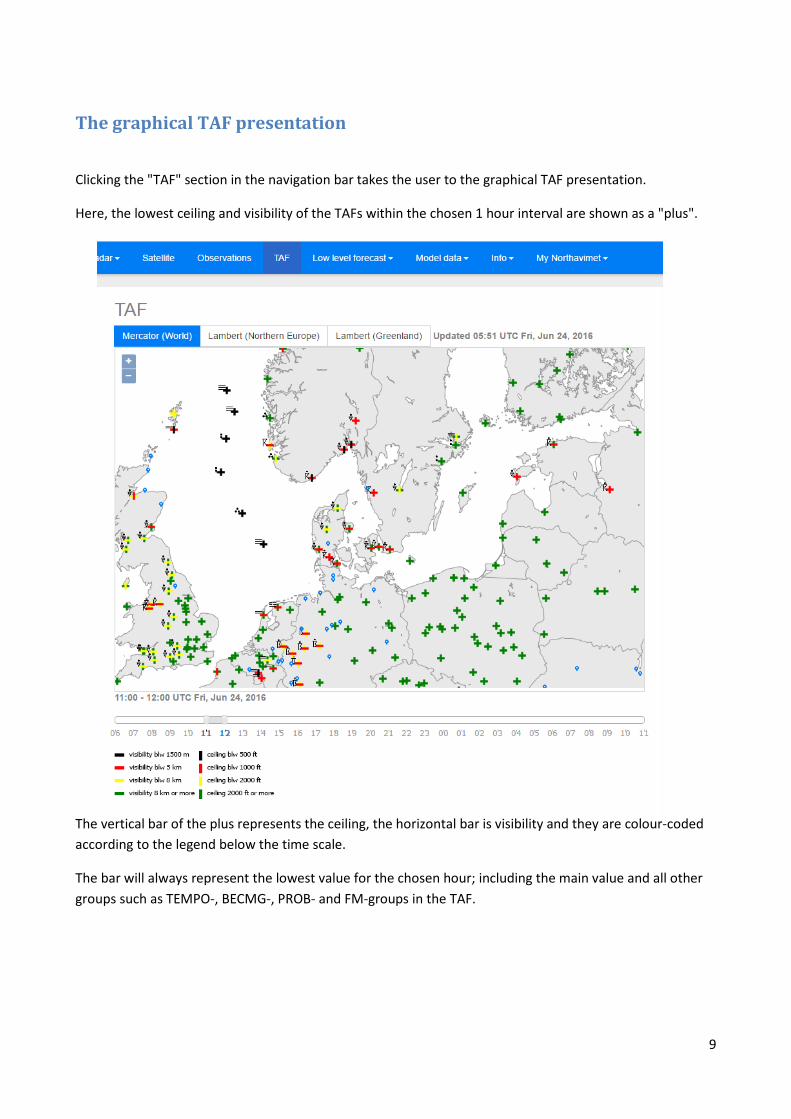
The graphical TAF presentation
Clicking the "TAF" section in the navigation bar takes the user to the graphical TAF presentation.
Here, the lowest ceiling and visibility of the TAFs within the chosen 1 hour interval are shown as a "plus".
The vertical bar of the plus represents the ceiling, the horizontal bar is visibility and they are colour-coded according to the legend below the time scale.
The bar will always represent the lowest value for the chosen hour; including the main value and all other groups such as TEMPO-, BECMG-, PROB- and FM-groups in the TAF.
10
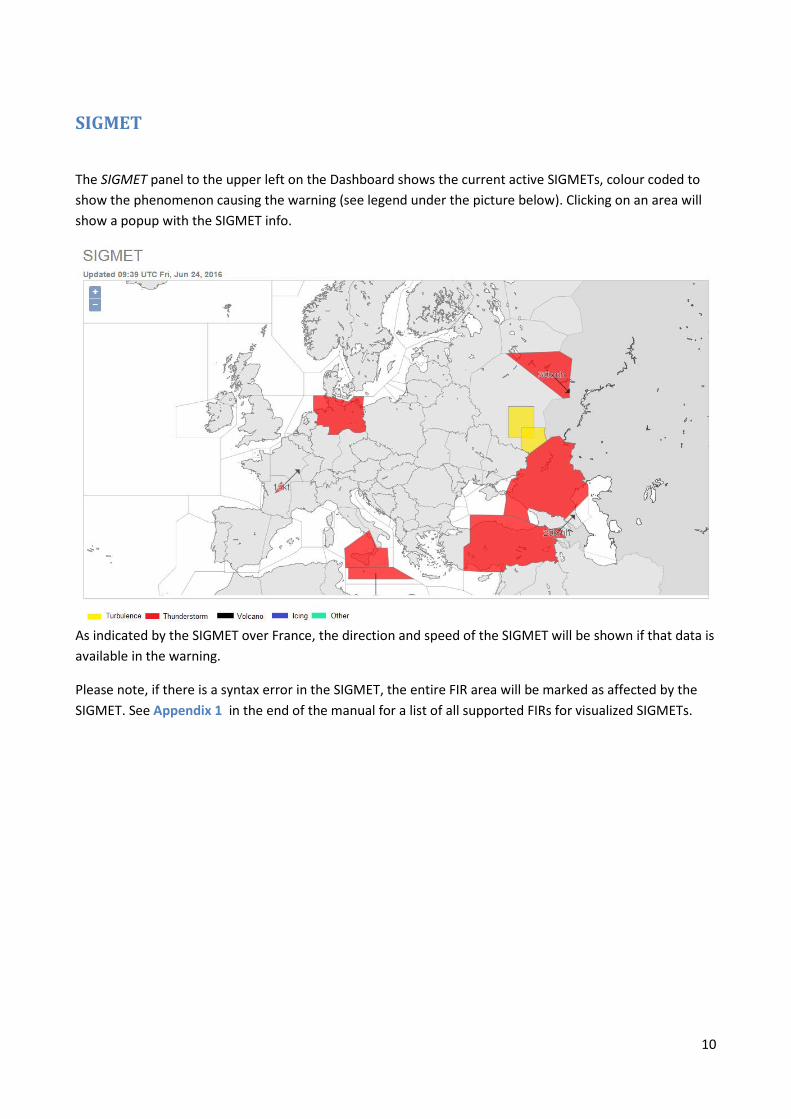
SIGMET
The SIGMET panel to the upper left on the Dashboard shows the current active SIGMETs, colour coded to show the phenomenon causing the warning (see legend under the picture below). Clicking on an area will show a popup with the SIGMET info.
As indicated by the SIGMET over France, the direction and speed of the SIGMET will be shown if that data is available in the warning.
Please note, if there is a syntax error in the SIGMET, the entire FIR area will be marked as affected by the SIGMET. See Appendix 1 in the end of the manual for a list of all supported FIRs for visualized SIGMETs.
11
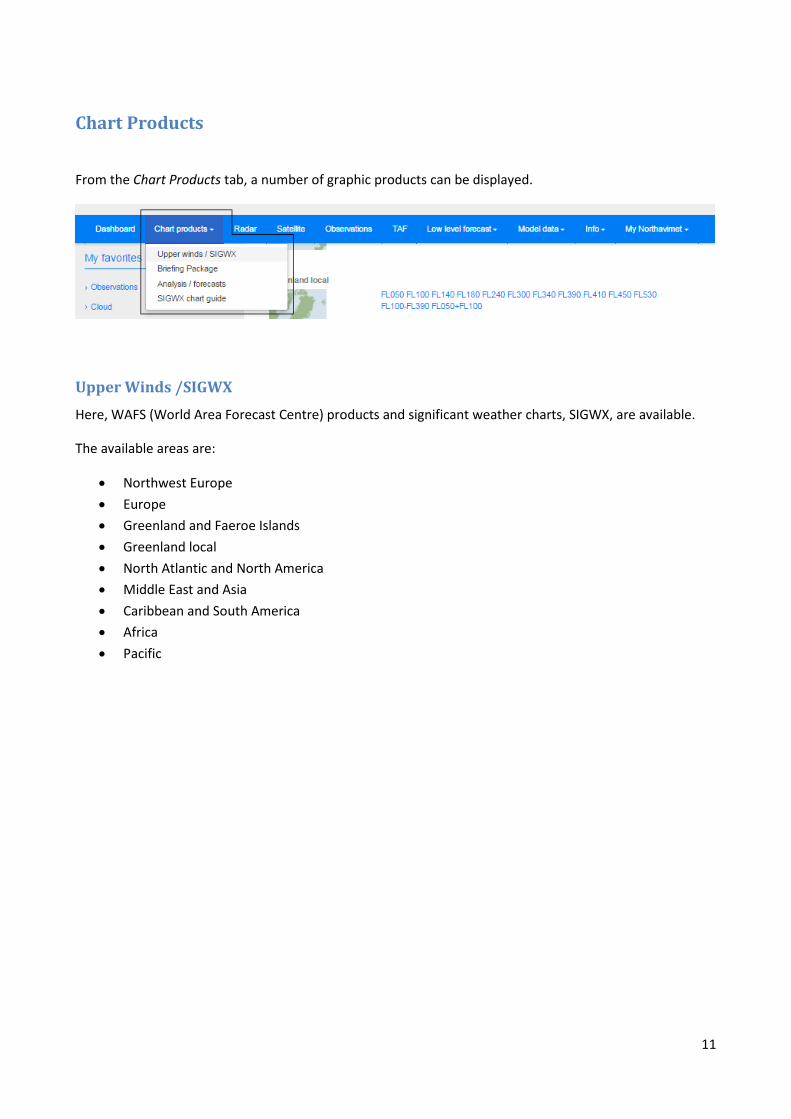
Chart Products
From the Chart Products tab, a number of graphic products can be displayed.
Upper Winds /SIGWX
Here, WAFS (World Area Forecast Centre) products and significant weather charts, SIGWX, are available.
The available areas are:
• Northwest Europe • Europe • Greenland and Faeroe Islands • Greenland local • North Atlantic and North America • Middle East and Asia • Caribbean and South America • Africa • Pacific
12
In addition, significant weather (SIGWX) charts, for the NAMCON region including Germany are available here.
Analysis / Forecasts
The synoptic analysis and forecasts issued by The UK Met Office are available on this page.
SIGWX chart guide
The last option in the Chart Products tab contains an English guide for the SIGWX chart for the Denmark region and a Swedish guide for the SIGWX charts.
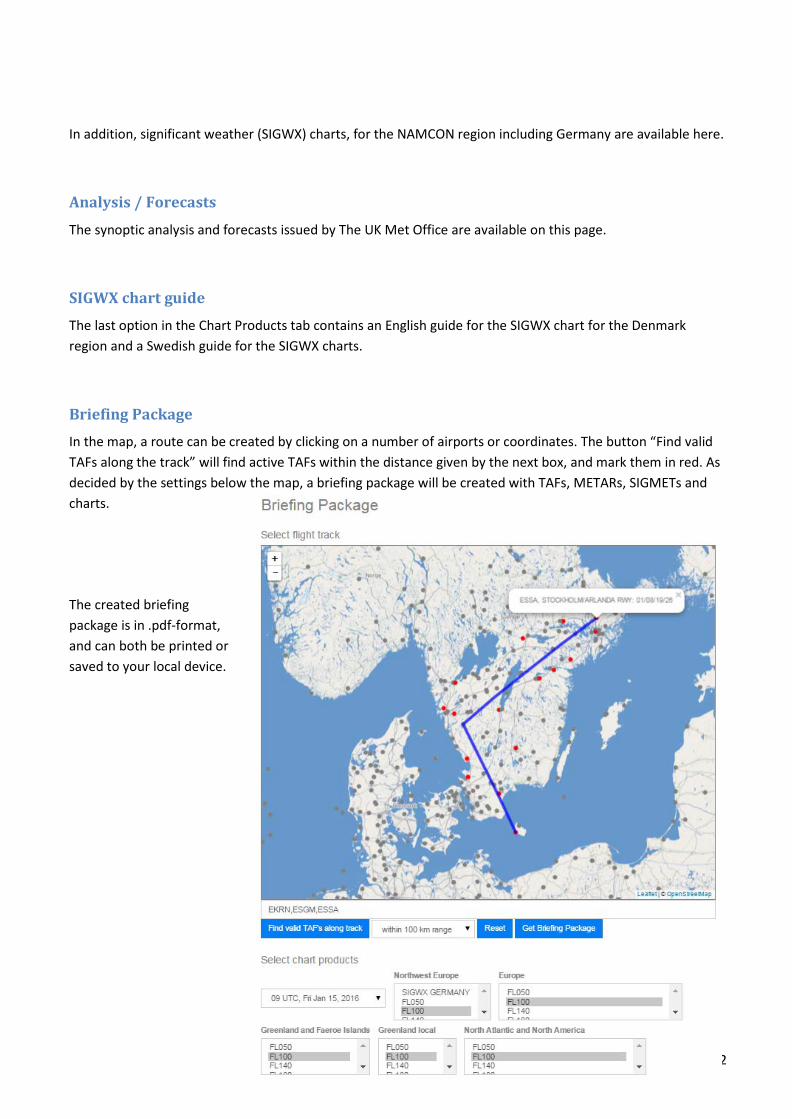
Briefing Package
In the map, a route can be created by clicking on a number of airports or coordinates. The button “Find valid TAFs along the track” will find active TAFs within the distance given by the next box, and mark them in red. As decided by the settings below the map, a briefing package will be created with TAFs, METARs, SIGMETs and charts.
The created briefing package is in .pdf-format, and can both be printed or saved to your local device.
13
Radar
Clicking the Radar menu, two view modes will be presented. The first option, Denmark/Sweden will allow the user to show a composite image of radar image from either Denmark or Sweden, the second one contains a composite radar image over Europe.
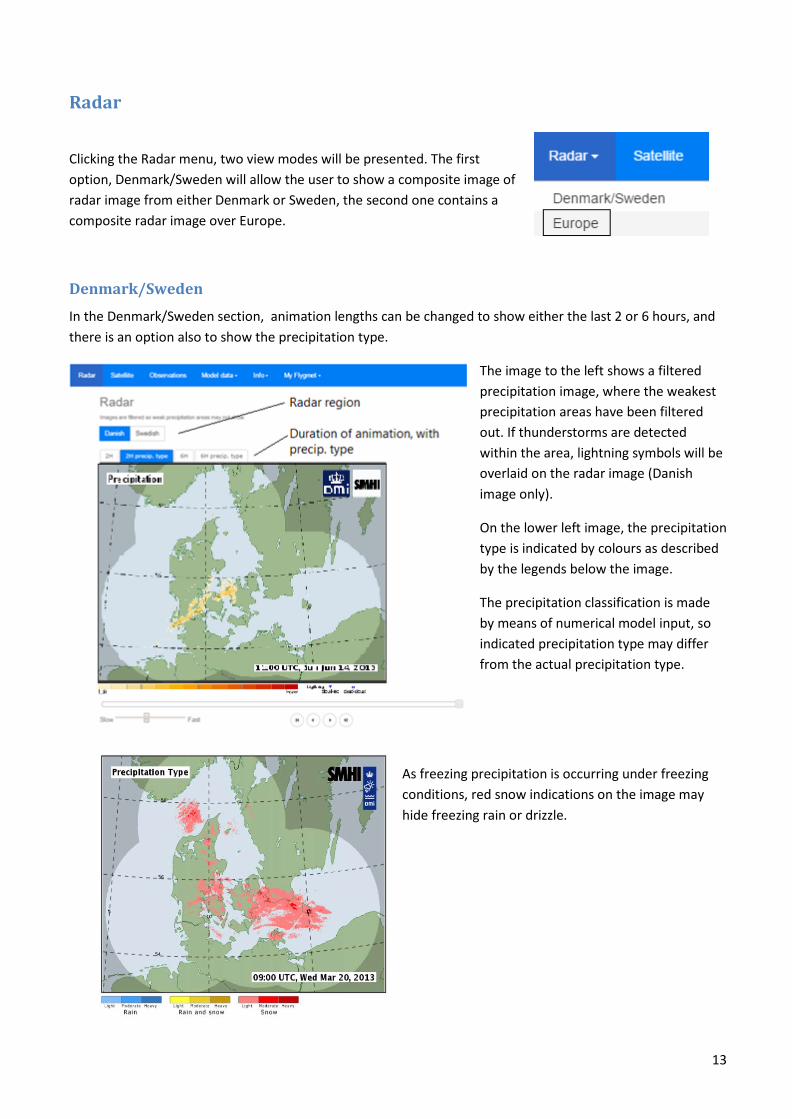
Denmark/Sweden
In the Denmark/Sweden section, animation lengths can be changed to show either the last 2 or 6 hours, and there is an option also to show the precipitation type.
The image to the left shows a filtered precipitation image, where the weakest precipitation areas have been filtered out. If thunderstorms are detected within the area, lightning symbols will be overlaid on the radar image (Danish image only).
On the lower left image, the precipitation type is indicated by colours as described by the legends below the image.
The precipitation classification is made by means of numerical model input, so indicated precipitation type may differ from the actual precipitation type.
As freezing precipitation is occurring under freezing conditions, red snow indications on the image may hide freezing rain or drizzle.
14
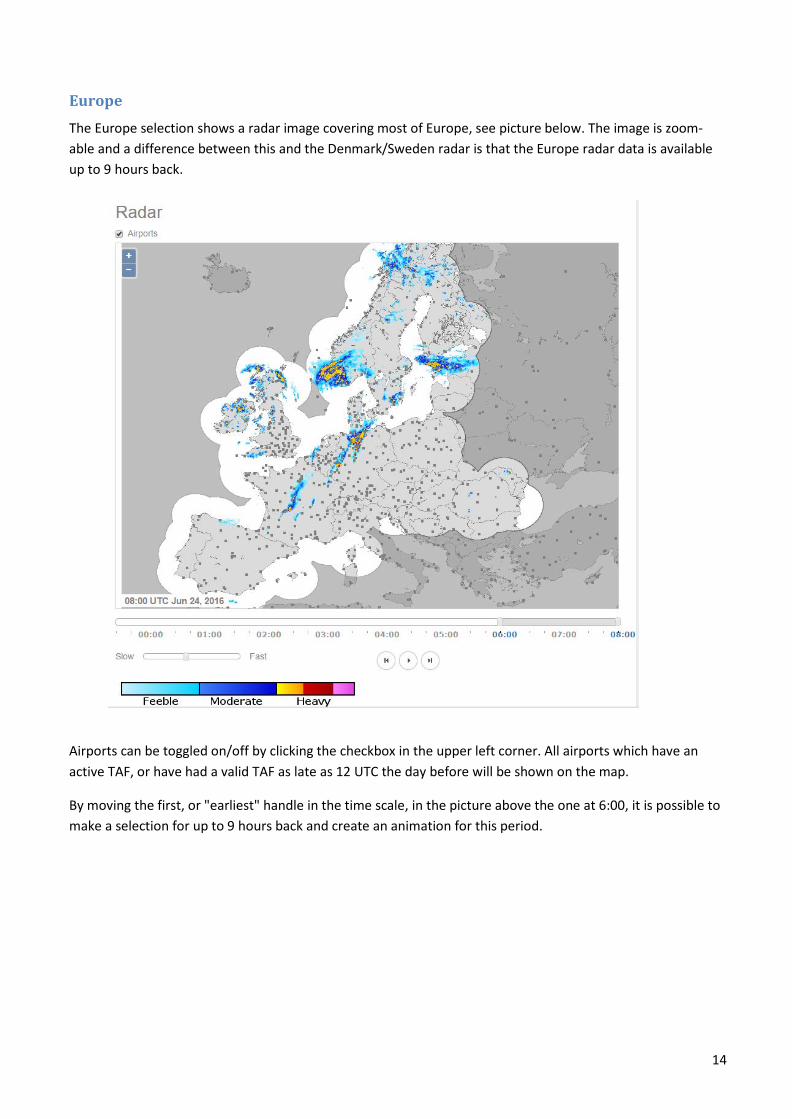
Europe
The Europe selection shows a radar image covering most of Europe, see picture below. The image is zoom-able and a difference between this and the Denmark/Sweden radar is that the Europe radar data is available up to 9 hours back.
Airports can be toggled on/off by clicking the checkbox in the upper left corner. All airports which have an active TAF, or have had a valid TAF as late as 12 UTC the day before will be shown on the map.
By moving the first, or "earliest" handle in the time scale, in the picture above the one at 6:00, it is possible to make a selection for up to 9 hours back and create an animation for this period.
15
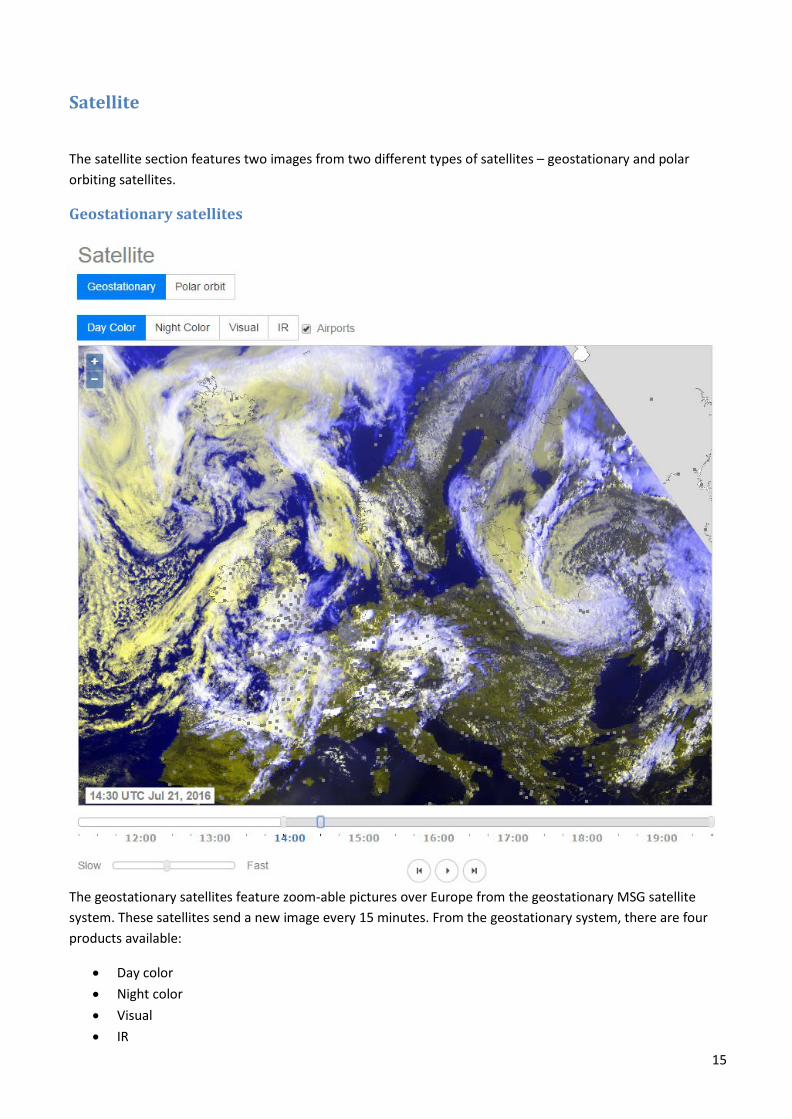
Satellite
The satellite section features two images from two different types of satellites – geostationary and polar orbiting satellites.
Geostationary satellites
The geostationary satellites feature zoom-able pictures over Europe from the geostationary MSG satellite system. These satellites send a new image every 15 minutes. From the geostationary system, there are four products available:
• Day color • Night color • Visual • IR
16
Day color
The day color satellite image is a colored representation of what the human eye would see from space. Ground is colored green, sea is dark blue, and clouds are colored in different shades of white. The “whiteness” of the clouds indicates the height of the cloud top, with a yellow tone indicating lower clouds and white with a blueish tone indicating a higher altitude cloud top. The advantage of this image is the fairly high resolution providing detailed images of the cloud cover. The downside is that the image is only usable when daylight prevails. As soon as the sun sinks below the horizon, the image turns into a dark blue/ black picture, possible mixed with digital noise.
NB! During certain conditions, cloud layers can look similar to snow-covered surfaces. Use with caution.
Night color
The night color satellite image shows images with an infrared channel, which makes it possible to see cloud formations during the night. The images are “inverted infrared” which means that a higher altitude and therefore colder cloud is represented with a brighter color, while a lower and warmer cloud top will have a darker white-red tone. These images are optimized to show the best contrast during the night, this optimization makes clouds during the day become turquoise. The main advantage of the infrared image is that it is available and usable 24 hours a day. The downside is reduced resolution compared to the visible image.
NB! During certain conditions and temperatures, cloud layers can look similar to the sea and/or a snow-covered surface. Use with caution.
Visual
The visual image is very similar to the day color image, the main difference is that this feature has black and white images with a high contrast between clouds and ground/sea. As in the “day color” section, colder/higher cloud tops are represented with a brighter white, and lower/warmer cloud tops with a grayer tone. This section only produces high-contrast images during daytime.
NB! During certain conditions, cloud layers can look similar to snow-covered surfaces. Use with caution.
IR
The IR images are black and white representations of infrared images, similar to what the Visual images are to the Day colored ones. These images are also “inverted infrared” meaning that a higher altitude and therefore colder cloud is represented with a brighter color, while a lower and warmer cloud top will have a darker white-red tone. E.g. a warm ground surface will therefore have a very dark grey tone.
NB! During certain conditions and temperatures, cloud layers can look similar to the sea and/or a snow-covered surface. Use with caution.
By moving the left handle in the time scale, in the picture above the one positioned at 14:00, it is possible to make a selection for up to 9 hours back and create an animation for this period.
Airports can be toggled on/off by clicking the checkbox in the upper left corner. All airports which have an active TAF, or have had a valid TAF as late as 12 UTC the day before will be shown on the map.
17
Polar orbiting satellites
Choosing the "Polar"-option will allow the user to see images from polar-orbiting satellites. These satellites orbit the earth at a much closer distance than the geostationary ones, which gives a higher detail level. The downside is that the passages of the polar orbiting ones are much more irregular than the MSG satellites. Depending on the path the polar-orbiting satellite takes, it may also not produce a picture covering the desired area.
• Day color • Night color
These products are described above in the geostationary satellite section.
18
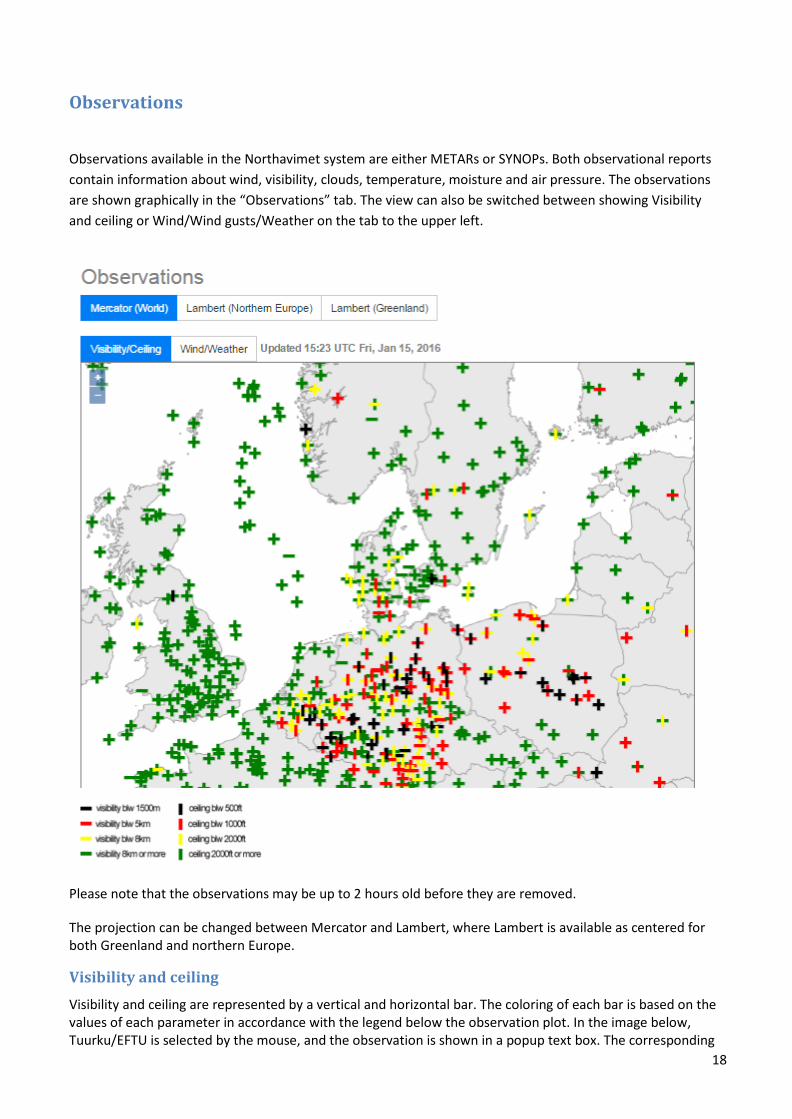
Observations
Observations available in the Northavimet system are either METARs or SYNOPs. Both observational reports contain information about wind, visibility, clouds, temperature, moisture and air pressure. The observations are shown graphically in the “Observations” tab. The view can also be switched between showing Visibility and ceiling or Wind/Wind gusts/Weather on the tab to the upper left.
Please note that the observations may be up to 2 hours old before they are removed.
The projection can be changed between Mercator and Lambert, where Lambert is available as centered for both Greenland and northern Europe.
Visibility and ceiling
Visibility and ceiling are represented by a vertical and horizontal bar. The coloring of each bar is based on the values of each parameter in accordance with the legend below the observation plot. In the image below, Tuurku/EFTU is selected by the mouse, and the observation is shown in a popup text box. The corresponding
19
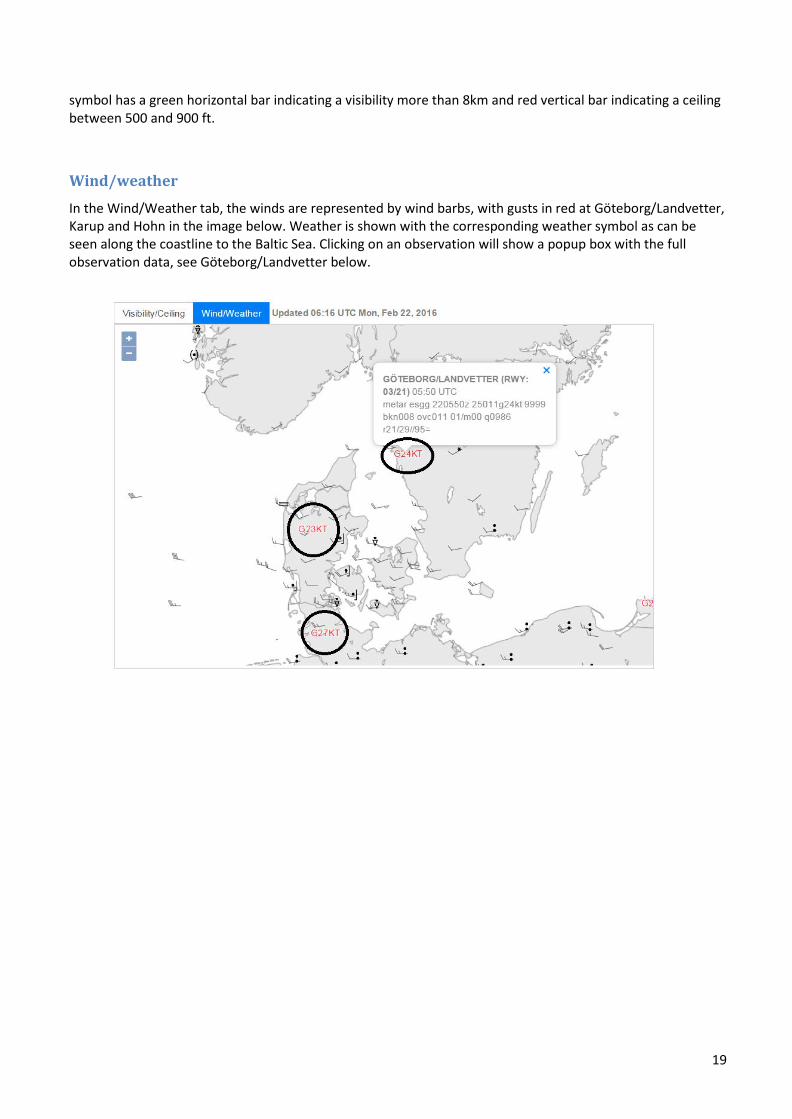
symbol has a green horizontal bar indicating a visibility more than 8km and red vertical bar indicating a ceiling between 500 and 900 ft.
Wind/weather
In the Wind/Weather tab, the winds are represented by wind barbs, with gusts in red at Göteborg/Landvetter, Karup and Hohn in the image below. Weather is shown with the corresponding weather symbol as can be seen along the coastline to the Baltic Sea. Clicking on an observation will show a popup box with the full observation data, see Göteborg/Landvetter below.
20
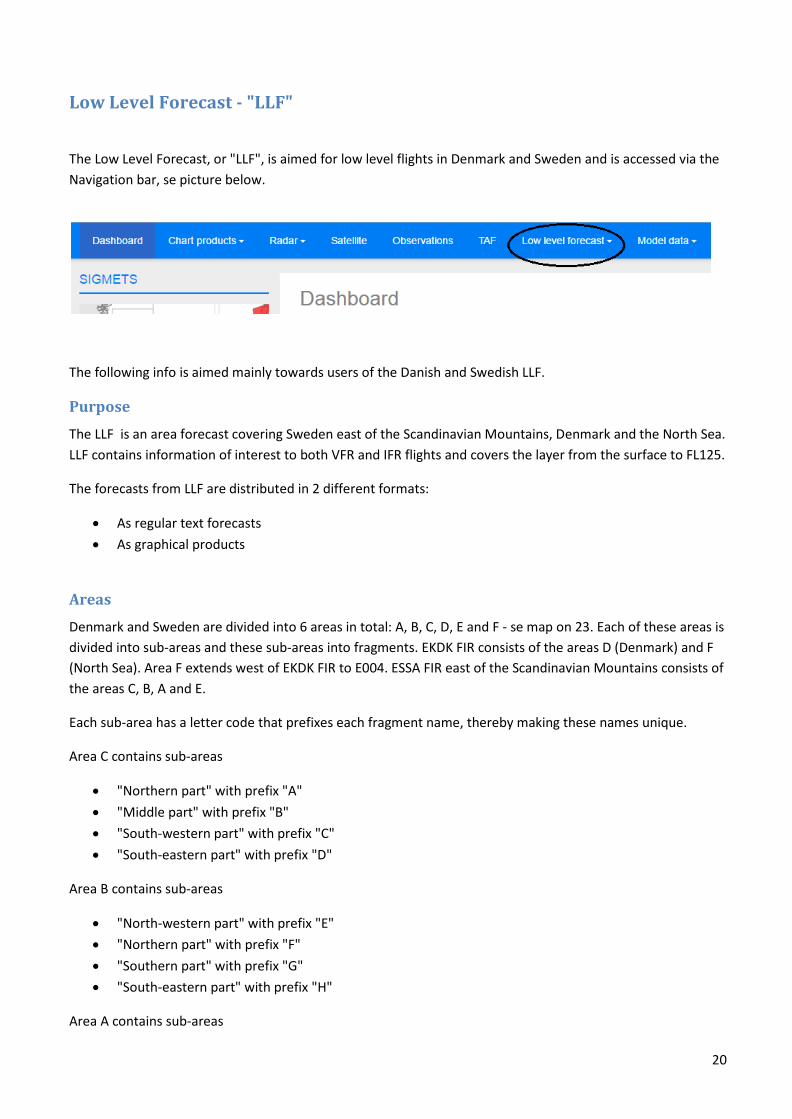
Low Level Forecast - "LLF"
The Low Level Forecast, or "LLF", is aimed for low level flights in Denmark and Sweden and is accessed via the Navigation bar, se picture below.
The following info is aimed mainly towards users of the Danish and Swedish LLF.
Purpose
The LLF is an area forecast covering Sweden east of the Scandinavian Mountains, Denmark and the North Sea. LLF contains information of interest to both VFR and IFR flights and covers the layer from the surface to FL125.
The forecasts from LLF are distributed in 2 different formats:
• As regular text forecasts • As graphical products
Areas
Denmark and Sweden are divided into 6 areas in total: A, B, C, D, E and F - se map on 23. Each of these areas is divided into sub-areas and these sub-areas into fragments. EKDK FIR consists of the areas D (Denmark) and F (North Sea). Area F extends west of EKDK FIR to E004. ESSA FIR east of the Scandinavian Mountains consists of the areas C, B, A and E.
Each sub-area has a letter code that prefixes each fragment name, thereby making these names unique.
Area C contains sub-areas
• "Northern part" with prefix "A" • "Middle part" with prefix "B" • "South-western part" with prefix "C" • "South-eastern part" with prefix "D"
Area B contains sub-areas
• "North-western part" with prefix "E" • "Northern part" with prefix "F" • "Southern part" with prefix "G" • "South-eastern part" with prefix "H"
Area A contains sub-areas
21
• "Northern part" with prefix "I" • South-eastern part" with prefix "K"´
Area E only has one sub-area
• The entire area with prefix "J"
Area D consists of sub-areas:
• "Jutland" with prefix "M" • "The Islands" with prefix "N"
Area F has only one sub-area
• The entire area with prefix "L"
Naming example
The fragment covering Bornholm has the name J4c, indicating that the fragment lies in Area E. 3c is an internal for Area E.
The fragment covering the island of Gotland has the name H2a indicating that the fragment lies in the south-eastern part of area B.
When looking at the LLF text forecasts for a specific sub-area fragment, names will appear with the prefix omitted. Therefore, Bornholm will be referenced as 4c in the text forecast for Area E.
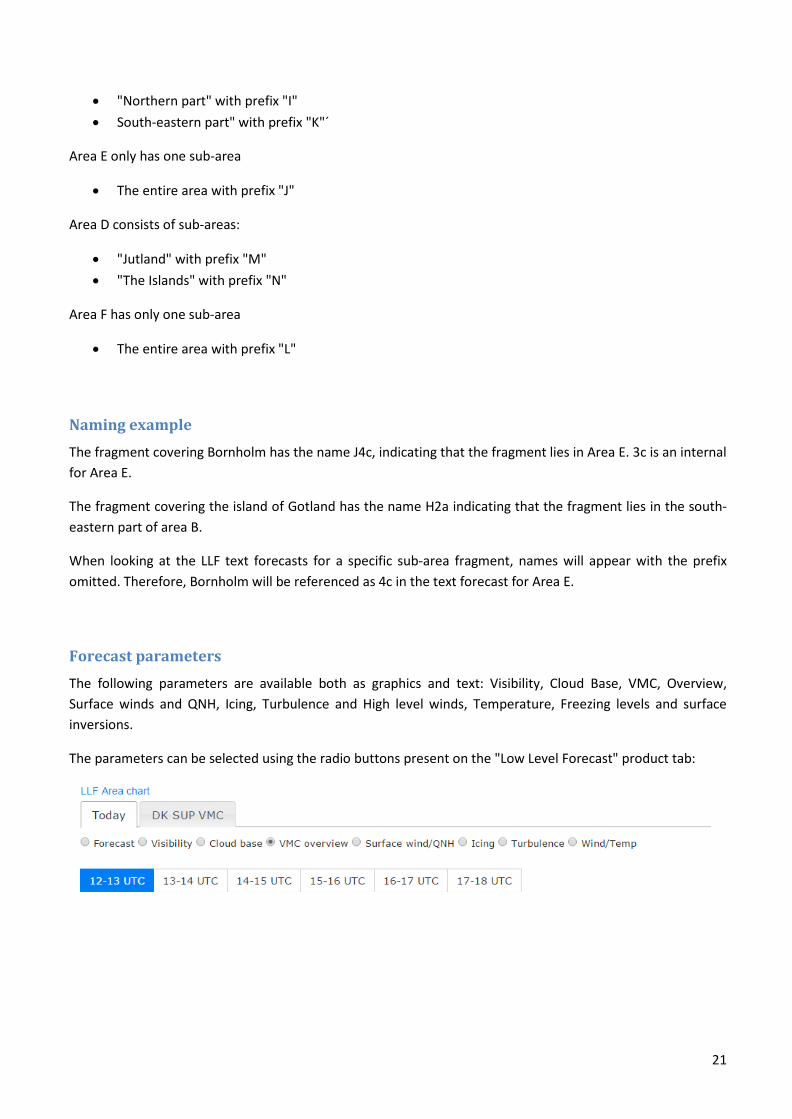
Forecast parameters
The following parameters are available both as graphics and text: Visibility, Cloud Base, VMC, Overview, Surface winds and QNH, Icing, Turbulence and High level winds, Temperature, Freezing levels and surface inversions.
The parameters can be selected using the radio buttons present on the "Low Level Forecast" product tab:
22
Time slice buttons
Below the radio buttons, time slices can be selected. The specific buttons can be selected. The specific time slices will wary throughout the day the forecasts are issued, but will always cover 6 hours divided into 1 hour slices.
Forecasts are issued according to this schedule:
0340 (0440) UTC: LLF Area A+B+C+D+E+F, valid 04-10 (05-11)
0655 (0755) UTC: LLF Area A+B+C+D+E+F, valid 07-13 (08-14)
0955 (1055) UTC: LLF Area A+B+C+D+E+F, valid 10-16 (11-17)
1255 (1355) UTC: LLF Area A+B+C+D+E+F, valid 13-19 (14-20)
1555 (1655) UTC: LLF Area A+B+C+D+E+F, valid 16-22 (16-22)
1830 (1830) UTC: Preliminary LLF Area A+B+C+D+E+F, valid tomorrow
(Times in parenthesis are production times during the winter)
Preliminary forecast
If you access the "Low Level Forecast" product tab during the night time and early morning, there will be no valid forecast for Today, but a preliminary forecast describing visibility, cloud base and wind for the periods Morning, Day and Evening will be shown until a fresh forecast for Today is issued. Whenever there is a preliminary forecast, it will present itself as a secondary product tab next to the "Today" pane shown in the previous page.
The periods Morning, Day and Evenings roughly translate: Morning: 06-11 local time
Day: 11-16 local time Evening: 16-21 local time
When looking at preliminary forecasts of surface winds you will see two time periods: Morning/Day: 06-13 local time
Day/Evening: 13-21 local time
Remark: You can access a preliminary text-forecast for weather "tonight" and "tomorrow" by typing "FBDN82" in the TAF/METAR-panel. (Issued during daytime).
Heights and units
Heights are displayed in flight levels from FLOSO and above. Below FL050 heights are displayed above ground level AGL in feet/ft.
23
Wind speeds are in knots, wind direction in intervals of 10 degrees. Surface wind directions however are displayed as N, NNE, NE, ENE, E, ESE, SE, SSE, S, SSW, SW, WSW, W, WNW, NW and NNW.
Temperatures are in degrees Celsius.
Visibility is displayed in kilometers.
Air pressure (QNH) in hPa.
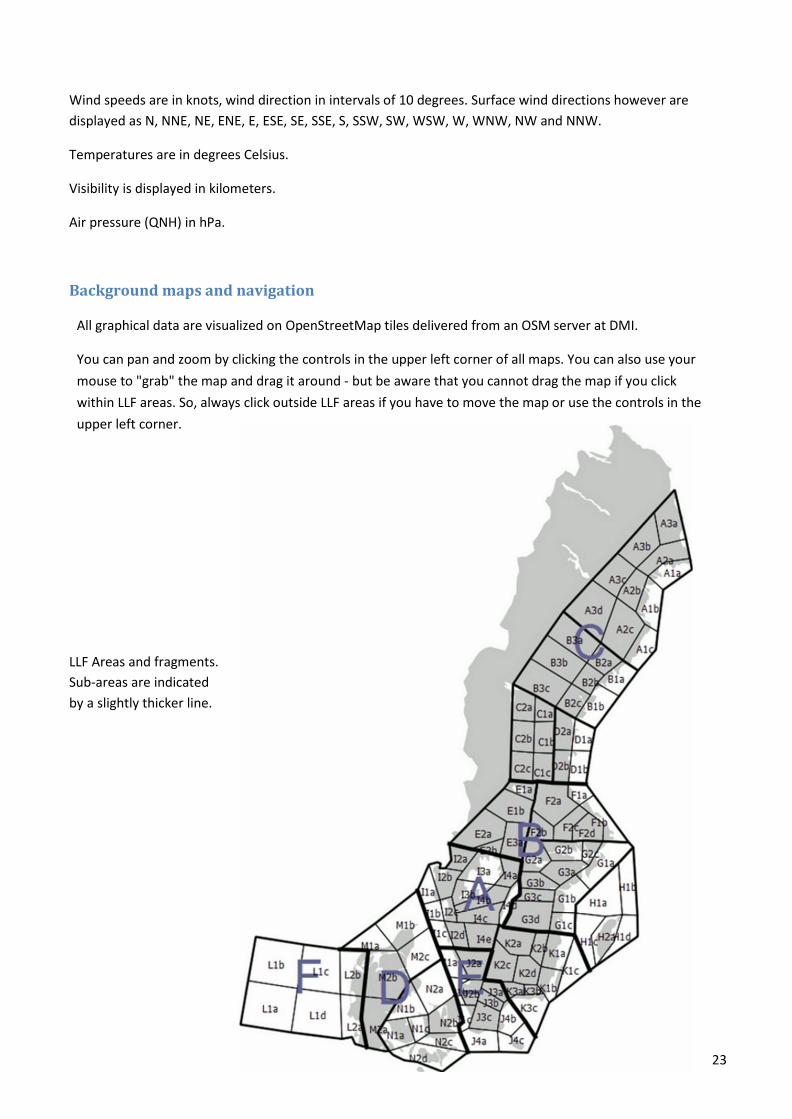
Background maps and navigation
All graphical data are visualized on OpenStreetMap tiles delivered from an OSM server at DMI.
You can pan and zoom by clicking the controls in the upper left corner of all maps. You can also use your mouse to "grab" the map and drag it around - but be aware that you cannot drag the map if you click within LLF areas. So, always click outside LLF areas if you have to move the map or use the controls in the upper left corner.
LLF Areas and fragments. Sub-areas are indicated by a slightly thicker line.
24
Run-down of the different parameters available in the LLF-forecast:
Forecast
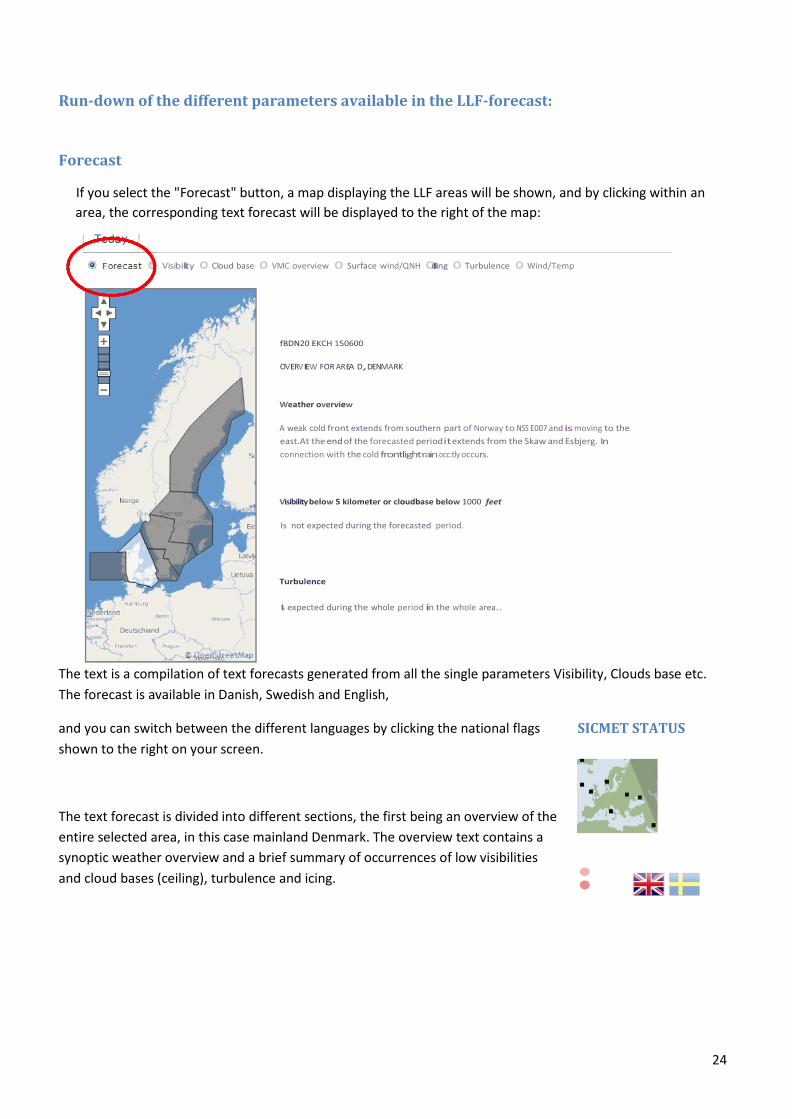
If you select the "Forecast" button, a map displaying the LLF areas will be shown, and by clicking within an area, the corresponding text forecast will be displayed to the right of the map:
The text is a compilation of text forecasts generated from all the single parameters Visibility, Clouds base etc. The forecast is available in Danish, Swedish and English,
and you can switch between the different languages by clicking the national flags shown to the right on your screen.
The text forecast is divided into different sections, the first being an overview of the entire selected area, in this case mainland Denmark. The overview text contains a synoptic weather overview and a brief summary of occurrences of low visibilities and cloud bases (ceiling), turbulence and icing.
SICMET STATUS
••
nd/QNH
Norway and
25
Then follows the detailed forecast for each sub-area. In this case where I have selected Denmark and the first detailed forecast is for "The Islands". In this forecast 8 sections covering Turbulence, Icing, Visibility/Weather/Clouds, Zero degree isotherm, Surface winds, High level winds/temperature, Lowest QNH and any additional information can be found.
The text is short and precise and relates weather parameters to so-called fragments, the smallest areas. Each fragment has a short-code name; the fragment covering Roskilde is named N2b,but in the text forecast this fragment is referenced as 2b,because the sub-area prefix is omitted. So, when looking at text forecast be aware of which sub-area the text is referencing. See page 5 for a description of areas, sub-areas and fragments and their naming practices. An overview map of all areas, sub-areas and fragments can be found on page 8.
Visibility
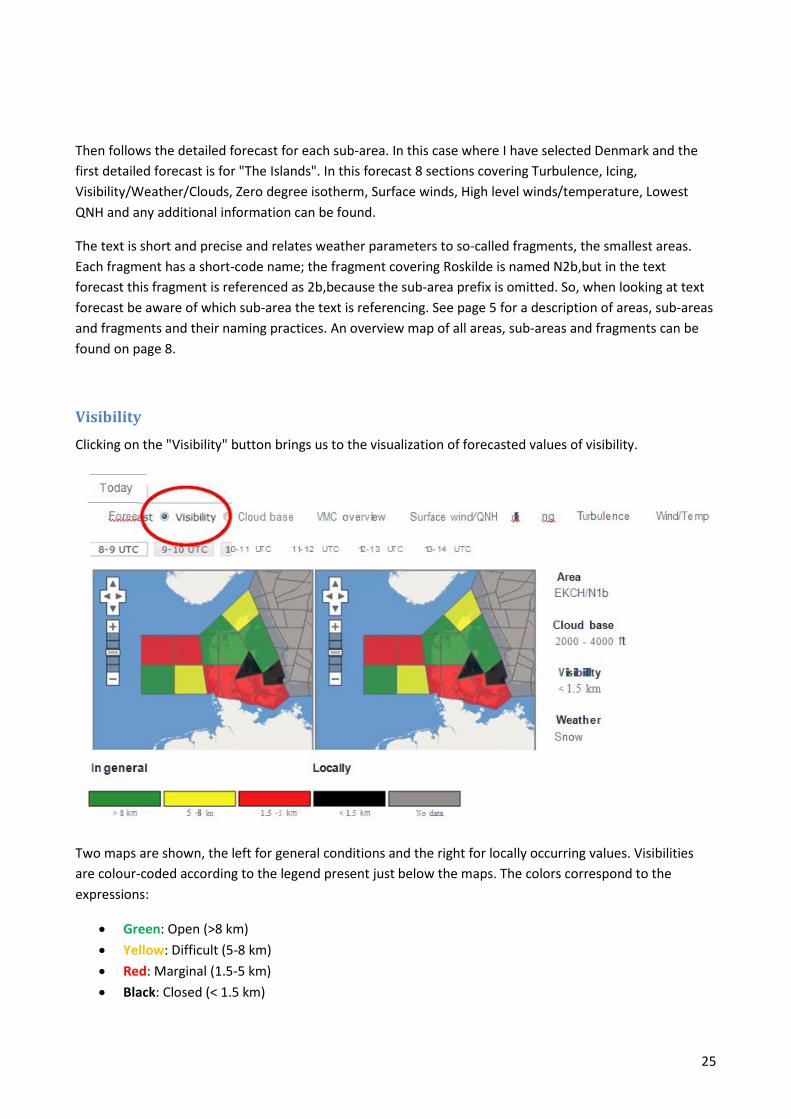
Clicking on the "Visibility" button brings us to the visualization of forecasted values of visibility.
Two maps are shown, the left for general conditions and the right for locally occurring values. Visibilities are colour-coded according to the legend present just below the maps. The colors correspond to the expressions:
• Green: Open (>8 km) • Yellow: Difficult (5-8 km) • Red: Marginal (1.5-5 km) • Black: Closed (< 1.5 km)
26
These expressions will be used in other areas as well.
The forecast shown above covers the period from 8 to 14 utc, and this period is divided into 6 time slices. Clicking the different time slice buttons, changes the content of the two maps below to match the selected time slice.
If you move the mouse pointer into the map, text info about the forecasted values of visibility, cloud base, weather and cloud top wi11 be displayed to the right of the two maps.
Cloud base
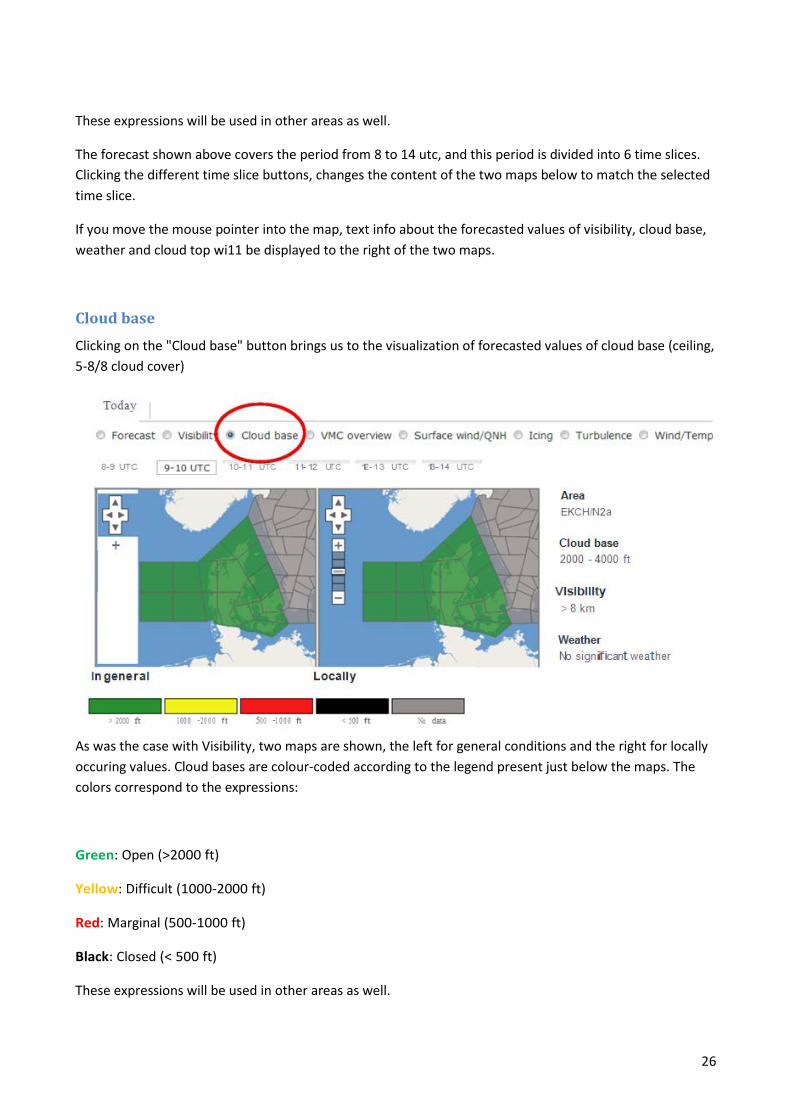
Clicking on the "Cloud base" button brings us to the visualization of forecasted values of cloud base (ceiling, 5-8/8 cloud cover)
As was the case with Visibility, two maps are shown, the left for general conditions and the right for locally occuring values. Cloud bases are colour-coded according to the legend present just below the maps. The colors correspond to the expressions:
Green: Open (>2000 ft)
Yellow: Difficult (1000-2000 ft)
Red: Marginal (500-1000 ft)
Black: Closed (< 500 ft)
These expressions will be used in other areas as well.
27
The forescast shown above covers the period from 8 to 14 utc, and this period is divided into 6 time slices. Clicking the different time slice buttons, changes the content of the two maps below to match the selected time slice.
If you move the mouse pointer into the map, text info about the forecasted values of visibility, cloud base, weather and cloud top will be displayed to the right of the two maps.
In the case above we see that the area covering Roskilde and Copenhagen the general color is green indicating that in general visibility is >8 km and cloud base >2000 ft. Under "Locally" visibility <1.5 km corresponding to black whereas cloud base 500-1000 ft corresponding to red. Black is selected, as it is the lowest forecasted value. By this we see that VMC overview visualizes the lowest expected category according to the terms Open, Difficult, Marginal, Closed
Surface wind
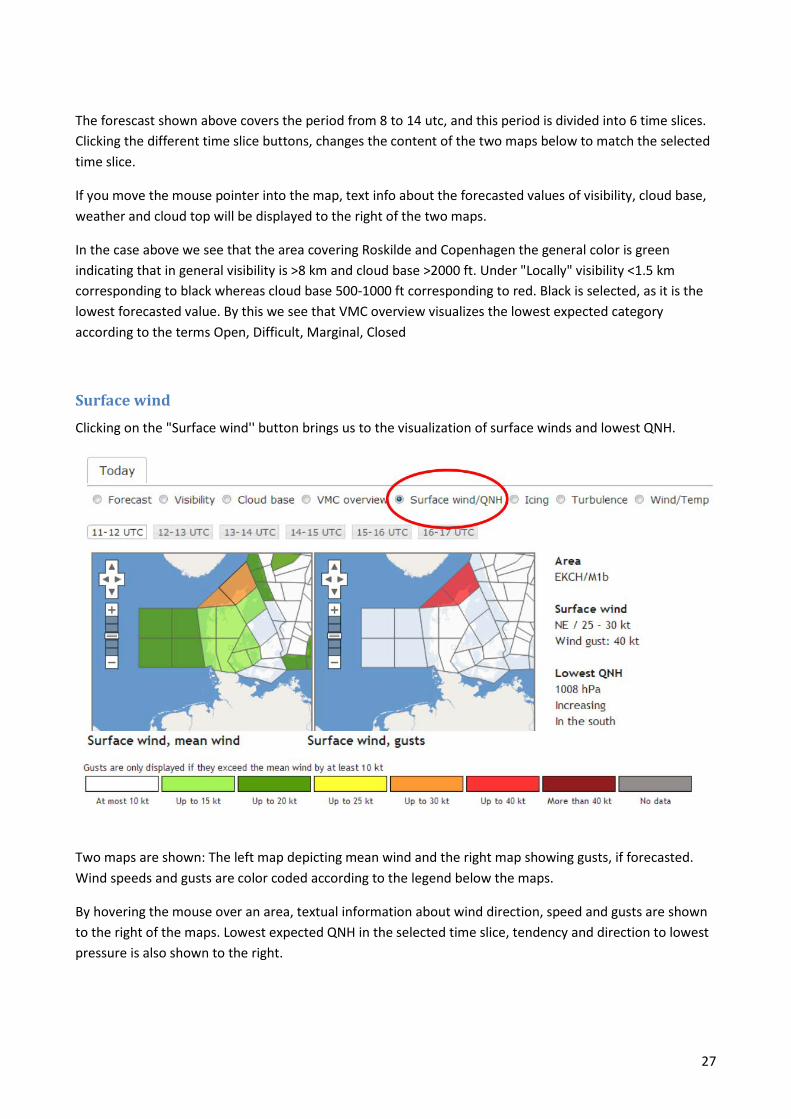
Clicking on the "Surface wind'' button brings us to the visualization of surface winds and lowest QNH.
Two maps are shown: The left map depicting mean wind and the right map showing gusts, if forecasted. Wind speeds and gusts are color coded according to the legend below the maps.
By hovering the mouse over an area, textual information about wind direction, speed and gusts are shown to the right of the maps. Lowest expected QNH in the selected time slice, tendency and direction to lowest pressure is also shown to the right.
28
The forecast shown above covers the period from 11 to 17 utc, and this period is divided into 6 time slices. Clicking the different time slice buttons, changes the content of the two maps below to match the selected time slice.
Icing
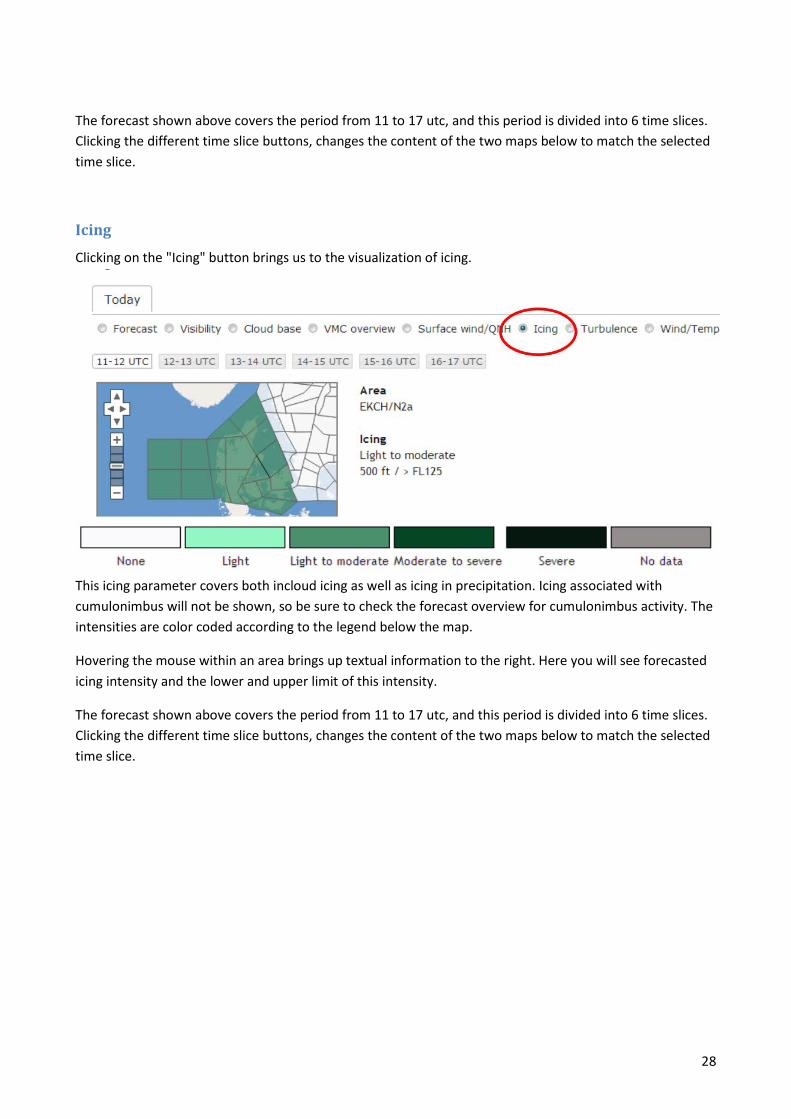
Clicking on the "Icing" button brings us to the visualization of icing.
This icing parameter covers both incloud icing as well as icing in precipitation. Icing associated with cumulonimbus will not be shown, so be sure to check the forecast overview for cumulonimbus activity. The intensities are color coded according to the legend below the map.
Hovering the mouse within an area brings up textual information to the right. Here you will see forecasted icing intensity and the lower and upper limit of this intensity.
The forecast shown above covers the period from 11 to 17 utc, and this period is divided into 6 time slices. Clicking the different time slice buttons, changes the content of the two maps below to match the selected time slice.
29
Turbulence
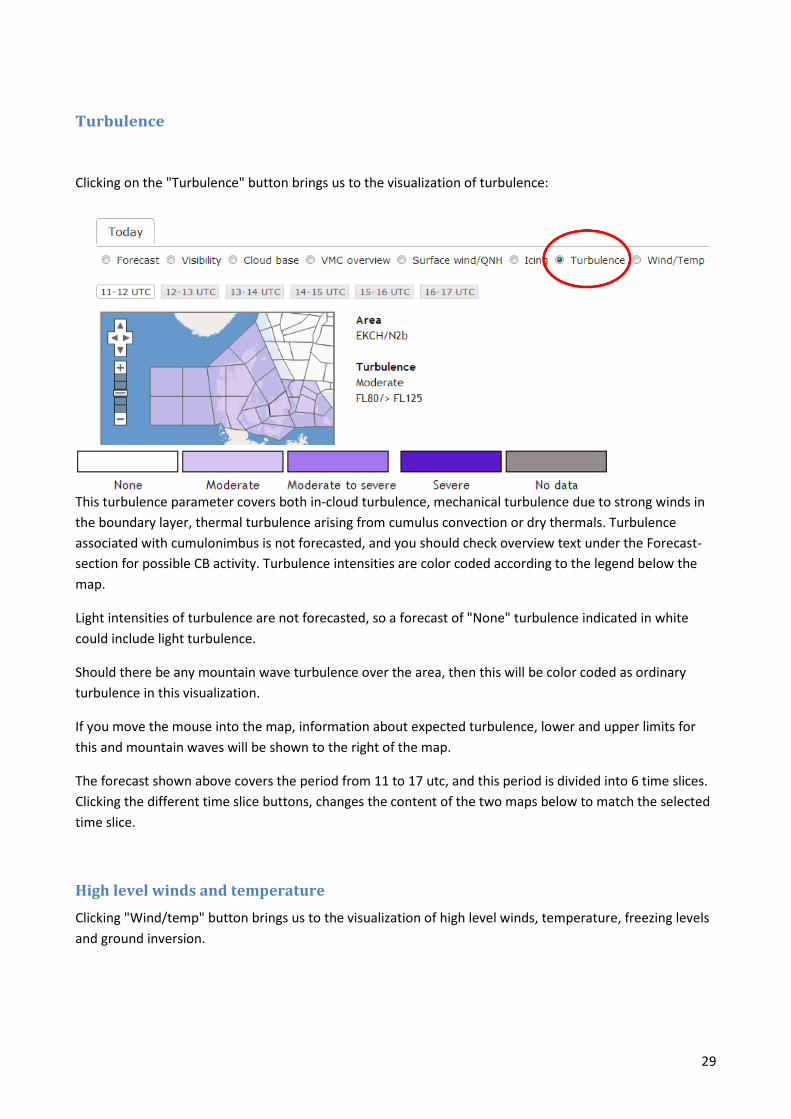
Clicking on the "Turbulence" button brings us to the visualization of turbulence:
This turbulence parameter covers both in-cloud turbulence, mechanical turbulence due to strong winds in the boundary layer, thermal turbulence arising from cumulus convection or dry thermals. Turbulence associated with cumulonimbus is not forecasted, and you should check overview text under the Forecast-section for possible CB activity. Turbulence intensities are color coded according to the legend below the map.
Light intensities of turbulence are not forecasted, so a forecast of "None" turbulence indicated in white could include light turbulence.
Should there be any mountain wave turbulence over the area, then this will be color coded as ordinary turbulence in this visualization.
If you move the mouse into the map, information about expected turbulence, lower and upper limits for this and mountain waves will be shown to the right of the map.
The forecast shown above covers the period from 11 to 17 utc, and this period is divided into 6 time slices. Clicking the different time slice buttons, changes the content of the two maps below to match the selected time slice.
High level winds and temperature
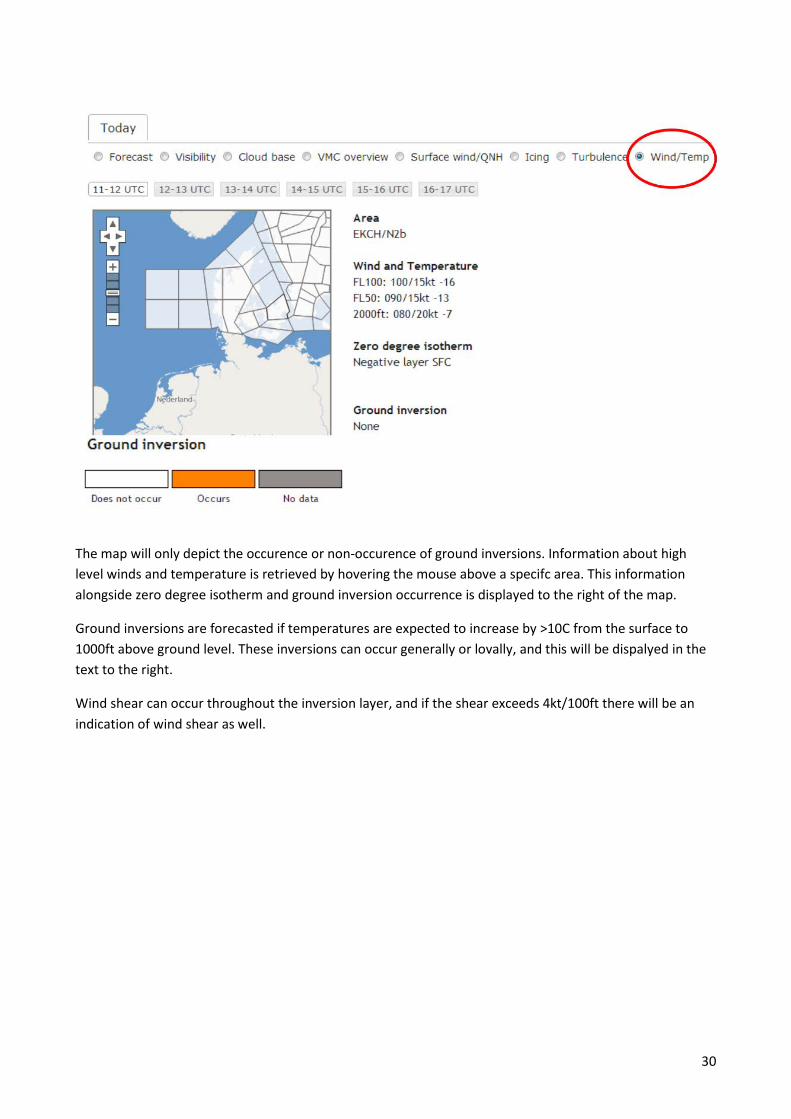
Clicking "Wind/temp" button brings us to the visualization of high level winds, temperature, freezing levels and ground inversion.
30
The map will only depict the occurence or non-occurence of ground inversions. Information about high level winds and temperature is retrieved by hovering the mouse above a specifc area. This information alongside zero degree isotherm and ground inversion occurrence is displayed to the right of the map.
Ground inversions are forecasted if temperatures are expected to increase by >10C from the surface to 1000ft above ground level. These inversions can occur generally or lovally, and this will be dispalyed in the text to the right.
Wind shear can occur throughout the inversion layer, and if the shear exceeds 4kt/100ft there will be an indication of wind shear as well.
31
Model data
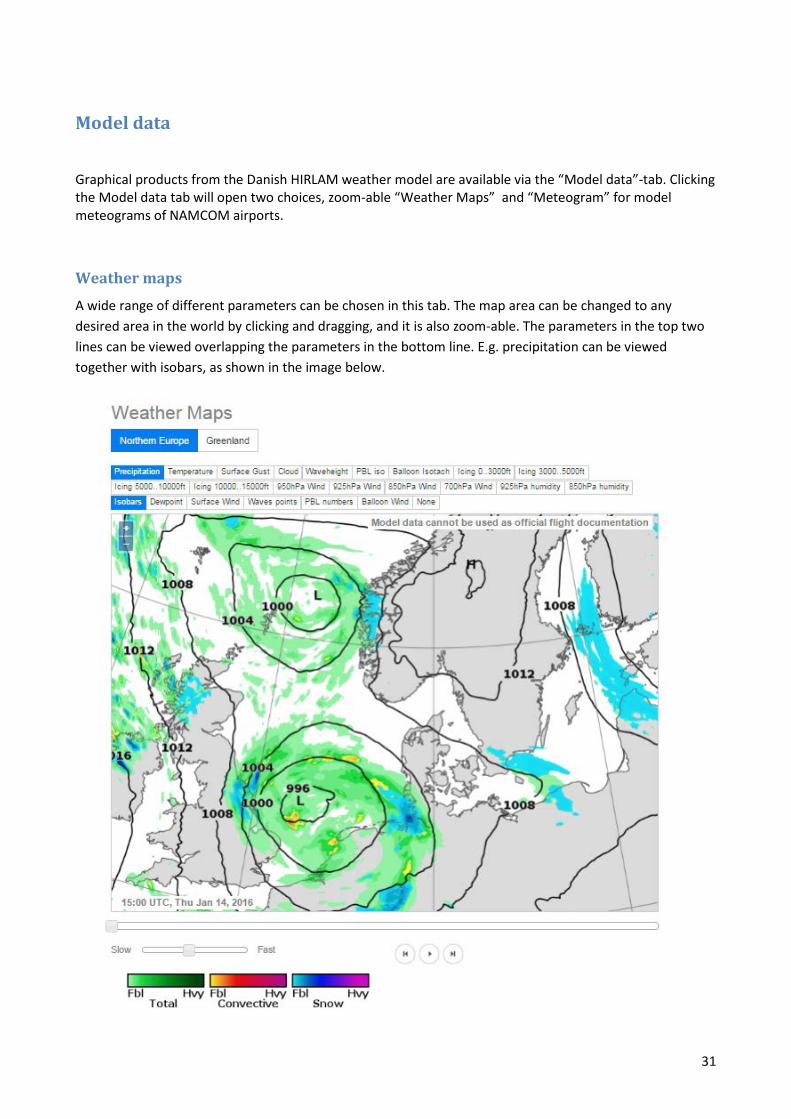
Graphical products from the Danish HIRLAM weather model are available via the “Model data”-tab. Clicking the Model data tab will open two choices, zoom-able “Weather Maps” and “Meteogram” for model meteograms of NAMCOM airports.
Weather maps
A wide range of different parameters can be chosen in this tab. The map area can be changed to any desired area in the world by clicking and dragging, and it is also zoom-able. The parameters in the top two lines can be viewed overlapping the parameters in the bottom line. E.g. precipitation can be viewed together with isobars, as shown in the image below.
32
Model data parameters
Precipitation The forecasted precipitation within each 1 hour time step is shown by selecting the “Precipitation” button.
The total precipitation intensity is coded in ranges of green, convective prec. is indicated by ranges of yellow/red, and snow intensity feeble/moderate/heavy is indicated turquoise/blue/purple.
The QNH is represented by black isolines in the precipitation chart.
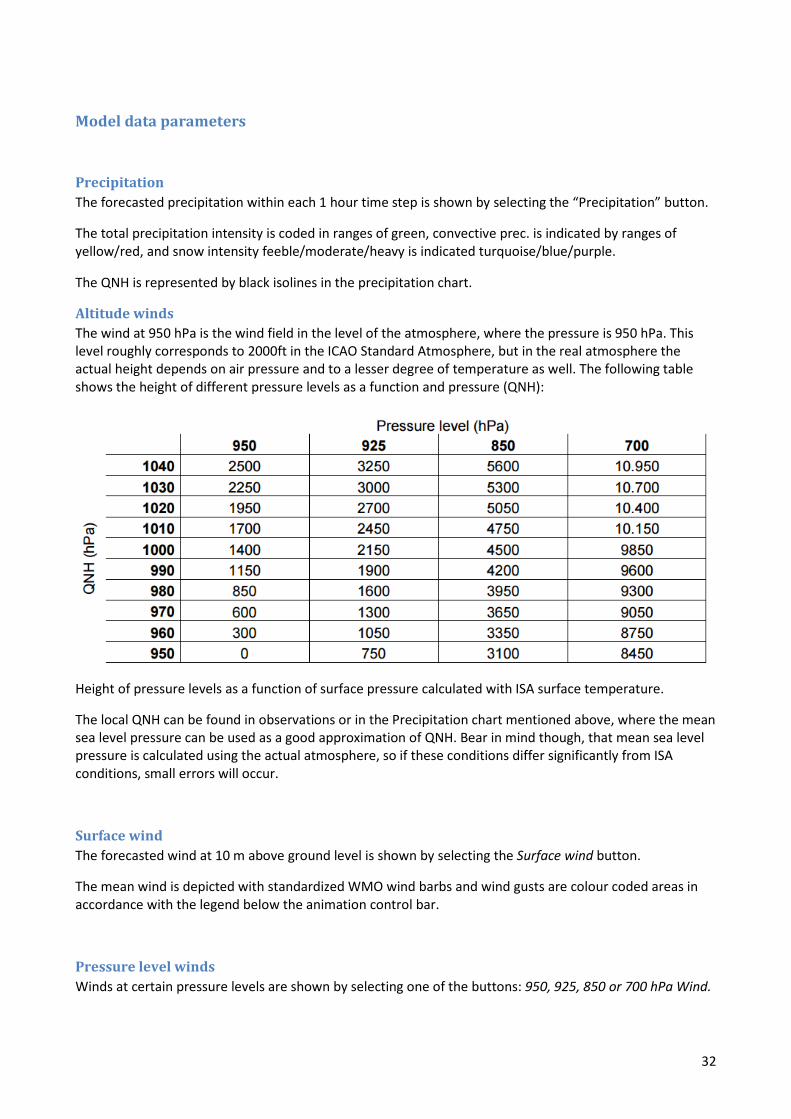
Altitude winds The wind at 950 hPa is the wind field in the level of the atmosphere, where the pressure is 950 hPa. This level roughly corresponds to 2000ft in the ICAO Standard Atmosphere, but in the real atmosphere the actual height depends on air pressure and to a lesser degree of temperature as well. The following table shows the height of different pressure levels as a function and pressure (QNH):
Height of pressure levels as a function of surface pressure calculated with ISA surface temperature.
The local QNH can be found in observations or in the Precipitation chart mentioned above, where the mean sea level pressure can be used as a good approximation of QNH. Bear in mind though, that mean sea level pressure is calculated using the actual atmosphere, so if these conditions differ significantly from ISA conditions, small errors will occur.
Surface wind The forecasted wind at 10 m above ground level is shown by selecting the Surface wind button.
The mean wind is depicted with standardized WMO wind barbs and wind gusts are colour coded areas in accordance with the legend below the animation control bar.
Pressure level winds Winds at certain pressure levels are shown by selecting one of the buttons: 950, 925, 850 or 700 hPa Wind.
33
The pressure levels correspond to certain altitudes in the ICAO standard atmosphere indicated with a text string below the time animation control bar.
Standardized WMO wind barbs show the wind speed and direction and the temperature is indicated by numbers.
Icing intensities and freezing level Forecasted icing intensities are shown in two intervals: Light to moderate and moderate to severe in accordance with the colour code:
The lowest freezing level is shown by alternating solid and dashed black lines, and whenever the freezing level is at the surface, this is indicated by black dots.
Cloud Mid-level cloud cover is shown in degrees of clear light green to dark green. High level clouds are represented by a more grey/bluish scale.
Temperature and dew point The 2m temperature is shown according to the colour label and blue digits, dew point is indicated by green digits.
Relative humidity at 925/850 hPa The relative humidity with the estimated cloud cover is shown for the two pressure levels. In the standard atmosphere these correspond to 3000ft and 5000ft resp. See the table above for adjusted altitude when the current atmosphere deviates from the standard atmosphere.
Height of planetary boundary level The height of the PBL is shown numerically in meter and graphically according to the legend.
Balloon winds The 10m wind is indicated numerically up to 11kt, and colour-coded up to 9 kt according to the colour-scale in the plot.
Wave and Sea surface temperature Significant waves and sea surface temperatures are shown for the two areas “Atlantic/North Sea” and “Faroe Islands”. SST is shown in red digits, waves are in colours and black digits outlined with a box.
34
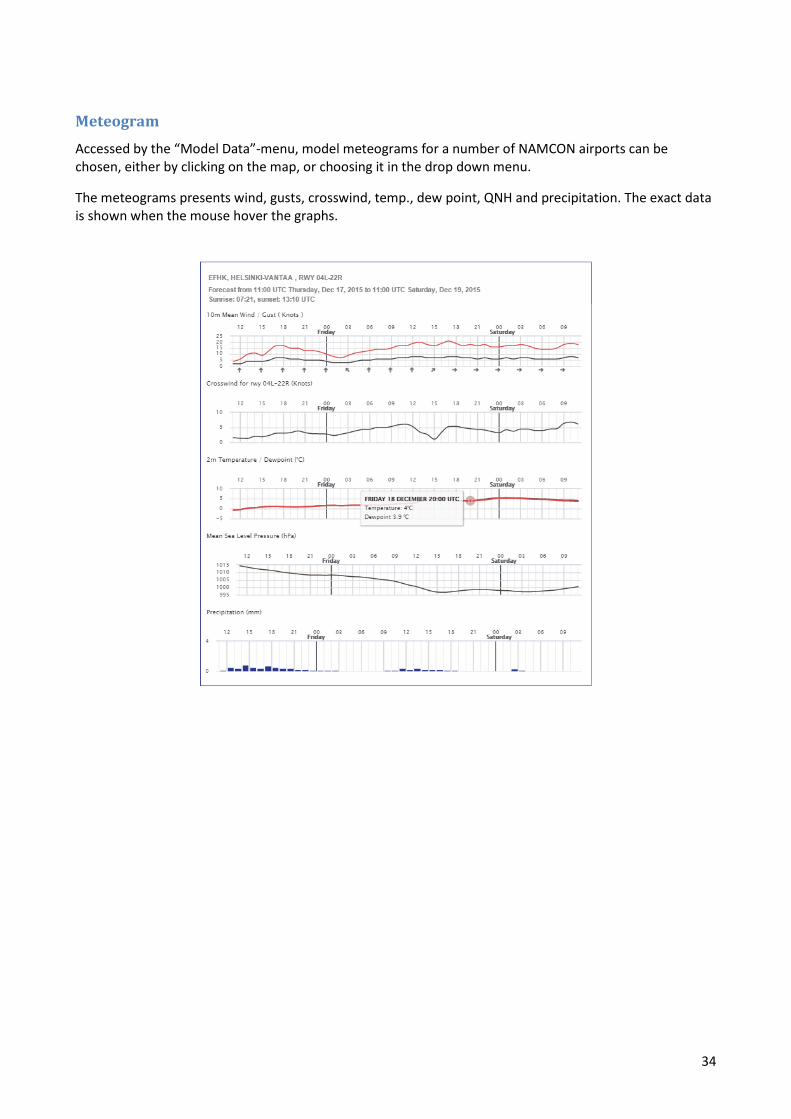
Meteogram
Accessed by the “Model Data”-menu, model meteograms for a number of NAMCON airports can be chosen, either by clicking on the map, or choosing it in the drop down menu.
The meteograms presents wind, gusts, crosswind, temp., dew point, QNH and precipitation. The exact data is shown when the mouse hover the graphs.
35
Info-menu
Contact
By clicking Contact, you will find contact info for queries about Northavimet.
Briefing and consultation
Contact info to the respective met office in the NAMCON region is found here.
User guide
This is where this manual is found.
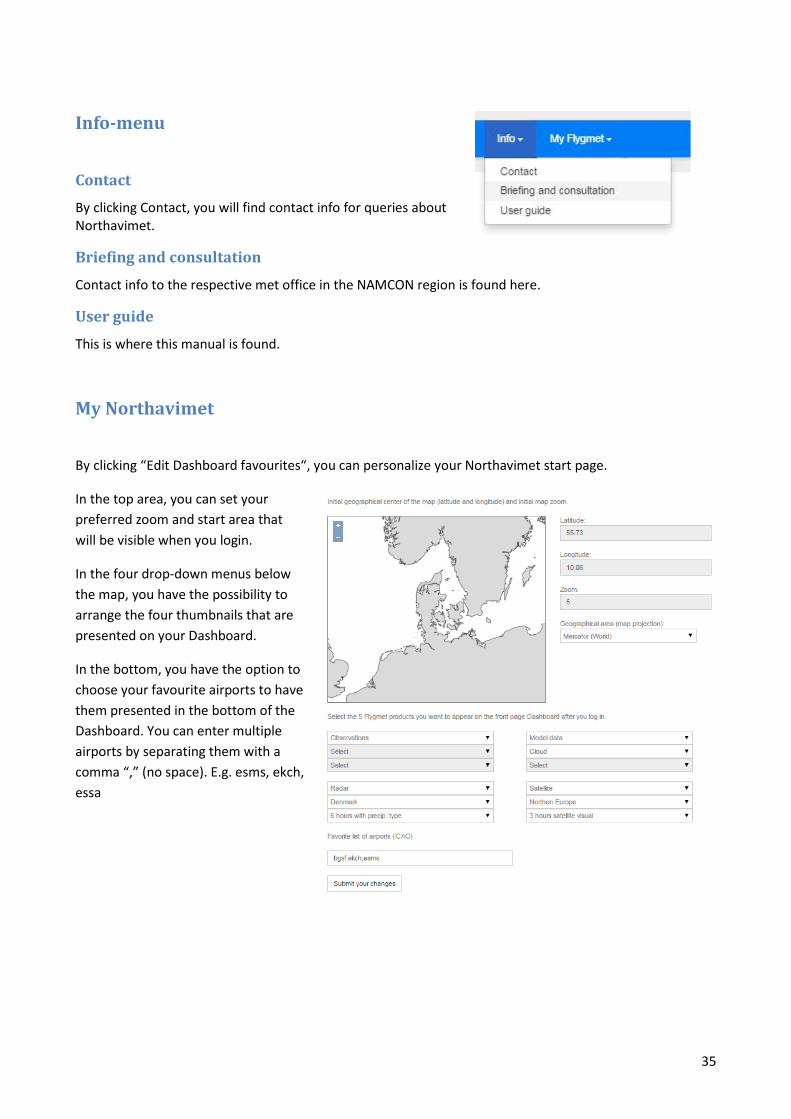
My Northavimet
By clicking “Edit Dashboard favourites“, you can personalize your Northavimet start page.
In the top area, you can set your preferred zoom and start area that will be visible when you login.
In the four drop-down menus below the map, you have the possibility to arrange the four thumbnails that are presented on your Dashboard.
In the bottom, you have the option to choose your favourite airports to have them presented in the bottom of the Dashboard. You can enter multiple airports by separating them with a comma “,” (no space). E.g. esms, ekch, essa
36
Appendix 1.List of supported FIRs for SIGMET visualization BGGL SONDRESTROM FIR BIRD REYKJAVIK FIR CZEG EDMONTON FIR CZQM MONCTON FIR CZQX GANDER FIR CZUL MONTREAL FIR CZVR VANCOUVER FIR CZWG WINNIPEG FIR CZYZ TORONTO FIR DAAA ALGER FIR DTTC TUNIS FIR EBBU BRUSSELS FIR EDGG LANGEN FIR EDMM MÜNCHEN FIR EDWW BREMEN FIR EETT TALLIN FIR EFIN FINLAND FIR EGGX SHANWICK OAC EGJJ JERSEY EGPX SCOTTISH FIR EGTT LONDON FIR EHAA AMSTERDAM FIR EISN SHANNON FIR EKDK KØBENHAVN FIR ENOB BODØ OAC ENOR NORWAY FIR EPWW WARSZAWA FIR ESAA SWEDEN FIR EVRR RIGA FIR EYVL VILNIUS FIR GCCC CANARIAS FIR GMMM CASABLANCA GOOO DAKAR FIR HECC CAIRO FIR HLLL TRIPOLI FIR HSSS KHARTOUM LAAA TIRANA FIR LBSR SOFIA FIR LCCC NICOSIA FIR LDZO ZAGREB FIR LECB BARCELONA FIR LECM MADRID FIR LFBB BORDEAUX FIR LFEE REIMS FIR LFFF PARIS FIR LFMM MARSEILLE FIR LFRR BREST FIR LGGG ATHINAI FIR LHCC BUDAPEST FIR LIBB BRINDISI FIR
LIMM MILANO FIR LIRR ROMA FIR LJLA LJUBLJANA FIR LKAA PRAHA FIR LLLL TEL-AVIV FIR LMMM MALTA FIR LOVV WIEN FIR LPPC LISBOA FIR LPPO SANTA MARIA OCEANIC FIR LQSB SARAJEVO FIR LRBB BUCURESTI FIR LSAS SWITZERLAND FIR LTAA ANKARA FIR LTBB ISTANBUL FIR LUUU CHISINAU FIR LWSS SKOPJE FIR LYBA BEOGRAD FIR LZBB BRATISLAVA FIR OBBB BAHRAIN FIR OEJD JEDDAH FIR OIIX TEHERAN FIR OJAC AMMAN FIR OKAC KUWAIT FIR OLBB BEIRUT FIR OMAE UAE FIR OOMM MUSCAT FIR ORBB BAGHDAD FIR OSTT DAMASCUS FIR OYSC SANA'A FIR UDDD YEREVAN FIR UGGG TBILISI/LOCHINI UKBV KIEV FIR UKDV DNIPROPETROVSK FIR UKFV SIMFEROPOL FIR UKLV L'VIV FIR UKOV ODESA FIR ULAA ARKHANGELSK/TALAGI ULAM NARYAN-MAR ULKK KOTLAS ULLL ST-PETERBURG FIR ULMM MURMANSK ULWW VOLOGDA UMKK KALININGRAD/KHRABROVO UMMV MINSK FIR URRV ROSTOV FIR UUWV MOSKVA FIR