Embed Size (px)
Citation preview
North Whitfield County Roadway Corridor Study
Report #3: Summary and Implementation Plan
MA Project 11501
September 22, 2011
Prepared For: Greater Dalton Metropolitan Planning Organization
Prepared By: Moreland Altobelli Associates, Inc. 2211 Beaver Ruin Road Suite 190 Norcross, GA 30071 (770) 263-5945

© 2011 Greater Dalton Metropolitan Planning Organization (GDMPO). All rights reserved. The contents of this publication reflect the views of the author(s), who is (are) responsible for the facts and accuracy of the data presented herein. The opinions, findings, and conclusions of this publication are those of the author(s) and do not necessarily reflect the official views or policies of those of the GDMPO. This publication does not constitute a standard, specification, or regulation.
North Whitfield County — Roadway Corridor Study
22-Sep-11 ii
Table of Contents 1.0 Introduction ............................................................................. 1 1.1 Summary of Previous Reports ................................................................. 1 1.2 Purpose of this report ............................................................................... 2 1.3 Organization of the Report ...................................................................... 2 2.0 Implementation Plan .............................................................. 4 2.1 Short Term Implementation Plan ............................................................ 6 2.2 Medium Term Implementation Plan ....................................................... 6 2.3 Long Term Implementation Plan ............................................................. 8 3.0 Conclusion ............................................................................. 11
Appendix A. Benefit Cost Worksheets ................................................ A
Appendix B. Highway Capacity Analysis Worksheets ....................... B
North Whitfield County — Roadway Corridor Study
22-Sep-11 iii
Table of Figures Figure 1: Roadways under Study ............................................................................................... 3 Figure 2: Proposed Improvements ............................................................................................ 5
Table of Tables Table 1: Implementation Plan, by Priority ................................................................................. 4 Table 2: Short Term Projects ....................................................................................................... 6 Table 3: Medium Term Projects .................................................................................................. 7 Table 4: Long Term Projects ....................................................................................................... 9 Table 5: Implementation Plan .................................................................................................. 12
North Whitfield County — Roadway Corridor Study
22-Sep-11 1
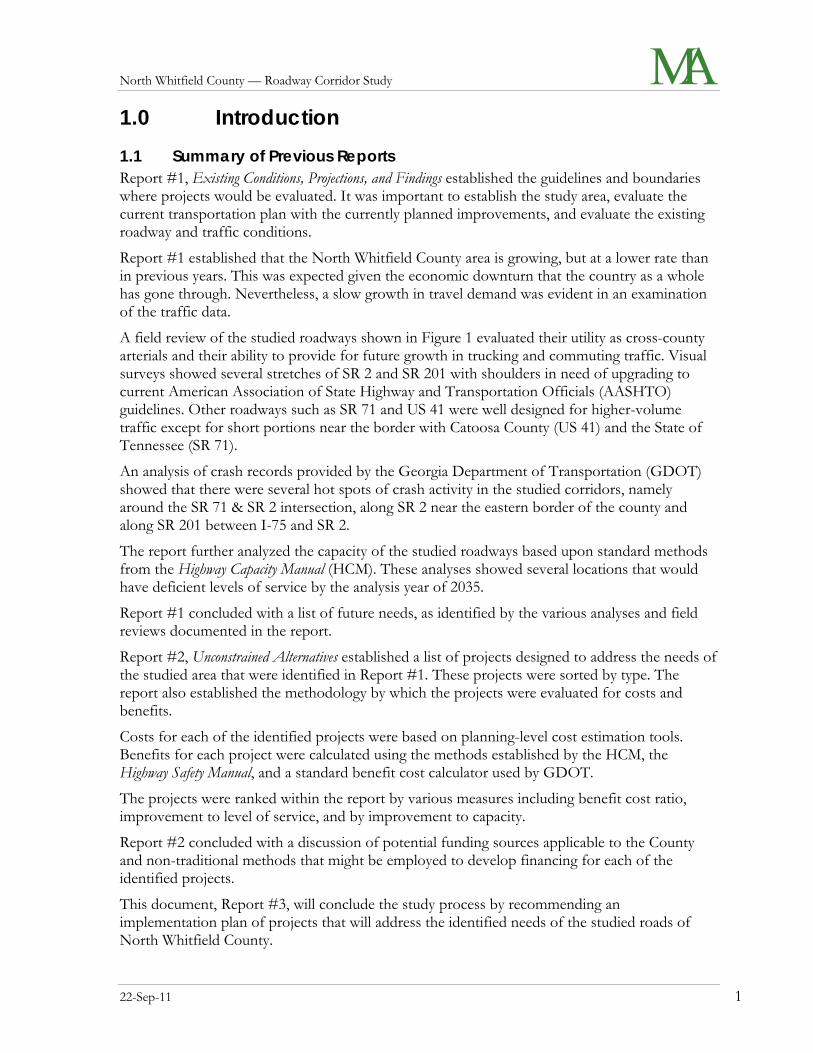
1.0 Introduction 1.1 Summary of Previous Reports Report #1, Existing Conditions, Projections, and Findings established the guidelines and boundaries where projects would be evaluated. It was important to establish the study area, evaluate the current transportation plan with the currently planned improvements, and evaluate the existing roadway and traffic conditions.
Report #1 established that the North Whitfield County area is growing, but at a lower rate than in previous years. This was expected given the economic downturn that the country as a whole has gone through. Nevertheless, a slow growth in travel demand was evident in an examination of the traffic data.
A field review of the studied roadways shown in Figure 1 evaluated their utility as cross-county arterials and their ability to provide for future growth in trucking and commuting traffic. Visual surveys showed several stretches of SR 2 and SR 201 with shoulders in need of upgrading to current American Association of State Highway and Transportation Officials (AASHTO) guidelines. Other roadways such as SR 71 and US 41 were well designed for higher-volume traffic except for short portions near the border with Catoosa County (US 41) and the State of Tennessee (SR 71).
An analysis of crash records provided by the Georgia Department of Transportation (GDOT) showed that there were several hot spots of crash activity in the studied corridors, namely around the SR 71 & SR 2 intersection, along SR 2 near the eastern border of the county and along SR 201 between I-75 and SR 2.
The report further analyzed the capacity of the studied roadways based upon standard methods from the Highway Capacity Manual (HCM). These analyses showed several locations that would have deficient levels of service by the analysis year of 2035.
Report #1 concluded with a list of future needs, as identified by the various analyses and field reviews documented in the report.
Report #2, Unconstrained Alternatives established a list of projects designed to address the needs of the studied area that were identified in Report #1. These projects were sorted by type. The report also established the methodology by which the projects were evaluated for costs and benefits.
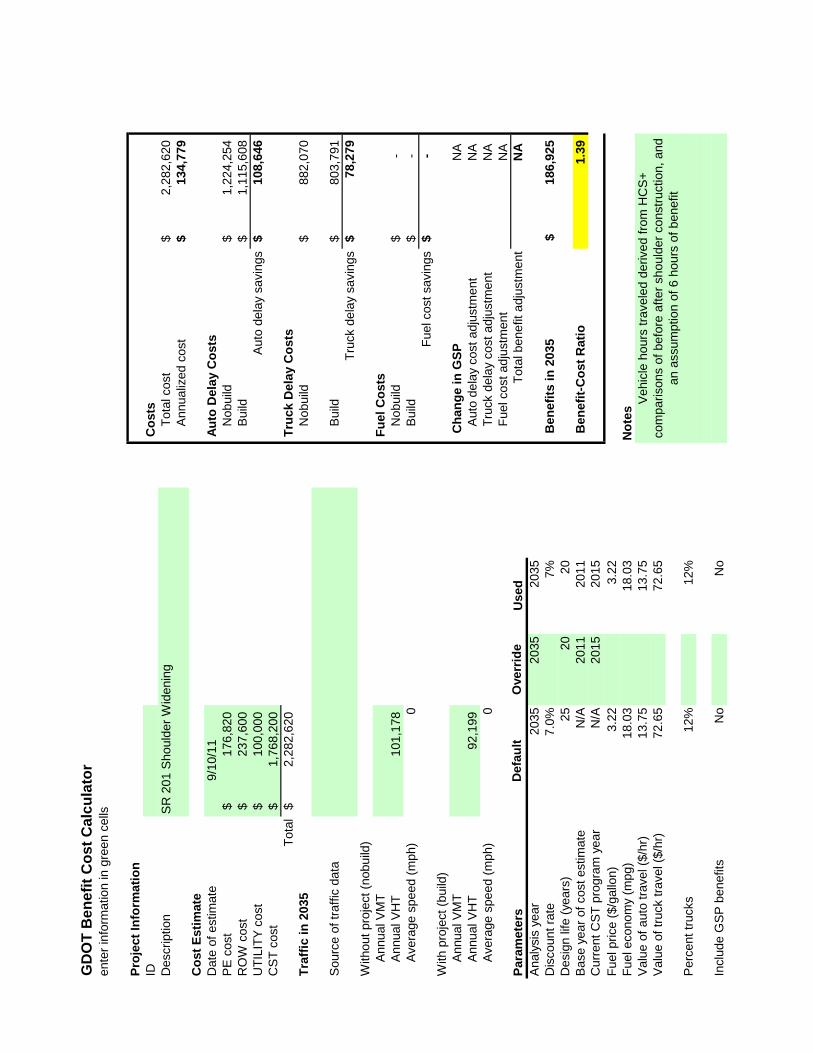
Costs for each of the identified projects were based on planning-level cost estimation tools. Benefits for each project were calculated using the methods established by the HCM, the Highway Safety Manual, and a standard benefit cost calculator used by GDOT.
The projects were ranked within the report by various measures including benefit cost ratio, improvement to level of service, and by improvement to capacity.
Report #2 concluded with a discussion of potential funding sources applicable to the County and non-traditional methods that might be employed to develop financing for each of the identified projects.
This document, Report #3, will conclude the study process by recommending an implementation plan of projects that will address the identified needs of the studied roads of North Whitfield County.
North Whitfield County — Roadway Corridor Study
22-Sep-11 2
1.2 Purpose of this report The purpose of this report is to provide the Greater Dalton Metropolitan Planning Organization (GDMPO) a list of recommended projects which will improve the potential capacity of the studied roadways in order to attract development opportunities in northern Whitfield County. Along with the recommendations will be an implementation plan which will address the short, medium, and long term strategy for constructing the projects in question.
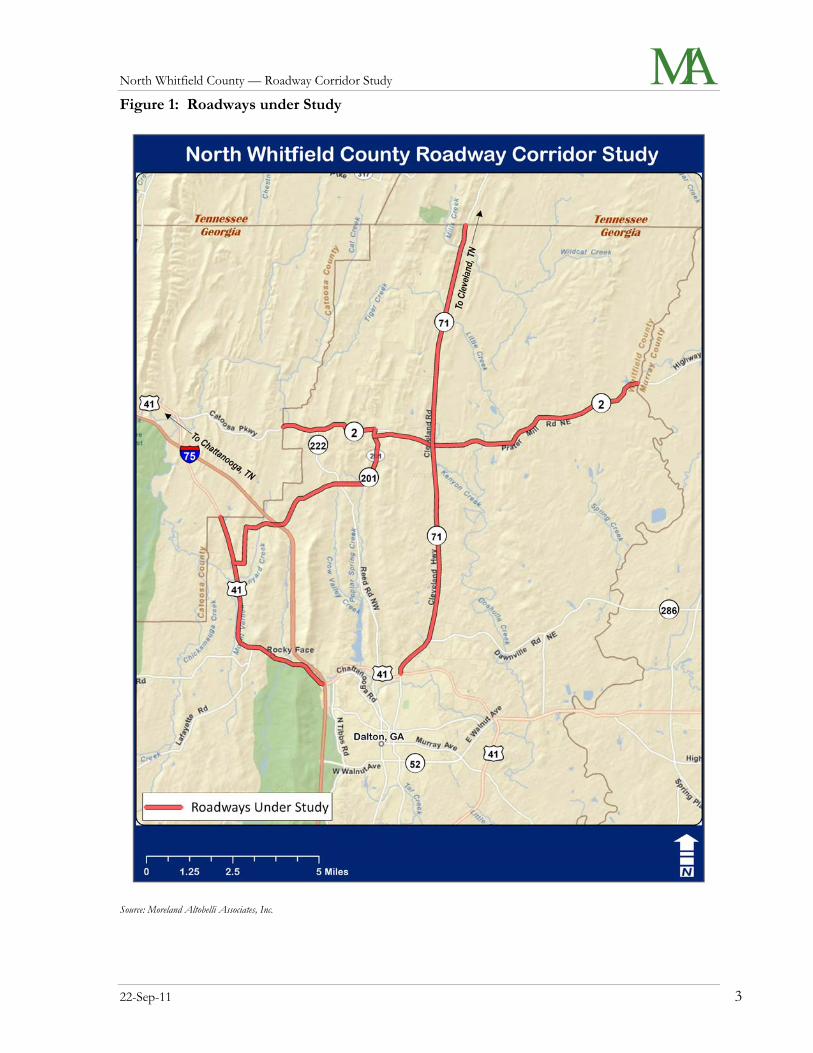
The studied roadways have been identified as major corridors for traffic flows to and from Hamilton and Bradley Counties in Tennessee and Catoosa and Murray Counties in Georgia. The impetus for this study is the anticipated growth in traffic along these corridors that will result from the development of major employment centers in Tennessee, such as the Volkswagen Assembly Plant in Hamilton County and the Wacker Manufacturing Plant in Bradley County. The roadways under study are the following: State Route 2 (SR 2), from Murray County to Catoosa County; State Route 201 (SR 201), from State Route 2 to US Highway 41; State Route 71 (SR 71), from the North Dalton Bypass to the Georgia/Tennessee State line; and US Highway 41 (US 41) from Catoosa County line to Interstate 75. Figure 1: Roadways under Study illustrates the project study area.
1.3 Organization of the Report Moreland Altobelli Associates, Inc. (MA) developed an existing conditions analysis and created a report entitled North Whitfield County Corridor Study: Existing Conditions, Projections, and Findings. The report was published on July 11, 2011 and reviewed by the GDMPO. Report #2, entitled North Whitfield County Corridor Study: Unconstrained Alternatives is being submitted simultaneously with this report.
This report is the third in a series of three and will present a series of recommended improvements, their costs, benefits, and an implementation plan.
North Whitfield County — Roadway Corridor Study
22-Sep-11 3
Figure 1: Roadways under Study
Source: Moreland Altobelli Associates, Inc.

North Whitfield County — Roadway Corridor Study
22-Sep-11 4
2.0 Implementation Plan Whitfield County has finite resources and must spend the tax dollars it accrues wisely. Thus an implementation plan for deploying the projects as recommended in order to justify the expenditures required.
Table 1: Implementation Plan, by Priority, lists all of the improvements that were examined during the second phase of the corridor study and are detailed in Report #2, Unconstrained Alternatives. With the exception of project number 16—the widening of SR 2 from SR 201 to SR 71—all examined projects are recommended for inclusion in the short, medium, and long range plans.
Table 1: Implementation Plan, by Priority
No. Location Type Cost (Millions)
B/C Priority
Implementation Schedule
2 SR 201 Shoulder $2.28 1.39 1 Short 7 SR 201 Restriping $0.11 - 2 Short
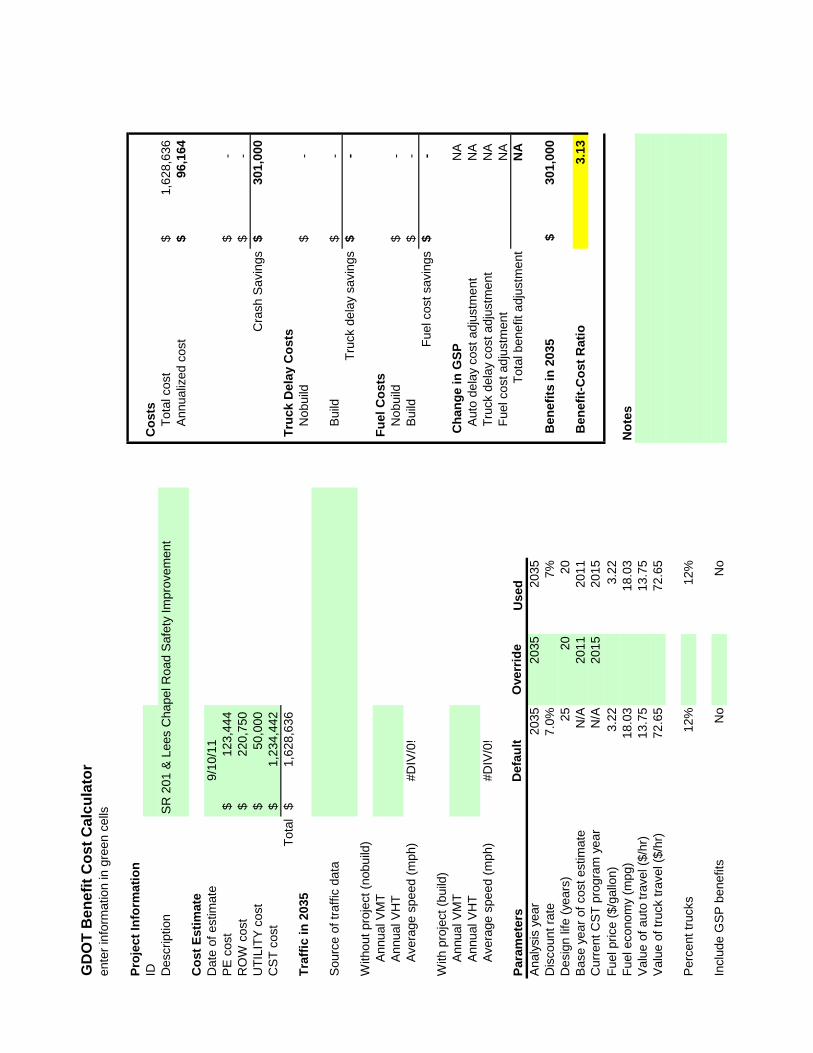
9 SR 201, Lees Chapel Safety $1.63 3.13 3 Short
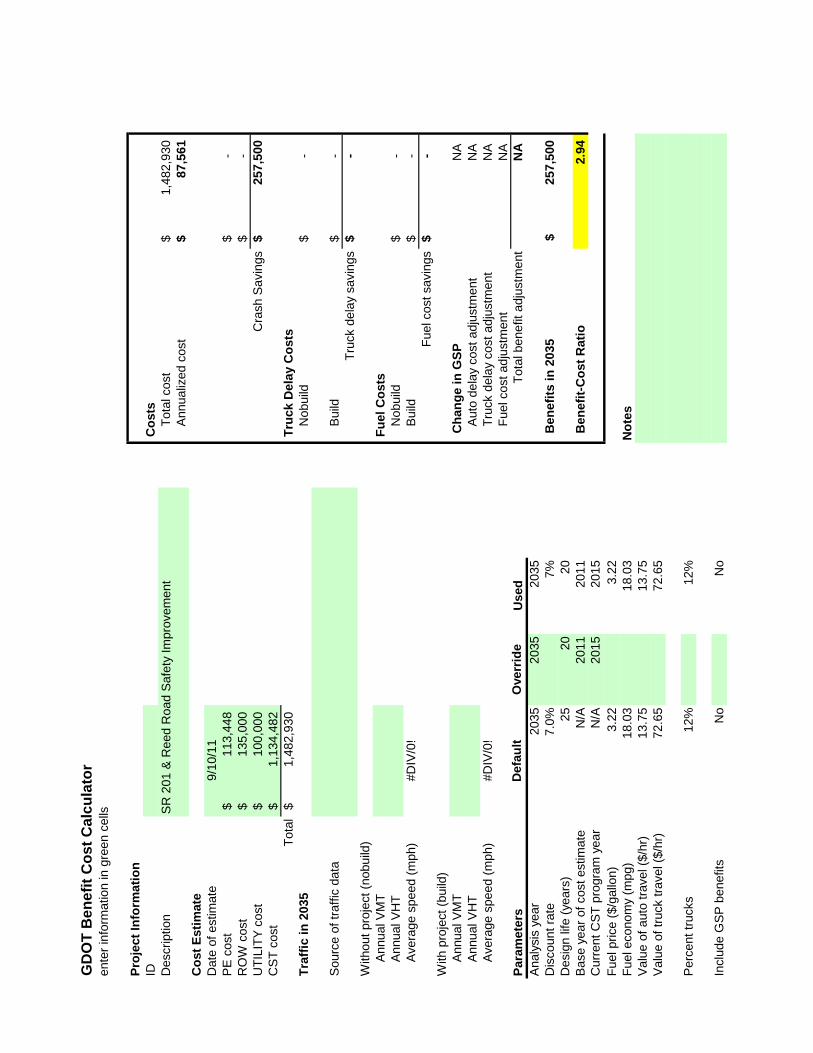
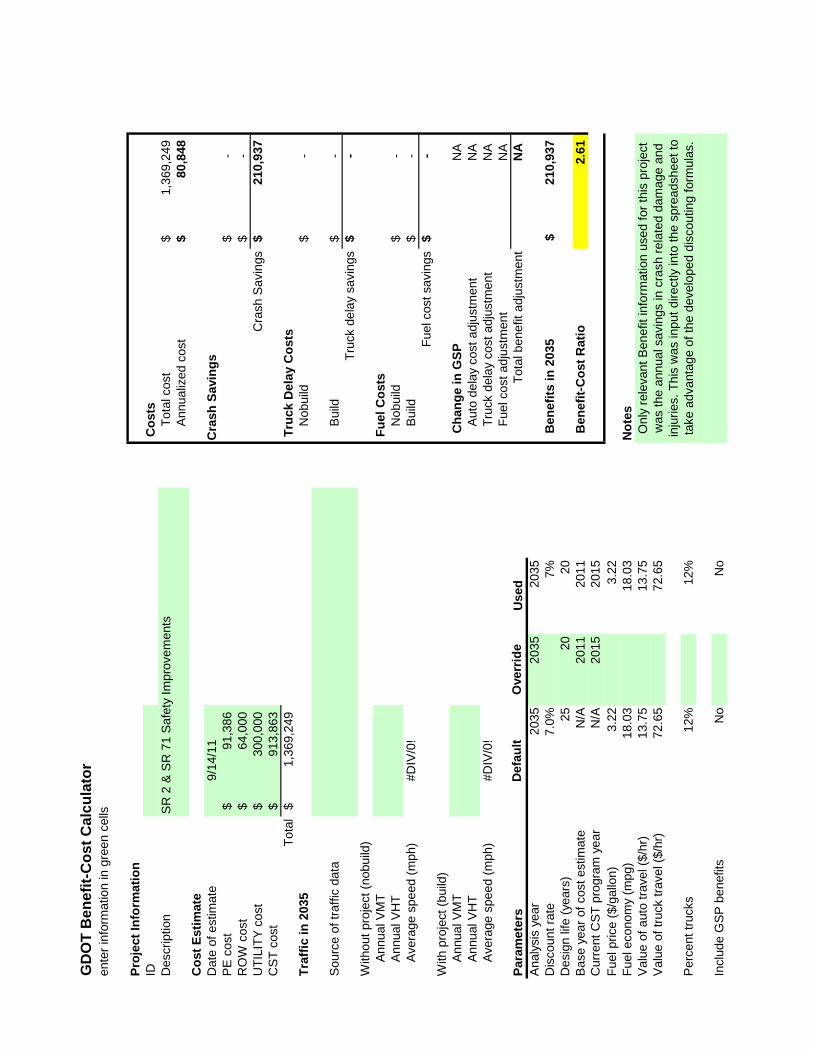
12 SR 71, SR 2 Safety $1.37 2.61 4 Medium 11 SR 201, I-75 Safety $1.70 5.53 5 Medium 10 SR 201, Reed Safety $1.48 2.94 6 Medium
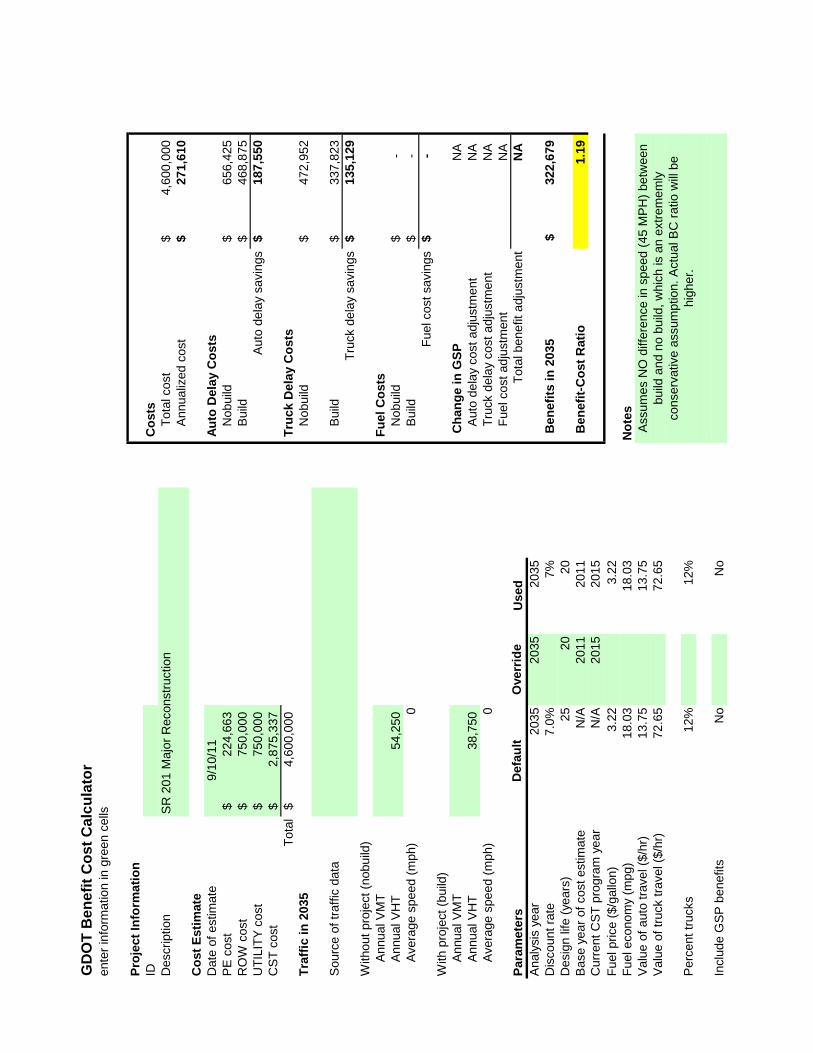
13 SR 201 Major Reconstruction $4.60 1.19 7 Medium
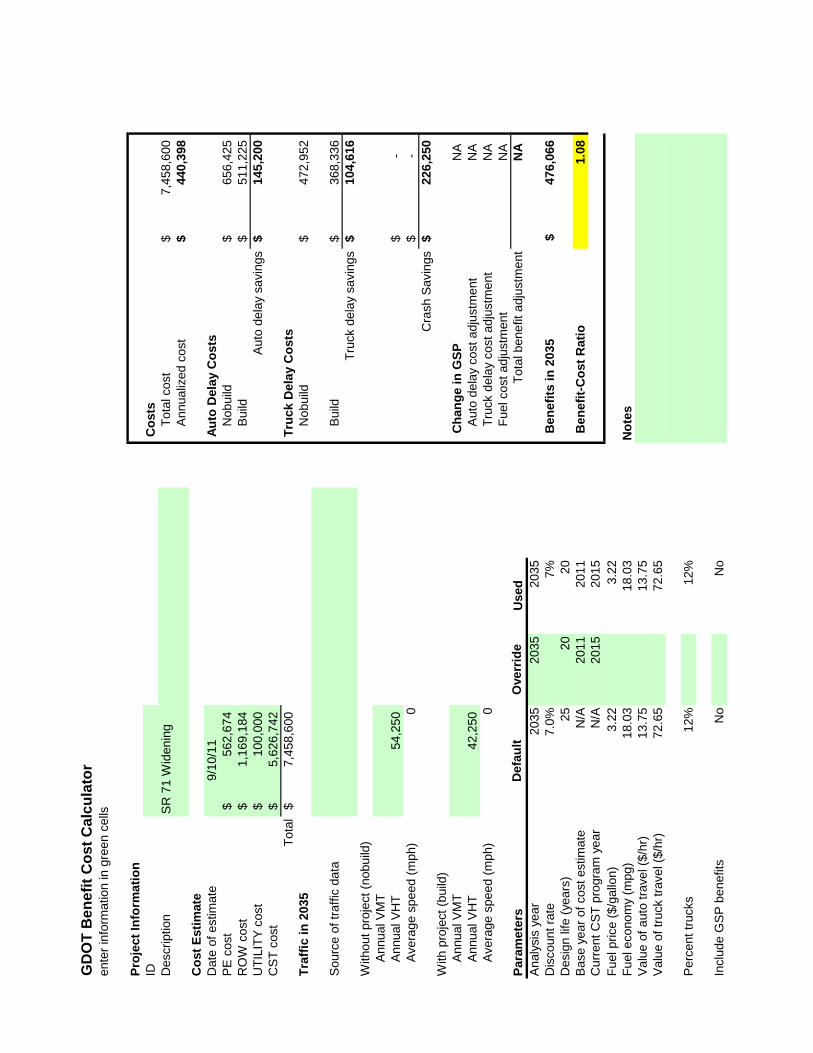
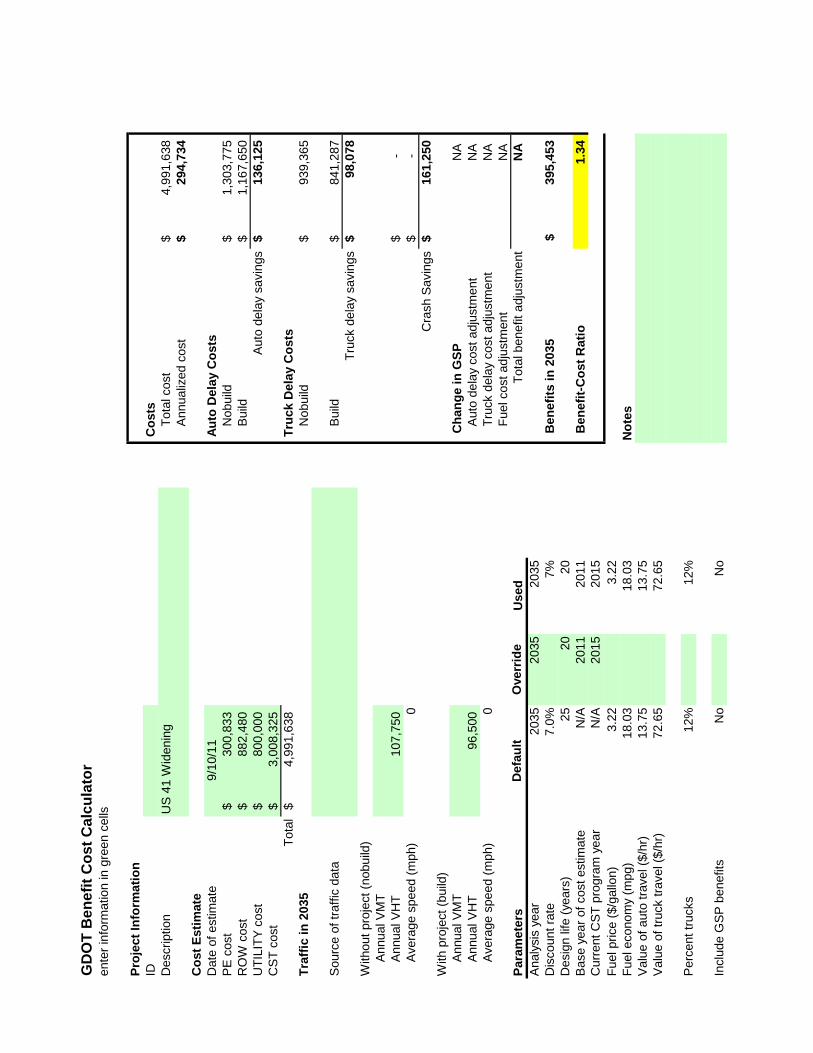
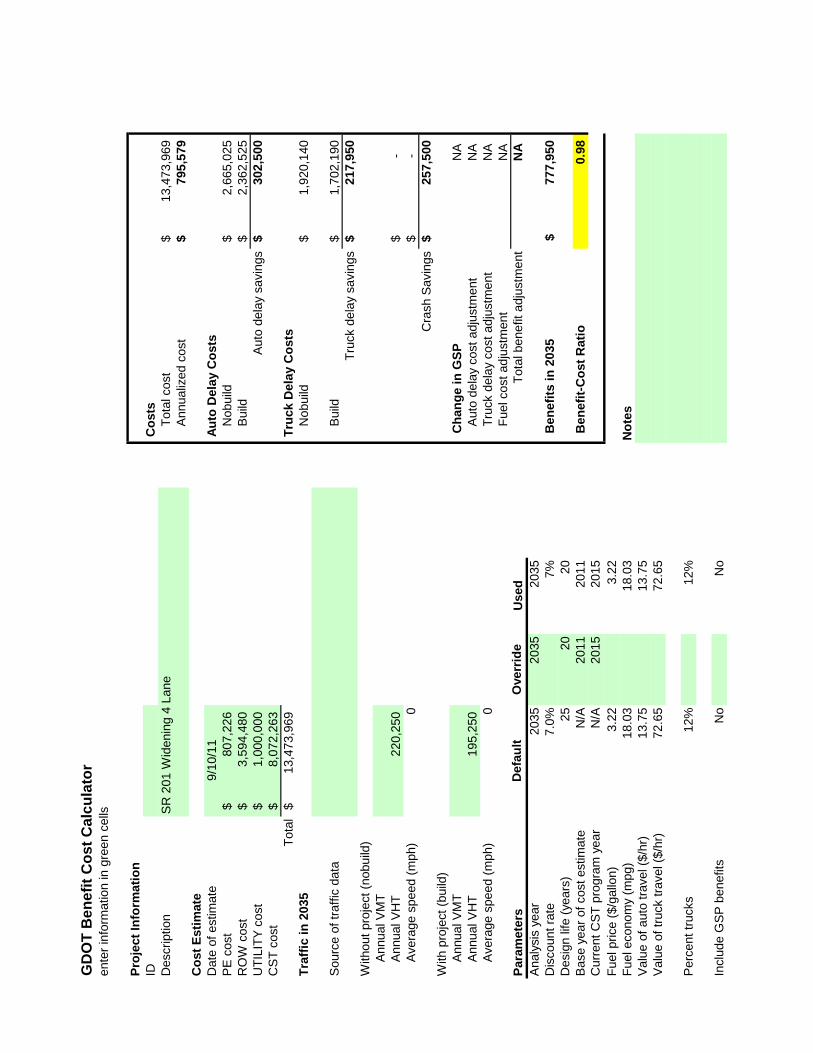
15 US 41 Widening $4.99 1.34 8 Long 14 SR 71 Widening $7.46 1.08 9 Long 17 SR 201 - 4 lane Widening $13.47 0.98 10‡ Long 18 SR 201 - 3 Lane Widening $5.40 0.99 10‡ Long
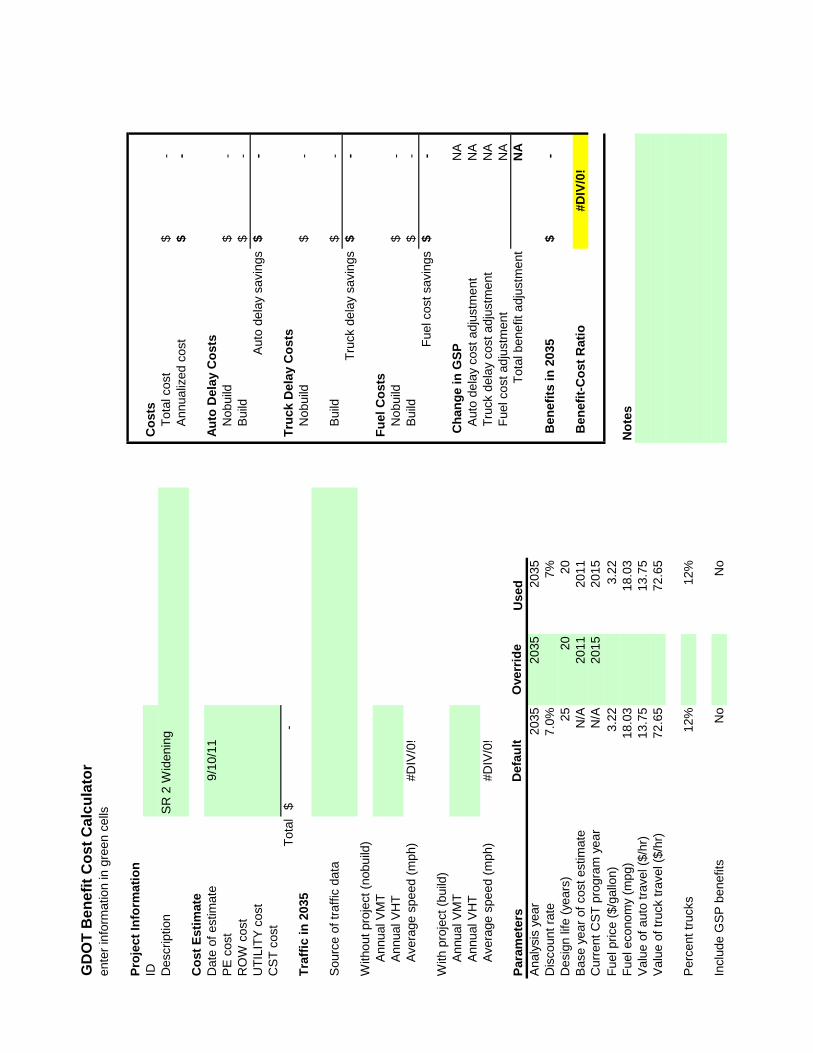
1 SR 2 Shoulder $2.41 0.99 11 Long 16 SR 2 Widening $7.69 0.79 12 -
3 SR 2 Resurfacing $2.55 - M1† Medium 4 SR 71 Resurfacing $1.82 - M2† Medium 5 US 41 Resurfacing $6.41 - M3† Medium 8 US 41 Bicycle $0.26 - M4† Short 6 SR 201 Resurfacing $1.71 - M5† Medium
Source: Moreland Altobelli Associates, Inc. †Priority beginning with “M” are classified as maintenance projects ‡Projects 17 and 18 are mutually exclusive
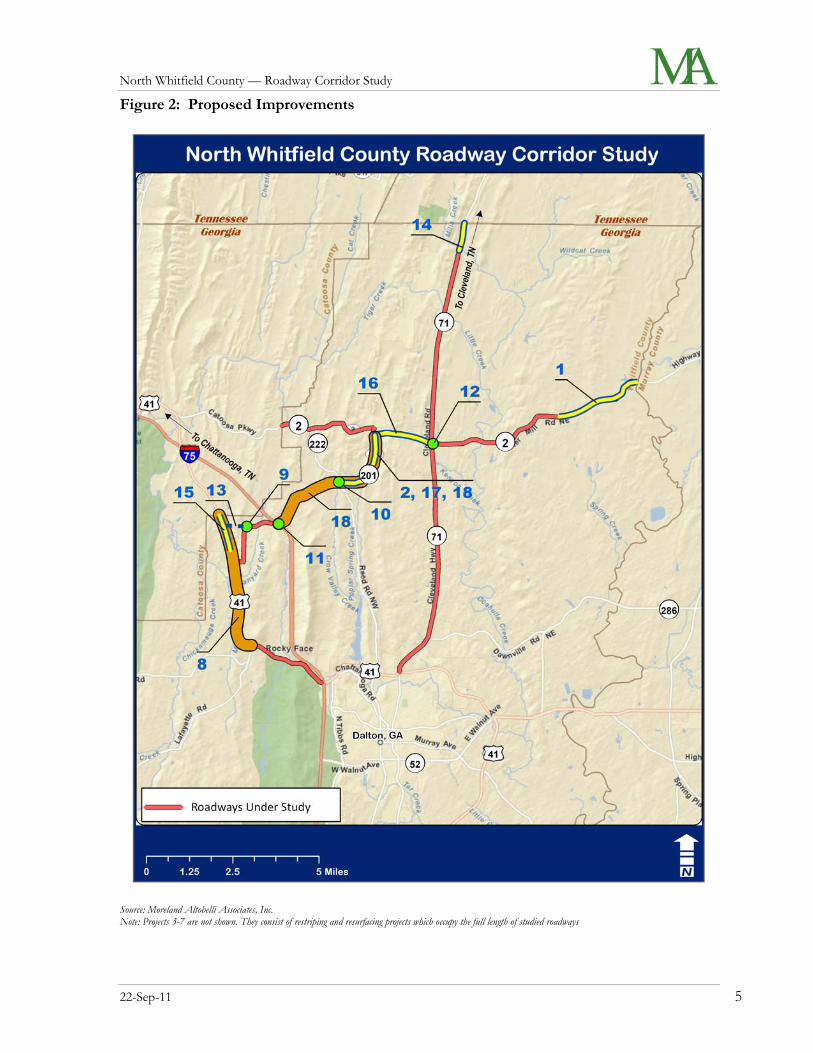
Each of the numbered improvements is shown on Figure 2: Proposed Improvements, with the exception of project numbered 3 to 8, as these are maintenance improvements that cover the entire length of the studied roadways. Note that project numbers 17 and 18 are mutually exclusive.
North Whitfield County — Roadway Corridor Study
22-Sep-11 5
Figure 2: Proposed Improvements
Source: Moreland Altobelli Associates, Inc. Note: Projects 3-7 are not shown. They consist of restriping and resurfacing projects which occupy the full length of studied roadways
North Whitfield County — Roadway Corridor Study
22-Sep-11 6
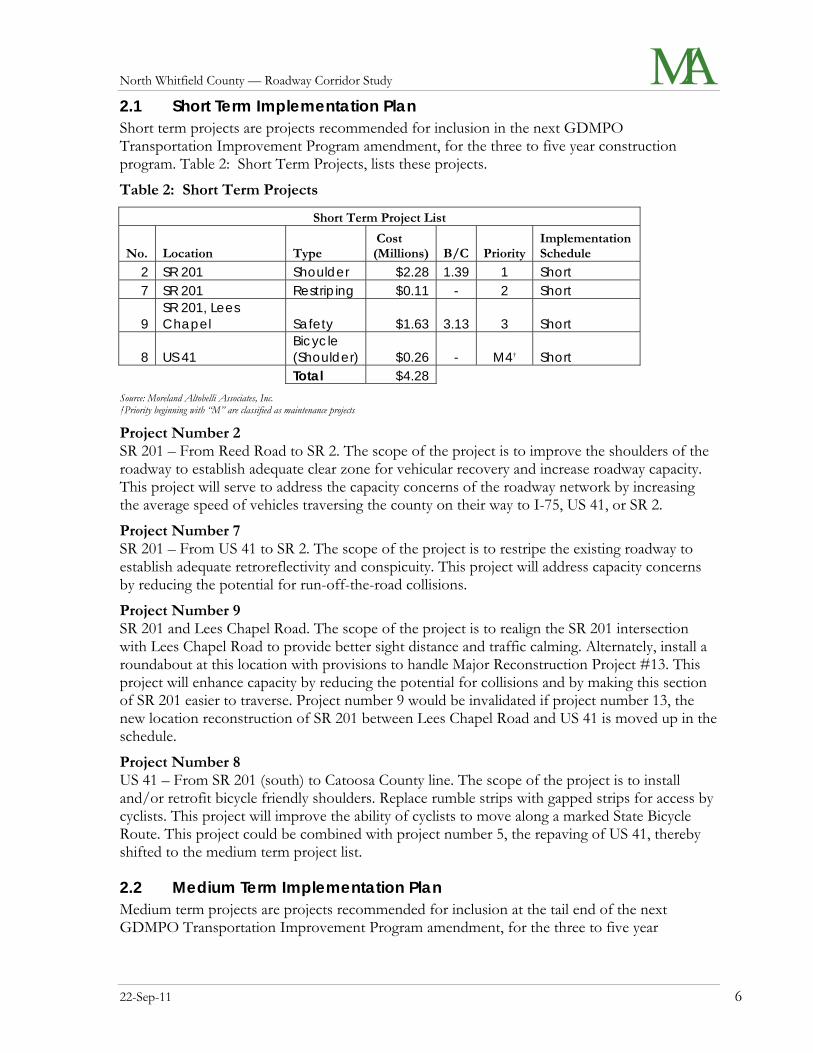
2.1 Short Term Implementation Plan Short term projects are projects recommended for inclusion in the next GDMPO Transportation Improvement Program amendment, for the three to five year construction program. Table 2: Short Term Projects, lists these projects.
Table 2: Short Term Projects
Short Term Project List
No. Location Type Cost (Millions)
B/C Priority
Implementation Schedule
2 SR 201 Shoulder $2.28 1.39 1 Short 7 SR 201 Restriping $0.11 - 2 Short
9 SR 201, Lees Chapel Safety $1.63 3.13 3 Short
8 US 41 Bicycle (Shoulder) $0.26 - M4† Short Total $4.28
Source: Moreland Altobelli Associates, Inc. †Priority beginning with “M” are classified as maintenance projects
Project Number 2 SR 201 – From Reed Road to SR 2. The scope of the project is to improve the shoulders of the roadway to establish adequate clear zone for vehicular recovery and increase roadway capacity. This project will serve to address the capacity concerns of the roadway network by increasing the average speed of vehicles traversing the county on their way to I-75, US 41, or SR 2.
Project Number 7 SR 201 – From US 41 to SR 2. The scope of the project is to restripe the existing roadway to establish adequate retroreflectivity and conspicuity. This project will address capacity concerns by reducing the potential for run-off-the-road collisions.
Project Number 9 SR 201 and Lees Chapel Road. The scope of the project is to realign the SR 201 intersection with Lees Chapel Road to provide better sight distance and traffic calming. Alternately, install a roundabout at this location with provisions to handle Major Reconstruction Project #13. This project will enhance capacity by reducing the potential for collisions and by making this section of SR 201 easier to traverse. Project number 9 would be invalidated if project number 13, the new location reconstruction of SR 201 between Lees Chapel Road and US 41 is moved up in the schedule.
Project Number 8 US 41 – From SR 201 (south) to Catoosa County line. The scope of the project is to install and/or retrofit bicycle friendly shoulders. Replace rumble strips with gapped strips for access by cyclists. This project will improve the ability of cyclists to move along a marked State Bicycle Route. This project could be combined with project number 5, the repaving of US 41, thereby shifted to the medium term project list.
2.2 Medium Term Implementation Plan Medium term projects are projects recommended for inclusion at the tail end of the next GDMPO Transportation Improvement Program amendment, for the three to five year
North Whitfield County — Roadway Corridor Study
22-Sep-11 7
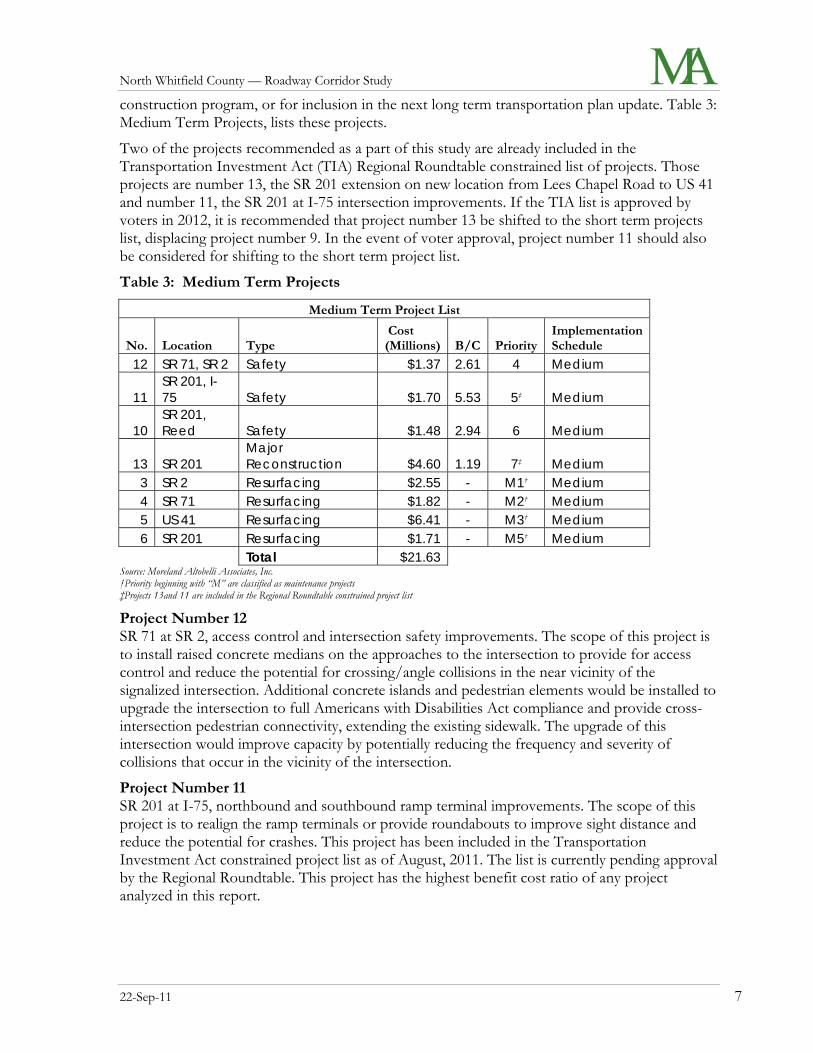
construction program, or for inclusion in the next long term transportation plan update. Table 3: Medium Term Projects, lists these projects.
Two of the projects recommended as a part of this study are already included in the Transportation Investment Act (TIA) Regional Roundtable constrained list of projects. Those projects are number 13, the SR 201 extension on new location from Lees Chapel Road to US 41 and number 11, the SR 201 at I-75 intersection improvements. If the TIA list is approved by voters in 2012, it is recommended that project number 13 be shifted to the short term projects list, displacing project number 9. In the event of voter approval, project number 11 should also be considered for shifting to the short term project list.
Table 3: Medium Term Projects
Medium Term Project List
No. Location Type Cost (Millions)
B/C Priority
Implementation Schedule
12 SR 71, SR 2 Safety $1.37 2.61 4 Medium
11 SR 201, I-75 Safety $1.70 5.53 5‡ Medium
10 SR 201, Reed Safety $1.48 2.94 6 Medium
13 SR 201 Major Reconstruction $4.60 1.19 7‡ Medium
3 SR 2 Resurfacing $2.55 - M1† Medium 4 SR 71 Resurfacing $1.82 - M2† Medium 5 US 41 Resurfacing $6.41 - M3† Medium 6 SR 201 Resurfacing $1.71 - M5† Medium
Total $21.63 Source: Moreland Altobelli Associates, Inc. †Priority beginning with “M” are classified as maintenance projects ‡Projects 13and 11 are included in the Regional Roundtable constrained project list
Project Number 12 SR 71 at SR 2, access control and intersection safety improvements. The scope of this project is to install raised concrete medians on the approaches to the intersection to provide for access control and reduce the potential for crossing/angle collisions in the near vicinity of the signalized intersection. Additional concrete islands and pedestrian elements would be installed to upgrade the intersection to full Americans with Disabilities Act compliance and provide cross-intersection pedestrian connectivity, extending the existing sidewalk. The upgrade of this intersection would improve capacity by potentially reducing the frequency and severity of collisions that occur in the vicinity of the intersection.
Project Number 11 SR 201 at I-75, northbound and southbound ramp terminal improvements. The scope of this project is to realign the ramp terminals or provide roundabouts to improve sight distance and reduce the potential for crashes. This project has been included in the Transportation Investment Act constrained project list as of August, 2011. The list is currently pending approval by the Regional Roundtable. This project has the highest benefit cost ratio of any project analyzed in this report.
North Whitfield County — Roadway Corridor Study
22-Sep-11 8
Project Number 10 SR 201 and Reed Road. The scope of this project is to realign Reed road to intersect with SR 201 at as close to a 90 degree angle as possible. Signal modifications would be necessary. This project would improve capacity by potentially reducing the frequency and severity of collisions that occur in the vicinity of the intersection.
Project Number 13 SR 201 – From SR 201/Lees Chapel Road to US 41. The scope of this project is to provide a new location roadway connecting existing SR 201 to US 41, bypassing the city of Tunnel Hill and the attendant dense residential areas. This project has been included in the Transportation Investment Act constrained project list as of August, 2011. The list is currently pending approval by the Regional Roundtable. As noted previously, if the TIA list is approved by voters in 2012, it is recommended that this project be shifted to the short term projects list for immediate design and construction. This project will improve capacity by shortening the route between I-75 and US 41, avoiding numerous residential access points along the existing SR 201, and increasing the average speed of all traffic between the end points.
Project Number 3 SR 2 Resurfacing – entire length of the Whitfield County. The scope of this project is to overlay or replace the surface course of pavement on the existing footprint of SR 2. This project would increase capacity by reducing maintenance wear and tear on vehicles using the roadway.
Project Number 4 SR 71 Resurfacing – From North Dalton Bypass to the Tennessee State line. The scope of this project is to overlay or replace the surface course of pavement on the existing footprint of SR 71. This project would increase capacity by reducing maintenance wear and tear on vehicles using the roadway.
Project Number 5 US 41 Resurfacing – From I-75 to the Catoosa County line. The scope of this project is to overlay or replace the surface course of pavement on the existing footprint of US 41. This project would increase capacity by reducing maintenance wear and tear on vehicles using the roadway. This project could be combined with project number 8, the bicycle friendly shoulder improvements to replace the existing rumble strips with bicycle friendly rumble strips.
Project Number 6 SR 201 Resurfacing – From US 41 to SR 2. The scope of this project is to overlay or replace the surface course of pavement on the existing footprint of SR 201. This project would increase capacity by reducing maintenance wear and tear on vehicles using the roadway.
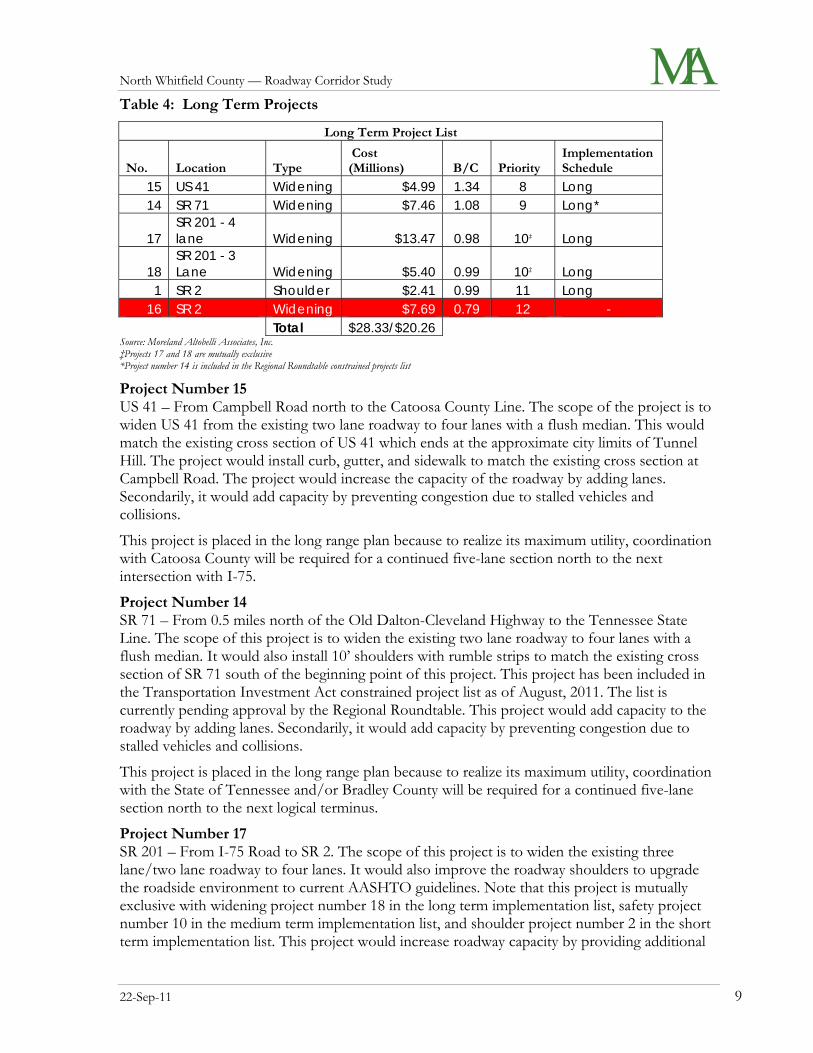
2.3 Long Term Implementation Plan Long term projects are those recommended for inclusion in the next GDMPO Long Range Transportation Plan. Note that two of the projects included on Table 4: Long Term Projects, are mutually exclusive; project numbers 17 and 18 contain approximately the same end points. The total project cost at the bottom of Table 4 has the cost of the long term plan with either project 17, or project 18, as illustrated by the two costs.
Project number 16 has been discarded from the long term implementation plan as not cost effective based on the benefit cost ratio. The total cost of project number 16 is not included in the total of the long term implementation plan.
North Whitfield County — Roadway Corridor Study
22-Sep-11 9
Table 4: Long Term Projects
Long Term Project List
No. Location Type Cost (Millions) B/C Priority
Implementation Schedule
15 US 41 Widening $4.99 1.34 8 Long 14 SR 71 Widening $7.46 1.08 9 Long*
17 SR 201 - 4 lane Widening $13.47 0.98 10‡ Long
18 SR 201 - 3 Lane Widening $5.40 0.99 10‡ Long
1 SR 2 Shoulder $2.41 0.99 11 Long 16 SR 2 Widening $7.69 0.79 12 -
Total $28.33/$20.26 Source: Moreland Altobelli Associates, Inc. ‡Projects 17 and 18 are mutually exclusive *Project number 14 is included in the Regional Roundtable constrained projects list
Project Number 15 US 41 – From Campbell Road north to the Catoosa County Line. The scope of the project is to widen US 41 from the existing two lane roadway to four lanes with a flush median. This would match the existing cross section of US 41 which ends at the approximate city limits of Tunnel Hill. The project would install curb, gutter, and sidewalk to match the existing cross section at Campbell Road. The project would increase the capacity of the roadway by adding lanes. Secondarily, it would add capacity by preventing congestion due to stalled vehicles and collisions.
This project is placed in the long range plan because to realize its maximum utility, coordination with Catoosa County will be required for a continued five-lane section north to the next intersection with I-75.
Project Number 14 SR 71 – From 0.5 miles north of the Old Dalton-Cleveland Highway to the Tennessee State Line. The scope of this project is to widen the existing two lane roadway to four lanes with a flush median. It would also install 10’ shoulders with rumble strips to match the existing cross section of SR 71 south of the beginning point of this project. This project has been included in the Transportation Investment Act constrained project list as of August, 2011. The list is currently pending approval by the Regional Roundtable. This project would add capacity to the roadway by adding lanes. Secondarily, it would add capacity by preventing congestion due to stalled vehicles and collisions.
This project is placed in the long range plan because to realize its maximum utility, coordination with the State of Tennessee and/or Bradley County will be required for a continued five-lane section north to the next logical terminus.
Project Number 17 SR 201 – From I-75 Road to SR 2. The scope of this project is to widen the existing three lane/two lane roadway to four lanes. It would also improve the roadway shoulders to upgrade the roadside environment to current AASHTO guidelines. Note that this project is mutually exclusive with widening project number 18 in the long term implementation list, safety project number 10 in the medium term implementation list, and shoulder project number 2 in the short term implementation list. This project would increase roadway capacity by providing additional
North Whitfield County — Roadway Corridor Study
22-Sep-11 10
lanes, making passing possible throughout the roadway section, and improving the shoulders to comply with clear zone guidelines.
Project Number 18 SR 201 – From Reed Road to SR 2. The scope of this project is to widen the existing roadway to three lanes with attendant shoulder and safety improvements at Reed Road. The third lane would be an alternating passing lane for trucks and other vehicles to be passed safely. Note that this project is mutually exclusive with widening project number 17 in the long term implementation list, safety project number 10 in the medium term implementation list, and shoulder project number 2 in the short term implementation list. This project would increase roadway capacity by providing additional lanes, making passing possible throughout the roadway section, and improving the shoulders to comply with clear zone guidelines.
Project Number 1 SR 2 – From Deep Springs Road to the Murray County line. The scope of the project is to improve the existing roadway shoulders to establish adequate clear zone for vehicular recovery. This project would increase capacity by providing a safer and more easily drivable roadway section, increasing the average speed of drivers.
North Whitfield County — Roadway Corridor Study
22-Sep-11 11
3.0 Conclusion The North Whitfield County corridor study was intended to develop an appreciation and analysis of the effects that growth will have on four studied roadways. Those roadways were SR 2 from Catoosa to Murray Counties; US 41 from I-75 to Catoosa County; SR 71 from the North Dalton Bypass to the Tennessee State line; and SR 201 from US 41 to SR 2. Particular attention was paid to the ability of these roadways to carry freight and commuter traffic through the study year of 2035. With economic development occurring in Tennessee to the north of the study area, the study’s initiators wanted to ensure that Whitfield County is well placed to provide roadway access that will encourage businesses and residents to locate within the study area.
They study examined the roadway conditions with respect to existing traffic volumes, crash history, and the physical condition of the roadway environment. The traffic volumes were projected to 2035 and average daily traffic for that year was projected.
The roadway crash history was analyzed to determine if any sections of roadway were showing a predilection to crashes, and of what type. Several roadway sections along SR 2 and SR 201 showed hot spots of crash activity, attributable to intersections and to roadway shoulders that were not suitable for vehicle recovery if a driver left the road surface.
Using the existing conditions as a base, a general list of roadway needs was developed, discussing the general types of roadway improvements that might be required to meet the stated goal of the study, to encourage freight and passenger movement well into the 21st century.
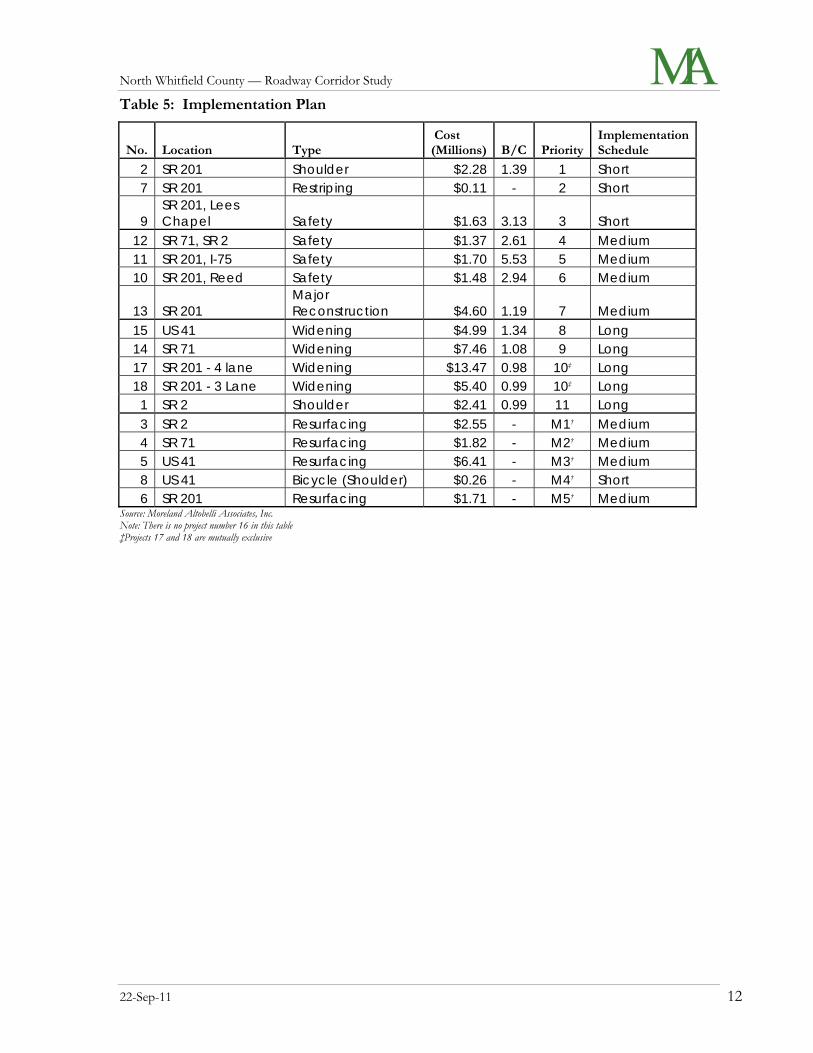
The study continued by developing a more specific list of roadway projects that would address the needs of the study area. These projects were analyzed for their costs and anticipated benefits. The results were tabulated and an implementation plan was developed. This plan is shown here in Table 5: Implementation Plan. Each project is also shown on Figure 2: Proposed Improvements.
The short term implementation plan is recommended for inclusion in the next Greater Dalton Metropolitan Planning Organization (GDMPO) modification to the transportation improvement plan (TIP), the three to five year construction program.
The medium term implementation plan is recommended for inclusion at the end of the next TIP update, or to be included in the Long Range Transportation Plan (LRTP).
The long term implementation plan is recommended for inclusion in the next update to the LRTP.
North Whitfield County — Roadway Corridor Study
22-Sep-11 12
Table 5: Implementation Plan
No. Location Type Cost (Millions)
B/C Priority
Implementation Schedule
2 SR 201 Shoulder $2.28 1.39 1 Short 7 SR 201 Restriping $0.11 - 2 Short
9 SR 201, Lees Chapel Safety $1.63 3.13 3 Short
12 SR 71, SR 2 Safety $1.37 2.61 4 Medium 11 SR 201, I-75 Safety $1.70 5.53 5 Medium 10 SR 201, Reed Safety $1.48 2.94 6 Medium
13 SR 201 Major Reconstruction $4.60 1.19 7 Medium
15 US 41 Widening $4.99 1.34 8 Long 14 SR 71 Widening $7.46 1.08 9 Long 17 SR 201 - 4 lane Widening $13.47 0.98 10‡ Long 18 SR 201 - 3 Lane Widening $5.40 0.99 10‡ Long
1 SR 2 Shoulder $2.41 0.99 11 Long 3 SR 2 Resurfacing $2.55 - M1† Medium 4 SR 71 Resurfacing $1.82 - M2† Medium 5 US 41 Resurfacing $6.41 - M3† Medium 8 US 41 Bicycle (Shoulder) $0.26 - M4† Short 6 SR 201 Resurfacing $1.71 - M5† Medium
Source: Moreland Altobelli Associates, Inc. Note: There is no project number 16 in this table ‡Projects 17 and 18 are mutually exclusive
North Whitfield County — Roadway Corridor Study
16-Sep-11 A
Appendix A. Benefit Cost Worksheets

GD
OT
Ben
efi
t C
os
t C
alc
ula
tor
ente
r in
form
ation in g
reen c
ells
Pro
ject
Info
rmati
on
ID C
osts
Description
Tota
l cost
2,4
09,4
22
$
Annualiz
ed c
ost
142,2
66
$
Co
st
Esti
mate
Date
of
estim
ate
9/1
0/1
1 A
uto
Dela
y C
osts
PE
cost
185,4
67
$
Nobuild
951,3
14
$
RO
W c
ost
269,2
80
$
Build
869,1
67
$
UT
ILIT
Y c
ost
100,0
00
$
Auto
dela
y s
avin
gs
82,1
47
$
CS
T c
ost
1,8
54,6
75
$
Tota
l2,4
09,4
22
$
T
ruck D
ela
y C
osts
Tra
ffic
in
2035
Nobuild
685,4
18
$
Sourc
e o
f tr
aff
ic d
ata
Build
626,2
31
$
Tru
ck d
ela
y s
avin
gs
59,1
87
$
Without
pro
ject
(nobuild
)
Annual V
MT
Fu
el
Co
sts
Annual V
HT
78,6
21
N
obuild
-$
Avera
ge s
peed (
mph)
0
B
uild
-$
Fuel cost
savin
gs
-$
With p
roje
ct
(build
)
Annual V
MT
C
han
ge i
n G
SP
N
A
Annual V
HT
71,8
32
A
uto
dela
y c
ost
adju
stm
ent
NA
Avera
ge s
peed (
mph)
0
T
ruck d
ela
y c
ost
adju
stm
ent
NA
Fuel cost
adju
stm
ent
NA
Para
mete
rsD
efa
ult
Overr
ide
Used
Tota
l benefit
adju
stm
ent
NA
Analy
sis
year
2035
2035
2035
Dis
count
rate
7.0
%7%
B
en
efi
ts i
n 2
035
141,3
33
$
Desig
n life (
years
)25
20
20
Base y
ear
of
cost
estim
ate
N/A
2011
2011
B
en
efi
t-C
ost
Rati
o0.9
9
Curr
ent
CS
T p
rogra
m y
ear
N/A
2015
2015
Fuel price (
$/g
allo
n)
3.2
23.2
2
Fuel econom
y (
mpg)
18.0
318.0
3N
ote
s
Valu
e o
f auto
tra
vel ($
/hr)
13.7
513.7
5
Valu
e o
f tr
uck t
ravel ($
/hr)
72.6
572.6
5
Perc
ent
trucks
12%
12%
Inclu
de G
SP
benefits
No
No
SR
2 S
hould
er
Wid
enin
g
Vehic
le h
ours
tra
vele
d d
erived f
rom
HC
S+
com
parisons o
f befo
re a
fter
should
er
constr
uction,
and
an a
ssum
ption o
f 6 h
ours
of
benefit
GD
OT
Ben
efi
t C
os
t C
alc
ula
tor
ente
r in
form
ation in g
reen c
ells
Pro
ject
Info
rmati
on
ID C
osts
Description
Tota
l cost
2,2
82,6
20
$
Annualiz
ed c
ost
134,7
79
$
Co
st
Esti
mate
Date
of
estim
ate
9/1
0/1
1 A
uto
Dela
y C
osts
PE
cost
176,8
20
$
Nobuild
1,2
24,2
54
$
RO
W c
ost
237,6
00
$
Build
1,1
15,6
08
$
UT
ILIT
Y c
ost
100,0
00
$
Auto
dela
y s
avin
gs
108,6
46
$
CS
T c
ost
1,7
68,2
00
$
Tota
l2,2
82,6
20
$
T
ruck D
ela
y C
osts
Tra
ffic
in
2035
Nobuild
882,0
70
$
Sourc
e o
f tr
aff
ic d
ata
Build
803,7
91
$
Tru
ck d
ela
y s
avin
gs
78,2
79
$
Without
pro
ject
(nobuild
)
Annual V
MT
Fu
el
Co
sts
Annual V
HT
101,1
78
Nobuild
-$
Avera
ge s
peed (
mph)
0
B
uild
-$
Fuel cost
savin
gs
-$
With p
roje
ct
(build
)
Annual V
MT
C
han
ge i
n G
SP
N
A
Annual V
HT
92,1
99
A
uto
dela
y c
ost
adju
stm
ent
NA
Avera
ge s
peed (
mph)
0
T
ruck d
ela
y c
ost
adju
stm
ent
NA
Fuel cost
adju
stm
ent
NA
Para
mete
rsD
efa
ult
Overr
ide
Used
Tota
l benefit
adju
stm
ent
NA
Analy
sis
year
2035
2035
2035
Dis
count
rate
7.0
%7%
B
en
efi
ts i
n 2
035
186,9
25
$
Desig
n life (
years
)25
20
20
Base y
ear
of
cost
estim
ate
N/A
2011
2011
B
en
efi
t-C
ost
Rati
o1.3
9
Curr
ent
CS
T p
rogra
m y
ear
N/A
2015
2015
Fuel price (
$/g
allo
n)
3.2
23.2
2
Fuel econom
y (
mpg)
18.0
318.0
3N
ote
s
Valu
e o
f auto
tra
vel ($
/hr)
13.7
513.7
5
Valu
e o
f tr
uck t
ravel ($
/hr)
72.6
572.6
5
Perc
ent
trucks
12%
12%
Inclu
de G
SP
benefits
No
No
SR
201 S
hould
er
Wid
enin
g
Vehic
le h
ours
tra
vele
d d
erived f
rom
HC
S+
com
parisons o
f befo
re a
fter
should
er
constr
uction,
and
an a
ssum
ption o
f 6 h
ours
of
benefit
GD
OT
Ben
efi
t C
os
t C
alc
ula
tor
ente
r in
form
ation in g
reen c
ells
Pro
ject
Info
rmati
on
ID C
osts
Description
Tota
l cost
1,6
28,6
36
$
Annualiz
ed c
ost
96,1
64
$
Co
st
Esti
mate
Date
of
estim
ate
9/1
0/1
1
PE
cost
123,4
44
$
-$
RO
W c
ost
220,7
50
$
-$
UT
ILIT
Y c
ost
50,0
00
$
C
rash S
avin
gs
301,0
00
$
CS
T c
ost
1,2
34,4
42
$
Tota
l1,6
28,6
36
$
T
ruck D
ela
y C
osts
Tra
ffic
in
2035
Nobuild
-$
Sourc
e o
f tr
aff
ic d
ata
Build
-$
Tru
ck d
ela
y s
avin
gs
-$
Without
pro
ject
(nobuild
)
Annual V
MT
Fu
el
Co
sts
Annual V
HT
Nobuild
-$
Avera
ge s
peed (
mph)
#D
IV/0
!
B
uild
-$
Fuel cost
savin
gs
-$
With p
roje
ct
(build
)
Annual V
MT
C
han
ge i
n G
SP
N
A
Annual V
HT
Auto
dela
y c
ost
adju
stm
ent
NA
Avera
ge s
peed (
mph)
#D
IV/0
!
T
ruck d
ela
y c
ost
adju
stm
ent
NA
Fuel cost
adju
stm
ent
NA
Para
mete
rsD
efa
ult
Overr
ide
Used
Tota
l benefit
adju
stm
ent
NA
Analy
sis
year
2035
2035
2035
Dis
count
rate
7.0
%7%
B
en
efi
ts i
n 2
035
301,0
00
$
Desig
n life (
years
)25
20
20
Base y
ear
of
cost
estim
ate
N/A
2011
2011
B
en
efi
t-C
ost
Rati
o3.1
3
Curr
ent
CS
T p
rogra
m y
ear
N/A
2015
2015
Fuel price (
$/g
allo
n)
3.2
23.2
2
Fuel econom
y (
mpg)
18.0
318.0
3N
ote
s
Valu
e o
f auto
tra
vel ($
/hr)
13.7
513.7
5
Valu
e o
f tr
uck t
ravel ($
/hr)
72.6
572.6
5
Perc
ent
trucks
12%
12%
Inclu
de G
SP
benefits
No
No
SR
201 &
Lees C
hapel R
oad S
afe
ty I
mpro
vem
ent
GD
OT
Ben
efi
t C
os
t C
alc
ula
tor
ente
r in
form
ation in g
reen c
ells
Pro
ject
Info
rmati
on
ID C
osts
Description
Tota
l cost
1,4
82,9
30
$
Annualiz
ed c
ost
87,5
61
$
Co
st
Esti
mate
Date
of
estim
ate
9/1
0/1
1
PE
cost
113,4
48
$
-$
RO
W c
ost
135,0
00
$
-$
UT
ILIT
Y c
ost
100,0
00
$
Cra
sh S
avin
gs
257,5
00
$
CS
T c
ost
1,1
34,4
82
$
Tota
l1,4
82,9
30
$
T
ruck D
ela
y C
osts
Tra
ffic
in
2035
Nobuild
-$
Sourc
e o
f tr
aff
ic d
ata
Build
-$
Tru
ck d
ela
y s
avin
gs
-$
Without
pro
ject
(nobuild
)
Annual V
MT
Fu
el
Co
sts
Annual V
HT
Nobuild
-$
Avera
ge s
peed (
mph)
#D
IV/0
!
B
uild
-$
Fuel cost
savin
gs
-$
With p
roje
ct
(build
)
Annual V
MT
C
han
ge i
n G
SP
N
A
Annual V
HT
Auto
dela
y c
ost
adju
stm
ent
NA
Avera
ge s
peed (
mph)
#D
IV/0
!
T
ruck d
ela
y c
ost
adju
stm
ent
NA
Fuel cost
adju
stm
ent
NA
Para
mete
rsD
efa
ult
Overr
ide
Used
Tota
l benefit
adju
stm
ent
NA
Analy
sis
year
2035
2035
2035
Dis
count
rate
7.0
%7%
B
en
efi
ts i
n 2
035
257,5
00
$
Desig
n life (
years
)25
20
20
Base y
ear
of
cost
estim
ate
N/A
2011
2011
B
en
efi
t-C
ost
Rati
o2.9
4
Curr
ent
CS
T p
rogra
m y
ear
N/A
2015
2015
Fuel price (
$/g
allo
n)
3.2
23.2
2
Fuel econom
y (
mpg)
18.0
318.0
3N
ote
s
Valu
e o
f auto
tra
vel ($
/hr)
13.7
513.7
5
Valu
e o
f tr
uck t
ravel ($
/hr)
72.6
572.6
5
Perc
ent
trucks
12%
12%
Inclu
de G
SP
benefits
No
No
SR
201 &
Reed R
oad S
afe
ty I
mpro
vem
ent
GD
OT
Ben
efi
t-C
os
t C
alc
ula
tor
ente
r in
form
ation in g
reen c
ells
Pro
ject
Info
rmati
on
ID C
osts
Description
Tota
l cost
1,3
69,2
49
$
Annualiz
ed c
ost
80,8
48
$
Co
st
Esti
mate
Date
of
estim
ate
9/1
4/1
1C
rash
Savin
gs
PE
cost
91,3
86
$
-
$
RO
W c
ost
64,0
00
$
-
$
UT
ILIT
Y c
ost
300,0
00
$
Cra
sh S
avin
gs
210,9
37
$
CS
T c
ost
913,8
63
$
Tota
l1,3
69,2
49
$
T
ruck D
ela
y C
osts
Tra
ffic
in
2035
Nobuild
-$
Sourc
e o
f tr
aff
ic d
ata
Build
-$
Tru
ck d
ela
y s
avin
gs
-$
Without
pro
ject
(nobuild
)
Annual V
MT
Fu
el
Co
sts
Annual V
HT
Nobuild
-$
Avera
ge s
peed (
mph)
#D
IV/0
!
B
uild
-$
Fuel cost
savin
gs
-$
With p
roje
ct
(build
)
Annual V
MT
C
han
ge i
n G
SP
N
A
Annual V
HT
Auto
dela
y c
ost
adju
stm
ent
NA
Avera
ge s
peed (
mph)
#D
IV/0
!
T
ruck d
ela
y c
ost
adju
stm
ent
NA
Fuel cost
adju
stm
ent
NA
Para
mete
rsD
efa
ult
Overr
ide
Used
Tota
l benefit
adju
stm
ent
NA
Analy
sis
year
2035
2035
2035
Dis
count
rate
7.0
%7%
B
en
efi
ts i
n 2
035
210,9
37
$
Desig
n life (
years
)25
20
20
Base y
ear
of
cost
estim
ate
N/A
2011
2011
B
en
efi
t-C
ost
Rati
o2.6
1
Curr
ent
CS
T p
rogra
m y
ear
N/A
2015
2015
Fuel price (
$/g
allo
n)
3.2
23.2
2
Fuel econom
y (
mpg)
18.0
318.0
3N
ote
s
Valu
e o
f auto
tra
vel ($
/hr)
13.7
513.7
5
Valu
e o
f tr
uck t
ravel ($
/hr)
72.6
572.6
5
Perc
ent
trucks
12%
12%
Inclu
de G
SP
benefits
No
No
SR
2 &
SR
71 S
afe
ty I
mpro
vem
ents
Only
rele
vant
Benefit
info
rmation u
sed f
or
this
pro
ject
was t
he a
nnual savin
gs in c
rash r
ela
ted d
am
age a
nd
inju
ries.
This
was input
directly into
the s
pre
adsheet
to
take a
dvanta
ge o
f th
e d
evelo
ped d
iscouting f
orm
ula
s.
GD
OT
Ben
efi
t C
os
t C
alc
ula
tor
ente
r in
form
ation in g
reen c
ells
Pro
ject
Info
rmati
on
ID C
osts
Description
Tota
l cost
4,6
00,0
00
$
Annualiz
ed c
ost
271,6
10
$
Co
st
Esti
mate
Date
of
estim
ate
9/1
0/1
1 A
uto
Dela
y C
osts
PE
cost
224,6
63
$
Nobuild
656,4
25
$
RO
W c
ost
750,0
00
$
Build
468,8
75
$
UT
ILIT
Y c
ost
750,0
00
$
Auto
dela
y s
avin
gs
187,5
50
$
CS
T c
ost
2,8
75,3
37
$
Tota
l4,6
00,0
00
$
T
ruck D
ela
y C
osts
Tra
ffic
in
2035
Nobuild
472,9
52
$
Sourc
e o
f tr
aff
ic d
ata
Build
337,8
23
$
Tru
ck d
ela
y s
avin
gs
135,1
29
$
Without
pro
ject
(nobuild
)
Annual V
MT
Fu
el
Co
sts
Annual V
HT
54,2
50
N
obuild
-$
Avera
ge s
peed (
mph)
0
B
uild
-$
Fuel cost
savin
gs
-$
With p
roje
ct
(build
)
Annual V
MT
C
han
ge i
n G
SP
N
A
Annual V
HT
38,7
50
A
uto
dela
y c
ost
adju
stm
ent
NA
Avera
ge s
peed (
mph)
0
T
ruck d
ela
y c
ost
adju
stm
ent
NA
Fuel cost
adju
stm
ent
NA
Para
mete
rsD
efa
ult
Overr
ide
Used
Tota
l benefit
adju
stm
ent
NA
Analy
sis
year
2035
2035
2035
Dis
count
rate
7.0
%7%
B
en
efi
ts i
n 2
035
322,6
79
$
Desig
n life (
years
)25
20
20
Base y
ear
of
cost
estim
ate
N/A
2011
2011
B
en
efi
t-C
ost
Rati
o1.1
9
Curr
ent
CS
T p
rogra
m y
ear
N/A
2015
2015
Fuel price (
$/g
allo
n)
3.2
23.2
2
Fuel econom
y (
mpg)
18.0
318.0
3N
ote
s
Valu
e o
f auto
tra
vel ($
/hr)
13.7
513.7
5
Valu
e o
f tr
uck t
ravel ($
/hr)
72.6
572.6
5
Perc
ent
trucks
12%
12%
Inclu
de G
SP
benefits
No
No
SR
201 M
ajo
r R
econstr
uction
Assum
es N
O d
iffe
rence in s
peed (
45 M
PH
) betw
een
build
and n
o b
uild
, w
hic
h is a
n e
xtr
em
em
ly
conserv
ative a
ssum
ption.
Actu
al B
C r
atio w
ill b
e
hig
her.
GD
OT
Ben
efi
t C
os
t C
alc
ula
tor
ente
r in
form
ation in g
reen c
ells
Pro
ject
Info
rmati
on
ID C
osts
Description
Tota
l cost
7,4
58,6
00
$
Annualiz
ed c
ost
440,3
98
$
Co
st
Esti
mate
Date
of
estim
ate
9/1
0/1
1 A
uto
Dela
y C
osts
PE
cost
562,6
74
$
Nobuild
656,4
25
$
RO
W c
ost
1,1
69,1
84
$
B
uild
511,2
25
$
UT
ILIT
Y c
ost
100,0
00
$
Auto
dela
y s
avin
gs
145,2
00
$
CS
T c
ost
5,6
26,7
42
$
Tota
l7,4
58,6
00
$
T
ruck D
ela
y C
osts
Tra
ffic
in
2035
Nobuild
472,9
52
$
Sourc
e o
f tr
aff
ic d
ata
Build
368,3
36
$
Tru
ck d
ela
y s
avin
gs
104,6
16
$
Without
pro
ject
(nobuild
)
Annual V
MT
Annual V
HT
54,2
50
-
$
Avera
ge s
peed (
mph)
0-
$
Cra
sh S
avin
gs
226,2
50
$
With p
roje
ct
(build
)
Annual V
MT
C
han
ge i
n G
SP
N
A
Annual V
HT
42,2
50
A
uto
dela
y c
ost
adju
stm
ent
NA
Avera
ge s
peed (
mph)
0
T
ruck d
ela
y c
ost
adju
stm
ent
NA
Fuel cost
adju
stm
ent
NA
Para
mete
rsD
efa
ult
Overr
ide
Used
Tota
l benefit
adju
stm
ent
NA
Analy
sis
year
2035
2035
2035
Dis
count
rate
7.0
%7%
B
en
efi
ts i
n 2
035
476,0
66
$
Desig
n life (
years
)25
20
20
Base y
ear
of
cost
estim
ate
N/A
2011
2011
B
en
efi
t-C
ost
Rati
o1.0
8
Curr
ent
CS
T p
rogra
m y
ear
N/A
2015
2015
Fuel price (
$/g
allo
n)
3.2
23.2
2
Fuel econom
y (
mpg)
18.0
318.0
3N
ote
s
Valu
e o
f auto
tra
vel ($
/hr)
13.7
513.7
5
Valu
e o
f tr
uck t
ravel ($
/hr)
72.6
572.6
5
Perc
ent
trucks
12%
12%
Inclu
de G
SP
benefits
No
No
SR
71 W
idenin
g
GD
OT
Ben
efi
t C
os
t C
alc
ula
tor
ente
r in
form
ation in g
reen c
ells
Pro
ject
Info
rmati
on
ID C
osts
Description
Tota
l cost
4,9
91,6
38
$
Annualiz
ed c
ost
294,7
34
$
Co
st
Esti
mate
Date
of
estim
ate
9/1
0/1
1 A
uto
Dela
y C
osts
PE
cost
300,8
33
$
Nobuild
1,3
03,7
75
$
RO
W c
ost
882,4
80
$
Build
1,1
67,6
50
$
UT
ILIT
Y c
ost
800,0
00
$
Auto
dela
y s
avin
gs
136,1
25
$
CS
T c
ost
3,0
08,3
25
$
Tota
l4,9
91,6
38
$
T
ruck D
ela
y C
osts
Tra
ffic
in
2035
Nobuild
939,3
65
$
Sourc
e o
f tr
aff
ic d
ata
Build
841,2
87
$
Tru
ck d
ela
y s
avin
gs
98,0
78
$
Without
pro
ject
(nobuild
)
Annual V
MT
Annual V
HT
107,7
50
-$
Avera
ge s
peed (
mph)
0-
$
Cra
sh S
avin
gs
161,2
50
$
With p
roje
ct
(build
)
Annual V
MT
C
han
ge i
n G
SP
N
A
Annual V
HT
96,5
00
A
uto
dela
y c
ost
adju
stm
ent
NA
Avera
ge s
peed (
mph)
0
T
ruck d
ela
y c
ost
adju
stm
ent
NA
Fuel cost
adju
stm
ent
NA
Para
mete
rsD
efa
ult
Overr
ide
Used
Tota
l benefit
adju
stm
ent
NA
Analy
sis
year
2035
2035
2035
Dis
count
rate
7.0
%7%
B
en
efi
ts i
n 2
035
395,4
53
$
Desig
n life (
years
)25
20
20
Base y
ear
of
cost
estim
ate
N/A
2011
2011
B
en
efi
t-C
ost
Rati
o1.3
4
Curr
ent
CS
T p
rogra
m y
ear
N/A
2015
2015
Fuel price (
$/g
allo
n)
3.2
23.2
2
Fuel econom
y (
mpg)
18.0
318.0
3N
ote
s
Valu
e o
f auto
tra
vel ($
/hr)
13.7
513.7
5
Valu
e o
f tr
uck t
ravel ($
/hr)
72.6
572.6
5
Perc
ent
trucks
12%
12%
Inclu
de G
SP
benefits
No
No
US
41 W
idenin
g
GD
OT
Ben
efi
t C
os
t C
alc
ula
tor
ente
r in
form
ation in g
reen c
ells
Pro
ject
Info
rmati
on
ID C
osts
Description
Tota
l cost
-$
Annualiz
ed c
ost
-$
Co
st
Esti
mate
Date
of
estim
ate
9/1
0/1
1 A
uto
Dela
y C
osts
PE
cost
Nobuild
-$
RO
W c
ost
Build
-$
UT
ILIT
Y c
ost
Auto
dela
y s
avin
gs
-$
CS
T c
ost
Tota
l-
$
Tru
ck D
ela
y C
osts
Tra
ffic
in
2035
Nobuild
-$
Sourc
e o
f tr
aff
ic d
ata
Build
-$
Tru
ck d
ela
y s
avin
gs
-$
Without
pro
ject
(nobuild
)
Annual V
MT
Fu
el
Co
sts
Annual V
HT
Nobuild
-$
Avera
ge s
peed (
mph)
#D
IV/0
!
B
uild
-$
Fuel cost
savin
gs
-$
With p
roje
ct
(build
)
Annual V
MT
C
han
ge i
n G
SP
N
A
Annual V
HT
Auto
dela
y c
ost
adju
stm
ent
NA
Avera
ge s
peed (
mph)
#D
IV/0
!
T
ruck d
ela
y c
ost
adju
stm
ent
NA
Fuel cost
adju
stm
ent
NA
Para
mete
rsD
efa
ult
Overr
ide
Used
Tota
l benefit
adju
stm
ent
NA
Analy
sis
year
2035
2035
2035
Dis
count
rate
7.0
%7%
B
en
efi
ts i
n 2
035
-$
Desig
n life (
years
)25
20
20
Base y
ear
of
cost
estim
ate
N/A
2011
2011
B
en
efi
t-C
ost
Rati
o#D
IV/0
!
Curr
ent
CS
T p
rogra
m y
ear
N/A
2015
2015
Fuel price (
$/g
allo
n)
3.2
23.2
2
Fuel econom
y (
mpg)
18.0
318.0
3N
ote
s
Valu
e o
f auto
tra
vel ($
/hr)
13.7
513.7
5
Valu
e o
f tr
uck t
ravel ($
/hr)
72.6
572.6
5
Perc
ent
trucks
12%
12%
Inclu
de G
SP
benefits
No
No
SR
2 W
idenin
g
GD
OT
Ben
efi
t C
os
t C
alc
ula
tor
ente
r in
form
ation in g
reen c
ells
Pro
ject
Info
rmati
on
ID C
osts
Description
Tota
l cost
13,4
73,9
69
$
Annualiz
ed c
ost
795,5
79
$
Co
st
Esti
mate
Date
of
estim
ate
9/1
0/1
1 A
uto
Dela
y C
osts
PE
cost
807,2
26
$
Nobuild
2,6
65,0
25
$
RO
W c
ost
3,5
94,4
80
$
B
uild
2,3
62,5
25
$
UT
ILIT
Y c
ost
1,0
00,0
00
$
A
uto
dela
y s
avin
gs
302,5
00
$
CS
T c
ost
8,0
72,2
63
$
Tota
l13,4
73,9
69
$
Tru
ck D
ela
y C
osts
Tra
ffic
in
2035
Nobuild
1,9
20,1
40
$
Sourc
e o
f tr
aff
ic d
ata
Build
1,7
02,1
90
$
Tru
ck d
ela
y s
avin
gs
217,9
50
$
Without
pro
ject
(nobuild
)
Annual V
MT
Annual V
HT
220,2
50
-$
Avera
ge s
peed (
mph)
0-
$
Cra
sh S
avin
gs
257,5
00
$
With p
roje
ct
(build
)
Annual V
MT
C
han
ge i
n G
SP
N
A
Annual V
HT
195,2
50
Auto
dela
y c
ost
adju
stm
ent
NA
Avera
ge s
peed (
mph)
0
T
ruck d
ela
y c
ost
adju
stm
ent
NA
Fuel cost
adju
stm
ent
NA
Para
mete
rsD
efa
ult
Overr
ide
Used
Tota
l benefit
adju
stm
ent
NA
Analy
sis
year
2035
2035
2035
Dis
count
rate
7.0
%7%
B
en
efi
ts i
n 2
035
777,9
50
$
Desig
n life (
years
)25
20
20
Base y
ear
of
cost
estim
ate
N/A
2011
2011
B
en
efi
t-C
ost
Rati
o0.9
8
Curr
ent
CS
T p
rogra
m y
ear
N/A
2015
2015
Fuel price (
$/g
allo
n)
3.2
23.2
2
Fuel econom
y (
mpg)
18.0
318.0
3N
ote
s
Valu
e o
f auto
tra
vel ($
/hr)
13.7
513.7
5
Valu
e o
f tr
uck t
ravel ($
/hr)
72.6
572.6
5
Perc
ent
trucks
12%
12%
Inclu
de G
SP
benefits
No
No
SR
201 W
idenin
g 4
Lane

GD
OT
Ben
efi
t C
os
t C
alc
ula
tor
ente
r in
form
ation in g
reen c
ells
Pro
ject
Info
rmati
on
ID C
osts
Description
Tota
l cost
5,4
01,4
81
$
Annualiz
ed c
ost
318,9
34
$
Co
st
Esti
mate
Date
of
estim
ate
9/1
0/1
1 A
uto
Dela
y C
osts
PE
cost
285,9
16
$
Nobuild
1,2
49,3
25
$
RO
W c
ost
2,0
56,4
00
$
B
uild
1,2
16,0
50
$
UT
ILIT
Y c
ost
200,0
00
$
Auto
dela
y s
avin
gs
33,2
75
$
CS
T c
ost
2,8
59,1
65
$
Tota
l5,4
01,4
81
$
T
ruck D
ela
y C
osts
Tra
ffic
in
2035
Nobuild
900,1
34
$
Sourc
e o
f tr
aff
ic d
ata
Build
876,1
59
$
Tru
ck d
ela
y s
avin
gs
23,9
75
$
Without
pro
ject
(nobuild
)
Annual V
MT
Annual V
HT
103,2
50
-$
Avera
ge s
peed (
mph)
0-
$
Cra
sh S
avin
gs
257,5
00
$
With p
roje
ct
(build
)
Annual V
MT
C
han
ge i
n G
SP
N
A
Annual V
HT
100,5
00
Auto
dela
y c
ost
adju
stm
ent
NA
Avera
ge s
peed (
mph)
0
T
ruck d
ela
y c
ost
adju
stm
ent
NA
Fuel cost
adju
stm
ent
NA
Para
mete
rsD
efa
ult
Overr
ide
Used
Tota
l benefit
adju
stm
ent
NA
Analy
sis
year
2035
2035
2035
Dis
count
rate
7.0
%7%
B
en
efi
ts i
n 2
035
314,7
50
$
Desig
n life (
years
)25
20
20
Base y
ear
of
cost
estim
ate
N/A
2011
2011
B
en
efi
t-C
ost
Rati
o0.9
9
Curr
ent
CS
T p
rogra
m y
ear
N/A
2015
2015
Fuel price (
$/g
allo
n)
3.2
23.2
2
Fuel econom
y (
mpg)
18.0
318.0
3N
ote
s
Valu
e o
f auto
tra
vel ($
/hr)
13.7
513.7
5
Valu
e o
f tr
uck t
ravel ($
/hr)
72.6
572.6
5
Perc
ent
trucks
12%
12%
Inclu
de G
SP
benefits
No
No
SR
201 W
idenin
g 3
Lane
Whitfield County
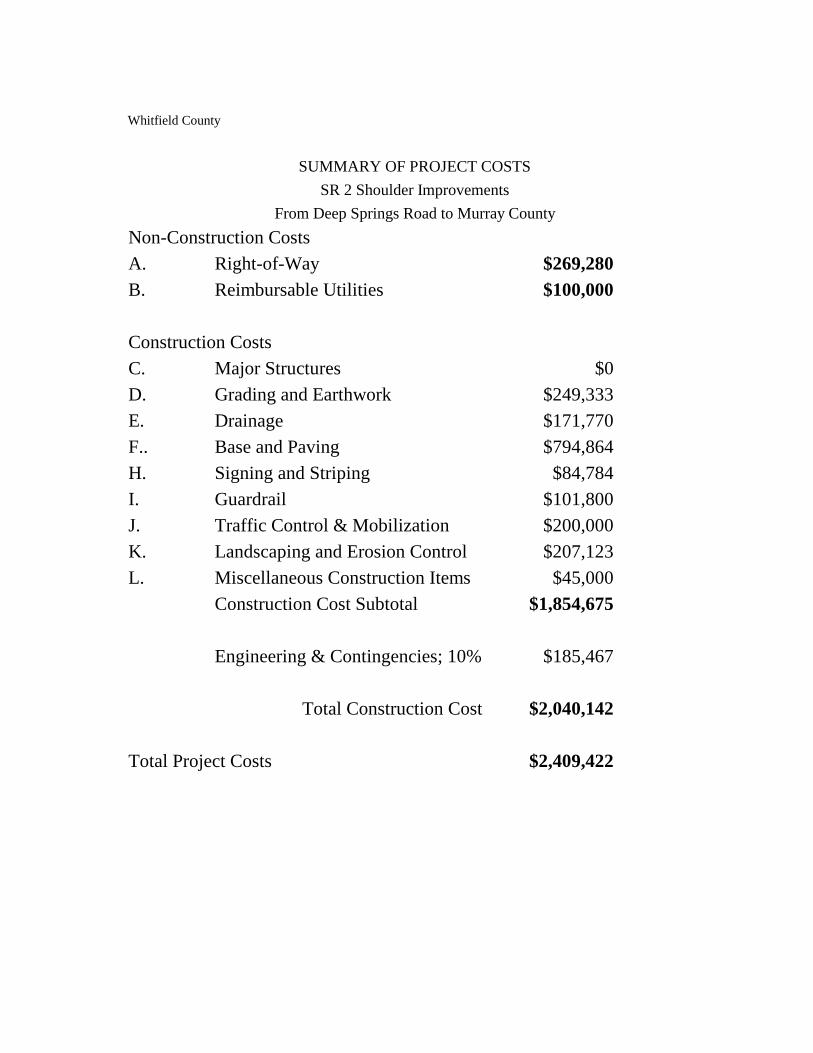
SUMMARY OF PROJECT COSTS
Non-Construction Costs
A. Right-of-Way $269,280
B. Reimbursable Utilities $100,000
Construction Costs
C. Major Structures $0
D. Grading and Earthwork $249,333
E. Drainage $171,770
F.. Base and Paving $794,864
H. Signing and Striping $84,784
I. Guardrail $101,800
J. Traffic Control & Mobilization $200,000
K. Landscaping and Erosion Control $207,123
L. Miscellaneous Construction Items $45,000
Construction Cost Subtotal $1,854,675
Engineering & Contingencies; 10% $185,467
Total Construction Cost $2,040,142
Total Project Costs $2,409,422
SR 2 Shoulder Improvements
From Deep Springs Road to Murray County
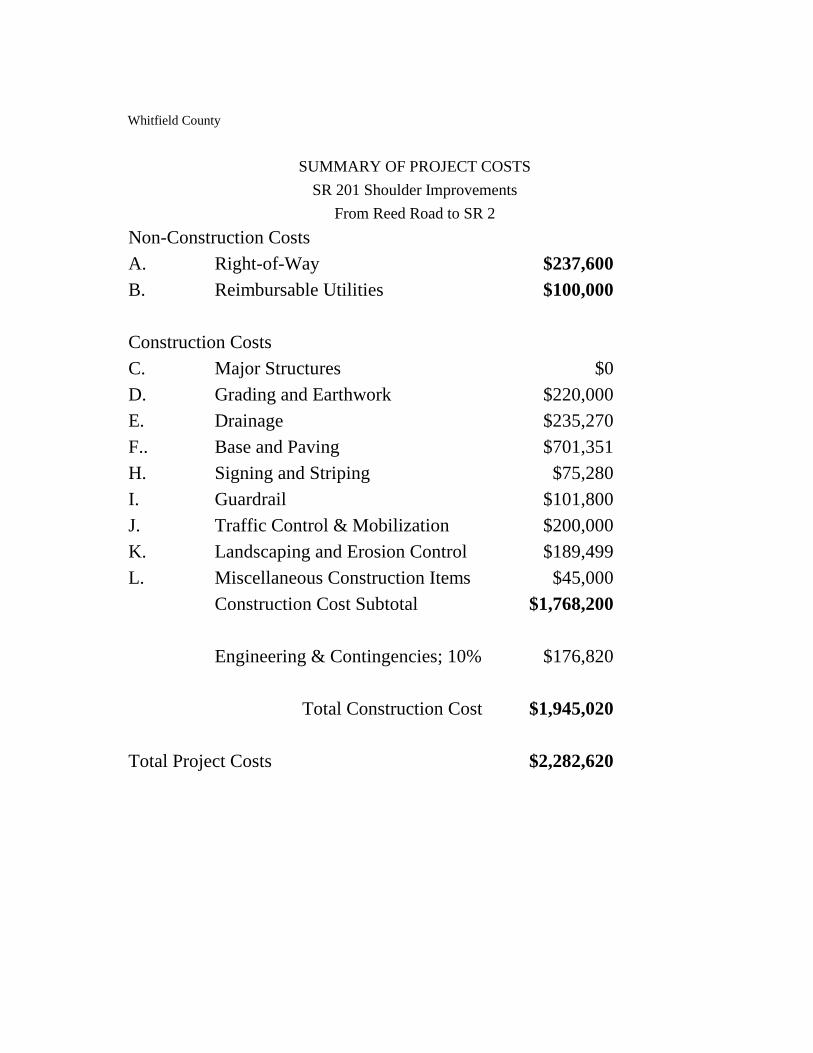
Whitfield County
SUMMARY OF PROJECT COSTS
Non-Construction Costs
A. Right-of-Way $237,600
B. Reimbursable Utilities $100,000
Construction Costs
C. Major Structures $0
D. Grading and Earthwork $220,000
E. Drainage $235,270
F.. Base and Paving $701,351
H. Signing and Striping $75,280
I. Guardrail $101,800
J. Traffic Control & Mobilization $200,000
K. Landscaping and Erosion Control $189,499
L. Miscellaneous Construction Items $45,000
Construction Cost Subtotal $1,768,200
Engineering & Contingencies; 10% $176,820
Total Construction Cost $1,945,020
Total Project Costs $2,282,620
SR 201 Shoulder Improvements
From Reed Road to SR 2

Whitfield County
SUMMARY OF PROJECT COSTS
Non-Construction Costs
A. Right-of-Way $0
B. Reimbursable Utilities $0
Construction Costs
C. Major Structures $0
D. Grading and Earthwork $0
E. Drainage $0
F.. Base and Paving $1,932,153
H. Signing and Striping $239,488
I. Guardrail $0
J. Traffic Control & Mobilization $100,000
K. Landscaping and Erosion Control $0
L. Miscellaneous Construction Items $45,000
Construction Cost Subtotal $2,316,641
Engineering & Contingencies; 10% $231,664
Total Construction Cost $2,548,305
Total Project Costs $2,548,305
SR 2 Widening
From Catoosa Co. to Murray Co.
Whitfield County
SUMMARY OF PROJECT COSTS
Non-Construction Costs
A. Right-of-Way $0
B. Reimbursable Utilities $0
Construction Costs
C. Major Structures $0
D. Grading and Earthwork $0
E. Drainage $0
F.. Base and Paving $5,101,104
H. Signing and Striping $582,688
I. Guardrail $0
J. Traffic Control & Mobilization $100,000
K. Landscaping and Erosion Control $0
L. Miscellaneous Construction Items $45,000
Construction Cost Subtotal $5,828,792
Engineering & Contingencies; 10% $582,879
Total Construction Cost $6,411,672
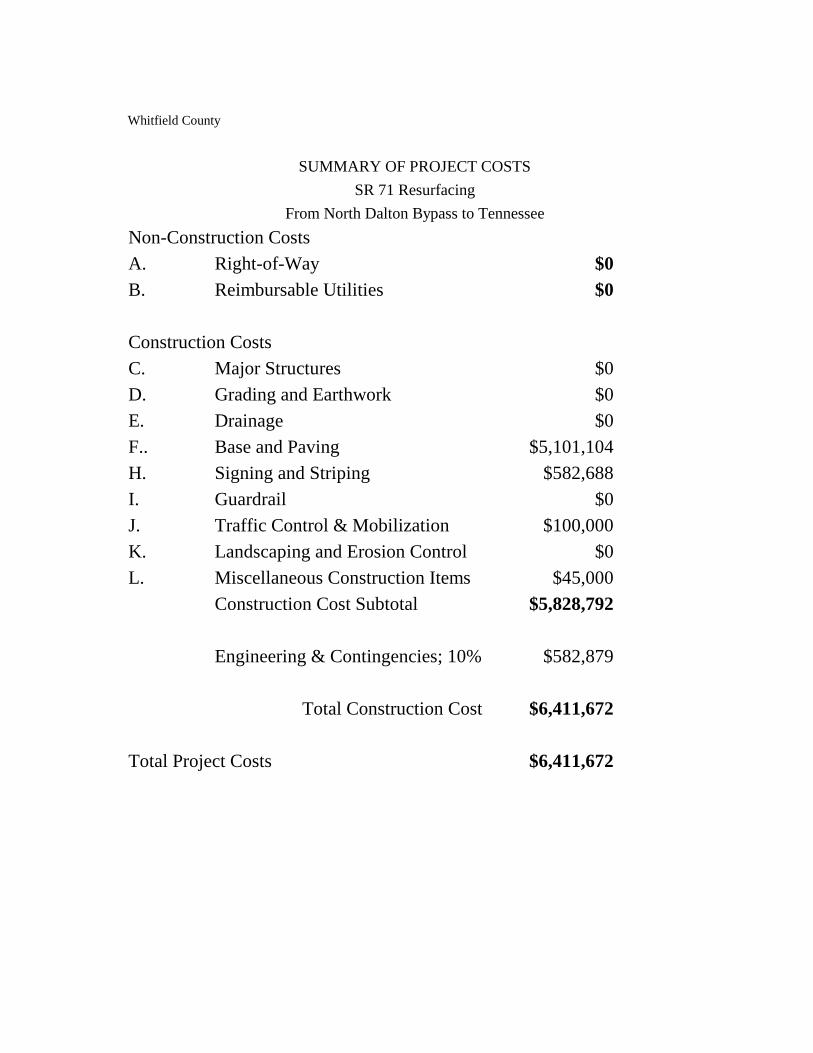
Total Project Costs $6,411,672
SR 71 Resurfacing
From North Dalton Bypass to Tennessee

Whitfield County
SUMMARY OF PROJECT COSTS
Non-Construction Costs
A. Right-of-Way $0
B. Reimbursable Utilities $0
Construction Costs
C. Major Structures $0
D. Grading and Earthwork $0
E. Drainage $0
F.. Base and Paving $1,123,750
H. Signing and Striping $284,051
I. Guardrail $0
J. Traffic Control & Mobilization $100,000
K. Landscaping and Erosion Control $0
L. Miscellaneous Construction Items $45,000
Construction Cost Subtotal $1,552,801
Engineering & Contingencies; 10% $155,280
Total Construction Cost $1,708,081
Total Project Costs $1,708,081
US 41 Resurfacing
From I-75 to Catoosa Co.

Whitfield County
SUMMARY OF PROJECT COSTS
Non-Construction Costs
A. Right-of-Way $0
B. Reimbursable Utilities $0
Construction Costs
C. Major Structures $0
D. Grading and Earthwork $0
E. Drainage $0
F.. Base and Paving $1,356,897
H. Signing and Striping $150,573
I. Guardrail $0
J. Traffic Control & Mobilization $100,000
K. Landscaping and Erosion Control $0
L. Miscellaneous Construction Items $45,000
Construction Cost Subtotal $1,652,470
Engineering & Contingencies; 10% $165,247
Total Construction Cost $1,817,717
Total Project Costs $1,817,717
SR 201 Resurfacing
From US 41 to SR 2

Whitfield County
SUMMARY OF PROJECT COSTS
Non-Construction Costs
A. Right-of-Way $0
B. Reimbursable Utilities $0
Construction Costs
C. Major Structures $0
D. Grading and Earthwork $0
E. Drainage $0
F.. Base and Paving $0
H. Signing and Striping $93,440
I. Guardrail $0
J. Traffic Control & Mobilization $10,000
K. Landscaping and Erosion Control $0
L. Miscellaneous Construction Items $0
Construction Cost Subtotal $103,440
Engineering & Contingencies; 10% $10,344
Total Construction Cost $113,784
Total Project Costs $113,784
SR 201 Shoulder Improvements
From US 41 to SR 2

Whitfield County
SUMMARY OF PROJECT COSTS
Non-Construction Costs
A. Right-of-Way $0
B. Reimbursable Utilities $0
Construction Costs
C. Major Structures $0
D. Grading and Earthwork $0
E. Drainage $0
F.. Base and Paving $209,883
H. Signing and Striping $0
I. Guardrail $0
J. Traffic Control & Mobilization $25,000
K. Landscaping and Erosion Control $0
L. Miscellaneous Construction Items $0
Construction Cost Subtotal $234,883
Engineering & Construction; 10% $23,488
Total Construction Cost $258,372
Total Project Costs $258,372
US 41 Shoulder
From SR 201 (South) to Catoosa County line

Whitfield County
SUMMARY OF PROJECT COSTS
Non-Construction Costs
A. Right-of-Way $220,750
B. Reimbursable Utilities $50,000
Construction Costs
C. Major Structures $0
D. Grading and Earthwork $100,000
E. Drainage $118,593
F.. Base and Paving $591,533
H. Signing and Striping $38,000
I. Guardrail $20,350
J. Traffic Control & Mobilization $200,000
K. Landscaping and Erosion Control $120,966
L. Miscellaneous Construction Items $45,000
Construction Cost Subtotal $1,234,442
Engineering & Contingencies; 10% $123,444
Total Construction Cost $1,357,886
Total Project Costs $1,628,636
SR 2 & Lees Chapel Road

Whitfield County
SUMMARY OF PROJECT COSTS
Non-Construction Costs
A. Right-of-Way $135,000
B. Reimbursable Utilities $100,000
Construction Costs
C. Major Structures $0
D. Grading and Earthwork $100,000
E. Drainage $118,593
F.. Base and Paving $504,554
H. Signing and Striping $42,000
I. Guardrail $15,650
J. Traffic Control & Mobilization $200,000
K. Landscaping and Erosion Control $108,685
L. Miscellaneous Construction Items $45,000
Construction Cost Subtotal $1,134,482
Engineering & Contingencies; 10% $113,448
Total Construction Cost $1,247,930
Total Project Costs $1,482,930
SR 201 & Reed Road
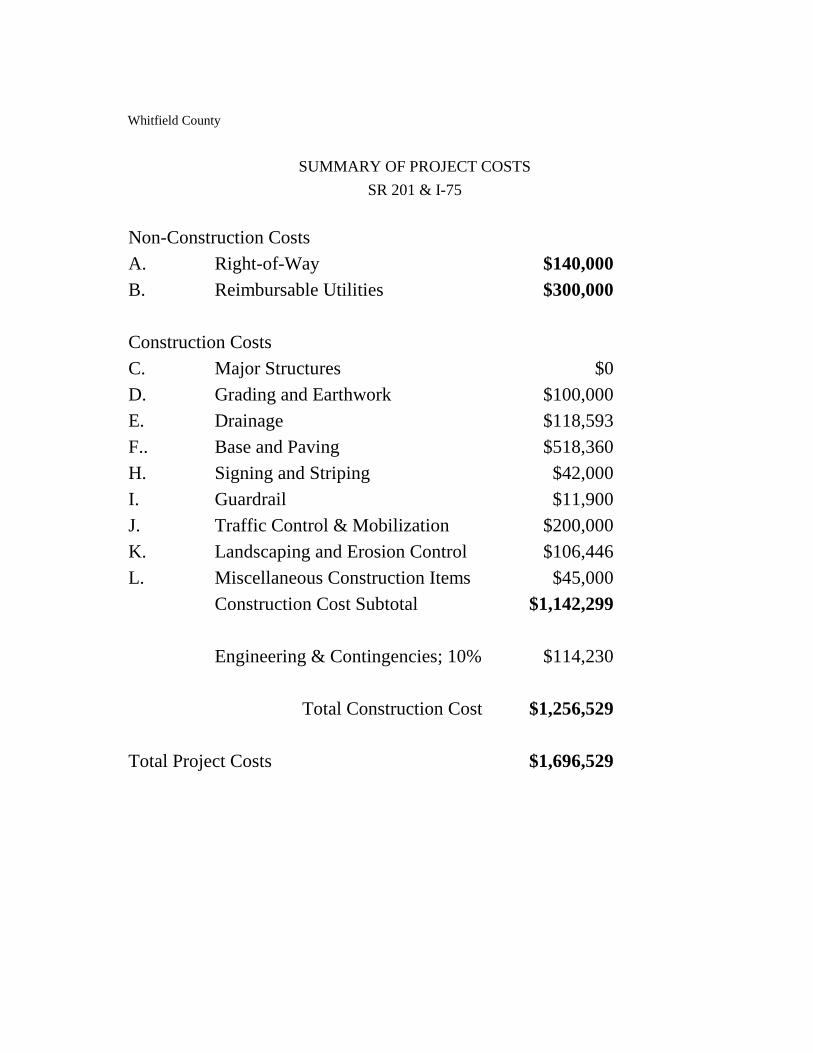
Whitfield County
SUMMARY OF PROJECT COSTS
Non-Construction Costs
A. Right-of-Way $140,000
B. Reimbursable Utilities $300,000
Construction Costs
C. Major Structures $0
D. Grading and Earthwork $100,000
E. Drainage $118,593
F.. Base and Paving $518,360
H. Signing and Striping $42,000
I. Guardrail $11,900
J. Traffic Control & Mobilization $200,000
K. Landscaping and Erosion Control $106,446
L. Miscellaneous Construction Items $45,000
Construction Cost Subtotal $1,142,299
Engineering & Contingencies; 10% $114,230
Total Construction Cost $1,256,529
Total Project Costs $1,696,529
SR 201 & I-75
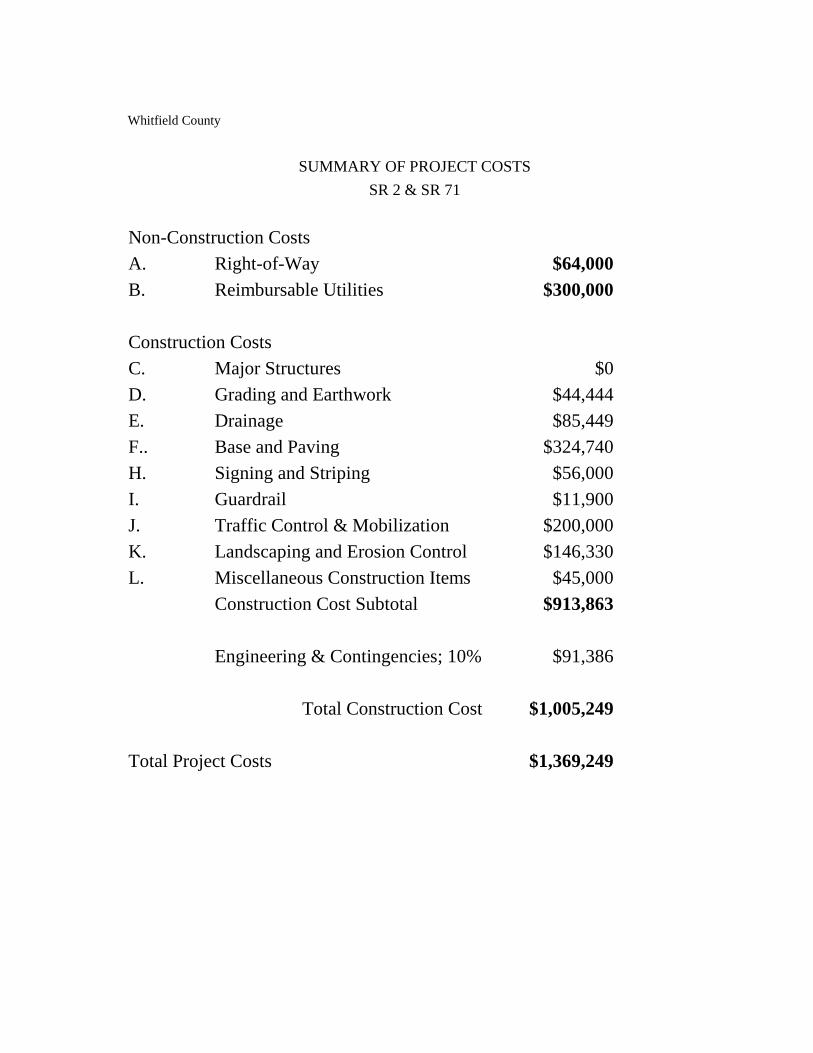
Whitfield County
SUMMARY OF PROJECT COSTS
Non-Construction Costs
A. Right-of-Way $64,000
B. Reimbursable Utilities $300,000
Construction Costs
C. Major Structures $0
D. Grading and Earthwork $44,444
E. Drainage $85,449
F.. Base and Paving $324,740
H. Signing and Striping $56,000
I. Guardrail $11,900
J. Traffic Control & Mobilization $200,000
K. Landscaping and Erosion Control $146,330
L. Miscellaneous Construction Items $45,000
Construction Cost Subtotal $913,863
Engineering & Contingencies; 10% $91,386
Total Construction Cost $1,005,249
Total Project Costs $1,369,249
SR 2 & SR 71
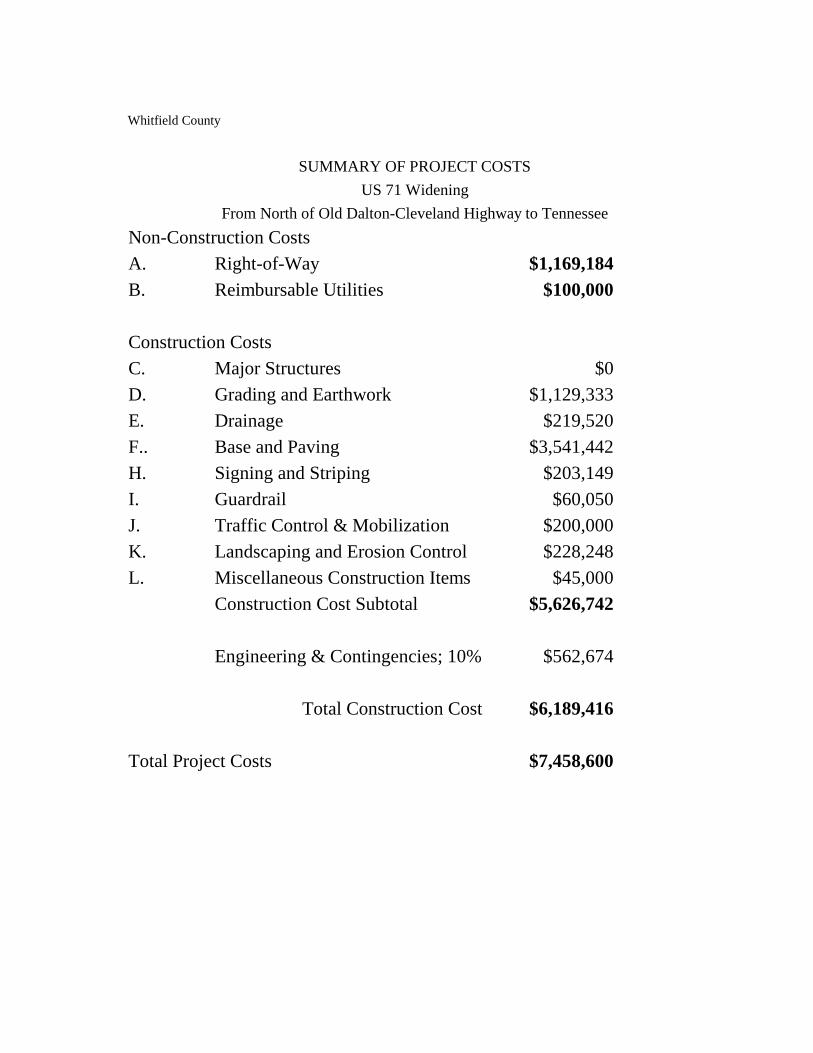
Whitfield County
SUMMARY OF PROJECT COSTS
Non-Construction Costs
A. Right-of-Way $1,169,184
B. Reimbursable Utilities $100,000
Construction Costs
C. Major Structures $0
D. Grading and Earthwork $1,129,333
E. Drainage $219,520
F.. Base and Paving $3,541,442
H. Signing and Striping $203,149
I. Guardrail $60,050
J. Traffic Control & Mobilization $200,000
K. Landscaping and Erosion Control $228,248
L. Miscellaneous Construction Items $45,000
Construction Cost Subtotal $5,626,742
Engineering & Contingencies; 10% $562,674
Total Construction Cost $6,189,416
Total Project Costs $7,458,600
US 71 Widening
From North of Old Dalton-Cleveland Highway to Tennessee

Whitfield County
SUMMARY OF PROJECT COSTS
Non-Construction Costs
A. Right-of-Way $882,480
B. Reimbursable Utilities $800,000
Construction Costs
C. Major Structures $0
D. Grading and Earthwork $523,111
E. Drainage $344,183
F.. Base and Paving $1,697,985
H. Signing and Striping $92,394
I. Guardrail $32,400
J. Traffic Control & Mobilization $100,000
K. Landscaping and Erosion Control $173,253
L. Miscellaneous Construction Items $45,000
Construction Cost Subtotal $3,008,325
Engineering & Construction; 10% $300,833
Total Construction Cost $3,309,158
Total Project Costs $4,991,638
US 41 Widening
From Campbel Road to Catoosa County
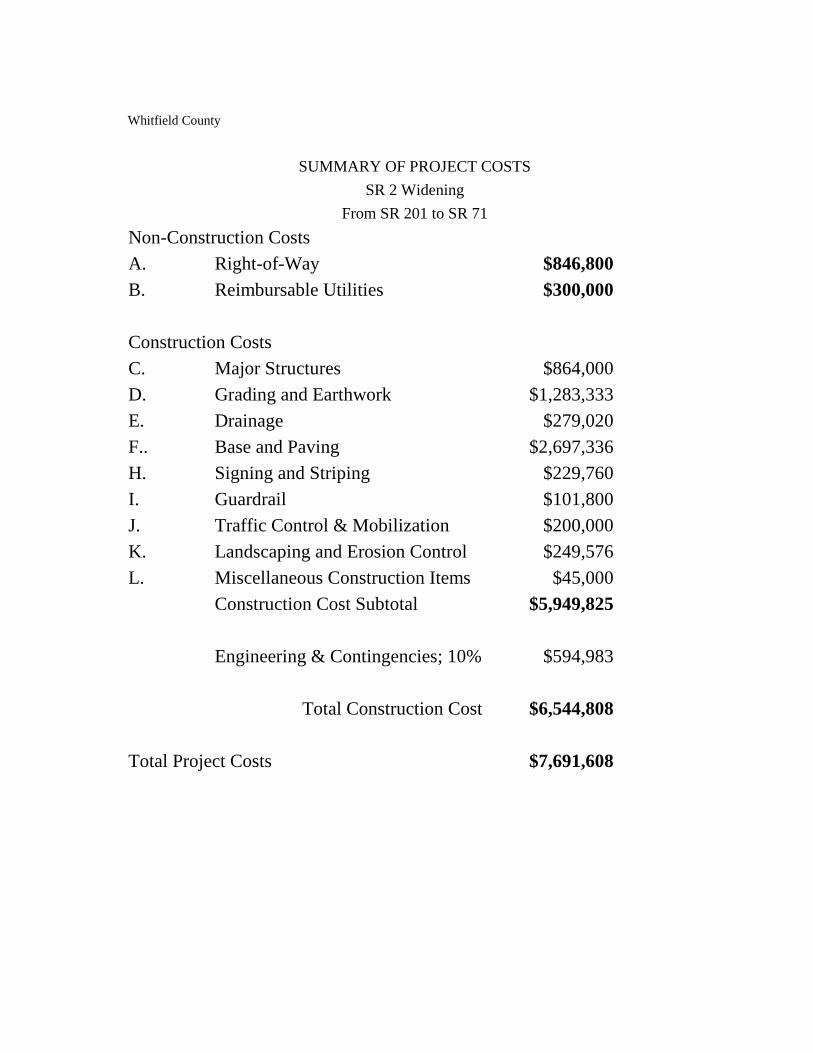
Whitfield County
SUMMARY OF PROJECT COSTS
Non-Construction Costs
A. Right-of-Way $846,800
B. Reimbursable Utilities $300,000
Construction Costs
C. Major Structures $864,000
D. Grading and Earthwork $1,283,333
E. Drainage $279,020
F.. Base and Paving $2,697,336
H. Signing and Striping $229,760
I. Guardrail $101,800
J. Traffic Control & Mobilization $200,000
K. Landscaping and Erosion Control $249,576
L. Miscellaneous Construction Items $45,000
Construction Cost Subtotal $5,949,825
Engineering & Contingencies; 10% $594,983
Total Construction Cost $6,544,808
Total Project Costs $7,691,608
SR 2 Widening
From SR 201 to SR 71

Whitfield County
SUMMARY OF PROJECT COSTS
Non-Construction Costs
A. Right-of-Way $3,594,480
B. Reimbursable Utilities $1,000,000
Construction Costs
C. Major Structures $0
D. Grading and Earthwork $1,102,933
E. Drainage $485,520
F.. Base and Paving $5,173,293
H. Signing and Striping $214,528
I. Guardrail $101,800
J. Traffic Control & Mobilization $400,000
K. Landscaping and Erosion Control $549,188
L. Miscellaneous Construction Items $45,000
Construction Cost Subtotal $8,072,263
Engineering & Contingencies; 10% $807,226
Total Construction Cost $8,879,489
Total Project Costs $13,473,969
SR 201 Widening
From I-75 to SR 2
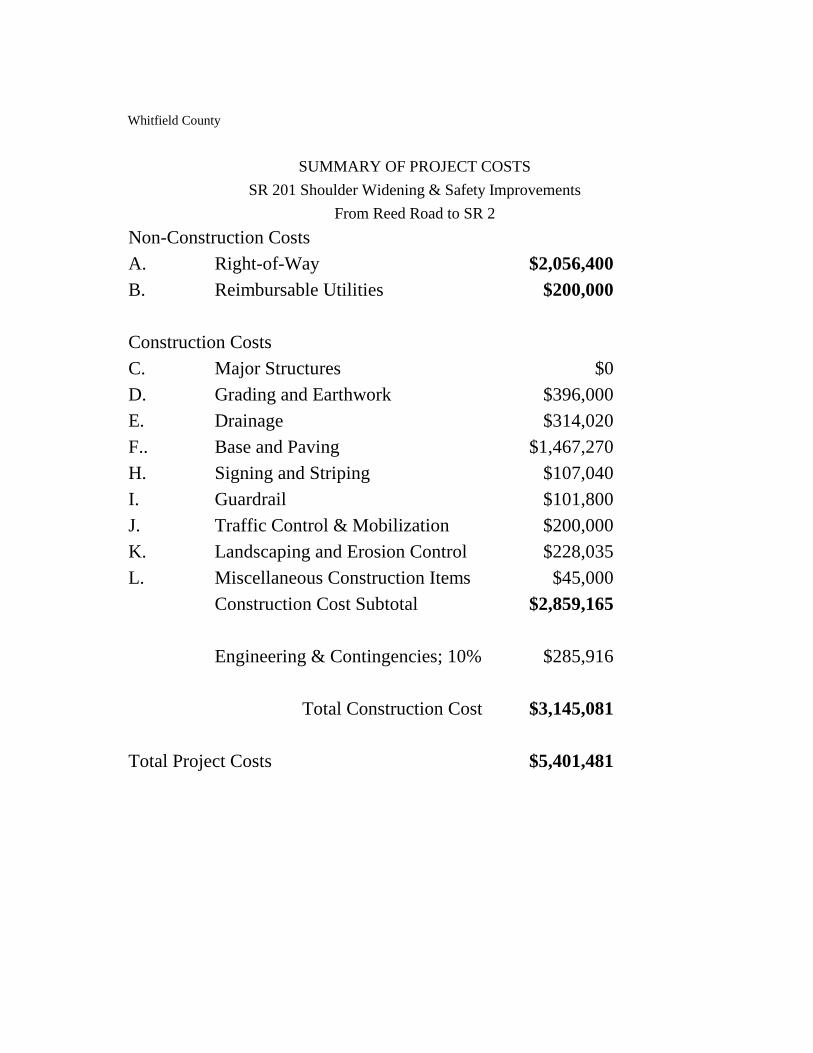
Whitfield County
SUMMARY OF PROJECT COSTS
Non-Construction Costs
A. Right-of-Way $2,056,400
B. Reimbursable Utilities $200,000
Construction Costs
C. Major Structures $0
D. Grading and Earthwork $396,000
E. Drainage $314,020
F.. Base and Paving $1,467,270
H. Signing and Striping $107,040
I. Guardrail $101,800
J. Traffic Control & Mobilization $200,000
K. Landscaping and Erosion Control $228,035
L. Miscellaneous Construction Items $45,000
Construction Cost Subtotal $2,859,165
Engineering & Contingencies; 10% $285,916
Total Construction Cost $3,145,081
Total Project Costs $5,401,481
SR 201 Shoulder Widening & Safety Improvements
From Reed Road to SR 2
16-Sep-11 B
Appendix B – Highway Capacity Analysis Worksheets

HCS+: Two-Lane Highways Release 5.2 Phone: Fax: E-Mail: ___________________Two-Way Two-Lane Highway Segment Analysis__________________ Analyst William Ruhsam Agency/Co. Moreland Altobelli Date Performed 7/11/11 Analysis Time Period Highway SR 2 From/To Eastern Leg Jurisdiction Whitfield County Analysis Year 2009 Description North Whitfield County Corridor Study ___________________________________Input Data_________________________________ Highway class Class 1 Shoulder width 1.0 ft Peak-hour factor, PHF 0.90 Lane width 12.0 ft % Trucks and buses 12 % Segment length 6.0 mi % Recreational vehicles 0 % Terrain type Rolling % No-passing zones 0 % Grade: Length mi Access points/mi 8 /mi Up/down % Two-way hourly volume, V 656 veh/h Directional split 60 / 40 % ____________________________Average Travel Speed______________________________ Grade adjustment factor, fG 0.93 PCE for trucks, ET 1.9 PCE for RVs, ER 1.1 Heavy-vehicle adjustment factor, 0.903 Two-way flow rate,(note-1) vp 868 pc/h Highest directional split proportion (note-2) 521 pc/h Free-Flow Speed from Field Measurement: Field measured speed, SFM - mi/h Observed volume, Vf - veh/h Estimated Free-Flow Speed: Base free-flow speed, BFFS 60.0 mi/h Adj. for lane and shoulder width, fLS 4.2 mi/h Adj. for access points, fA 2.0 mi/h Free-flow speed, FFS 53.8 mi/h Adjustment for no-passing zones, fnp 0.0 mi/h Average travel speed, ATS 47.1 mi/h

__________________________Percent Time-Spent-Following________________________ Grade adjustment factor, fG 0.94 PCE for trucks, ET 1.5 PCE for RVs, ER 1.0 Heavy-vehicle adjustment factor, fHV 0.943 Two-way flow rate,(note-1) vp 822 pc/h Highest directional split proportion (note-2) 493 Base percent time-spent-following, BPTSF 51.4 % Adj.for directional distribution and no-passing zones, fd/np 0.0 Percent time-spent-following, PTSF 51.4 % ________________Level of Service and Other Performance Measures_______________ Level of service, LOS C Volume to capacity ratio, v/c 0.27 Peak 15-min vehicle-miles of travel, VMT15 1093 veh-mi Peak-hour vehicle-miles of travel, VMT60 3936 veh-mi Peak 15-min total travel time, TT15 23.2 veh-h ______________________________________________________________________________ Notes: 1. If vp >= 3200 pc/h, terminate analysis-the LOS is F. 2. If highest directional split vp >= 1700 pc/h, terminate analysis-the LOS is F.
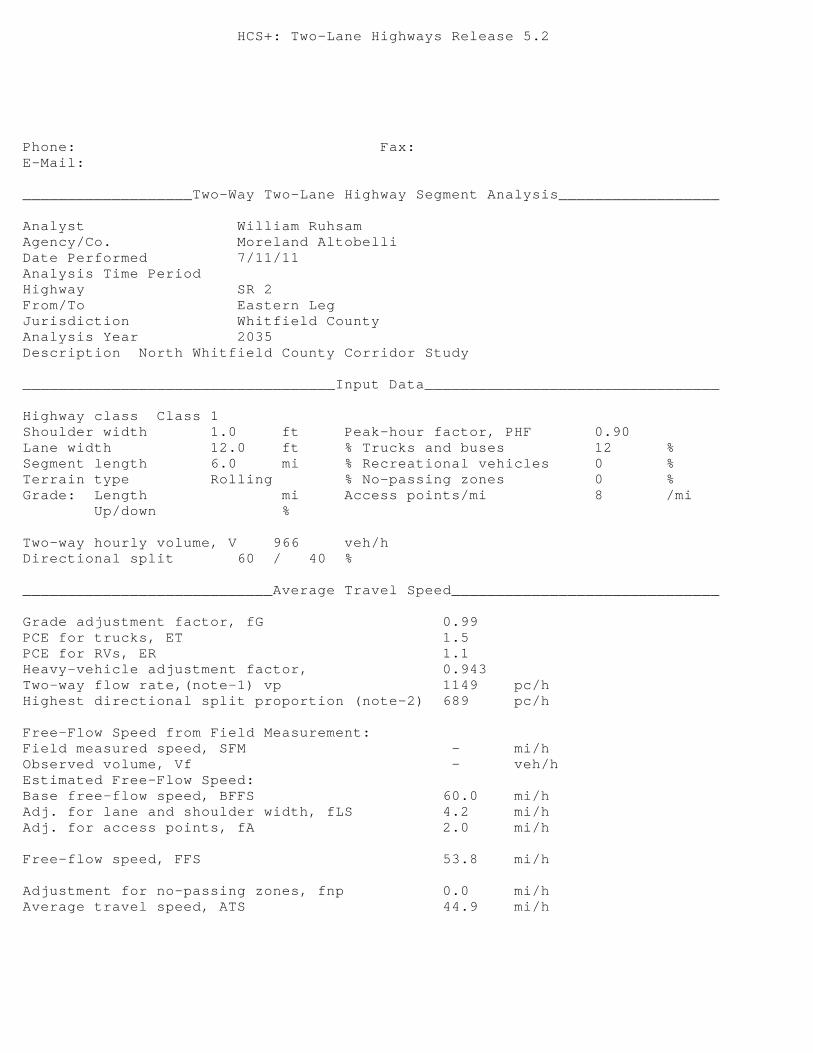
HCS+: Two-Lane Highways Release 5.2 Phone: Fax: E-Mail: ___________________Two-Way Two-Lane Highway Segment Analysis__________________ Analyst William Ruhsam Agency/Co. Moreland Altobelli Date Performed 7/11/11 Analysis Time Period Highway SR 2 From/To Eastern Leg Jurisdiction Whitfield County Analysis Year 2035 Description North Whitfield County Corridor Study ___________________________________Input Data_________________________________ Highway class Class 1 Shoulder width 1.0 ft Peak-hour factor, PHF 0.90 Lane width 12.0 ft % Trucks and buses 12 % Segment length 6.0 mi % Recreational vehicles 0 % Terrain type Rolling % No-passing zones 0 % Grade: Length mi Access points/mi 8 /mi Up/down % Two-way hourly volume, V 966 veh/h Directional split 60 / 40 % ____________________________Average Travel Speed______________________________ Grade adjustment factor, fG 0.99 PCE for trucks, ET 1.5 PCE for RVs, ER 1.1 Heavy-vehicle adjustment factor, 0.943 Two-way flow rate,(note-1) vp 1149 pc/h Highest directional split proportion (note-2) 689 pc/h Free-Flow Speed from Field Measurement: Field measured speed, SFM - mi/h Observed volume, Vf - veh/h Estimated Free-Flow Speed: Base free-flow speed, BFFS 60.0 mi/h Adj. for lane and shoulder width, fLS 4.2 mi/h Adj. for access points, fA 2.0 mi/h Free-flow speed, FFS 53.8 mi/h Adjustment for no-passing zones, fnp 0.0 mi/h Average travel speed, ATS 44.9 mi/h

__________________________Percent Time-Spent-Following________________________ Grade adjustment factor, fG 1.00 PCE for trucks, ET 1.0 PCE for RVs, ER 1.0 Heavy-vehicle adjustment factor, fHV 1.000 Two-way flow rate,(note-1) vp 1073 pc/h Highest directional split proportion (note-2) 644 Base percent time-spent-following, BPTSF 61.1 % Adj.for directional distribution and no-passing zones, fd/np 0.0 Percent time-spent-following, PTSF 61.1 % ________________Level of Service and Other Performance Measures_______________ Level of service, LOS D Volume to capacity ratio, v/c 0.36 Peak 15-min vehicle-miles of travel, VMT15 1610 veh-mi Peak-hour vehicle-miles of travel, VMT60 5796 veh-mi Peak 15-min total travel time, TT15 35.9 veh-h ______________________________________________________________________________ Notes: 1. If vp >= 3200 pc/h, terminate analysis-the LOS is F. 2. If highest directional split vp >= 1700 pc/h, terminate analysis-the LOS is F.

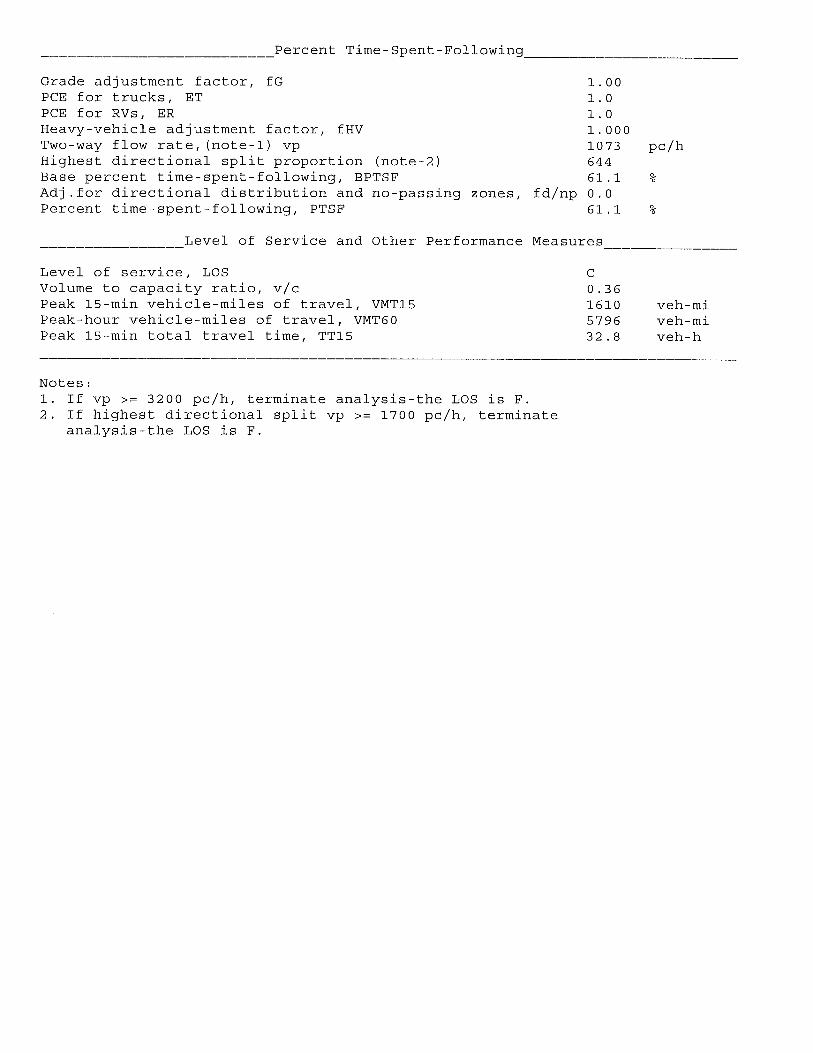

HCS+: Two-Lane Highways Release 5.2 Phone: Fax: E-Mail: ___________________Two-Way Two-Lane Highway Segment Analysis__________________ Analyst William Ruhsam Agency/Co. Moreland Altobelli Date Performed 7/11/11 Analysis Time Period Highway SR 2 From/To Middle Leg Jurisdiction Whitfield County Analysis Year 2009 Description North Whitfield County Corridor Study ___________________________________Input Data_________________________________ Highway class Class 1 Shoulder width 1.0 ft Peak-hour factor, PHF 0.90 Lane width 12.0 ft % Trucks and buses 12 % Segment length 6.0 mi % Recreational vehicles 0 % Terrain type Rolling % No-passing zones 0 % Grade: Length mi Access points/mi 8 /mi Up/down % Two-way hourly volume, V 379 veh/h Directional split 60 / 40 % ____________________________Average Travel Speed______________________________ Grade adjustment factor, fG 0.93 PCE for trucks, ET 1.9 PCE for RVs, ER 1.1 Heavy-vehicle adjustment factor, 0.903 Two-way flow rate,(note-1) vp 502 pc/h Highest directional split proportion (note-2) 301 pc/h Free-Flow Speed from Field Measurement: Field measured speed, SFM - mi/h Observed volume, Vf - veh/h Estimated Free-Flow Speed: Base free-flow speed, BFFS 60.0 mi/h Adj. for lane and shoulder width, fLS 4.2 mi/h Adj. for access points, fA 2.0 mi/h Free-flow speed, FFS 53.8 mi/h Adjustment for no-passing zones, fnp 0.0 mi/h Average travel speed, ATS 49.9 mi/h

__________________________Percent Time-Spent-Following________________________ Grade adjustment factor, fG 0.77 PCE for trucks, ET 1.8 PCE for RVs, ER 1.0 Heavy-vehicle adjustment factor, fHV 0.912 Two-way flow rate,(note-1) vp 599 pc/h Highest directional split proportion (note-2) 359 Base percent time-spent-following, BPTSF 40.9 % Adj.for directional distribution and no-passing zones, fd/np 0.0 Percent time-spent-following, PTSF 40.9 % ________________Level of Service and Other Performance Measures_______________ Level of service, LOS C Volume to capacity ratio, v/c 0.16 Peak 15-min vehicle-miles of travel, VMT15 632 veh-mi Peak-hour vehicle-miles of travel, VMT60 2274 veh-mi Peak 15-min total travel time, TT15 12.7 veh-h ______________________________________________________________________________ Notes: 1. If vp >= 3200 pc/h, terminate analysis-the LOS is F. 2. If highest directional split vp >= 1700 pc/h, terminate analysis-the LOS is F.

HCS+: Two-Lane Highways Release 5.2 Phone: Fax: E-Mail: ___________________Two-Way Two-Lane Highway Segment Analysis__________________ Analyst William Ruhsam Agency/Co. Moreland Altobelli Date Performed 7/11/11 Analysis Time Period Highway SR 2 From/To Middle Leg Jurisdiction Whitfield County Analysis Year 2035 Description North Whitfield County Corridor Study ___________________________________Input Data_________________________________ Highway class Class 1 Shoulder width 1.0 ft Peak-hour factor, PHF 0.90 Lane width 12.0 ft % Trucks and buses 12 % Segment length 6.0 mi % Recreational vehicles 0 % Terrain type Rolling % No-passing zones 0 % Grade: Length mi Access points/mi 8 /mi Up/down % Two-way hourly volume, V 558 veh/h Directional split 60 / 40 % ____________________________Average Travel Speed______________________________ Grade adjustment factor, fG 0.93 PCE for trucks, ET 1.9 PCE for RVs, ER 1.1 Heavy-vehicle adjustment factor, 0.903 Two-way flow rate,(note-1) vp 739 pc/h Highest directional split proportion (note-2) 443 pc/h Free-Flow Speed from Field Measurement: Field measured speed, SFM - mi/h Observed volume, Vf - veh/h Estimated Free-Flow Speed: Base free-flow speed, BFFS 60.0 mi/h Adj. for lane and shoulder width, fLS 4.2 mi/h Adj. for access points, fA 2.0 mi/h Free-flow speed, FFS 53.8 mi/h Adjustment for no-passing zones, fnp 0.0 mi/h Average travel speed, ATS 48.1 mi/h

__________________________Percent Time-Spent-Following________________________ Grade adjustment factor, fG 0.94 PCE for trucks, ET 1.5 PCE for RVs, ER 1.0 Heavy-vehicle adjustment factor, fHV 0.943 Two-way flow rate,(note-1) vp 699 pc/h Highest directional split proportion (note-2) 419 Base percent time-spent-following, BPTSF 45.9 % Adj.for directional distribution and no-passing zones, fd/np 0.0 Percent time-spent-following, PTSF 45.9 % ________________Level of Service and Other Performance Measures_______________ Level of service, LOS C Volume to capacity ratio, v/c 0.23 Peak 15-min vehicle-miles of travel, VMT15 930 veh-mi Peak-hour vehicle-miles of travel, VMT60 3348 veh-mi Peak 15-min total travel time, TT15 19.3 veh-h ______________________________________________________________________________ Notes: 1. If vp >= 3200 pc/h, terminate analysis-the LOS is F. 2. If highest directional split vp >= 1700 pc/h, terminate analysis-the LOS is F.
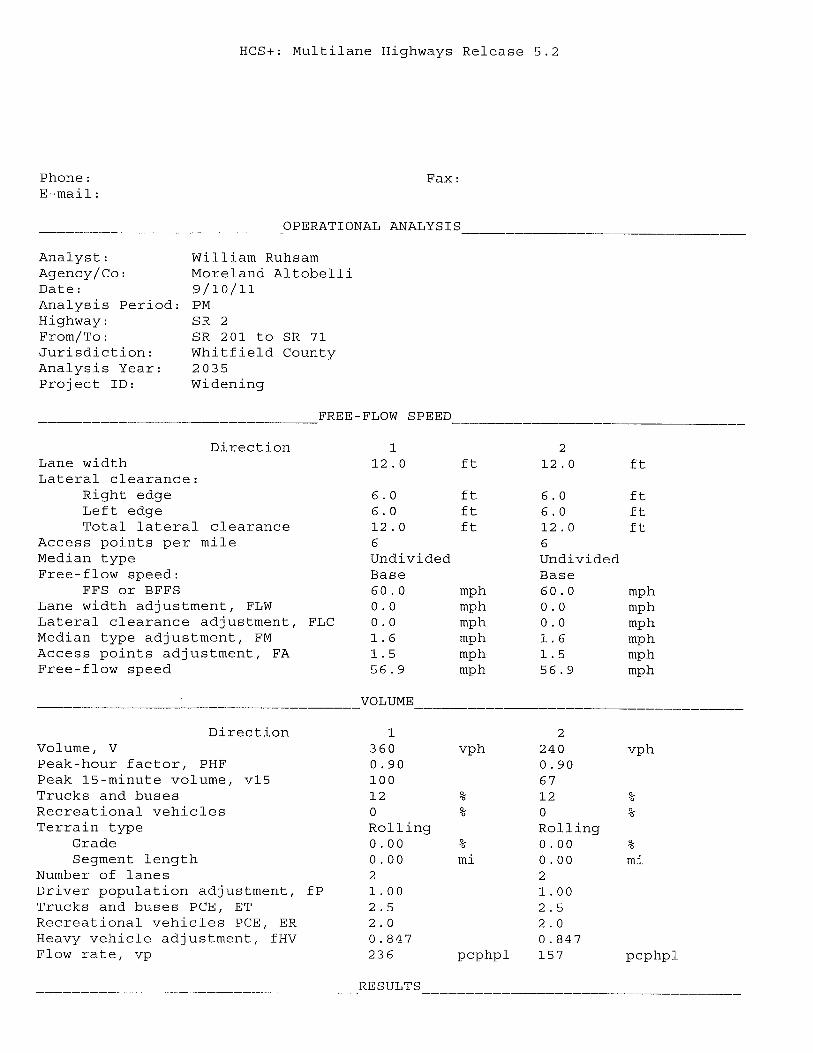
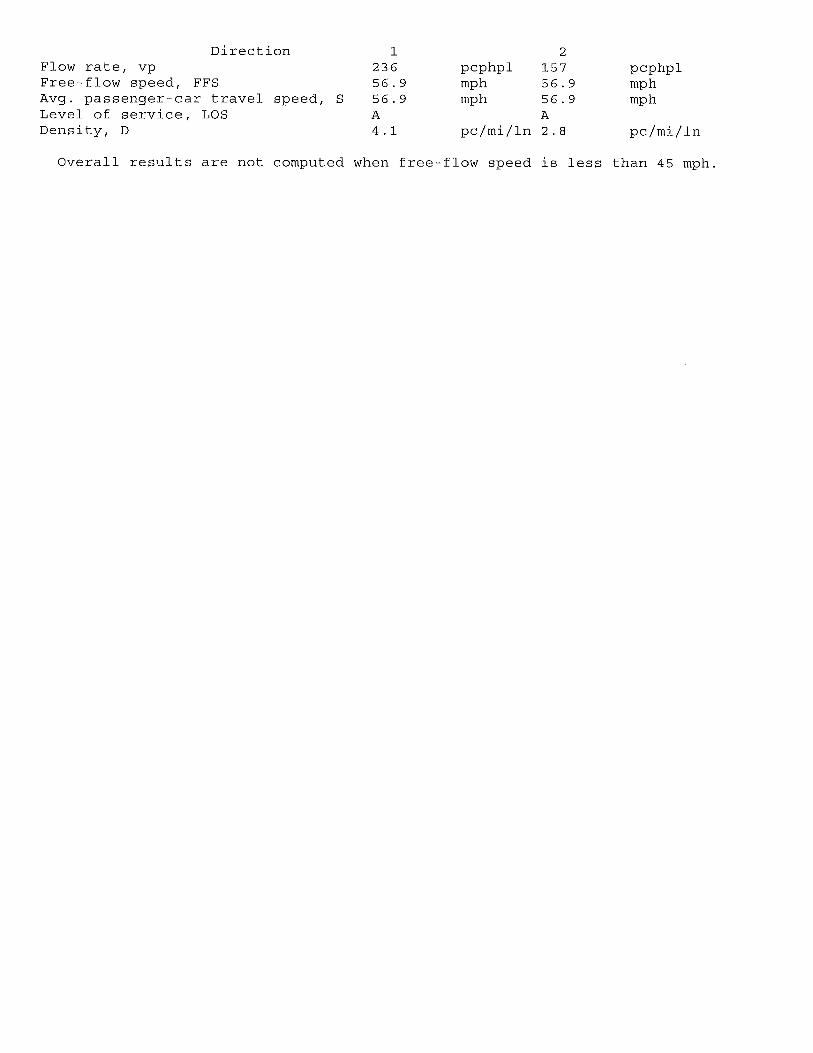

HCS+: Two-Lane Highways Release 5.2 Phone: Fax: E-Mail: ___________________Two-Way Two-Lane Highway Segment Analysis__________________ Analyst William Ruhsam Agency/Co. Moreland Altobelli Date Performed 7/11/11 Analysis Time Period Highway SR 2 From/To Western Leg Jurisdiction Whitfield County Analysis Year 2009 Description North Whitfield County Corridor Study ___________________________________Input Data_________________________________ Highway class Class 1 Shoulder width 1.0 ft Peak-hour factor, PHF 0.90 Lane width 12.0 ft % Trucks and buses 12 % Segment length 6.0 mi % Recreational vehicles 0 % Terrain type Rolling % No-passing zones 0 % Grade: Length mi Access points/mi 8 /mi Up/down % Two-way hourly volume, V 173 veh/h Directional split 60 / 40 % ____________________________Average Travel Speed______________________________ Grade adjustment factor, fG 0.71 PCE for trucks, ET 2.5 PCE for RVs, ER 1.1 Heavy-vehicle adjustment factor, 0.847 Two-way flow rate,(note-1) vp 319 pc/h Highest directional split proportion (note-2) 191 pc/h Free-Flow Speed from Field Measurement: Field measured speed, SFM - mi/h Observed volume, Vf - veh/h Estimated Free-Flow Speed: Base free-flow speed, BFFS 60.0 mi/h Adj. for lane and shoulder width, fLS 4.2 mi/h Adj. for access points, fA 2.0 mi/h Free-flow speed, FFS 53.8 mi/h Adjustment for no-passing zones, fnp 0.0 mi/h Average travel speed, ATS 51.3 mi/h

__________________________Percent Time-Spent-Following________________________ Grade adjustment factor, fG 0.77 PCE for trucks, ET 1.8 PCE for RVs, ER 1.0 Heavy-vehicle adjustment factor, fHV 0.912 Two-way flow rate,(note-1) vp 274 pc/h Highest directional split proportion (note-2) 164 Base percent time-spent-following, BPTSF 21.4 % Adj.for directional distribution and no-passing zones, fd/np 1.2 Percent time-spent-following, PTSF 22.6 % ________________Level of Service and Other Performance Measures_______________ Level of service, LOS B Volume to capacity ratio, v/c 0.10 Peak 15-min vehicle-miles of travel, VMT15 288 veh-mi Peak-hour vehicle-miles of travel, VMT60 1038 veh-mi Peak 15-min total travel time, TT15 5.6 veh-h ______________________________________________________________________________ Notes: 1. If vp >= 3200 pc/h, terminate analysis-the LOS is F. 2. If highest directional split vp >= 1700 pc/h, terminate analysis-the LOS is F.

HCS+: Two-Lane Highways Release 5.2 Phone: Fax: E-Mail: ___________________Two-Way Two-Lane Highway Segment Analysis__________________ Analyst William Ruhsam Agency/Co. Moreland Altobelli Date Performed 7/11/11 Analysis Time Period Highway SR 2 From/To Western Leg Jurisdiction Whitfield County Analysis Year 2035 Description North Whitfield County Corridor Study ___________________________________Input Data_________________________________ Highway class Class 1 Shoulder width 1.0 ft Peak-hour factor, PHF 0.90 Lane width 12.0 ft % Trucks and buses 12 % Segment length 6.0 mi % Recreational vehicles 0 % Terrain type Rolling % No-passing zones 0 % Grade: Length mi Access points/mi 8 /mi Up/down % Two-way hourly volume, V 257 veh/h Directional split 60 / 40 % ____________________________Average Travel Speed______________________________ Grade adjustment factor, fG 0.71 PCE for trucks, ET 2.5 PCE for RVs, ER 1.1 Heavy-vehicle adjustment factor, 0.847 Two-way flow rate,(note-1) vp 475 pc/h Highest directional split proportion (note-2) 285 pc/h Free-Flow Speed from Field Measurement: Field measured speed, SFM - mi/h Observed volume, Vf - veh/h Estimated Free-Flow Speed: Base free-flow speed, BFFS 60.0 mi/h Adj. for lane and shoulder width, fLS 4.2 mi/h Adj. for access points, fA 2.0 mi/h Free-flow speed, FFS 53.8 mi/h Adjustment for no-passing zones, fnp 0.0 mi/h Average travel speed, ATS 50.1 mi/h

__________________________Percent Time-Spent-Following________________________ Grade adjustment factor, fG 0.77 PCE for trucks, ET 1.8 PCE for RVs, ER 1.0 Heavy-vehicle adjustment factor, fHV 0.912 Two-way flow rate,(note-1) vp 406 pc/h Highest directional split proportion (note-2) 244 Base percent time-spent-following, BPTSF 30.0 % Adj.for directional distribution and no-passing zones, fd/np 0.5 Percent time-spent-following, PTSF 30.5 % ________________Level of Service and Other Performance Measures_______________ Level of service, LOS B Volume to capacity ratio, v/c 0.15 Peak 15-min vehicle-miles of travel, VMT15 428 veh-mi Peak-hour vehicle-miles of travel, VMT60 1542 veh-mi Peak 15-min total travel time, TT15 8.5 veh-h ______________________________________________________________________________ Notes: 1. If vp >= 3200 pc/h, terminate analysis-the LOS is F. 2. If highest directional split vp >= 1700 pc/h, terminate analysis-the LOS is F.

HCS+: Two-Lane Highways Release 5.2 Phone: Fax: E-Mail: ___________________Two-Way Two-Lane Highway Segment Analysis__________________ Analyst William Ruhsam Agency/Co. Moreland Altobelli Date Performed 7/11/11 Analysis Time Period Highway SR 201 From/To Eastern Leg Jurisdiction Whitfield County Analysis Year 2009 Description North Whitfield County Corridor Study ___________________________________Input Data_________________________________ Highway class Class 1 Shoulder width 1.0 ft Peak-hour factor, PHF 0.90 Lane width 12.0 ft % Trucks and buses 12 % Segment length 6.0 mi % Recreational vehicles 0 % Terrain type Rolling % No-passing zones 0 % Grade: Length mi Access points/mi 8 /mi Up/down % Two-way hourly volume, V 487 veh/h Directional split 60 / 40 % ____________________________Average Travel Speed______________________________ Grade adjustment factor, fG 0.93 PCE for trucks, ET 1.9 PCE for RVs, ER 1.1 Heavy-vehicle adjustment factor, 0.903 Two-way flow rate,(note-1) vp 645 pc/h Highest directional split proportion (note-2) 387 pc/h Free-Flow Speed from Field Measurement: Field measured speed, SFM - mi/h Observed volume, Vf - veh/h Estimated Free-Flow Speed: Base free-flow speed, BFFS 60.0 mi/h Adj. for lane and shoulder width, fLS 4.2 mi/h Adj. for access points, fA 2.0 mi/h Free-flow speed, FFS 53.8 mi/h Adjustment for no-passing zones, fnp 0.0 mi/h Average travel speed, ATS 48.8 mi/h

__________________________Percent Time-Spent-Following________________________ Grade adjustment factor, fG 0.94 PCE for trucks, ET 1.5 PCE for RVs, ER 1.0 Heavy-vehicle adjustment factor, fHV 0.943 Two-way flow rate,(note-1) vp 610 pc/h Highest directional split proportion (note-2) 366 Base percent time-spent-following, BPTSF 41.5 % Adj.for directional distribution and no-passing zones, fd/np 0.0 Percent time-spent-following, PTSF 41.5 % ________________Level of Service and Other Performance Measures_______________ Level of service, LOS C Volume to capacity ratio, v/c 0.20 Peak 15-min vehicle-miles of travel, VMT15 812 veh-mi Peak-hour vehicle-miles of travel, VMT60 2922 veh-mi Peak 15-min total travel time, TT15 16.6 veh-h ______________________________________________________________________________ Notes: 1. If vp >= 3200 pc/h, terminate analysis-the LOS is F. 2. If highest directional split vp >= 1700 pc/h, terminate analysis-the LOS is F.

HCS+: Two-Lane Highways Release 5.2 Phone: Fax: E-Mail: ___________________Two-Way Two-Lane Highway Segment Analysis__________________ Analyst William Ruhsam Agency/Co. Moreland Altobelli Date Performed 7/11/11 Analysis Time Period Highway SR 201 From/To Eastern Leg Jurisdiction Whitfield County Analysis Year 2035 Description North Whitfield County Corridor Study ___________________________________Input Data_________________________________ Highway class Class 1 Shoulder width 1.0 ft Peak-hour factor, PHF 0.90 Lane width 12.0 ft % Trucks and buses 12 % Segment length 6.0 mi % Recreational vehicles 0 % Terrain type Rolling % No-passing zones 0 % Grade: Length mi Access points/mi 8 /mi Up/down % Two-way hourly volume, V 717 veh/h Directional split 60 / 40 % ____________________________Average Travel Speed______________________________ Grade adjustment factor, fG 0.93 PCE for trucks, ET 1.9 PCE for RVs, ER 1.1 Heavy-vehicle adjustment factor, 0.903 Two-way flow rate,(note-1) vp 949 pc/h Highest directional split proportion (note-2) 569 pc/h Free-Flow Speed from Field Measurement: Field measured speed, SFM - mi/h Observed volume, Vf - veh/h Estimated Free-Flow Speed: Base free-flow speed, BFFS 60.0 mi/h Adj. for lane and shoulder width, fLS 4.2 mi/h Adj. for access points, fA 2.0 mi/h Free-flow speed, FFS 53.8 mi/h Adjustment for no-passing zones, fnp 0.0 mi/h Average travel speed, ATS 46.4 mi/h
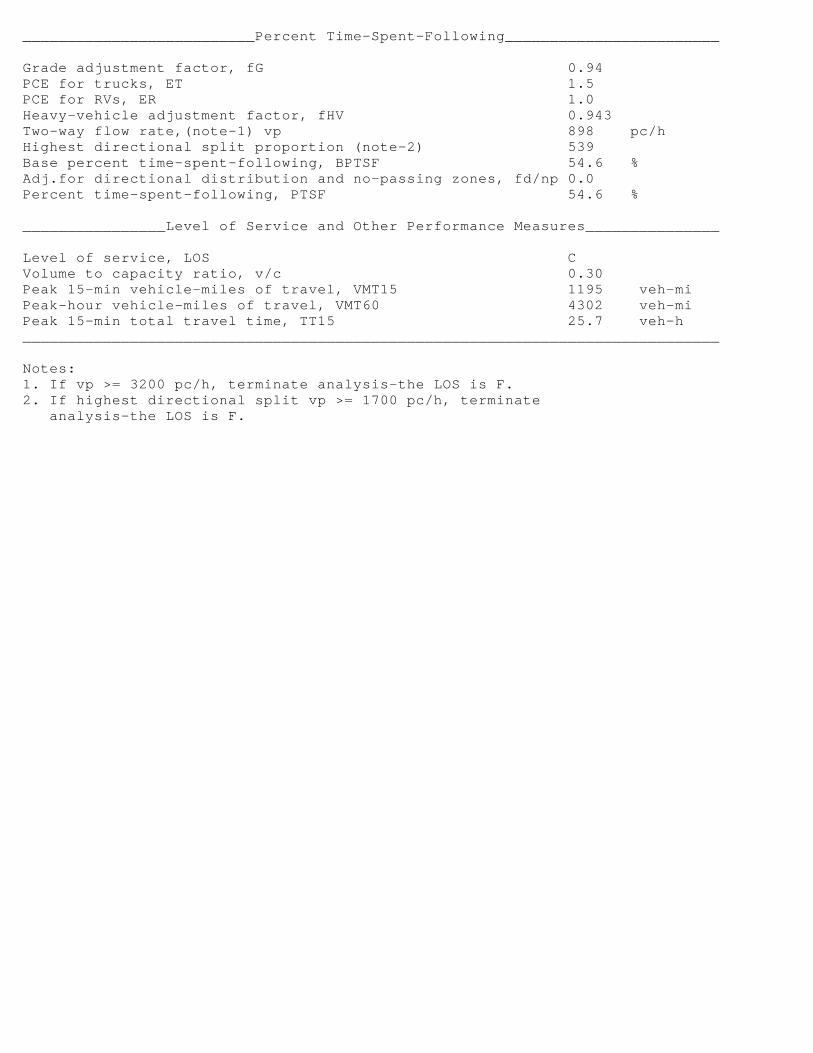
__________________________Percent Time-Spent-Following________________________ Grade adjustment factor, fG 0.94 PCE for trucks, ET 1.5 PCE for RVs, ER 1.0 Heavy-vehicle adjustment factor, fHV 0.943 Two-way flow rate,(note-1) vp 898 pc/h Highest directional split proportion (note-2) 539 Base percent time-spent-following, BPTSF 54.6 % Adj.for directional distribution and no-passing zones, fd/np 0.0 Percent time-spent-following, PTSF 54.6 % ________________Level of Service and Other Performance Measures_______________ Level of service, LOS C Volume to capacity ratio, v/c 0.30 Peak 15-min vehicle-miles of travel, VMT15 1195 veh-mi Peak-hour vehicle-miles of travel, VMT60 4302 veh-mi Peak 15-min total travel time, TT15 25.7 veh-h ______________________________________________________________________________ Notes: 1. If vp >= 3200 pc/h, terminate analysis-the LOS is F. 2. If highest directional split vp >= 1700 pc/h, terminate analysis-the LOS is F.

HCS+: Two-Lane Highways Release 5.2 Phone: Fax: E-Mail: ___________________Two-Way Two-Lane Highway Segment Analysis__________________ Analyst William Ruhsam Agency/Co. Moreland Altobelli Date Performed 7/11/11 Analysis Time Period Highway SR 201 From/To Middle Leg Jurisdiction Whitfield County Analysis Year 2009 Description North Whitfield County Corridor Study ___________________________________Input Data_________________________________ Highway class Class 1 Shoulder width 1.0 ft Peak-hour factor, PHF 0.90 Lane width 12.0 ft % Trucks and buses 12 % Segment length 6.0 mi % Recreational vehicles 0 % Terrain type Rolling % No-passing zones 0 % Grade: Length mi Access points/mi 8 /mi Up/down % Two-way hourly volume, V 806 veh/h Directional split 60 / 40 % ____________________________Average Travel Speed______________________________ Grade adjustment factor, fG 0.93 PCE for trucks, ET 1.9 PCE for RVs, ER 1.1 Heavy-vehicle adjustment factor, 0.903 Two-way flow rate,(note-1) vp 1067 pc/h Highest directional split proportion (note-2) 640 pc/h Free-Flow Speed from Field Measurement: Field measured speed, SFM - mi/h Observed volume, Vf - veh/h Estimated Free-Flow Speed: Base free-flow speed, BFFS 60.0 mi/h Adj. for lane and shoulder width, fLS 4.2 mi/h Adj. for access points, fA 2.0 mi/h Free-flow speed, FFS 53.8 mi/h Adjustment for no-passing zones, fnp 0.0 mi/h Average travel speed, ATS 45.5 mi/h

__________________________Percent Time-Spent-Following________________________ Grade adjustment factor, fG 0.94 PCE for trucks, ET 1.5 PCE for RVs, ER 1.0 Heavy-vehicle adjustment factor, fHV 0.943 Two-way flow rate,(note-1) vp 1010 pc/h Highest directional split proportion (note-2) 606 Base percent time-spent-following, BPTSF 58.8 % Adj.for directional distribution and no-passing zones, fd/np 0.0 Percent time-spent-following, PTSF 58.8 % ________________Level of Service and Other Performance Measures_______________ Level of service, LOS C Volume to capacity ratio, v/c 0.33 Peak 15-min vehicle-miles of travel, VMT15 1343 veh-mi Peak-hour vehicle-miles of travel, VMT60 4836 veh-mi Peak 15-min total travel time, TT15 29.5 veh-h ______________________________________________________________________________ Notes: 1. If vp >= 3200 pc/h, terminate analysis-the LOS is F. 2. If highest directional split vp >= 1700 pc/h, terminate analysis-the LOS is F.

HCS+: Two-Lane Highways Release 5.2 Phone: Fax: E-Mail: ___________________Two-Way Two-Lane Highway Segment Analysis__________________ Analyst William Ruhsam Agency/Co. Moreland Altobelli Date Performed 7/11/11 Analysis Time Period Highway SR 201 From/To Middle Leg Jurisdiction Whitfield County Analysis Year 2035 Description North Whitfield County Corridor Study ___________________________________Input Data_________________________________ Highway class Class 1 Shoulder width 1.0 ft Peak-hour factor, PHF 0.90 Lane width 12.0 ft % Trucks and buses 12 % Segment length 6.0 mi % Recreational vehicles 0 % Terrain type Rolling % No-passing zones 0 % Grade: Length mi Access points/mi 8 /mi Up/down % Two-way hourly volume, V 1188 veh/h Directional split 60 / 40 % ____________________________Average Travel Speed______________________________ Grade adjustment factor, fG 0.99 PCE for trucks, ET 1.5 PCE for RVs, ER 1.1 Heavy-vehicle adjustment factor, 0.943 Two-way flow rate,(note-1) vp 1413 pc/h Highest directional split proportion (note-2) 848 pc/h Free-Flow Speed from Field Measurement: Field measured speed, SFM - mi/h Observed volume, Vf - veh/h Estimated Free-Flow Speed: Base free-flow speed, BFFS 60.0 mi/h Adj. for lane and shoulder width, fLS 4.2 mi/h Adj. for access points, fA 2.0 mi/h Free-flow speed, FFS 53.8 mi/h Adjustment for no-passing zones, fnp 0.0 mi/h Average travel speed, ATS 42.8 mi/h

__________________________Percent Time-Spent-Following________________________ Grade adjustment factor, fG 1.00 PCE for trucks, ET 1.0 PCE for RVs, ER 1.0 Heavy-vehicle adjustment factor, fHV 1.000 Two-way flow rate,(note-1) vp 1320 pc/h Highest directional split proportion (note-2) 792 Base percent time-spent-following, BPTSF 68.7 % Adj.for directional distribution and no-passing zones, fd/np 0.0 Percent time-spent-following, PTSF 68.7 % ________________Level of Service and Other Performance Measures_______________ Level of service, LOS D Volume to capacity ratio, v/c 0.44 Peak 15-min vehicle-miles of travel, VMT15 1980 veh-mi Peak-hour vehicle-miles of travel, VMT60 7128 veh-mi Peak 15-min total travel time, TT15 46.2 veh-h ______________________________________________________________________________ Notes: 1. If vp >= 3200 pc/h, terminate analysis-the LOS is F. 2. If highest directional split vp >= 1700 pc/h, terminate analysis-the LOS is F.


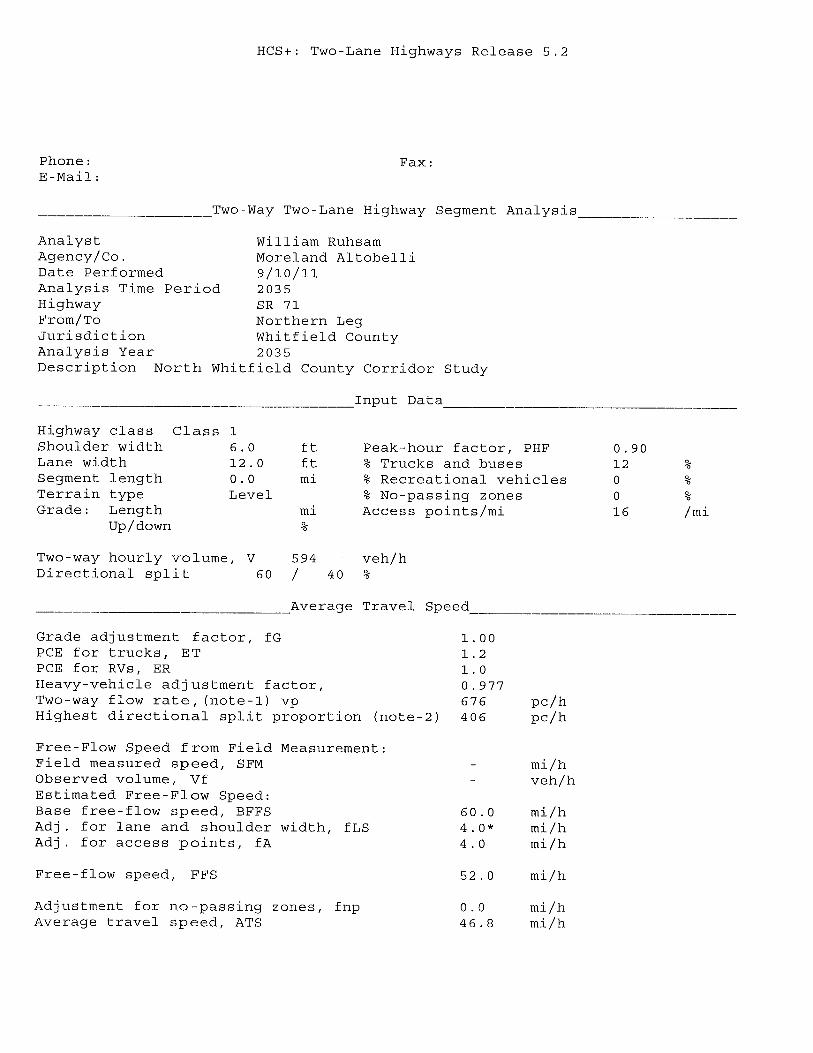
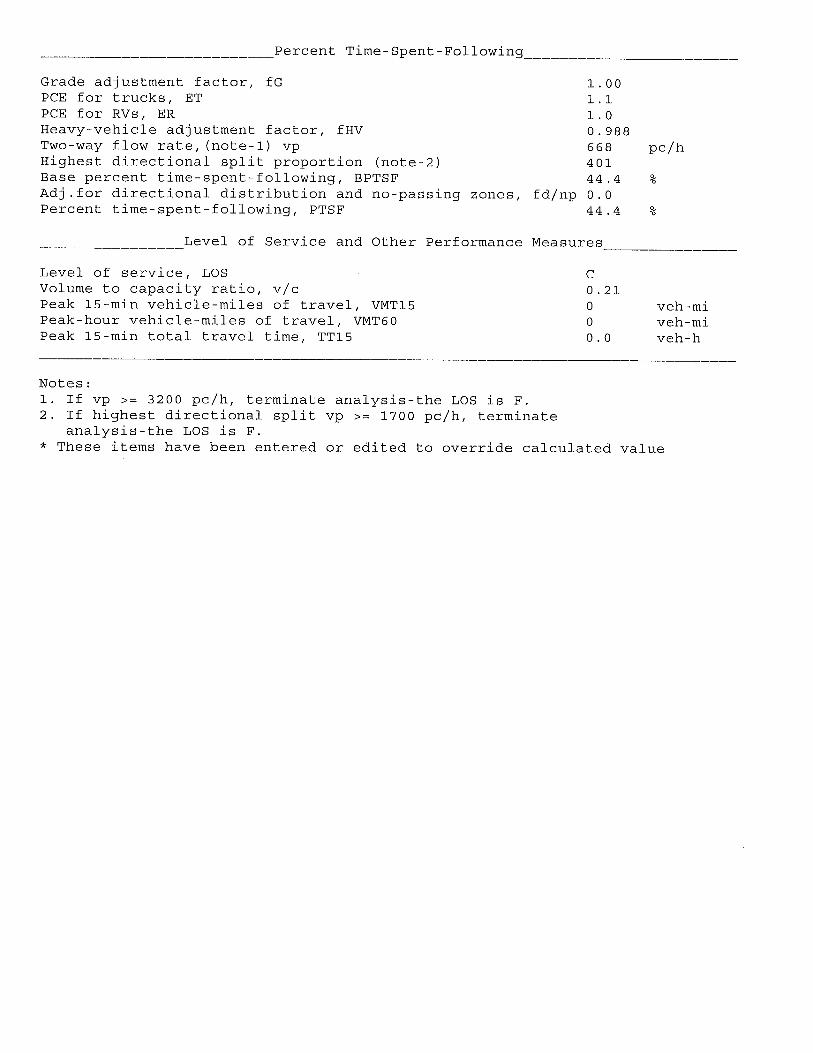

HCS+: Two-Lane Highways Release 5.2 Phone: Fax: E-Mail: ___________________Two-Way Two-Lane Highway Segment Analysis__________________ Analyst William Ruhsam Agency/Co. Moreland Altobelli Date Performed 7/11/11 Analysis Time Period Highway SR 201 From/To Western Leg Jurisdiction Whitfield County Analysis Year 2009 Description North Whitfield County Corridor Study ___________________________________Input Data_________________________________ Highway class Class 1 Shoulder width 1.0 ft Peak-hour factor, PHF 0.90 Lane width 12.0 ft % Trucks and buses 12 % Segment length 6.0 mi % Recreational vehicles 0 % Terrain type Rolling % No-passing zones 0 % Grade: Length mi Access points/mi 8 /mi Up/down % Two-way hourly volume, V 274 veh/h Directional split 60 / 40 % ____________________________Average Travel Speed______________________________ Grade adjustment factor, fG 0.71 PCE for trucks, ET 2.5 PCE for RVs, ER 1.1 Heavy-vehicle adjustment factor, 0.847 Two-way flow rate,(note-1) vp 506 pc/h Highest directional split proportion (note-2) 304 pc/h Free-Flow Speed from Field Measurement: Field measured speed, SFM - mi/h Observed volume, Vf - veh/h Estimated Free-Flow Speed: Base free-flow speed, BFFS 60.0 mi/h Adj. for lane and shoulder width, fLS 4.2 mi/h Adj. for access points, fA 2.0 mi/h Free-flow speed, FFS 53.8 mi/h Adjustment for no-passing zones, fnp 0.0 mi/h Average travel speed, ATS 49.9 mi/h

__________________________Percent Time-Spent-Following________________________ Grade adjustment factor, fG 0.77 PCE for trucks, ET 1.8 PCE for RVs, ER 1.0 Heavy-vehicle adjustment factor, fHV 0.912 Two-way flow rate,(note-1) vp 433 pc/h Highest directional split proportion (note-2) 260 Base percent time-spent-following, BPTSF 31.7 % Adj.for directional distribution and no-passing zones, fd/np 0.4 Percent time-spent-following, PTSF 32.1 % ________________Level of Service and Other Performance Measures_______________ Level of service, LOS C Volume to capacity ratio, v/c 0.16 Peak 15-min vehicle-miles of travel, VMT15 457 veh-mi Peak-hour vehicle-miles of travel, VMT60 1644 veh-mi Peak 15-min total travel time, TT15 9.2 veh-h ______________________________________________________________________________ Notes: 1. If vp >= 3200 pc/h, terminate analysis-the LOS is F. 2. If highest directional split vp >= 1700 pc/h, terminate analysis-the LOS is F.
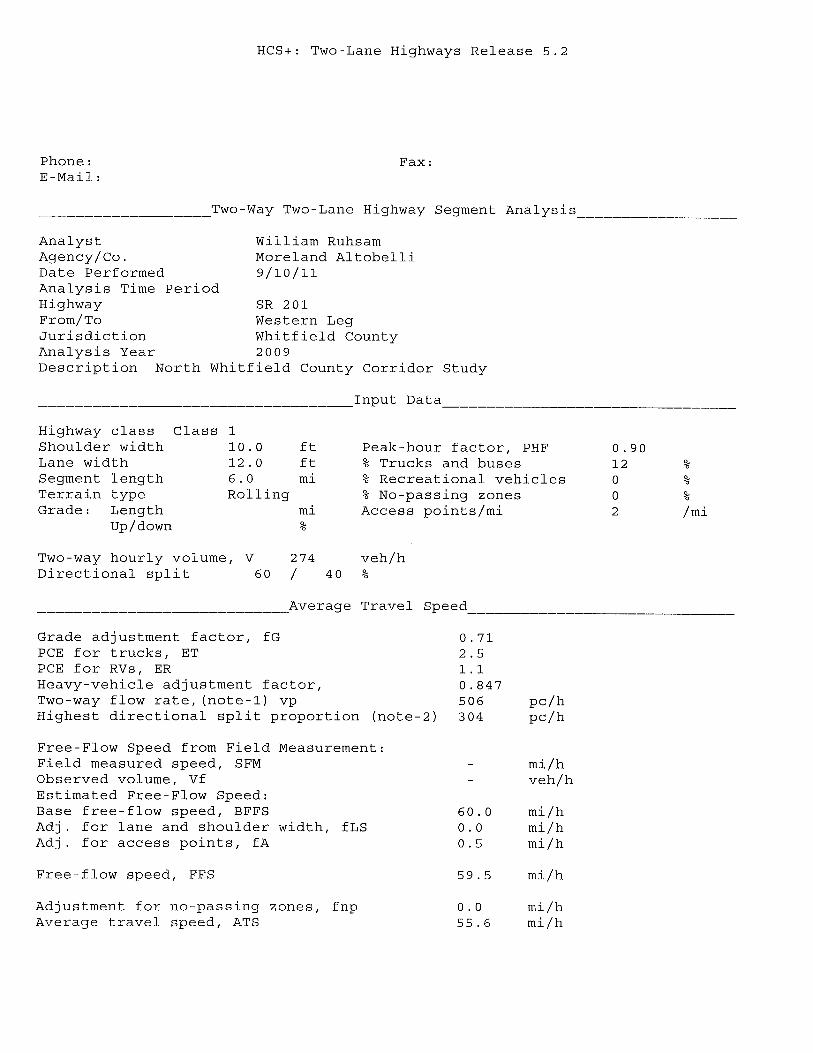
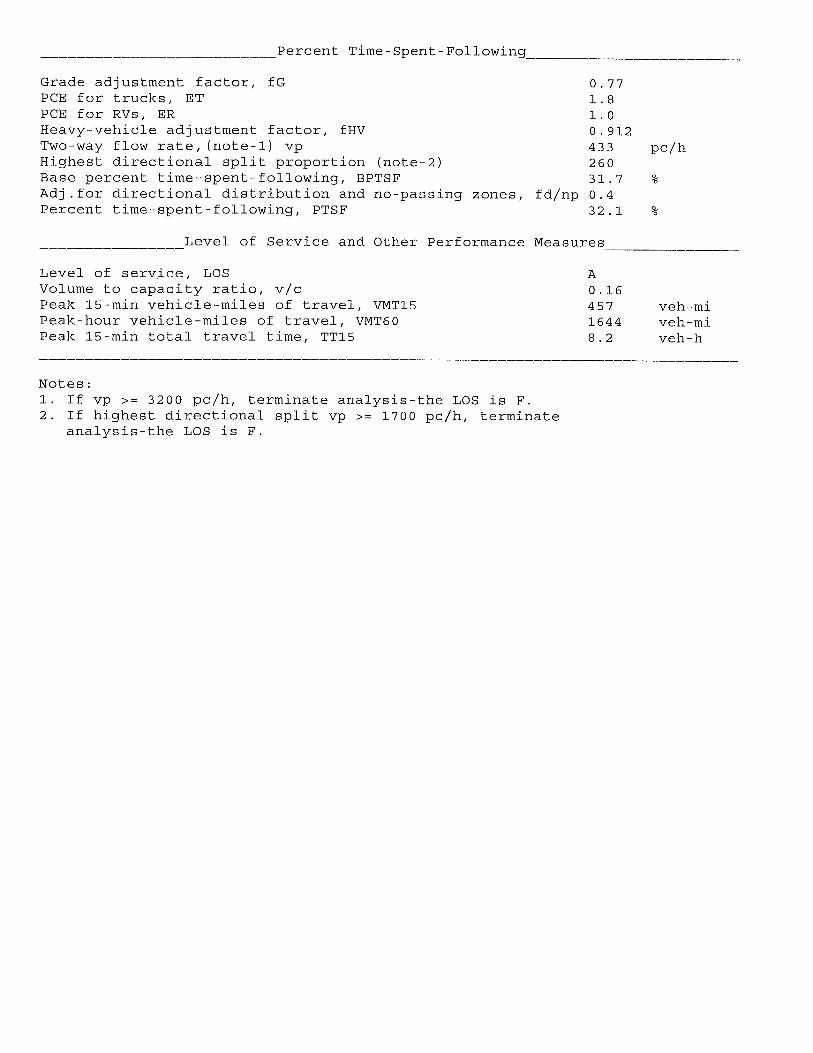

HCS+: Two-Lane Highways Release 5.2 Phone: Fax: E-Mail: ___________________Two-Way Two-Lane Highway Segment Analysis__________________ Analyst William Ruhsam Agency/Co. Moreland Altobelli Date Performed 7/11/11 Analysis Time Period Highway SR 201 From/To Western Leg Jurisdiction Whitfield County Analysis Year 2035 Description North Whitfield County Corridor Study ___________________________________Input Data_________________________________ Highway class Class 1 Shoulder width 1.0 ft Peak-hour factor, PHF 0.90 Lane width 12.0 ft % Trucks and buses 12 % Segment length 6.0 mi % Recreational vehicles 0 % Terrain type Rolling % No-passing zones 0 % Grade: Length mi Access points/mi 8 /mi Up/down % Two-way hourly volume, V 404 veh/h Directional split 60 / 40 % ____________________________Average Travel Speed______________________________ Grade adjustment factor, fG 0.93 PCE for trucks, ET 1.9 PCE for RVs, ER 1.1 Heavy-vehicle adjustment factor, 0.903 Two-way flow rate,(note-1) vp 535 pc/h Highest directional split proportion (note-2) 321 pc/h Free-Flow Speed from Field Measurement: Field measured speed, SFM - mi/h Observed volume, Vf - veh/h Estimated Free-Flow Speed: Base free-flow speed, BFFS 60.0 mi/h Adj. for lane and shoulder width, fLS 4.2 mi/h Adj. for access points, fA 2.0 mi/h Free-flow speed, FFS 53.8 mi/h Adjustment for no-passing zones, fnp 0.0 mi/h Average travel speed, ATS 49.6 mi/h

__________________________Percent Time-Spent-Following________________________ Grade adjustment factor, fG 0.94 PCE for trucks, ET 1.5 PCE for RVs, ER 1.0 Heavy-vehicle adjustment factor, fHV 0.943 Two-way flow rate,(note-1) vp 506 pc/h Highest directional split proportion (note-2) 304 Base percent time-spent-following, BPTSF 35.9 % Adj.for directional distribution and no-passing zones, fd/np 0.2 Percent time-spent-following, PTSF 36.1 % ________________Level of Service and Other Performance Measures_______________ Level of service, LOS C Volume to capacity ratio, v/c 0.17 Peak 15-min vehicle-miles of travel, VMT15 673 veh-mi Peak-hour vehicle-miles of travel, VMT60 2424 veh-mi Peak 15-min total travel time, TT15 13.6 veh-h ______________________________________________________________________________ Notes: 1. If vp >= 3200 pc/h, terminate analysis-the LOS is F. 2. If highest directional split vp >= 1700 pc/h, terminate analysis-the LOS is F.
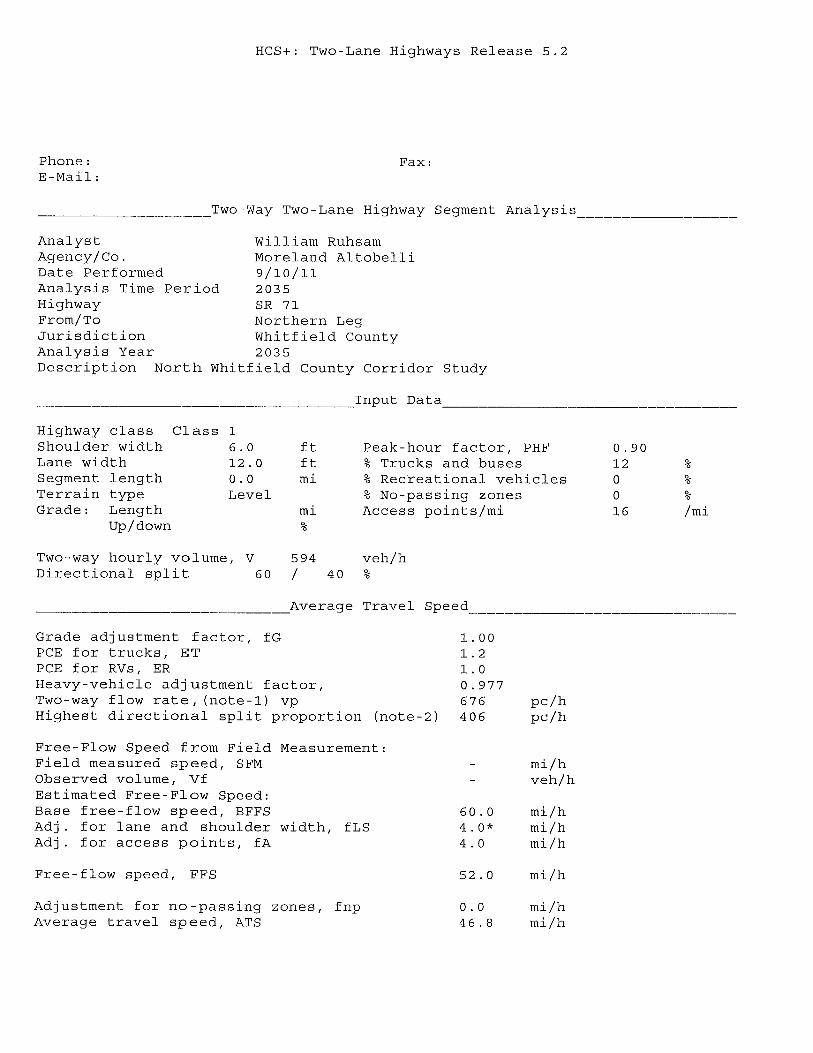
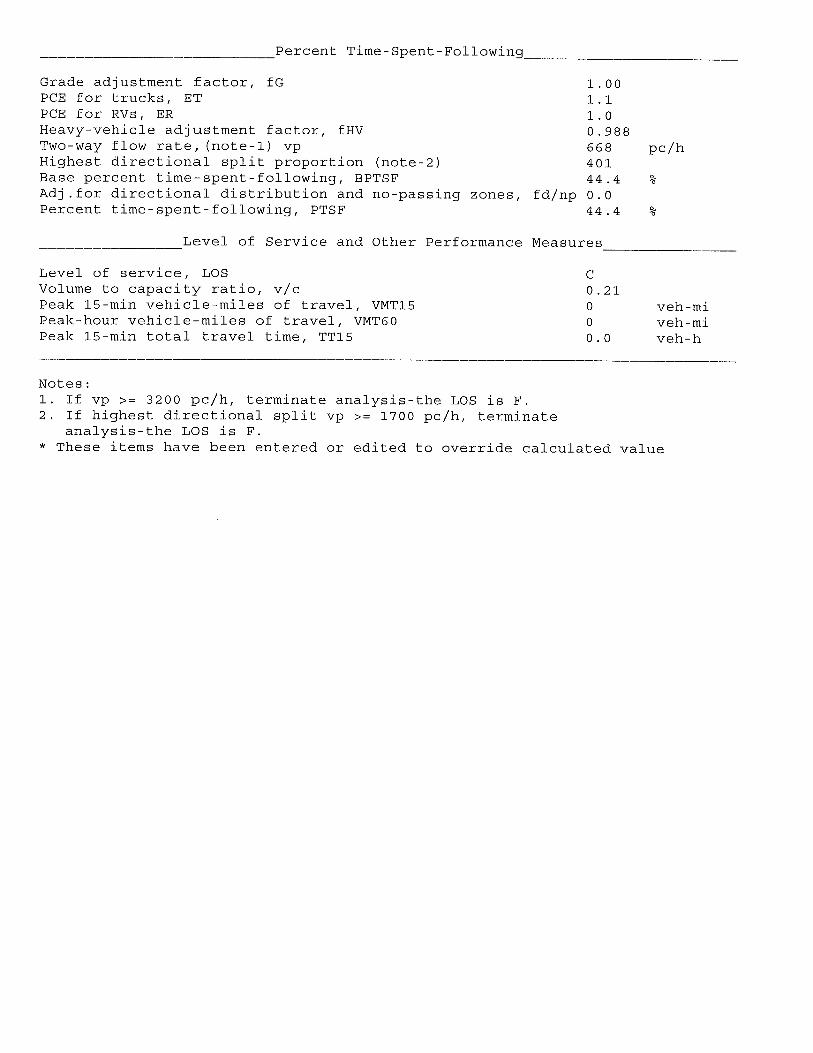

HCS+: Multilane Highways Release 5.2 Phone: Fax: E-mail: ______________________________PLANNING ANALYSIS________________________________ Analyst: William Ruhsam Agency/Co: Moreland Altobelli Date: 7/11/11 Analysis Period: 2009 Highway: SR 71 From/To: Northern Leg Jurisdiction: Whitfield County Analysis Year: 2009 Project ID: North Whitfield County Corridor Study _________________________________INPUT DATA____________________________________ Total AADT volume, AADT 4040 vpd Proportion AADT during peak hour, K 0.09 Percent peak-hour traffic in heaviest direction, D 60 % Trucks 12 % Terrain type Rolling Base free-flow speed, BFFS 60.0 mph ___________________________________ANALYSIS____________________________________ DDHV = AADT x D x K DDHV = 4040 x 0.60 x 0.09 = 218 Volume for : LOS 4-lane highway = 218 vph/2 lanes = 109 vphpl A 6-lane highway = 218 vph/3 lanes = 72 vphpl A ________________________________LEVEL OF SERVICE_______________________________ Free-Flow Speed = 60 mph Free-Flow Speed = 50 mph Percent Trucks Percent Trucks LOS 0 5 10 15 20 0 5 10 15 20 Terrain Level A 560 550 530 520 510 440 430 420 410 400 B 920 900 870 850 840 710 700 680 660 650 C 1310 1280 1250 1220 1190 1030 1000 980 960 940 D 1680 1640 1600 1570 1530 1350 1320 1290 1260 1230 E 1870 1820 1780 1740 1700 1610 1570 1530 1500 1460 Rolling A 560 520 490 460 430 440 410 380 360 340 B 920 850 800 750 710 710 660 620 580 550 C 1310 1220 1140 1070 1010 1030 960 900 840 790 D 1680 1570 1470 1380 1300 1350 1260 1180 1100 1040 E 1870 1740 1620 1520 1440 1610 1500 1400 1310 1240 Mountain A 560 480 420 370 330 440 370 320 290 260

B 920 780 680 600 540 710 610 530 470 420 C 1310 1120 970 860 770 1030 880 760 680 610 D 1680 1430 1250 1100 990 1350 1150 1000 890 800 E 1870 1590 1380 1220 1100 1610 1370 1190 1050 950 Assumptions: highway with 60 mi/h FFS has 8 access points/mi; highway with 50 mi/h FFS has 25 access points/mi; lane width = 12 ft; shoulder width > 6 ft; divided highway; PHF = 0.88; all heavy vehicles are trucks and regular commuters
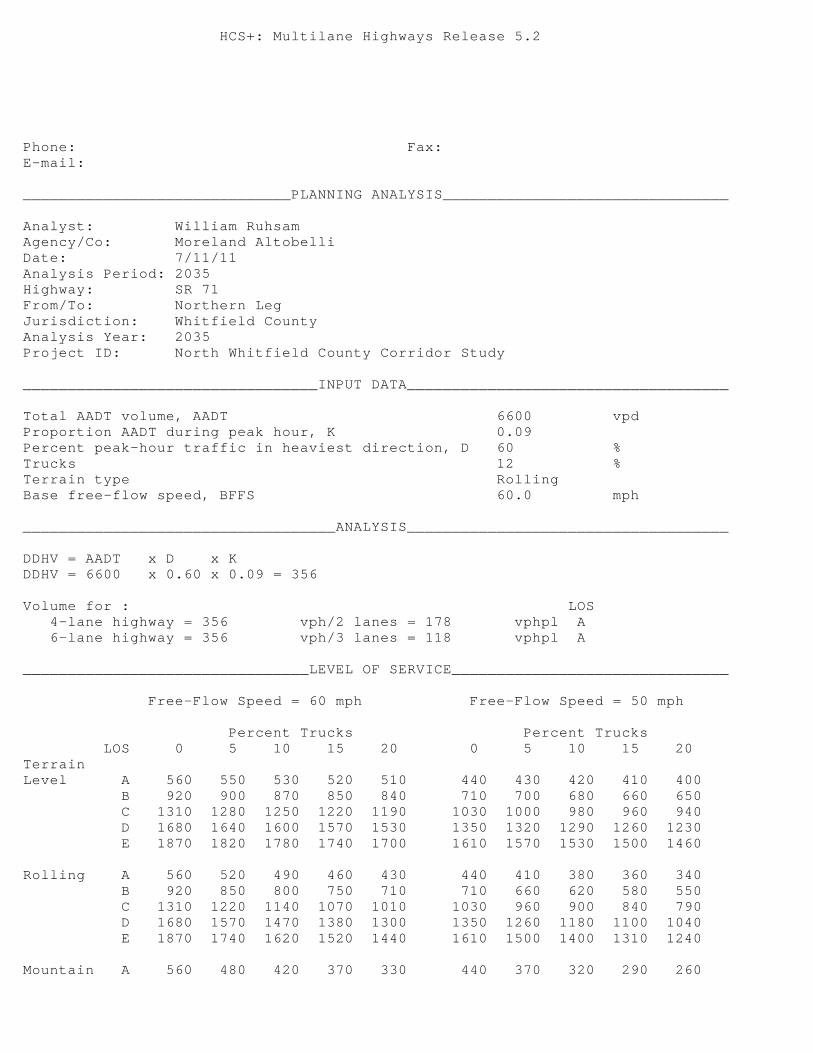
HCS+: Multilane Highways Release 5.2 Phone: Fax: E-mail: ______________________________PLANNING ANALYSIS________________________________ Analyst: William Ruhsam Agency/Co: Moreland Altobelli Date: 7/11/11 Analysis Period: 2035 Highway: SR 71 From/To: Northern Leg Jurisdiction: Whitfield County Analysis Year: 2035 Project ID: North Whitfield County Corridor Study _________________________________INPUT DATA____________________________________ Total AADT volume, AADT 6600 vpd Proportion AADT during peak hour, K 0.09 Percent peak-hour traffic in heaviest direction, D 60 % Trucks 12 % Terrain type Rolling Base free-flow speed, BFFS 60.0 mph ___________________________________ANALYSIS____________________________________ DDHV = AADT x D x K DDHV = 6600 x 0.60 x 0.09 = 356 Volume for : LOS 4-lane highway = 356 vph/2 lanes = 178 vphpl A 6-lane highway = 356 vph/3 lanes = 118 vphpl A ________________________________LEVEL OF SERVICE_______________________________ Free-Flow Speed = 60 mph Free-Flow Speed = 50 mph Percent Trucks Percent Trucks LOS 0 5 10 15 20 0 5 10 15 20 Terrain Level A 560 550 530 520 510 440 430 420 410 400 B 920 900 870 850 840 710 700 680 660 650 C 1310 1280 1250 1220 1190 1030 1000 980 960 940 D 1680 1640 1600 1570 1530 1350 1320 1290 1260 1230 E 1870 1820 1780 1740 1700 1610 1570 1530 1500 1460 Rolling A 560 520 490 460 430 440 410 380 360 340 B 920 850 800 750 710 710 660 620 580 550 C 1310 1220 1140 1070 1010 1030 960 900 840 790 D 1680 1570 1470 1380 1300 1350 1260 1180 1100 1040 E 1870 1740 1620 1520 1440 1610 1500 1400 1310 1240 Mountain A 560 480 420 370 330 440 370 320 290 260

B 920 780 680 600 540 710 610 530 470 420 C 1310 1120 970 860 770 1030 880 760 680 610 D 1680 1430 1250 1100 990 1350 1150 1000 890 800 E 1870 1590 1380 1220 1100 1610 1370 1190 1050 950 Assumptions: highway with 60 mi/h FFS has 8 access points/mi; highway with 50 mi/h FFS has 25 access points/mi; lane width = 12 ft; shoulder width > 6 ft; divided highway; PHF = 0.88; all heavy vehicles are trucks and regular commuters

HCS+: Multilane Highways Release 5.2 Phone: Fax: E-mail: ______________________________PLANNING ANALYSIS________________________________ Analyst: William Ruhsam Agency/Co: Moreland Altobelli Date: 7/11/11 Analysis Period: 2009 Highway: SR 71 From/To: Southern Leg Jurisdiction: Whitfield County Analysis Year: 2009 Project ID: North Whitfield County Corridor Study _________________________________INPUT DATA____________________________________ Total AADT volume, AADT 9440 vpd Proportion AADT during peak hour, K 0.09 Percent peak-hour traffic in heaviest direction, D 60 % Trucks 12 % Terrain type Rolling Base free-flow speed, BFFS 60.0 mph ___________________________________ANALYSIS____________________________________ DDHV = AADT x D x K DDHV = 9440 x 0.60 x 0.09 = 510 Volume for : LOS 4-lane highway = 510 vph/2 lanes = 255 vphpl A 6-lane highway = 510 vph/3 lanes = 170 vphpl A ________________________________LEVEL OF SERVICE_______________________________ Free-Flow Speed = 60 mph Free-Flow Speed = 50 mph Percent Trucks Percent Trucks LOS 0 5 10 15 20 0 5 10 15 20 Terrain Level A 560 550 530 520 510 440 430 420 410 400 B 920 900 870 850 840 710 700 680 660 650 C 1310 1280 1250 1220 1190 1030 1000 980 960 940 D 1680 1640 1600 1570 1530 1350 1320 1290 1260 1230 E 1870 1820 1780 1740 1700 1610 1570 1530 1500 1460 Rolling A 560 520 490 460 430 440 410 380 360 340 B 920 850 800 750 710 710 660 620 580 550 C 1310 1220 1140 1070 1010 1030 960 900 840 790 D 1680 1570 1470 1380 1300 1350 1260 1180 1100 1040 E 1870 1740 1620 1520 1440 1610 1500 1400 1310 1240 Mountain A 560 480 420 370 330 440 370 320 290 260

B 920 780 680 600 540 710 610 530 470 420 C 1310 1120 970 860 770 1030 880 760 680 610 D 1680 1430 1250 1100 990 1350 1150 1000 890 800 E 1870 1590 1380 1220 1100 1610 1370 1190 1050 950 Assumptions: highway with 60 mi/h FFS has 8 access points/mi; highway with 50 mi/h FFS has 25 access points/mi; lane width = 12 ft; shoulder width > 6 ft; divided highway; PHF = 0.88; all heavy vehicles are trucks and regular commuters
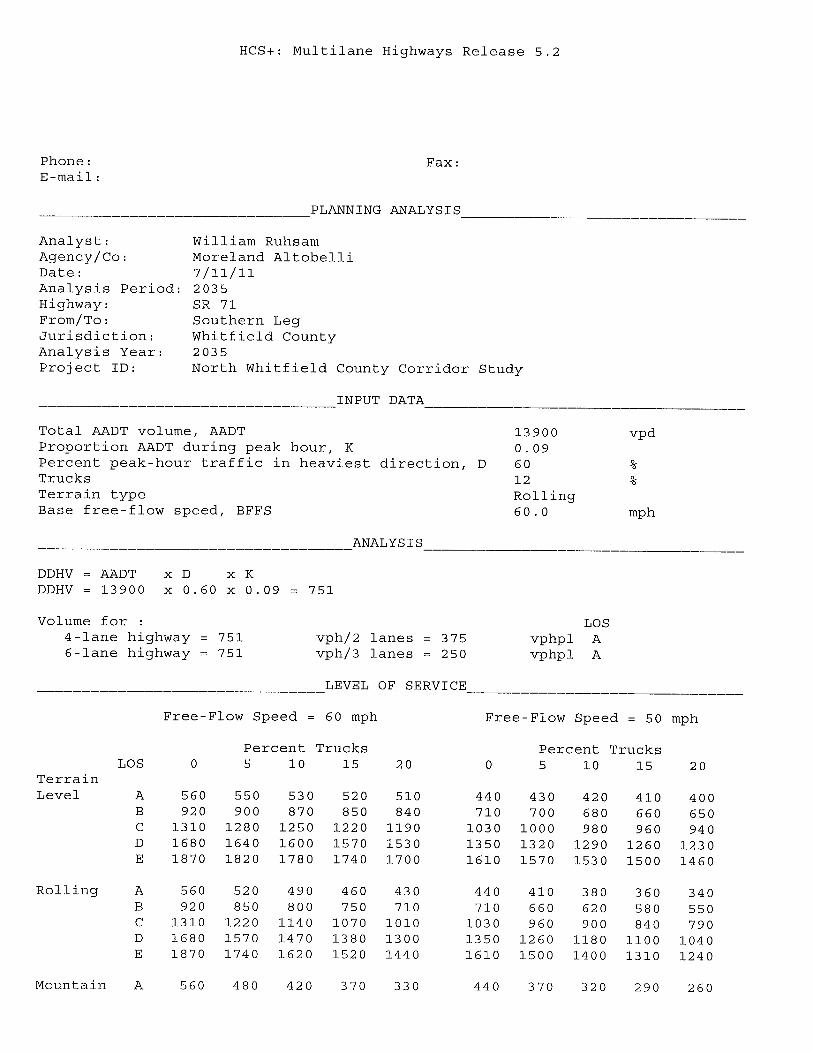
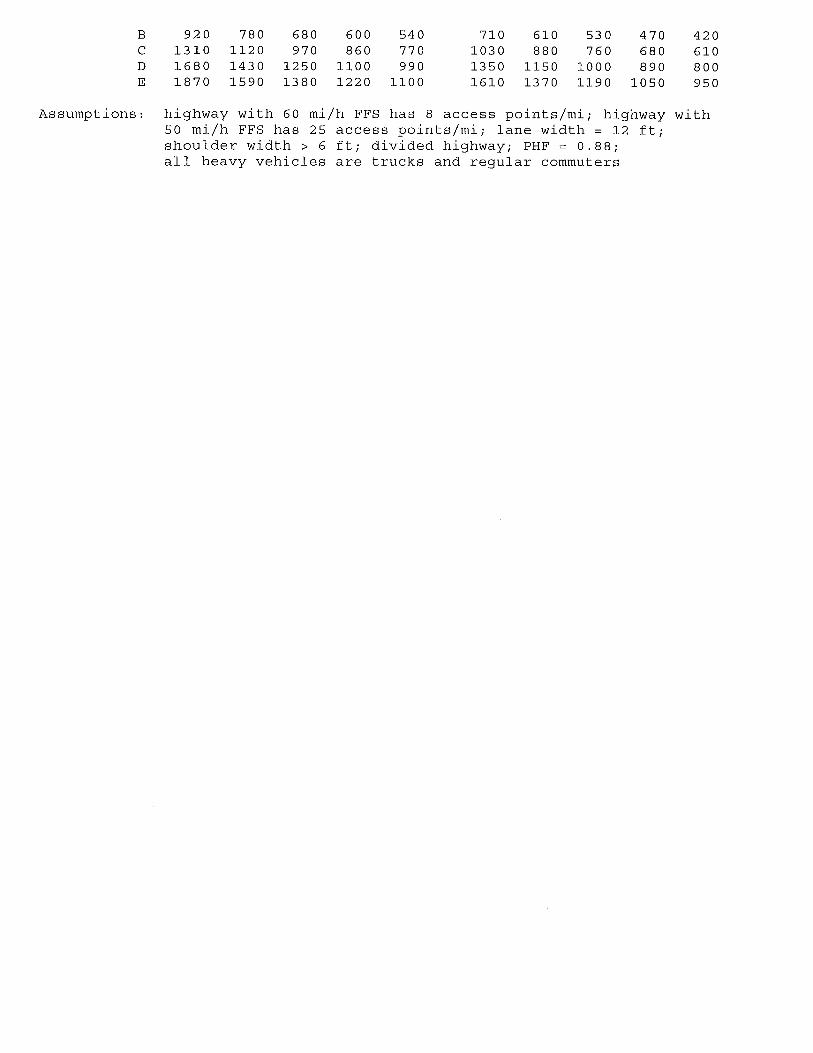

HCS+: Two-Lane Highways Release 5.2 Phone: Fax: E-Mail: ___________________Two-Way Two-Lane Highway Segment Analysis__________________ Analyst William Ruhsam Agency/Co. Moreland Altobelli Date Performed 7/11/11 Analysis Time Period Highway US 41 From/To Northern Leg Jurisdiction Whitfield County Analysis Year 2009 Description North Whitfield County Corridor Study ___________________________________Input Data_________________________________ Highway class Class 1 Shoulder width 1.0 ft Peak-hour factor, PHF 0.90 Lane width 12.0 ft % Trucks and buses 9 % Segment length 1.0 mi % Recreational vehicles 0 % Terrain type Rolling % No-passing zones 0 % Grade: Length mi Access points/mi 8 /mi Up/down % Two-way hourly volume, V 404 veh/h Directional split 60 / 40 % ____________________________Average Travel Speed______________________________ Grade adjustment factor, fG 0.93 PCE for trucks, ET 1.9 PCE for RVs, ER 1.1 Heavy-vehicle adjustment factor, 0.925 Two-way flow rate,(note-1) vp 522 pc/h Highest directional split proportion (note-2) 313 pc/h Free-Flow Speed from Field Measurement: Field measured speed, SFM - mi/h Observed volume, Vf - veh/h Estimated Free-Flow Speed: Base free-flow speed, BFFS 60.0 mi/h Adj. for lane and shoulder width, fLS 4.2 mi/h Adj. for access points, fA 2.0 mi/h Free-flow speed, FFS 53.8 mi/h Adjustment for no-passing zones, fnp 0.0 mi/h Average travel speed, ATS 49.7 mi/h

__________________________Percent Time-Spent-Following________________________ Grade adjustment factor, fG 0.94 PCE for trucks, ET 1.5 PCE for RVs, ER 1.0 Heavy-vehicle adjustment factor, fHV 0.957 Two-way flow rate,(note-1) vp 499 pc/h Highest directional split proportion (note-2) 299 Base percent time-spent-following, BPTSF 35.5 % Adj.for directional distribution and no-passing zones, fd/np 0.3 Percent time-spent-following, PTSF 35.8 % ________________Level of Service and Other Performance Measures_______________ Level of service, LOS C Volume to capacity ratio, v/c 0.16 Peak 15-min vehicle-miles of travel, VMT15 112 veh-mi Peak-hour vehicle-miles of travel, VMT60 404 veh-mi Peak 15-min total travel time, TT15 2.3 veh-h ______________________________________________________________________________ Notes: 1. If vp >= 3200 pc/h, terminate analysis-the LOS is F. 2. If highest directional split vp >= 1700 pc/h, terminate analysis-the LOS is F.

HCS+: Two-Lane Highways Release 5.2 Phone: Fax: E-Mail: ___________________Two-Way Two-Lane Highway Segment Analysis__________________ Analyst William Ruhsam Agency/Co. Moreland Altobelli Date Performed 7/11/11 Analysis Time Period Highway US 41 From/To Northern Leg Jurisdiction Whitfield County Analysis Year 2035 Description North Whitfield County Corridor Study ___________________________________Input Data_________________________________ Highway class Class 1 Shoulder width 1.0 ft Peak-hour factor, PHF 0.90 Lane width 12.0 ft % Trucks and buses 9 % Segment length 1.0 mi % Recreational vehicles 0 % Terrain type Rolling % No-passing zones 0 % Grade: Length mi Access points/mi 8 /mi Up/down % Two-way hourly volume, V 594 veh/h Directional split 60 / 40 % ____________________________Average Travel Speed______________________________ Grade adjustment factor, fG 0.93 PCE for trucks, ET 1.9 PCE for RVs, ER 1.1 Heavy-vehicle adjustment factor, 0.925 Two-way flow rate,(note-1) vp 767 pc/h Highest directional split proportion (note-2) 460 pc/h Free-Flow Speed from Field Measurement: Field measured speed, SFM - mi/h Observed volume, Vf - veh/h Estimated Free-Flow Speed: Base free-flow speed, BFFS 60.0 mi/h Adj. for lane and shoulder width, fLS 4.2 mi/h Adj. for access points, fA 2.0 mi/h Free-flow speed, FFS 53.8 mi/h Adjustment for no-passing zones, fnp 0.0 mi/h Average travel speed, ATS 47.8 mi/h
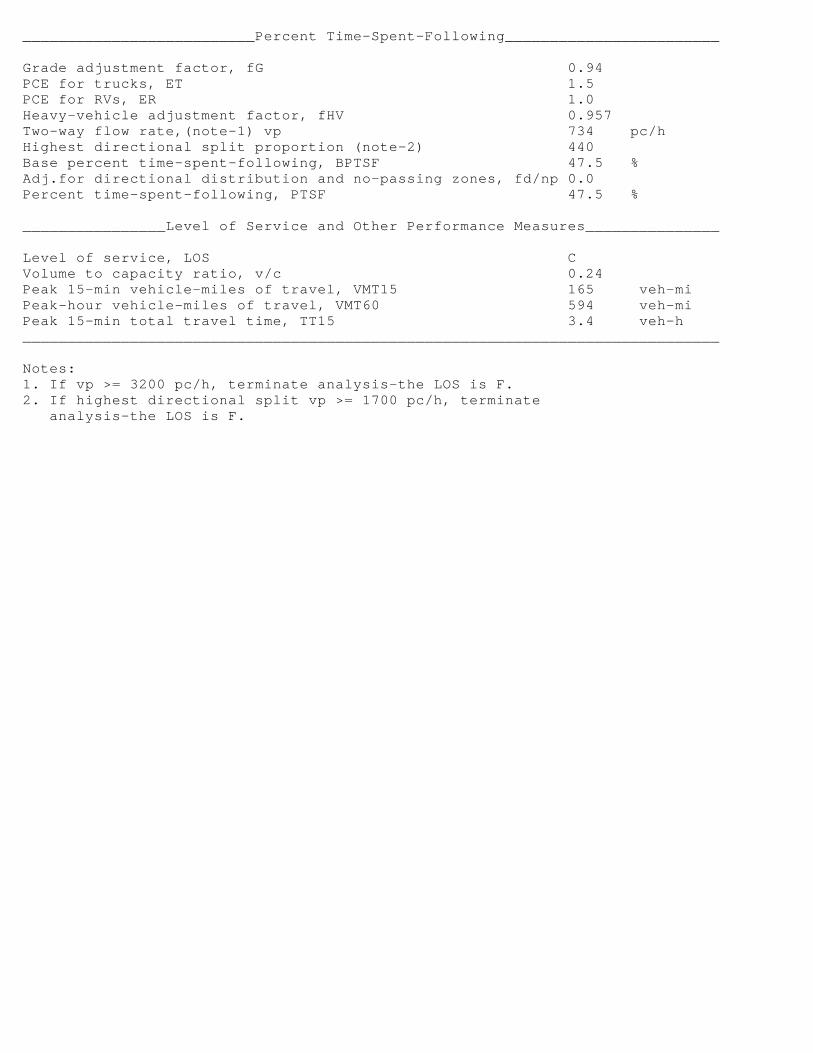
__________________________Percent Time-Spent-Following________________________ Grade adjustment factor, fG 0.94 PCE for trucks, ET 1.5 PCE for RVs, ER 1.0 Heavy-vehicle adjustment factor, fHV 0.957 Two-way flow rate,(note-1) vp 734 pc/h Highest directional split proportion (note-2) 440 Base percent time-spent-following, BPTSF 47.5 % Adj.for directional distribution and no-passing zones, fd/np 0.0 Percent time-spent-following, PTSF 47.5 % ________________Level of Service and Other Performance Measures_______________ Level of service, LOS C Volume to capacity ratio, v/c 0.24 Peak 15-min vehicle-miles of travel, VMT15 165 veh-mi Peak-hour vehicle-miles of travel, VMT60 594 veh-mi Peak 15-min total travel time, TT15 3.4 veh-h ______________________________________________________________________________ Notes: 1. If vp >= 3200 pc/h, terminate analysis-the LOS is F. 2. If highest directional split vp >= 1700 pc/h, terminate analysis-the LOS is F.
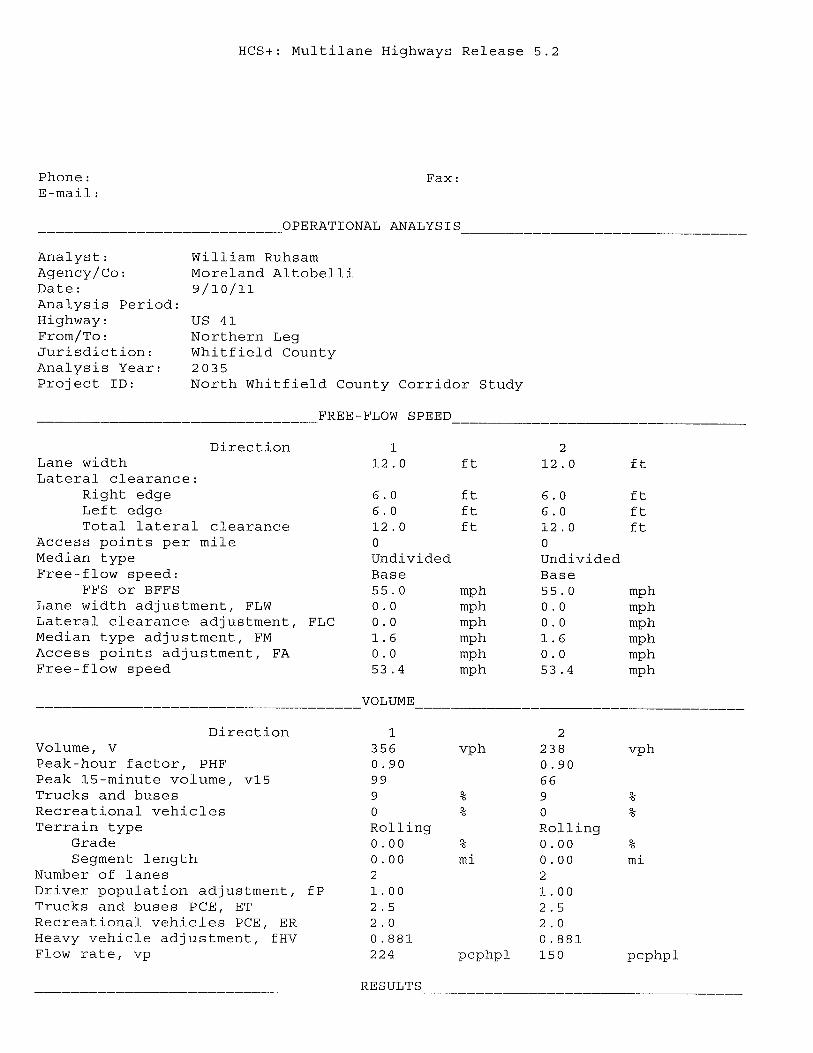
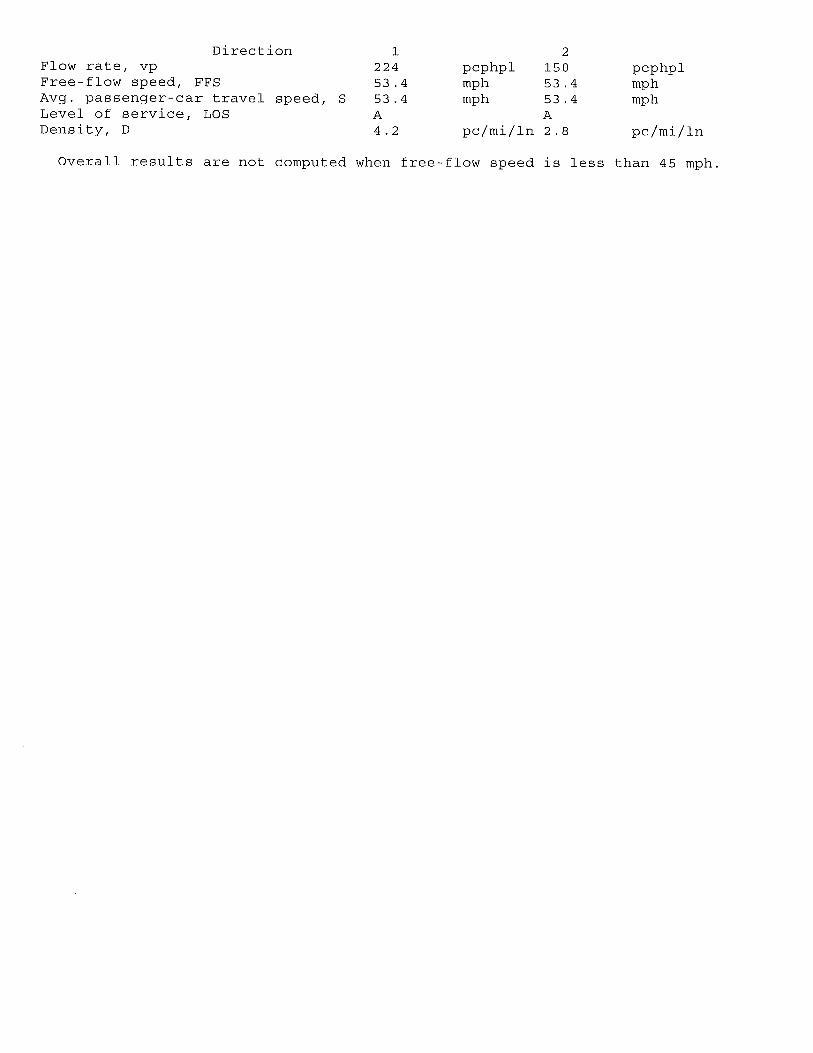
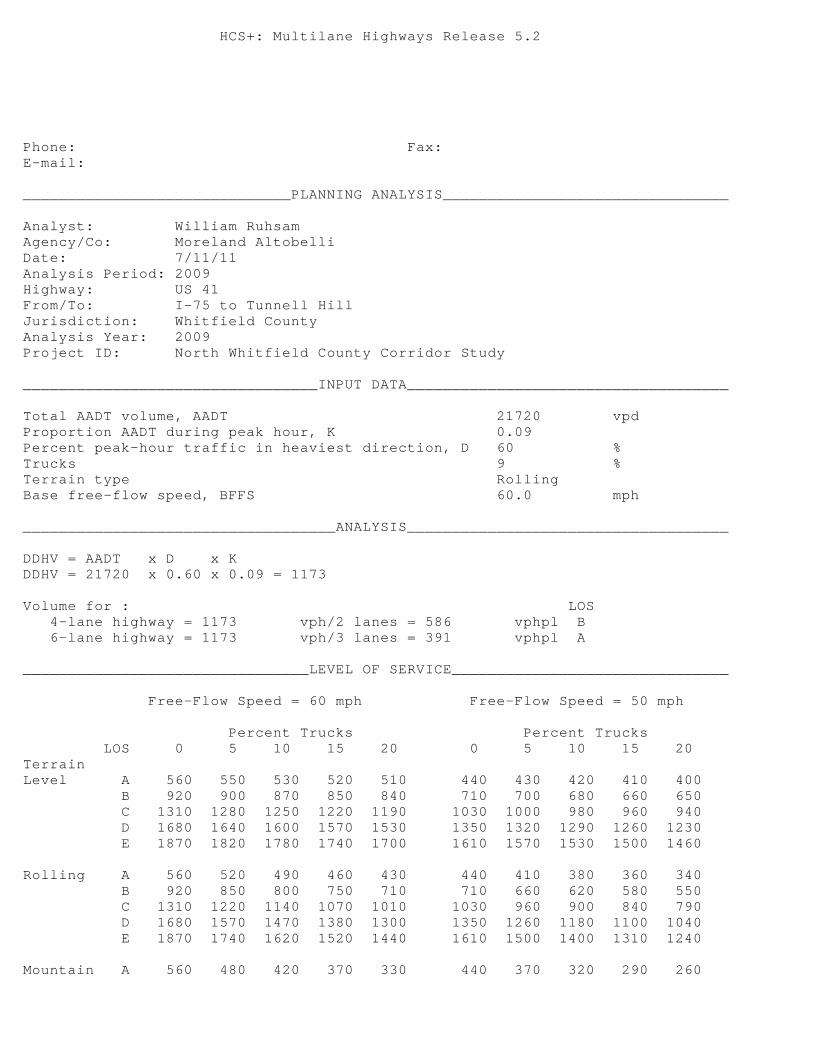
HCS+: Multilane Highways Release 5.2 Phone: Fax: E-mail: ______________________________PLANNING ANALYSIS________________________________ Analyst: William Ruhsam Agency/Co: Moreland Altobelli Date: 7/11/11 Analysis Period: 2009 Highway: US 41 From/To: I-75 to Tunnell Hill Jurisdiction: Whitfield County Analysis Year: 2009 Project ID: North Whitfield County Corridor Study _________________________________INPUT DATA____________________________________ Total AADT volume, AADT 21720 vpd Proportion AADT during peak hour, K 0.09 Percent peak-hour traffic in heaviest direction, D 60 % Trucks 9 % Terrain type Rolling Base free-flow speed, BFFS 60.0 mph ___________________________________ANALYSIS____________________________________ DDHV = AADT x D x K DDHV = 21720 x 0.60 x 0.09 = 1173 Volume for : LOS 4-lane highway = 1173 vph/2 lanes = 586 vphpl B 6-lane highway = 1173 vph/3 lanes = 391 vphpl A ________________________________LEVEL OF SERVICE_______________________________ Free-Flow Speed = 60 mph Free-Flow Speed = 50 mph Percent Trucks Percent Trucks LOS 0 5 10 15 20 0 5 10 15 20 Terrain Level A 560 550 530 520 510 440 430 420 410 400 B 920 900 870 850 840 710 700 680 660 650 C 1310 1280 1250 1220 1190 1030 1000 980 960 940 D 1680 1640 1600 1570 1530 1350 1320 1290 1260 1230 E 1870 1820 1780 1740 1700 1610 1570 1530 1500 1460 Rolling A 560 520 490 460 430 440 410 380 360 340 B 920 850 800 750 710 710 660 620 580 550 C 1310 1220 1140 1070 1010 1030 960 900 840 790 D 1680 1570 1470 1380 1300 1350 1260 1180 1100 1040 E 1870 1740 1620 1520 1440 1610 1500 1400 1310 1240 Mountain A 560 480 420 370 330 440 370 320 290 260
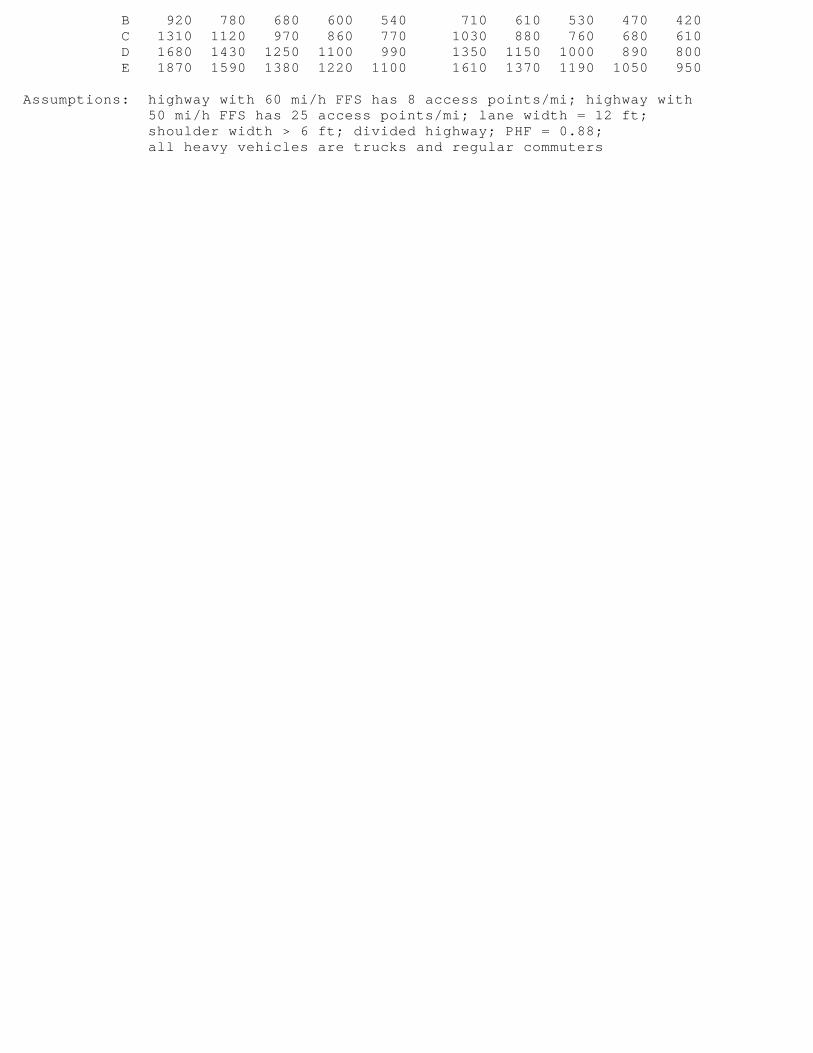
B 920 780 680 600 540 710 610 530 470 420 C 1310 1120 970 860 770 1030 880 760 680 610 D 1680 1430 1250 1100 990 1350 1150 1000 890 800 E 1870 1590 1380 1220 1100 1610 1370 1190 1050 950 Assumptions: highway with 60 mi/h FFS has 8 access points/mi; highway with 50 mi/h FFS has 25 access points/mi; lane width = 12 ft; shoulder width > 6 ft; divided highway; PHF = 0.88; all heavy vehicles are trucks and regular commuters
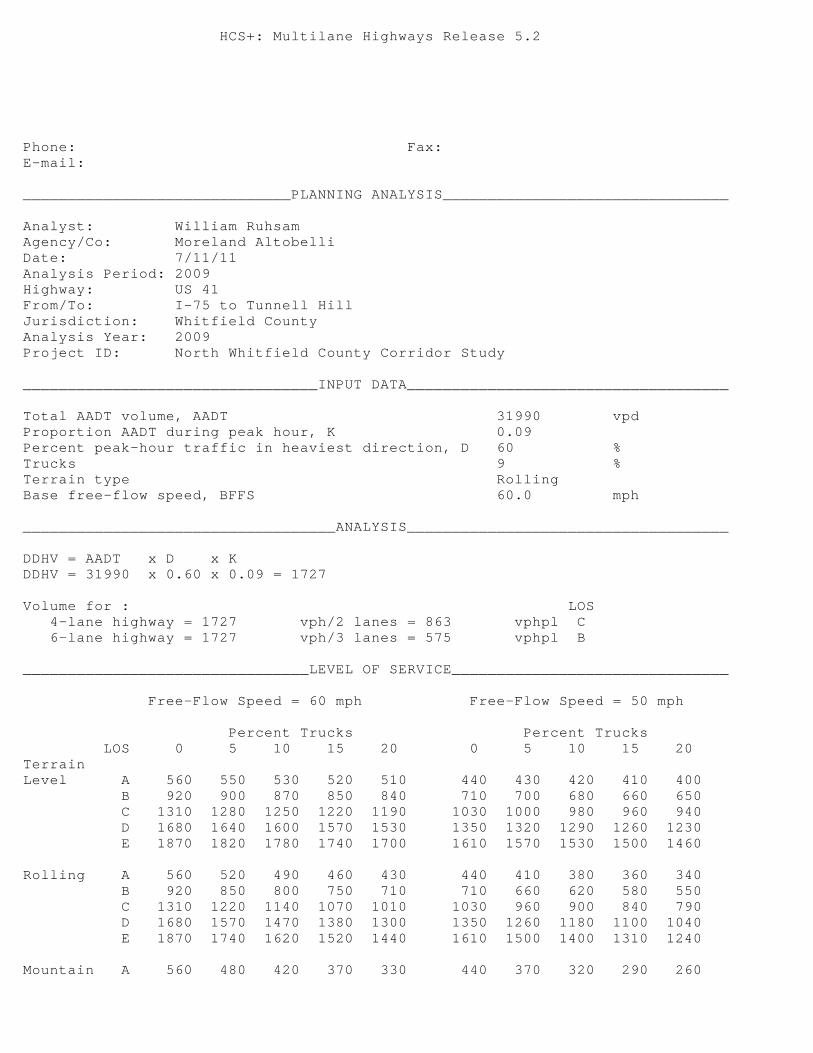
HCS+: Multilane Highways Release 5.2 Phone: Fax: E-mail: ______________________________PLANNING ANALYSIS________________________________ Analyst: William Ruhsam Agency/Co: Moreland Altobelli Date: 7/11/11 Analysis Period: 2009 Highway: US 41 From/To: I-75 to Tunnell Hill Jurisdiction: Whitfield County Analysis Year: 2009 Project ID: North Whitfield County Corridor Study _________________________________INPUT DATA____________________________________ Total AADT volume, AADT 31990 vpd Proportion AADT during peak hour, K 0.09 Percent peak-hour traffic in heaviest direction, D 60 % Trucks 9 % Terrain type Rolling Base free-flow speed, BFFS 60.0 mph ___________________________________ANALYSIS____________________________________ DDHV = AADT x D x K DDHV = 31990 x 0.60 x 0.09 = 1727 Volume for : LOS 4-lane highway = 1727 vph/2 lanes = 863 vphpl C 6-lane highway = 1727 vph/3 lanes = 575 vphpl B ________________________________LEVEL OF SERVICE_______________________________ Free-Flow Speed = 60 mph Free-Flow Speed = 50 mph Percent Trucks Percent Trucks LOS 0 5 10 15 20 0 5 10 15 20 Terrain Level A 560 550 530 520 510 440 430 420 410 400 B 920 900 870 850 840 710 700 680 660 650 C 1310 1280 1250 1220 1190 1030 1000 980 960 940 D 1680 1640 1600 1570 1530 1350 1320 1290 1260 1230 E 1870 1820 1780 1740 1700 1610 1570 1530 1500 1460 Rolling A 560 520 490 460 430 440 410 380 360 340 B 920 850 800 750 710 710 660 620 580 550 C 1310 1220 1140 1070 1010 1030 960 900 840 790 D 1680 1570 1470 1380 1300 1350 1260 1180 1100 1040 E 1870 1740 1620 1520 1440 1610 1500 1400 1310 1240 Mountain A 560 480 420 370 330 440 370 320 290 260

B 920 780 680 600 540 710 610 530 470 420 C 1310 1120 970 860 770 1030 880 760 680 610 D 1680 1430 1250 1100 990 1350 1150 1000 890 800 E 1870 1590 1380 1220 1100 1610 1370 1190 1050 950 Assumptions: highway with 60 mi/h FFS has 8 access points/mi; highway with 50 mi/h FFS has 25 access points/mi; lane width = 12 ft; shoulder width > 6 ft; divided highway; PHF = 0.88; all heavy vehicles are trucks and regular commuters