Embed Size (px)
Citation preview

North Sumatra Public Expenditure Review
Draft July 22, 2002

1
EXECUTIVE SUMMARY This paper reports on experience with decentralization in North Sumatra, Indonesia’s largest province outside Java. It focuses on the role of the province-level government in a system in which autonomous districts have primacy. This paper assesses the province-level vision and agenda in terms of different criteria, including consistency with Laws 22 and 25 of 1999, the key decentralization statutes. The paper then suggests ways in which province-level or cross-district entities can foster improved sector performance. The Bank’s goal in working at the sub-national level is to better understand decentralization to improve the quality of its support to the country. North Sumatra’s inclusion in this study resulted from the interest shown by the Governor and his staff, and the availability of information due to the province’s participation in a number of Bank-assisted projects. Also important were features of this most populous province outside Java, such as the ongoing structural transition, and the democratization which preceded decentralization. Structural change. North Sumatra is going through a growth-induced, structural transition. The transition features a shift from a rural, agriculture-led economy to an urban-centered one in which jobs are created in manufacturing and services. The labor force is not only less firmly tied to agriculture, it is becoming more mobile and gender-balanced, increasingly urban in numbers and world view, better trained, and more likely to be governed by market-determined employment and compensation arrangements. Even without decentralization, such a transition requires major change in government policies in areas as diverse as agriculture, small and medium size enterprises, education, and health. Decentralization and democratization. Decentralization in North Sumatra was preceded by vigorous democratization. Civil society groups such as NGOs and advocacy bodies are active in the province, taking on land rights, wages and working conditions, gender equality, and other issues. Some groups are monitoring policy formulation and program implementation at different government levels. The lively give-and-take which has developed is discerned in the legislative reactions to the annual accountability speech and the Governor’s responses to these reactions. In addition, guided by Law 22, district-level officials have altered budgeting and related processes to elicit citizen involvement. Other steps include the creation in several municipalities of city development forums, consisting of local agency and stakeholder group representatives. Overall, the two streams, decentralization and democratization have been working in tandem, though until now the relationship between government and civil society has been more adversarial than cooperative. The Propeda. The province level government’s 2001 Regional Development Program (Propeda) is an interesting element in the North Sumatra scene. This combined vision statement and action program was issued by the provincial government to help in the design of district and cross-district policies in a decentralizing setting. The Propeda’s main concern is the impact of the 1997 economic downturn which was seen as a defining event and challenge. In response to weaknesses revealed by the crisis, the Propeda proposes a “people’s economy” strategy which includes measures to enhance incomes in small farming units, foster agriculture-based manufacturing and services in small and medium size enterprises, and provide improved education and health services. The Propeda views decentralization as a key building block in this strategy. A blueprint is set out which includes an extensive role for the province, and the Propeda in effect asserts the duty of province level agencies to act in the best

2
interests of North Sumatra’s districts and population.1 The document notes that the province lacks the authority and resources to carry out this agenda. Coverage. The Propeda focuses on agriculture and forestry, small and medium enterprises, education, and health, sectors that are highlighted as crucial for growth and equity in North Sumatra, and which loom large in budget and government work force terms. These sectors experienced similar, increasingly ineffective Suharto-era interventions, in which civil servants were used to bring sectoral “messages” and other services to clients such as school children, farmers, and pregnant women. This Public Expenditure Review (PER) discusses for each sector the pressures to enhance policy impacts and sustainability. The policy options for the sectors have much in common, including creating smaller, more productive, and better paid cadres; raising performance standards, and making staff accountable to clients who are empowered in different a variety of ways. For each sector, the PER discusses how to exploit decentralized structures at the provincial level to facilitate solutions. Observations and Findings Financing and spending patterns. Decentralization has put significant pressure on budgets at the province and district levels. This came on top of the pressures inflicted by the 1997-98 crisis. Overall spending fell very sharply, by 37 percent in constant price terms in 1998/99 before recovering somewhat, leaving total expenditures in 1999/2000 at the 1990/91 level of outlays--this represented a 10 percent decline on a per capita basis. This overall trend continued following decentralization, but with patterns differing by government level. Broadly, both the districts’ and the province’s spending increased, but the districts’ development spending jumped more sharply than that of the province. The estimate for total district spending, Rp.3.1 trillion in 2001, was nearly 50 percent higher than the 12 month equivalent for 2000;2 development spending at Rp. 923 billion was 41 percent higher than the equivalent 2000 figure. Province level outlays in 2001 were 45 percent greater than comparable estimates for 2000, including a 74 percent rise in routine outlays and a modest, 13 percent, increase in development expenditures. On the other hand, central level development spending in North Sumatra fell 45 percent between 2000 (12 month basis) and 2001. Nevertheless, the amounts involved, representing 85 percent of district development outlays, remained substantial, especially for those sectors in which central resources were concentrated. Combining central, district, and province-level changes, government expenditure in North Sumatra was Rp. 5.7 trillion in 2001. In constant prices, this amount was smaller than the 1999/2000 and 2000 (12 month basis) figures, with development outlays falling more sharply than routine spending. However, development spending in the latter two years was already a third less than the 1996/97 level. Therefore, development outlays in 2001 comprised little more than half of the pre-crisis figure. This trend bears watching as do the factors governing district level development spending--districts may feel outlays were too high before 2001, and/or they may be counting on a continuing central spending role. Policy, Planning and Budgeting. Budgetary allocations for the province are--in principle--guided by the Propeda. As mentioned, North Sumatra’s Propeda focuses on the "people's economy” and proposes numerous measures in each of a number of sectors. Overall, the people’s economy program appears to be oversized and financially and managerially burdensome. The Propeda adds elements to
1 Indeed, the Propeda mentions numerous steps which the province level authorities would like to pursue vis a vis the districts, e.g., encouraging district officials to foster “the values and culture of being productive,” and to expand revenue inflows, carry out procurement transparently and on an efficient scale, restructure district owned enterprises, and so forth. 2 The 2000 fiscal year was 9 months, that is April 1- December 31.
3
the pre-decentralization and pre-crisis sector and related programs, implying financing needs, combining center, province, and district-level spending, at least as large as total pre-crisis outlays in constant prices. This will be difficult in part since the budget envelope of consolidated spending in 2001 was much smaller than in 1996/1997 and is likely to remain so for some time. Moreover, the mechanisms and understandings required to arrive at a coordinated package of central, provincial, and district expenditures do not exist at the moment. In particular, there is no agreement on what should be the province’s mandate. The Propeda can be read as a manifesto for an expanded province-level role, but whether this would be acceptable to central ministries and the districts is unclear. A second opinion. Underlying this costly and elaborate package is a view of the crisis as a catastrophe which revealed major shortfalls in outcomes and fundamental weaknesses in policy. Accordingly, the intent of the Propeda is not just to provide temporary assistance but also to insulate the province against future economic downturns. As discussed, the large resource commitment entailed is unlikely to be forthcoming. Moreover, such a step which assumes unending economic crisis conditions would be unnecessary and counter-productive. The Propeda seems to treat economic crises and structural effects as the same phenomenon, though they are quite different. The extensive subsidy and safety-net mechanisms which the Propeda envisages to shield small holders and SMEs from market downturns could put at risk a growth process which is critical for medium term job and income gains. Nevertheless, North Sumatra’s policy makers deserve much credit for seeking to gain control over various cyclical, growth, and transition effects. Typically, the structural shift that is underway, with transitions in work force, epidemiology, demography, and education, is an especially difficult phase in development. Indeed, few middle and higher income economies have escaped the wrenching and sometimes tumultuous consequences that can accompany rapid growth. However, the most promising way of overcoming the challenges of transition is to devise ways of exploiting comparative advantage and responding to the incentives and opportunities which arise endogenously as development proceeds. Suggested agenda. To overcome North Sumatra’s development challenges, the province level government should actively exploit the possibilities that decentralization offers, including coordinating with central and district initiatives, and reaping the benefits from engaging civil society. Public services from agriculture extension to education and health can and should be made more client responsive. The regulatory environment and management of essential assets such as land and forestry should become more focused on the needs of SMEs—the likely motor of renewed growth and employment. At the same time, the tax regime in the province should be kept at a competitive level, in order not to crush the SME sector, and therefore Government resources will remain scarce for the foreseeable future. Within its limited budget envelope, the province level government could act as a facilitator and coordinator among local governments; sponsor and developer of minimum service standards; supplier of critical inputs in local level functions, including training, management of finances and procurement, and work force administration; and provider of technical and regulatory services with cross-boundary implications. The province should build on the lively civil society in North Sumatra, and actively promote client involvement in local level services and policy matters. It can do this by providing comparative information on service use, coverage and needs. It could also make transfers to districts conditional on meeting transparency and participation goals. These steps would leave an opening for important but new and distinctive contributions of the central government. By taking on crucial advocacy, analytical, experience-sharing, and poverty monitoring

4
tasks, these central agencies can play an important role helping provinces and districts to decentralize successfully Sectoral applications. This suggested mix of province-level roles and functions will be helpful at the sector level, where policy adjustments may be stymied by an emerging district and central dominance of funding flows. As noted, sector strategies continue to depend on government-hired field staff who have been transferred to the districts and retain major service delivery responsibilities. One critical issue relates to the best use of the large service cadres (or the resources they embody), including linking staff-related initiatives to substantive, service quality-related agendas. Other key concerns are how to address cross-district issues arising in priority sectors including appropriate roles for province level bodies; and the focus and scale of central funding. Agriculture. Province-level bodies can be instrumental in fostering the crop yield increases on small holdings which figure prominently in the people’s economy strategy. Though there are promising possibilities in terms of improved agricultural extension and more productive use of irrigation, neither of these policy directions seem ready for full scale implementation. Of the two, extension is the riskier option. Extension has had limited success to date, and one could question its viability in rainfed areas, in which Farmer Associations (FAs)—which are expected to be key actors—are not very strong. The risks are seen in the optimistic assumptions that underlie the approach now being piloted. It assumes that existing often poorly prepared and demoralized staff can be retrained as facilitators who are adept at communication and credible with farmers. The approach also needs field staff to analyze community dynamics, using yet to be acquired skills to convey practical advice to the very poor farmers not reached before. And it assumes that customer oriented managers have the power to plan and implement programs and can design pilot projects to determine replicable techniques; effective “technology generation” systems are in place; and information on farmer needs and characteristics is available to and used by researchers. None of the pre-conditions for successful extension seem to be in place at this point. Of course, the litmus test for an extension system is whether its messages are adopted by usually very cautious, conservative farmers. But there are other clients who need to be persuaded. Extension involves information developed in the province-level agricultural technology assessment center (BPTP). Though the system cuts across district lines, a significant share of BPTP’s financing has to come eventually from the districts. This is a substantial hurdle to overcome—making the case for funding research is always difficult. A helpful measure, in this respect, was the designation of the BPTP as the province level coordinator of extension reforms as well as research work. A further reassuring step would be to make BPTP accountable to a board in which Bupatis are core members. This oversight body would be a province-wide analogue to envisaged District Extension Committees, and would provide a vehicle for team building, priority setting, and assessment of results in the extension arena. Small-holder oriented irrigation measures seem like a better bet to increase agricultural productivity. This is in part because the designated counterparts, Water User Associations (WUAs) are typically larger in scale and more viable than FAs. The Propeda proposes a three part province level role in strengthening irrigation institutions. Of these, the case for province level coordination of river basin and related management functions is more convincing than that outlined in support off scheme maintenance and strengthening and empowering WUAs. What needs further discussion is how much public money to invest in raising yields in rain fed districts. And North Sumatra’s traditional agricultural growth “engine,” i.e., tree crop estates, should be kept in view, since productivity may not have leveled off in such units
5
Forestry. The province level government needs to take on different functions in forestry than in agriculture. A more intrusive regulatory role is needed because of the devastating and seemingly unstoppable deforestation which is taking place--it appears that more than 80 percent of lowland and logged forest, 36 percent of hill forest, and substantial amounts of wetlands as of the mid-1980s have been cleared. To date, the main forestry policy instrument has been the cadre of field staff. Unlike agricultural extension workers, foresters operate with little or no back-up in an arena with overlapping interests (official agencies, landless farmers and logging concessionaires) and competing claims, such as adat lands, protected forests, and concessions. The content of the forester’s job is akin to policing with “clients” often seeking to avoid contact. Lack of skills and support for conflict resolution has resulted in low worker morale, weak compliance, ineffective enforcement of regulations, and continuing illegal logging and land clearance. Meanwhile, decentralization is complicating an already messy scene in which the field worker-based approach has been sidelined. Under Law 22, districts acquired operational responsibilities in forestry, but also gained a revenue interests as they can now issue small concessions. This has changed the dynamics, possibly making local officials more amenable to forest exploitation, and opening new ways of getting legal access to wood products. But district officials may also be more responsive to local pressures to slow deforestation. In this environment, a strong regulatory and enforcement role for the province is needed to counter any increased impetus to logging at the district level. The province-level government is already responsible according to Law 22 for setting some standards, providing guidance on certain issues, and for management of protected forests. Moreover, a clause in the statute allows districts to ask the province to act on their behalf. SMEs. The Propeda sees SMEs as the “mainstay of the people’s economy system.” However, a review of achievements and prospects casts doubts on the document’s optimistic SME scenario. The Propeda recognizes that direct assistance has proved costly, and endorses an approach aimed at enhancing the business environment, improve productivity, and developing entrepreneurship. To this end, SME-related tasks such as coordination of local taxies, information provision, training, and advocacy should be taken on by a province level body, that can mobilize stakeholders, skills, and talents. The rationale for this entity would not be technical excellence and quality of research recommendations (agriculture) or enforcement (forestry), but coordination and coalition building. The aim would be to avoid overlap in district initiatives, and more broadly to develop a Local Economic Development Strategy (LEDS), as a partnership between the province and district governments, the private sector, and civil society. LEDS should start with modest but achievable steps, focusing on initiating a virtuous process of more efficient expenditures, increased productivity and growth, leading to greater income opportunities and firm prosperity, and a larger tax base. A LEDS would help balance the expenditure and revenue aspects of SME policy, giving district governments a framework within which to plan local initiatives. Education. The Propeda regards education advance as crucial for the people’s economy. It makes quality improvement a priority, with teachers recognized as the dominant influence. To operationalize a pro-quality approach, districts need to establish effective teacher deployment and compensation arrangements. Districts also need to tackle staff training and peer support, minimum standards, performance monitoring and feedback to communities and school boards, procedures for confirmation and certification, and career development paths—some of these matters involve negotiations with central agencies and unions. All this amounts to a tall order which districts could best take on collectively. For example, groups of districts can exploit scale economies in key technical and management functions covering finance, personnel management, training, regulatory matters, procurement of text books and computers, and curriculum development. The districts could assign these functions to a province-level entity, which

6
would be well situated to coordinate education policies. This could include a mandate to secure quality improvements--the province level, arguably, offers the most realistic opportunities for developing integrated strategies to raise learning levels. Other responsibilities should include balancing differences in educational needs and resources; setting quality standards; managing teacher deployment across districts, and tackling challenges posed by children with special needs. In addition, the province level body could position itself to negotiate with teachers, and as a supplier of technical assistance to the districts, at least during the transition period. Health. The Propeda’s intriguing health sector vision does not lead to clear policy guidelines. The policy agenda in health is analogous to that in education. Low service utilization is attributable ultimately to weak skills and distracted provider behavior. What would turn this syndrome around, i.e., result in provider behavior which is responsive and technically adequate? Training improvements should make a difference along with an insistence on a fulltime job commitment, with strong accountability provisions, and pay increases for a smaller number of staff linked to realistic performance assessment. Such supply-side measures should be accompanied by introduction of demand-side factors including feedback, advocacy, and bargaining mechanisms. Changes in provider behavior and incentives along these lines would require adjustments in staff recruitment, deployment, supervision, and management practices, and complementary changes in health sector funding. These are matters which fall within the jurisdiction of the district, but as with education, local governments may do better by tackling many of these through a collective entity. In addition, health education and promotion, regulatory functions, and negotiations with MOH on priority areas for technical and financial support and with providers would likely prove more effective if undertaken on a group basis. Moreover, a cross-district entity would be the best option to ensure that designs for key health functions are technically effective and cost efficient. Otherwise, districts may represent too small a population base to allocate funds for communicable disease control and related services with externalities. The Joint Health Council (JHC), now being set up in North Sumatra, provides a means for Bupatis and their teams to organize the above activities. Transition. The JHC is an example of how the province and districts have begun to combine forces in different sectors; comparable efforts are being made in agriculture and other sectors. Hopefully, any contested aspects of decentralization between these parties will turn out to be superficial squabbles—awareness that funds and technical skills are in limited supply and need to be shared can and should lead to cooperative outcomes, as should recognition that there are advantages to speaking to Jakarta in one voice. As the districts and province become increasingly comfortable with the new array of roles, they should work together to free up resources for the new tasks just outlined. Both the province and districts will need to jettison some previous responsibilities. To this end, a thorough joint review of spending is suggested. This should be accompanied by an analysis of government work force needs that leads to a comprehensive initiative aimed at rightsizing the civil service, while improving skills, productivity and client responsiveness. The spending and civil service reviews should include central outlays—central ministry staff should be invited to participate, and the province and districts should be allowed to retain the central development spending which is saved. Criteria. Selectivity would be the key organizing principle within the province-districts spending review. Selectivity in policy could begin by revising the approach which has guided government intervention in numerous sectors. To date, sector program designs seem to have underestimated the complexity of the tasks which were taken on and the capacity of the target audience. This explains the reliance on underskilled and poorly paid front line staff. This is changing with extension agents, teachers, doctors, and so forth now, very appropriately, being asked to take full account of the needs and preferences of their target audiences, and to use professional expertise to tailor their advice to client circumstances. The following guidelines may be useful:

7
o Develop a realistic picture of the “market.” It’s best to know how clients and customers
actually feel, what they are looking for, what standards they apply, and what other options they can turn to if needed.
o Deal decisively with providers. Staff need stronger technical and inter-personal skills.
Training, technical support, supervision, and control systems, as well as salaries will all need to be enhanced. This will be costly, and a minority of current employees may emerge as a component of upgraded staff cadres. The downsizing which is entailed needs to be handled fairly and openly. Staff organizations should be brought into the process but without giving them a veto.
o Focus public efforts on indispensable tasks. Policy selectivity is required in part because of
budgetary constraints. This necessity should be turned into an opportunity to redefine priorities and jettison activities which are not being done well, and are not highly valued by clients who have preferred alternatives. Relative to the private sector, the comparative advantage of public services lies in providing unbiased and correct information, maintaining data banks and clearinghouse arrangements and facilitating information sharing, and providing technical advice on matters for which there is no private provision. Providing and organizing social safety nets are important activities for public agencies as well.
o Foster demand-side pressures. Providers need to be exposed to the questions and concerns of
service recipients and their families. Demand-side inputs can be conveyed via passive mechanisms such as surveys as well as more direct ways of eliciting and expressing demand. The “watchdog” NGOs which are now active in North Sumatra may be willing to play an active role in this effort.
8
NORTH SUMATRA: POLICY OPTIONS IN A DECENTRALIZED INDONESIAN PROVINCE3
1. INTRODUCTION : POLICY ANALYSIS IN A CHANGING SETTING As in the rest of the country decentralization in North Sumatra, Indonesia’s most populous province outside Java, has been affected by what many observers felt was an abrupt and poorly prepared beginning on January 1, 2001. The key statutes, Laws 22 and 25 of 1999, had been passed by the National Assembly (DPR) with strong majorities, signed by one President and endorsed by his successors and by the Constitutional Assembly (MPR) in 2001, and later reaffirmed on numerous occasions by the DPR. Little effort was made, though, to explain to opinion leaders, stakeholders, and the public the aims of the new laws. This legislation went into effect in 2001 unrehearsed and without a complete script, on many matters. This commission has been addressed to a considerable extent through the numerous guidelines, regulations, and decrees issued by central and lower level authorities. Still, clarity and consistency remain elusive in regard to some basic principles, notably the responsibilities and powers assigned to the province level or left to central agencies. Democratization and decentralization. The vigorous democratization which preceded decentralization is a factor which differentiates North Sumatra. Democratization has provided opportunities for affected groups to seek redress for long suppressed grievances. For example, Formasa (Forum Masyarakat Adat Tapanuli Selatan) a group of 8525 households in South Tapanuli, is seeking the return of 48,000 hectares now operated by a palm oil estate. The group expected to be contracted to operate half of this land, once their land rights had been transferred to the palm oil estate. Labor is another contested area--several unions in North Sumatra have become effective, at times militant advocates of workers’ rights. For example, SBSI (Serikat Buruh Sejahtera Indonesia), is the second biggest union with approximately 33,000 active members (60,000 card holders) working in 217 companies covering all 19 districts. The union’s stated mission of fighting for labor’s welfare includes keeping an eye on government policies affecting its members directly and indirectly. It has raised concerns about the employment conditions and compensation of women and child workers. There are issue-defined farming and fishing groups as well, including the farmers’ union, Serikat Petani Sumatra Utara (SPSU), with roughly 72,000 members. Within SPSU, the Kelompok Inti Petani Perempuan, (“core group of women farmers”) is working to empower women in the work place and to lessen domestic violence. In fact, the two streams, decentralization and democratization, of the post-Suharto reform movement, have been working in tandem in the province. For example, the leaders of the province-level assembly (DPRD I) regularly invite NGOs to key budget planning meetings, and to the Governor’s accountability speech. The lively and constructive give-and-take which has developed is evident in the legislative reaction each year to the budget and the accountability speech and the Governor’s responses.
3 This paper was drafted by S. Lieberman, drawing on contributions from W. Teleki, C. Buchori, S. Iskandar, I. Abla, D. Pantjadarma, K. Kaiser, D. Dharmapatni, S. Faiez, and M. Juwono. Inputs and assistance were received from P. Marzoeki, L. Hatt, E. Bos, D. Gapasin, W. Cuddihy, G. Alaerts, and D. Aariasingam. B. Sembodo, D. Judkins, and C. Chakravarthi were instrumental in producing the document. Helpful comments were received from Bert Hofman.

9
In addition, guided by Law 22, district-level officials have altered budgeting and related arrangements to elicit citizen involvement, and taken other promising steps. Medan municipality established the Forum Pembangunan Kota (FPK), made up of representatives from local agencies, and stakeholder groups. In addition to reviewing priority projects, the FKP will evaluate programs under implementation. The local government now conducts monthly hearings on environmental issues, and is working with NGOs concerned with cultural heritage. Another example is Binjai’s decree promoting public involvement in policy formulation and implementation. The decree authorizes the participation of civil society in the budgeting process, and the hiring of an expert team to advise to the mayor on legal issues, the environment, and urban development respectively. Meanwhile, numerous NGOs are monitoring policy formulation and program implementation. Some operate outside the bureaucracy, while others work from within, getting involved in programs and projects to keep track of implementation or to facilitate specific activities. The rough division of labor among these “watchdog” NGOs covers the following themes:
• the budget. Timely and accessible reviews are provided by FITRA (Forum Indonesia untuk Transparansi Anggaran), a network of around 30 local NGOs. In 2001, FITRA analyzed the budgets for Deli Serdang and Medan district and the province-level government.
• development and environment. Active groups include Jari Indonesia, a network with
members which closely monitor safety net programs, and Yayasan Humaniora, which also runs an NGO forum. A third organization of interest is Walhi (Wahana Lingkungan Hidup) Medan, a forum of 26 NGOs working on environmental, labor, and other issues. Walhi’s three main concerns have been: the conduct of Inti Indorayon Utama (a pulp producing firm located in the Lake Toba catchment zone which polluted the surrounding area), forestry (illegal logging), and land disputes (indigenous people vs. palm oil plantations).
• consumer protection. LAPK (Lembaga Advokasi dan Perlindungan Konsumen) was
established in 1999 by NGO activists, lecturers, lawyers, and students, to undertake consumer advocacy and protection. LAPK operates as the regional partner of the well known national level Yayasan Lembaga Konsumen Indonesia. At the provincial level, LAPK directs its lobbying at the DPRD, different government agencies, and some other organizations, e.g., MUI (Majelis Ulama Indonesia). At the district level, intensive contacts have been established with various parties, including DPRDs, education institutions, newspapers and radio stations.
• community development. Other NGOs such as the well established Yasika are working on
community empowerment. A second example is Yayasan Delapan, which focuses on indigenous people, farmers, labors, fishermen, and the urban poor.
The view from Medan. Another distinctive element in the North Sumatra scene is the 2001 Regional Development Program (Propeda) which the province-level government prepared. This combined vision statement and action program is intended to guide the design of district level policies, and interventions which cut across districts and sectors. This document has several noteworthy features. The key concern is to address what are seen as lingering effects of the 1997 economic crisis. A wide interpretation is adopted of the scope and underpinnings of the crisis, including dimensions such as regional equity, preservation of natural resources, the quality of education and health services, and trends in law and order conditions and in religious practice and values. An alternative “people’s economy” strategy is proposed which aims to enhance incomes in small farming units, foster agriculture-based manufacturing and services in small and medium size enterprises, and provide improved education and health welfare services. The

10
Propeda acknowledges that this approach will need to pay heed to efficiency and competitiveness so that North Sumatra’s export revenues can be sustained and even increased. The Propeda views decentralization, through contributions to governance and community empowerment and resilience, as a key building block for the people’s economy strategy. A blueprint for decentralization is set out, which includes an extensive role for the province. In justification, the Propeda refers to capacity limitations at the district level;4 these are attributed to 30 years of excessive centralization during the Suharto era. A five year transition to full decentralization is proposed which includes training for district officials, and steps to strengthen community organizations. During the initial phase, the Propeda in effect asserts the right of province level authorities to act in the best interests of North Sumatra’s districts and population overall. For instance, province level officials are seen as having an accurate and unbiased overview of the comparative advantages and needs of individual districts, and to be well placed to act as a neutral party tasked with developing and operationalizing responsive polices.5 The Propeda states, however, that the province lacks the authority and resources to carry out its envisaged agenda since the implementation regulations for Law 22 have not been “fully issued.” As a result, “the division of competencies between the government, the province government, and district governments is not clear enough to be used as guidance.” Preview. This report covers some of the same terrain as the Propeda, i.e., the intersection between development and decentralization. A variant of the Public Expenditure Reviews (PERs) which are a standard Bank instrument and product, the report assesses development policy alternatives in a province which is going through concurrent changes in economic and institutional structures. The paper provides an alternative perspective on various Propeda topics while pursuing several issues left open in the 2001 document. The focus is on sectors, i.e., agriculture and forestry, small and medium enterprises, education, and health, which the Propeda highlights as crucial for the province’s growth and equity agenda and which are important for the budget and government work force. These sectors experienced comparable, increasingly ineffective Suharto-era interventions, which relied on field staff to deliver sectoral “messages” to clients such as school children, farmers, and pregnant women. The five sectors face similar imperatives to enhance the impacts and sustainability of key policies, including increasing the productivity and lowering the fiscal burden of the numerous teachers, doctors, nurses, midwives, agricultural extension agents, and other field workers deployed starting in the 1970s. Sector policy reforms need to proceed, however, without contradicting Laws 22 and 25 and related measures. Perhaps the most important potential advantage of decentralization at the sector level is to facilitate flows of information to and interactions between service providers and consumers, leading to more differentiated, better targeted, and higher quality services. Successful decentralization would lead to more systematic involvement of citizens in policy, design, and financing, and in monitoring service provision. Crucially, clients need bargaining power sufficient to elicit appropriate responses from providers at the decentralized level. Providers in turn should face the incentives, and have access to the skills, supervision, material support, and discretionary authority needed to offer high quality services. If these conditions are fulfilled, decentralization should provide the basis for sustainable financing as well as continuing health advance.
4 “The primary problem in developing regional autonomy is the wide scope of regional development…in the frame of implementing regional autonomy that is not yet supported by the readiness and ability of the regional administrative apparatus in a sufficient measure”(Chapter V, “Development Priorities”). 5 Indeed, the Propeda mentions numerous steps which the province level authorities would like to pursue vis a vis the districts, e.g., encouraging district officials to foster “the values and culture of being productive,” and to expand revenue inflows, carry out procurement transparently and on an efficient scale, restructure district owned enterprises, and so forth.

11
On the other hand, the far-reaching reorganization of government that decentralization represents can be disruptive in the short run. Furthermore, downsizing of administrative units could result in operational levels for key health functions that are neither technically efficient nor cost effective. For example, policy in each sector is affected by the principle of “district primacy” embedded in Law 22 with the associated risk of downscaling.
This report examines for each sector these shared development and institutional challenges. Sections 2 and 3 set the scene as regards development patterns and outcomes (2), and revenue and spending trends (3). Sector specific sections (4-8), cover Propeda proposals, alternative approaches, and related topics such as how best to “demobilize” the cadres of sector staff working in North Sumatra, and how to link employee-focused initiatives to substantive, service quality-related agendas. Overall strategy and inter-sectoral issues are discussed in Section 9. The rest of the current Section (1) discusses development policy constraints stemming from the decentralization-produced downsizing in design and implementation.
Policy Assessment and Paradigm Change. Traditionally, PERs have taken each country’s institutional set up as given--this made it easier to tackle sectoral and cross sectoral issues in single framework.6For example, past PERs on Indonesia were addressed to the Ministry of Finance (MOF) and Bappenas, on the assumption that these agencies had clearly defined cross-ministry “horizontal,” i.e., coordination, evaluation, and oversight responsibilities and powers. A similar premise of unchanging “vertical” allocation, accountability, supervision, and reporting rules and practices, e.g., within line ministries, underpinned PER comments in fields such as agriculture or education. The assumption of unambiguous powers and rules is not fully valid in Indonesia. This is not true across the board--Laws 22 and 25 and subsequent operational guidelines define many responsibilities and relationships at different government levels. Nevertheless, these documents have left unresolved interrelated questions of how cross-boundary considerations would be applied to district level decisions, and how levels and sectoral allocations of central government outlays are to be determined. Put differently, policy analysis in current day Indonesia must deal with two sets of unknowns. The first group relates to making decentralization work better, comprising the responsibilities, incentives, and inter and intra-government relationships needed to establish effective cross boundary, integration and aggregation arrangements. The second set of variables consists of specific initiatives and spending levels in individual sectors determined in light of suggested “checks and balances” on district level decisions. It is hardly surprising that these matters remain to be worked out--they relate to core aspects of the citizen-government relationship, rationales for decentralization, and the to-and-fro within the central government and between Jakarta and local authorities over the scope of decentralization. On one hand, Laws 22 and 25 aim to empower districts to operate freely, no longer subject to central level instructions and supervision, but responsible to local political and budgetary oversight. On the other hand, most societies have identified circumstances in which other considerations take precedence over district primacy and autonomy. In North Sumatra like elsewhere in present day Indonesia, there are three instances in which the district primacy principle should be set aside. (See illustrations in the sector discussions below). The first involves commitments which districts need to take on as civil and political obligations. Examples include policies with respect to national integration, defense, and security; regional equity; and poverty alleviation—the Propeda, articulating a province level perspective gives first mention to national unity and security when it provides rationales for its proposed “cross-sectoral” role. National
6 Bank work at the sub-national level work, e.g., in India ( Uttar Pradesh), Mexico (Guanajuato), and Pakistan (Punjab), has typically been carried out in systems with clearly defined relationships between government levels.

12
commitments would also include assuring access to basic education and health services of adequate quality. This first instance underlies Law 22’s emphasis “on fostering and empowerment of …national standardization” (Article 7). Responsibility for this important function is among the accountabilities not placed under regional (district) authority. The Operational Guidelines (2000, number 25) for Law 22 enumerate matters for which central agencies including designated province-based units have the responsibility and authority to define Minimum Service Standards (MSS). In health, for example, the central government is to set standards with respect to training of medical professionals, services in health facilities, and health financing. In agriculture, this role covers standards and norms for distribution of foodstuff. In education, retained responsibilities include determining standards for the main school subjects, and financing guidelines. District primacy may also need to be superceded when local decisions directly influence opportunities and choices elsewhere. The classic case of market failure is illustrated in the downstream impact, e.g., flooding due to increased run-off, of a decision in one district to permit land clearing. Also included are failures to act--opting to be “free riders”--on the part of districts in respect of, for example, joining in efforts to control communicable diseases, limit water and air pollution from different sources, monitor activities in protected forest areas, and so forth. Law 22 anticipated this eventuality by including language defining responsibilities for cross-district matters. The key Article (no. 9) gives responsibility for cross-district matters to the provinces, while also providing the clearest statement in Law 22 as regards the role, functions, and accountabilities intended for the provinces. The Propeda’s proposed environmental protection role for the province level government is framed to be consistent with Article 9. The Operational Guidelines (number 25, 2000) specify activities with cross-district dimensions. Continuing the health example, these included eradication of contagious diseases, and food and drugs surveillance. And the central government retains the responsibility for issuing permits for “utilization of forest products” and implementing “the security and prevention of disasters on forest and plantation area.” Nevertheless, as in the first instance, the Operational Guidelines leave open how most of the cross district tasks would be organized. A third reason to override boundary lines, which is endorsed in the Propeda, lies in helping districts take advantage of scale economies in providing various services. For example, districts can band together to purchase pharmaceuticals and textbooks, or to organize agricultural extension worker or teacher training, at lower unit costs than if done individually. The need for districts to join forces did not arise before since they were already part of much larger health, education, agricultural research and extension systems in which scale and scope economies had been internalized. Indeed, this has long been is the rationale for sustaining such systems, i.e., they offer convenience, continuity, and cost savings relative to what smaller units would do on a solo basis. And the need to tap into such arrangements is likely to grow as advances in individual sectors become more dependent on transmission of information, new technologies, behaviors, and skills, appropriately selected and conveyed, to clients and consumers. From the district’s point of view, though, signing on to existing systems may be problematic. For example, districts may have to agree to meet specified standards or make financial commitments for which there is insufficient political grounding. This instance provides a related reason to pool resources and make common cause with other districts, i.e., the likelihood that a group would have more clout in negotiations with central ministries or input suppliers such as the teachers’ union.

13
2. DEVELOPMENT PATTERNS AND OUTCOMES
The vulnerability of the population and fragility of conditions in North Sumatra is a persistent theme in the Propeda. This state of affairs is attributed in part to province’s heterogeneity which is seen as a possible source of dynamism as well as conflict. There are 3 indigenous groups, Bataks, Mwlayu Deli, and Nias, along with other ethnic groups, including large numbers of Javanese descent, drawn to the province originally by economic opportunity. Nearly half of the province’s 11.6 million people now live in urban areas. According to the Propeda, the risk factors associated with population diversity were heightened by the 1997 economic downturn and limited recovery since 1999. A sharp reduction in overall output; increased levels of poverty, malnutrition, and unemployment; additional stress on already troubled education and health systems; and further loss of control over and damage to the province’s forest and other natural resources are all attributed to what is seen as an extended crisis. Other consequences linked to the crisis include ethnic friction, urban disturbances, increases in corrupt practices, and breakdowns in law enforcement. The Propeda suggests that the economic downturn revealed serious flaws in what it sees as the pre-crisis, industry-based approach to development. This strategy is criticized for increasing economic vulnerability due to reliance on costly imported raw materials; and running counter to employment generation by favoring capital intensive, formal sector investments. These design faults are attributed to decisions made non-transparently and in an “overly centralized fashion” by a small number of Jakarta-based officials. The Propeda articulates a cross-sectoral, poverty-oriented policy perspective which involves increased attention to rural areas. This people’s economy approach is expected to lead to widely shared development benefits and improved social cohesion and protection of the environment. Elements of this pro-poor approach are discussed in more detail below. To set the stage, it is worth noting changes in the development landscape in the period prior to the crisis. The Propeda recognizes that economic growth was “sufficiently sound” and above the national trend. The RDGP overall (not including oil) increased at a 6.4 percent yearly rate in the province in the 1975-1999 interval. The rate reached 8.9 percent yearly between 1993 and 1997; RDGP fell by 11 percent in 1998, and then rebounded at a 2.7 percent rate in 1999, and then decreasing by 0.9 percent in 2000 (Table 2-1). Thanks to rapid output expansion and declining population growth, per capita income in North Sumatra increased at an impressive 4.8 percent annual rate during the 1975-1999 period. Growth in per capita income accelerated to 7.1 percent in 1993-97 and then fell 6 percent per year through 1999. As noted in the Propeda, the benefits of growth varied by region.7 The North and South East Coast regions (ECN, ECS) led the way in terms of mean per capita expenditure (Table 2-2), followed by the upland zone (MT), and lastly the north coast area (NC). When per capita output is the criterion, ECN, ECS, and MT can trade places in the ordering. In 1993, mean per capita expenditure was highest in ECS followed by ECN (Table 2-3), MT, and finally NC. Six years later, ECS led the group followed by MT, and ECN. MT’s strong showing was likely due to production gains during the 1990s (and slow population growth) including a solid performance during the economic crisis. By contrast, ECN fared less well in the1997-99 interval in terms of production. Meanwhile, the gap between NC and the other regions remains substantial. In 1999, mean per capita expenditure (PCE) in NC was 89 percent of that for MT, the next poorest region and 85 percent of mean per capita spending for the province overall. 7 The regions follow a demarcation based on agricultural conditions adopted by the provincial planning agent (Bappeda) in the 1970s.

14
Sustained growth brought significant gains as regards poverty--North Sumatra is somewhat better off compared to other parts of Indonesia. The poverty ratio fell from 16.8 percent in 1986 to 12.3 in 1993 and 10.9 percent in pre-crisis 1996; it jumped to 16.7 percent in 1999, then resumed the downward trend, falling to 14.2 percent in 2000 vs. 15.2 percent for Indonesia overall (Table 2-4). Within North Sumatra, the poverty ratio in NC was 12.3 percent compared to 9.4 percent in MT, 8.2 percent in ECS, and 4.8 percent in ECN (Table 2-2). Labor force impacts. High output growth rates over a long period are usually accompanied by changes in key labor force dimensions and other structural changes. This pattern fits North Sumatra, where labor force growth appeared to moderate in the 1990s, reflecting reductions in the relative size of population of young labor force age and rising school participation rates (Figure 2-1).8Meanwhile, thanks to expanding off-farm opportunities, the labor force share of agriculture decreased during the 1980s, reaching 63 percent in 1992 and continuing to fall in subsequent years (Figure 2-2 and Table 2-5). And by the mid 1990s, a downward trend was discernible in the absolute number of those working in agriculture, marking another development milestone. The number who cited agriculture as their primary sector this fell by almost 330,000 during the 1992-1997 interval (the sectoral labor force share decreased to 51 percent). This reduction was most extensive for rural women. The decline in numbers in agriculture was accompanied by significant work force growth in industry (20 percent) and services (increases of 40 percent and 34 percent respectively in trading activities and personal services). During roughly the same period, 1990-1996, the absolute number of poor fell by 130,000. During the early and mid 1990s,the labor force changed in other ways. With the work force increasing by almost 400,000 (9.2 percent) in the 1992-98 interval, the number of paid employees grew by over 600,000; their labor share rose from 24.4 percent in 1992 to 35.0 percent, overtaking the Indonesia-wide figure (34 percent). The increase in the number of male wage and salary earning employees was especially large (410,000) exceeding the overall increase (360,000) in the male labor force. The female labor force did not increase during this period, but the number of paid workers rose by 200,000, and the number of unpaid family workers fell by 30 percent, a sign of tightening labor demand. At the same time, those self-employed, mostly operating SMEs, rose by 200,000 province wide, including a 170,000 increase in urban areas. These developments were interrupted by the economic crisis. In the 1998-2000 interval, the numbers working in agriculture increased by 280,000; the labor force share rose to 57.5 percent with the sector accommodating an inflow of urban-based employees and self employed, from construction and other sectors. Related adjustments included modest and temporary reductions in the rural labor force in 1998/99, and in the urban labor force in 1999/2000, combined with increases in the number of workers aged 55 and above, and 15 through 29. There was also some evidence that those with junior or senior secondary vocational training left the labor force in disproportionate numbers. Regional patterns. Distinctive structural changes and reversals were discernible at the regional level. The shift of labor out of farming was most extensive in ECN. In this agriculturally advanced region, nearly half (above 50 percent for men) of the relatively young and well educated work force had shifted to employee status, while a significant share of women had withdrawn from the labor force. Changes of similar direction took place in ECS. An entirely different pattern had developed in NC, one of strong reliance on female workers in agriculture. Roughly 75 percent of the adult women work in this region but in non-wage, family-based jobs, compared to 45 percent in ECN and ECS. Still another pattern can be seen in MT where
8 Estimated annual labor force growth rates were 2.2%, 3. percent, and 1.7 percent during the 1970s, 1980s, and 1990s respectively.

15
there is high female labor force participation, with more women working in trade and related jobs than men. Women in MT work long hours, with work force participation increasing with age. Divergent work force responses to the 1997 crisis were observed at the regional level. In NC, the poorest region, the agricultural labor force rose temporarily, including involvement of urban based men. Women left unpaid family work in large numbers for informal sector jobs. By contrast, in the MT region, the crisis brought reductions in male and female wage employment, and compensating increases in the number of unpaid family laborers. The agricultural labor force increased temporarily in 1998/99. In ECN, the agricultural labor force declined while the numbers working in trade and services grew. Increased numbers of women worked as unpaid family laborers. There was a fall in the number of male wage earners. In ECS, there were increases in the numbers of those aged 60 and over, and (boys) aged 14 and under in the labor force. A gender perspective. The Propeda includes gender issues in its discussion of social concerns linked to or exacerbated by the economic crisis. Gender is on the NGO agenda as well. A common focus seems to be the cultural aspects of female roles and outcomes. The issues often cited are domestic violence, sexual harassment, and the limited decision making powers of women within households. These and related problems are seen as consequences of a strong traditional culture and patriarchal value system in which men are accorded dominant status. The cultural underpinnings of gender-related issues cannot be ignored. Nevertheless, they fall outside the purview of this paper. Instead, the labor force dimensions of female status are suggested as an entry point. This focus is needed because the growth and changing make-up of the female labor force, and special disadvantages faced by working women get too little attention. For example, crisis-related adjustments for working women included a decrease in the number of female wage earners within the agricultural labor force and a temporary shift in 1998/99 by rural women from unpaid family-based work to paid jobs. Fortunately and interestingly, there were only modest changes in the number of female wage earners in urban areas. Similarly, various impacts and side-effects of female labor force participation, e.g., on household time and task allocations, and the world views and behavior of working women themselves, need to be understood. Recap. This discussion supports the Propeda’s call for a rethinking of development policy. Such a reassessment should take note of crisis period concerns, which the Propeda emphasizes, but within a framework which recognizes pre-crisis trends, structural changes, and policy constraints.

16
Table 2-1a: Gross Domestic Products, North Sumatra in Current Prices
Sector 1993 1994 1995 1996 1997 1998 1999 1. Agriculture 4,895,743 5,494,842 6,120,211 7,042,127 8,743,188 13,374,806 19,536,496 2. Mining 601,047 551,432 674,081 623,271 469,096 817,191 843,000 3. Industry 4,482,169 5,531,889 6,490,829 7,629,599 9,073,373 14,915,458 16,809,641 4. Electricity, Gas and Fresh Water
168,974 191,808 225,355 264,410 343,035 423,329 496,613
5. Construction 836,324 937,937 1,041,204 1,241,204 1,433,015 2,027,407 2,286,838 6. Trading 3,116,434 4,112,010 4,637,954 5,296,180 6,688,499 10,367,977 12,229,426 7. Transportation and Communication
1,629,519 1,905,434 2,119,453 2,323,089 2,752,201 3,057,638 3,337,003
8. Finance 1,195,381 1,551,546 1,694,892 1,904,006 2,297,192 2,462,388 2,489,414 9. Other Services 1,289,870 1,424,100 1,626,544 1,849,215 2,206,675 3,259,781 3,929,129 Total (without Gas Sector) 17,733,037 21,287,229 24,102,731 27,711,736 33,726,383 50,046,055 61,329,083
Table 2-1b: North Sumatra RGDP by Sector contribution and Growth
1993 1994 1995 1996 1997 1998 1999
Distribution Agriculture 26.9 25.3 24.8 25.0 25.7 26.4 31.5
Mining and Quarrying 3.3 2.5 2.7 2.2 1.4 1.6 1.4
Manufacturing 24.6 25.5 26.4 27.1 26.7 29.4 27.1
Electrical, gas and water 0.9 0.9 0.9 0.9 1.0 0.8 0.8
Construction 4.6 4.3 4.2 4.4 4.2 4.0 3.7
Trade, hotel, and restaurant 17.1 18.9 18.8 18.8 19.7 20.4 19.7
Transport and communication 8.9 8.8 8.6 8.2 8.1 6.0 5.4
Financial 6.6 7.1 6.9 6.8 6.8 4.9 4.0
Services 7.1 6.6 6.6 6.6 6.5 6.4 6.3 GDP 100 100 100 100 100 100 100
GDP (in million Rp.) 18,215 21,701 24,631 28,173 34,006 50,706 61,958 Growth Agriculture 7.2 8.6 8.7 9.0 2.1 5.7
Mining and Quarrying -9.0 8.7 0.7 -38.0 -17.8 -2.7
Manufacturing 7.8 9.2 9.3 3.8 -16.6 -0.1
Electrical, gas and water 8.0 14.6 13.6 38.5 4.3 4.0
Construction 4.5 6.0 12.7 8.7 -16.2 1.4
Trade, hotel, and restaurant 20.2 9.3 8.8 5.5 -17.9 3.4
Transport and communication 6.7 8.7 8.5 7.4 -17.7 3.2
Financial 14.4 12.8 10.5 5.6 -14.6 -1.8
Services 9.3 7.9 9.6 7.8 -8.8 0.6
GDP total 9.5 9.1 9.0 5.7 -10.9 2.6
GDP non-migas 10.1 9.1 9.2 6.9 -11.0 2.7 Source: Central Bureau of Statistics

17
Table 2-1c: PDRB ATAS DASAR HARGA BERLAKU DI PROPINSI SUMATRA UTARA, MENURUT KABUPATEN/KOTA, 1993 - 1999 (JUTA RUPIAH)/GRDP at
Current Price By Regencies/Cities, in North Sumatra, 1993 – 1999 (Million Rupiahs)
KABUPATEN/KOTA
REGENCIES/CITIES
1993 1994 1995 1996 1997 1998 1999
(1) (2) (3) (4) (5) (6) (7) (8)
01. Nias 599,309.31 743,707.17 883,201.11 1,017,431.35 1,154,886.64 1,738,869.11 1,999,841.23
02. Mandailing Natal - - - - 675,778.17 1,062,438.61 1,148,099.22
03. Tapanuli Selatan 1,353,654.54 1,668,131.07 1,967,103.76 2,205,792.16 1,880,272.30 2,996,248.57 3,304,159.51
04. Tapanuli Tengah 307,756.52 360,583.08 414,677.77 472,432.28 508,552.99 764,481.57 895,444.14
05. Tapanuli Utara 863,047.55 1,009,778.69 1,122,171.65 666,352.56 765,308.77 1,158,061.65 1,345,458.61
06. Toba Samosir - - - 602,002.33 684,953.51 951,288.38 1,163,331.22
07. Labuhan Batu 1,495,911.17 1,708,924.99 1,945,912.82 2,333,703.03 3,927,019.91 5,369,977.19 6,093,216.88
08. Asan 1,916,571.27 2,196,559.63 2,580,087.82 3,025,229.94 3,550,418.52 5,404,445.99 6,114,044.12
09. Simalungun 1,487,388.40 1,717,300.01 1,944,483.05 2,101,291.95 2,211,979.49 3,437,823.22 3,658,657.27
10. Dairi 295,035.76 372,486.31 465,183.73 586,685.45 717,324.20 1,106,094.96 1,289,697.09
11. Karo 482,344.51 586,635.81 645,927.88 724,888.77 842,928.46 1,315,213.53 1,575,487.83
12. Deli Serdang 1,908,390.16 2,414,507.50 2,894,363.49 3,087,153.35 3,501,196.86 5,375,683.78 6,012,473.15
13. Langkat 1,218,239.03 1,379,022.81 2,096,715.56 2,227,883.30 2,328,983.74 3,862,305.29 4,265,689.66
Langkat 1) 1,218,239.03 1,379,022.81 1,608,147.56 1,815,447.55 2,105,378.59 3,309,204.12 3,744,074.20
71. Sibolga 141,106.02 170,085.37 212,645.73 254,173.02 281,339.20 366,223.61 415,428.40
72. Tanjung Balai 267,583.09 317,503.93 357,861.49 398,327.67 430,862.47 596,023.40 689,120.20
73. Pematang Siantar 521,051.95 650,556.75 728,285.16 801,484.71 915,921.18 1,312,611.00 1,528,554.23
74. Tebing Tinggi 250,402.31 306,931.23 363,459.96 385,397.46 426,377.63 602,352.50 686,816.51
75. Medan 4,382,251.46 5,094,032.94 5,806,572.80 6,400,860.11 7,031,630.96 9,737,645.51 10,705,120.29
76. Binjai 247,468.97 297,646.31 339,966.17 392,620.60 425,700.80 613,592.69 708,748.40 Jml 19 Kab./Kota. Total of
19 Reg./Cities 17,737,512.02 20,994,393.60 24,768,619.95 27,683,710.04 32,261,435.80 47,771,380.56 53,599,387.96 Jml 19 Kab./Kota. Total of
19 Reg./Cities1) 17,737,512.02 20,994,393.60 24,280,051.95 27,271,274.29 32,037,830.65 47,218,279.39 53,077,772.50
PROPINSI/PROVINCE 18,215,459.00 21,700,997.90 24,630,522.49 28,173,100.90 34,006,274.64 50,705,973.10 61,957,560.99
PROPINSI/PROVINCE 1) 17,733,037.30 21,287,229.10 24,102,730.82 27,711,736.11 33,726,383.33 50,046,055.39 61,329,083.07 Catatan/Note : 1) Tidak
termasuk Minyak Bumi dan Gas/Excluding Oil and Gas

18
Table 2-1d: PDRB ATAS DASAR HARGA KONSTAN 1993 DI PROPINSI SUMATRA UTARA, MENURUT KABUPATEN/KOTA, 1993 - 1999 (JUTA RUPIAH)/GRDP
at Constant 1993 Price By Regencies/Cities, in North Sumatra, 1993 – 1999 (Million Rupiahs)
KABUPATEN/KOTA
REGENCIES/CITIES
1993 1994 1995 1996 1997 1998 1999
(1) (2) (3) (4) (5) (6) (7) (8)
01. Nias 599,309.31 682,774.46 755,394.70 810,134.09 847,474.21 794,938.11 820,104.62
02. Mandailing Natal - 559,455.23 526,783.61 535,489.19
03. Tapanuli Selatan 1,353,654.54 1,524,178.19 1,703,303.59 1,843,588.27 1,426,888.62 1,343,759.70 1,372,540.60
04. Tapanuli Tengah 307,756.52 338,708.09 371,346.93 412,876.33 436,541.75 400,473.65 414,204.32
05. Tapanuli Utara 863,047.55 928,827.75 995,660.25 570,193.29 603,282.30 569,262.93 583,076.14
06. Toba Samosir 506,928.95 542,370.51 517,061.82 530,935.00
07. Labuhan Batu 1,495,911.17 1,631,070.13 1,781,836.79 2,000,648.02 2,199,857.70 2,226,269.90 2,336,335.41
08. Asan 1,916,476.02 2,084,209.84 2,292,115.68 2,527,920.78 2,750,512.39 2,779,512.59 2,926,478.17
09. Simalungun 1,487,388.40 1,584,334.91 1,718,629.25 1,830,754.48 1,920,435.33 1,867,378.85 1,957,978.33
10. Dairi 295,035.76 325,749.81 354,079.37 392,501.67 418,454.28 428,710.08 430,013.24
11. Karo 482,344.51 546,741.09 615,042.10 673,464.72 724,310.68 729,548.83 770,406.94
12. Deli Serdang 1,908,390.16 2,293,817.88 2,646,148.46 2,819,535.86 3,087,096.06 2,812,455.15 2,924,335.85
13. Langkat 1,218,239.03 1,327,131.34 1,904,841.34 2,040,668.04 1,891,450.31 1,868,372.83 1,870,344.85
Langkat 1) 1,218,239.03 1,327,131.34 1,487,617.34 1,600,493.89 1,676,454.26 1,679,291.39 1,703,855.04
71. Sibolga 141,106.02 156,514.93 185,405.29 219,343.21 232,420.33 212,965.53 224,027.66
72. Tanjung Balai 267,246.53 294,293.40 318,705.76 349,811.36 376,108.73 348,082.14 357,012.20
73. Pematang Siantar 521,051.95 578,501.48 615,661.07 647,779.37 687,620.29 655,266.89 683,194.80
74. Tebing Tinggi 250,402.31 281,793.63 313,184.70 335,173.51 348,116.36 294,034.62 303,197.32
75. Medan 4,382,251.46 4,686,615.42 4,992,604.17 5,479,426.25 5,903,111.60 4,833,911.19 4,999,857.97
76. Binjai 247,440.22 273,248.10 299,497,346.00 328,939.37 337,451.70 294,377.00 307,446.14 Jml 19 Kab./Kota. Total of 19 Reg./Cities 17,737,051.46 19,538,510.45 321,061,305.45 23,789,687.57 25,292,958.38 23,503,165.42 24,346,978.75 Jml 19 Kab./Kota. Total of 19 Reg./Cities1) 17,737,051.46 19,538,510.45 320,644,081.45 23,349,513.42 25,077,962.33 23,314,083.98 24,180,488.94
PROPINSI/PROVINCE 18,215,459.00 19,942,023.72 21,753,805.68 23,714,737.95 25,065,405.00 22,332,689.92 22,910,086.44
PROPINSI/PROVINCE 1) 17,733,037.30 19,525,020.84 21,305,204.69 23,273,774.13 24,876,013.34 22,142,992.78 22,743,020.06 Catatan/Note : 1) Tidak termasuk Minyak Bumi dan Gas/Excluding Oil and Gas

19
Table 2-2: Mean consumption per capita and poverty by region and main source of household income, 1999
North Coast Mountains
East Coast North
East Coast South
North Sumatra
Agriculture Per capita consumption 97,392 105,781 105,951 113,543 105,212 Poverty head count 14.5 11.2 13.3 6.1 11.5 Number 1,461 1,885 712 1,014 5,072 Non agriculture Per capita consumption 128,667 142,963 147,470 135,799 143,276 Poverty head count 6.7 6.1 6.2 2.9 5.7 Number 1,059 1,307 2,421 1,599 6,386
Total Per capita consumption 106,069 118,918 136,003 122,800 124,651 Poverty head count 12.3 9.4 8.2 4.8 8.6 Number 2,520 3,192 3,133 2,613 11,458
Sources: Susenas, 1999
Table 2-3: Household Expenditures
Average monthly household expenditure per capita, 1993 means, standard deviations and number of observations
Quintiles Defined by Region
Region Poorest 2 3 4 Richest Total
North Coast 57849 80639 98054 118166 184603 117861 11004 5274 5241 6746 77163 62148 339 398 413 505 865 2520
Mountains 63051 83585 102600 130326 225813 134314 8596 5431 6250 10556 99385 80922 443 513 577 707 952 3192
East Coast North 64806 92015 118380 152328 268040 149126
11570 7445 7228 13269 119814 95107 458 596 620 668 791 3133
East Coast South 71343 93720 110741 133973 211016 132963
11223 5013 5548 8875 66940 61914 324 379 457 578 875 2613
Total 64436 88744 110439 138473 232781 137706 11618 8116 10433 17222 105206 82657 1564 1886 2067 2458 3483 11458 (Note: quintiles defined at the region level) Sources: Susenas, 1999

20
Table 2-4: Poverty In North Sumatra and Indonesia, 1986 – 1999
North Sumatra Indonesia
Urban Rural Total # Poor % Poor # Poor % Poor # Poor % Poor % Poor 1986 1,665,244 16.82 17.4* 1990 492,876 14.44 872,050 13.03 1,364,926 13.53 15.1 1993 494,479 11.72 837,152 12.70 1,331,630 12.32 13.7 10.31996 457,037 9.51 777,157 11.95 1,234,194 10.91 10.3 1999 1,674,478 14.21 23.5**
Source: BPS * 1987 ** Reflect new consumption standard
Table 2-5: Structure of the working population in North Sumatra 1994-2000 and pros 2001-2005 (%)
Sector Year 1994-1999 Projection
1994 1995 1996 1997 1998 1999 2000 2001 2002 2003 2004 2005 1 2 3 4 5 6 7 8 9 10 11 12 13
1. Agriculture 57,25 55,15 52,93 52,25 53,73 53,18 52,31 51,74 51,32 51,12 50,21 50,10 2. Mining 0.76 0.84 0.94 0.37 0.53 0.5 0.49 0.41 0.43 0.45 0.46 0.4 3. Industry 6.82 6.63 6.39 8.42 6.35 7.28 7.25 7.3 7.41 7.5 7.6 7.79 4. Electricity, Gas & Fresh Water 0.36 0.38 0.45 0.43 0.6 0.24 0.36 0.31 0.35 0.33 0.36 0.35 5. Construction 2.35 3.47 3.19 3.45 3.66 3.05 3.51 3.4 3.52 3.05 0.5 3.3 6. Trading 14.22 14.55 13.95 15.44 17.27 16.35 16.73 17.1 17.25 17.82 17.95 18.3 7. Transportation and Communication 3.32 3.64 4.43 4.34 4.7 4.8 4.7 4.91 4.85 4.8 4.9 4.75 8. Finance 0.5 0.44 0.43 0.5 0.49 0.29 0.3 0.42 0.45 0.43 0.46 0.41 9. Other Services 14.42 14.9 17.29 14.88 12.66 14.31 14.35 14.41 14.42 14.5 14.56 14.6
TOTAL 100 100 100 100 100 100 100 100 100 100 100 100 Sources: The Propeda

21
Figure 2-1: North Sumatra Province: 15-60 year olds, 1970-2005
0
1000
2000
3000
4000
5000
6000
1970 1975 1980 1985 1990 1995 2000 2005
To
tal p
op
ula
tio
n (
000s
)
15-24
25-60
Figure 2-2: Trends in Employment in North Sumatra, Overall and in Agriculture
1,000,000
1,500,000
2,000,000
2,500,000
3,000,000
3,500,000
4,000,000
4,500,000
5,000,000
1965 1970 1975 1980 1985 1990 1995 2000 2005
CENSUS SAKERNAS SUSENAS CENSUS/SUPAS SAKERNAS SUSENAS

22
3. EXPENDITURE TRENDS AND PATTERNS
The Propeda’s call for changes in North Sumatra’s development strategy may have spending implications. For one thing, agriculture and rural-based manufacturing may need a higher share of expenditures; within these sectors reallocations would probably be required. This section characterizes past and present day financing and expenditure patterns as background for section 4-8. Before decentralization. The expenditure picture in North Sumatra in the 1990s was dominated, by centrally determined, direct outlays and earmarked transfers, e.g., through the Inpres, SDO, and other centrally controlled channels (Table 3-1). Total spending rose 4.2 percent annually in real terms through 1997/8. Central, direct outlays made up 60-65 percent of total spending during this period and two thirds or more of development expenditures (Table 3-2). When SDO and other earmarked transfers are included, centrally allocated funds accounted for 80-90 percent of all public spending in the province. As emphasized in the Propeda, overall spending fell very sharply, by 37 percent in real terms, in 1998/99 before recovering somewhat (16 percent) in 1999/2000. As a result, total spending in constant prices in 1999/2000 plunged to the 1990/91 level of outlays--this represented a 10 percent decline in real income in per capita terms. The reduction was steepest, by 75 percent in 1998/99, at the province level, with spending hardly increasing in the following year. Overall, the share of government outlays in aggregate provincial output began to fall in the early 1990s and dropped further during the crisis (Table 3-1). Per capita public spending in North Sumatra, at just under Rp.500,000 in 1999/2000, was relatively low among Indonesia’s provinces. This outcome is traceable to gaps in respect of three key sources: per capita shared taxes, locally generated revenues, and transfers earmarked for staff, were typically above those in the main Java provinces and some provinces in Sumatra but lower than outlays in Kalimantan, Sulawesi, and Bali. Information is available on development outlays, consolidated across Central agencies, the province, and North Sumatra’s districts, in 2000 (Table 3-3). This paper’s sectors of interest, i.e., education, health and family planning, agriculture and irrigation, and industry, accounted for 27 percent of consolidated expenditures with transportation and infrastructure-related outlays claiming over 50 percent of consolidated public outlays. Expenditure shares within the central, provincial, and district spending components, were similar for education but diverged for irrigation and health (a relative priority at the province level) and transport (favored by the province and districts). New instruments and decision makers. The decentralized framework which came into effect on January 1, 2001 was intended to give district and province level decision makers the increased flexibility and augmented resources needed to develop locally grounded programs. Per capita budgeted revenue in North Sumatra in 2001 was relatively low compared to other provinces (Figure 3-1, Table 3-4). This is attributable to predicted returns which are below average for three financing sources: shared taxes, locally generated revenues, and central grants and transfers. Nevertheless, the resource picture and actual outlays change substantially in 2001. A new unearmarked grant (DAU) subsumed the pre-decentralization SDO and Inpres channels. North Sumatra’s 13 districts

23
(kabupaten) and 6 municipalities (kota) received DAU grants averaging 152 billion.9 Due mainly to DAU transfers, district revenues in 2001 were 72 percent larger than what was received in 2000.10 In addition, four districts got special allocation grants (DAKs) of between Rp. 500 million and Rp. 16.3 billion for reforestation purposes, and three received loan funds. Another revenue component, the local portion of shared taxes, amounted to Rp.13.1 billion per district 2001, nearly double the 6.8 billion on average generated locally from user fees and taxes, Pendapatan Asli Dareah (PAD), still another component. Combining all sources, districts received 1.95 billion on average with the DAU comprising 78 percent of this figure. Of course, there were large differences between districts in revenues--DAU inflows varied by a factor of four. This is not surprising considering that district populations ranged from Deli Serdang’s 1.96 million to Sibolga’s 82,000. Nevertheless, variation in DAU payments was almost as wide when put in per capita terms. DAU transfers per capita to the ECN region, which includes Medan, rapidly growing Binjai, and Deli Serdang , were 45 percent -50 percent below those in the MT region. Shared taxes per capita clustered in the 20 million range, i.e., less than 10 percent of DAU per capita. Deli Serdang, possibly the first district to introduce new levies and taxes, and Medan generated the largest PAD revenues followed by Simalungun, Asahan, Toba Samosir, and Pematang Siantar. PAD receipts were still low in the other districts (and municipalities) despite stated intentions and initial steps to expand locally generated revenues. (The Propeda recommended a package of activities to enhance “Original Regional Revenues.”) District outlays. Aggregate spending in the 19 districts was an estimated Rp.3.1 trillion in 2001, i.e., over twice that in 2000 and 48 percent higher than the 12 month equivalent of the 2000 (Figure 3-1). Routine outlays came to an estimated Rp. 2.2 trillion, Rp. 116 billion per district on average, with salaries and other personnel-related costs accounting for 75 percent of this amount. Development spending, which averaged Rp. 49 billion per district, was Rp. 923 billion overall, substantially larger (41 percent) than the 12 month 2000 figure for the same districts. How have districts used their larger revenue flows and greater autonomy in spending? This question can be tackled by considering whether higher funding was sufficient to meet expanded responsibilities. For this, the ratio of revenues to obligatory expenditures provides a rough indicator of the adequacy of resources received by districts is. The latter could be approximated by including first, the civil servant compensation formerly financed in large part by an SDO grant--this comes to Rp. 103 billion per district on average. A second component is an estimate, Rp. 39.3 billion, of what would be needed, on average, to maintain and operate public facilities and services.11 Combining these elements yields estimated spending requirements of Rp. 142.3 million. Subtracting “required” outlays from average revenues yields an estimated “surplus” of approximately Rp. 52.7 billion per district. This rough estimate suggests that the average district has substantial, apparently uncommitted funds available for allocation and program development. However, this figure needs to be seen in context. First, there is considerable variation between districts in the discretionary revenues which are available in per capita terms. There is a seven fold difference between Deli Serdang (Rp.40,000 per person) and Tebet Tinggi (Rp. 294,000 person) in the availability of uncommitted resources. As with revenues, expenditure obligations vary considerably between districts and regions, with higher outlays per person reported for the North Center (NC) and MT regions. These higher per capita spending requirements occurred, however, in regions which depended on DAU funds. Estimated funds available for discretionary use show one district, Tanah Karo, with inadequate revenues, i.e.,
9 The numbers in this section are based on information for 16 of the 19 districts in the province. Data were missing for Nias, Mandaling Natal, and Langkat. 10 Revenues for 2000 are calculated on a 12 month basis. Total level II revenues were Rp. 84.6 billion per district on average for the 9 month fiscal year, and 112.6 billion on a 12 month basis. 11 Based on Inpres funding for 1999/2000.

24
funds were not sufficient to cover notional spending requirements, and another six districts with 25 billion or less in “surplus” revenues. By contrast, seven of eight East Coast (North and South) districts had more than 40 billion rupiah available for local priority setting. So some districts face difficulties due to limited revenue inflows. But officials seem to feel even more constrained on the expenditure side. This was seen first in the often stated expectation that different central ministries would continue to fund certain activities or inputs, e.g., vaccines. A second concern related to resources actually available for decentralized priority setting and allocation, with a strong sense of pessimism and even suspicion that this envelope will be quite small once all required deductions occur The example cited usually was the required allocations from the DAU for civil servant compensation, including pay and allowance increases. District officials were irritated by central government delays in informing the province about the increase in civil servant salary effective January 2001, to be paid in July 2001. This boosted the wage bill an estimated 20 percent in Deli Serdang district. Another sizable increase in teachers’ functional allowances, also backdated, was announced unilaterally by the Minister of Education in March 2002. Also not budgeted in advance, were the higher functional allowances linked to increases in status and echelon which came into effect when many staff were transferred to the districts. For example, the head of the Dinas office and school principals each advanced one echelon. Such increased salary outlays likely affected other allocations -- operational costs reportedly received much less than they normally get. These deductions, some unanticipated, have colored the way district officials view the DAU and APBD, the overall local budget, and the decentralization process itself. In effect, the DAU is seen as a replacement for the previous grants for civil servants, essentially an SDO tied to place rather than individuals--in a telling phrase, staff refer to DAU allocations for compensation as “Prima Donna” payments. District decision makers in different sectors do not view their local budget (APBD) as “one pocket” over which they have the autonomy and authority to finance their needs. In addition to salary matters, district decision makers feel they have little or no discretionary powers in personnel matters--they cite the absence of transfer arrangements and so forth. And then there are important matters, with expenditure implications, over which responsibilities remain poorly defined, e.g., water resources management. Taken together such concerns may have slowed the transition to new funding and planning arrangements. As discussed below, it has also prompted some local decision makers to cut spending on activities once financed through centrally managed programs Another angle. District-level responses can also be gauged in the way the additional resources received following decentralization were spent. There was no change between 2000 and 2001 in the average budget share, 30 percent, allocated to development activities (Tables 3-1, 3-2, and 3-3). However, there was greater variation around the mean between districts in terms of financing development spending. Sibolga, for instance, reduced the absolute level and share (from 47 percent to 11 percent) of development spending within public spending. North Tapanuli followed a contrasting strategy of increasing the level and share of development spending, while two rapidly growing towns, Pematang Siantar and Binjai, used their discretionary funds to raise development outlays more than fourfold in 2001--on average development spending rose by two thirds at the district level A related question is whether increased revenues provided districts with opportunities to pursue their own priorities and development goals. This can be explored by comparing spending patterns in 2001 with previous years. This exercise reveals greater variation around the mean for key sectors in 2001 compared to 2000, suggesting that individual districts responded to decentralization with different priorities. For example, Tanjung Balai and Labuhan Batu each allocated over 15 percent of development funds to education compared to Tanah Karo’s 1 percent.

25
Province-level patterns. The funding and spending picture at the province level changed very little following decentralization. Revenues at Rp. 800, were virtually identical comparing 2001 with a 12 month equivalent for 2000 (Table 3-1), with the new financing instrument, the DAU, and a large carry over from 2000 making up for reductions in shared taxes and in returns from natural resources taxes. On the spending side, outlays in 2001 were 45 percent greater than the 2000 figure scaled up to a 12 month estimate. The 45 percent increase reflected a 74 percent rise in routine outlays and 13 percent increase in development expenditures. The latter figure was lower than that for total district level, development spending, and suggests a conscious decision by province level officials to emphasize routine expenditures. The allocation of development expenditures sector-wise also did not change dramatically. For instance, the share of transport in overall development outlays rose from 23 percent to 27 percent, while the shares of agriculture and irrigation (from 38 percent to 42 percent), and health, family planning, and education (from 12.6 to 9.9) increased and decreased respectively. Central government outlays. Central level development spending fell 45 percent between 2000 and 2001on a 12 month comparison basis. Nevertheless, the amounts involved, representing 85 percent of district development outlays, were still substantial, especially for those sectors in which central resources were concentrated. The major central development funding emphasis continued to be infrastructure, accounting for 65 percent of development outlays in 2000 and 49 percent in 2001. Meanwhile, the human development sectors increased their combined share from 13 percent to 24 percent, and agriculture (including irrigation) claimed a slightly smaller share, 12 percent in 2001 compared to 14 percent in 2000. At first sight, central development outlays overall and by sector seem to be too large. But the appropriate level and focus of central spending must be seen within the constraints and needs of each sector. In this regard, the rationales provided in Section 1 for countermanding Law 22’s district primacy principle could justify a non-marginal central role. On the other hand, current central expenditure levels may be mainly due to program momentum, including conditions related to the availability of foreign funding. More than half of North Sumatra’s development budget was supported by external financing, making it probable that sector shares were affected by life cycle and other project-specific effects. For instance, disbursements by a large Bank funded education project have been affected by compliance with procurement procedures. Another view of central spending relates to the adjustment to decentralization which each sectoral ministry is undergoing. The line ministries are still in the early stage of what is could be a drawn out and contested process. From this perspective, current central spending may still contain resources for functions now being carried out at the district. Explanations for current central development spending and possible rationales for future outlays in a decentralized system are reviewed below. Consolidated spending in 2001. Combining central, district, and province-level changes, decentralized government expenditures in North Sumatra reached Rs. 5.7 trillion in 2001. In constant prices, this amount was 17 percent and 4 percent smaller compared to the 1999/2000 and 2000 (12 month basis) figures respectively. Development outlays fell (9 percent, and 21 percent compared to 1999/2000 and 2000 respectively) more sharply than routine spending (-2 percent,-18 percent compared to 1999/2000 and 2000 respectively). The is because the 58 percent and 31 percent increases in district development spending in constant prices did not fully offset the 60 percent and 49 percent reductions in central development outlays. Province-level development expenditures changed very little in real terms. The overall reduction in development spending in 2001 was relative to the post-crisis levels established in 1999/2000 and 2000. But the figures in the latter period were already a third less than pre-crisis levels. Therefore, in 2001 development spending fell to a little more than half of pre-crisis

26
figures. This may have reflected transitional, temporary factors during 2001. However, this trend bears watching, while looking specifically at what governs district level development spending. For example, districts may feel outlays were too high before 2001, and may assume a continuing central role in development outlays. Central and province level decision makers may also take note of these findings. A common entry point. The resource picture has changed at different government levels in North Sumatra. Districts were responsible for more than 50 percent of spending overall in 2001 on both routine and development accounts, though this larger share overstates the degree of district discretionary control over revenue allocation and spending. The central spending role has been reduced somewhat, though line ministries still have the resources and other instruments needed to make an impact in specific sectors. These features--a much larger district role but subject to some predetermined allocations and an independent central role--have special importance for agriculture, forestry, education and health, and small and medium enterprises. As is evident in development budget allocations, these sectors have long been key elements in national anti-poverty and pro-equity policies. Central agencies continue to be a factor, viewing their role as that of translating national priorities into operational reality through direct spending and by influencing district level allocations. The continuing influence of the central ministries is also seen in sector policies which are still largely in place. In each case, sector strategy revolves around government-hired field staff who have now been transferred to the districts but who retain major service delivery responsibilities. This staff-reliant approach is a legacy of Suharto’s New Order regime. The education sector employs the largest number of these fieldworkers, i.e., over 94,000 primary and secondary school teachers and supervisors, followed by health, agriculture, and forestry (Table 3-5). How to make best use of these large cadres and/or the resources they embody, and how to link staff-related initiatives to substantive, service quality-related agendas are key concerns in each of the five sectors. Another common issue is the focus and scale of central funding. The options which are reviewed involve the division of responsibilities between districts and other government levels, including how to solve or sidestep the cross-district issues arising in these priority sectors and the possible role of the province along Propeda or other lines.

27
Table 3-1: Trends in Spending by Level of Government in North Sumatra (Millions Rps)
North Sumatra 1990/91 1991/92 1992/93 1993/94 1994/95 1995/96 1996/7 1997/8 1998/9 1999/00 2000 2000
(12 Mos) 2001
Central
Expenditures 986,243 1,139,729 1,434,671 1,552,544 1,531,982 1,847,824 1,964,686 2,242,564 2,617,413 3,582,233 2,062,453 2,749,937 1,751,592
Expenditures (Routine) ** 538,498 619,657 750,550 921,148 756,877 861,811 986,520 1,176,982 1,311,196 1,966,039 994,901 1,326,535 970,655
Expenditures (Dev’t) 447,745 520,072 684,121 631,396 775,105 986,013 978,166 1,065,582 1,306,217 1,616,194 1,067,552 1,423,402 780,937
Province
Expenditures 295,922 315,821 361,339 440,258 488,401 537,232 606,045 714,238 317,261 435,830 416,923 555,759 804,277
Expenditures (Routine)* 235,667 253,510 298,409 364,664 404,579 435,558 467,930 551,513 196,841 196,087 219,719 292,886 508,208 Expenditures (Development)* 60,255 62,311 62,930 75,594 83,822 101,674 138,115 162,725 120,420 239,743 197,204 262,873 296,069
Districts
Expenditures 261,686 322,575 345,896 416,747 432,263 549,695 649,881 827,944 1,305,036 1,670,090 1,608,157 2,142,356 3,111,798
Expenditures (Current) 118,018 138,479 133,642 163,439 193,733 267,754 347,029 425,798 869,809 1,182,699 1,117,498 1,488,258 2,188,488
Expenditures (Dev’t) 143,668 184,096 212,254 253,308 238,530 281,941 302,852 402,146 435,228 487,391 490,659 654,098 923,310
PGDP 18,215,459 21,700,998 24,630,522 28,173,101 34,006,275 50,705,973 61,957,561
Total Expenditures 1,543,851 1,778,125 2,141,906 2,409,549 2,452,646 2,934,751 3,220,612 3,784,746 4,239,710 5,688,153 4,087,533 5,450,044 5,667,667
Total Expenditures Net of
Transfers for Provinces Central % of Total Exp. (Net) 63.90% 64.10% 67.00% 64.40% 62.50% 63.00% 61.00% 59.30% 61.70% 63.00% 50.50% 50.50% 30.90% Province % of Total of Exp. (Net) 19.20% 17.80% 16.90% 18.30% 19.90% 18.30% 18.80% 18.90% 7.50% 7.70% 10.20% 10.20% 14.20% Districts % of Total Exp. (Net) 17.00% 18.10% 16.10% 17.30% 17.60% 18.70% 20.20% 21.90% 30.80% 29.40% 39.30% 39.30% 54.90%
CGDP 329,776 382,220 451,717 532,568 627,321 955,753 1,109,980 1,290,684 716,258
RealGDP 329,776 354,641 383,792 413,798 433,246 376,374 379,558 397,666 203,689
DEFL 0.79 0.85 0.92 1 1.08 1.18 1.29 1.45 2.54 2.92 3.25 3.52

28
Table 3-2: Spending by Level of Government in constant 1993 prices
North Sumatra 1990/91 1991/92 1992/93 1993/94 1994/95 1995/96 1996/7 1997/8 1998/9 1999/00 2000 2000 (12mos) 2001
Central
Expenditures 1,248,409 1,340,858 1,559,425 1,552,544 1,421,442 1,569,965 1,526,534 1,548,779 1,030,733 1,224,946 635,452 846,135 498,117
Expenditures (Routine) 681,643 729,008 815,815 921,148 702,265 732,220 766,512 812,858 516,347 672,288 306,534 408,165 276,034
Expenditures (Dev’t) 566,766 611,849 743,610 631,396 719,177 837,746 760,022 735,922 514,386 552,658 328,918 437,970 222,082
Provinces
Expenditures 374,585 371,554 392,760 440,258 453,161 456,448 470,889 493,273 124,937 149,032 128,456 171,003 228,720
Expenditures (Routine) 298,313 298,247 324,358 364,664 375,387 370,063 363,575 380,891 77,516 67,052 67,697 90,119 144,524
Expenditures (Dev’t) 76,272 73,307 68,402 75,594 77,774 86,385 107,313 112,383 47,421 81,980 60,760 80,884 84,196
Districts
Expenditures 331,248 379,500 375,974 416,747 401,073 467,037 504,949 571,802 513,921 571,088 495,481 659,186 884,931
Expenditures (Current) 149,390 162,916 145,263 163,439 179,754 227,492 269,637 294,069 342,529 404,424 344,306 457,926 622,361
Expenditures (Dev’t) 181,858 216,584 230,711 253,308 221,319 239,546 235,312 277,733 171,392 166,664 151,174 201,261 262,570
Total Expenditure 1,954,242 2,091,912 2,328,159 2,409,549 2,275,676 2,493,451 2,502,371 2,613,855 1,669,591 1,945,066 1,259,389 1,676,937 1,611,768
DEFL 0.79 0.85 0.92 1 1.08 1.18 1.29 1.45 2.54 2.92 3.25 3.25 3.52
Central % of Total Exp. 64% 64% 67% 64% 62% 63% 61% 59% 62% 63% 50% 50% 31% Province % of Total of Exp. 19% 18% 17% 18% 20% 18% 19% 19% 7% 8% 10% 10% 14%
Districts % of Total Exp. 17% 18% 16% 17% 18% 19% 20% 22% 31% 29% 39% 39% 55%
Total Routine 1,129,346 1,190,172 1,285,436 1,449,251 1,257,405 1,329,774 1,399,724 1,487,817 936,392 1,143,764 718,537 956,209 1,042,919
Total Development 824,896 901,740 1,042,723 960,298 1,018,270 1,163,676 1,102,647 1,126,038 733,199 801,302 540,852 720,115 568,849

29
Table 3-3: Sectoral Shares of Development Spending by Level of Government, 2000 and 2001 Year/ Share
Overall Develop 12 month Industry Total
12 month Agric. & Total
12 month Irrigation Total
12 month Educ.* Total
12 month Health** Total
12 month
Spending total Forestry total total total total
2000
Central 1,067,552 1,423,402 0.1% 1043 1,390 7.0% 74,839 99,785 3.1% 32,910 43,879 12.5% 133,707 178,276 5.2% 55,785 74,380
Province 197,204 262,939 0.6% 1150 1,533 7.0% 13,792 18,390 15.1% 29,690 39,587 8.8% 17,292 23,056 14.0% 27,562 36,749
District 490,696 654,261 0.4% 2154 2,872 3.9% 19,131 25,508 1.1% 5,198 6,931 10.6% 52,040 69,387 3.0% 14,865 19,820
Overall 1,755,452 2,340,602 0.2% 4,346 5,795 6.1% 107,762 143,683 3.9% 67,798 90,397 11.6% 203,039 270,718 5.6% 98,212 130,949
2001
Central 780,937 0.2% 1698 4.3% 33,757 8.0% 62,840 19.7% 154,112 3.3% 25,550 Province 296,100 0.4% 1213 5.0% 14,854 14.2% 41,934 5.2% 15,538 13.9% 41,143 District 923,310 0.5% 4865 4.4% 40,556 2.5% 23,220 8.0% 73,435 5.6% 51,266 Overall 2,000,347 0.4% 7,776 4.5% 89,167 6.4% 127,994 12.2% 243,085 5.9% 117,959
* Includes Ministry of Religious Affairs activities ** Does not include Family Planning

30
Table 3-4: Consolidated Province Revenues per capita
Own Source
Revenue Share Non-Tax Fron Natural Resources
Share Tax (PBB + PPH +BPHTB)
DAU 2001 + Contingency
code_prop pc_pad pc_sda pc_shtx Pc_dau2001_2 1_DI Aceh 23,109.27 275,520.90 28,314.09 538,302.402_Sumut 30,907.82 6,520.01 27,013.53 298,978.403_Sumbar 30,528.46 7,847.32 20,455.29 442,246.004_Riau 65,501.52 862,949.20 87,939.98 478,916.205_Jambi 32,751.09 32,234.60 33,028.42 451,023.806_Sumsel 21,997.22 96,620.00 24,178.96 246,549.507_Bengkulu 21,534.75 7,822.95 18,877.77 493,943.008_Lampung 14,277.15 32,183.93 13,154.93 271,698.709_DKI Jakarta 201,902.10 11,362.36 289,006.60 92,192.2310_Jabar 28,814.14 7,871.45 22,116.71 179,167.5011_Jateng 27,440.35 1,521.79 12,074.32 266,040.3012_DI Yogya 45,352.54 1,106.07 19,849.50 366,457.0013_Jatim 30,869.65 4,561.85 20,573.39 265,484.1014_Kalbar 23,450.59 9,786.05 21,170.32 420,663.0015_Kalteng 33,447.86 102,455.60 51,625.61 589,468.3016_Kalsel 39,543.50 71,601.73 37,840.80 399,165.4017_Kaltim 67,268.71 1,656,517.00 135,959.60 760,949.4018_Sulut 35,023.99 6,719.28 18,693.17 486,467.1019_Sulteng 38,186.86 10,891.61 17,745.70 549,391.8020_Sulsel 31,260.96 8,818.57 22,830.10 376,750.0021_Sultra 21,505.85 7,019.99 14,073.74 534,972.4022_Bali 214,649.50 1,971.76 33,337.34 426,211.3023_NTB 21,508.25 16,051.46 15,929.09 343,727.3024_NTT 13,533.70 2,508.49 13,523.37 577,309.7025_Maluku 25,232.37 13,910.87 23,824.73 662,149.4026_Irja 30,621.78 129,589.50 107,211.90 1,315,409.0027_Maluku Utara 7,772.98 48,082.84 24,470.35 632,409.5028_Banten 38,352.77 626.14 32,830.98 157,694.8029_Bangka Belitung 33,733.95 25,410.96 32,976.83 351,455.8030_Gorontalo 19,861.23 6,339.93 13,504.59 447,986.90Note: Consolidates province includes all local governments and the provincial level. Only some Rp. 13 Trillion could be identified by region. Source: MOF Budget Department, SIKD, and Staff Estimates

31
Table 3-5: North Sumatra – Number of Staff and Share of Development Budget by Sector, 2000 and 2001
Staff 2000
Overall* 2001
Overall* EDUCATION 11.6 12.2 Primary 65,731 Junior Secondary 18,054 Senior Secondary 10,318 Principals Agriculture** 10.0 10.9 Extension Worker 1,335 Specialist 65 Rural Center Heads 163 Provincial Office Technical 95 Administrative 114 District Staff Technical 387 Administrative 150 Mantri tani 149 Forestry Foresters 427 Full Time 248 “Honorary” Staff 129 Administrative Staff 584 Health 5.6 5.9 Specialists 496 1356 General Practitioners 698 1066 Dentists 412 823 Pharmacists 344 Other Paramedics 342 Nurses (incl. Dental Assistants
9078
Other Health Personnel 3949 Non Medical Doctor (GP) 410 Dentist (PTT) 98 Midwife (PTT) 2834 Midwife 7442 Total 27,456
* Consolidated spending covering district, province, and central level outlays. ** Budget share refers to agriculture, irrigation, and forestry spending.

32
Figure 3-1: Some are more equal than others (Per capita revenues after DAU, 2001, consolidated province, Rp.).
0.00
500,000.00
1,000,000.00
1,500,000.00
2,000,000.00
2,500,000.00
3,000,000.00
Ban
ten
Jaba
r
Jate
ng
Jatim
Lam
pung
Sum
ut
Sum
sel
NT
B
DI Y
ogya
Sul
sel
Ban
gka
Bel
itung
Kal
bar
Gor
onta
lo
Sum
bar
Ben
gkul
u
Sul
ut
Kal
sel
Jam
bi
Sul
tra
DK
I Jak
arta
NT
T
Sul
teng Bal
i
Mal
uku
Uta
ra
Mal
uku
Kal
teng
DI A
ceh
Ria
u
Irja
Kal
tim
Rupiah Per-capita
Ow n Revenues Natural Resource revenues Shared Taxes DAU+contingency
Source: SIKD, authors’ calculation. Note: the numbers for consolidated province are aggregates of the local level and the provincial level government within the same province
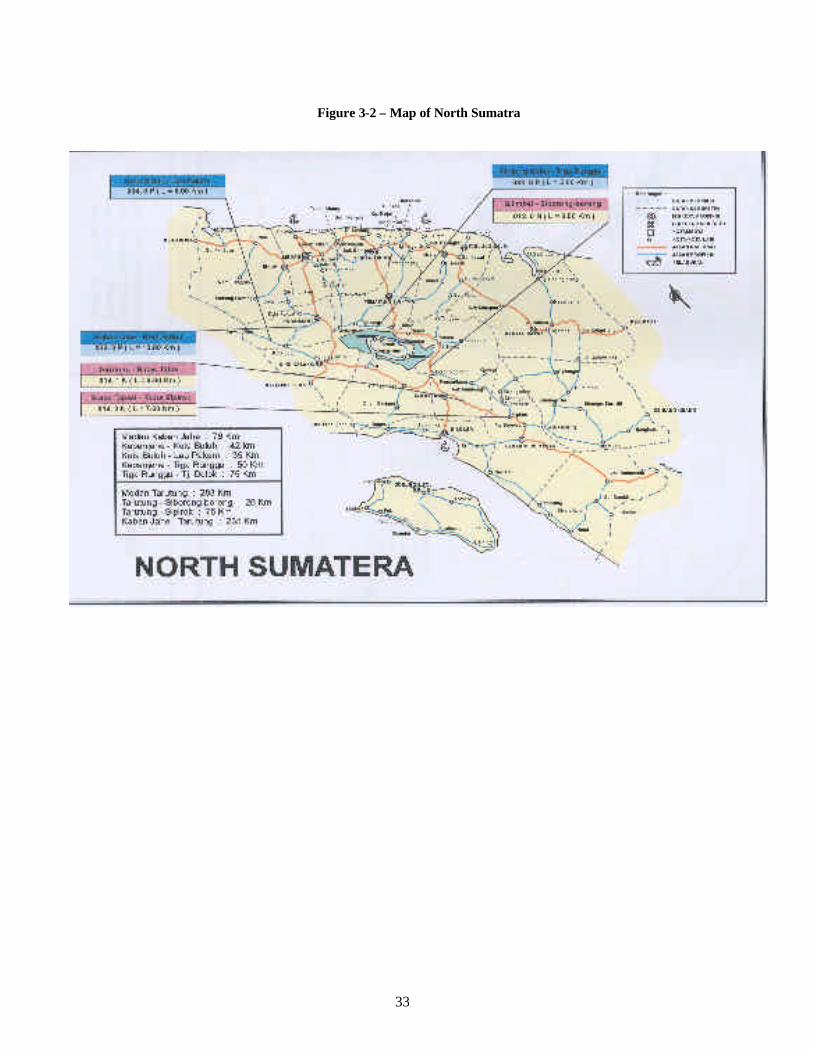
33
Figure 3-2 – Map of North Sumatra

34
4. AGRICULTURE
The Propeda’s people’s economy strategy is agriculture-based. This is understandable in view of past, including very recent performance. Supported by outlays on land clearing, irrigation and drainage, processing and marketing facilities, transport infrastructure, and related investments, agriculture delivered an average yearly growth rate of 5.6 percent (in constant prices) during the 1975-99 period, including an 8 percent growth rate during the 1993-97 interval. Growth continued at a lower rate (4.1 percent) during and after the crisis. Thanks to this long term performance, agriculture’s share of RGDP remained high, declining from 41 percent in 1975 to 26 percent in 1996, then rising to 32 percent in 1999 and 2000 (Table 2-1). Agriculture has also served as a flexible labor reservoir, providing employment and income security, including support during crises, to over half the labor force. The sector contributed directly to poverty reduction in North Sumatra via on-farm employment. Agricultural growth also benefited off-farm employment and income generation, by providing a market for inputs, services, and consumer goods, or alternatively a revenue stream available for reinvestment or other purposes. Through such backward and forward linkages, agricultural expansion had an indirect and positive effect on poverty trends in the province. So the emphasis on agriculture seems like a good bet. Moreover, the Propeda contends that a stronger linkage to poverty reduction can be achieved via future on-farm output expansion. The growth pattern in the 1980s and 1990s is seen as allowing regional disparities to persist and even widen and to have contributed too little in respect of on-farm job creation. Looking ahead, potential small holder production gains are seen as an opportunity to generate investment and employment in backward areas of the province, and in small and medium enterprises (SMEs) in agri-business and related fields by stimulating forward and backward linkages. The anti-poverty, job creating, and inter-sectoral benefits are important enough, it seems, for the Propeda to accept an output growth rate below the pre-crisis, mid1990s (Table 4-1). In regard to these broad objectives, the Propeda sets out a wide-ranging set of intermediate goals and measures. Meanwhile, it is too early to look for the impacts of this approach on spending allocations. Still, a continuing priority to agriculture is seen in the 2001 province-level budget--agriculture and irrigation account for 21 percent of the development budget (Table 3-3). Sizable shares are allocated as well in the central level (12 percent) and district level (11 percent) budgets. The 12.5 percent share of the consolidated budget represents a slight increase over the 2000 figure (12.3 percent), and continues the strong support given the sector in central development spending through the 1990s (Table3-3). In absolute terms, district development spending on agriculture rose fourfold in 2001 compared to 2000 (12 month basis). But this was not enough, even combined with a 20 percent increase in province level spending, to compensate for the 56 percent fall in central level spending (Table 3-3). In this and the other sector sections (5-8), the focus is on opportunities, and risks and trade-offs associated with key policy components. The Propeda serves as a useful entry point--the focal questions are first, whether proposed solutions have merit in technical and sectoral terms, and second, what financing and institutional constraints need to be overcome Special features. What is distinctive about North Sumatra’s agricultural development is the contribution of export-destined plantation crops. Starting in the late nineteenth century, Dutch investments created a sizable estates or plantation sub-sector.12 The main estate crops, were and remain rubber and oil palm, followed by coconut, cacao, coffee, tea, tobacco, and sugar cane. There are at least 15 other estate-crops
12In Indonesian usage, “estates” refer to areas of tree crops of 25 hectares or more under common management (Barlow and Thee, 19xx?).

35
produced in the province, with ten of these exported (cloves, casiavera, patchouli, nutmeg, pepper, gambier, palmnut, vanilla, ginger, and cardamon). The estate sector accounted for 27 percent of agricultural value added in 1975, rising to 40 percent in 1993, and 41 percent in 1997 and 2000. Crop exports earned US$185.8 million in 1999, about 10 percent of total Indonesian agriculture exports. Estate crops, which already contributed the largest share of sectoral value added, performed better (9.5 percent yearly growth rate) than food crops during 1993-1997 (9.5 percent versus 5.8 percent) but less well (4.1 percent versus 4.2 percent) during the 1997-2000 interval. Estates, which range from operations of a few hundred hectares to corporate enterprises covering thousands of hectares, were carved out of the forests which once blanketed the province. Tree crops are also grown by small holders, i.e., units cultivating areas of less than 25 hectares. The main rubber and oil palm estates are in the fertile, well watered East Coast North (ECN) and East Coast South (ECS) regions which have excellent market connections (See Regional Agricultural Profile). Of the two, ECN is more developed, with estate crops and rice benefiting from technically advanced irrigation. Thanks to sophisticated input use, rice yields are the highest in the province. Flooding and soil erosion are the main environmental concerns, apart from pressure on the remaining forest cover. Environmental issues are even more serious in ECS where there is heavy reliance on drainage works to control flooding. The upland region (MT) depends on more diverse farming systems, including some estate-based crops, e.g., rubber, coffee, and cacao, with smaller size irrigation facilities than in ECN and ECS. There is longstanding concern about deforestation, soil erosion, and reductions in the water level in Lake Toba, the province’s major tourist attraction. There are fewer estates in the more sparsely populated, late developing North Coast (NC) region, with its more limited infrastructure. Rubber and oil palm are the main estate crops. Farmer organizations are not well developed. Past approaches. North Sumatra’s agricultural production and export gains over a 30 year period were achieved through increases in cropped area and yields. The longstanding strategy in this sector was to ensure that farmers had access to critical inputs on an affordable basis. Public agencies organized and subsidized provision of extension advice, credit, improved seed, fertilizers, pesticides, marketing assistance, and often water supplies. Delivery arrangements and inputs varied according to local conditions, with crop specific schemes and programs serving as a way to standardize service packages and control delivery costs. Examples include the North Sumatra Small Holder Development Project, the Nucleus Estate Scheme, the Bimas and Integrated Crop Management programs, and the Kaduma special integrated operation. These discrete projects and programs were supported by government extension staff and by sizable outlays on water control and irrigation. Before decentralization, extension advice was conveyed through separate food crops and horticulture, livestock, estate crops, and fisheries services. In 1999, there were roughly 1400 extension workers in the province, including 65 specialists, half of whom worked on food crops with another 20 percent assigned to tree crops. Combining the 895 structural and 1563 functional employees, there were 2458 staff working on technical agricultural issues in the province in 1999 (Tables 3-7, 4-2). Meanwhile, farmers often received advice from other sources. For example, farmers in Labuhan Batu were visited by extension workers, and by staff from the Directorate General for estates, government and privately owned estates, the Nucleus Estate Scheme, the Directorate for Plant Protection, and the Ministry of Forestry. Most farmers also receive information from the mass media, neighbors, and the many suppliers and private distributors of inputs and so forth.
Extension activities were backed by a network comprising 97 Rural Extension Centers (RECs), 40 implementation units from crop-specific projects, the Agricultural Technology Assessment Institute, in-service training centers, the provincial seeds certification center, the BIMAS organization, and the Center for Food Crops Plant Protection.

36
Regional Agriculture Profile
Dominant Crops Remarks Regions Estate Crops Food and
Holticulture
Irrigation Facilities
North Coast (NC) - South Tapanuli - Central Tapanuli - Nias - Mandailing Natal - Sibolga*
Rubber (>50,000 ha) Oilpalm(>50,000 ha) Coffee (>10,000 ha) Coconut (>50,000 ha) Others (Casiavera, Patchiouli, Candlenut, Cloves, Palmsugar)
- Cardamon (>150 ha) - Rice (enough for the region) - Soybean
- Represents 24 percent of irrigated area, of which 65 percent are technical irrigation - 31,810 ha (21 percent) of rainfed ricefield
- Dominated by rubber 162,63 ha in all kabupatens, oilpalm 64,189 ha in South Tapanuli, and coconut 48,561 ha in Nias - Only 19 percent of areas managed by estate companies - Less developed farmer organizations
Mountain (MT) - North Tapanuli - Simalungun - Dairi - Toba Samosir - Tanah Karo - Pematang Siantar*
Rubber (>50,000 ha) Oilpalm(>50,000 ha) Coffee (>10,000 ha) Cacoa ((>10,000 ha) Tea (>5,000 ha) Others (Gum Benzoin, Casiavera, Candlenut)
- Ginger (>1,500 ha) - Rice (enough for the region) - Maize - Cassava - Sweet Potato - Peanut - Soybean
- Represent 38 percent of irrigated area, of which 66 percent are technical irrigation - Only very small rainfed areas here.
- Dominated by Simalungun, where most of large treecrop plantation are located, and coffee 20,526 in Dairi - Ginger is mostly planted in Toba Samosir - 53 percent of area managed by estate companies - most developed farmer organizations
East Coast – North (ECN) - Deli Serdang - Langkat - Binjai* - Medan*
Rubber (>50,000 ha) Oilpalm(>50,000 ha) Cacao (>10,000 ha) Sugarcane (>20,000) Tobacco (>3,000 ha) Others (Candlenut, Palmnut)
- Rice (enough for the region) - Maize - Cassava - Peanut - Soybean
- Represents 20 percent of irrigated areas, of which 95 percent is technical irrigation - 70,239 ha (45 percent) of rainfed ricefield
- Deli Serdang (closest to main port Belawan) is eager to become a center of agro-business - 67 percent of area managed by estate companies - Well developed farmer organizations
East Coast – South (ECS) - Labuhan Batu - Asahan - Tanjung Balai* - Tebing Tinggi*
Rubber (>50,000 ha) Oilpalm(>50,000 ha) Cacao (10,000 ha) Coconut (>50,000 ha) Others (Palmnut)
- Rice (enough for the region) - Soybean
- Represents 12 percent of irrigated areas, of which 86 percent is technical irrigation - 45,418 ha (29 percent) rainfed ricefield.
- Dominated by Oilpalm 401,904 ha - 60 percent of areas managed by estate companies - less developed farmer organizations
*) Municipality

37
Irrigation. A differentiated approach was also followed as regards water and drainage facilities. Irrigated land makes up over 400,000 of the 1.5 million hectares in North Sumatra which are suitable for food crops (Table 4-3). Public investment has contributed to the development of 75 percent of the irrigated areas, with village schemes of 100-200 hectares making up the rest. Roughly 40 percent of publicly financed facilities were developed with the mechanisms and controls needed to attain the most effective use of water and highest yields. Another 40 percent of the system allows a modicum of control. Despite productivity enhancing potential, a substantial share of existing capacity in technical and semi-technical schemes is not fully utilized. Old and new hurdles. Impressive agricultural gains through the 1990s were accompanied by questions about how long growth could be sustained. In fact, larger farming enterprises, notably the tree crop estates, were thought to be towards the upper end of the yield curve, while output per hectare in smaller farms, which for each crop account for as much cultivated area or more as a group than larger units, was typically 60 percent or less of that in large farms. This is the case for the different estate crops (Table 4-4, Figure 4-1). For example, yields for rubber in smaller holdings were less than 60 percent of those on estates (Table 4-5), while for all tree crops combined, productivity varied by a 1:3 factor between small farms and plantations. Similarly, there is substantial scope to raise food crop yields (Table 4-6). Meanwhile, export possibilities have emerged for new or specialized crops, e.g., pesticide free vegetables. In short, the expert consensus in the 1990s was that productivity gains in smaller holdings were essential if output trends were to be sustained. The Propeda’s small holder-oriented strategy carries forward this thinking, and the approach itself appears to be making a virtue out of necessity. The document takes the possibility of significant yield increases as a given, and spells out some favorable consequences expected to follow. What is not clear though is the specific approach to be relied upon to bring about productivity gains. Instead, numerous sub-components and measures are listed, without considering whether the policy elements can be implemented simultaneously in light of budgetary and institutional constraints. As discussed, there is little attention to subsidiary steps, trade-offs, and choices between instruments. In fact, the many measures listed in the Propeda are reducible to two main policy thrusts, extension and irrigation. These policy areas have common features, and should operate in a complementary fashion. But there are also technical and institutional issues specific to each, e.g., the delivery apparatus for extension is quite different than that for irrigation. Extension--a revised design. The Propeda gives high priority to enhancing small holder access to new farming technologies and inputs, and timely market information. Extension workers are seen as an important means of training and informing farmers on small holdings. The Propeda’s endorsement of extension as a key policy instrument likely reflects a reassessment that began in the early 1990s. A revamped basic approach, which builds on lessons learned in North Sumatra and other provinces, is being tested in two districts. The discussion below considers whether the Propeda draws the right inferences from past and current pilot project findings. The aim of the revised approach is to get timely advice to farmers calibrated to conditions on individual holdings. The was the way many estates and other larger farm enterprises already functioned--the goal was to help smaller holdings operate in similar fashion. Moreover, it was acknowledged that the uniform, crop specific packages provided in enclave schemes were only a temporary solution, and that upgrading productivity and responsiveness in small holdings would entail significant changes in the mission of the extension services, as well as in irrigation-related and other support activities. In essence, the goal is to make extension services demand-driven and responsive to clients. To this end, various participatory processes are being introduced: (a) farm-to-farm extension with farmers as active disseminators; (b) research-extension-farmer collaboration to identify technology menus and enhance on-farm testing and demonstrations of improved technologies; (c) partnerships with the private sector, non-government organizations, universities, and farmers' organizations; (d) use of farmer field schools to train

38
farmers and farmer trainers; (e) participatory appraisal, planning and monitoring; and (f) farmer group development and networking. In principle, the technologies to be assessed would be based on specific farming system requirements and problems cited by farmers, with identification and testing of technology possibilities to be done by farmer groups with guidance from extension workers and researchers from the technology assessment institutes. Underpinning this approach is to be greater attention to North Sumatra’s 17,500 Farmer Associations (FA), of which over half were defined as “developing” and over a third, mostly in NC, were there in name only. The expectation was that FAs would be instrumental in attaining higher yields (Figure 4-2, Table 4-6). Eventually, extension advice would be privately financed and organized, but in the medium term, it was understood that effective publicly run services were needed, requiring a motivated, well trained cadre of sustainable size. Relying on attrition, the public extension service was expected to become smaller and more focused on low income small holders, particularly those in deforested, rainfed areas. The key agency was to be the District Center for Agricultural Information and Extension, Balai Informasi dan Penyuluhan Pertanian (BIPP), set up with a mandate to pull together the staff and diverse activities going on under different programs. As part of the required consolidation of extension activities, tree crops were moved to the Ministry of Forestry and Estate Crops in 1998. Realities. The agenda set for extension reform is ambitious, especially considering the limited impact of such services to date. Extension has contributed little to activities in pace-setting larger units--a hallmark of the estates sector had long been the ability of larger enterprises to obtain and introduce productive techniques without reliance on extension intermediaries. Moreover, the undifferentiated approach used in enclave initiatives, e.g., the Small Holder Development Project, was designed in light of extension service limitations. A sense of these weaknesses came through in field studies done in the mid 1990s. One review pointed to communications problems and performance gaps on the part of extension workers and complications as regards designated clients (Gouyon, A. and Soeprapto, N, 1996). The farmers interviewed had a clear sense of their needs and disappointments as regards extension. Field workers were viewed as ineffective, with little to say on livestock and agri-forestry matters and not the best source of information and advice on other topics; preferred sources were the private sector, mass media, and other farmers. Extension workers were found to be weak technically and in their social interactions, and lacking the perspective and methodologies needed to size up and respond to smallholder needs. Instead, staff relied on a top-down approach to deliver standard messages. And workers, nearly all of whom were men, were found to focus on male farmers in their farm visits and group sessions. This was unfortunate, since women were playing increasingly active farming roles as men sought non-agricultural jobs. The same study observed that staff were poorly paid, and without adequate means of transportation, and were subject to incentives which discouraged spending time with individual farmers. A complementary study on the experiences and outlook of extension workers themselves, found that most felt discredited, unappreciated by clients, unsure of their emerging role, and inadequate to the task due to poor training and back-up. This unflattering self-portrait of a demoralized and sometimes resentful cadre pointed as well to deteriorating training and staff management, and reduced resources invested in the then conventional approach. These findings highlight some of the risks entailed in the revised extension approach. Specifically, the redesigned system rests on the following highly optimistic assumptions: that existing staff can be retrained as facilitators who are adept at communication and socialization and credible with farmers; that field staff will analyze community structures and dynamics, using their acquired skills to relate to those very poor farmers not reached before, and conveying practical advice; that BIPP managers, all evidencing a customer and outcome oriented mind frame, have the power to plan and implement extension programs and can design pilot projects to determine replicable techniques; that effective “technology generation” systems are in place; and that information on farmer needs and characteristics
39
are relayed back to and used by researchers. The training agenda for the reform approach is illustrated by the large share of extension staff who are locally hired casual workers, and the even larger proportion of extension personnel whose formal education ended at high school (Table 4-7). Pilot tests of this revised approach were essential in light of these heroic assumptions. So far, results based on pilot work in Simalungun district, suggest that replication should be postponed. For instance, field evaluations indicate that field workers were themselves handling various “grass roots” techniques, e.g., community assessments, expected to be used by and for local communities; and that farmers had no sense of belonging to what they felt were artificial groups created by field workers and which were unlikely to outlive pilot activities. Steps recommended in these evaluations are revealing and point to unresolved flaws. For example, it is suggested that NGOs and other “third parties” rethink the farmer grouping and assessment steps in the extension methodology, and that extension workers be subject to further retraining, to convert them into broad gauge development workers. Prospects and options--affordability. Unfortunately, the costs of enhanced extension arrangements have not been specified and estimated. Clearly, there would be higher outlays per extension worker in terms of compensation, operational needs, and spending to develop and channel more appropriate and better targeted information. These routine costs would be contained somewhat through reductions in numbers of extension agents--outlays for early retirement or separation packages for laid off workers would constitute start-up costs. Assuming much higher spending on half the number of agents, it seems likely that financing needs might rise three fold on a continuing basis. In absolute terms though, the amount of money involved is not large, and could be accommodated if current spending levels were sustained. Institutional feasibility. This discussion has focused on the difficulties involved in transforming an existing, demoralized worker cadre. But the litmus test for an extension system, reformed or not, is whether its messages are adopted by hardnosed, skeptical farmers. Message content and transmission modes need to be improved and then sustained at high standards. And farmers are not the only clients who need to be persuaded. Extension involves transmission of information developed in the agricultural technology assessment center (BPTP) established at the province level to obtain economies of scale in carrying out and disseminating agricultural research. Hence, the system cuts across district lines. Nevertheless, a significant share of the overall financing eventually would have to come from the districts, whose chief executives, the Bupatis, and local assemblies, have to be convinced that it is worthwhile to fund not only personnel and other operating costs, but the sustaining costs of BPTP. This is a substantial hurdle to overcome—making the case for funding research activities is always difficult. But in this respect, an ingenious step was the designation of the BPTP as the province level coordinator of extension reforms as well as research work. But what accountability arrangements are within sight to give district level decision makers and their constituents comfort that funds allocated to BPTP are well used? Of course, one such accountability instrument would be simply the withdrawal of funding by districts which feel they are not getting adequate attention and extension advice from BPTP—with funding is on a voluntary basis. A more constructive solution would make BPTP accountable to a board made up of Bupatis as core members. This oversight body would be a province-wide analogue to the District Extension Committees (DECs), chaired by Bupatis or Bappeda chiefs, now being set up, and which would provide a vehicle for team building, priority setting, and assessment of results in the extension arena. Crucially, the BPTP board like the DECs needs to have strong representation from farmers, NGOs, and researchers. One mechanism, also applicable to the province-level body, is to form topical working groups and agree on action programs. It is worth noting that same broad structure should be applicable to several other province-level, agriculture-related institutions, e.g., plant protection, certified seed production, training, a notional body responsible for analyzing lessons and strategy development.

40
Irrigation options. The Propeda also counts on irrigation-related initiatives to implement the people’s economy strategy. The view of irrigation potential presented in the Propeda was likely influenced by a mid 1990s inventory which showed that up to half of all systems were not functioning due to lack of maintenance. In response, decision makers postponed construction of new systems in rainfed zones, and turned to initiatives to improve existing small and medium scale schemes (<2000 hectares). The focus was on systems with largely completed infrastructure but needing minor rehabilitation and upgrading. These schemes accounted for roughly 60 percent of publicly funded irrigated areas, while spending was also directed at a second category. This was the group of systems, 40 percent of the total, requiring more extensive rehabilitation and improvement. The revised approach gives considerable attention to Water User Associations (WUAs). These farmer groups play a key role in Java, where there are hundreds of legally established, autonomous, comparatively large (800 – 8000 members) water user entities. Each WUA collects fees which are used to operate and maintain, and to an extent rehabilitate its system. Cost recovery, which varies from 30 percent to 70 percent, has increased gradually, with many Bupatis actively support Service Agreements with WUAs, and/or allocating part of their regular irrigation budget for use by WUAs on a “sharing” basis for approved initiatives. WUAs undertake construction projects in some districts and sit on contract award committees in others. In North Sumatra, farming communities tend to be more diverse and less disposed culturally to the complexities of cooperative arrangements than in Java (Table 4-8). Nevertheless, many schemes already feature WUA precursor organizations (often smaller than recommended and not covering a full secondary-canal or primary-canal scheme); some recover large shares of costs. Field staff began working in selected districts to empower these groups, which became a district-level responsibility. A participatory approach was developed to support productivity-enhancing rehabilitation measures while strengthening WUAs and support services. This overall approach, which the Propeda has adopted, seems promising, offering sustained productivity gains for lower outlays than new systems would require. Nevertheless, key aspects such as impacts and sustainability still have to be worked out. Budgetary issues. Inevitably, funding responsibilities and levels need attention. Irrigation spending almost doubled in 2001 compared to 2000 (12 month basis), with central and province level funding increasing somewhat and district outlays expanding nine-fold. While the direction is appropriate, the composition of irrigation outlays needs to be kept in view. One issue is the traditionally low district allocation to operations and maintenance. The budget share for such important activities fell from 74 percent of target level in 1998/1999 to 36 percent in 2001. Moreover, about 40 percent to 50 percent of the O&M budget is spent for operation cost. As discussed, the schemes which do not receive adequate maintenance budget require heavy and expensive rehabilitation works every five to ten years (Tables 4-9, 4-10). The question as regards central level funding seems more to do with the continuity rather than the allocation of funding. A large share, roughly 80 percent of central financing, has been allocated for water resources management and flood control, with the rest for irrigation. This is an appropriate use of central outlays. But mechanisms are needed to ensure that this level and pattern of support continue, and even used to leverage other resource flows and institutional changes. Institutional issues. The Propeda’s proposes a province level role in strengthening irrigation institutions at three levels. First, the document argues that the province has to confront the major challenge of properly managing available water resources. Most rivers and many big irrigation schemes flow across two or more districts, and may involve other provinces. The Propeda presents a convincing case for a dominant province-level role in respect of flood protection and maintenance of river outflow to the sea and the integrity of the existing levees; prevention of siltation of rivers and irrigation scheme intakes; and

41
coordinating supply of water to increasingly competitive urban, food crop, plantation, and industrial users. Building on the effective data collection work of the Provincial Hydrological Unit, a province-level water resources coordination committee, the PSDA, and seven regional committees, Balai PSDAs have been set up. Once fully staffed, these units are expected to further management and planning of water resources on a basin basis. The rationale, i.e., strong externalities, for this role seems unexceptionable. Law 22 already tasks the province with cross-district water and irrigation matters, such as those just listed. A further justification for a strong province level involvement is to take charge of negotiations with the central government for continuing funding for flood control and other major works. O&M. The Propeda asserts a province level role in system maintenance even for schemes which do not cross boundaries and despite Law 22’s assignment of most irrigation matters to the districts. (In Java, there is near complete consensus that these responsibilities belong with the districts apart from large canals or headworks serving different several districts). The province level view in North Sumatra is that irrigation water originates from rivers that cross the district lines, making it, in their eyes, part of their mandate. Such authority is sought specifically because of concerns, based on a long track record, about local government commitment to and farmer participation in system maintenance. This interpretation is unlikely to stand unless districts agree that the province level is or can be positioned to organize and manage such recurrent activities. Meanwhile, districts seem to be assuming a larger role than before, judging from the increase seen in 2001 in district level irrigation spending (Table 4-11). System-level arrangements. Finally, the Propeda proposes a province level role in strengthening and empowering WUAs. The document notes that the large number of newly established systems which need support and the high share of existing systems still considered to be in the formative stage. Clarity on this issue will be appreciated at the water system level as WUAs have been uncertain a to the level of government to turn to. However, the Propeda’s proposal, which is inconsistent with central government thinking and practice in Java, overlooks the achievements and inherent advantages of existing WUAs and makes too much of their vulnerability--district officials should be able to cope and it is worthwhile for them to do so. The best role for the province may lie in facilitating linkages between WUAs themselves and between WUAs and extension and other service providers. Summing up. Province-level bodies can be instrumental is fostering the crop yield and production increases which figure prominently in the people’s economy strategy. But neither the extension-based or irrigation-based mechanisms seems ready to take beyond the pilot stage. Of the two, extension is riskier in view of limited success in the past and questions about the viability and longevity of FAs. Especially in rainfed areas, there are no major advantages which would accrue to farmer cooperation. WUAs typically are larger in scale and have reasons to cooperate which should provide a good basis for building successful WUAs. There is no conflict between these approaches—WUAs are not an option in rainfed areas. What needs further discussion is how much public funding to invest in raising on-farm productivity in rain fed districts. Meanwhile, while new approaches are piloted and developed further, the traditional agricultural growth “engine” in North Sumatra, i.e., the tree crop estates, should be kept in view. There appears to be scope for further yield increases in such units.

42
Table 4-1: Value Added by Sub-Sector
Actual, 1995-2000 Projection, 2001-2005 Sector 1995 1996 1997 1998 1999 2000 2001 2001 2003 2004 2005
1 2 3 4 5 6 7 8 9 10 11 12
Value-Added by Agricultural Sub-Sector in RGDP ( percent) Agriculture 8.61 8.71 8.98 2.1 5.54 4.78 3.4 3.82 4.27 4.6 5.04
Food Crops 13.22 9.77 -0.41 3.67 2.26 6.44 6.35 6.3 6.46 6.48 6.7 Tree Crops 7.95 8.07 12.01 4.04 6.84 4.49 4.61 4.7 4.65 4.9 5.01 Livestock -5.8 12.39 8.51 -14.36 14 4.51 4.01 4.75 6.01 5.03 6.17 Forestry 18.12 6.79 8.71 0.32 5.36 0.28 0.25 0.31 0.98 1.3 1.51 Fishery 6.38 5.09 31.93 5.32 4.43 3.6 4.05 5.11 5.6 5.98 6.25
Contribution by Sector and Sub-Sector in RGDP (percent) Agriculture 24.85 25 25.71 26.38 27.47 26.51 26.95 26.53 26.07 25.4 24.83
Food Crops 9 8.86 8.6 9.76 9.89 9.4 9.5 9.6 9.7 9.7 9.7 Tree Crops 9.72 10.22 10.53 10.69 11.26 11 11.3 11.2 11.35 11.25 11.25 Livestock 2.35 2.39 2.88 2.75 3.07 3.07 3.07 3.06 3.06 3.05 3.01 Forestry 1.38 1.28 1.19 1.12 1.18 1.1 1.09 1.08 1.09 1.1 1.09 Fishery 2.39 2.25 2.51 2.06 2.08 1.95 1.89 1.9 1.92 1.92 1.93
Table 4-2: Status of Agriculture Staff 1999
Description Staff Needed Status as of 1999
Additional Required
1. Structural Staff 1.a Provincial Office Technical Staff 172 95 77 Administration 160 114 46 1.b Kabupaten Offices Technical 640 387 253 Administration & other 276 150 126 Mantri Tani 249 149 100 2. Functional Staff Special Extension Workers 48 65 0 Extension Workers 924 1335 0 Head of Rural Centers 166 163 3

43
Table 4-3: (North Sumatra)
Public Irrigated Schemes Swamp/Lowland Technical
Schemes Semi Technical
Simple Schemes Village Schemes
Rainfed Tidal Inland
Total Area 133,046 134,742 40,899 93,307 106,769 69,786 4,983 Main system Is completed
130,011 117,340 38,947
Main system and rice fields completed
118,429 103,828 18,932
Problem Areas Needed Actions Category A: System not functioning
11,087 16,827 15,011 Rehabilitation or upgrading of networks
Category B: Rice fields exists but main canals not ready
666 5,721 827 Completion of main canals
Category C: Main canal completed Rice fields are not ready
11,582 13,512 20,015 Land development for rice fields
Table 4-4: Yields: Smallholder and Private Farms, 1999
Smallholder Farming Private Companies Commodities Areas (ha)
Yields (ton/ha)
Areas (ha)
Yields (ton/ha)
Rubber 341,480 0.48 167,067 0.87 Oil palm 157,061 1.94 1,864,558 3.13 Coffee 61,868 0.43 445 1.00 Coconut 145,203 0.59 5,506 1.73 Cacao 24,881 0.39 30,760 0.87 Tobacco 471 0.45 1,725 0.54 Sugarcane 1,747 5.30 97,583 5.23 Tea 1,530 0.58 14,708 2.37 Note: Yield is production per hectare productive trees.
Table 4-5: Annual Rice Production Percapita in Nearby Provinces or Combined (Unhusked Rice)
No Provinces Population 1999 Rice Production (Ton)
Prod./Cap Kg/Cap
1 Aceh 4,083,300 1,478,712 362 2 North Sumatra 11,782,400 3,451,430 293 3 West Sumatra 4,541,900 1,897,678 418 4 Riau 4,212,700 461,630 110 5 All Sumatra 43,209,000 11,816,051 273 6 National 204,783,900 50,886,387 248
Requirement Per Capita
About 280

44
Table 4-6: Area, Production and Productivity of Main Estate Crops in North Sumatra, 1999
Development Agents Area (hectares) Production (ton) Productivity (t/ha) Smallholder 800,924 894,178 1.12 State-owned Company 382,495 1,247,181 3.26 National Company 285,506 931,540 3.27 Foreign Company 128,245 423,803 3.31 Total 1,587,170 3,496,702 2.20
Note: Productivity is production per hectare gross areas.
Table 4-7: Qualifications of Extension Workers
NORTH CENTRAL Honorer II III IV HS D3 S1 HS D3 S1 HS D3 S1 S2 D3 S1 S2 S3
Nias 4 0 0 58 5 0 8 2 2 0 0 0 0 0
Tapanuli Selatan 46 0 0 102 3 0 57 7 15 0 0 2 0 0 Tapanuli Tengah 7 0 0 54 3 0 15 2 7 0 0 0 0 0 Sibolga Mandailing Natal 14 0 0 53 0 0 11 1 1 0 0 0 0 0
TOTAL 71 0 0 267 11 0 91 12 25 0 0 2 0 0 MOUNTAINS HS D3 S1 HS D3 S1 HS D3 S1 S2 D3 S1 S2 S3
Tapanuli Utara 3 0 0 65 10 0 21 7 4 0 0 0 0 0 Simalungun 13 0 0 67 11 0 41 11 6 0 0 1 1 0
Pematang Siantar 0 0 0 3 0 0 5 1 1 0 0 0 0 0 Dairi 8 0 0 43 5 0 27 4 5 0 0 2 0 0
Karo 4 0 0 49 2 0 27 2 9 0 0 0 0 0
Toba Samosir
TOTAL 28 0 0 227 28 0 100 18 21 0 0 3 1 0
EAST COAST NORTH HS D3 S1 HS D3 S1 HS D3 S1 S2 D3 S1 S2 S3
Deli Serdang 31 0 0 115 21 1 60 25 20 0 ` 0 0 0
Langkat 17 0 0 78 19 1 30 21 10 0 0 0 0 0
Medan 1 0 0 12 4 0 15 0 10 0 0 1 0 0
Binjai 1 0 0 7 2 0 2 1 4 0 0 0 0 0
TOTAL 50 0 0 212 46 2 107 47 44 0 0 1 0 0
EAST COAST SOUTH HS D3 S1 HS D3 S1 HS D3 S1 S2 D3 S1 S2 S3
Tebing Tinggi 2 0 0 2 0 0 2 1 0 0 0 0 0 0
Labuhan Batu 25 0 0 80 3 0 28 4 10 0 0 0 0 0
Asahan 15 0 0 93 13 0 50 11 9 0 0 0 0 0
Tanjung Balai 1 0 0 4 1 0 0 0 1 0 0 0 0 0
TOTAL 43 0 0 179 17 0 80 16 20 0 0 0 0 0
North Sumatra 192.0 0 0 885.0 102.0 2.0 378 93 110 0 0 6 1 0

45
Table 4-8: Status of Water User Associations in North Sumatra
Offices
Number Of
Schemes
Ideal No. Of
WUAs
Existing No. of
WUAs
Developed WUAs
Developing WUAs
Not Yet Developed
Deli Serdang 50 451 134 5 88 41 Langkat 97 68 57 0 18 39
Karo 49 67 65 14 0 51 Dairi 87 162 90 0 85 5
Simalungun 177 513 500 14 161 325 Asan 23 101 87 3 56 28
Labuhan Batu 16 28 24 1 13 10 North Tapanuli 153 290 174 36 127 11 South Tapanuli 130 439 179 59 95 15
Central Tapanuli 37 69 40 13 27 0 Nias 32 60 23 0 12 11
Pematang Siantar 7 15 10 0 10 0 Total 258 2263 1373 145 692 536
Table 4-9: Irrigation Rehabiltation Works in North Sumatra (Rp. Million)
197/1998 1998/1999 1999/2000 2000 2001
Cost 36,211.0 15,162.0 26,741.2 8,356.2 7,800.0 Ha. 26,000.0 18,717.0 21,021.0 7,087.0 17,081.0
Million Rp/ha 1.4 0.8 1.3 1.2 0.5
Table 4-10: Proposed Rehabilitation and Upgrading of Main Irrigation Schemes
No. Names of Irrigation Scheme
Total Area (ha)
Poorly Functioning
(ha)
Proposed Cost
(Rp.million)
Cost per ha (Rp.million)
1 Namu Sira-sira 6,350 2,540 7,750 1.22 2 Simalungun 49,171 19,688 90,100 1.83 3 Batang Ilung 4,194 1,678 10,000 2.38 4 Batang Gadis 6,628 2,651 10,000 1.51 5 Paya Sordang 4,350 1,740 7,500 1.72 6 Sei Ular 18,500 10,800 153,000 8.27 7 Bah Bolon 7,630 2435 38,000 5.00
Total 96,823 41,512 316,350 3.27

46
Table 4-11: Allocation of Irrigation O&M Budget in North Sumatra (Rp. Million)
No. Offices 1998/1999 1999/2000 2000 2001 1 Province Office 524.0 756.8 625.0 650.0 2 Langkat 1,096.5 715.0 750.0 1,175.0 3 Deli Serdang 2,001.8 1,685.0 1,388.7 1,475.0 4 Karo 548.3 375.0 431.0 500.0 5 Dairi 715.2 480.0 470.0 575.0 6 Pematang Siantar 331.0 210.0 275.0 325.0 7 Asan 1,326.7 996.0 847.0 1,100.0 8 Labuhan Batu 932.3 700.0 625.0 1,000.0 9 North Tapanuli 1,306.1 947.0 810.3 950.0 10 Central Tapanuli 748.3 570.0 527.5 600.0 11 South Tapanuli 1,546.3 1,061.0 895.7 1,300.0 12 Nias 380.6 260.0 320.0 450.0 13 Simalungun 2,138.5 1,601.0 1,400.7 0 Total 13,595.6 10,000.4 9,366.0 10,100.0 Allocation Rp./ha 37,168 28,312 25,605 28,597 Actual need Rp/ha 50,000 65,000 75,000 80,000 Percent allocated 74.34% 43.56% 34.14% 35.75%

47
Figure 4-1: Crop Yields (Ton/Ha) 1999
0.00
1.00
2.00
3.00
4.00
5.00
6.00
1 2 3 4 5 6 7 8
Series1
Series2
Notes: Series 1 = Smallholding ; Series 2 = Private or State-owned Company 1=Rubber 2=Oilpalm 3=Coffee 4=Coconut 5=Cacao 6=Tobacco 7=Sugarcane 8=Tea
Figure 4-2: Crop Yields and No. of Farmer Groups (FG) per 1000 ha (Smallholding Plantation)
0
5
10
15
20
25
0.00 2.00 4.00 6.00 8.00 10.00 12.00
Series1
Linear (Series1)
Notes: Vertical line = Number of FG per 1000 ha; Horizontal line = Yields

48
5. FORESTRY The consequences of tree and food crop development for North Sumatra’s forest resources have been of longstanding concern. There was some commercial logging in the colonial era, but it was only in the early-mid 1970s that the losses began to rise ominously. Causal factors included stepped up land clearing for new estates and transmigration sites, road and port investments which facilitated timber exports, and development of the wood processing industry. Production of forest products grew at a 5.9 percent yearly growth rate in the 1975-1984 interval, and then rose to 8.6 percent between 1984 and 1999 . International and Indonesian observers warned in the early 1980s that deforestation was accelerating.13 Also, in the mid 1980s anti-transmigration voices were heard--it was this movement which directed international attention to commercial logging and forest losses. Judging from recent statements, there is growing recognition in Medan as well as Jakarta of the need for policy reform in this vital sector. The topic gets some attention in the Propeda which would rely in the short run to improved supervision and enforcement of existing laws and regulations, and better information on the status of the province’s natural resources. In the medium term, the Propeda looks to “self-enforcement” by local communities which are committed, based on greater awareness of the risks and improved security of tenure, to preventing over-exploitation of forest products. The province-level administration has followed up with specific actions. In January 2002, the Governor encouraged the Bupatis to speed up reforestation programs using funds allocated (as a DAK) by the central government. Notably, a senior province level forestry official attributed over-exploitation to forest concession holder who had illegally, but with the connivance of military and forestry officials, converted their tracts into estate sites. The Governor has continued to issue statements during 2002 recently stating that local forestry and security officials need to act against illegal logging and to close the numerous sawmills which process logs. Meanwhile, a stronger and more consistent position has been heard from the central government. President Megawati Sukarnoputri called for the “regreening” of Lake Toba during a well publicized visit. Earlier, the Coordinating Minister for Poverty had asked the province to manage its forests better to avoid damaging floods. The new GOI forestry minister has taken a number of encouraging steps, e.g., banning new forestry concessions, auditing use of illegal timber by established pulp and paper mills, banning log exports and working with the navy to seize logs illegally cut. Information gaps. Unfortunately, efforts to improve enforcement and design better policies face the same data constraints which have long deflected public attention. 14 Without accurate data on the extent of deforestation, it is difficult to identify the direct causes, e.g., land clearing for estate crops, logging, forest fires, slash and burn agriculture, and/or urbanization, and to design responsive policies. Enough is known though to provide an overview of trends and key issues. The scale of losses to date is illustrated when a planning map (Figure 5-1) is compared with a map of the remaining forest cover (Figure 5-2). The green swath of forest that extended from Lake Toba to the southern border of the province in the plan has been reduced to fragmentary bits of forest cover. Similarly, the protected area planned for Nias island has been completely deforested with only scattered traces left along the eastern and northwestern coast. Work by Derek Holmes found that during the 1987-99 interval over 1.24 million hectares were affected with North Sumatra ranked just behind South Sumatra and Jambi in the rate of
13 The 1982 FAO National Conservation Plan volume on Sumatra provided, province by province, a very detailed analysis of remaining areas of forest habitats and compared these with the 'natural' areas, and the areas within protected areas as a means of determining conservation priorities. Also, in the mid 1980s anti-transmigration voices were heard--it was this movement which directed international attention to commercial logging and forest losses. 14 Against the official forest area statistics ranging from about 2.4-3.8 million hectares, the amount of actual forest cover recorded in the MOFEC maps approximated 1.56 million hectares. This translates to only between 41-65 percent of officially designated forest lands that currently enjoy forest cover.

49
deforestation. When the changes in forest cover in this the period are disaggregated (Table 5-1), it can be seen that more than 80 percent of lowland and logged forest, 36 percent of hill forest, and substantial amounts of wetlands as of the mid-1980s have been cleared. One estimate suggests that against a total area of 7,168,068 ha, there is now less than a quarter (22 percent) of the province that is covered by forests.15 This is disconcerting given North Sumatra’s mountainous terrain and its 36 major river basins and 120 rivers (Regional Forestry Profile). The amount of deforestation in the upland regions is also evident. Extensive clearance is seen in hilly terrain, especially in the districts of South Tapanuli, North Tapanuli and Labuhan Batu. Heavy upland clearance is evident also in the watershed along the northeastern side of Lake Toba (where the district boundaries of Asahan, Simalungun and North Tapanuli meet). A recent assessment found that 40 percent of Lake Toba’s watershed is under grass cover, with land designated as forest and being reforested accounting for only 7 and 17 percent respectively.16 It is significant that a large proportion of these cleared areas have Protected Forest status. At the Dolok Sembilin Nature Reserve, which received high priority in the National Conservation Plan, partial forest clearing can be seen to have occurred. In other reserves such as the North Sumatra sector of the Leuser National Park, the Siranggas Game Reserve, and the Barumun Game Reserve, footslope encroachment of the reserves can already be observed. It is only in the western coast of the province that extensive tracts of lowland forest remain. Issues. The exhortations made to district staff are indicative of policy failure as regards forestry. The Propeda’s two stage approach was mentioned above. In regard to this agenda, the main policy instrument has been the cadre of field staff, foresters, who are organized like agricultural extension agents. There are 427 professional foresters out of a workforce of 1011 in the Dinas Kehutanan. This professional cadre which is distributed among the 14 offices of the Dinas Kehutanan, includes 248 functional foresters (i.e. full-time staff) and 139 “honorary” staff paid on a daily rate). The rest are personnel concerned with regulatory administrative functions includes 41 personnel who have the authority to conduct investigation and prosecute offenders. Foresters are not only often compared to farm extension agents, there are efforts underway in some districts to integrate the two cadres. This step would be expected to promote agro-forestry and enhance awareness of environmental, biodiversity, conservation, and water management issues. It would also provide an opportunity for the district extension system to become demand-driven and farming systems-oriented. Most farming systems in the chosen sites already include trees and shrubs for livestock feeds and the planting of fruit trees and estate crops in mixed farming systems by small holders. A joint program would allow the agricultural and forestry extension workers to reach non-forested areas, where farmers do not have access to technical advice and information, and improve the management of deforested areas by emphasizing tree crops in mixed farming systems. Nevertheless, the forestry cadre differs from the agricultural workforce in important ways. There are fewer foresters relative to need, and their qualifications are weaker than those agricultural field staff. In Tapanuli Selatan and Labuhan Batu, for instance, two districts with extensive deforestation, forest staff coverage is about 9,381 ha. per person and 1,789 ha. per person, respectively.17 As regards technical qualifications, 24 had university degrees and 35 had technical certificates from the forestry school. Almost 90 percent percent had not had training beyond the high school level.
15 The total area figure is obtained from Neraca Kualitas Lingkungan Hidup Daerah 1999. The forest cover figure can be seen in Table 2. It should be noted that the numbers in the table provide only a provisional view of deforestation. Not taken into account are the qualitative aspects of the forest, e.g., whether forests have been damaged by logging. 16 See International Lake Environment Committee Foundation (ILEC) database at http://www.ilec.or.jp/ 17 For Tapanuli Selatan, this figure is obtained by dividing the official forest area of 619,164 ha. with 66 staff (62 jagawana and 4 penyidik). In Labuhan Batu, it is 85,888 ha. divided by 48 staff (46 jagawana and 2 penyidik).

50
Conflict zone. There are major differences, moreover, between the forestry and agricultural cadres in respect of job content in likely client receptivity. Backed or accompanied by input suppliers, researchers, marketing arrangements, subject matter specialists, agricultural extension workers relate to individuals or farmer groups who are interested in improving their practices and interested in principle in helpful advice. By contrast, foresters operate with little or no back-up in an arena with overlapping interests (official agencies, landless farmers or logging concessionaires) and competing claims (such as adat lands, officially designated protected forests, concession grants, or the migratory route of elephants). The content of the forester’s job is more akin to policing in that “clients” seek to avoid contact. Accordingly, foresters need special skills for conflict resolution. Lack of such skills has resulted in low worker morale, ineffective enforcement of forestry regulations, weak compliance, and illegal logging and land clearance limited only by market and weather factors. Prospects. Decentralization is complicating an already messy scene in which a field worker-based approach discredited. Under Law 22, province-level officials are responsible for setting some standards, providing guidance on certain issues, and for management of protected forest, e.g., national parks and conservation areas. Operational responsibilities were transferred to the districts. Simultaneously, districts acquired a revenue interest in forestry and introduced varying charges on wood products. These developments have changed the dynamics of the forestry sector, including likely making district governments more amenable to forest exploitation, and possibly opening new ways of getting legal access to wood products (C. Bennett, draft, 2002). For example, a study of an adjacent area in Aceh concludes that local “networks of power and interest have coalesced around logging” (J.F. McCarthy, 2000), providing the poor with attractive but temporary options. There are potentially positive aspects of decentralization as regards forestry, e.g., district officials may adopt a tougher line with those seeking forestry concessions and may be more responsive to local pressures to slow deforestation. In this seemingly very different environment, a strong regulatory role for the province is needed to counter-balance any increased impetus to logging at the district level. Clearly, the rationale for this suggested province-level role would be that of avoiding or at least limiting the sort of market failure which leads to accelerated deforestation. This will not be an easy task since the province level forestry office has been in disarray over the disposition of staff including friction between employees hired as national (“outsiders”) and as province-level civil servants (“locals”). Besides the problem of a weak information base discussed previously, the planning process for forest management also suffers from a weak coordination and communication between different agencies whose actions have a bearing on the forest sector (A.J. Whitten and J. Ranger, 1986). An example provided by Holmes was of the regional development planning board (BAPPEDA) not being involved in the forest concession allocation process. Another instance arises when the process of creating aerial maps of the forest by MOFEC is not linked to a systematic ground-truthing and analysis of deforestation in specific locations. There should be greater linkages made between analysis of forest change issues, the planning process and the institutional apparatus of the government. It is not enough to conduct simple arithmetic exercises about how much forest area had increased or decreased as the Annual Report and State of the Environment seems to be concerned with. Rather, there is a need for greater analytical work to establish an understanding of the processes involved in the phenomenon of forest change in North Sumatra. There are a great many conceptual blind-spots that the current system has failed to address in its planning process. The position of traditional tenure or tanah adat is an example of such a blind-spot. The conflict between what the state perceives to be protected forest land and what local communities recognize as traditional or communal land is a key issue underlying the current crisis of governance plaguing the sector.
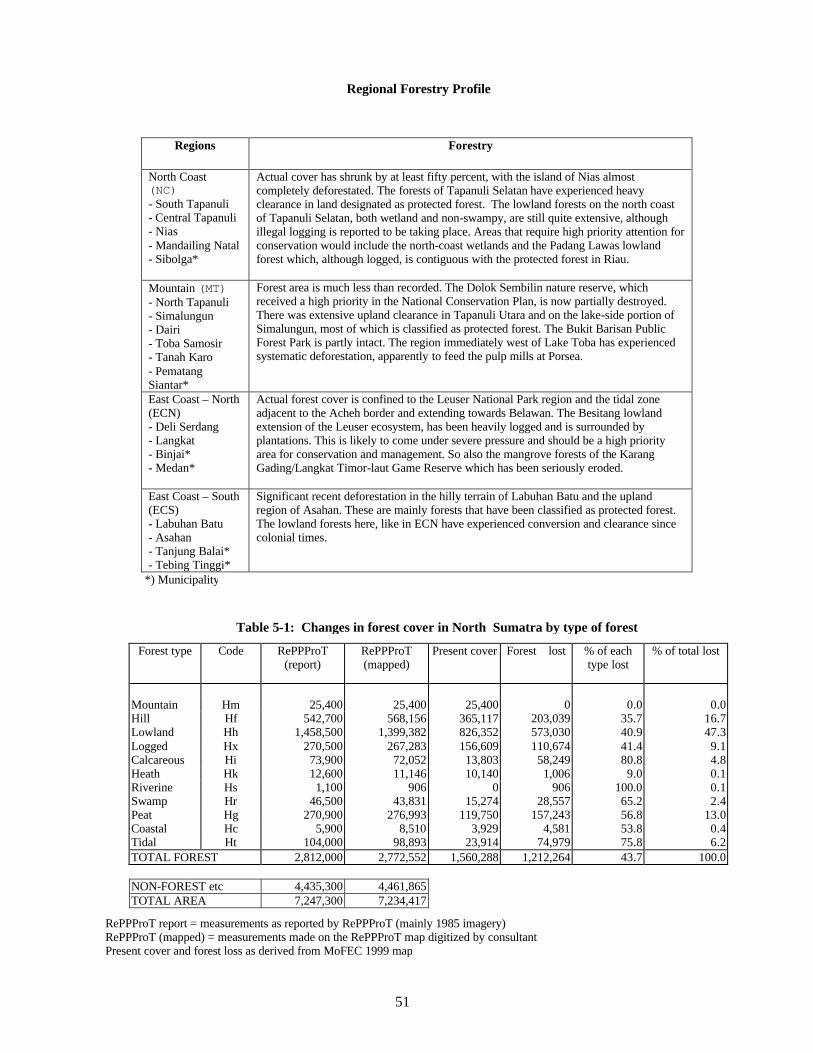
51
Regional Forestry Profile
Regions Forestry
North Coast (NC) - South Tapanuli - Central Tapanuli - Nias - Mandailing Natal - Sibolga*
Actual cover has shrunk by at least fifty percent, with the island of Nias almost completely deforestated. The forests of Tapanuli Selatan have experienced heavy clearance in land designated as protected forest. The lowland forests on the north coast of Tapanuli Selatan, both wetland and non-swampy, are still quite extensive, although illegal logging is reported to be taking place. Areas that require high priority attention for conservation would include the north-coast wetlands and the Padang Lawas lowland forest which, although logged, is contiguous with the protected forest in Riau.
Mountain (MT) - North Tapanuli - Simalungun - Dairi - Toba Samosir - Tanah Karo - Pematang Siantar*
Forest area is much less than recorded. The Dolok Sembilin nature reserve, which received a high priority in the National Conservation Plan, is now partially destroyed. There was extensive upland clearance in Tapanuli Utara and on the lake-side portion of Simalungun, most of which is classified as protected forest. The Bukit Barisan Public Forest Park is partly intact. The region immediately west of Lake Toba has experienced systematic deforestation, apparently to feed the pulp mills at Porsea.
East Coast – North (ECN) - Deli Serdang - Langkat - Binjai* - Medan*
Actual forest cover is confined to the Leuser National Park region and the tidal zone adjacent to the Acheh border and extending towards Belawan. The Besitang lowland extension of the Leuser ecosystem, has been heavily logged and is surrounded by plantations. This is likely to come under severe pressure and should be a high priority area for conservation and management. So also the mangrove forests of the Karang Gading/Langkat Timor-laut Game Reserve which has been seriously eroded.
East Coast – South (ECS) - Labuhan Batu - Asahan - Tanjung Balai* - Tebing Tinggi*
Significant recent deforestation in the hilly terrain of Labuhan Batu and the upland region of Asahan. These are mainly forests that have been classified as protected forest. The lowland forests here, like in ECN have experienced conversion and clearance since colonial times.
*) Municipality
Table 5-1: Changes in forest cover in North Sumatra by type of forest
Forest type Code RePPProT (report)
RePPProT (mapped)
Present cover Forest lost % of each type lost
% of total lost
Mountain Hm 25,400 25,400 25,400 0 0.0 0.0 Hill Hf 542,700 568,156 365,117 203,039 35.7 16.7 Lowland Hh 1,458,500 1,399,382 826,352 573,030 40.9 47.3 Logged Hx 270,500 267,283 156,609 110,674 41.4 9.1 Calcareous Hi 73,900 72,052 13,803 58,249 80.8 4.8 Heath Hk 12,600 11,146 10,140 1,006 9.0 0.1 Riverine Hs 1,100 906 0 906 100.0 0.1 Swamp Hr 46,500 43,831 15,274 28,557 65.2 2.4 Peat Hg 270,900 276,993 119,750 157,243 56.8 13.0 Coastal Hc 5,900 8,510 3,929 4,581 53.8 0.4 Tidal Ht 104,000 98,893 23,914 74,979 75.8 6.2 TOTAL FOREST 2,812,000 2,772,552 1,560,288 1,212,264 43.7 100.0
NON-FOREST etc 4,435,300 4,461,865 TOTAL AREA 7,247,300 7,234,417
RePPProT report = measurements as reported by RePPProT (mainly 1985 imagery) RePPProT (mapped) = measurements made on the RePPProT map digitized by consultant Present cover and forest loss as derived from MoFEC 1999 map

52
Figure 1 Dramatic reduction of forest cover in Sumatra between 1932 and 1996.
(van Steenis 1935, reproduced in Whitten et al 2000)
(FAO/MacKinnon 1982, reproduced in Whitten et al 2000)
(Whitten et al 2000)
Forest cover in 1932
Forest cover in 1982
Forest cover in 1996

53
Figure 2: Remaining Forest Cover

54
6. SMALL AND MEDIUM ENTERPRISES (SMES)
The Governor and his administration view the SME “sector” as critical for the future of North Sumatra. This favorable assessment and a corresponding program of supportive activities are detailed in the Propeda, which refers to SMEs as “the mainstay of the people’s economy system.” Improving access to funds including accelerating debt settlements and lowering transactions costs via subsidies and other measures is seen in the Propeda as the near term policy priority for SME development. In the medium term, the goal is seen as enhancing productivity and technical and entrepreneurial capacity within SMEs through various policy steps and supportive activities, e.g., the partnership program with large enterprises. However, the high expectations attached to SMEs are due more to expansion prospects than current activities. In fact, the contribution of SMEs, e.g., in the industrial sector, remains modest. This is not due to lack of overall gains. In fact, North Sumatra’s manufacturing sector grew very rapidly, e.g., 18.1 percent and 10.9 percent yearly in the 1975-84 and 1984-97 intervals, and then reversed directions (-16.6 percent, -0.1 percent) during the crisis. This expansion was based on cultural linkages--the main manufacturing sub-sectors in North Sumatra, i.e., food and tobacco products, textiles and footwear, furniture, rubber, and machinery, all make use of local agricultural products, or sell to farm markets, e.g., equipment (Table 6-1). The share of manufacturing in RDGP increased more than fourfold between the mid 1970s and late 1990s. Actual position. Manufacturing value added is still concentrated in a small number of large scale operations. The numerous small and medium enterprises (SMEs) in industry specialize in consumer goods for lower income households, and have not taken on production of intermediate inputs or semi-finished goods for the rest of manufacturing sectors. Manufacturing SMEs comprise about 10 percent of non-agricultural enterprise. SMEs are often not able to meet the standards required for supplying, for example, machine parts and components. Even for consumer oriented activities like fruit processing, it appears that the limited number of smaller firms lack the specialized skills and equipment needed to increase market share. For example, fruit processing such as production of canned mangoes involves chemical treatment and adding preservatives to uniformly sliced raw fruit, followed by labeling and quality control. The province’s manufacturing SMEs are concentrated in Medan, Deli Serdang and Tapanuli Selatan, where there are also large numbers of such units in trade and other services; the total number of non-agricultural establishments was estimated at 510,000 in 1997. The strong presence of SMEs in Medan is attributable to its position as provincial capital and major regional center, with high quality infrastructure, where most government offices, banks, business representatives and public services (education, communication, transportation) can be found. SME development in Deli Serdang and Binjai have benefited from proximity to Medan-based services and markets. Together they accounted for 35 percent of the SMEs in the province. Medan accounted for seven percent of the SMEs but contributes over 25 percent of the SME productivity, which is a result of its focus on some higher value-added sectors. Although they are less productive than larger firms, SMEs contribute disproportionately to the province’s exports, providing 19 percent of the region’s overseas earnings. Non-agricultural SME exports include wood-based products, textile and garments and various handicrafts, clay-based products and coconut charcoal. Direct SME exports are made up largely of goods that require relatively low value added processing of traditional commodities such as; wood products, coffee, cacao, fruits and vegetables. On the other hand, exports such as palm oil, rubber, aluminum and plywood are largely produced and exported by large enterprises, with SMEs involved in upstream production and processing. There is considerable potential for SMEs in manufacturing to add value through linkages with the agricultural sector and larger industries. For example, SMEs can play a strong role in the processing of cooking oil, rice, grains and rubber, and in the production of fertilizer, plastics, garments. They can also supply goods to larger companies related to marine transport, restaurant and hotels and machine

55
components. Development of SMEs in such sub-sectors could have a multiplier effect on the regional economy. Nevertheless, the direction endorsed in the Propeda faces significant obstacles. Decision makers do not have an existing, even moderately successful approach to build on or a service delivery platform. Indeed, the policy scene, as inherited on January 1, 2001, is in disarray with a variety of central Ministries involved each on a small scale. For example, the Ministries of Industry and Trade, Agriculture, Health and Social Welfare, Finance, and the State Ministry of Cooperatives and Small Enterprises all supported SME activities, typically by channeling funds and support directly to individual enterprises. Based on project reports, this approach has not been very effective. Projects, with average outlays per enterprise of Rp. 17,400, usually reached only a small number of SMEs or could not be shown to have sustained impact. This could be due in part to the fact that selection criteria were often unclear, as were the rationale for working with the target group and the methodologies to be used. As a result, projects tended to be unfocused and lack proper performance indicators. This was the case with the Klinik Konsultasi Business (KKB) which was introduced into each Dinas Industry and Trade to provide business services to SMEs. These have proven to be unsustainable for the most part, and have been closed down. An additional weakness was the lack of coordination between Dinas offices on programs that have similar objectives and beneficiaries, resulting in duplication. An example is the agro-industrial production center run by Dinas for Industry and Trade and the integrated Foodcrops Production Center run by Dinas Foodcrops in Langkat, Simalungun and Tapanuli Selatan. Both focused on developing the value chain of soya beans, from planting to processing and sale. Unfortunately, the programs were run independently of one another and associated expenditures did not yield significant impact for the intended beneficiaries. In light of low allocations per enterprise and limited successes and resources, it is clear that the public agencies cannot reach a significant portion of SMEs through direct programs. It is ecessary then to turn to an indirect approach. This was recognized in the Propeda which identified three main SME initiatives to be implemented through 2005: establishment of a conducive business environment; improved productivity and better access to productive resources; and development of entrepreneurship and competitiveness. The need for this approach is seen from what a typical SME spends, Rp. 23.4 millions per year, to ensure their businesses run undisturbed. This is roughly equivalent to eight times the average regional minimum salary of a worker in North Sumatra (Rp. 254,000 in year 2000). This level of expenditure hurts businesses, by adding costs, uncertainty, and significant management attention. Moreover, by forcing a huge number of firms to remain in the informal economy, it precludes them from being able to access bank financing to grow their business. According to the Survey, only eight percent of SMEs utilize formal financial institutions (bank and cooperative) to obtain working capital. The situation could get worse. Decentralization in North Sumatra has been marked by increased number of permits, licenses and levies required at the local level.18 A 2001 survey in Medan in 200119 revealed that 38 percent to 54 percent of SMEs operate without required permits, depending on the type of permit. The high fee for obtaining business permits and the three week wait for licenses contributes to the fact that 43 percent of the 1.5 million SMEs in the region operate in the informal sector. Moreover, local governments in North Sumatra are keen to increase PAD and are focusing on expanding taxes. Medan, for example, has opted to intensify existing taxes and levies without imposing new ones (Table 6-3). At the same time it has focused on promoting better utilization of regional state-owned enterprises (BUMD) and regional assets. Meanwhile, the other local governments, particularly those with limited economic resources have also tended to take the seemingly easy route to increase PAD. Current inattention to the effectiveness of expenditure coupled with intensified taxes and levies, could backfire 18 Ubaidillah.et.al,’Fiscal decentralisation and its implications to business environment in urban and rural districts of Sumatra Utara’ ( 2001) and Yadi et.al,’Business environment of SMEs’ (2000). 19 Study carried out by The Asia Foundation in collaboration with CESS (Centre for Economic and Social Studies), Forda Sumut, Swisscontact and BITRA during the period of year 2000-2001.

56
and create disincentives for investments in productivity and expansion. This will reduce competitiveness, diminish job opportunities, and reduce the tax base. Options. There was a modest increase in the budget allocated for indirect SME programs (Table 6-4). Expenditures rose from Rp. 20 billion in FY 2000 to Rp. 25 billion in FY2001, with the increase allocated to greater indirect SME expenditures. (This represents a decline in the share of the total budget dedicated to SME projects from 4.9 percent in FY2000 to 3.1 percent in FY2001, and a decrease in the share of the development budget from 10.3 percent to 8.5 percent) Impacts on SMEs will require time as well as additional resources. These programs are implemented largely (around 80 percent) by two institutions, the Regional Investment Board (BKPMD) and the Regional Office for Tourism. In addition, the budget embodies a shift by the Economic Bureau in the Regional Secretariat from developing export markets to promoting domestic trading, as indicated by a seven-fold increase in the budget for the latter and a 12 percent reduction in the former. Attention to worker skill upgrading is indicated by a four-fold budget increase from FY 2000. Industrial expenditures are a much smaller portion of direct expenditures and are split almost evenly between projects managed by the Regional Secretary’s Economic Bureau and the Ministry of Industry and Trade. This level and mix of funding are appropriate in light of limited experience in SME policy formulation and implementation at the provincial level. Readiness is even more limited at the district level where most programs are carried out at the Dinas level. Although Regional Secretaries (level II) and Planning Boards (BAPPEDA) are involved, there is usually significant overlap between the work they do and that of the Bupati’s office and BAPPEKAP. One way to address this issue is through increased attention to joint activities during planning for SME projects. A role for a province level entity. There are a number of SME-related tasks, e.g., coordination of local taxies and fees, information provision, training and other preparatory steps, and joint lobbying and spending initiatives, which transcend district lines and perspectives. These functions should be taken on by a province level body, which can mobilize different parties and stakeholders, and pull together needed skills and talents.
What sort of entity should be created? The primary rationale and tasks are not technical excellence and quality of research findings and recommendations as in the case of agriculture. Instead, the role of the province-level body is mainly coordination and coalition building. The aim would be to avoid redundancy in district-level initiatives, and more broadly to develop a Local Economic Development Strategy (LEDS), as a partnership between the province and district governments, the private sector, and civil society. LEDS should start with modest but achievable steps, focusing on initiating a virtuous process of more efficient expenditures, increased productivity and growth, leading to greater income opportunities and firm prosperity, and a larger tax base. A LEDS would help balance the expenditure and revenue aspects of SME policy, giving district governments a framework within which to plan local initiatives. In operationalizing such a partnership, there are guidelines to keep in mind: v Foster external linkages. Given the limited resources at the district and province levels, external
partnerships are likely to be critical to increasing the impact of public expenditures. Indeed, there are already numerous initiatives that are funded off-budget by state-owned enterprises, government sponsored revolving funds, NGOs or the private sector -- or through some combination of the above. The funds available from these programs are significant. Greater use of such partnerships is imperative to ensure better leverage of public funds. Some of the larger programs include the following:
• SME Credit, totaling Rp. 2.2 trillion in 2000, provided through public and private banks.

57
• Sarana Sumut Ventura, which has invested Rp 48 billion in 124 growth firms over a six year period, and provided technical assistance as well.
• State owned enterprise (SOE) funding of SMEs, which has disbursed Rp. 20 billion to 1290 firms over the last decade.
• Revolving Funds such as LPT Indak, which has disbursed Rp. 1.4 billion to 56 firms since 1999 together with technical assistance provided by NGOs and the universities.
• Astra’s Linkage Program, which has funded 21 garages for approximately Rp. 427 million and provided technical assistance for upgrading their services.
• Swisscontact, which promotes market-driven business development services in Sumatra, focusing on building sustainable private establishments that can provide quality services to SMEs.
v Tackle skill gaps. External partnerships can be helpful in overcoming the relatively mediocre
technical skills and technological capability to produce higher value added products. One of the challenges SUMUT faces in trying to raise the productivity of SMEs is the low skill level of the workforce. Only 4.2 percent of the labor force has completed university degrees and only 50 percent have completed education lower than primary school. Such a low level of education contributes to low productivity and low income jobs. Another challenge is to improve the use of production technologies through improved quality testing, product development and technical information which allow firms to produce higher value-added goods.
v Promote Large-Small Firm Linkages. Like external linkages, connections with larger companies
can help SMEs overcome some of skill-related constraints. Already, there are some programs in place that provide models, e.g., the Astra program and programs in which large firms contribute something besides money to SMEs. Leverage can be obtained from public funds by supporting the development of programs which combine technical support, financing and supplier relationships with the larger firms.
v Leverage Outside Funding. All public expenditures should look to leverage funds from
beneficiaries, the private sector, or external donors. The easiest way to do this is to work with partners which already demonstrate best practice, have access to external funds, and can reach larger scale with a small amount of government funds. A good example is Swiss contact, which has developed a strong model for providing business services to SMEs in a sustainable manner.
v One-stop Shop for Permits and Licensing. SMEs need to be able to access permits and licenses in
a transparent and timely manner. The current ad hoc system promotes corruption, creates uncertainty, and can result in a resource drain for small firms which opt for formal sector status. One-stop shops bring together representatives of the key regulatory bodies responsible for processing licenses and permits, and provide information on regulations relating to these documents. They would increase transparency in the licensing process and reduce the turnaround time for documents, lessening the “burden of formality” on SMEs. Over time, this will lead to a decline in the number of informal firms, and a rise in the tax base.
v Tighten design and monitoring of projects. Given resource constraints, support projects should
be undertaken only if they are likely to have a significant impact on the SME sector. Without better design and monitoring, it is impossible to demonstrate the impact that projects will have. Responsible departments should be expected to clearly define and demonstrate the intended outputs, outcomes and impacts of proposed projects.

58
Table 6-1: Leading sub-sectors: RGDP in 1999 at constant 1993 prices (Million Rp.)
Agriculture 7288312 Manufacturing* 4,955,078 Trade/ Hotel 3,991,368 Food crops 2405789 Food, Beverages, Tobacco 2,460,379 Retails and
Distributor 3,588,196
Plantations 3023144 Textiles and Footwear 595,540 Hotel 62,111 Animal Husbandry 633,398 Wood Forest and Products 390,630 Restaurant 341,060 Forests Products 366,028 Paper and printing 109,707
Fisheries 859,953 Rubber and chemicals 671,408 Cement and non-metallic
minerals 197,604
Metalworks, iron and steel 248,697 Machinery 204,105 Others 77,008
Note: *Manufacturing refers to processing of finished goods others than oil and gas. Source: North Sumatra Base line survey 1999.
Table 6-2: Number of informal establishments in year 1996
Sector Establishment Employee (person) Mining and Quarrying 1,314 2,730 Manufacturing 63,391 153,491 Electricity, gas and water 590 859 Construction 6,218 20,976 Trade, Hotel, Restaurant 436,358 777,384 Transportation 70,550 91,424 Financial 384 1,197 Estate, Rental services 84,670 135,624 Total 662,159 1,184,135
Table 6-3: Fees for Licenses in Medan
Sector Fee ( Rp.Million/year/firm) Manufacturing 10.908 Trade 45.059 Restaurant 2.102 Transportation 54.995 Average 23.442
Source :Ubaidillah,2001
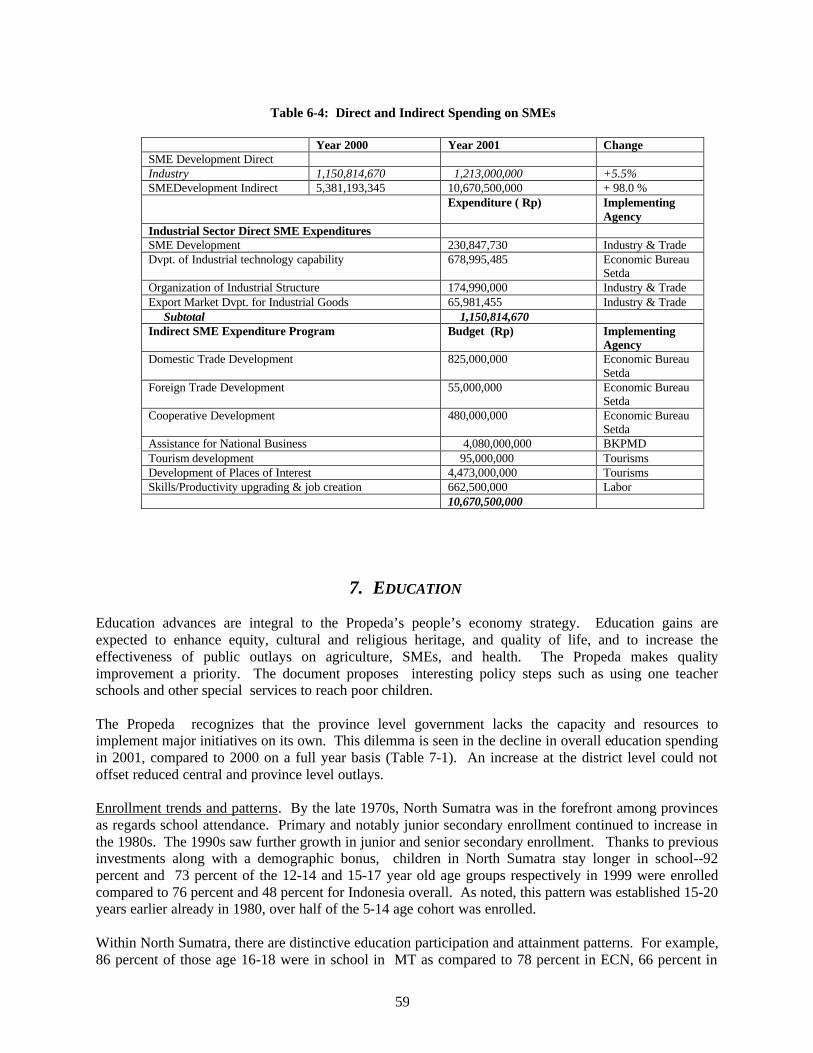
59
7. EDUCATION Education advances are integral to the Propeda’s people’s economy strategy. Education gains are expected to enhance equity, cultural and religious heritage, and quality of life, and to increase the effectiveness of public outlays on agriculture, SMEs, and health. The Propeda makes quality improvement a priority. The document proposes interesting policy steps such as using one teacher schools and other special services to reach poor children. The Propeda recognizes that the province level government lacks the capacity and resources to implement major initiatives on its own. This dilemma is seen in the decline in overall education spending in 2001, compared to 2000 on a full year basis (Table 7-1). An increase at the district level could not offset reduced central and province level outlays. Enrollment trends and patterns. By the late 1970s, North Sumatra was in the forefront among provinces as regards school attendance. Primary and notably junior secondary enrollment continued to increase in the 1980s. The 1990s saw further growth in junior and senior secondary enrollment. Thanks to previous investments along with a demographic bonus, children in North Sumatra stay longer in school--92 percent and 73 percent of the 12-14 and 15-17 year old age groups respectively in 1999 were enrolled compared to 76 percent and 48 percent for Indonesia overall. As noted, this pattern was established 15-20 years earlier already in 1980, over half of the 5-14 age cohort was enrolled. Within North Sumatra, there are distinctive education participation and attainment patterns. For example, 86 percent of those age 16-18 were in school in MT as compared to 78 percent in ECN, 66 percent in
Table 6-4: Direct and Indirect Spending on SMEs
Year 2000 Year 2001 Change SME Development Direct Industry 1,150,814,670 1,213,000,000 +5.5% SMEDevelopment Indirect 5,381,193,345 10,670,500,000 + 98.0 % Expenditure ( Rp) Implementing
Agency Industrial Sector Direct SME Expenditures SME Development 230,847,730 Industry & Trade Dvpt. of Industrial technology capability 678,995,485 Economic Bureau
Setda Organization of Industrial Structure 174,990,000 Industry & Trade Export Market Dvpt. for Industrial Goods 65,981,455 Industry & Trade Subtotal 1,150,814,670 Indirect SME Expenditure Program Budget (Rp) Implementing
Agency Domestic Trade Development 825,000,000 Economic Bureau
Setda Foreign Trade Development 55,000,000 Economic Bureau
Setda Cooperative Development 480,000,000 Economic Bureau
Setda Assistance for National Business 4,080,000,000 BKPMD Tourism development 95,000,000 Tourisms Development of Places of Interest 4,473,000,000 Tourisms Skills/Productivity upgrading & job creation 662,500,000 Labor 10,670,500,000

60
ECS, and 60 percent in NC (Table 7-2, 7-3, 7-4 ). The pattern is especially visible for females. In each region apart from NC, female participation exceeded that for male students, and by substantial margins in several regions. Enrollment rates seem to be governed by labor market opportunities along with access and schooling costs. Consider, for instance, the regional disparities in enrollment rates--in MT, 78 percent of low income children in 1999, ages 16-18, had attained grade 9 compared to 63 percent in ECN, the former education leader, and 47 percent in NC and 32 percent ECS. It is interesting that junior secondary graduates in ECS received only a modest wage premium compared to those with primary school qualifications (Table 7-2). This premium was larger in MT and ECN; a relatively high share of students from non-poor households in ECN did not reach ninth grade. In NC, the labor market “punished” junior secondary compared to primary school graduates. Lower junior secondary entry rates were due in part to withdrawal of poor children prior to completing primary school. In ECS, drop out rates rose after fifth grade while in NC they increased even earlier The influence of access and cost factors can be seen as well. In ECN, entering junior secondary students accounted for over 90 percent of the number of primary school graduates. However, junior secondary students enrolled in government-run schools represented only 38 percent of the total with the rest attending private schools. Privately supplied junior secondary schooling, which also played a key role in ECS, was less of a factor in MT and NC (Table 7-5), suggesting that schooling costs relative to household income were an important differentiating factor. For the province as a whole, average monthly education spending in the two lowest quintiles was Rp. 12,088 in 2000. This figure was roughly twice that spent by the households in the lowest quintile and larger than mean spending in the other income groups in NC as well. Affordability, i.e., the costs of schooling relative to actual and/or expected income, seems to been a significant limiting factor in NC. On the other hand, monthly education outlays in the poorest quintile in MT were above the Rp. 12,088 figure with spending among the near poor and middle income groups trailing only ECN among the four regions. It appears that even poor households in the Mountain region have opted and been able to turn to education as a means of entering more remunerative non-farming sectors. Issues and Constraints Learning achievements. North Sumatra’s achievements as regards access to primary and continuation to junior secondary schooling need to be juxtaposed with various indicators suggesting that the province lags behind in terms of learning levels. The perspective from the SME and agricultural sectors, is that skill gaps have made it difficult for most small, family-centered production units to take advantage of new technologies and market opportunities. This view is consistent with other findings.20 For instance, North Sumatra’s scores on the national examination (NEM) tend to be below average21 The mean primary school NEM in 1999/2000, for 5 subjects, 6.24, was just below the Indonesia-wide average 6.31; while that for junior secondary school level in 1999/2000, for 6 subjects, was 4.94 compared to a national average of 5.27 (Tables 7-6, 7-7). The pattern of NEM scores is of concern as well: (i) 78 percent of the examination participants attained less than the average 5.5 score (for the 6 subjects) - this figure was 90 percent for Natural Science. The pattern of the distribution SLTP NEM attainment
20 For example, a team from FITRA interviewed 36 parents and observed teachers and students in a school in Medan. They found that the primary level curriculum was too demanding; teachers were overburdened and needed to be supplemented by subject matter specialists, scholarships were not distributed fairly, books were expensive, physical facilities were not sufficient, the quality of teachers was low, and there was no extra teaching/guidance out-of class, supervision of individual schools seemed to "just look for mistakes," the education system was very centralized and dogmatic, and there were indications that the government discriminated against private schools. 21 There has been a longstanding debate on the effectiveness and reliability of the National Examinations. Many experts are concerned about performance pressures on children exerted by principals, teachers and parents in some areas.

61
distribution in AY 1999/2000 suggest poor teaching learning outputs: (i) the majority of the examination participants (76 percent) attained scores between 3.51 – 5.5. average scores; (ii) the lowest scores were in Natural Science and Social Science; and (iii) some students attained less than 1 NEM in Civic Education and Natural Science. All in all, students seem to be leaving basic education with low literacy and numeracy, and poor communication and reasoning skills22.
22 These inferences are based in part on several cross-country studies of reading and mathematical ability. For example, Indonesian fourth and eighth graders ranked well below students in neighboring countries in a 1992 comparative exercise. And Indonesian eighth graders ranked fifth lowest in terms of mathematics and seventh lowest for science achievement within a sample of 38 countries participating in the 1999 Third International Mathematics and Science Study (Martin, M. O., et. Al., 2000; Mullis, I.V.S., et. al., 2000).

62
Low average student achievement levels are attributable to weaknesses in the following areas: Readiness for school. Less than half of North Sumatra’s primary school students were enrolled at age six, the official entry age. This was the case for each income quintile for NC and among the poor in other regions (Table 7-2). Limited readiness may reflect the small share (8 percent) of the population aged 6 years who attended kindergarten. The proportion of children ages 3-6 attending play group or kindergarten was 17 percent in urban and 12 percent in rural areas compared to 24 percent and 15 percent respectively for the country overall (Tables 7-8, 7-9). Effective learning hours. Time spent on actual learning is an aspect of education quality in North Sumatra. As in the rest of Indonesia, only 3 hours a day are spent on regular teaching-learning activities in grades 1 and 2, with 6 hours a day allocated from grade 3 onward. In urban secondary schools, the number of hours may be less, as due to excessive student numbers, the time allocated per class is cut to allow use in a double-shift mode. To make up for such limited in-school learning hours, up to half of all students reported that they were assisted by tutors and others, often for a fee.23 Physical facilities, books, and teaching materials. Many government primary schools, secular and Islamic, have dilapidated buildings and furniture, and are without safe water and toilets (Table 7-10). School mapping showed that the districts of Deli Serdang, Asahan, Labuhan Batu, Tapanuli Utara and Nias had the most serious problems. For example, 60 percent of primary school buildings in Nias were in either badly or totally damaged condition. Moreover, students often need to share old and deteriorated textbooks, if any are available at all, and study with few teaching aids. These conditions apply most frequently to schools with poor children, both in urban and rural areas. Curriculum. Children must deal with a curriculum which contains too many subjects and seems to be driven, including the content of textbooks, by the exigencies and characteristics of a demanding national
23 In rural areas, the percentage of students undertaking extra study was 26 percent for primary and 28 percent for junior secondary compared to 46 percent and 54 percent nationally.
Figure 1 : Enrollment by Age and Gender, North Sumatra and Indonesia
0
2
4
6
8
10
12
0 20 40 60 80 100
age
year
s ed
ucat
ion
Male IndonesiaMale N- SumatraFemale IndonesiaFemale N-Sumatra
Source: MNE Statistics, AY 1999/2000

63
assessment system. As mentioned, many students needed outside help in digesting the heavy curriculum (8 primary and 14 secondary school subjects–each with many topics). Household conditions. Students from low income families often come to class hungry, malnourished, ill prepared, and incapable of deriving much benefit. There may be little encouragement or practical help from parents (who may be first generation literates) as regards homework or general reading, and insufficient funds for tutoring, after school activities, or books and so forth. And there may be little in the way of local support. Parents and communities may not have a clear sense of standards, and what constitutes poor quality services, and may lack awareness of the rights of children and their communities vis a vis the schooling system and how to pursue their needs and demands effectively. Teachers can make a difference. These and other factors often constrain the learning environment. However, they can be offset or neutralized through skillful and resourceful responses by North Sumatra’s 140,578 primary and secondary school teachers who are positioned to be more than passive conduits of information. By virtue of their oversight, diagnostic, and integrating roles, teachers, 94,700 of whom are government employees, are of transcendent importance within the education process. Indeed, the enthusiasm, motivation, and skills which teachers apply to the task likely hold the key to education performance. In this regard, North Sumatra has not done well--many teachers lack appropriate skills, have not benefited from good training, and are typically not assisted, monitored and evaluated by knowledgeable principals and supervisors. Primary school teachers are required to have earned a D2 certificate (two years teacher training college) and junior secondary school teachers are supposed to have a bachelor’s degree (S1). In terms of these standards, only 8 percent of primary school teachers were qualified compared to 20 percent nationally. North Sumatra trails the four large Java provinces, i.e., DKI, West Java, Central Java, and East Java. At the junior secondary level, only 27 percent of teachers met the standard (Table 7-11, 7-12). Without good training, teachers rely on frontal lecturing, emphasizing memorization of facts and formulas rather than developing skills and concepts. Teachers make little effort to sense children's needs (and common errors) and abilities and match these with materials and activities. Indeed, they rarely allow activities other than passive listening (partly because they may have trouble managing a "disorderly' classroom), often do not know how to plan lessons and use class periods effectively, and seem to allocate their and the students' time unproductively. A curriculum which was too demanding of teachers and students also affected the quality of teaching and learning. Moreover, many supervisory positions are filled on a seniority basis and by individuals without recent or substantial classroom experience and who are not familiar with the use of assessment tools (and have few results to draw on in any event) and may not be sure about how best to support and advise teachers on actual practice. Because of the above and due to other factors, many teachers lack strong motivation, commitment, and even confidence in their own abilities. Incentives. Teachers’ social status is not particularly high and civil service pay, though higher than many rural incomes, is not remunerative in urban settings. In fact, many rely on private tutoring and non-teaching jobs, which divert attention from planning lessons and evaluating children, and may involve conflicts of interest. A consequence has been uneven deployment and distribution of teachers. Remote areas lack teachers while urban areas are oversupplied according to data for 2000. For example, the teacher/class ratios in Tapanuli Utara, Nias, Madina and Tapanuli Selatan districts are below 0.8 while in Medan and Pematang Siantar the ratio are close to 1.2. The government was not able to provide an incentive package for teachers, almost two-thirds of whom are women, to relocate to rural and remote areas. As a supposedly stopgap solution which has taken on permanent features, district government recruited and assigned “honorary” teachers in rural areas. The province has about 4,000 of these locally hired, generally less qualified and paid teachers.

64
A funding problem? At first sight, it seems that chronic financing shortfalls are responsible for poor learning achievements. Per student spending in North Sumatra has been on average only 50 percent of that in Yogyakarta, and 20 percent less than South Sulawesi though higher than in West Java (Table 7-13). Moreover, education outlays were hard hit during crisis. Junior secondary schooling was particularly affected with real spending per student in publicly run middle schools falling by 32 percent in 1998/99 compared to 1997/98 and by 38 percent relative to 1995/96. Outlays per primary student in public schools fell by 30 percent in constant prices in 1998/99, plunging to a level not seen since 1990/91. A closer look suggests the problem in the first instance was due to the allocation rather than the overall level of education funding. Total and per capita education spending rose at impressive rates in real terms, 4.9 percent overall and 7 percent and 5 percent yearly respectively for primary and junior secondary outlays, in the 1989/90-1997/98 interval before plunging during the economic crisis. However, much of this growth came through increases in SDO grants allocated by MOHA to local governments to cover compensation for civil service teachers. SDO resources already accounted for 40 percent of overall government education outlays and almost 80 percent of primary level spending in 1989/90, but then grew at a 6.5 percent annual rate (7.0 percent on a per student basis) through 1996/97 (Tables 7-1, 7-14, 7-15). Funds budgeted for routine spending (DIK), representing roughly 20 percent of SDO outlays and spent mainly on compensation for non-teacher MNE and MORA primary-school personnel, grew at a similar rate. Together these financing sources bore the brunt of the crisis-period spending decline--per student SDO and DIK outlays in 1998/99 fell to 69 percent of the 1996/97 level—and then figured in the partial recovery in 1999/2000 and the reversal later in 2000 to 81 percent of the 1996/97 level. Meanwhile, outlays on non-salary recurrent items followed a different pattern. The**designated channels were the INPRES grants for primary school maintenance and textbooks, and allocations on non-salary items teacher training. INPRES grants per student peaked in the early 1990s, then fell slightly, before decreasing sharply during and after the crisis (Table 7-14 ). SBPP-SDN spending per student showed a similar decline over the decade. The combined spending share per student of these two sources of non-salary outlays fell from 8.4 percent in 1989/90 to 6 percent in 2000. Modest amounts of non-salary recurrent financing were also available through the DIP. But with new construction activities largely finished, the DIP accounted for roughly 2 percent of primary level outlays during the 1990s. In short, a significant portion of the pre-crisis spending gains was MOHA-directed and financed, and not coordinated with support for measures thought to be directly quality raising. These increases in the SDO and DIK were “passive,” i.e., not linked to any inducements to teachers to perform better. Accordingly, an opportunity was lost to leverage a sizeable increase in spending on behalf of quality improvements. Notably absent, in fact, was the sort of vision of improvement, based on a broader gauge role for extension workers, which took shape in the farming sector during the 1990s. Access and coverage goals remained paramount--no concept of schooling quality was formulated and disseminated. An example is the lack of encouragement to teachers to complete the D2 program. Without such backing, teachers were less likely to enter D2 courses at their own expense. There were two other issues with regards to the D2 program: (i) there was a strong indication that teachers viewed the program more as a way to acquire qualifications than to improve schooling; and (ii) there has been very limited effort by the authorities to control the quality of the program – most of the teachers joined open university D2 program.

65
Addressing Education Challenges The Propeda rightly identifies the qualifications and contribution of teachers as a key factor behind poor learning results.24 Proposed remedies relate to enhancing teachers’ professional capabilities; ensuring an equitable distribution of teaching staff; supporting steps to increase teachers’ image, authority, dignity and status; and establishing a regional teaching accreditation and certification agency tasked with improving the quality of teaching staff. The steps are part of a larger package which covers the curriculum, learning materials, school repairs, text books and reading materials, libraries, laboratories, and sports equipment and facilities. Other measures relate to special support for MIs and MTs; subsidies for private schools to enable them to organise quality education and serve larger numbers on a self-financing basis; staff and school consolidation; unconventional delivery modes directed at specific poor groups such as fishing villages, street children; scholarships to students showing good performance and/or students from poor families; public participation in providing children’s crèches, play groups and kindergartens; and renewed efforts to reach school drop-outs. Rounding out this program, management-related steps are envisaged, such as developing school committees and school boards, stepped up monitoring and evaluation, and introduction of an incentive system to “foster healthy competition among institutions and school personnel.” This policy package is inclusive and well-balanced. But its broad scope takes attention away from the need to find effective entry points and policy priorities. Teachers for instance, deserve an early and major focus as the preeminent, quality-producing factor capable of overcoming most quality obstacles. Previous efforts. Nationally, some quality-enhancing steps were supported by MOEC on a pilot basis in the mid 1980s. These measures, including in-service training for primary school teachers, were implemented on a larger scale during the pre-crisis 1990s. Some good results, for example, occurred in respect of extending the period and upgrading the content of pre-service training for primary and secondary level teachers. But any associated quality gains were felt largely in urban areas where new teachers were generally allocated. Such initiatives were put aside during the economic downturn which began in 1997. In any event, these initiatives largely bypassed North Sumatra where recruitment of new teachers was very restricted due to the same age structure factors which are a concern today. For instance, many primary school teachers were hired in the same period and will reach pension age in the same time e.g., 2010 or possibly earlier for MORA teachers. These limitations put greater weight on attempts to raise the quality of the existing teaching force. But generally across the country, in-service teaching training and related measures such as visits by core teachers and school supervisors and close classroom supervision by the principals, have been ineffective especially when replicated beyond initial pilots. Still, North Sumatra seems to have been especially unresponsive with respect to such initiatives. This may reflect the way quality related measures were seen and financed by central authorities, and decisions over which provinces would benefit from donor-funded investments. Quality strengthening steps were typically introduced in donor-supported projects and never integrated within overall funding flows. For example, the cluster (“gugus”) system which was established in some development projects in the 1980s and 1990s to facilitate the grassroots-level training was not sustained and replicated. One reason is that schools became more familiar with project-driven activities rather than those based on an assessment of local needs. MNE’s efforts to spread the cluster idea by providing a small block grants was not supported
24 Along with unequal access to schooling and low quality of outcomes, the Propeda cites “lack and unequal distribution of qualified teaching staff.”

66
by the necessary inputs – the selection and training of the key cluster actors, tutors, and subject teachers. The same was the case for a program for SLTP and MT teachers. Generally, clusters, most of which were urban-based, faded away after the projects closed. One way of integrating quality-enhancing steps would have involved the increases which occurred in primary level personnel expenditures, which translated, as shown above, into higher outlays per primary teacher. These could have underpinned a larger effort to upgrade primary school quality, possibly including additional funding for books, school maintenance, and various teaching materials, and activities such as in-service training, thought to be important for improved quality of instruction and learning. Quality considerations to the fore. Perhaps even more than in other parts of the country, quality considerations were a secondary priority in North Sumatra compared to basic education enrollment expansion and other goals. The linkage established between piloting quality-enhancing approaches and donor funding helps explain why various measures were never integrated into a mutually reinforcing learning improvement strategy. But the lack of advance in respect of learning achievement also stems from difficulties inherent in the topic. Quality improvement comprised a new and different challenge, one not readily amenable to direct intervention. But how can this situation be altered? As discussed, teachers are the key to quality and learning gains, so a revised approach needs to return to this primary organizer and provider of services. However, the pre-service training-based approach of the 1990s failed despite absorbing significant funding allocations. In essence, this was due to inconsistencies in teacher policies. During the 1980s and early 1990s, GOI programs resulted in an excess number of primary schools and teachers even as demographic changes brought a decline in new entrants. Meanwhile, the implicit policy on teachers was to keep salaries low and working hours to a minimum - in effect encouraging teachers to hold second and third jobs to supplement their income, and affecting work commitment. Deployment of non-civil service, “honorary” teachers was a further complication. Once hired, training for these less well educated, supposedly temporary staff was not forthcoming while their presence may have weakened professionalism in the teacher corps. There were other constraints such as problems with teacher distribution, a near absence of in-class teacher support and coaching, limited recognition or rewards for good teaching practices and effective school administration, all of which characterized a flawed approach to managing teachers.
In short, quality gains require that teacher incentives, deployment, supervision, and training be reassembled in a mutually supporting fashion. A further distinction is warranted in regard to teachers’ capacities and approaches. First, technical skills need to be enhanced so that teachers make good assessments and follow these up with actions which enhance learning. This entails building familiarity with various instruction techniques, setting goals and planning and monitoring of student learning activities, disseminating ways of identifying and responding to lagging students, and setting up performance assessment arrangements. Teachers need to do more than become proficient in technical skills. Student from low income households also need providers to take on the role of committed and opportunistic advisor and broker, ready and inclined to go beyond their classroom functions, working with families and groups of households to build a commitment to schooling. To this end, teachers need not just technical expertise but diagnostic, networking and advising skills. This advocate and agent would identify and help implement ways, including creative "interpretation" of rules and conventions if necessary, of maximizing education gains from existing programs and policies. Clearly, a different approach to teacher pre-service and in-service training is indicated away from a mass production and maintenance approach, and an incentive system which did not link performance to reward. One option which has been overlooked is establishment of an active, continuing connection between schools and training providers, i.e., to ensure that the training material fits with the reality in the classroom and curriculum challenges and to make the training providers available to deliver in-service training for their alumni.

67
Demand side mechanisms. However, salary increases, training and other supply side measures are unlikely to be enough to promote shrewd and responsive provider decisions and behavior. Different demand-side factors need to be activated and institutionalized as well. Sophisticated, continuing communication efforts are needed to inform poor beneficiaries of current program goals and details, standards, means of registering complaints, and penalties for poor performance, and to seek regular feedback on what clients think about services and what they prefer. Mechanisms include developing valid and understandable quality indicators, facility-specific quality report cards, and use of surveys and focus groups to obtain timely feedback. Interaction with poor beneficiaries via surveys and receipt of complaints needs to be complemented with other means of eliciting and expressing demand. Alternatively or in a complementary fashion, greater command over program budgets should be given to local community organizations. This is a likely eventual outcome of the decentralization steps now underway. Decentralization—the district-level agenda. Pilot results have long suggested that quality advances depend on local initiative backed by deft higher level interventions. In this fashion, decentralization can be conducive to learning gains, including achievement by poor children, by strengthening provider involvement with students and their families, making teachers more aware of and responsive to client characteristics and needs. As just discussed, some conditions need to be fulfilled for positive interactions between education service providers and consumers to eventuate. Armed with adequate skills, supervision, material support, and discretionary authority, teachers need to face incentives conducive to providing high quality services. For their part, clients must have access to adequate information, financial means, and bargaining power to elicit appropriate responses from education providers. To ensure creation of a teacher cadre with desirable behavior, districts need to establish effective deployment and relocation, compensation, and career development systems. Districts would require ways of identifying localities with shortages and/or teachers with inadequate skills, and planning new intakes, possibly via contracts with education faculties. Districts also need to address training and peer support for existing teachers, as well as minimum standards; performance monitoring and feedback including ties to local communities and school boards; and procedures for confirmation, certification, and re-certification. Issues to be solved include whether teachers should be civil servants at all, and if so, should they remain part of the national cadre or be hired under other arrangements. All this will entail substantial annual outlays, sustained indefinitely, as well as new policy instruments and some institutional innovations. Steps also need be taken to avoid some negative aspects of decentralization. In the short run, the process can be disruptive due to possible opposition from staff, breakdowns in deployment and other personnel mechanisms, withdrawal of support previously earmarked for the poor, and lapses in reporting, accountability, and quality control procedures, all potentially leading to deterioration in service access and quality. North Sumatra seems to be vulnerable to these effects, though it is a perception of possible opposition that has brought results which could prove disruptive and costly. For example, the merger and full integration of Kanwil and Dinas offices and staff has gone slowly in many districts. Delays in completing this task often stem from difficulty in reaching consensus on selection of “deserving” or “qualified” persons for a smaller number of management positions. In some districts which have undergone restructuring, there has been an issue of “mismatch” between the qualifications of appointed staff and those required by the education unit. Moreover, the longer the transition the weaker the bargaining power of individual districts is likely to be in education matters. This is because district governments are making funding and other decisions, while teachers and their union, PGRI, are weighing in along with other stakeholders. Some of these decisions may be regretted later. For example, most districts have reduced spending for certain activities handed over by the central ministry. These include the “Open” junior secondary (SLTP Terbuka) and OPF

68
(operational and facility maintenance) programs. The former is a means of enrolling poor children who have had no opportunities to attend school, and the latter was an earmarked grant which was important for financing schools’ operational and maintenance costs. Another central initiative at risk is the Program Tambahan Makanan Anak Sekolah (PMTAS) which was started in 1992 to improve physical endurance of poor primary school students. This activity which covered 7 percent of urban and 14 percent of rural students was overlooked in 200, and its continuity is not clear. There is a substantial risk that downsizing of administrative units, i.e., basing education administration at the district level, could result in operational levels for key processes and functions, e.g., training and supervision, that are neither technically efficient nor cost effective. This could be due to a failure of lower level units to capture externalities linked to public education spending, or to hire expert staff, putting technical oversight in doubt. Smaller units may also have less capacity and commitment to develop and finance initiatives targeted at the poor. For example, the standard fully staffed six-classroom school is not an effective means reaching remote populations in North Sumatra. But solutions, such as one-room schools, multi-grade teaching, para-teachers, streamlined curricula, and/or distance education, may be difficult for individual districts to develop. Funds and cost savings. The quality agenda entails into stepped up spending, including outlays on teacher training, assessment systems, books and materials, and even deployment reforms and incentives and so forth coupled with facility-level repairs, improved availability and quality of books and materials, revisions in curriculum. All this will take substantial resources committed for a lengthy period. Spending reallocations will be needed affecting funds tied up in existing facilities as well as recourse to scale economies and other efficiency gains. Suggested cost lowering interventions include: (i) lengthening the school year to approximately 900-1000 hours of instructional time, (ii) increasing the amount of instructional time in core subjects, (iii) professional zing school-level management and selecting school directors on the basis of instructional leadership qualities, (iv) increased flexibility in scheduling, (v) monitoring teacher attendance and regulating use of substitute teachers, and (vi) merging schools. These steps although helpful are unlikely to free up the full measure of resources needed. The obvious place to turn to is spending on staff compensation. Substantial resources can be generated over a 3-10 year horizon, by cutting the number of teachers. Savings would be used not only for school-level improvements but to increase teachers' salaries as part of the strategy of building a professional teaching corps in the country. Higher salaries would be seen as elements in a package which also includes a fulltime job commitment, and clear accountability provisions, linked to realistic performance assessment Minimum Service Standards (MSS). Districts might benefit from guidelines on funding allocations and related measures. In this regard, the MSS prepared by MNE to fulfill a requirement set by MOHA have some potential. MSS were prepared for school facilities, curriculum, staffing, learning materials, learning processes and community support levels. Still being worked out is how to assist schools in meeting standards, particularly those which affect the quality of teaching and learning. A related question is whether, and if so, how to enforce attainment of MSS. Perhaps the best course is to use MSS to establish a dialogue with local schools and communities on acceptable standards and ways of raising quality in the near to medium term. Standards could then be developed collaboratively and presented as goals not as tight performance requirements--a move to required standards could come later, driven by community expectations. Inevitably a large part of the outlays needed to sustain expansion of basic education and simultaneously raise quality standards and achievements must come from district funds. MSS may lead in unfruitful directions, e.g., MNE is looking for ways of ensuring that decentralized block grants are allocated for education development and recurrent outlays. This involves risks that MNE would have to police standards, likely creating local resentment and mistrust of the central ministry as the "agent" of MSS.

69
Negotiating with GOI--MORA. Reaching a satisfactory understanding with the Ministry of Religion Affairs (MORA) is also part of each district’s education agenda. According to Laws 22 and 25, religious matters are not decentralized, and MORA continues to administer the 533 MIs, 733 MTs, and 308 MAs with total students of 100,706, 52,594, and 21,028 respectively and oversee another 374 and 569 privately run Mis and MTs respectively. Quality would be an appropriate organizing principle in dealings with MORA. Issues include whether districts are allocating funds to schools under MORA’s oversight and if so, based on what criteria; what relationships such schools should be expected to establish with local communities; teachers’ qualifications and performance standards; and the minimum physical conditions, inputs, and service standards (MSS) to be expected of schools in the MORA system. Dealing with MNE. A more complicated task for districts concerns interactions with a central ministry, MNE, whose response to decentralization is still taking shape. Besides MSS, policy thrusts consist of continued support for nine years of basic education, and backing for the phased strengthening of local control by piloting school committees and district school councils. But important policies bearing on quality and equity have not been delineated yet. For instance, MNE's intentions remain unclear regarding teacher training and the assessment system, and how to address inter- district funding differences. The package is incomplete, with some key elements still untested, and an overall approach to learning improvement not in view. Moreover, individual districts are at a disadvantage in relating to a Ministry whose operations and outlook remain centralized and which is committed to certain national objectives, e.g., expansion of junior secondary attendance. MNE’s school construction initiative increased the number of junior secondary students by a third (4.9 percent yearly) during the 1990s. This, however, came at the cost of much reduced spending per student, which was consistent with the secondary priority traditionally given to learning achievement and related quality of education matters. Also of relevance is the MNE’s preferred approach to decentralization, i.e., a phased and controlled expansion of school board duties, with members chosen in specified ways. Finally, financing for teacher remains high on the agenda—the Minister of Education’s recent announcement of 50 percent increase in monthly allowances for teachers was a good remainder of the lack of consensus on financing teacher management arrangements.25 Districts should not be confronted with a “take it or leave it” decision in regard to central support for junior secondary spending. Enrollment at this level, although well below 100 percent, grew rapidly in the 1990s and remains above the rate in most other provinces. Reaching 100 percent will entail enrolling another 160,000 students in the 13-15 age range, and require 4,000 additional classrooms, 250 additional teachers and a number of other supporting facilities. The required level of government spending will depend on the relative shares of government or MT schools in enrolling new students. The required public outlays are substantial and could be more effectively allocated, together with the routine costs associated with 250 new teachers and so forth, to other uses. In particular, part of the resources could be invested in upgrading the teacher cadre and in numerous other ways. Ideally, districts would have access to central funds for junior secondary enrollment gains and quality improvements. A possible mechanism would be for each district to prepare its own local education assessment which would be submitted for possible central funding. Roles for the province. The central Ministry is more likely to react favorably to petitions and proposals if they are pursued by groups of districts rather than individual districts as is the process currently. This highlights Law 22’s emphasis on district level roles and responsibilities. But in education like several other sectors, districts in North Sumatra are too small to handle key tasks well, while the central ministry has encountered diseconomies of scale in tackling critical support functions on a national basis.
25 The current education allowance, known as functional allowance in the past, ranges from Rp 112,500 (US$11) to Rp 175,000. New state teachers receive Rp 667,300 as a monthly salary, with the highest paid ones taking home Rp 2.1 million. Malik said the government was studying the possibility of declaring the increase effective as of January this year, and reimbursing the unpaid monthly allowances starting from May. – JP.

70
Districts need to work together to maximize their bargaining power with Jakarta, and also to exploit scale economies in key technical and management functions, e.g., finance, personnel management, training, regulatory matters, procurement of text books and computers, and curriculum development. A province level entity could be assigned these functions by the districts, and would be well situated to coordinate education policies. This could include a mandate to secure quality improvements--the province, arguably, offers the most realistic opportunities for developing integrated strategies to raise learning levels. A related responsibility appropriate for the province-level is to address the large disparities between districts in North Sumatra. This task would require assessments to determine achievement levels across the province. A province-level body would be well placed to balance differences in educational needs and resources; set educational quality standards; manage teacher deployment across districts, and tackle challenges posed by children with special needs. In addition, the province could position itself to negotiate with teachers, and as a supplier of technical assistance to the districts, at least during the transition period.. This type of engagement at the province level seems to be fully compatible with Law 22 which allows districts, operating together as collective entities, to upgrade key technical support activities, draft guidelines for school based management, educational standards and assessments; and promote equity between the regions and provide assistance to backward areas. The public as policy instrument. In the medium term, it will be public demands for higher education standards, not MSS, which drive the system and shape education policy. Further thinking and experimentation are needed on how best to communicate with the public vis a vis education--a combination of local school committees and boards together with a high level Provincial Education Commission (PEC) may prove effective. Essentially, the sector needs a broad policy "compact" which is supported and largely financed by local governments if past achievements are to be preserved and extended. This framework agreement would provide a mechanism to bring together the key stakeholders, e.g., the teachers' union, parents, school committees and other community groups, district councils, NGOs, academic centers, and advocacy groups, which have become more visible. The likely key role of a province-level body should not be overlooked. Assurances are needed as well that the poor, and female students are not left out in district settings. This suggested policy compact could be a key product of a notional PEC which works to build political commitment from the various stakeholders of the education system. The consultative process which is entailed would include difficult discussion of the costs and benefits of different options and strategies for maintaining access while improving learning. In this way, the PEC would serve ad a way of linking funding sustainability to client and stakeholder expectations and actions and to the effectiveness of system management, accountability, and revenue raising. Terms and conditions for education subsidies. While local sources must assume a larger role in financing education services, centrally allocated subsidies need to continue for equity reasons. General allocation grants that respond to regional inequalities should form the main source of public financing for education. Earmarked grants for the most deprived areas are needed as well.

71
Table 7-1: Public Sector Education Expenditure by Level 1989/90 - 2000 In Billion Rupiah, in Current Prices
North Sumatra 89/90 90/91 91/92 92/93 93/94 94/95 95/96 96/97 97/98 98/99 99/00 2000(12mos) Preschool & Primary School 139.2 185.9 215.1 266.4 280.1 335.8 370.4 441.5 528.3 580.8 820.8 1,050.8Junior Secondary School 44.6 59.4 68.5 83.3 99.7 109.7 126.0 148.3 179.4 206.6 272.4 319.6Senior Secondary School 33.3 38.7 46.1 54.3 77.4 70.3 76.2 92.1 106.7 125.1 186.7 206.2University 75.0 32.2 49.1 41.2 48.5 52.1 53.5 75.4 95.0 94.2 135.2 164.5Non-formal Education 0.9 2.1 1.8 3.7 4.7 7.2 6.7 8.9 9.2 8.4 13.6 9.9 # of Students Preschool & Primary School 1,632,940 1,632,7891,644,1541,655,797 1,657,269 1,646,747 1,619,112 1,597,210 1,591,424 1,575,901 1,559,261 1,560,662Junior Secondary School 271,162 265,363 272,429 270,657 283,975 292,574 303,937 323,122 327,767 334,130 347,145 351,797Senior Secondary School 111,951 109,567 116,254 128,762 122,644 124,963 128,776 134,711 141,882 146,763 154,561 156,827University 41,793 Non-formal Education Expenditure per Student (Rp)
Preschool & Primary School 85,21
5 113,875 130,829 160,877 169,042 203,922 228,760 276,394 331,935 368,522 526,416 673,335
Junior Secondary School 164,5
14 223,950 251,293 307,779 351,063 374,936 414,616 459,011 547,454 618,407 784,759 908,458
Senior Secondary School 297,7
05 353,561 396,349 421,766 631,162 562,775 592,002 683,989 751,839 852,465 1,208,236 1,314,771University 3,234,872 Non-formal Education

72
Table 7-2: SCHOOL PARTICIPATION Percent of age group currently attending school (with number of Obs.)
(quintiles based at region level) AGE 6-11
Poorest 2 3 4 Richest Total
West Coast 77.6 83.6 86.4 83.7 89.2 83.3 441 459 344 352 309 1905 Mountains 88.3 90.0 89.0 90.5 91.5 89.6 561 504 417 306 222 2010 ECstNorth 85.3 89.7 93.3 93.8 94.7 90.7 444 454 347 325 253 1823 ECstSouth 85.7 85.2 90.3 90.3 92.1 88.0 396 378 375 327 306 1782 Total 84.6 87.5 90.2 90.2 92.6 88.3 1842 1795 1483 1310 1090 7520 AGE 12-14 West Coast 85.7 88.8 91.2 88.5 97.3 90.0 165 214 178 172 180 Mountains 95.7 95.9 94.2 95.4 98.3 95.8 260 255 220 190 169 1094 EcstNorth 83.5 92.1 97.6 96.1 98.2 92.2 235 251 179 179 151 995 EcstSouth 87.6 86.8 90.2 89.9 94.2 89.4 187 179 174 182 200 922 Total 87.3 91.3 94.1 93.3 97.3 92.1 847 899 751 723 700 3920 AGE 15-17 West Coast 48.9 59.4 63.1 70.6 76.8 63.5 139 190 173 176 196 874 Mountains 74.3 82.0 86.4 83.6 89.3 83.0 227 246 209 192 248 1122 EcstNorth 61.0 71.2 80.6 84.1 90.0 76.2 208 247 225 196 177 1053 EcstSouth 39.1 49.5 61.0 67.3 77.9 59.4 154 139 179 211 230 913 Total 59.0 68.7 75.1 78.0 85.7 72.8 728 822 786 775 851 3962

73
Percent whoever Attended School – Children Aged 5 to 10 (Quintiles based at region level)
Years Poorest 2 3 4 Richest Total
Sumatra Utara 5 3.1 2.3 4.1 2.3 7.1 3.5 6 31.3 40.7 44.8 47.4 61.1 42.8 7 87.0 91.4 94.9 96.2 98.8 92.5 8 96.5 95.7 98.4 99.6 99.6 97.5 9 99.3 99.5 99.0 99.3 98.9 99.2 10 99.2 99.7 99.9 100.0 100.0 99.7 Total 70.4 73.3 73.9 73.0 77.6 73.1 West Coast 5 1.5 0.0 0.0 0.8 0.7 0.6 6 18.7 21.1 28.9 24.1 40.5 24.6 7 72.0 88.5 93.1 93.7 99.4 87.7 8 92.0 94.8 97.6 99.7 98.9 96.2 9 100.0 100.0 97.6 97.0 100.0 98.9 10 97.4 98.5 99.2 100.0 100.0 98.7 Total 63.2 69.0 65.5 67.9 69.3 66.6 Mountains 5 0.0 0.8 7.2 7.2 7.2 3.7 6 38.4 41.5 36.5 52.8 43.0 41.8 7 93.4 98.1 98.9 100.0 95.6 97.0 8 100.0 98.7 96.2 98.4 100.0 98.7 9 100.0 99.2 98.4 100.0 100.0 99.4 10 98.7 100.0 100.0 100.0 100.0 99.6 Total 75.6 74.8 75.4 77.5 75.0 75.6 East Coast North 5 4.6 5.1 5.5 1.4 9.4 4.6 6 29.1 54.5 59.1 60.9 73.0 52.9 7 89.6 95.5 94.8 97.0 100.0 94.3 8 94.2 93.4 99.9 100.0 100.0 96.8 9 98.8 99.5 99.6 100.0 97.6 99.2 10 100 100.0 100.0 100.0 100.0 100.0 Total 70.6 74.3 78.1 73.1 83.5 75.1 East Coast South 5 4.6 0.6 4.6 2.3 10.1 4.5 6 40.5 38.5 46.9 48.5 68.0 46.2 7 88.6 83.2 93.2 94.7 98.2 90.2 8 100.0 97.4 100.0 100.0 99.3 99.3 9 98.4 99.2 100.0 100.0 99.4 00.3 10 100.0 100.0 100.0 100.0 100.0 100.0 Total 71.6 74.7 74.6 74.4 75.4 73.9

74
Percent of 16 to 18 year olds who have attained each grade
(quintiles based at region level) SUMATRA UTARA gr1 gr2 gr3 gr4 gr5 r6 gr7 gr8 gr9 poorest 99.1 98.7 96.5 95.5 93.7 91.6 66.6 63.7 60.6 2 99.4 99.0 98.5 96.5 94.9 94.4 81.2 79.2 72.9 3 99.8 99.5 98.8 97.6 95.6 93.9 78.8 77.5 73.1 4 99.2 99.1 98.3 97.0 96.0 95.5 86.0 85.1 80.7 richest 99.8 99.8 99.8 99.0 98.5 97.7 93.6 92.8 89.8 Total 99.5 99.2 98.3 97.1 95.7 94.5 80.8 79.2 75.0 WEST COAST
gr1 gr2 gr3 gr4 gr5 gr6 gr7 gr8 gr9 poorest 97.3 95.4 89.6 87.3 85.4 81.9 52.1 49.8 43.0 2 99.9 98.5 96.9 94.7 91.5 90.7 68.8 65.1 58.1 3 99.2 99.2 97.8 95.0 90.3 87.3 59.9 57.6 52.1 4 100.0 99.9 97.0 94.5 94.1 93.8 67.7 65.9 63.0 richest 99.0 99.0 98.6 96.8 96.8 95.6 87.6 87.6 83.6 Total 99.2 98.5 96.2 93.9 91.7 90.1 67.3 65.2 59.9 MOUNTAINS gr1 gr2 gr3 gr4 gr5 gr6 gr7 gr8 gr9 poorest 100.0 99.4 99.0 98.1 97.5 97.3 86.6 81.0 76.9 2 99.3 99.0 98.1 97.1 96.8 96.2 93.4 92.1 85.3 3 100.0 99.7 98.0 97.1 95.8 95.2 91.9 90.2 84.9 4 100.0 100.0 99.7 99.4 98.7 97.9 95.8 95.4 92.5 richest 100.0 100.0 100.0 100.0 100.0 99.4 96.5 94.6 93.2 Total 99.9 99.6 99.0 98.4 97.8 97.2 92.8 90.6 86.4 EAST COAST NORTH gr1 gr2 gr3 gr4 gr5 gr6 gr7 gr8 gr9 poorest 99.1 99.1 96.1 95.5 93.5 92.7 65.3 63.8 61.5 2 99.9 99.9 99.7 97.7 96.1 95.8 83.2 82.0 76.4 3 100.0 100.0 99.6 98.9 97.3 96.1 82.5 81.7 78.1 4 98.2 98.2 97.7 96.9 96.8 96.1 91.2 90.7 85.2 richest 100.0 100.0 100.0 99.6 99.6 99.6 98.1 97.6 94.6 Total 99.4 99.4 98.5 97.6 96.5 95.8 82.8 81.8 77.9 EAST COAST SOUTH gr1 gr2 gr3 gr4 gr5 gr6 gr7 gr8 gr9 poorest 99.1 99.1 99.1 98.0 95.2 87.4 54.2 50.3 48.9 2 97.0 97.0 97.0 94.0 92.1 91.7 71.6 68.3 61.6 3 99.9 98.6 98.6 97.3 96.3 93.4 71.5 70.2 66.5 4 99.9 99.5 99.5 96.7 93.4 93.1 80.9 79.5 74.5 richest 100.0 100.0 100.0 97.8 95.0 92.4 83.5 82.7 78.4 Total 99.2 98.9 98.9 96.9 94.5 91.6 72.4 70.3 66.1

75
Table 7-3: Means, Standard Deviations and Number of Observations of Wage Earmers
Region
edcat WestCoast Mountains ECstNorth ECstSouth Total None+less 278731 311361 323260 367891 334874 167853 122443 130013 150685 140988 84 79 130 236 529 Prim 402917 331283 336961 371567 349245 238442 119515 122507 155612 142263 126 210 333 384 1053 J.Sec 382663 357033 396353 384131 386929 179612 166690 180063 150701 172426 132 171 367 282 952 S.Sec 482829 467865 432900 494301 449896 193590 208884 202525 191339 202383 247 262 703 400 1612 SomeUniv 614954 562429 565362 672986 578950 182934 227960 231239 153283 220645 30 37 59 20 146 Univ 562779 573987 711015 589203 664011 251662 246250 284893 243204 279123 39 54 111 33 237 Total| 440181 395599 413098 410040 411721 220450 190120 204108 176224 197838 658 813 1703 1355 4529

76
Table 7-4: Percent whoever Attended School – Children Aged 5 to10 (quintiles based at region level)
SUMATRA UTARA years Poorest 2 3 4 Richest Total 5 3.1 2.3 4.1 2.3 7.1 3.5 6 31.3 40.7 44.8 47.4 61.1 42.8
7 87.0 91.4 94.9 96.2 98.8 92.5 WEST COAST 5 1.5 0.0 0.0 0.8 0.7 0.6 6 18.7 21.1 28.9 24.1 40.5 24.6 7 72.0 88.5 93.1 93.7 99.4 87.7 MOUNTAINS 5 0.0 0.8 7.2 7.2 7.2 3.7 6 38.4 41.5 36.5 52.8 43.0 41.8 7 93.4 98.1 98.9 100.0 95.6 97.0 EAST COAST NORTH 5 4.6 5.1 5.5 1.4 9.4 4.6 6 29.1 54.5 59.1 60.9 73.0 52.9 7 89.6 95.5 94.8 97.0 100.0 94.3 EAST COAST SOUTH 5 4.6 0.6 4.6 2.3 10 4.5 6 40.5 38.5 46.9 48.5 68.0 46.2 7 88.6 83.2 93.2 94.7 98.2 90.2

77
Table 7-5: Education Indicators by Region
Indicators North Coast Mountains East Coast North East Coast South
% % % % Entering junior secondary students per 65 61 50 35
graduating primary school students (public)
Public junior secondary students per 81 71 38 67
total junior secondary students
Entering public senior secondary students per 81 72 40 67
Entering senior secondary students (Total)
Public senior secondary students per/ 77 58 25 51
Total senior secondary students
Entering junior secondary students per 77 78 91 49
graduating primary school students (Total)
Average No. Junior Secondary Students
Per public school 387 523 586 521
Per private school 179 195 263 204
Students per teacher
Public junior secondary 18 18 15 20
Private 15 16 16 14
% of those ages 16-18 who completed
Sixth grade (poorest quintile) 83 98 92 91
Sixth Grade, (male) 92 97 95 90
Sixth Grade, (female) 88 97 97 94
% of those ages 16-18 who completed
Ninth Grade (poorest) 47 78 63 32
Ninth Grade, (male) 61 84 77 62
Ninth Grade, (female) 58 89 79 69

78
Table 7-6: National Examination Scores (NEM) SLTP & MTS Public and Private, AY 1999/2000
NEM Civic
Education Bahasa
Indonesia Mathematics Natural Science
Social Science English Total Score
Average Score
Average 5.18 4.83 5.01 4.53 4.87 5.21 29.61 4.94 Lowest 0.59 1.68 1.71 0.95 2.23 1.26 8.42 1.40 Highest 8.79 7.95 9.17 8.49 7.41 9.55 51.35 8.56
Deviation Standard 0.58 0.64 0.52 0.49 0.44 0.62 3.27 0.55
Table 7-7: Distribution of NEM Attainment -- SLTP, Sumatra Utara AY 1999/2000
Civic Ed. B. Indonesia Mathematics Natural Science Social Science English Average-Total
No, of participants 169,629 169,629 169,629 169,629 169,629 169,629 169,629 % get > 7.51 NEM 0.39 0.07 0.60 0.15 0.00 3.06 1 % get 5.51 – 7.5 NEM 36 21 18 10 15 28 21 % get 3.51-5.5 NEM 63 75 80 86 85 69 76 % get < 3.5 NEM 0.49 4.13 0.77 4.52 0.37 0.73 2
Source: MNE Statistics, AY 1999/2000 -- MTs data is not included.
Table 7-8: Proportion of Population Aged 3-6 years who are attending Play group/Kindergarten -- Selected Provinces -- 2000
Urban Rural % Urban
Male Female Total % Male Female Total % + Rural
North Sumatra 15.1 19.4 17.2 12.1 11.1 11.6 14.4
DKI Jakarta 18.7 21.5 20.1 - - - 20.1
West Java 17.4 21.5 19.4 9.7 10.6 10.1 14.8
Central Java 33.4 33.7 33.6 25.0 25.8 25.4 29.5
East Java 34.3 31.9 33.1 27.5 28.4 27.9 30.5 National Average 22.7 23.6 23.2 14.8 15.5 15.1 19.1
Note: - Total population, Indonesia, excluding Aceh and Maluku is 196.6 m. - Total population of Sumatra Utara is 11.4 m, 42% of them are in urban. - Female compose 51% of urban and 49% of rural population. - Population aged 3-6 in Sumatra Utara is 0.9m.
Source: Statistics of Education - Susenas, BPS 2000

79
Table 7-9: Number of Kindergarten (KG) institutions and students
by Status of Schools (PS) and Its ratio to Number of First Grader
of Primary Schools – Selected provinces, AY 1999/2000
Public Private Total Grade 1 PS % KG to Inst. Students Inst. Students Inst. Students Students Grade 1 PS (Est. 1/) Students 2/ North Sumatra 12 855 574 36,777 586 37,632 471,600 8 DKI Jakarta 9 626 1,558 83,008 1,567 83,634 182,840 46 West Java 19 1,065 3,478 151,111 3,497 152,176 1,322,440 12 Central Java 20 1,834 10,221 284,626 10,241 286,460 910,720 31 East Java 19 1,145 11,969 514,951 11,988 516,096 978,440 53 National - total 225 16,745 41,092 1,596,016 41,317 1,612,761 7,069,480 23 1/ Data available is no of classes. Average no of students is 40. 2/ Ratio is taken Kindergarten students and 1st grade PS students, as they are the ones who later move up to primary schools Source: MNE, Indonesia Educational Statistics in Brief, 1999/2000

80
Table 7-10: Condition of Selected Physical Facilities, SD and MI -- AY 2000.
SD MI No of schools 9,439 518 % badly/totally damaged buildings 41 36 % without clean water 33 25 % without toilets 29 24 % without electricity 10 NA % badly damaged & shortage of furniture 35 32
Source: North Sumatra BEP Mapping, AY 20020.
Table 7-12: Profile of Junior Secondary Education Teachers North Sumatra, AY 2000
Level of education SLTP MTs No % No. % PGSLP/A/D2 subtotal 15,033 44 3,530 34 D3 and higher: D3/SM 9,904 29 - S1/Bachelor 9,357 27 - Post Graduate 56 0.2
subtotal 19,317 56 6,843 66 Total 34,350 100 10,373 100
The numbers include: - No. with non-teacher training 2,371 6.9 2.3 - No. with Islamic teacher training 6,515 63 Non-general academic teacher tr.
Source: School Mapping, Basic Education Project, as of August 2000.
Table 7-11: Profile of SD teacher education AY 1999/2000
Education level SUMUT Jabar Jateng Jatim DKI
Total no. 75,464 175,969 164,343 167,583 34,802
Teacher Training, SSS 54,758 61,581 90,312 77,251 9,822
PGSLTP/D1 3,407 1,904 2,040 2,491 700
Other SSS, non-teacher training 9,056 21,116 19,721 20,110 4,176
subtotal D1 and lower 67,221 84,601 112,073 99,852 14,698
% to total 89 48 68 60 42
PGSLTA/D2 4,837 93,439 57,669 50,891 16,926
Sarjana Muda 425 3,076 3,141 7,911 1,622
Sarjana/S1& higher 3,348 12,365 7,284 25,725 4,652
Subtotal qualified/D2 and higher 8,610 108,880 68,094 84,527 23,200
% to total 11 62 41 50 67
Source: MNE statistics for AY 1999/2000

81
Table 7-13: Public Sector Education Expenditure by Level 1996/97 – 2001
(Constant Prices) North Sumatra 96/97 97/98 98/99 99/00 2000 (12 mos) # of Students Preschool & Primary School 1,597,210 1,591,424 1,575,901 l,559,261 1,560,662 Junior Secondary School 323,122 327,767 334,130 347,145 351,797 Senior Secondary School 134,711 130,378 146,763 154,56l 156,827 Expenditure per Student (Rp) Preschool & Primary School 218,263 230,711 160,256 183,668 208,995 Junior Secondary School 360,721 374,794 257,908 268,698 276,668 Senior Secondary School 537,778 560,197 349,007 408,444 384,835 South Sulawesi # of Students Preschool & Primary School 1,023,753 1,030,473 1,056,742 1 ,078,995 1,106,944 Junior Secondary School 217,724 233,026 239,645 247,595 256,842 Senior Secondary School 109,449 110,319 124,279 129,244 132,004 Expenditure per Student (Rp) Preschool & Primary School 270,205 294,129 193,527 230,72l 249,037 Junior Secondary School 546,189 531,853 301,178 338,582 341,813 Senior Secondary School 672,465 638,949 333,916 433,718 392,811 West Java # of students Preschool and Primary School 4,956,547 4,995,249 5,010,962 5,153,970 5,160,405 Junior Secondary School 902,876 958,424 984,635 1 ,009,004 1,025,026 Senior Secondary School 307,624 290,409 340,375 356,73l 360,760 Expenditure per Student (Rp) Preschool & Primary School 163,997 173,775 117,243 139,646 148,787 Junior Secondary School 301,410 301,494 174,259 205,98l 192,084
Senior Secondary School 495,328 472,579 247,316 335,24l 291,865 West Nusa Tenggara # of students Preschool and Primary School 553,378 564,642 573,126 579,455 585,312 Junior Secondary School 102,738 107,074 110,542 119,718 134,610 Senior Secondary School 38,832 42,258 48,836 58,808 59,222 Expenditure per Student (Rp) Preschool & Primary School 180,182 191,114 127,990 154,938 167,989 Junior Secondary School 418,717 470,406 246,023 255,80l 256,548 Senior Secondary School 644,751 596,849 279,638 397,36l 341,463 Yogyakarta # of Students Preschool & Primary School 267,108 256,775 251,900 246,202 249,313 Junior Secondary School 113,433 111,917 112,386 112,933 112,293 Senior Secondary School 59,564 54,721 63,076 66,33l 68,198 Expenditure per Student (Rp) Preschool & Primary School 423,631 508,236 343,848 415,874 430,434 Junior Secondary School 514,199 549,019 319,843 431,176 389,169 Senior Secondary School 689,998 739,340 376,216 456,583 425,378

82
Table 7-14 Per Student Spending in Current Prices (Rp)
North Sumatra 89/90 90/91 91/92 92/93 93/94 94/95 95/96 96/97 97/98 98/99 99/00 2000(12mos)
Preschool & Primary School
MONE+MORA - #students 1,632,940 1,632,789 1,644,154 1,655,797 1,657,269 1,646,747 1,619,112 1,597,210 1,591,424 1,575,901 1,559,261 1,560,662
DIK 10,675 11,726 13,991 17,206 2,484 22,522 27,258 29,945 34,735 34,753 55,832 64,611
DIP 1,298 2,240 4,306 3,805 4,196 4,821 6,679 6,800 6,411 29,254 31,661 39,966
INPRES+SDO+SBPP-SDN 73,242 99,909 112,532 139,866 143,362 176,578 194,823 239,649 290,790 304,515 438,923 568,759
INPRES or DIPDA I + DIPDA II 3,436 9,162 11,745 14,652 15,260 11,750 15,323 17,906 24,016 28,225 37,794 51,115
SDO 66,873 87,739 97,613 121,814 124,488 160,850 175,133 216,521 261,106 268,050 391,679 506,281
SBPP-SDN 2,933 3,007 3,175 3,400 3,614 3,978 4,367 5,222 5,668 8,240 9,451 11,363
Total 85,215 113,875 130,829 160,877 169,042 203,922 228,760 276,394 331,935 368,522 526,416 673,335
Enrollment of MIs in N Sumatra is estimated at 6% of national.
Junior Secondary School
MONE - #students 264,520 258,403 265,186 262,640 274,931 282,677 293,292 311,165 310,856 314,452 325,727 331,579
DIK 134,591 153,251 173,296 213,608 247,197 250,523 294,763 317,016 388,346 375,458 592,095 729,035
DIP+BLN 13,790 53,660 60,572 71,352 79,090 100,861 87,728 115,534 133,818 227,799 171,444 146,764
MORA - #students 6,642 6,960 7,243 8,017 9,044 9,897 10,645 11,957 16,911 19,678 21,418 20,218
DIK 790,528 799,060 850,587 936,824 999,219 865,738 1,006,657 1,016,308 917,131 782,745 1,029,975 1,372,177
DIP+BLN 16,562 57,470 38,656 118,500 105,044 181,878 293,108 131,304 95,204 77,752 77,505 71,883
MONE+MORA - #students 271,162 265,363 272,429 270,657 283,975 292,574 303,937 323,122 327,767 334,130 347,145 351,797
DIK 150,657 170,189 191,304 235,030 271,147 271,334 319,695 342,893 415,628 399,445 619,111 765,997
DIP+BLN 13,857 53,760 59,989 72,749 79,917 103,602 94,921 116,117 131,825 218,963 165,648 142,461
Total 164,514 223,950 251,293 307,779 351,063 374,936 414,616 459,011 547,454 618,407 784,759 908,458
Enrollment of MTs in N Sumatra is estimated at 3% of national.
Senior Secondary School
MONE - #students 105,983 103,143 109,387 121,175 114,073 116,289 119,199 124,670 130,378 135,473 141,456 143,248
DIK 216,779 244,387 259,990 285,682 366,232 381,174 425,521 471,179 540,224 510,316 765,528 948,232
DIP+BLN 61,459 91,492 119,830 116,359 253,094 163,383 140,492 187,928 182,772 310,225 436,162 316,532

83
Table 7-14 Per Student Spending in Current Prices (Rp)
MORA - #students 5,968 6,424 6,867 7,587 8,571 8,674 9,577 10,041 11,504 11,290 13,105 13,579
DIK 643,389 637,453 659,648 736,825 788,678 766,659 860,125 934,170 1,023,952 1,036,249 1,278,138 1,510,421
DIP+BLN 0 0 0 0 0 40,350 55,340 58,759 54,761 199,291 763 331,885
MONE+MORA - #students 111,951 109,567 116,254 128,762 122,644 124,963 128,776 134,711 141,882 146,763 154,561 156,827
DIK 239,523 267,433 283,598 312,263 395,756 407,932 457,843 505,689 579,447 550,774 808,991 996,910
DIP+BLN 58,182 86,128 112,751 109,503 235,406 154,843 134,159 178,300 172,392 301,691 399,245 317,861
Total 297,705 353,561 396,349 421,766 631,162 562,775 592,002 683,989 751,839 852,465 1,208,236 1,314,771
Enrollment of MAs in N Sumatra is estimated at 5% of national.
University
MONE - #students #REF! 10,244 #REF! 22,475 18,660 18,824 19,451 29,879 29,511 51,204 31,983 31,800
DIK 1,573,604 880,534 1,477,492 1,661,708 1,636,934 1,817,999 2,431,636 1,341,301 2,913,110 3,748,428
DIP+BLN 1,496,486 800,890 903,537 814,386 865,765 602,764 554,370 304,078 938,624 966,457
MORA - #students 9,810
DIK 708,970
DIP+BLN 514,781

84
Table 7-15: Per Student Spending in Constant Prices (Rp)
North Sumatra 89/90 90/91 91/92 92/93 93/94 94/95 95/96 96/97 97/98 98/99 99/00 2000(12mos)
Preschool & Primary School MONE+MORA - #students 1,632,940 1,632,789 1,644,154 1,655,797 1,657,269 1,646,747 1,619,112 1,597,210 1,591,424 1,575,901 1,559,261 1,560,662 DIK 16,615 16,756 18,325 19,797 21,496 22,536 27,274 23,491 24,174 15,576 19,819 20,475 DIP 1,604 2,608 4,944 4,131 4,165 4,785 6,629 5,516 4,256 10,436 9,644 11,329
INPRES+SDO+SBPP-SDN 112,893 140,345 145,495 159,979 143,325 176,588 194,815 188,479 201,609 133,897 153,903 178,529
INPRES or DIPDA I + DIPDA II 4,246 10,670 13,486 15,907 15,147 11,663 15,209 14,524 15,944 10,069 11,512 14,489
SDO 104,082 125,378 127,851 140,159 124,562 160,945 175,237 169,859 181,721 120,135 139,037 160,439 SBPP-SDN 4,565 4,297 4,158 3,912 3,617 3,980 4,369 4,096 3,945 3,693 3,355 3,601
Total 131,112 159,710 168,765 183,907 168,986 203,909 228,718 217,486 230,039 159,909 183,366 210,333 Enrollment of MIs in N Sumatra is estimated at 6% of national.
Junior Secondary School MONE - #students 264,520 258,403 265,186 262,640 274,931 282,677 293,292 311,165 310,856 314,452 325,727 331,579 DIK 209,478 218,993 226,979 245,777 247,343 250,671 294,937 248,696 270,276 168,273 210,179 231,029 DIP+BLN 17,043 62,488 69,553 77,467 78,502 100,111 87,076 93,711 88,838 81,269 52,220 41,603 MORA - #students 6,642 6,960 7,243 8,017 9,044 9,897 10,645 11,957 16,911 19,678 21,418 20,218 DIK 1,230,380 1,141,844 1,114,081 1,077,907 999,810 866,250 1,007,252 797,284 638,292 350,811 365,616 434,838 DIP+BLN 20,470 66,924 44,387 128,655 104,263 180,525 290,929 103,789 63,204 27,738 23,607 20,376 MONE+MORA - #students 271,162 265,363 272,429 270,657 283,975 292,574 303,937 323,122 327,767 334,130 347,145 351,797 DIK 234,483 243,198 250,566 270,424 271,307 271,494 319,884 268,997 289,263 179,023 219,769 242,742 DIP+BLN 17,127 62,604 68,884 78,983 79,323 102,832 94,215 94,084 87,515 78,116 50,455 40,383 Total 251,610 305,802 319,450 349,407 350,630 374,326 414,099 363,081 376,778 257,140 270,224 283,125 Enrollment of MTs in N Sumatra is estimated at 3% of national. Senior Secondary School MONE - #students 105,983 103,143 109,387 121,175 114,073 116,289 119,199 124,670 130,378 135,473 141,456 143,248 DIK 337,396 349,225 340,529 328,704 366,449 381,400 425,773 369,636 375,978 228,714 271,744 300,492 DIP+BLN 75,960 106,544 137,597 126,330 251,212 162,168 139,447 152,431 121,337 110,675 132,851 89,726

85
Table 7-15: Per Student Spending in Constant Prices (Rp)
MORA - #students 5,968 6,424 6,867 7,587 8,571 8,674 9,577 10,041 11,504 11,290 13,105 13,579 DIK 1,001,372 910,911 863,993 847,789 789,145 767,112 860,633 732,847 712,636 464,427 453,708 478,647 DIP+BLN 0 0 0 0 0 40,050 54,929 47,660 36,355 71,098 232 94,078 MONE+MORA - #students 111,951 109,567 116,254 128,762 122,644 124,963 128,776 134,711 141,882 146,763 154,561 156,827 DIK 372,794 382,157 371,451 359,289 395,990 408,173 458,113 396,708 403,275 246,846 287,172 315,918 DIP+BLN 71,911 100,297 129,469 118,887 233,656 153,691 133,162 144,622 114,446 107,630 121,606 90,103 Total 444,705 482,454 500,920 478,176 629,645 561,864 591,275 541,330 517,722 354,477 408,779 406,021 Enrollment of MAs in N Sumatra is estimated at 5% of national. University MONE - #students 0 10,244 0 22,475 18,660 18,824 19,451 29,879 29,511 51,204 31,983 31,800 DIK 2,248,657 1,013,139 1,478,365 1,662,691 1,637,901 1,426,203 1,692,337 601,145 1,034,084 1,187,865 DIP+BLN 1,742,672 869,522 896,819 808,330 859,328 488,911 368,031 108,482 285,896 273,958 MORA - #students 9,810 DIK 251,667 DIP+BLN 156,798 3,991,329 1,882,661 2,375,184 2,471,021 2,497,229 1,915,115 2,060,368 709,627 1,319,980 1,461,823
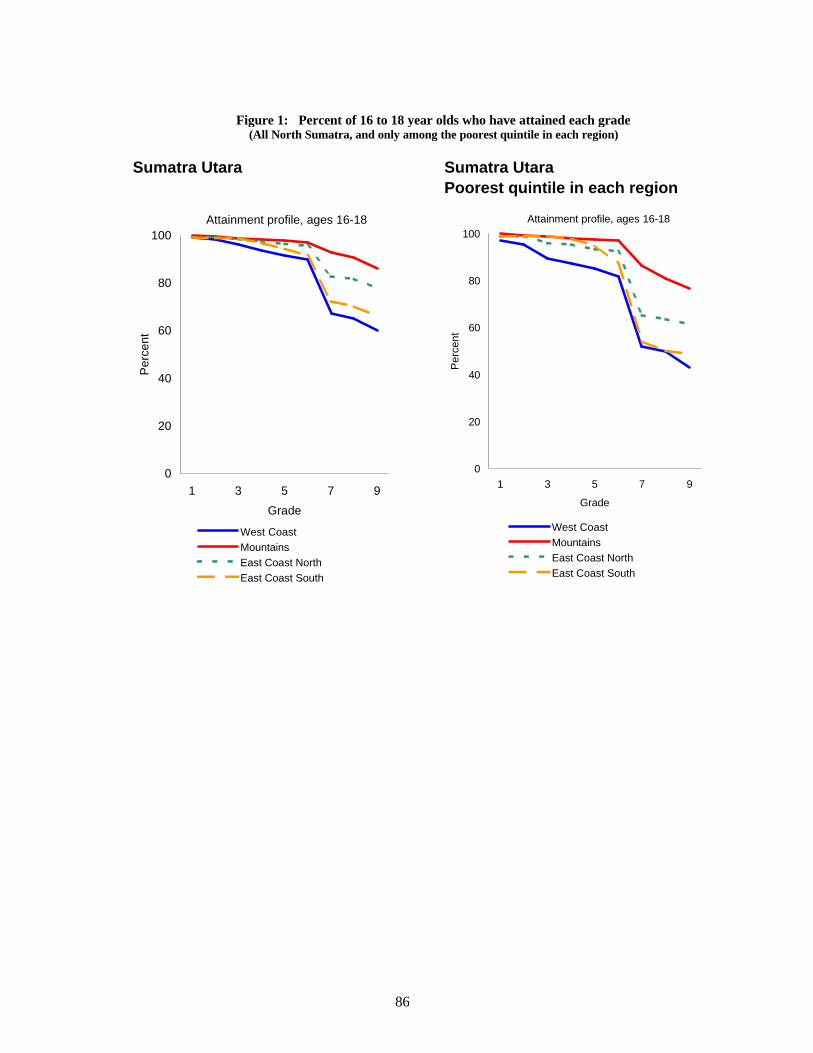
86
Figure 1: Percent of 16 to 18 year olds who have attained each grade (All North Sumatra, and only among the poorest quintile in each region)
Sumatra Utara
Attainment profile, ages 16-18
0
20
40
60
80
100
1 3 5 7 9
Grade
Per
cent
West CoastMountainsEast Coast NorthEast Coast South
Sumatra UtaraPoorest quintile in each region
Attainment profile, ages 16-18
0
20
40
60
80
100
1 3 5 7 9
Grade
Per
cent
West CoastMountainsEast Coast NorthEast Coast South

87
Figure 2: Percent of 16 to 18 year olds who have attained each grade (By Provincial level quintiles, and among the poorest quintile in each region – with province based quintiles).
Sumatra Utara(Province based quintiles)
Attainment profile, ages 16-18
0
20
40
60
80
100
1 3 5 7 9
Grade
Per
cent
Poorest Quintile 2
Middle quint. Quintile 4
Richest
Sumatra Utara: Poorest quintile(Province based quintiles)
Attainment profile, ages 16-18
0
20
40
60
80
100
1 3 5 7 9
Grade
Per
cent
West Coast
Mountains
East Coast North
East Coast South

88
8. HEALTH
The Propeda presents an intriguing policy agenda for the health sector. For instance, the policy section begins with the concept of a “healthy living environment” which is seen ultimately as a family and community responsibility but which would be advocated and facilitated by government staff. The recurrent theme of healthy behavior linked to community empowerment is interesting Also of note is the proposed multi-component “health effort program,” which seems to be motivated by the realization that existing initiatives have not worked well. However, little background information is presented; the risks posed by decentralization are not identified; while the material and analysis provided are not enough to shape a rationale for measures actually proposed. This Section introduces additional information which is used to define a suggested approach in this sector. Health status in North Sumatra. As with education, health advances in North Sumatra came earlier than in most other provinces. In 1971, for example, the infant mortality rate (IMR) in North Sumatra was roughly 20 percent less than the national rate. This gap narrowed as health conditions improved during the next two decades (Table 8-1, Figure 8-1). In the late 1990s, IMR for North Sumatra was estimated at roughly 45 deaths per thousand births, about 10 percent less than estimates for the country overall. Despite significant gains, survival rates and health status remain much below levels in other developing countries and elsewhere in Indonesia. For one thing, the provincial population remains at risk from traditional diseases such as diarrhea, dysentery, pneumonia, tuberculosis, typhoid, gonorrhea, measles, hepatitis, malaria, dengue, and pertussis, and even polio (200 cases in 2000), leprosy (952 active cases) and filariasis (1019 cases). However, data weaknesses make it impossible to develop a robust picture of actual disease and mortality risks between districts. Not surprisingly, IMRs are highest in NC, the poorest region (Table 8-2 ). Specific health concerns in NC include high maternal mortality and morbidity, malnutrition, endemic malaria in Nias and parts of Tapanuli Selatan, and persistence of other communicable diseases due to low coverage of safe water supplies, sanitation facilities, and immunization. ECN and ECS face occasional malaria in rural areas and endemic dengue risks in several districts in each region but are dissimilar in some ways. For instance, water and sanitation infrastructure in ECS are more rudimentary with a smaller proportion of the population with access to safe water (Table 8-4b). Government facilities and staff. The health system seemed to be adequately endowed with staff and facilities in the late 1990s. There were 27 public hospitals (not including 7 run by the military), 87 private hospitals, and over 400 health centers each typically with 4 or more sub-centers and 2 mobile clinics and an average of 26 staff with training in a health field (Tables 8-3, 8-4a,b,c). On average, each health center has several doctors and dentists, and 17 nurses, midwives, and other trained paramedical workers. In 2000, there were 1066 general practitioners and contract doctors, 1356 specialists, 823 dentists contract dentists, 6434 midwives and contract midwives, 9078 nurses, and 264 pharmacists for a total of 15,776 health workers with some training in the province, with 3685 support staff (Tables 3-7, 8-4a). Traditionally, government health centers were tasked with implementing 18 programs, including curative services, maternal and child health (MCH) and family planning, immunization, health education, and communicable disease control (Table 8-5).

89
Use of health services. Although disease risks are substantial, utilization of health services has remained low on average (Tables 8.6-8.10, Figure 8.2), while displaying sharp differences by income group (Figure 8.3). To illustrate, more than half (57 percent) of the 23 million outpatient sickness episodes experienced in 1998 were self-treated (Table 8.6). Of the remaining 43 percent, around 64 percent were treated by private providers and 36 percent in public facilities (3.6 million outpatient visits). However, over 40 percent, 1.5 million visits, of public sector services was delivered to the 835,000 members of ASKES, the civil servants’ health insurance scheme. The remaining 10.8 million people in North Sumatra made roughly 2 million outpatient visits to government facilities, a rate of only 0.2 visits per person yearly (25 percent of that in West Java). Moreover, during the 1994-98 interval, attendance was broadly declining, with the percentage of those under five attending health centers falling. Utilization fell further in 1998 and continued to drop in 1999/2000. Also underutilized were government hospitals, with bed occupancy rates (BOR) in public facilities, falling from above 50 percent before the crisis to 33 percent by 1998, rising marginally to 35 percent in 1999. Reasons for low use of public facilities. A recent field assessment provided insights into why the public system has performed so poorly. Five health centers, two each in Medan and Karo district and 1 in Dairi)
Figure 8.1: Infant Mortality Rates in North Sumatra 1971-97
122
97
6849
51
71
109145
0
50
100
150
200
250
300
1971 1980 1990 1997
Year
IMR Indonesia
North Sumatera
Source : Neraca Kualitas Lingkungan Hidup Daerah Prop.Sumatra Utara, 1998.
90
were visited covering areas of varying socio-economic and epidemiological characteristics. In addition, the team also spent time in three public hospitals26.
• Utilization features. Each center was functioning more as an outpatient clinic than a community health facility, with most staff time spent providing curative services. One center chosen as a best practice example received 200 visitors a day. For the others, the number of visits averaged between 5 and 40 per day, not including limited outpatient contacts at the sub-center level.. About 50 percent of the visitors were poor patients covered under JPSBK program. Utilization in the hospitals was also low, with BORs as low as 29 percent and outpatient visits of 100 per day or only 7 – 8 patients daily per specialist doctor.
• Affordability. Utilization was likely affected by informal visit charges. Interviews with patients
revealed that most paid Rp 8,000-15,000 per visit, much more than the official fee of Rp 1,100 per visit. As the point of reference, average monthly household spending on health in 1999 came to Rp. 9100 (Table 8.11a,b). Meanwhile, the stated minimum fee in private clinics was Rp 20,000 including drugs. The official fee per visit consisted of Rp 500 for registration and Rp 600 for drugs and medical services. With higher fees, the patients received brand name medicines rather than the generic drugs formally provided in the health center. The poor were supposed to be excused from user charges Health cards, for those of the poor who had them, did not seem to bring fee reductions.
• Inappropriate fee structure and subsidies. Hospitals had in common insufficient operational and
maintenance budgets, and heavy cost burdens in serving the poor. Fees were set well below costs with low revenues the result. For outpatient services by a specialist, the official fee was only Rp 1,500. Room charges for class-III, class-II and class-I were Rp 8,500, Rp 12,500 and Rp 30,000 respectively. Due to this fee and cost structure, there were inappropriate subsidies to individuals capable of paying. Calculations showed that ASKES was subsidized as well, paying provincial health authorities only a portion of the cost of services rendered to members. The subsidy to ASKES members was estimated to be approximately US $ 7 million in excess of existing payments for services in 1999.
• Quality of facilities. Settings for service provision were under-resourced, unpleasant, and possibly
unsafe. Buildings or outreach points were in poor condition, and inputs such as drugs and spare parts for medical equipment and instruments as well as water and electricity were unavailable. The appearance of the hospitals was inferior to the image presented by private facilities.
• Availability of services. Except for immunization, many programs were not implemented. For
example, there were no health promotion activities undertaken. Laboratories did not have the capacity to examine sputum for TB. Recording and reporting were also very poor. One health center was unable to examine Hemoglobin (Hb) levels because there was no Hb-meter available.
• Client information and feedback. Actual and potential patients and clients are largely uninformed
and even confused as to how to use health services, their rights, and the scope and level of services they should expect. In part, this reflects a lack of organized efforts by or behalf of health clients. Also, there was little indication of prior health education and related demand side initiatives. Such efforts, which have long been underfunded, were handled centrally through occasional uniform, national level campaigns. It is likely that the public’s interest in using
26 The public hospitals observed were Kabanjahe in Karo District, Sidikalang in Dairi District and Pirngadi Hospital in Medan.

91
government facilities was typically constrained by their experience and perception of erratic, low quality, and not fully unsubsidized care (see footnote 2 below).
• Staffing problems. Under utilization of health centers combined with standard staffing patterns
had resulted in excess numbers of employees. One health center doctor estimated that at current workloads, only half of his 38 staff were actually needed. Hospital staffing problems concerned the low availability of specialists most of whom commuted daily from Medan, and also had part time private practices.
• Targeting. This evidence indicates that targeting the “real poor” has not been effective in health
center catchment areas. Health center staff confirmed this conclusion and stated that the current criteria used to identify the poor need to be modified.27
Funding constraints. These observations provide glimpses of a system in trouble. Financing has been a key factor. Public primary care and hospital outlays per capita were two-thirds and two-fifths respectively of average figures for the country overall, and there were differentials between districts. Field reports confirm that only limited resources reached primary care facilities with most of the "standard" 18 health center programs not being implemented. Misallocation was also evident, e.g., in the concentration of government health staff in metropolitan areas, e.g., Medan. Due to financing shortfalls and other crisis-related factors, public expenditures on health fell by 53 percent on a per capita basis in constant prices in 1998/99, with the decline most severe at the hospital level (Tables 8-12a and b and Figure 8-4). By 2000 (12 month basis), spending per capita had recovered to 65 percent of the 1997/98 peak level, before falling again in 2001 in decentralized budgetary circumstances. The negative impact of decentralization on overall health spending was discernible in the reduction by two thirds in central development outlays compared to 2000 (12 month basis), which was not fully offset by the near tripling of district development spending (Table 3-3). The net result was a 10 percent cut in total and per capita health expenditures across the three levels of government. In constant prices, per capita spending in 2001 fell back to less than 60 percent of the 1997/98 figure compared to 65 percent for 2000. Faltering back-up systems. Non-provision of many health center services (see bullet number 5 above) along with disproportionate attention to curative care was one clear consequence of chronic underfunding. Spending in constant prices on preventive health services which climbed to a pre-crisis maximum in 1995/96, fell by nearly a quarter in 1996/97, and then after a slight increase, declined by 38 in 1998/99 (Table 12a, b). Also vulnerable but more difficult to monitor and quantify was the extent and quality of key back-up technical support and referral arrangements for the 18 frontline services and activities. Effective supply and quality assurance systems are indispensable in several senses. They should protect the public from outbreaks of contagious disease and from harm caused by misuse of modern medical technologies. They should ensure supplies of serum, medicine, reagents, and spare parts for critical equipment, and safe systems for disposing of radioactive materials and other medical waste. Provision of such back-up services is an integral and essential part of an effective public health system.one of the main rationales for establishing and financing health systems themselves. The pivotal role of providers. As in education matters, interaction between providers and service beneficiaries in North Sumatra’s health sector is problematic. Faltering performance is attributable in part 27 The Fitra team(see footnote 16) also interviewed providers and patients in a Medan hospital. Their findings included noting that the hospital treated its patients according to their socio-economic status; a patient needing emergency service was only served when there was a financial guarantee to pay the service cost; Patient in the economic class did not get any access to medical specialist; the services provided were not adequate i.e. limited health staff (caused a queuing), health staff were not friendly and the medicine allocated for the Center was often sold illegally by staff (resulting in scarce medical supplies); and free (or cheap) medical service was only as a slogan.
92
to features of the public delivery system, especially low skill levels and the way staff are tasked, supervised, and compensated. The skills of health providers have long been recognized as deficient by decision makers, but were expected to rise as graduates from expanded training programs joined the health work force in the 1990s. In the interim which turned into an extended period, policy makers adopted numerous guidance and control mechanisms in an attempt to manage widely dispersed personnel, and to ensure that poorly trained staff adhered to standard service practices. Norms were set for facility staffing, activity schedules, and work loads, and conscription and centrally controlled deployment of doctors and dentists were used to fill staff positions. Supervision and assessment procedures were based mainly on seniority and compliance with guidelines not actual performance. This centrally orchestrated approach had major drawbacks. The large number of assigned responsibilities and tasks and the specificity of guidelines and instructions actually made it more difficult for managers to assess work processes and outcomes, and left them with weak oversight tools and circumscribed responsibilities. Some experienced facility and district-level. managers found ways of overcoming these features of the system or working around inadequate staff skills. Indeed, there are examples of dedicated and ingenious facility managers who have found ways, including bending or breaking the rules, to improve staff performance and service outcomes. But these creative solutions have often escaped notice and have rarely been captured and recycled via training sessions or cited and internalized as appropriate behavior. Pro-poor advising and brokering. Clearly, a major effort will be needed to improve provider skills. This likely means providing the intensified in-service training required by health workers to make good technical assessments and to follow these up with actions which enhance health. But in this regard, more is required from doctors, nurses, midwives and other health staff than technical expertise. As with poor students, patients from low income households often need professionals to act as advisors, advocates, and intermediaries in health-related matters. Would health providers have the time to take on this sort of role? On the surface, this might be a problem since health center staff have work obligations, e.g., their assigned responsibilities vis a vis the standard 18 health center activities. However, field observations indicated that did not and presumably were unable to carry out anything approaching the full load of activities. In reality, providers must have some to considerable discretionary time at their disposal despite the many functions and activities assigned to them. This is due not just to the impossibility of carrying out all tasks as specified but the weakness and superficiality of monitoring and assessment mechanisms used to gauge performance. At present, much of this discretionary time is either used inefficiently, e.g., spending excessive time on some tasks, or on private income earning activities. Training, reorientation, and compensation. Would staff agree to take on the broker-advocate role? Such a step would require special training on client relations, communications skills, and some forth. But to be fully effective, this long overdue step would have to be accompanied by several other major changes. A remaking of training should be part of a rethinking of the ends and means of public policy in health, and specifically a strong shift, well communicated to staff, to respect and respond to the client’s needs and views. This change will need to be communicated in different ways and to different audiences. Important signals to staff and the public lie in compensation for government employees. Previously, MOH recognized that government salaries were not sufficient and permitted civil servant doctors to supply services privately during off duty hours; MOH also turned a blind eye to such practices by nurses, midwives and other staff. This compensation strategy created perverse incentives within the health center, making it financially attractive to health staff to advise patients with the ability to pay fees to visit obtain services on private account. The attractions of private service provision and the emphasis on adhering to guidelines created a passive and distracted public work force, with little awareness of local community. This approach needs to change to one in which staff are paid as professionals at levels linked to local labor market trends. The higher salaries which would result should be offered, however, in

93
return for a fulltime commitment to a single job, with strong accountability provisions, and pay increases and so forth linked to realistic performance assessment. Clearly enhanced spending is entailed. But where would this increase come from? The most realistic source is the salary budget itself, with resources being generated over a number of years by cutting the numbers of staff. Demand side mechanisms. Nevertheless, salary increases, training and other supply side measures are unlikely to be sufficient to promote shrewd and responsive provider decisions and behavior. Providers need to be exposed routinely and persistently to the questions and concerns and reminded of the interest of direct recipients of services and their families. To this end, different demand-side factors need to be activated and institutionalized as well. Sophisticated, continuing communication efforts are needed to inform poor beneficiaries of current program goals and details, standards, means of registering complaints, and penalties for poor performance, and to seek regular feedback on what clients think and feel about services and what they prefer. Mechanisms include developing valid and understandable quality indicators, facility-specific quality report cards, and use of surveys and focus groups to obtain prompt feedback. Furthermore, interaction with poor beneficiaries via surveys and receipt of complaints needs to be informed and energized by advocacy groups or related arrangements which work on behalf of the poor. Here there are other country lessons worth noting and even piloting: For example, the New Zealand government is testing the use of private sector brokers who are contracted to help poor clients find and use the services they require. A similar approach has been tried in several states in the USA except that the agents working on behalf of the poor are state government employees. Another approach which has been important in the USA context involves use of the political process to secure better health services. Examples include the patients' rights, consumers', women's health, and disability rights movements. Lastly, command over program budgets could be given to local community organizations. This may be a near term outcome of decentralization. Democratization (Section 1) has made all of these possible mechanisms feasible options in North Sumatra. For instance, a number of the “watch dog” NGOs should easily fit expanded efforts on behalf of health clients into their mandates. What decentralization promises. Changes in provider behavior and incentives along the lines just discussed would require supporting adjustments not just in compensation but also staff recruitment, deployment, supervision, and management, and complementary changes in health sector funding. Following decentralization, these are matters which now come almost entirely under the purview of the district. First, as with teachers and students and their families and communities, decentralization provides the opportunity to put provider-client interactions on a more secure and effective basis. By providing more accessible routes for local involvement, decentralization offers a chance to encourage the proactive, staff problem solving and team dynamics needed to deliver high quality services. But districts need to do a lot to move towards creating settings in which providers have the clear goals, incentives, skills, supervision, material support, and discretionary authority needed to offer high quality services. To this end, district officials need to work out their most critical health skills and the compensation packages required to attract qualified individuals. Unorthodox solutions may be needed in terms of payment levels and hiring arrangements, while to free up funds for much higher salary packages major changes in the scope of services and number of staff will be entailed. A smaller range of high priority high quality public services would be the most appropriate result. Curative services would need to be dropped entirely or priced on a full cost basis with resources shifted to delivering more extensive preventive health services. Realistic and sustainable mechanisms would need to be worked out by districts to provide curative care for the poor.

94
Generic risks. Districts and North Sumatra’s society overall face huge challenges in tackling the abovementioned and related reform steps. For one thing as discussed earlier, decentralization can jeopardize the technical quality and the scale and cost effectiveness of health interventions. In particular, the “downsizing” of administrative units can result in designs for key health functions and activities which are neither technically effective nor cost efficient. This would be due in part to the inability of districts to capture externalities linked to public health investments-- worldwide such smaller units typically under-invest in these classic public goods. And districts may represent too small a population and economic base to hire staff with the expert skills, putting technical supervision and assessment in doubt. Previously, health services were guided and supported by technical “inputs” organized routinely through MOH. The sector has been cut loose from sources of technical expertise and direction, e.g., on the range and scale of interventions overall, best practice in designing of individual initiatives, and quality assurance procedures. Finally, reductions in the scale and volume of communicable disease control, health education, and related activities have adverse implications for unit costs and program viability and sustainability. A role for a province-level entity. So districts may not be the appropriate unit to tackle a number of public health measures. District administrations may also find it challenging in the short term as well as beyond to devise and move to quite different staffing, deployment, compensation, priority setting and related arrangements. Difficult tasks on the agenda include the inevitable negotiations with staff organizations to win their agreement to different compensation approaches and possibly a reduction in staff numbers. This matter needs to be handled carefully—hostile staff relations prevented health decentralization from proceeding rapidly for several years in the Philippines. Districts may do better in dealing with strong provider organizations as well as training, deployment issues, and so forth, if they work together to take on some or all of the tasks entailed. Likewise, there are other agenda items which would benefit from a collective, cross-district treatment. For example, negotiations with MOH on priority areas for technical and financial support would likely prove more effective if undertaken on a group basis. Then there are technical imperatives associated with handling provision of public health services effectively and efficiently. Again, it is the cross-district level, i.e., a province-level entity or body run by and for the districts, which provides the most realistic options for tackling key disease control responsibilities. Also best done on a cross district basis are health education and promotion including efforts on behalf of centrally recommended “merit” goods. The cross district platform is likely to be more effective as well in terms of market scale as regards health finance, insurance, regulatory, and related functions (Table 8-14). The Joint Health Council (JHC), which has been set up in North Sumatra, provides a means to organize such activities. The JHC is a cross-district entity in which key decisions are taken by Bupatis, working together to build a collective entity to upgrade and sustain critical technical support activities. A related new entity is the Technical Review Team (TRT) which reports to the JHC and which is expected to play a key role in technical strategy, through their reviews of district proposals and the feedback and guidance offered. Expectations of the Center. Districts and the province-level health entity will need focused, high quality information and advice from central units on disease trends and risks, standards and quality control methodologies, and best and worst practice efforts defined in terms of technical approaches applied and also in use of decentralized management and/or private sector arrangements. Central level resources should be made available to assist the very poorest districts in advancing their health agendas and in backing adoption of merit goals deemed important nationally as well as to foster testing or replication of new technical approaches.

95
Table 8-1: Key Health Indicators for Indonesia and North Sumatra
Indonesia (North Sumatra) Year IMR CMR MMR (source) CDR Life expectancy
1971 145(121) 18.7 (14.6) 45.7(49.9) 1980 109(97) 12.5 (10.2) 52.2(56.1) 1985 9.1 (9.6) 1986 111(87) 450(SKRT 1986) 1990 71(68) 7.9 (8.2) 61.4(62.6) 1992 425(SKRT 1992) 1993 81(74) 1994 390(SDKI 1994) 1995 55(50) 79(65) 373(SKRT 1995) 7.5 (7.2) 1996 51(49) 63.9(64.8) 1997 41(42) 64.2(66.9)
IMR= Infant Mortality Rate per 1000 live births Source: Profil kesehatan Provinsi Sumatra Utara 1999, Departemen Kesehatan RI provided by BPS
CMR = Under five year old Child Mortality Rate per 1000 new borns Source: Profil kesehatan Provinsi Sumatra Utara 1999, Departemen Kesehatan RI
MMR = Maternal Mortality Rate per 100,000 births SKRT is the National Household Health Survey of 1986, 92 and 95 SDKI Sensus demography dan Kesehatan Indonesia 1994 (Indonesian Demographic and health survey)
CDR = Crude death rate per 1000 of the population
Life expectancy = Expected lifespan if born in the respective years Source: Profil kesehatan Provinsi Sumatra Utara 1999, Departemen Kesehatan RI provided by BPS
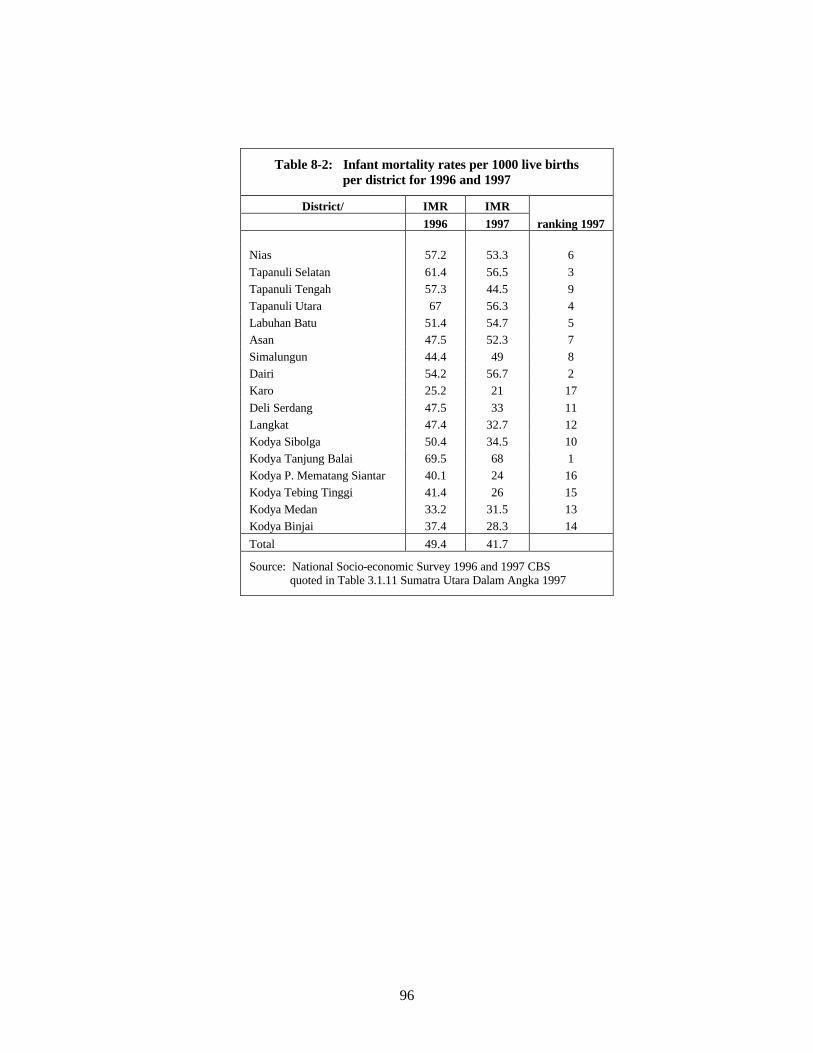
96
Table 8-2: Infant mortality rates per 1000 live births
per district for 1996 and 1997
District/ IMR IMR 1996 1997 ranking 1997
Nias 57.2 53.3 6 Tapanuli Selatan 61.4 56.5 3 Tapanuli Tengah 57.3 44.5 9 Tapanuli Utara 67 56.3 4 Labuhan Batu 51.4 54.7 5 Asan 47.5 52.3 7 Simalungun 44.4 49 8 Dairi 54.2 56.7 2 Karo 25.2 21 17 Deli Serdang 47.5 33 11 Langkat 47.4 32.7 12 Kodya Sibolga 50.4 34.5 10 Kodya Tanjung Balai 69.5 68 1 Kodya P. Mematang Siantar 40.1 24 16 Kodya Tebing Tinggi 41.4 26 15 Kodya Medan 33.2 31.5 13 Kodya Binjai 37.4 28.3 14 Total 49.4 41.7
Source: National Socio-economic Survey 1996 and 1997 CBS quoted in Table 3.1.11 Sumatra Utara Dalam Angka 1997

97
Table 8-3: Availability of Hospital beds per 1000 population by District
Name of District
Size of Population
Total Private Hospital
Private General Hospitals
Private Specialty Hospitals
BUMN Hospitals
Total Public Hospital
Public General Hospitals
Public Specialty Hospitals
ABRI Hospitals
Nias 678,445 0.20 0.20 Tapanuli Selatan 1,103,103 0.07 0.07 0.20 0.20 Tapanuli Tengah 249,986 Tapanuli Utara 736,498 0.34 0.34 0.40 0.31 0.09 Labuhan Batu 878,496 0.44 0.03 0.40 0.10 0.10 Asahan 959,667 0.31 0.20 0.10 0.12 0.12 Simalungun 873,666 0.75 0.14 0.61 0.03 0.03 Dairi 301,360 0.20 0.20 0.13 0.13 Karo 285,434 0.45 0.45 0.56 0.35 0.21 Deli Serdang 1,876,384 0.44 0.24 0.20 0.07 0.04 0.03 Langkat 889,592 0.46 0.06 0.40 0.10 0.10 Sibolga 80,246 0.31 0.31 1.11 0.98 0.12 Tanjung Balai 118,571 0.55 0.55 0.63 0.63 Pem Siantar 238,375 1.51 1.51 1.80 1.05 0.76 Tebing Tinggi 135,216 1.80 0.62 1.18 0.67 0.67 Medan 1,995,367 2.20 1.58 0.29 0.34 1.12 0.60 0.30 0.23 Binjai 216,593 0.37 0.37 0.59 0.28 0.31 North Sumatra 11,616,999 0.71 0.43 0.05 0.23 0.38 0.25 0.07 0.06
Source: Dinas Kasehatan I, 1999.
Table 8-4a: Distribution of medical and paramedical workforce in Health Centers by district, 1999 /a
District
Health
Centers
Total D
octor
Total D
entist
% C
ontract D
octors
Public H
ealth Specialists
Total
Paramedics
Other Staff
Total Staff
Doctors
per HC
Param
edics per H
C
Total staff
per HC
Tapanuli Selatan 53 50 16 37.9% 721 236 1023 1.25 13.6 19.3 Dairi 17 20 11 45.1% 301 124 456 1.82 17.7 26.8 Karo 15 22 16 35.0% 485 114 637 2.53 32.3 42.5 Deli Serdang 48 139 80 35.8% 5 825 222 1266 4.56 17.2 26.4 Langkat 25 77 30 32.6% 1 650 196 953 4.28 26.0 38.1 Sibolga 3 3 2 12.5% 50 22 77 1.67 16.7 25.7 Tanjung Balai 6 8 3 15.8% 1 45 31 87 1.83 7.5 14.5 Pem Siantar 17 15 15 8.9% 4 264 129 423 1.76 15.5 24.9 Tebing Tinggi 5 7 7 0.0% 56 70 140 2.80 11.2 28.0 Medan 39 61 67 0.0% 522 213 863 3.28 13.4 22.1 Binjai 7 9 7 0.0% 58 69 143 2.29 8.3 20.4
North Sumatra /a 235 411 254 26.4% 11 3977 1426 6068 2.83 16.9 25.8
/a Table excludes 8 districts as no data were available Source: Kanwil Department of Health, North Sumatra and Dinas Kesehatan Tingkat I
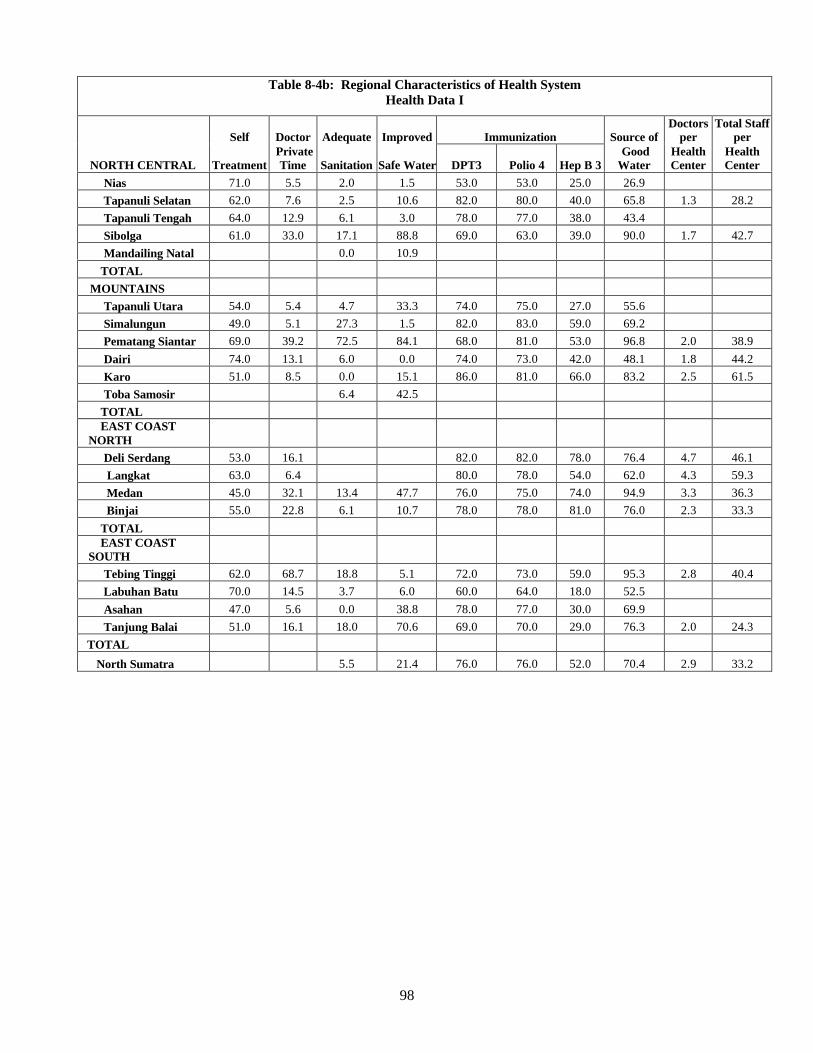
98
Table 8-4b: Regional Characteristics of Health System Health Data I
Self Doctor Adequate Improved Immunization Source of Doctors
per Total Staff
per
NORTH CENTRAL Treatment Private
Time Sanitation Safe Water DPT3 Polio 4 Hep B 3 Good Water
Health Center
Health Center
Nias 71.0 5.5 2.0 1.5 53.0 53.0 25.0 26.9 Tapanuli Selatan 62.0 7.6 2.5 10.6 82.0 80.0 40.0 65.8 1.3 28.2 Tapanuli Tengah 64.0 12.9 6.1 3.0 78.0 77.0 38.0 43.4 Sibolga 61.0 33.0 17.1 88.8 69.0 63.0 39.0 90.0 1.7 42.7 Mandailing Natal 0.0 10.9 TOTAL
MOUNTAINS Tapanuli Utara 54.0 5.4 4.7 33.3 74.0 75.0 27.0 55.6 Simalungun 49.0 5.1 27.3 1.5 82.0 83.0 59.0 69.2 Pematang Siantar 69.0 39.2 72.5 84.1 68.0 81.0 53.0 96.8 2.0 38.9 Dairi 74.0 13.1 6.0 0.0 74.0 73.0 42.0 48.1 1.8 44.2 Karo 51.0 8.5 0.0 15.1 86.0 81.0 66.0 83.2 2.5 61.5 Toba Samosir 6.4 42.5 TOTAL EAST COAST
NORTH Deli Serdang 53.0 16.1 82.0 82.0 78.0 76.4 4.7 46.1 Langkat 63.0 6.4 80.0 78.0 54.0 62.0 4.3 59.3 Medan 45.0 32.1 13.4 47.7 76.0 75.0 74.0 94.9 3.3 36.3 Binjai 55.0 22.8 6.1 10.7 78.0 78.0 81.0 76.0 2.3 33.3 TOTAL EAST COAST
SOUTH Tebing Tinggi 62.0 68.7 18.8 5.1 72.0 73.0 59.0 95.3 2.8 40.4 Labuhan Batu 70.0 14.5 3.7 6.0 60.0 64.0 18.0 52.5 Asahan 47.0 5.6 0.0 38.8 78.0 77.0 30.0 69.9 Tanjung Balai 51.0 16.1 18.0 70.6 69.0 70.0 29.0 76.3 2.0 24.3
TOTAL
North Sumatra 5.5 21.4 76.0 76.0 52.0 70.4 2.9 33.2

99
Table 8-4c: Regional Characteristics of Health System
Health Data 2 Doctors per Total Staff per Number of Visits by type of Ambulatory
Care
Health Center Health Center Population # Sick
Episodes Self Treatment BOR IncidentsCare Ratio
NORTH CENTRAL Nias 678,445 1,546,855 1,102,951 35.0 2.3 0.7 Tapanuli Selatan 1.3 19.3 1,103,103 2,250,330 1,386,494 35.0 2.0 0.8 Tapanuli Tengah 249,986 479,973 308,267 44.5 1.9 0.7 Sibolga 1.7 25.7 36.0 Mandailing Natal TOTAL
MOUNTAINS Tapanuli Utara 736,498 1,679,215 913,033 78.0 2.3 1.0 Simalungun 873,666 1,258,079 621,604 5.0 1.4 0.7 Pematang Siantar 1.8 24.9 31.0 Dairi 1.8 26.8 301,360 867,917 641,164 31.0 2.9 0.8 Karo 2.5 42.5 285,434 376,773 191,941 37.0 1.3 0.6 Toba Samosir TOTAL EAST COAST NORTH Deli Serdang 4.6 26.4 29.0 Langkat 4.3 38.1 28.0 Medan 3.3 22.1 43.0 Binjai 2.3 20.4 78.0 TOTAL EAST COAST SOUTH Tebing Tinggi 2.8 28.0 33.0 Labuhan Batu 878,496 2,002,971 1,401,730 48.0 2.3 0.7 Asahan 959,667 2,533,521 1,193,052 40.0 2.6 1.4 Tanjung Balai 1.8 14.5 13.0
TOTAL North Sumatra 2.8 25.8 38.0

100
Table 8.5: Services Provided by Health Center Diagnosis and treatment Family Planning services School Health Environmental Health Mental Health Dental Health Health Education and promotion Nutrition Communicable Disease Control
Clinical Laboratory Recording and Reporting Eye diseases Promotion of Traditional Medicine Maternal and Child Health Occupational Health Geriatric medicine Sport Medicine Public Health Nursing
Table 8-6: Numbers who sought ambulatory care in North Sumatra, (1998 Susenas)
Visits per North Sumatra % person
per year
Population 11,616,999
Sickness episodes 23,201,568
Self Treat 13,166,133 57% 1.10Seek ambulatory treatment 10,035,436 43% 0.90
of these
Total Private 6,384,416 64% 0.60Total Public 3,651,018 36% 0.30
of the public
835,000 ASKES members 1,500,000 41% 1.80
Total Public without ASKES 2,151,018 59% 0.29

101
Table 8-7a: Number of visits by type of ambulatory care by North Sumatra 1998
Nias Tapsel Tapteng Taput L. Batu Asahan Simalngn Dairi Karo Population 678,445 1,103,103 249,986 736,498 878,496 959,667 873,666 301,360 285,434 Prevalence 0.19 0.17 0.16 0.19 0.19 0.22 0.12 0.24 0.11 # sick episodes 1,546,855 2,250,330 479,973 1,679,215 2,002,971 2,533,521 1,258,079 867,917 376772.88 Self treatment 1,102,951 1,386,494 308,267 913,033 1,401,730 1,193,052 621,604 641,164 191,941 Outpatient care 443,904 863,836 171,706 766,182 601,241 1,340,469 636,475 226,753 184,832 Places for ambulatory care 1. Public Hospital 5,447 21,777 16,066 38,309 24,469 44,568 41,639 20,330 4,265 2. Health Center 147,060 163,330 45,186 86,195 87,390 89,136 101,122 25,021 32,701 3. Sub HC 62,637 21,777 4,017 121,312 17,478 133,704 65,432 43,787 65,402 4. Village Maternity House 19,063 94,369 10,041 156,429 10,487 3,428 23,793 18,766 36,966 5. Integrated Health Post 24,510 7,259 - 12,770 - 10,285 5,948 1,564 -
Total Public 258,717 308,513 75,310 415,015 139,823 281,121 237,935 109,467 139,335 6. Private Hospital - 14,518 5,021 19,155 10,487 95,993 53,535 12,511 11,374 7. Doctor (private time) 24,510 65,332 22,091 41,502 87,390 75,423 32,716 29,712 15,640 8. Health Worker 130,720 355,697 47,194 220,277 297,125 641,094 196,296 56,297 12,796 9. Polyclinic 5,447 25,407 5,021 44,694 34,956 150,846 83,277 1,564 1,422 10.Trad.healer 24,510 94,369 17,070 25,539 31,460 95,993 32,716 17,202 4,265
Total Private 185,187 555,323 96,396 351,167 461,417 1,059,348 398,540 117,286 45,497 Source: Susenas 1998.
Table 8-7b: Number of visits by type of ambulatory care by district of N Sumatra 1998
Dl.Serdang Langkat Sibolga T.balai P.Siantar T.Tinggi Medan Binjai Sumut Population 1,876,384 889,592 80,246 118,571 238,375 135,216 1,995,367 216,593 11,616,999 Prevalence 0.2 0.17 0.08 0.11 0.08 0.1 0.12 0.15 0.17 # Sick episodes 4,503,322 1,814,768 77,036 156,514 228,840 162,259 2,873,328 389,867 23,201,568 Self treatment 2,376,167 1,143,370 47,177 79,800 157,388 100,476 1,285,555 215,964 13,166,133 Outpatient care 2,127,155 671,398 29,859 76,714 71,452 61,783 1,587,773 173,904 10,035,436
Places for ambulatory care 1. Public Hospital 97,073 63,151 896 5,731 966 3,120 171,407 13,751 572,965 2. Health Center 400,952 136,274 8,062 23,367 23,174 8,737 360,858 50,958 1,789,523 3. Sub HC 109,734 109,684 896 3,086 - 624 31,575 3,235 794,380 4. Village Maternity House 33,764 3,324 - 441 - 624 - 809 412,304 5. Integrated Health Post 4,221 9,971 - - - - 4,511 809 81,848
Total Public 645,743 322,404 9,853 32,625 24,139 13,106 568,351 69,561 3,651,018 6. Private Hospital 312,320 16,619 597 2,204 - 1,872 212,004 8,897 777,107 7. Doctor (private time) 341,864 43,209 9,853 12,345 28,002 42,437 509,711 39,634 1,421,371 8. Health Worker 536,009 202,749 5,972 19,399 15,449 4,369 175,918 48,531 2,965,892 9. Polyclinic 223,689 26,590 1,493 441 - - 103,747 809 709,403 10.Trad.healer 67,529 59,828 2,090 9,699 3,862 - 18,043 6,471 510,646
Total Private 1,481,411 348,994 20,006 44,088 47,313 48,678 1,019,423 104,342 6,384,419 Source: Susenas 1998.

102
Table 8-8: Percentage source of out patient-care by district of N Sumatra 1998
Nias Tapsel Tapteng Taput L. Batu Asahan Simalngn Dairi Karo Self treatment 71% 62% 64% 54% 70% 47% 49% 74% 51%Outpatient care 29% 38% 36% 46% 30% 53% 51% 26% 49%Places for ambulatory care 1. Public Hospital 1.2% 4.9% 3.6% 8.6% 5.5% 10.0% 9.4% 4.6% 1.0%2. Health Center 33.1% 18.9% 26.3% 11.2% 14.5% 6.6% 15.9% 11.0% 17.7%3. Sub HC 14.1% 2.5% 2.3% 15.8% 2.9% 10.0% 10.3% 19.3% 35.4%
4. Village Maternity House 4.3% 10.9% 5.8% 20.4% 1.7% 0.3% 3.7% 8.3% 20.0%
5. Integrated Health Post 5.5% 0.8% - 1.7% - 0.8% 0.9% 0.7% - Total Public 58% 38.1% 38.1% 57.8% 24.7% 27.7% 40.2% 43.9% 74.0%
6. Private Hospital - 1.7% 2.9% 2.5% 1.7% 7.2% 8.4% 5.5% 6.2%7. Doctor (private time) 5.5% 7.6% 12.9% 5.4% 14.5% 5.6% 5.1% 13.1% 8.5%8. Health Worker 29.4% 41.2% 27.5% 28.7% 49.4% 47.8% 30.8% 24.8% 6.9%9. Polyclinic 1.2% 2.9% 2.9% 5.8% 5.8% 11.3% 13.1% 0.7% 0.8%10.Trad.healer 5.5% 10.9% 9.9% 3.3% 5.2% 7.2% 5.1% 7.6% 2.3%
Total Private 41.7% 64.3% 56.1% 45.8% 76.7% 79.0% 62.6% 51.7% 24.6%
Dl.Serdang Langkat Sibolga T.balai P.Siantar T.Tinggi Medan Binjai Sumut
Self treatment 53% 63% 61% 51% 69% 62% 45% 55% 56.7%
Outpatient care 47% 37% 39% 49% 31% 38% 55% 45% 43.3% Places for ambulatory care
1. Public Hospital 4.6% 9.4% 3.0% 7.5% 1.4% 5.0% 10.8% 7.9% 5.7%
2. Health Center 18.8% 20.3% 27.0% 30.5% 32.4% 14.1% 22.7% 29.3% 17.8%
3. Sub HC 5.2% 16.3% 3.0% 4.0% - 1.0% 2.0% 1.9% 7.9%
4. Village Maternity House 1.6% 0.5% - 0.6% - 1.0% - 0.5% 4.1%
5. Integrated Health Post 0.2% 1.5% - - - - 0.3% 0.5% 0.8%
Total Public 30.4% 48.0% 33.0% 42.5% 33.8% 21.2% 35.8% 40.0% 36.4%
6. Private Hospital 14.7% 2.5% 2.0% 2.9% - 3.0% 13.4% 5.1% 7.7%
7. Doctor (private time) 16.1% 6.4% 33.0% 16.1% 39.2% 68.7% 32.1% 22.8% 14.2%
8. Health Worker 25.2% 30.2% 20.0% 25.3% 21.6% 7.1% 11.1% 27.9% 29.6%
9. Polyclinic 10.5% 4.0% 5.0% 0.6% - - 6.5% 0.5% 7.1%
10.Trad.healer 3.2% 8.9% 7.0% 12.6% 5.4% - 1.1% 3.7% 5.1%
Total Private 69.6% 52.0% 67.0% 57.5% 66.2% 78.8% 64.2% 60.0% 63.6% Susenas, 1998
These figures paint a similar picture (Figure 4.3). That is only 36% of all visits are to the public sector, and of these around 26% of visits are to the Health Center or sub center although this varies strongly district by district (Table 4.4), with a high of 75% in Karo and a low of 21% in T Tinggi and Asahan.

103
Table 8-9: Percent Use of Different Facilities by Income Quintile
Q-I Q-II Q-III Q-IV Q-V Public Hospital 7.0 5.6 5.2 6.5 9.1 Health Center 21.4 21.3 16.3 13.8 5.3 Sub HC 12.1 8.5 5.9 3.0 2.3 Village Maternity House 7.1 5.1 2.4 1.3 0.0 Integrated Health Post 1.2 0.8 0.4 0.9 0.0 Total Public 48.8 41.4 30.2 25.4 16.7 Priv.Hosp 4.8 5.3 9.1 6.9 16.7 MD clinic 7.6 12.7 19.4 35.3 41.7 Policlinic 4.2 6.9 5.5 4.3 2.3 Hlth.Wkr. 27.9 28.3 29.7 25.9 18.9 Traditional 6.6 5.5 6.2 2.2 3.8 Total Private 51.2 58.6 69.8 74.6 83.3 100.0 100.0 100.0 100.0 100.0 Source: Susenas 1998.
Table 8-10: Percentage of Deliveries Assisted by Type of Health Personnel, by District in N Sumatra
Districts Doctor Bidan Paramed TBA Family Other Total
Nias 0.3 26.4 3.7 45.8 15.9 7.8 100 Tapsel 2.8 52.1 1.8 36.1 6.0 1.3 100 Tapteng 1.3 63.0 6.8 12.0 14.8 2.3 100 Taput 5.7 62.2 3.9 12.7 14.1 1.4 100 Lab. Batu 7.0 64.2 1.6 21.8 5.1 0.3 100 Asahan 9.5 56.1 6.3 23.2 4.7 0.3 100 Simalungun 4.4 72.1 0.0 8.1 13.6 1.8 100 Dairi 4.6 65.5 4.6 11.5 7.8 6.0 100 Karo 2.2 20.5 0.5 3.7 72.9 0.2 100 Deli Serdang 5.9 71.1 1.5 6.9 14.3 0.4 100 Langkat 3.5 68.0 1.5 11.6 14.3 1.2 100 Sibolga 3.7 90.2 0.0 1.8 4.3 0.0 100 T. Balai 6.1 75.8 1.0 11.5 5.4 0.3 100 P. Siantar 12.7 72.6 0.8 2.3 11.2 0.4 100 T. Tinggi 4.9 86.0 0.4 2.1 6.2 0.4 100 Medan 25.5 56.6 1.3 3.5 10.8 2.4 100 Binjai 5.4 74.2 0.0 3.0 17.4 0.0 100
SUMUT 6.8 65.2 2.3 13.5 10.7 1.6 100
Susenas, 1998.

104
Table 8.11a Average monthly household expenditures on health (Susenas broad category) (quintiles defined at the region level)
Region Poorest 2 3 4 Richest Total North Coast 5149 5494 4770 5870 13403 7641 Mountains 3744 4383 6369 7793 14423 8226 EC North 3505 6483 8503 13183 17942 10656 EC South 4720 6300 6037 7966 10995 7594 Total 4058 5871 7014 9849 15077 9084
Table 8.11b Average proportion of household expenditures spent on health (Susenas broad category)
(quintiles defined at the region level)
Region Poorest 2 3 4 Richest Total North Coast 0.015 0.013 0.010 0.012 0.018 0.014 Mountains 0.011 0.010 0.014 0.016 0.020 0.015 EC North 0.010 0.014 0.016 0.020 0.020 0.016 EC South 0.012 0.013 0.012 0.015 0.015 0.014 Total 0.011 0.013 0.014 0.017 0.019 0.015

105
Table 8-12: North Sumatra Health Expenditures by Source, 1994/95 – 2001 (in Rp. Million) Current Prices 2000 2000
1994/95 1995/96 1996/97 1997/98 1998/99 1999/00 (9months) (12 months)
2001
APBN 42,957 31% 61,756 37% 67,845 37% 85,121 38% 88,333 47% 130,663 52% 119,813 159,751 47% 66,198 20% DIK-R 24,913 18% 42,640 26% 50,532 28% 61,228 27% 58,888 31% 90,273 36% 94,286 125,715 37% 48,002 14% DIP R BLN 3,059 2% 3,510 2% 593 0% 1,135 1% 3,821 2% 11,147 4% 8,289 11,053 3% 6,482 2% DIP R RM 14,985 11% 15,607 9% 16,719 9% 22,757 10% 25,625 14% 29,243 12% 17,238 22,984 7% 11,714 3% APBD I 77,634 56% 81,413 49% 83,441 46% 99,443 44% 31,496 17% 42,344 17% 53,048 70,730 21% 93,813 28% DIK1-R 74,845 54% 77,675 47% 79,479 44% 95,731 43% 28,658 15% 25,107 10% 25,486 33,981 10% 52,670 16% DIP1-R 2,788 2% 3,737 2% 3,962 2% 3,712 2% 2,838 2% 17,237 7% 27,562 36,749 11% 41,143 12% APBD II 18,234 13% 22,860 14% 30,205 17% 39,528 18% 67,632 36% 78,157 31% 81,041 108,055 32% 177,172 53% DIK2-R 8,611 6% 12,339 7% 16,784 9% 21,547 10% 49,837 27% 69,066 27% 66,176 88,235 26% 125,906 37% DIP2-R 9,623 7% 10,522 6% 13,421 7% 17,981 8% 17,796 9% 9,091 4% 14,865 19,820 6% 51,266 15% TOTAL 138,825 100% 166,030 100% 181,490 100% 224,092 100% 187,461 100% 251,164 100% 253,902 338,536 100% 337,183 100% Constant 1993 Prices Deflator 1.08 1.18 1.29 1.45 2.54 2.92 3.25 3.52 2000 2000
1994/95 1995/96 1996/97 1997/98 1998/99 1999/00 (9months) (12 months)
2001
APBN 39,858 31% 52,470 37% 52,714 37% 58,787 38% 34,785 47% 44,680 52% 36,915 49,220 47% 18,825 20% DIK-R 23,115 18% 36,228 26% 39,263 28% 42,286 27% 23,190 31% 30,869 36% 29,050 38,733 37% 13,651 14% DIP R BLN 2,838 2% 2,982 2% 461 0% 784 1% 1,505 2% 3,812 4% 2,554 3,405 3% 1,843 2% DIP R RM 13,904 11% 13,260 9% 12,991 9% 15,717 10% 10,091 14% 10,000 12% 5,311 7,081 7% 3,331 3% APBD I 72,032 56% 69,171 49% 64,833 46% 68,678 44% 12,403 17% 14,480 17% 16,344 21,792 21% 26,678 28% DIK1-R 69,445 54% 65,995 47% 61,754 44% 66,115 43% 11,286 15% 8,585 10% 7,852 10,470 10% 14,978 16% DIP1-R 2,587 2% 3,175 2% 3,078 2% 2,564 2% 1,117 2% 5,894 7% 8,492 11,323 11% 11,700 12% APBD II 16,918 13% 19,423 14% 23,469 17% 27,299 18% 26,633 36% 26,726 31% 24,969 33,292 32% 50,384 53% DIK2-R 7,989 6% 10,483 7% 13,041 9% 14,881 10% 19,626 27% 23,617 27% 20,389 27,186 26% 35,805 37% DIP2-R 8,929 7% 8,940 6% 10,428 7% 12,418 8% 7,008 9% 3,109 4% 4,580 6,107 6% 14,579 15% TOTAL 128,808 100% 141,064 100% 141,015 100% 154,765 100% 73,822 100% 85,886 100% 78,228 104,305 100% 95,888 100% % annual change 10% 0% 10% -52% 16% 21% -8%

106
Table 8-13: North Sumatra Health Expenditures by Level, 1994/95 - 2001, in Rp. Mn.
1994/95 1995/96 1996/97 1997/98 1998/99 1999/00 2000(12mos) 2001 Current Prices Primary 80,310 95,119 106,972 129,353 119,638 159,611 216,836 257,527 Promotion 1,559 2,043 2,028 2,965 3,866 6,376 6,492 5,388 Preventive 9,310 11,234 9,406 12,245 13,271 28,300 26,718 17,274 Curative 69,441 81,842 95,539 114,143 102,501 124,935 183,625 234,865 Secondary 58,515 70,910 74,518 94,740 67,823 91,553 121,700 79,656 Total 138,825 166,030 181,490 224,092 187,461 251,164 338,536 337,183 Total/cap 12,971 15,334 16,568 20,220 16,719 22,142 29,499 29,041 Constant 1993 Prices Deflator 1.08 1.18 1.29 1.45 2.54 2.92 3.25 3.52 Primary 74,515 80,816 83,116 89,335 47,113 54,579 66,808 73,235 Promotion 1,446 1,735 1,576 2,048 1,522 2,180 2,000 1,532 Preventive 8,638 9,545 7,308 8,457 5,226 9,677 8,232 4,912 Curative 64,431 69,536 74,232 78,830 40,365 42,722 56,576 66,791 Secondary 54,293 60,247 57,899 65,430 26,709 31,307 37,496 22,653 Total 128,808 141,064 141,015 154,765 73,822 85,886 104,305 95,888 Population 10,702,626 10,827,846 10,954,532 11,082,700 11,212,368 11,343,552 11,476,272 11,610,544 Total/cap (Rp) 12,035 13,028 12,873 13,965 6,584 7,571 9,089 8,259

107
Table 8-14: Functions of Cross-District Health Entity
Responsible Entities/Concerns Policy Issue Previous centralized
paradigm Decentralized paradigm North Sumatra’s Health
Initiatives 1. Providing cross-district public goods.
MOH (C/P), Dinas (I). Law 22 designates Provinces, without clarifying implementation.
Province, as advised by Joint Health Councils (JHC).
2. Exploiting economies of scale/scope.
MOH (C,P), Dinas (I). Unclear, not mentioned in Laws 22 and 25.
Province, as advised by JHC.
3. Targeting Public Funds: a) Between provinces.
MOF, MOH, Bappenas, MOHA
Law 25 : to be governed by formula.
Central piloting of matching-grants.
b) Between districts within provinces.
MOF, MOH, MOHA, Bappenas, Bappeda (I).
Law 25 : to be governed by formula.
JHC to use agreed criteria to review proposals and allocate health funds.
c) Within districts. MOH (C/P), Bappedas (I, II)
DPRDs (D) Bappedas (D).
According to annual proposals reviewed by JHC.
4. Funding adequacy and allocation.
Bappenas, MOH, MOF, Bappeda (I, II)-- fragmented, suboptimal funding.
DPRDs (D), Bappedas (D), Bupatis (D), Bappenas, MOF.
DPRDs (P, D), Bappeda (P, D), JHC.
5. Health education and promotion.
MOH (C) and Dinas (I, II)--underused, ineffective.
Assigned to provinces in PP25
Provincial Health Promotion Board to elicit and fund NGO and other public participation.
6. Health work force management.
MOH (C/P), Dinas (I), BAKN, Bappeda (I, II), Dinas (I, II).
Merged Dinas (P/D) Province and district pilots.
7. Health work force development.
MOH (C,P), Dinas (I, II). Merged Dinas (P/D) Districts and province to develop mechanisms.
8. Technical support. MOHSW (C/P), Dinas (I).
Possibly by merged province Dinas but unclear.
Roles of technical team to be developed along with central piloting.
9. Quality control and assurance.
MOH (C/P), including HP4 pilot, Dinas (II).
Likely continuation of some central guidelines via merged Dinas (P).
D/P/C mechanisms to be tested.
10. Accountability of public providers.
MOH (C/P) and Dinas; agreed SSNAL mechanisms for JPS.
DPRDs, Bupatis (D). e.g., local oversight, professional associations.
11. Private providers-- accountability and quality control.
Licensing and limited accreditation, MOH (C/P), Dinas (P), Professional Groups.
Unclear. Central, province, and district pilots.
C = central P = provincial D = district
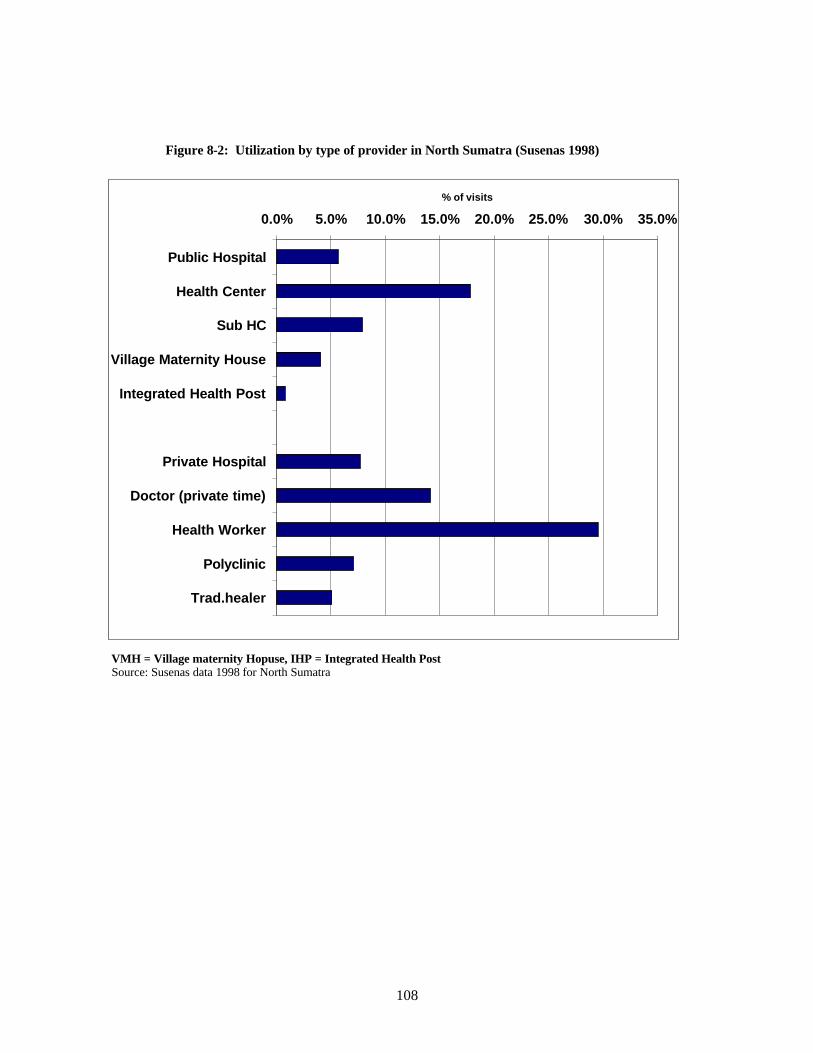
108
Figure 8-2: Utilization by type of provider in North Sumatra (Susenas 1998)
0.0% 5.0% 10.0% 15.0% 20.0% 25.0% 30.0% 35.0%
Public Hospital
Health Center
Sub HC
Village Maternity House
Integrated Health Post
Private Hospital
Doctor (private time)
Health Worker
Polyclinic
Trad.healer
% of visits
VMH = Village maternity Hopuse, IHP = Integrated Health Post Source: Susenas data 1998 for North Sumatra
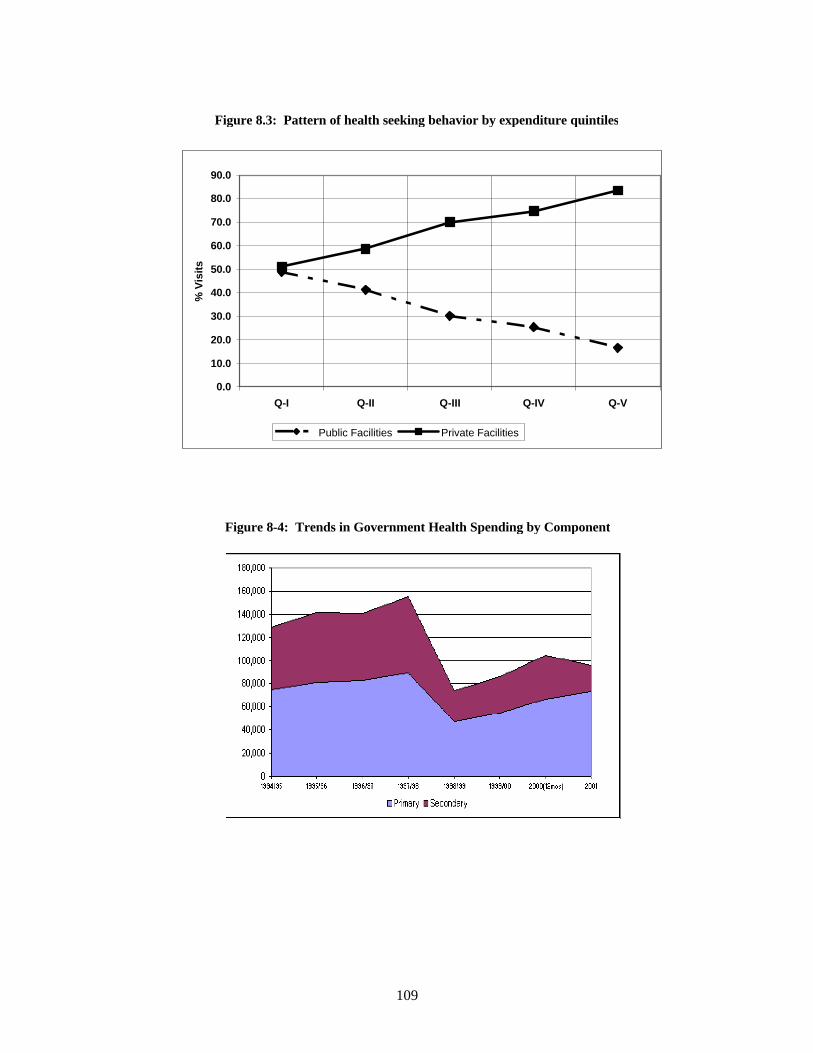
109
Figure 8.3: Pattern of health seeking behavior by expenditure quintiles
0.0
10.0
20.0
30.0
40.0
50.0
60.0
70.0
80.0
90.0
Q-I Q-II Q-III Q-IV Q-V
% V
isits
Public Facilities Private Facilities
Figure 8-4: Trends in Government Health Spending by Component

110
9. CROSS-CUTTING TOPICS AND CONCLU DING OBSERVATIONS This paper reports on policy options in North Sumatra in the wake of the wide-ranging decentralization of government powers and resources which took effect in early January, 2001. Development-decentralization interrelationships were examined at the sector level in Sections 4-8, including the approaches presented in the Propeda, the province’s Regional Development Program. The sectors covered, i.e., agriculture, forestry, small and medium size enterprises, education, and health, all face publicly provided services of unsatisfactory quality and limited impact. Also comparable were the solutions recommended for each sector, including parallel measures to i) develop service cadres which are smaller, and better trained and paid, and held to high performance standards, and ii) make staff accountable to clients who are empowered in different ways. Ways were discussed of exploiting newly established and largely untested decentralized structures to facilitate the proposed solutions (see Table 9-1 below). This final section of the paper takes up the development-decentralization interface in cross-sectoral terms, and at a province-level of aggregation. The focal issue, similar to that in the Propeda, is economic performance leading up to and following the 1997-99 economic crisis. The Propeda’s aggregate perspective. The Propeda ‘s people’s economy strategy counts on productivity and income gains in small farming units, which are then expected to generate output and employment increases in small and medium size manufacturing and service enterprises. This market-based process would be facilitated by the many direct and indirect measures outlined in the Propeda.. This program needs to be assessed from several perspectives.28 First, the Propeda’s view of the potential for small unit productivity gains seems optimistic, especially since no empirical justification is provided. The development literature is filled with cautions that small firms are often seen as the subject of potentially costly social policy rather than a legitimate focus of productive investment (Tendler, 2002). These warnings seem applicable to North Sumatra’s agriculture-- the Propeda likely understates the difficulties and costs entailed in securing widely shared small holder yield gains. Conversely, opportunities for yield increases in medium and large size estate and food crop units are probably underestimated. Similar concerns apply to manufacturing and service SMEs. Section 6 suggests that policy is just starting to take shape, but a secure enough basis does not exist to go to scale with a major initiative. The Propeda also seems too upbeat about dealing effectively with performance and outcomes in forestry, education, and health, three sectors which represent constraints on productivity in small units. On the other hand, the overall Propeda program seems to be oversized and burdensome financially and managerially. The program’s scale and financing implications can only be inferred since expected costs, budgetary needs, and time lines are largely unstated. Nevertheless, the people’s economy approach would comprise a program of substantial proportions judging from the many actions enumerated in each of the sectors. The Propeda, in effect, adds elements to the pre-decentralization and pre-crisis sector and related programs. This implies a budget allocation, combining center, province, and district-level spending, at least as large as total pre-crisis outlays in constant prices. This will be difficult in part since consolidated spending in 2001 was well below the 1996/1997 “norm” and could remain so for some time.
28 Only qualitative comments are possible because of the way this framework paper is presented—it is not set out as a systematic model in which key relationships, e.g., between increased food crop production and employment, are specified and calibrated in individual equations. Nevertheless, this planning document is of considerable interest, in part, as a strongly felt statement, from the province-level angle, of key problems and favored solutions.

111
Of equal importance, the mechanisms and understandings required to arrive at an agreed package of central, provincial, and district expenditures do not exist at the moment. Still at issue is what should be the province’s mandate. On paper, the Propeda can be read as a manifesto for an expanded province-level role. This is a step which central agencies and the districts may not accept. The picture in this regard does have encouraging elements. The provincial government seems to be carving out a post-Propeda role as catalyst, gap-filler, advocate, and provider of specific services. Versions of reality. Why then look to a policy package which seems more complicated and costly than what can be afforded and implemented currently? The Propeda remains of interest, in part, because of the view conveyed of the economic crisis. The document presents the economic downturn as a defining event, a catastrophe which revealed fundamental policy weaknesses and shortfalls in development outcomes which requireda wide ranging rescue effort. The intent then of the Propeda’s overall package is not just to provide temporary assistance but also to inoculate the province against future crises. To that end, an elaborate and costly protection and control apparatus is proposed. The Propeda recognizes some degree of adjustment would occur, e.g., it projects lower growth rates overall and in agriculture for several years. But the implementation issues expected seem to be quite modest judging from the resumption of growth rates which is anticipated. Critique. The strong concern evidenced in the Propeda to assure fairness in the impacts of economic growth is understandable. The dislocations due to the crisis were significant, though probably less than in some provinces thanks to the buoyancy of North Sumatra’s agriculture. But is such a wide-ranging and costly program really necessary, yet alone feasible? In this regard, there are other formulations and approaches, including the proactive coordination work of the province-level government which seem more promising. The main alternative to the people’s economy strategy draws attention to the growth-induced, structural transition which is occurring. This transition has standard features, such as an ongoing shift from a rural, agriculture-led economy to an urban-centered one in which job creation is linked to manufacturing and services output trends. Meanwhile, the labor force is not only less firmly tied to agriculture, it is more mobile and gender-balanced, increasingly urban in numbers and world view, better trained, and more likely to be governed by market-determined employment and compensation arrangements. Even without decentralization, such a transition requires major change in government policies in the sectors covered in this study. In terms of this alternative perspective, the economic crisis receives too much attention in the Propeda and is targeted for too large a post-crisis intervention package. The emphasis instead should be on measures to restore high growth rates while overcoming transition shocks and adverse impacts. Such shocks can be devastating—few middle and higher income economies have escaped the wrenching and sometimes tumultuous consequences that can accompany rapid growth. However, the most constructive way of overcoming these shocks is to exploit comparative advantage and respond to the incentives and opportunities which arise endogenously as development proceeds. Suggested approach. To address North Sumatra’s development challenges, the province level government should actively pursue possibilities offered through decentralization, including coordinating with central and district initiatives. As discussed, public services from agriculture extension to education and health can and should be made more client responsive. The regulatory environment and management of essential assets such as land and forestry should become more focused on the needs of SMEs—the likely motor of renewed growth and employment. At the same time, the tax regime should be kept at a competitive level, in order not to crush the SME sector, and therefore Government resources will remain scarce for the foreseeable future.

112
Within its limited budget envelope, the province level government should act as a facilitator, coordinator, and broker among local governments, and with other provinces and the central government; a sponsor and developer of minimum service standards; supplier of critical inputs in local level functions, including training, management of finances and procurement, work force administration; and a provider of technical and regulatory services with cross-boundary implications. As mentioned, the province level government is already moving creatively to combine forces with the districts in different sectors. For instance, the newly established JHC promises to become a useful vehicle for developing and applying a cross-district approach in health matters. The BPTP ( the agricultural technology assessment center) and river basin authority have similar potential as would the mechanisms suggested for the education sector and for SME development. Other examples include task forces or comparable entities dealing with tourism and environmental management, development of the North Coast region, and joint financing of road construction in the Medan-Binjai-Deli Serdang growth triangle. There are aspects of decentralization such as jurisdiction over several irrigation matters, which are still contested in North Sumatra. Hopefully, such issues can be resolved amicably, as awareness grows that technical skills are in limited supply and need to be shared, leading to cooperative outcomes. Recognition that there are advantages to speaking to Jakarta in one voice should also help. Indeed, a sense of common predicament and benefits expected from “positive” collusion should overcome diehard advocates of “district-primacy.” The province and district-level roles in each case will be determined perhaps iteratively in a sector specific context. In this regard, the province should build on the lively civil society in North Sumatra, and actively promote client involvement in local level services and policy matters. It can do this by providing comparative information on service use, coverage and needs. It could also make transfers to districts conditional on meeting transparency and participation goals. These steps, actual and potential, leave “space” for important but new and distinctive contributions of the Central government. By taking on crucial advocacy, analytical, experience-sharing, and poverty monitoring tasks, these central agencies can play an important role helping provinces and districts to decentralize successfully Transition. As the districts and province become increasingly comfortable with their new roles, they should work together to free up resources for their new tasks. Both the province and districts will need to jettison some previous responsibilities. To this end, a joint review of spending is suggested. This start with an analysis of government work force needs that leads to a comprehensive initiative aimed at rightsizing the civil service, while improving skills, productivity and client responsiveness. The spending and civil service reviews should include central outlays—central ministry staff should be invited to participate, and the province and districts should be allowed to retain the central development spending which is saved. Selectivity would be the key organizing principle within the province-districts spending review. Selectivity in policy could begin by revising the approach which has guided government intervention in numerous sectors. To date, sector program designs seem to have underestimated the complexity of the tasks which were taken on and the capacity of the target audience. This explains the reliance on underskilled and poorly paid front line staff. This is changing with extension agents, teachers, doctors, and so forth now, very appropriately, being asked to take full account of the needs and preferences of their target audiences, and to use professional expertise to tailor their advice to the circumstances and characteristics of individual clients. To assist in this process, the following guidelines may be useful: Roll back the supply-side... Selectivity in policy can begin by reconsidering and revising the approach which guides government intervention in numerous sectors. Those covered in this report have in common not just the deficient quality and effectiveness of services provided. They have also relied on similar

113
approaches, e.g., use of field workers such extension agents, irrigation facilitators, teachers, doctors and other health providers, for the delivery of sector-specific messages and various other services. The main features of this approach are:
• The target audience is seen as the poor. • The justification for intervention by public agencies is to bring potentially life enhancing advice
and services to groups which lack “market” access to information and so forth. • Field workers, i.e., direct inter-personal contacts rather than mass media or other communications
tools, are the main policy instrument. • Field staff are hired, supervised, and managed as civil servants. • The skills of these service providers were identified early on as limited, leading to extensive
training and related upgrading steps. • While waiting for pre-service and in-service training to improve staff quality, instructions,
required procedures, guidelines, specific reporting and other accountability and related administrative tools were used to influence the pace, content, location, and other features of the work done by field operatives.
• Salaries were recognized to be low, but with public funding unavailable, staff were allowed to work on private account in off-duty hours.
• Besides collecting service statistics for administrative purposes, there was little or no information available for program monitoring and evaluation, and thus only limited awareness of the quality and impact of services.
• There was little attention given to the demand for and use of services, and seemingly little interest in accounting for differences in demand—this was due not just to data gaps, but to an initial view of clients as largely homogeneous, unsophisticated, and indifferent towards quality.
• Accordingly, there was often little awareness of the extent to which clients or potential clients turned to alternative, mainly private service providers, or of the cost, quality, and other factors that might have motivated such choices.
• Likewise, there was typically little sense of the low credibility and reputation of such services among the public.
• Programs ignored or underestimated the opportunities and “perverse” incentives facing staff and the alacrity and ingenuity with which they have supplemented their civil service incomes with earnings from unofficial work and other sources.
• As a corollary, policy makers did not gauge the risks of and protect against absenteeism, use of facilities and materials for private purposes, and other adverse effects.
• the attractions of private income earning and the emphasis on adhering to guidelines created a passive and distracted workforce, with little awareness of local community features and needs, especially those of the poor.
• In a sense, low initial views of client and staff capacity became a self-fulfilling prophecy.
There were few incentives or rewards for managers or staff who made special efforts to deliver quality services or find other ways of assisting client groups; indeed staff were discouraged from using the discretionary "space" available to most field and line workers to resolve problems.
To summarize this stylized discussion, sector program designs seem to have underestimated to a considerable extent, the scope and complexity of the tasks which were taken on. Contributing to this misunderstanding was a simplistic, even idealized view of the target audience as not only without alternatives, but unsophisticated and therefore undiscriminating and without stable preferences or standards. With this caricature in place as a premise, reliance on widely dispersed, underskilled, poorly paid, and distracted front line staff was not seen as especially risky. The main concern was seen as limited technical skills--this was thought to have been corrected by specifying in handbooks and written

114
guidelines the actions which staff should take if different situations arose. In effect, sector authorities took steps to restrict providers’ opportunities to make technical assessments for which they were thought to be unprepared. In this fashion, a climate hostile to problem solving was created –this spilled over adversely to teamwork by government staff since most steps and forms of behavior were nominally prescribed and codified in the relevant handbook. Detailed norms were set for facility staffing, activity schedules, and work loads, and centrally controlled deployment was used to fill staff positions. Supervision and assessment procedures were based mainly on seniority and compliance with guidelines not actual performance including how effectively providers had used their discretionary "space" and time. However, the large number of assigned responsibilities and tasks and the specificity of guidelines and instructions actually made it more difficult for managers to assess work processes and outcomes, and left them with weak oversight tools and circumscribed responsibilities. Reversing directions. The reformed sector designs now being discussed and in some cases piloted, e.g., agricultural extension, are trying to make drastic changes in course. Extension agents, teachers, doctors, and so forth are now, very appropriately, being asked to take full account of the needs and preferences of their target audiences, and to use professional expertise to tailor their advice to the circumstances and characteristics of individual clients. Of course, such provider behavior is not unknown. Experienced facility and district-level managers have found ways of overcoming system inertia and working around inadequate staff skills. including bending or breaking the rules, to improve staff performance and service outcomes. But this has not been encouraged, and used for training and other norm-setting purposes. Develop a realistic picture of the “market.” Such a profound change in direction and operational modalities requires information on how customers actually feel about the public services they are receiving, what they are looking for, what standards they apply, and what other options they can turn to if needed. There are various ways of getting this market “intelligence.” A key point here is that findings are likely to show that the image and appeal of current services are compromised already and face strong competition from private providers. Deal decisively with the provider agenda. Workers in the different sectors are said to be demoralized, insecure, and concerned about their futures. This may reflect a correct reading of budgetary prospects, but may also involve some recognition that their services are not always appreciated by clients. They cannot fail to notice that customers’ expectations have been rising and their abilities to respond are handicapped by their own skill limitations. The sector sections have brought out that staff need much stronger technical skills as well as the capacity to work effectively with groups, e.g., different segments of the poor, which are difficult to reach and to communicate with. Clearly, this involves investment in staff skills and in technical support, supervision, and control systems, along with higher salaries, and other elements which go with professionalization. A minority of current employees may eventually emerge as a component of a more professional cadre of service staff, and the downsizing which is entailed needs to be handled fairly and openly. Options need to be defined, funded, and offered to staff through a choreographed process. Worker associations and unions should be brought into the process if at all possible but without giving them a veto. Focus public efforts on indispensable tasks. Applying a selective approach is required because of budgetary constraints. This necessity should be turned into an opportunity to redefine priorities and jettison activities which are not being done well, and are not highly valued by clients who have preferred alternatives. Relative to the private sector, the comparative advantage of public services lies in providing unbiased and correct information, maintaining data banks and clearinghouse arrangements and facilitating different forms of information sharing, and providing technical advice on matters for which there is no private provision. Providing and organizing social safety nets are important activities for public agencies as well. However, a fresh approach is needed in this domain to ensure that NGOs and other stakeholders and different levels of government are appropriately and effectively engaged. While support arrangements

115
are undoubtedly needed, efforts must be made to prevent economic policy including that towards small holders and SMEs and education and health initiatives from being consumed by an antipoverty agenda. Foster demand-side pressures. Providers need to be exposed to the questions and concerns, and reminded of the interest of service recipients and their families. There are alternative ways for demand-side pressures to be conveyed. For instance, the traditional passive mechanisms, e.g., surveys and other feedback mechanisms, of registering consumer views have not been developed adequately and need to be strengthened. But policy attention is needed as well to more direct ways of eliciting and expressing demand. Possible directions include use of cash grants/vouchers by poor households, and/or ways of giving control over program budgets local community organizations. Another interim step would be to give local community councils, bodies and so forth not only oversight and supervisory authority but the power to hire, reward, and dismiss providers. Moreover, such household and community level channels should be informed and energized by advocacy groups or arrangements which work on behalf of the poor, drawing on lessons from other countries. The “watchdog” NGOs which are now active in North Sumatra (see Section 1) would have valuable suggestions and the capacity to play an active role in these endeavors.

116
Table 9-1: Decentralized Solutions to Sector Specific Problems
Sector Main Issue Stance in Propeda and/or Ongoing Work
Suggested Approach
Agriculture Can smallholder productivity be increased and at what unit cost; how to organize in a decentralized setting.
Core component of people’s economy with numerous measures proposed. Pilot extension and irrigation work already ongoing
Rigorous approach towards piloting and replicating small holder policies. Further development of province level extension and irrigation bodies. Build linkages to estates.
Forestry Perverse incentives at different levels working to hasten deforestation.
Call to strengthen awareness, commitment, and policy work.
Need strong province level authority with policy instruments with teeth but also able to open dialogue with different stakeholders
SMEs
Underachievement relative to large potential contribution due in part to over-emphasis on direct supports to SMEs
Numerous supports intended according to Propeda
SME-related tasks, e.g., response to local taxies and fees, information provision, training, and joint lobbying and spending initiatives, which transcend district lines should be carried out by a province level body, which can mobilize different parties and stakeholders, and pull together needed skills and talents.
Education Weak learning achievements/poor service quality.
Extensive program described in Propeda but feasibility/sustainability in question
Need strategic approach backed by province level coordination/quality control/advocacy body.
Health Low health status, poor quality of services.
Province health council being set up with priority setting, technical oversight l responsibilities

117
References
Auty, R. M. 2000. “How natural resources affect economic development.” Development Policy Review Vol. 18 (2000), 347-364. Bennett, C. 2002. “Ketetapan MPR IX, 2001: Just one more among a thousand land use and tenure policies or a real opportunity for land policy reform in Indonesia ?” Draft, 06 February 2002. Barlow, C. and T. K. Wie “North Sumatra: Growth with Unbalanced Development.” Unity and Diversity, Hill, Hal, ed. Oxford University Press, 1989. Gani, A. edited by J. Chalker. 2000. “Provincial Health Policy in North Sumatra: Protecting the poor under decentralization.” Draft October 2000. Ginting, M. and R. Daroesman. “An economic survey of North Sumatra.” Bulletin of Indonesian economic studies, Vol. XVIII, No. 1 March 1982. Government of North Sumatera. 2000. “Profil Kesehatan Propinsi Sumatera Utara Tahun,” Medan, 2000. Gouyon, A. and N. Soeprapto. 1996. “Social and gender analysis for the decentralized Agriculture and forestry extension pilot project.” Social analysis/DAFEPP- Dec. 13, 1996. McCarthy, J. F. 2002. “Decentralisation, Local communities and forest management in
Barito Selatan District, Central Kalimantan.” Case studies on decentralisation and Forests in Indonesia, case study 1.
McCarthy, J. F. 2000. “Wild Logging: The rise and fall of logging networks and Biodiversity conservation projects on Sumatra’s rainforest frontier.” Center for International Forestry Research Occasional Paper No. 31, October 2000. Mission Report. “Indonesia: Decentralized agricultural and forestry extension pilot Project – review of incentives for extension workers.” Indonesia, July 24, 1997. Pagiola, S. 2001. “Deforestation and land use changes induced by the East Asian Economic crisis.” EASES discussion paper series, The World Bank.
Potter, D. “Democratisation and the Environment: NGOs and deforestation policies in India (Karnataka) and Indonesia (North Sumatra).” Saragih, B. 2002. “Implementing agriculture counseling in the development of Agribusiness system and undertaking in the era of Regional autonomy.” Department of Agriculture, Indonesia. Tendler, J. 2002. “Small firms, the informal sector and the Devil’s deal.” Institute of Development Studies, Summer 2002.

118
Usman, S., I. Saad, V. Febriany, N. Toyamah, M. S. Mawardi, H. Sartono, P. Wibowo, S. Sumarto. “Regional autonomy and the business climate: Three Kabupaten case Studies from North Sumatra.” Field Report, SMERU Research Institute, Jakarta, May 2001. Whitten, A. J. and J. Ranger. “Logging at Bohorok.” Oryx, Vol. 20, No 4, October 1986.