Embed Size (px)
DESCRIPTION
Geology
Citation preview
AUTHORS
Peter Hennings � ConocoPhillips Subsur-face Technology, PR2014, 600 N. DairyAshford, Houston, Texas;[email protected]
Peter Hennings received his B.S. and M.S. de-grees in geology from Texas A&M University
Relationship between fractures,fault zones, stress, and reservoirproductivity in the Suban gasfield, Sumatra, Indonesia
and his Ph.D. in geology from the Universityof Texas. He has held various technical and
Peter Hennings, Patricia Allwardt, Pijush Paul, supervisory positions in Mobil Research Com- Chris Zahm, Ray Reid Jr., Hugh Alley,Copyright ©2012. The American Association of Petroleum Geologists. All rights reserved.
Manuscript received May 3, 2009; provisional acceptance June 18, 2009; revised manuscripJuly 6, 2011; final acceptance August 16, 2011.DOI:10.1306/08161109084
AAPG Bulletin, v. 96, no. 4 (April 2012), pp. 753–772 753
pany, Phillips Petroleum Company, and Conoco-Phillips. His research and application focus in
Roland Kirschner, Bob Lee, and Elliott Hough these positions includes structure and tectonics,seismic interpretation, reservoir description,geomechanics, and fracture characterization. Heis currently the manager of the Structure andGeomechanics Group in ConocoPhillips Subsur-face Technology. He is an AAPG distinguishedlecturer, a Geological Society of America honor-ary fellow, and is an adjunct professor at theUniversity of Wyoming and consulting professorat Stanford University.Patricia Allwardt � ConocoPhillipsSubsurface Technology, PR2014, 600 N.Dairy Ashford, Houston, Texas;[email protected]
Patricia Allwardt received her B.S. degree inearth and planetary sciences from HarvardUniversity and her Ph.D. in structural geologyand geomechanics from Stanford University.During work on this paper, Tricia was a memberof the Subsurface Technology Organization atConocoPhillips focused primarily on integratingstructural analysis, fracture characterization,and geomechanics into reservoir performance.Tricia is currently working in ConocoPhillips’Gulf of Mexico Exploration Group.
Pijush Paul � ConocoPhillips SubsurfaceTechnology, PR2014, 600 N. Dairy Ashford, Hous-ton, Texas; [email protected]
Pijush Paul works in the structure and geome-chanics team of ConocoPhillips SubsurfaceTechnology Group in Houston. He leads the
ABSTRACT
It is becoming widely recognized that a relationship existsbetween stress, stress heterogeneity, and the permeability ofsubsurface fractures and faults. We present an analysis of theSouth Sumatra Suban gas field, developed mainly in fracturedcarbonate and crystalline basement, where active deformationhas partitioned the reservoir into distinct structural and stressdomains. These domains have differing geomechanical andstructural attributes that control the permeability architectureof the field.
The field is a composite of Paleogene extensional elementsthat have been modified by Neogene contraction to producebasement-rooted forced folds and neoformed thrusts. Reservoir-scale faults were interpreted in detail along thewestern flank ofthe field and reveal a classic oblique-compressional geometry.
Bulk reservoir performance is governed by the local stressarchitecture that acts on existing faults and their fracture dam-age zones to alter their permeability and, hence, their access todistributed gas. Reservoir potential is most enhanced in areasthat have large numbers of fractureswith high ratios of shear tonormal stress. This occurs in areas of the field that are in astrike-slip stress style. Comparatively, reservoir potential islower in areas of the field that are in a thrust-fault stress stylewhere fewer fractures with high shear-to-normal stress ratiosexist. Achieving the highest well productivity relies on tappinginto critically stressed faults and their associated fracture
team’s computational geomechanics program.His other projects focus on providing geome-chanical models of reservoirs for completionand production optimization. He holds a Ph.D. ingeomechanics and an M.S. degree in petroleumengineering from Stanford University, an MTechdegree in applied geophysics from the IndianInstitute of Technology, and a B.S. degree in
t received
geology and physics from St. Xavier College,India.
Chris Zahm � ConocoPhillips SubsurfaceTechnology, PR2014, 600 N. Dairy Ashford,Houston, Texas; present address: University ofTexas, Bureau of Economic Geology, Austin,Texas; [email protected]
Chris Zahm received his B.S. degree in geologyfrom the University of Wisconsin, his M.S. degreein geology from the University of Texas atAustin, and his Ph.D. from the Colorado Schoolof Mines. He was employed by ConocoPhillipsSubsurface Technology where he worked on res-ervoir structural geology projects before joiningthe Bureau of Economic Geology at the Uni-versity of Texas at Austin. He is currently a re-search associate as part of the BEG-ReservoirCharacterization Research Laboratory (RCRL)Industrial Associates program and adjunct pro-fessor in Jackson School of Geosciences.
Ray Reid Jr. � ConocoPhillips SubsurfaceTechnology, PR2014, 600 N. Dairy Ashford,Houston, Texas; [email protected]
Ray Reid Jr., is a senior petrophysical analystin ConocoPhillips Subsurface Technology. Rayjoined Phillips Petroleum Company in 1979where he supported geophysical acquisition andexploration. In 2003, Ray joined ConocoPhillips.Since 2003, Ray has led the petrophysical imageprocessing and interpretation function forConocoPhillips.
Hugh Alley � ConocoPhillips Indonesia Inc.,Ltd., Jakarta, Indonesia
Hugh Alley received his B.Sc. and M.Sc. degrees ingeology from the University of Manitoba in 1975and 1982, respectively. He has held various tech-nical and supervisory positions in the Explorationand Development departments of ConocoPhil-lips, Gulf Canada Resources, Maxus Energy, andAmoco. Hugh is currently a principal geologistsupporting unconventional shale oil and shalegas exploration in ConocoPhillips Canada.
Roland Kirschner � ConocoPhillips Indo-nesia Inc., Ltd., Jakarta, Indonesia
Roland Kirschner is an exploration geologist withConocoPhillips in Perth, Australia. He receivedhis M.S. degree in geology from Louisiana StateUniversity. Since joining Phillips Petroleum in1999, he has held various technical positions withinPhillips and, later, within ConocoPhillips both in
754 Suban Gas Field, Sumatra, Indonesia
damage zones. Two wellbores have been drilled based on thisconcept, and each shows a three- to seven-fold improvementin flow potential.
INTRODUCTION
The relationship between stress, stress variability, active faults,and the permeability of natural fracture systems in the sub-surface is becoming widely recognized. Barton et al. (1995)presented initial evidence for elevated fluid flow associatedwith potentially active faults in boreholes in crystalline rock.Zoback (2007) expands this discussion to consider faults at avariety of scales in different geologic environments. Tamagawaand Pollard (2008) discuss a fractured basement gas reservoirwhere fracture-controlled well performance is significantly im-pacted by stress fields perturbed by faults. Also, active defor-mation, as manifested in faulting, can significantly alter the re-gional pattern of horizontal stress. Castillo and Zoback (1994)discuss how recent seismic movement along faults changes thelocal stress configuration at the scale of oil field structures insouthern California. Active deformation related to fault move-ment generates fractures and results in local stress-field pertur-bations, both ofwhich affect permeability in the vicinity of faults.The purpose of this article is to present an analysis of subsur-face data from a fractured gas field that strongly reinforces thesethemes and shows how integration of these concepts can beused to assess reservoir potential and drill wells with higherproductivities.
GEOLOGIC BACKGROUND
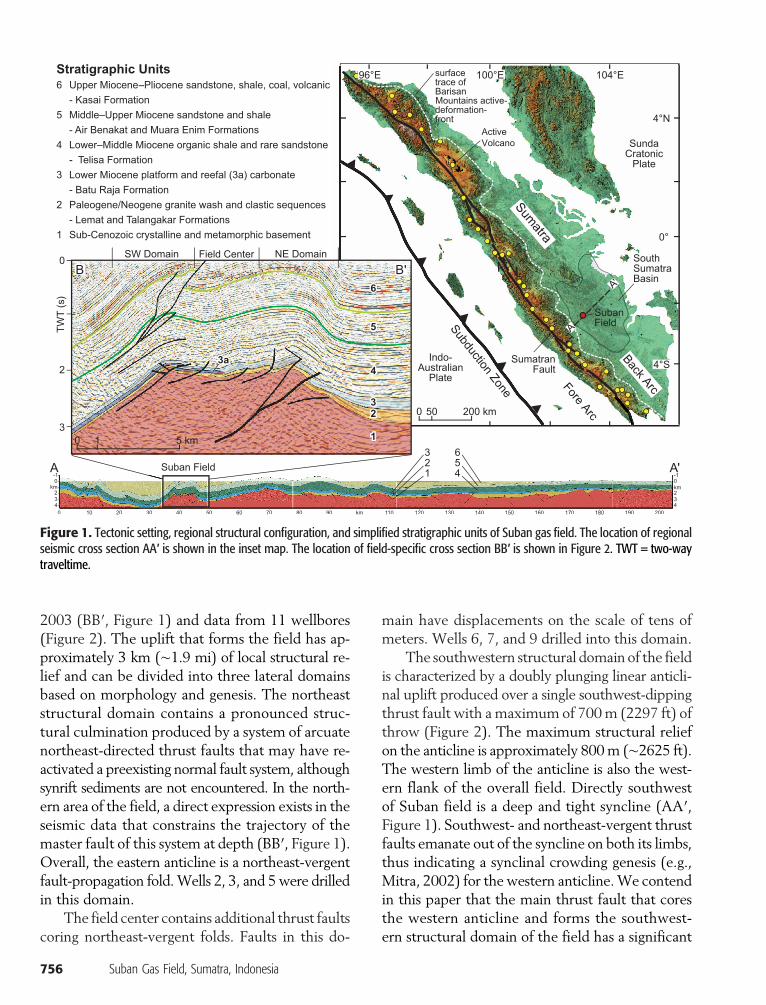
Suban field is located along the southwestern edge of theSouth Sumatra Basin in south-central Sumatra. The field pro-duces wet gas from compressionally uplifted fractured crys-talline and metamorphic basement and overlying clastic andreefal carbonate rocks (stratigraphic units [SUs] 1, 2, and 3;Figure 1).
The island of Sumatra owes its present-day complex tec-tonic architecture to northeast-directed oblique subduction ofthe Indo-Australian plate along its southwestern margin. Sig-nificant crustal decoupling and strain partitioning occur alongthis zone with the fore-arc region southwest of the Sumatranfault moving in a northerly direction, along with the subductingIndo-Australian plate (Figure 1) (Milsom, 2005). This obliquelateral movement interacts with the Sunda craton along the
domestic and overseas locations. Besides afascination with fractured reservoirs systems, hismain interests focus on the analysis and mod-eling of the sedimentology and stratigraphy ofshallow-water to deep-marine clastic reservoirsystems.
Bob Lee � ConocoPhillips Indonesia Inc., Ltd.,Jakarta, Indonesia
Bob Y. Q. Lee received his B.S. degree in chemicalengineering from the University of Saskatch-ewan in 1980. He has held reservoir engineeringpositions with various companies includingConocoPhillips Indonesia and is currently withInterOil. His technical interest is to integrateclassical and analytical reservoir engineeringtechniques with the modern-day workflowof reservoir characterization and simulation.
Elliott Hough � ConocoPhillips IndonesiaInc., Ltd., Jakarta, Indonesia
Elliott Hough received his B.S. degree in me-chanical engineering from Colorado State Univer-sity in 1980. He has held various technical andsupervisory reservoir engineering positions inPhillips Petroleum Company and ConocoPhillips.Elliott is currently a principal reservoir engineer,supporting unconventional shale oil and shalegas exploration in ConocoPhillips L48 Exploration.
ACKNOWLEDGEMENTS
We thank ConocoPhillips Technology, Conoco-Phillips Indonesia Inc., Badan Pelaksana KegiatanUsaha Hulu Minyak dan Gas Bumi (BPMIGAS),and partners Talisman Energy Inc. and PTPertamina (Persero) for permission to publishthe data and our findings. We thank Alan P.Morris, Laird B. Thompson, and especially MarkZoback for their thorough reviews of the manu-script that greatly improved its organization andtechnical message. Badley Geoscience TrapTesterwas used for structural interpretation and faultstress modeling, GeoMechanics International SFIBand MohrFracs were used for wellbore stressand fracture characterization, and ParadigmGOCAD was used for structural modeling anddata integration. The information containedherein is for information purposes only, and norepresentation or warranty is provided as toits content and accuracy.The AAPG Editor thanks the following reviewersfor their work on this paper: Alan P. Morris,Laird B. Thompson, and Mark D. Zoback.
dextral transcurrent Sumatran fault and Barisan Mountainstranspressional belt that run the length of Sumatra. Estimatesof lateral displacement along the Sumatran fault range greatly,but 150 km (93 mi) is a widely cited value (McCarthy andElders, 1997). Modern contractional deformation along theBarisan Mountains spreads to the northeast, involving a wideswath adjacent to the core of the range and includes our areaof study. Global positioning system observations along this zoneindicate complex tectonic movements, with northeast to north-west azimuths over a 150-km (93-mi) width as measured or-thogonally to the Sumatran fault (Barber and Crow, 2005;Milsom, 2005).
The South Sumatra Basin is one of five basins that devel-oped northeast of the present-day Sumatra volcanic arc, Barisanmountain chain, and Sumatran fault. The basins formed as riftsystems in the early Cenozoic in a terrain floored by Mesozoicgranitic, volcanic, and metasedimentary rocks. The dominantextensional fault fabric in the South Sumatra Basin trendsnortheast-southwest, with a subordinate trend to the north-northwest–south-southeast. The main phase of basin develop-ment occurred in the late Eocene to the earlyOligocene (Barberand Crow, 2005). This first phase of sedimentation occurredas infilling of structural depressions by clastic debris erodedfromexposed basement blocks (SU2) (Figure 1) (De Smet andBarber, 2005). Thermal subsidence followed rifting in the lateOligocene to the early Miocene and allowed a marine incur-sion that introduced fine-grained marine sequences and reefalbuildups on high-standing blocks (SU3). Continued subsi-dence drowned the carbonate system and resulted in deposi-tion of organic-rich deep-water shales and marls that later be-came the gas-prone hydrocarbon source rocks and top sealsof the system (SU4). Northeast-directed compression and tec-tonic inversion began in the mid-Miocene, and terrestrial sedi-ments prograded from the southwest, resulting in depositionof SU5. Stratigraphic unit 6 (SU6) spans the related transitionfrom marginal marine to erosional emergence and containscoal beds and terrestrial clastic deposits. South Sumatra has acomplex history of volcanicity that spans the Cenozoic Era andcontinues today (Crow, 2005; Gasparon, 2005). Stratigraphicunit 6 contains numerous tuff and volcaniclastic beds.
The degree of recent strike-slip dissection in the region ofSuban field is unclear, but Pulunggono (1986) documents severalpresumed lateral surface offsets with the southwestern part of thebasin. Figure 1 (AA′) shows preserved extension to the northeastand increased inversion and contraction to the southwest.
The complex architecture of Suban field was unraveledusing a prestack depth-migrated seismic volume acquired in
Hennings et al. 755
2003 (BB′, Figure 1) and data from 11 wellbores(Figure 2). The uplift that forms the field has ap-proximately 3 km (∼1.9 mi) of local structural re-lief and can be divided into three lateral domainsbased on morphology and genesis. The northeaststructural domain contains a pronounced struc-tural culmination produced by a system of arcuatenortheast-directed thrust faults that may have re-activated a preexisting normal fault system, althoughsynrift sediments are not encountered. In the north-ern area of the field, a direct expression exists in theseismic data that constrains the trajectory of themaster fault of this system at depth (BB′, Figure 1).Overall, the eastern anticline is a northeast-vergentfault-propagation fold.Wells 2, 3, and 5were drilledin this domain.
The field center contains additional thrust faultscoring northeast-vergent folds. Faults in this do-
756 Suban Gas Field, Sumatra, Indonesia
main have displacements on the scale of tens ofmeters. Wells 6, 7, and 9 drilled into this domain.
The southwestern structural domain of the fieldis characterized by a doubly plunging linear anticli-nal uplift produced over a single southwest-dippingthrust fault with a maximum of 700m (2297 ft) ofthrow (Figure 2). The maximum structural reliefon the anticline is approximately 800m (∼2625 ft).The western limb of the anticline is also the west-ern flank of the overall field. Directly southwestof Suban field is a deep and tight syncline (AA′,Figure 1). Southwest- and northeast-vergent thrustfaults emanate out of the syncline on both its limbs,thus indicating a synclinal crowding genesis (e.g.,Mitra, 2002) for the western anticline.We contendin this paper that the main thrust fault that coresthe western anticline and forms the southwest-ern structural domain of the field has a significant
Figure 1. Tectonic setting, regional structural configuration, and simplified stratigraphic units of Suban gas field. The location of regionalseismic cross section AA′ is shown in the inset map. The location of field-specific cross section BB′ is shown in Figure 2. TWT = two-waytraveltime.
component of dextral strike slip in addition to thedip slip.
The main thrust faults that form both theeastern and western anticlinal folds of Suban fieldalter the topographic surface; this, insights from re-gional tectonic indicators, and our wellbore stressanalysis and geomechanical modeling discussed be-low cause us to propose that the geologic processesthat formed the field are active today.
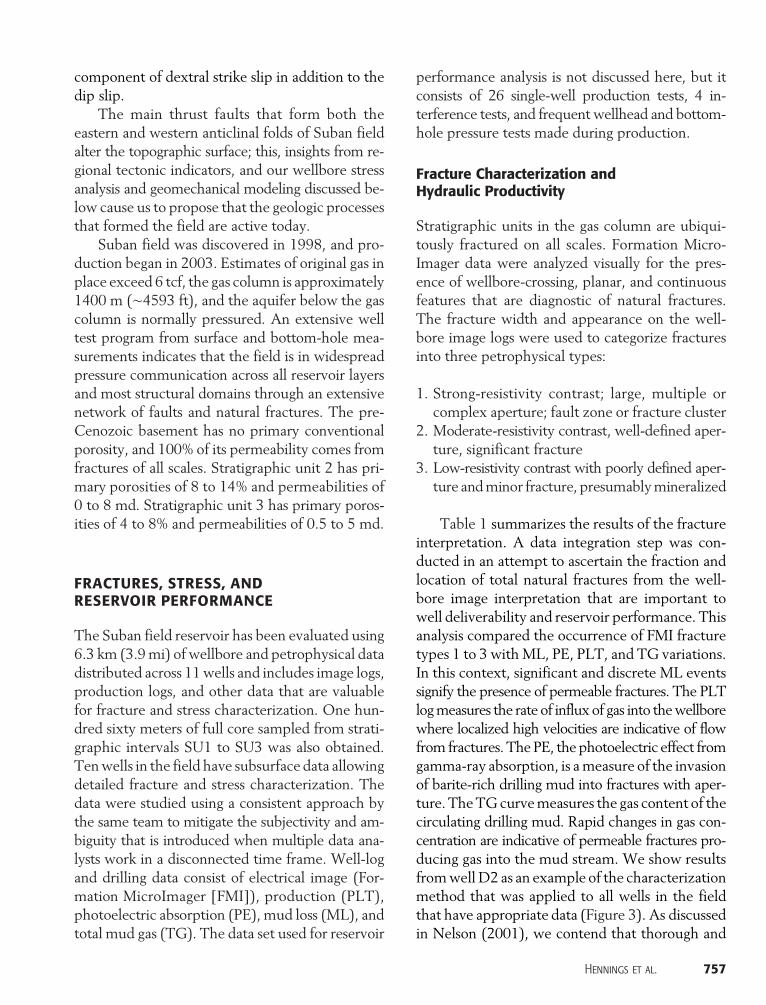
Suban field was discovered in 1998, and pro-duction began in 2003. Estimates of original gas inplace exceed 6 tcf, the gas column is approximately1400 m (∼4593 ft), and the aquifer below the gascolumn is normally pressured. An extensive welltest program from surface and bottom-hole mea-surements indicates that the field is in widespreadpressure communication across all reservoir layersand most structural domains through an extensivenetwork of faults and natural fractures. The pre-Cenozoic basement has no primary conventionalporosity, and 100% of its permeability comes fromfractures of all scales. Stratigraphic unit 2 has pri-mary porosities of 8 to 14% and permeabilities of0 to 8 md. Stratigraphic unit 3 has primary poros-ities of 4 to 8% and permeabilities of 0.5 to 5 md.
FRACTURES, STRESS, ANDRESERVOIR PERFORMANCE
The Suban field reservoir has been evaluated using6.3 km (3.9mi) of wellbore and petrophysical datadistributed across 11wells and includes image logs,production logs, and other data that are valuablefor fracture and stress characterization. One hun-dred sixty meters of full core sampled from strati-graphic intervals SU1 to SU3 was also obtained.Tenwells in the field have subsurface data allowingdetailed fracture and stress characterization. Thedata were studied using a consistent approach bythe same team to mitigate the subjectivity and am-biguity that is introduced when multiple data ana-lysts work in a disconnected time frame. Well-logand drilling data consist of electrical image (For-mation MicroImager [FMI]), production (PLT),photoelectric absorption (PE), mud loss (ML), andtotal mud gas (TG). The data set used for reservoir
performance analysis is not discussed here, but itconsists of 26 single-well production tests, 4 in-terference tests, and frequent wellhead and bottom-hole pressure tests made during production.
Fracture Characterization andHydraulic Productivity
Stratigraphic units in the gas column are ubiqui-tously fractured on all scales. Formation Micro-Imager data were analyzed visually for the pres-ence of wellbore-crossing, planar, and continuousfeatures that are diagnostic of natural fractures.The fracture width and appearance on the well-bore image logs were used to categorize fracturesinto three petrophysical types:
1. Strong-resistivity contrast; large, multiple orcomplex aperture; fault zone or fracture cluster
2. Moderate-resistivity contrast, well-defined aper-ture, significant fracture
3. Low-resistivity contrast with poorly defined aper-ture andminor fracture, presumablymineralized
Table 1 summarizes the results of the fractureinterpretation. A data integration step was con-ducted in an attempt to ascertain the fraction andlocation of total natural fractures from the well-bore image interpretation that are important towell deliverability and reservoir performance. Thisanalysis compared the occurrence of FMI fracturetypes 1 to 3 with ML, PE, PLT, and TG variations.In this context, significant and discrete ML eventssignify the presence of permeable fractures. The PLTlogmeasures the rate of influx of gas into thewellborewhere localized high velocities are indicative of flowfrom fractures. The PE, the photoelectric effect fromgamma-ray absorption, is ameasure of the invasionof barite-rich drilling mud into fractures with aper-ture. TheTGcurvemeasures the gas content of thecirculating drilling mud. Rapid changes in gas con-centration are indicative of permeable fractures pro-ducing gas into the mud stream. We show resultsfromwell D2 as an example of the characterizationmethod that was applied to all wells in the fieldthat have appropriate data (Figure 3). As discussedin Nelson (2001), we contend that thorough and
Hennings et al. 757
758Suban
GasField,Sum
atra,Indonesia
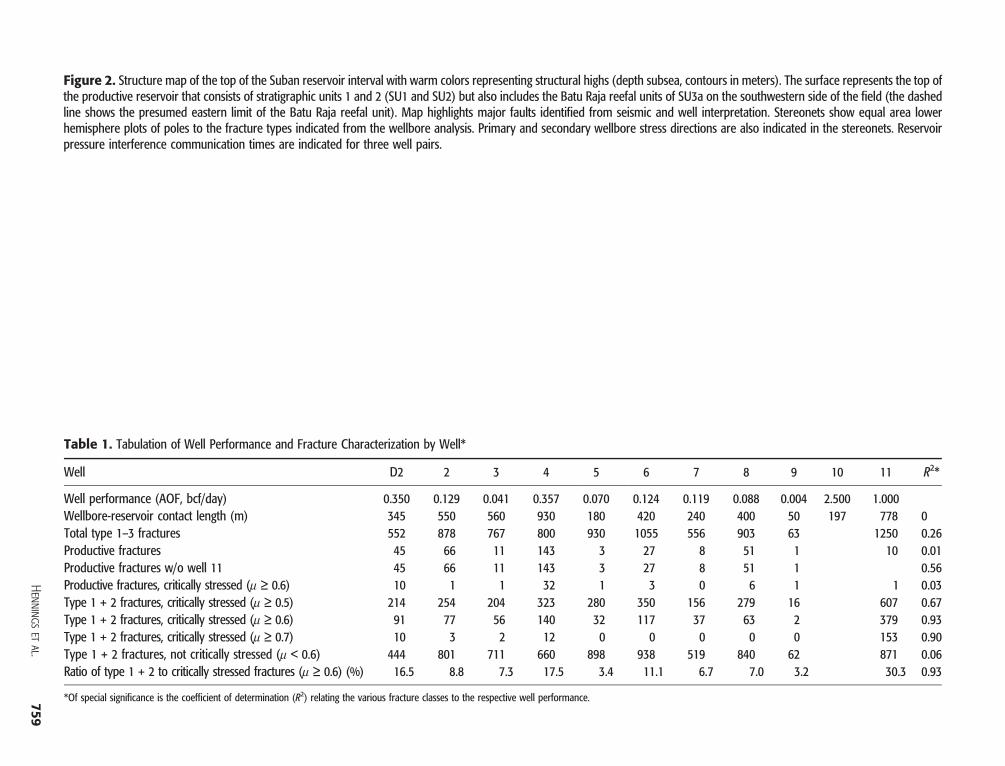
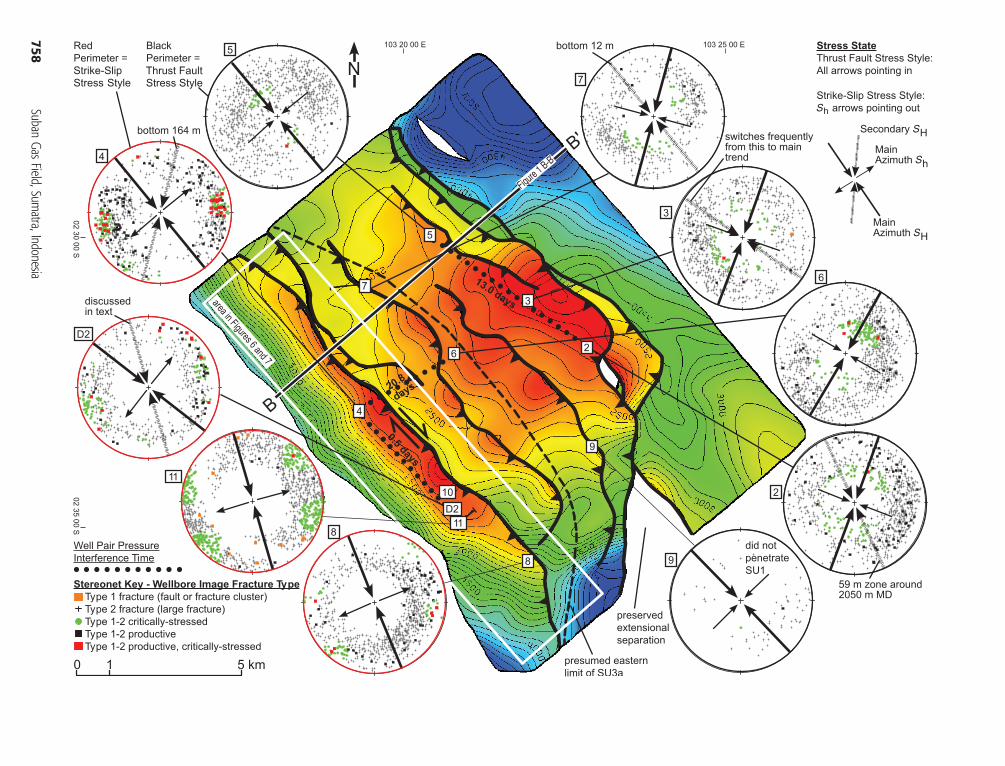
Figure 2. Structure map of the top of the Suban reservoir interval with warm colors representing structural highs (depth subsea, contours in meters). The surface represents the top ofthe productive reservoir that consists of stratigraphic units 1 and 2 (SU1 and SU2) but also includes the Batu Raja reefal units of SU3a on the southwestern side of the field (the dashedline shows the presumed eastern limit of the Batu Raja reefal unit). Map highlights major faults identified from seismic and well interpretation. Stereonets show equal area lowerhemisphere plots of poles to the fracture types indicated from the wellbore analysis. Primary and secondary wellbore stress directions are also indicated in the stereonets. Reservoirpressure interference communication times are indicated for three well pairs.
Table 1. Tabulation of Well Performance and Fracture Characterization by Well*
Well D2 2 3 4 5 6 7 8 9 10 11 R2*
Well performance (AOF, bcf/day) 0.350 0.129 0.041 0.357 0.070 0.124 0.119 0.088 0.004 2.500 1.000Wellbore-reservoir contact length (m) 345 550 560 930 180 420 240 400 50 197 778 0Total type 1–3 fractures 552 878 767 800 930 1055 556 903 63 1250 0.26Productive fractures 45 66 11 143 3 27 8 51 1 10 0.01Productive fractures w/o well 11 45 66 11 143 3 27 8 51 1 0.56Productive fractures, critically stressed (m ≥ 0.6) 10 1 1 32 1 3 0 6 1 1 0.03Type 1 + 2 fractures, critically stressed (m ≥ 0.5) 214 254 204 323 280 350 156 279 16 607 0.67Type 1 + 2 fractures, critically stressed (m ≥ 0.6) 91 77 56 140 32 117 37 63 2 379 0.93Type 1 + 2 fractures, critically stressed (m ≥ 0.7) 10 3 2 12 0 0 0 0 0 153 0.90Type 1 + 2 fractures, not critically stressed (m < 0.6) 444 801 711 660 898 938 519 840 62 871 0.06Ratio of type 1 + 2 to critically stressed fractures (m ≥ 0.6) (%) 16.5 8.8 7.3 17.5 3.4 11.1 6.7 7.0 3.2 30.3 0.93
*Of special significance is the coefficient of determination (R2) relating the various fracture classes to the respective well performance.
Henningsetal.
759
760Suban
GasField,Sum
atra,Indonesia
Figu
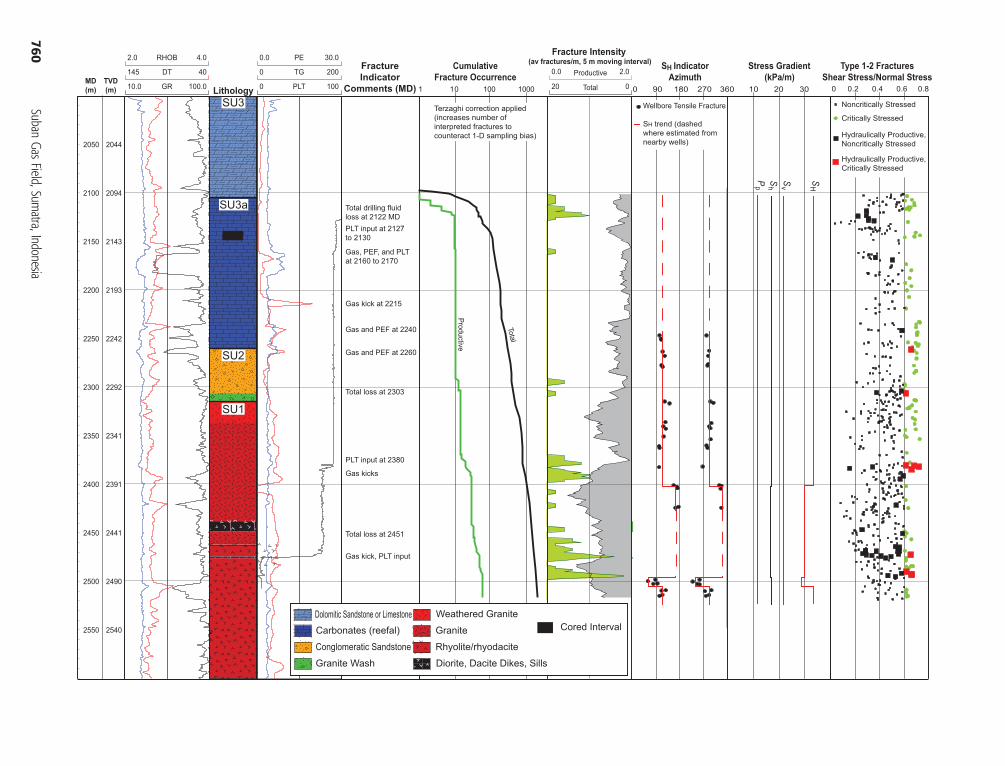
re3.
Exam
pleofthewellboredatacompilation,fractureandstresscharacterization,andgeom
echanicalanalysis
conductedforallwellsinthestu
dy(wellD
2show
n).Includedin
thecompilationarepetro
physicalcurves,lithology,d
rilling,andproductionindicators
offractureperm
eability,fractureinterpretation,
stress
orientationandmagnitude,and
geo-
mechanicalanalysis.M
D=measureddepth;TVD=totalverticaldepth;RH
OB=density
(ingram
spercubiccentimeter);DT
=sonictraveltime(in
microseconds
perfoot);
GR=gamma
ray(API);PE
=photoelectric
effect(API);TG
=totalgas
(API);PLT=productionlog(%
);S H
=maximum
horizontalstress;S
h=minimum
horizontalstress;S
v=verticalstress;P
p=pore
pressure;SU=stratigraphicunit.
consistent integration and visual compilation of alldata relating to fracture occurrence, permeabilitysignature, and geomechanical character are essen-tial in characterizing the hydraulic nature of frac-ture systems. On the left of Figure 3, we showtypical log data and the lithology as determinedfrom drill cuttings and core. Indicators of potentialfracture hydraulic importance (ML, PE, PLT, andTG) are shown on the right of the lithology. Frac-tures picked from the image data are shown as tracksof cumulative occurrence as well as fracture inten-sity. These curves are shown with Terzaghi correc-tion applied to compensate for one-dimensionalsampling bias (Terzaghi, 1965; Peacock et al., 2003).Fracture intensities, reported as the number inter-secting the wellbore per 5 m (16.4 ft), generallyincrease downward. Stratigraphic unit 2 and SU3ahave fracture intensities in the range of 1 to 7 per5 m and an average of 4 per 5 m. Fracture inten-sities in basement range from 1 to 15 per 5 m, withan average of 8 per 5 m.
We assume that fractures identified from theFMI logmay significantly contribute to productionif they are associatedwith anomalies in one ormoreof the ML, PE, PLT, and TG data sets. In contrastto wellbore image data that can locate fractureswith centimeter accuracy, these indicators of hy-draulic contribution operate at a resolution of 1 totens ofmeters and are, therefore, quite general. Forthis reason, we choose to discuss fracture intensi-ties at the scale of 5-m sampling windows as mea-sured along the wellbore. An additional limitationis that ML, PE, and TG data are all influenced bydrilling and mud-handling techniques that are dif-ficult to interpret quantitatively. The result of ourdata integration is a semiquantitative discrimina-tion of hydraulically significant fractures (produc-tive fractures) from the total population of fracturetypes 1 to 2 (see cumulative fracture occurrenceand fracture intensity curves, Figure 3). The num-ber of productive fractures ranges from a high of143 in well 4 (17.9% of the total fractures in thatwell) to a low of 3 in well 5 (0.3% of total fractures)(Table 1). Although theymost certainly contributeto or dominate distributed gas storage in SU1, type3 fractures are not considered in our geomechani-cal analysis because of our interpretation that they
Hennings et al. 761
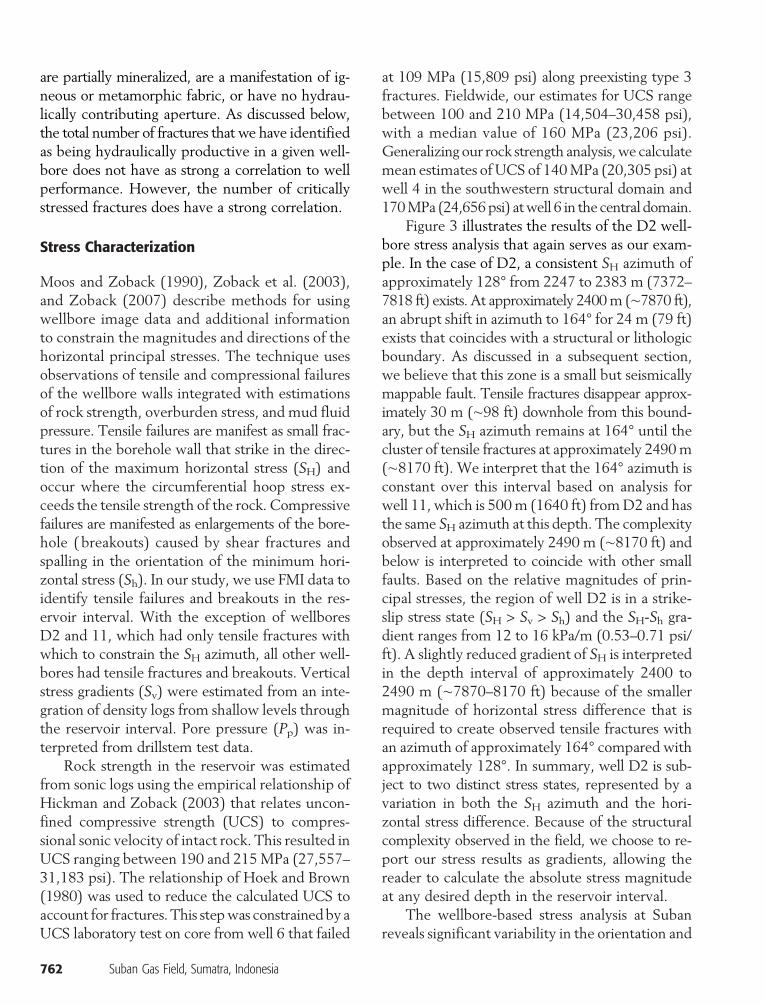
are partially mineralized, are a manifestation of ig-neous or metamorphic fabric, or have no hydrau-lically contributing aperture. As discussed below,the total number of fractures that we have identifiedas being hydraulically productive in a given well-bore does not have as strong a correlation to wellperformance. However, the number of criticallystressed fractures does have a strong correlation.
Stress Characterization
Moos and Zoback (1990), Zoback et al. (2003),and Zoback (2007) describe methods for usingwellbore image data and additional informationto constrain the magnitudes and directions of thehorizontal principal stresses. The technique usesobservations of tensile and compressional failuresof the wellbore walls integrated with estimationsof rock strength, overburden stress, and mud fluidpressure. Tensile failures are manifest as small frac-tures in the borehole wall that strike in the direc-tion of the maximum horizontal stress (SH) andoccur where the circumferential hoop stress ex-ceeds the tensile strength of the rock. Compressivefailures are manifested as enlargements of the bore-hole ( breakouts) caused by shear fractures andspalling in the orientation of the minimum hori-zontal stress (Sh). In our study, we use FMI data toidentify tensile failures and breakouts in the res-ervoir interval. With the exception of wellboresD2 and 11, which had only tensile fractures withwhich to constrain the SH azimuth, all other well-bores had tensile fractures and breakouts. Verticalstress gradients (Sv) were estimated from an inte-gration of density logs from shallow levels throughthe reservoir interval. Pore pressure (Pp) was in-terpreted from drillstem test data.
Rock strength in the reservoir was estimatedfrom sonic logs using the empirical relationship ofHickman and Zoback (2003) that relates uncon-fined compressive strength (UCS) to compres-sional sonic velocity of intact rock. This resulted inUCS ranging between 190 and 215MPa (27,557–31,183 psi). The relationship of Hoek and Brown(1980) was used to reduce the calculated UCS toaccount for fractures. This stepwas constrainedby aUCS laboratory test on core from well 6 that failed
762 Suban Gas Field, Sumatra, Indonesia
at 109 MPa (15,809 psi) along preexisting type 3fractures. Fieldwide, our estimates for UCS rangebetween 100 and 210 MPa (14,504–30,458 psi),with a median value of 160 MPa (23,206 psi).Generalizing our rock strength analysis,we calculatemean estimates of UCS of 140MPa (20,305 psi) atwell 4 in the southwestern structural domain and170MPa (24,656psi) atwell 6 in the central domain.
Figure 3 illustrates the results of the D2 well-bore stress analysis that again serves as our exam-ple. In the case of D2, a consistent SH azimuth ofapproximately 128° from 2247 to 2383 m (7372–7818 ft) exists. At approximately 2400m (∼7870 ft),an abrupt shift in azimuth to 164° for 24 m (79 ft)exists that coincides with a structural or lithologicboundary. As discussed in a subsequent section,we believe that this zone is a small but seismicallymappable fault. Tensile fractures disappear approx-imately 30 m (∼98 ft) downhole from this bound-ary, but the SH azimuth remains at 164° until thecluster of tensile fractures at approximately 2490m(∼8170 ft). We interpret that the 164° azimuth isconstant over this interval based on analysis forwell 11, which is 500m (1640 ft) fromD2 and hasthe same SH azimuth at this depth. The complexityobserved at approximately 2490 m (∼8170 ft) andbelow is interpreted to coincide with other smallfaults. Based on the relative magnitudes of prin-cipal stresses, the region of well D2 is in a strike-slip stress state (SH > Sv > Sh) and the SH-Sh gra-dient ranges from 12 to 16 kPa/m (0.53–0.71 psi/ft). A slightly reduced gradient of SH is interpretedin the depth interval of approximately 2400 to2490 m (∼7870–8170 ft) because of the smallermagnitude of horizontal stress difference that isrequired to create observed tensile fractures withan azimuth of approximately 164° compared withapproximately 128°. In summary, well D2 is sub-ject to two distinct stress states, represented by avariation in both the SH azimuth and the hori-zontal stress difference. Because of the structuralcomplexity observed in the field, we choose to re-port our stress results as gradients, allowing thereader to calculate the absolute stress magnitudeat any desired depth in the reservoir interval.
The wellbore-based stress analysis at Subanreveals significant variability in the orientation and
architecture of current stress throughout the field(Figure 2). We believe that this variability is parti-tioned by the structural domains and varies withdepth as associated with reservoir-scale features.Stress analysis data from all wells in the south-western structural domain (wells D2, 4, 8, 11) in-dicate a primary strike-slip stress state and SH azi-muth that roughly parallel the trend of the structuralgrain of the domain. This represents an approxi-mately 90° rotation from the regional northeast–north-northeast SH trend identified in the north-eastern structural domain of the field and regionallythroughout the South Sumatra Basin (Heidbachet al., 2007). Wells D2 and 4 each have secondarynortherly trending SH azimuths that are related tominor faulting.
With the exception of the bottom interval ofwell 7, all other wells in the field (2, 3, 5, 6, 7, and9) are in a thrust-fault stress state. Although thedominant SH azimuth in the thrust-fault domain isnorth-northeast, wells 5 and 9 have a northwesternSH azimuth that is similar to the SH azimuth of thesouthwestern structural domain. Several wells ex-hibit a variable SH azimuth with depth. The bot-tom 12 m (39 ft) of well 7 and a 50-m (164-ft)-thick interval in well 2 also have a northwestern SHazimuth, and well 3 has the most complex localstress heterogeneity, with the SH azimuth rotatingfrom northeast to northwest at least six times overthe reservoir interval.
Fractures and Stress
Using our wellbore stress model, we assess theproximity of each type 1 to 2 fractures to the crit-ical stress state by calculating the ratio of shearstress to normal stress resolved on each fracturesurface—the slip tendency of Morris et al. (1996).Based on the laboratory friction experiments ofByerlee (1978) and the analyses of Townend andZoback (2000) and Zoback and Townend (2001),who studied stress states of fractures in crystallinerocks in settings of active deformation, we considerthe coefficient of sliding friction (m) of fractures of0.6 to represent the potential onset of stress-inducedslip that may produce dilation and, therefore, en-hance permeability. Fractures with m ≥ 0.6 are
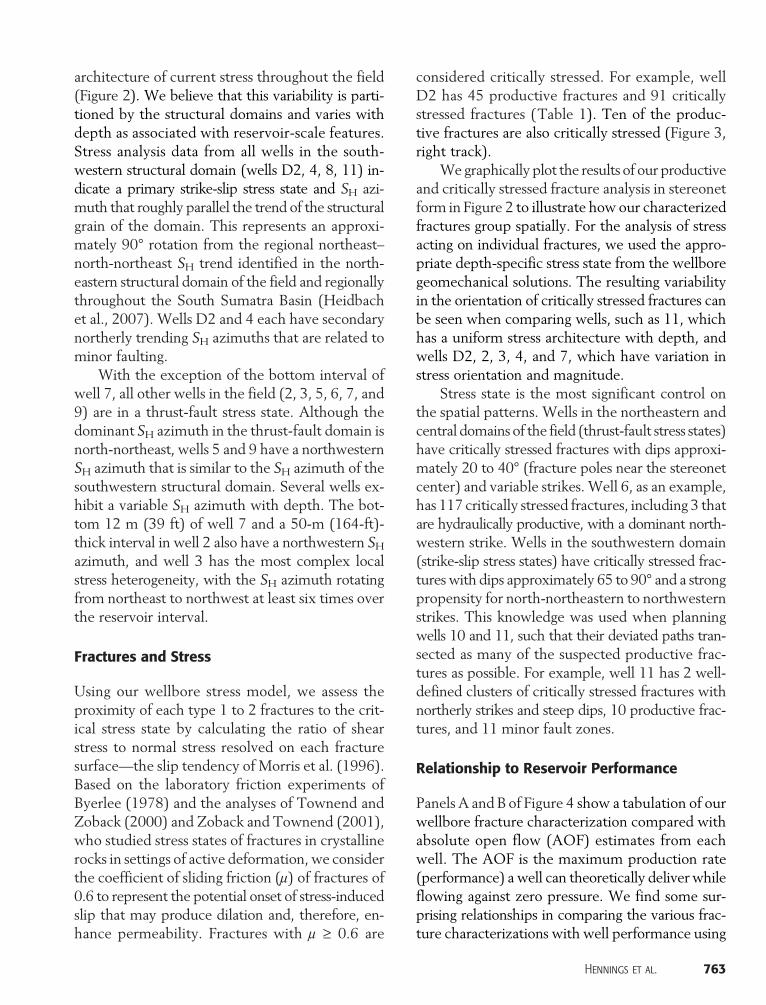
considered critically stressed. For example, wellD2 has 45 productive fractures and 91 criticallystressed fractures (Table 1). Ten of the produc-tive fractures are also critically stressed (Figure 3,right track).
We graphically plot the results of our productiveand critically stressed fracture analysis in stereonetform in Figure 2 to illustrate how our characterizedfractures group spatially. For the analysis of stressacting on individual fractures, we used the appro-priate depth-specific stress state from the wellboregeomechanical solutions. The resulting variabilityin the orientation of critically stressed fractures canbe seen when comparing wells, such as 11, whichhas a uniform stress architecture with depth, andwells D2, 2, 3, 4, and 7, which have variation instress orientation and magnitude.
Stress state is the most significant control onthe spatial patterns. Wells in the northeastern andcentral domains of the field (thrust-fault stress states)have critically stressed fractures with dips approxi-mately 20 to 40° (fracture poles near the stereonetcenter) and variable strikes. Well 6, as an example,has 117 critically stressed fractures, including 3 thatare hydraulically productive, with a dominant north-western strike. Wells in the southwestern domain(strike-slip stress states) have critically stressed frac-tures with dips approximately 65 to 90° and a strongpropensity for north-northeastern to northwesternstrikes. This knowledge was used when planningwells 10 and 11, such that their deviated paths tran-sected as many of the suspected productive frac-tures as possible. For example, well 11 has 2 well-defined clusters of critically stressed fractures withnortherly strikes and steep dips, 10 productive frac-tures, and 11 minor fault zones.
Relationship to Reservoir Performance
Panels A andB of Figure 4 show a tabulation of ourwellbore fracture characterization compared withabsolute open flow (AOF) estimates from eachwell. The AOF is the maximum production rate(performance) a well can theoretically deliver whileflowing against zero pressure. We find some sur-prising relationships in comparing the various frac-ture characterizations with well performance using
Hennings et al. 763
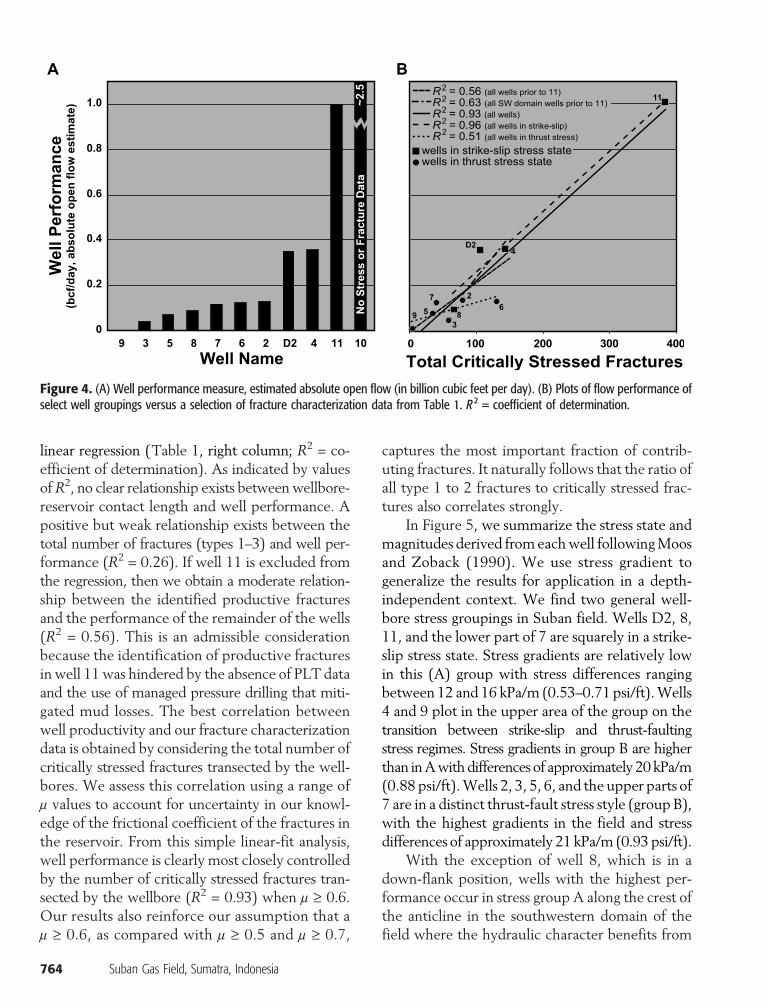
linear regression (Table 1, right column; R2 = co-efficient of determination). As indicated by valuesofR2, no clear relationship exists betweenwellbore-reservoir contact length and well performance. Apositive but weak relationship exists between thetotal number of fractures (types 1–3) and well per-formance (R2 = 0.26). If well 11 is excluded fromthe regression, then we obtain a moderate relation-ship between the identified productive fracturesand the performance of the remainder of the wells(R2 = 0.56). This is an admissible considerationbecause the identification of productive fracturesin well 11was hindered by the absence of PLT dataand the use of managed pressure drilling that miti-gated mud losses. The best correlation betweenwell productivity and our fracture characterizationdata is obtained by considering the total number ofcritically stressed fractures transected by the well-bores. We assess this correlation using a range ofm values to account for uncertainty in our knowl-edge of the frictional coefficient of the fractures inthe reservoir. From this simple linear-fit analysis,well performance is clearly most closely controlledby the number of critically stressed fractures tran-sected by the wellbore (R2 = 0.93) when m ≥ 0.6.Our results also reinforce our assumption that am ≥ 0.6, as compared with m ≥ 0.5 and m ≥ 0.7,
764 Suban Gas Field, Sumatra, Indonesia
captures the most important fraction of contrib-uting fractures. It naturally follows that the ratio ofall type 1 to 2 fractures to critically stressed frac-tures also correlates strongly.
In Figure 5, we summarize the stress state andmagnitudes derived fromeachwell followingMoosand Zoback (1990). We use stress gradient togeneralize the results for application in a depth-independent context. We find two general well-bore stress groupings in Suban field. Wells D2, 8,11, and the lower part of 7 are squarely in a strike-slip stress state. Stress gradients are relatively lowin this (A) group with stress differences rangingbetween 12 and 16 kPa/m (0.53–0.71 psi/ft).Wells4 and 9 plot in the upper area of the group on thetransition between strike-slip and thrust-faultingstress regimes. Stress gradients in group B are higherthan inAwithdifferences of approximately 20kPa/m(0.88 psi/ft).Wells 2, 3, 5, 6, and the upper parts of7 are in a distinct thrust-fault stress style (group B),with the highest gradients in the field and stressdifferences of approximately 21 kPa/m (0.93 psi/ft).
With the exception of well 8, which is in adown-flank position, wells with the highest per-formance occur in stress group A along the crest ofthe anticline in the southwestern domain of thefield where the hydraulic character benefits from
Figure 4. (A) Well performance measure, estimated absolute open flow (in billion cubic feet per day). (B) Plots of flow performance ofselect well groupings versus a selection of fracture characterization data from Table 1. R2 = coefficient of determination.

having high numbers of critically stressed fractures.Although no fracture or stress data were collectedin well 10, its location and strong performanceplace it in this group. The analysis described thusfar constitutes our fracture performance model forSuban field, which is based exclusively onwellboredata. Exploiting the bulk behavior of the field tomaximize well performance requires a deeper un-derstanding of the geologic controls on fracture for-mation. For this goal, we have closely examined thenature and hydraulic implications of the reservoir-scale faults in the southwestern structural domainof the field. We conclude that these faults and thefracture damage zones that surround them con-
stitute the hydraulic backbone of the southwesterndomain.
RESERVOIR-SCALE FAULTS AS THEHYDRAULIC BACKBONE
Fault Interpretation
The prestack depth-migrated three-dimensionalseismic volumewas interpreted in great detail overthe southwestern structural domain of the field toascertain the extent and character of reservoir-scale faults for integration with our fracture-basedreservoir performance model (Figure 6). The cri-teria for fault interpretation were consistent withfault offset observable over at least three consecu-tive inlines or crosslines and a geologically reason-able fault surface geometry and throw variation. Theinterpretation yielded 27 seismicallymappable faults,all with reverse separation, with map lengths rang-ing between 50 m (164 ft) and 1.2 km (0.8 mi),and strikes that are subparallel to the master faultof the southwestern domain (Figure 7). The faultsare concentrated in a 1 × 8–km (0.6 × 5–mi) areaalong the crest of the anticline that forms thesouthwestern domain. The faults can be divided intotwo sets based on strike: a north-northwest set of10 faults and a northwest set of 17 faults. The faultsdip between 55 and 80° and are predominantlyparallel to the master fault, although several haveantithetic dips. Maximum fault dip slip ranges be-tween 8 and 180 m (26–591 ft) with a linear re-gression of dip slip to map length of 0.08 and acoefficient of determination of 0.9. For most of thefaults, the upper tip cuts through SU1 to SU3 andinto SU4. We are uncertain about the downwardextent and trajectory of most of the faults becauseof poor seismic reflectivity at depth in SU1; there-fore, we have taken a conservative approach andinterpreted only fault surfaces for which we havedirect seismic evidence (Figure 6).
Our fracture model reinforces our interpreta-tion of the reservoir-scale faults. Well D2, for ex-ample, had significant drilling mud loss events at2122, 2303, and 2451m (6962, 7556, and8041 ft)measured depth, each generally coinciding with
Figure 5. Maximum horizontal stress (SH) versus minimumhorizontal stress (Sh) gradient plot summarizing the wellborestress state for wells in the Suban field. The shaded polygon rep-resents possible stress states (total stress) and related faultingstyle, and the ellipses show the results of our wellbore stressanalysis. The wells can be generalized to occur in two regions (Aand B) that are controlled by structural domains. The outsideboundary of the polygon is constrained by m = 0.8. The m = 0.6boundary is also indicated. Sv = vertical stress; m = coefficient ofsliding friction.
Hennings et al. 765
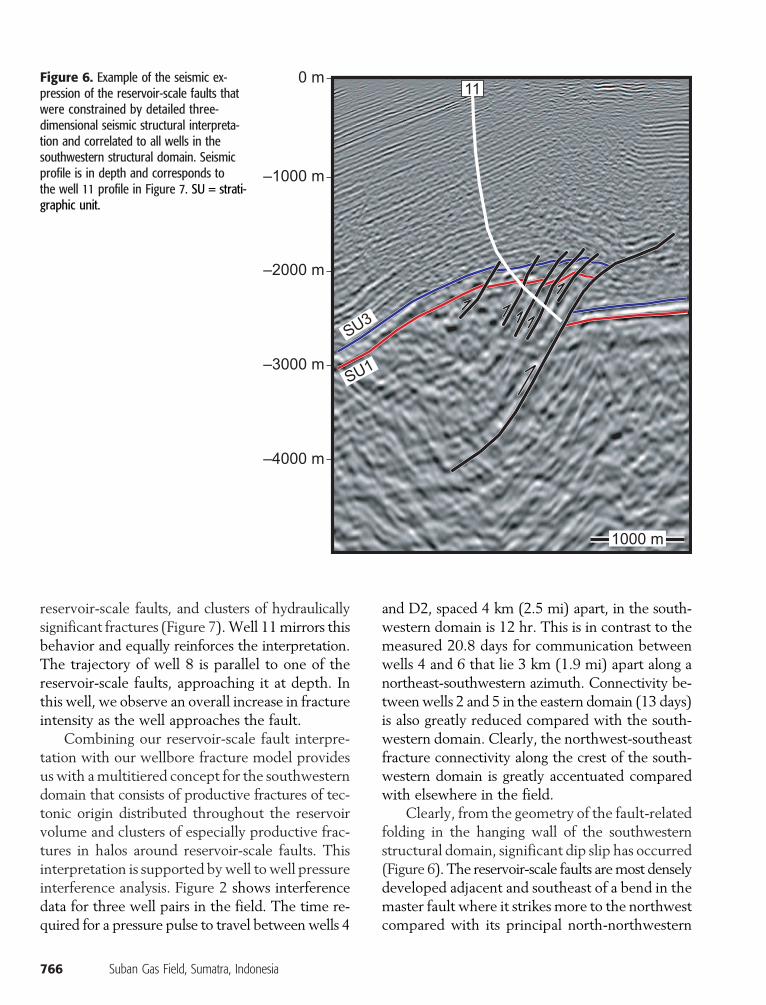
reservoir-scale faults, and clusters of hydraulicallysignificant fractures (Figure 7).Well 11mirrors thisbehavior and equally reinforces the interpretation.The trajectory of well 8 is parallel to one of thereservoir-scale faults, approaching it at depth. Inthis well, we observe an overall increase in fractureintensity as the well approaches the fault.
Combining our reservoir-scale fault interpre-tation with our wellbore fracture model providesus with amultitiered concept for the southwesterndomain that consists of productive fractures of tec-tonic origin distributed throughout the reservoirvolume and clusters of especially productive frac-tures in halos around reservoir-scale faults. Thisinterpretation is supported bywell to well pressureinterference analysis. Figure 2 shows interferencedata for three well pairs in the field. The time re-quired for a pressure pulse to travel between wells 4
766 Suban Gas Field, Sumatra, Indonesia
and D2, spaced 4 km (2.5 mi) apart, in the south-western domain is 12 hr. This is in contrast to themeasured 20.8 days for communication betweenwells 4 and 6 that lie 3 km (1.9 mi) apart along anortheast-southwestern azimuth. Connectivity be-tweenwells 2 and 5 in the eastern domain (13 days)is also greatly reduced compared with the south-western domain. Clearly, the northwest-southeastfracture connectivity along the crest of the south-western domain is greatly accentuated comparedwith elsewhere in the field.
Clearly, from the geometry of the fault-relatedfolding in the hanging wall of the southwesternstructural domain, significant dip slip has occurred(Figure 6). The reservoir-scale faults aremost denselydeveloped adjacent and southeast of a bend in themaster fault where it strikes more to the northwestcompared with its principal north-northwestern
Figure 6. Example of the seismic ex-pression of the reservoir-scale faults thatwere constrained by detailed three-dimensional seismic structural interpreta-tion and correlated to all wells in thesouthwestern structural domain. Seismicprofile is in depth and corresponds tothe well 11 profile in Figure 7. SU = strati-graphic unit.
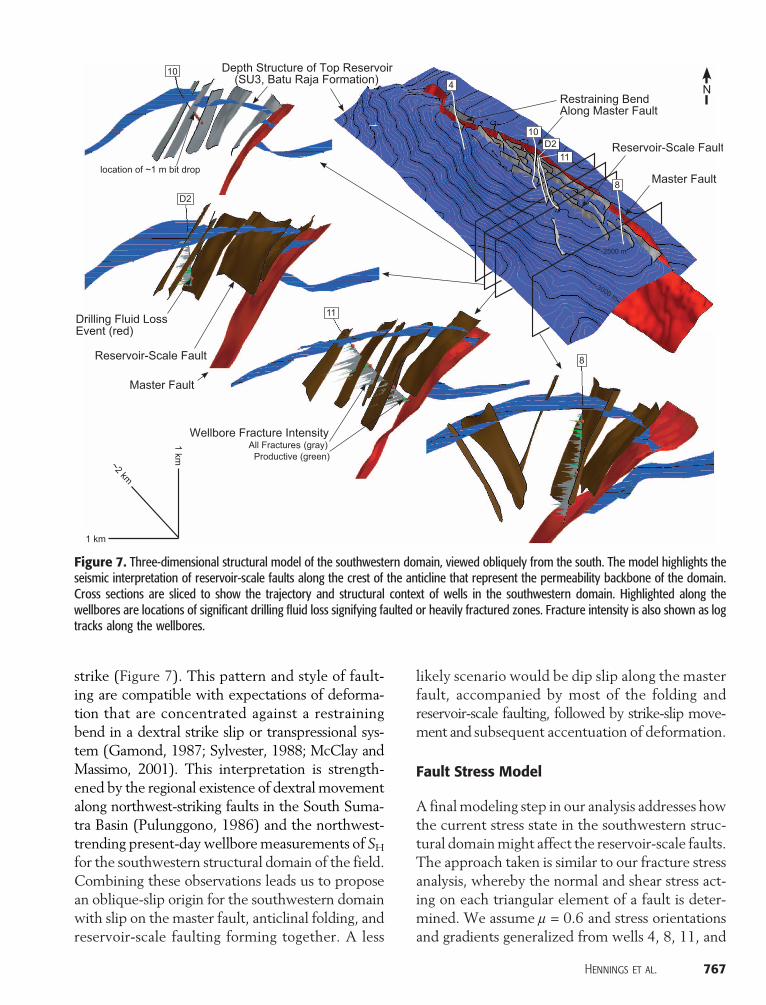
strike (Figure 7). This pattern and style of fault-ing are compatible with expectations of deforma-tion that are concentrated against a restrainingbend in a dextral strike slip or transpressional sys-tem (Gamond, 1987; Sylvester, 1988; McClay andMassimo, 2001). This interpretation is strength-ened by the regional existence of dextral movementalong northwest-striking faults in the South Suma-tra Basin (Pulunggono, 1986) and the northwest-trending present-day wellboremeasurements of SHfor the southwestern structural domain of the field.Combining these observations leads us to proposean oblique-slip origin for the southwestern domainwith slip on the master fault, anticlinal folding, andreservoir-scale faulting forming together. A less
likely scenario would be dip slip along the masterfault, accompanied by most of the folding andreservoir-scale faulting, followed by strike-slip move-ment and subsequent accentuation of deformation.
Fault Stress Model
A finalmodeling step in our analysis addresses howthe current stress state in the southwestern struc-tural domainmight affect the reservoir-scale faults.The approach taken is similar to our fracture stressanalysis, whereby the normal and shear stress act-ing on each triangular element of a fault is deter-mined. We assume m = 0.6 and stress orientationsand gradients generalized from wells 4, 8, 11, and
Figure 7. Three-dimensional structural model of the southwestern domain, viewed obliquely from the south. The model highlights theseismic interpretation of reservoir-scale faults along the crest of the anticline that represent the permeability backbone of the domain.Cross sections are sliced to show the trajectory and structural context of wells in the southwestern domain. Highlighted along thewellbores are locations of significant drilling fluid loss signifying faulted or heavily fractured zones. Fracture intensity is also shown as logtracks along the wellbores.
Hennings et al. 767
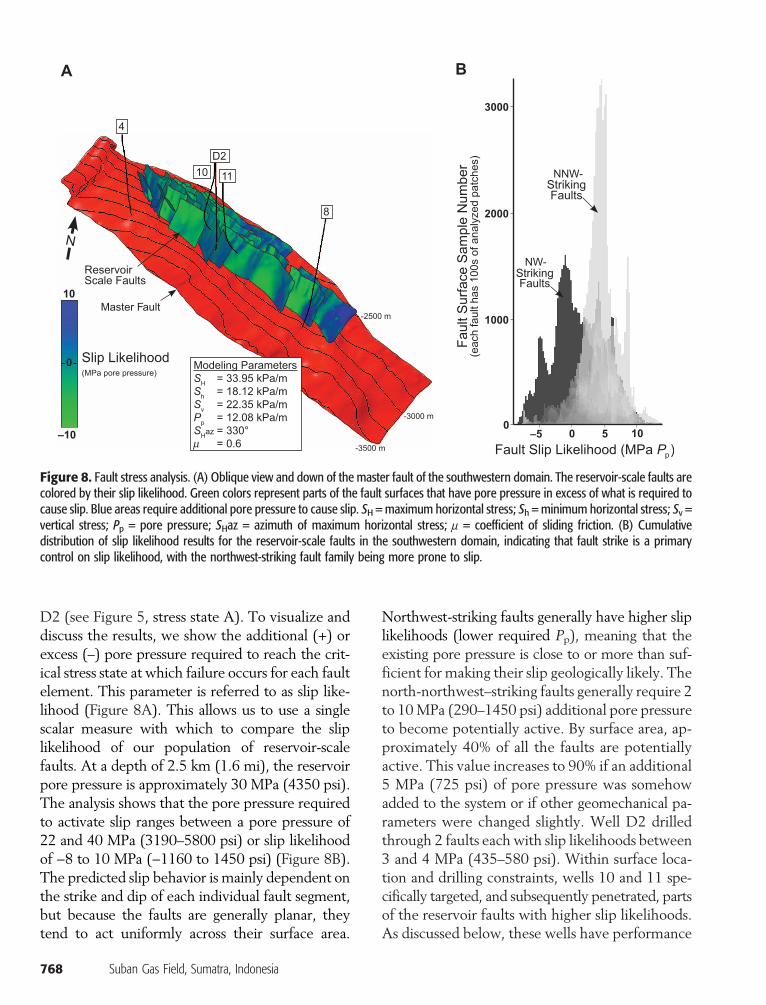
D2 (see Figure 5, stress state A). To visualize anddiscuss the results, we show the additional (+) orexcess (–) pore pressure required to reach the crit-ical stress state at which failure occurs for each faultelement. This parameter is referred to as slip like-lihood (Figure 8A). This allows us to use a singlescalar measure with which to compare the sliplikelihood of our population of reservoir-scalefaults. At a depth of 2.5 km (1.6 mi), the reservoirpore pressure is approximately 30 MPa (4350 psi).The analysis shows that the pore pressure requiredto activate slip ranges between a pore pressure of22 and 40 MPa (3190–5800 psi) or slip likelihoodof −8 to 10 MPa (−1160 to 1450 psi) (Figure 8B).The predicted slip behavior is mainly dependent onthe strike and dip of each individual fault segment,but because the faults are generally planar, theytend to act uniformly across their surface area.
768 Suban Gas Field, Sumatra, Indonesia
Northwest-striking faults generally have higher sliplikelihoods (lower required Pp), meaning that theexisting pore pressure is close to or more than suf-ficient for making their slip geologically likely. Thenorth-northwest–striking faults generally require 2to 10MPa (290–1450 psi) additional pore pressureto become potentially active. By surface area, ap-proximately 40% of all the faults are potentiallyactive. This value increases to 90% if an additional5 MPa (725 psi) of pore pressure was somehowadded to the system or if other geomechanical pa-rameters were changed slightly. Well D2 drilledthrough 2 faults each with slip likelihoods between3 and 4 MPa (435–580 psi). Within surface loca-tion and drilling constraints, wells 10 and 11 spe-cifically targeted, and subsequently penetrated, partsof the reservoir faults with higher slip likelihoods.As discussed below, these wells have performance
Figure 8. Fault stress analysis. (A) Oblique view and down of the master fault of the southwestern domain. The reservoir-scale faults arecolored by their slip likelihood. Green colors represent parts of the fault surfaces that have pore pressure in excess of what is required tocause slip. Blue areas require additional pore pressure to cause slip. SH = maximum horizontal stress; Sh = minimum horizontal stress; Sv =vertical stress; Pp = pore pressure; SHaz = azimuth of maximum horizontal stress; m = coefficient of sliding friction. (B) Cumulativedistribution of slip likelihood results for the reservoir-scale faults in the southwestern domain, indicating that fault strike is a primarycontrol on slip likelihood, with the northwest-striking fault family being more prone to slip.
estimates that are three to seven times higher thanany other wells previously drilled in the Suban field.
DISCUSSION
Stress Variability
In the absence of ample wellbore pressure leak-offand laboratory rock strength data, integrating ob-servations fromwellbore images to develop amodelof stress magnitude is an iterative process. Uncer-tainty in the calculated stress magnitude relatesmainly to the assumption of m. For wellbores in ourstudy that have both tensile fractures and break-outs, we find that using a m < 0.6 is inappropriatebecause it provides a solution window for stressmagnitude that is too narrow to explain thewellboredeformation features observed. Our approach is toassume a m value of 0.8 as the upper limit of fric-tional strength for the Suban fractured reservoirrock that allows us to compare wells across the field(Figure 5).
Published accounts of stress rotations within in-dividual fields generally show variations in SH azi-muth of 20 to 30° as compared with regional trends(Barton and Zoback, 1994). Tamagawa and Pollard(2008) document one well in their fractured granitegas field that has a 90° rotation in SH and concludethat the most significant stress rotation occurs inthe tip regions of active faults. In the Suban field,we find that stress perturbations occur at two scales.Local rotations in SH azimuth and alterations instress gradient occur commonly in our data set andcan be related to proximity of reservoir-scale faults.The more fundamental observation is that SH azi-muth, stress style, and stress gradient magnitudeare strongly partitioned into structural domains,which in turn are controlled by the larger faultsthat form the overall structure of the field.
We do not propose a definitive mechanism toexplain the variations in stress between the struc-tural domains, but we offer discussion on four sce-narios. The first scenario is that the overall upliftthat formed the field is undergoing complex de-formation producedby a superposition of regionallydriven thrust and strike-slip elements that natu-
rally partition the field into distinct stress domains.The second is that local folding of the southwesternstructural domain above itsmaster fault is causing areorganization of the principal stress axes wherebyouter arc stretching counteracts the regional SH,thereby reducing it to the least compressive prin-cipal stress. This scenario is strengthened in theobservation that wells 2 and 3 inmoderately foldedareas of the (thrusting) central and eastern domainsalso show some tendency toward this behaviorin parts of their wellbores. The third scenario iscoseismic stress relaxation. Here, the master faultof the southwestern structural domain has recentlyexperienced slip and associated reductions in stressgradient and reorientation in azimuth in a fashionsimilar to that described by Healy et al. (2004) intheir analysis of the 1980 El Asnam earthquakerupture. Consistent with this scenario is our obser-vation that stress gradients are lower in the south-western structural domain than in the central andnortheastern domains; however, a greater degree offracturing and overall deformation in this domaincould produce the same effect. The fourth scenariofollows Tamagawa and Pollard (2008) in propos-ing that stress orientations change in the vicinity ofactive faults, especially their tip zones, althoughthey do not also document wholesale reorganiza-tion of the stress architecture as we have observedat Suban field. These four scenarios explaining stressheterogeneity are not unique, and it is probablethat some combinations of these or other factorsact in concert.
Application to Reservoir Productivityand Drilling
The concept of potentially active faults and dam-age zones richwith critically stressed fractures formsthe basis for our exploitation strategy for futuredevelopment drilling at Suban field. This conceptwas tested in the southwestern domain by wells 10and 11. Wellbore fracture characterization and pro-ductivity data was collected in well 11. Figure 4Bshows a regression of reservoir productivity for allwells in the field before drillingwells 10 and11,whichsuggests a positive relationship between the numberof critically stressed fractures and well performance
Hennings et al. 769
(R2 = 0.56). Considering only the wells in thesouthwestern domain, all in a strike-slip stress state,suggests a stronger positive relationship locally (R2 =0.63). The engineering and geologic characteriza-tion of strong fracture-dominated permeability andpreferential northwest-southeast connectivity alongcritically stressed faults inspired locating the newwells in a cluster around well D2 to minimize thesurface footprint. Thewell trajectories were plannedto deviate to the northeast in the reservoir to maxi-mize the intersection of reservoir-scale faults andtheir associated fracture damage zones. The wellswere drilled with slightly larger diameters com-pared with previous wells and used a downholevalve tomanagemud pressure, therebyminimizingmud losses and potential degradation of flow po-
770 Suban Gas Field, Sumatra, Indonesia
tential. Drilling data for well 10 indicates that itencountered three heavily fractured fault zones(Figure 7). The drill string instantaneously drop-ped approximately 1 m (∼3.28 ft) while traversingthe second of these fault zones, demonstrating thatit has significant aperture at this location. Drillingwas terminated after crossing the third fault zone,which was specifically targeted for its stress char-acter, when mud losses and gas influx exceededoperating limits. Well 11 also encountered threezones interpreted as faults. Tests of the 10 and 11wells indicate that the parts of the reservoir pen-etrated have extremely favorable bulk propertiesthat we attribute to the permeability architectureof the intersected faults and their associatedfractures. Tapping into the system in this manner
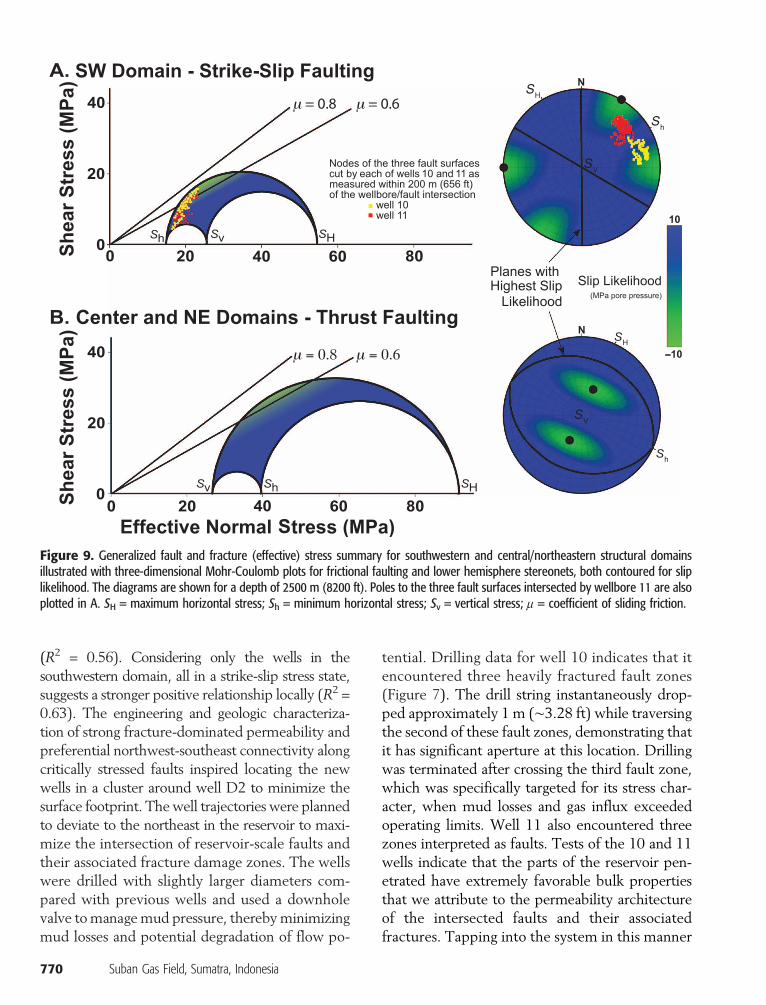
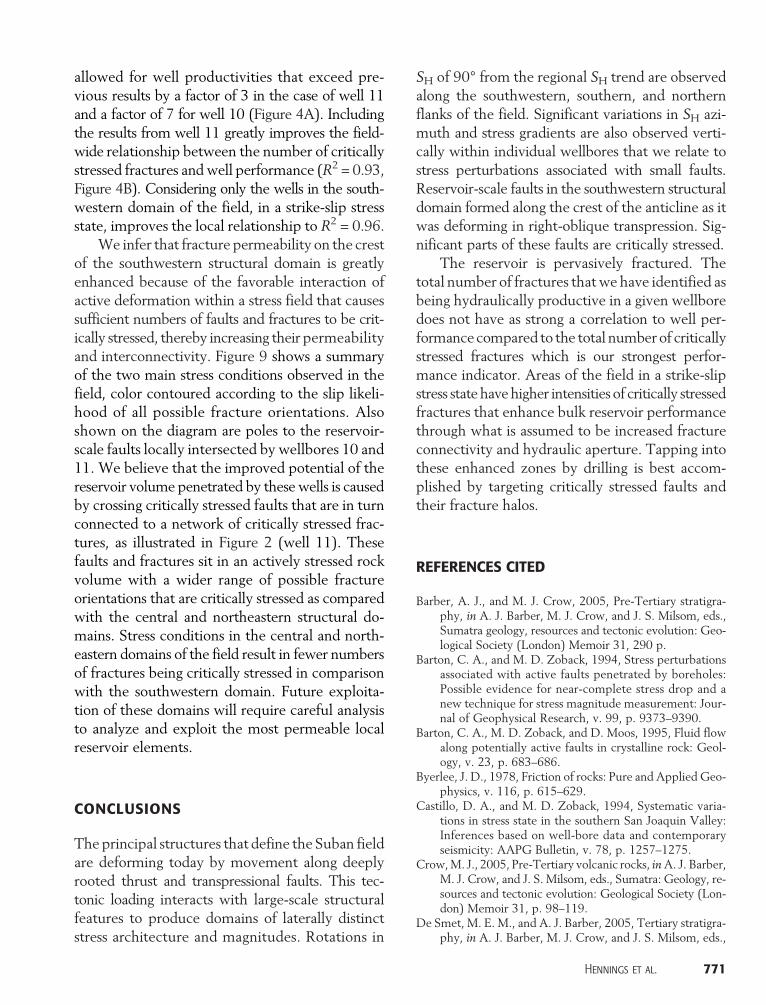
Figure 9. Generalized fault and fracture (effective) stress summary for southwestern and central/northeastern structural domainsillustrated with three-dimensional Mohr-Coulomb plots for frictional faulting and lower hemisphere stereonets, both contoured for sliplikelihood. The diagrams are shown for a depth of 2500 m (8200 ft). Poles to the three fault surfaces intersected by wellbore 11 are alsoplotted in A. SH = maximum horizontal stress; Sh = minimum horizontal stress; Sv = vertical stress; m = coefficient of sliding friction.
allowed for well productivities that exceed pre-vious results by a factor of 3 in the case of well 11and a factor of 7 for well 10 (Figure 4A). Includingthe results from well 11 greatly improves the field-wide relationship between the number of criticallystressed fractures and well performance (R2 = 0.93,Figure 4B). Considering only the wells in the south-western domain of the field, in a strike-slip stressstate, improves the local relationship to R2 = 0.96.
We infer that fracture permeability on the crestof the southwestern structural domain is greatlyenhanced because of the favorable interaction ofactive deformation within a stress field that causessufficient numbers of faults and fractures to be crit-ically stressed, thereby increasing their permeabilityand interconnectivity. Figure 9 shows a summaryof the two main stress conditions observed in thefield, color contoured according to the slip likeli-hood of all possible fracture orientations. Alsoshown on the diagram are poles to the reservoir-scale faults locally intersected by wellbores 10 and11. We believe that the improved potential of thereservoir volume penetrated by these wells is causedby crossing critically stressed faults that are in turnconnected to a network of critically stressed frac-tures, as illustrated in Figure 2 (well 11). Thesefaults and fractures sit in an actively stressed rockvolume with a wider range of possible fractureorientations that are critically stressed as comparedwith the central and northeastern structural do-mains. Stress conditions in the central and north-eastern domains of the field result in fewer numbersof fractures being critically stressed in comparisonwith the southwestern domain. Future exploita-tion of these domains will require careful analysisto analyze and exploit the most permeable localreservoir elements.
CONCLUSIONS
The principal structures that define the Suban fieldare deforming today by movement along deeplyrooted thrust and transpressional faults. This tec-tonic loading interacts with large-scale structuralfeatures to produce domains of laterally distinctstress architecture and magnitudes. Rotations in
SH of 90° from the regional SH trend are observedalong the southwestern, southern, and northernflanks of the field. Significant variations in SH azi-muth and stress gradients are also observed verti-cally within individual wellbores that we relate tostress perturbations associated with small faults.Reservoir-scale faults in the southwestern structuraldomain formed along the crest of the anticline as itwas deforming in right-oblique transpression. Sig-nificant parts of these faults are critically stressed.
The reservoir is pervasively fractured. Thetotal number of fractures thatwe have identified asbeing hydraulically productive in a given wellboredoes not have as strong a correlation to well per-formance compared to the total number of criticallystressed fractures which is our strongest perfor-mance indicator. Areas of the field in a strike-slipstress statehavehigher intensities of critically stressedfractures that enhance bulk reservoir performancethrough what is assumed to be increased fractureconnectivity and hydraulic aperture. Tapping intothese enhanced zones by drilling is best accom-plished by targeting critically stressed faults andtheir fracture halos.
REFERENCES CITED
Barber, A. J., and M. J. Crow, 2005, Pre-Tertiary stratigra-phy, in A. J. Barber, M. J. Crow, and J. S. Milsom, eds.,Sumatra geology, resources and tectonic evolution: Geo-logical Society (London) Memoir 31, 290 p.
Barton, C. A., and M. D. Zoback, 1994, Stress perturbationsassociated with active faults penetrated by boreholes:Possible evidence for near-complete stress drop and anew technique for stress magnitude measurement: Jour-nal of Geophysical Research, v. 99, p. 9373–9390.
Barton, C. A., M. D. Zoback, and D. Moos, 1995, Fluid flowalong potentially active faults in crystalline rock: Geol-ogy, v. 23, p. 683–686.
Byerlee, J. D., 1978, Friction of rocks: Pure and Applied Geo-physics, v. 116, p. 615–629.
Castillo, D. A., and M. D. Zoback, 1994, Systematic varia-tions in stress state in the southern San Joaquin Valley:Inferences based on well-bore data and contemporaryseismicity: AAPG Bulletin, v. 78, p. 1257–1275.
Crow,M. J., 2005, Pre-Tertiary volcanic rocks, inA. J. Barber,M. J. Crow, and J. S. Milsom, eds., Sumatra: Geology, re-sources and tectonic evolution: Geological Society (Lon-don) Memoir 31, p. 98–119.
De Smet, M. E. M., and A. J. Barber, 2005, Tertiary stratigra-phy, in A. J. Barber, M. J. Crow, and J. S. Milsom, eds.,
Hennings et al. 771
Sumatra: Geology, resources and tectonic evolution: Geo-logical Society (London) Memoir 31, p. 86–97.
Gamond, J. F., 1987, Bridge structures as sense of displace-ment criteria in brittle fault zones: Journal of StructuralGeology, v. 12, p. 609–620.
Gasparon, M., 2005, Quaternary volcanicity, in A. J. Barber,M. J. Crow, and J. S. Milsom, eds., Sumatra: Geology, re-sources and tectonic evolution: Geological Society (Lon-don) Memoir 31, p. 120–130.
Healy, D., G. Yielding, and N. Kusznir, 2004, Fracture pre-diction for the 1980 El Asnam, Algeria, earthquake viaelastic dislocationmodeling: Tectonics, v. 23, p. TC6005.
Heidbach, O., K. Fuchs, B. Müller, J. Reinecker, B. Sperner,M. Tingay, and F. Wenzel, 2007, The world stress map:Release 2005: Paris, Commission of the Geological Mapof the World, scale 1:46,000,000.
Hickman, S., and M. D. Zoback, 2003, Stress measurementsin the SAFOD pilot hole: Implications for the frictionalstrength of the San Andreas fault: Geophysical ResearchLetters, v. 31, p. L15.
Hoek, E., and E. T. Brown, 1980, Empirical strength criterionfor rock masses: Journal of Geotechnical EngineeringDivision, American Society of Civil Engineers, v. 106,p. 1013–1035.
McCarthy, A. J., and C. F. Elders, 1997, Cenozoic deforma-tion in Sumatra: Oblique subduction and the develop-ment of the Sumatran fault system, in A. J. Fraser, S. J.Matthews, and R. W. Murphy, eds., Petroleum geologyof Southeast Asia: Geological Society (London) SpecialPublication 126, p. 355–363.
McClay, K., and M. Massimo, 2001, Analog models of re-straining stopovers in strike-slip systems: AAPG Bulletin,v. 85, p. 233–260.
Milsom, J. S., 2005, Seismology and neotectonics, in A. J.Barber, M. J. Crow, and J. S. Milsom, eds., Sumatra: Ge-ology, resources and tectonic evolution: Geological So-ciety (London) Memoir 31, p. 8–15.
Mitra, S., 2002, Fold-accommodation faults: AAPG Bulletin,v. 86, p. 671–694.
Moos,D., andM.D.Zoback, 1990,Utilization of observationsof wellbore failure to constrain the orientation and mag-
772 Suban Gas Field, Sumatra, Indonesia
nitude of crustal stresses: Application to continental DeepSeaDrilling Project andOceanDrilling Project boreholes:Journal of Geophysical Research, v. 95, p. 9305–9325.
Morris, A. P., D. A. Ferrill, and D. B. Henderson, 1996, Sliptendency and fault reactivation: Geology, v. 24, p. 275–278, doi:10.1130/0091-7613(1996)024<0275:STAAFR>2.3.CO;2.
Nelson, R. A., 2001, Geologic analysis of naturally fracturedreservoirs, 2d ed.: Houston, Gulf Professional Publishing/Butterworth-Heinemann, 332 p.
Peacock, D. C. P., S. D. Harris, and M. Mauldon, 2003, Useof curved scanlines and boreholes to predict fracture fre-quencies: Journal of Structural Geology, v. 25, p. 109–119,doi:10.1016/S0191-8141(02)00016-0.
Pulunggono, A., 1986, Tertiary structural features related toextensional and compressive tectonics in the PalembangBasin, South Sumatra: 15th Annual Convention of theIndonesian Petroleum Association, p. 187–214.
Sylvester, A. G., 1988, Strike-slip faults: Geological Societyof America Bulletin, v. 100, p. 1666–1703, doi:10.1130/0016-7606(1988)100<1666:SSF>2.3.CO;2.
Tamagawa, T., and D. D. Pollard, 2008, Fracture permeabil-ity created by perturbed stress fields around active faultsin a fractured basement reservoir: AAPG Bulletin, v. 92,p. 743–764, doi:10.1306/02050807013.
Terzaghi, R. D., 1965, Sources of errors in joint surveys: Geo-technique, v. 15, p. 287–304.
Townend, J., and M. D. Zoback, 2000, How faulting keepsthe crust strong: Geology, v. 28, p. 399–402.
Zoback, M. D., 2007, Reservoir geomechanics: Cambridge,Cambridge University Press, 449 p.
Zoback, M. D., and J. Townend, 2001, Implications of hydro-static pore pressures and high crustal strength for thedeformation of intraplate lithosphere: Tectonophysics,v. 336, p. 19–30, doi:10.1016/S0040-1951(01)00091-9.
Zoback, M. D., C. B. Barton, M. O. Brudy, D. A. Castillo,B. R. Grollimund, T. Finkbeiner, D. B. Moos, P. Peska,C. D. Ward, and D. J. Wiprut, 2003, Determination ofstress orientation and magnitude in deep wells: Interna-tional Journal of Rock Mechanics and Mining Sciences,v. 40, p. 1049–1076, doi:10.1016/j.ijrmms.2003.07.001.