Embed Size (px)
Citation preview
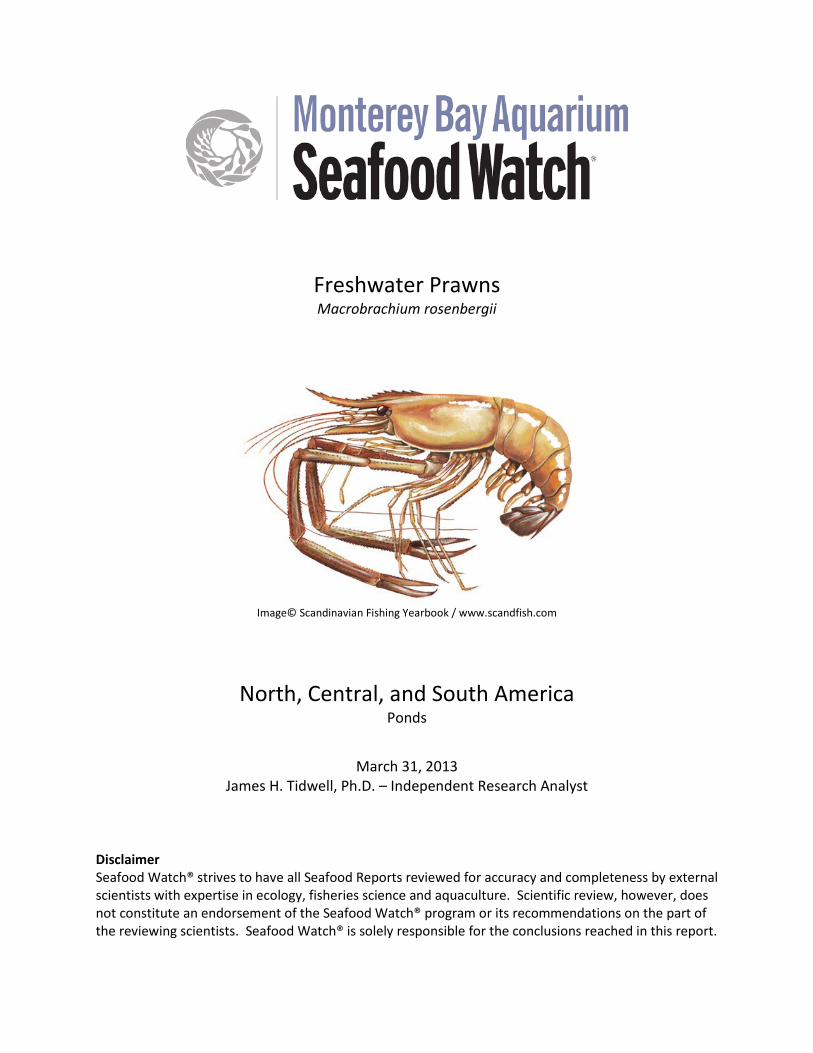
Freshwater Prawns Macrobrachium rosenbergii
Image© Scandinavian Fishing Yearbook / www.scandfish.com
North, Central, and South America Ponds
March 31, 2013
James H. Tidwell, Ph.D. – Independent Research Analyst
Disclaimer Seafood Watch® strives to have all Seafood Reports reviewed for accuracy and completeness by external scientists with expertise in ecology, fisheries science and aquaculture. Scientific review, however, does not constitute an endorsement of the Seafood Watch® program or its recommendations on the part of the reviewing scientists. Seafood Watch® is solely responsible for the conclusions reached in this report.
2
About Seafood Watch® Monterey Bay Aquarium’s Seafood Watch® program evaluates the ecological sustainability of wild-caught and farmed seafood commonly found in the United States marketplace. Seafood Watch® defines sustainable seafood as originating from sources, whether wild-caught or farmed, which can maintain or increase production in the long-term without jeopardizing the structure or function of affected ecosystems. Seafood Watch® makes its science-based recommendations available to the public in the form of regional pocket guides that can be downloaded from www.seafoodwatch.org. The program’s goals are to raise awareness of important ocean conservation issues and empower seafood consumers and businesses to make choices for healthy oceans. Each sustainability recommendation on the regional pocket guides is supported by a Seafood Report. Each report synthesizes and analyzes the most current ecological, fisheries and ecosystem science on a species, then evaluates this information against the program’s conservation ethic to arrive at a recommendation of “Best Choices,” “Good Alternatives” or “Avoid.” The detailed evaluation methodology is available upon request. In producing the Seafood Reports, Seafood Watch® seeks out research published in academic, peer-reviewed journals whenever possible. Other sources of information include government technical publications, fishery management plans and supporting documents, and other scientific reviews of ecological sustainability. Seafood Watch® Research Analysts also communicate regularly with ecologists, fisheries and aquaculture scientists, and members of industry and conservation organizations when evaluating fisheries and aquaculture practices. Capture fisheries and aquaculture practices are highly dynamic; as the scientific information on each species changes, Seafood Watch®’s sustainability recommendations and the underlying Seafood Reports will be updated to reflect these changes. Parties interested in capture fisheries, aquaculture practices and the sustainability of ocean ecosystems are welcome to use Seafood Reports in any way they find useful. For more information about Seafood Watch® and Seafood Reports, please contact the Seafood Watch® program at Monterey Bay Aquarium by calling 1-877-229-9990.
3
Guiding Principles Seafood Watch defines sustainable seafood as originating from sources, whether fished1 or farmed, that can maintain or increase production in the long-term without jeopardizing the structure or function of affected ecosystems. The following guiding principles illustrate the qualities that aquaculture must possess to be considered sustainable by the Seafood Watch program: Seafood Watch will: • Support data transparency and therefore aquaculture producers or industries that make
information and data on production practices and their impacts available to relevant stakeholders.
• Promote aquaculture production that minimizes or avoids the discharge of wastes at the farm level in combination with an effective management or regulatory system to control the location, scale and cumulative impacts of the industry’s waste discharges beyond the immediate vicinity of the farm.
• Promote aquaculture production at locations, scales and intensities that cumulatively maintain the functionality of ecologically valuable habitats without unreasonably penalizing historic habitat damage.
• Promote aquaculture production that by design, management or regulation avoids the use and discharge of chemicals toxic to aquatic life, and/or effectively controls the frequency, risk of environmental impact and risk to human health of their use.
• Within the typically limited data availability, use understandable quantitative and relative indicators to recognize the global impacts of feed production and the efficiency of conversion of feed ingredients to farmed seafood.
• Promote aquaculture operations that pose no substantial risk of deleterious effects to wild fish or shellfish populations through competition, habitat damage, genetic introgression, hybridization, spawning disruption, changes in trophic structure or other impacts associated with the escape of farmed fish or other unintentionally introduced species.
• Promote aquaculture operations that pose no substantial risk of deleterious effects to wild populations through the amplification and retransmission of pathogens or parasites.
• Promote the use of eggs, larvae, or juvenile fish produced in hatcheries using domesticated broodstocks thereby avoiding the need for wild capture.
• Recognize that energy use varies greatly among different production systems and can be a major impact category for some aquaculture operations, and also recognize that improving
1 “Fish” is used throughout this document to refer to finfish, shellfish and other invertebrates.
4
practices for some criteria may lead to more energy-intensive production systems (e.g. promoting more energy-intensive closed recirculation systems).
Once a score and rank has been assigned to each criterion, an overall seafood recommendation is developed on additional evaluation guidelines. Criteria ranks and the overall recommendation are color-coded to correspond to the categories on the Seafood Watch pocket guide: Best Choices/Green: Are well managed and caught or farmed in environmentally friendly ways. Good Alternatives/Yellow: Buy, but be aware there are concerns with how they’re caught or farmed. Avoid/Red: Take a pass on these. These items are overfished or caught or farmed in ways that harm other marine life or the environment.
5
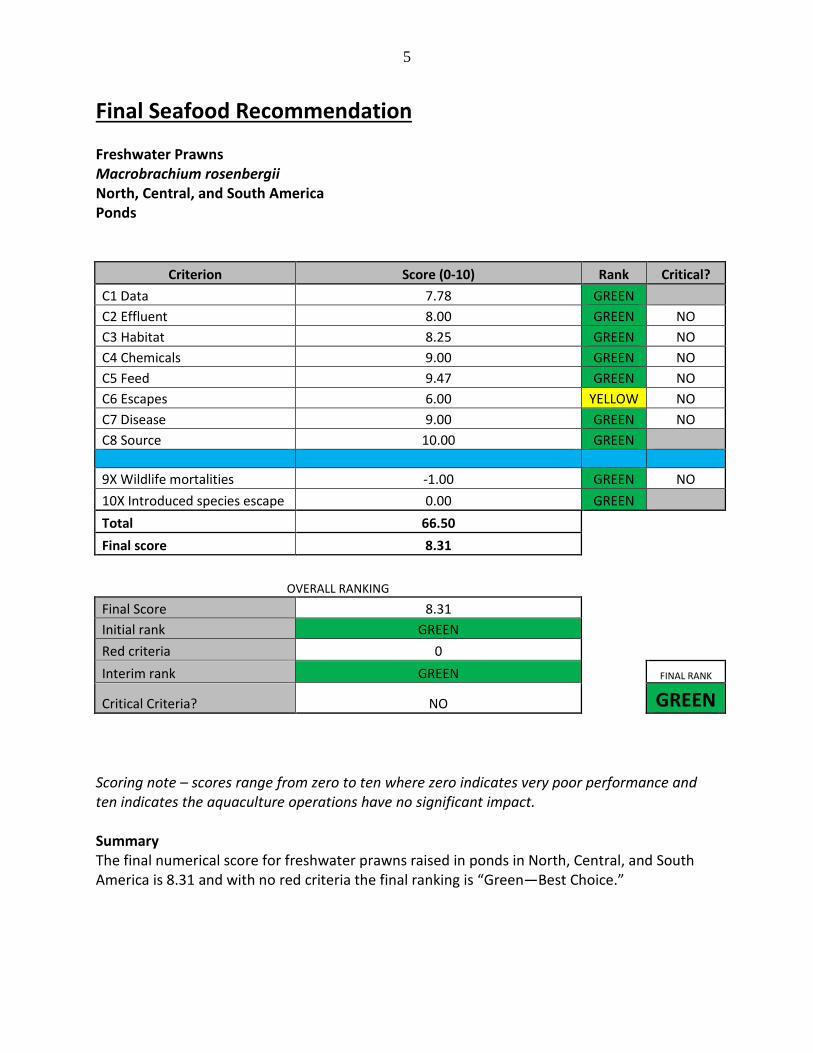
Final Seafood Recommendation Freshwater Prawns Macrobrachium rosenbergii North, Central, and South America Ponds
Criterion Score (0-10) Rank Critical? C1 Data 7.78 GREEN C2 Effluent 8.00 GREEN NO C3 Habitat 8.25 GREEN NO C4 Chemicals 9.00 GREEN NO C5 Feed 9.47 GREEN NO C6 Escapes 6.00 YELLOW NO C7 Disease 9.00 GREEN NO C8 Source 10.00 GREEN 9X Wildlife mortalities -1.00 GREEN NO 10X Introduced species escape 0.00 GREEN Total 66.50 Final score 8.31
OVERALL RANKING Final Score 8.31 Initial rank GREEN Red criteria 0 Interim rank GREEN FINAL RANK
Critical Criteria? NO GREEN Scoring note – scores range from zero to ten where zero indicates very poor performance and ten indicates the aquaculture operations have no significant impact.
Summary The final numerical score for freshwater prawns raised in ponds in North, Central, and South America is 8.31 and with no red criteria the final ranking is “Green—Best Choice.”

6
Executive Summary Global production of the Giant Malaysian Prawn or Giant River Prawn (Macrobrachium rosenbergii) in 2012 was 220,254 tons (t) valued at USD 1.27 billion. Major producers of M. rosenbergii include China (57%), Bangladesh (19%), Thailand (11%), Vietnam (4%), India (3%), Taiwan (3%), and Myanmar (2%). Combined production in North, Central, and South America was 592 t in 2012 and limited to small-scale producers. Currently, Central and South America are not exporting to the United States. For prawns produced in the U.S. (200 t in 2012), most sales are on-farm direct sales or farmer’s markets sales, directly to end users. There is limited processing of prawns, which are sold as fresh tails, frozen whole product, or frozen tails. Production and environmental information on prawns produced in North, Central, and South America is available in refereed primary literature in English, so data availability and quality is high for this assessment. The United States is the only country within the scope of this assessment whose production is available to U.S. consumers. The U.S. provides data through FAO reporting and actively publishes in scientific journals. Additionally, the author of this report has extensive personal experience in the industry and has been widely published in the scientific literature. The score for Criterion 1: Data is 7.78 out of 10. Production in the U.S. can be classified into two management approaches. The first is a low-density, low-input approach focusing on reducing input variable costs and producing large-sized prawns, which commonly fetch higher market prices. The second approach focuses on increasing production (kg/ha) using higher stocking rates, size-graded seedstock, added substrate in the ponds, and higher feeding rates. Much of the current industry is based on the low-density, low-input approach. Under either regime, production remains relatively low (up to 2,500 kg/ha in research ponds and <1,500 kg/ha in commercial production ponds) compared to many other aquaculture industries. Small ponds, low feeding rates, and low prawn densities indicate that high concentrations of nutrients in effluent are unlikely. Additionally, ponds are static, meaning that there is no water exchange and effluent is only discharged once per cycle when ponds are drained for harvest. Some governmental oversight exists, particularly at the state level, and enforcement of regulation is shown to be strong. Because data show no evidence that effluents cause (or contribute to cumulative) local or regional impacts, the final numerical score for Criterion 2: Effluents is 8.00 out of 10. Prawn ponds are built on previous pasture or cropland, so no sensitive habitats are affected during construction or operation. The farms are considered to have low impacts on the habitat’s provision of ecosystem services, and the evidence concludes that there are only minor impacts and there is no loss of habitat functionality. Strong regulation and enforcement in the
7
United States mitigate the risk of any potential future habitat impacts. The numerical score for Criterion 3: Habitat is 8.25 out of 10. Freshwater prawns are not as susceptible to disease outbreaks as marine shrimp, so disease (and the need to treat with chemicals) is rare. Though some chemicals have historically been used in prawn aquaculture, current small-scale and low-density practices avoid disease outbreaks and the subsequent need for treatment with chemicals. No antibiotics or pesticides are utilized during production. Because there is little risk of active chemicals being released into the environment, Criterion 4: Chemical Use receives a score of 9.00 out of 10. Freshwater prawns utilize natural pond biota as food, so only low levels of supplemental pelleted feed are required (40–65 kg/ha/day). The Feed Conversion Ratio (FCR) for M. rosenbergii is 2.0 and pelleted feeds consist of 30% protein, low fishmeal inclusion (2%–4%), and no fish oil. The majority of feed ingredients (95%) are agricultural products and byproducts such as corn gluten, wheat middlings, and distiller’s grains. Based on protein inputs and outputs, prawn farming is calculated to result in a net gain of protein. A total feed footprint of 2.80 hectares of land and ocean area is calculated to be necessary to produce the feed ingredients required to grow 1 ton of farmed prawns. The numerical score for Criterion 5: Feed is 9.47. The escape risk from static ponds (defined as 0%–3% water exchange per day) is considered low to moderate because there is some potential for prawns to escape when ponds are drained at harvest. They are non-native in the regions where they are cultured, they are not established, and they are highly unlikely to survive or establish viable populations due to temperature-related mortality (i.e., <15 oC) and salinity requirements for breeding (13–15 ppt). No evidence exists to suggest that prawns have established breeding populations as a result of farm escapes. Although recognized as being short-lived, any prawns that do escape are expected to compete to some extent with native populations for food. The numerical score for Criterion 6: Escapes is 6.00 out of 10. Freshwater prawns are resistant to many of the diseases common in marine shrimp aquaculture. This natural resistance is reinforced by the absence of water quality deterioration and physiological stress—issues that are avoided in U.S. prawn aquaculture through low stocking densities and low-input culture techniques. The risk of amplification and transmission of diseases from farms to wild populations is shown be minimal, so the numerical score for Criterion 7: Disease is 9.00 out of 10. Prawn production in North America relies exclusively on hatchery produced post-larvae (PLs) for pond stocking. Broodstock for hatcheries are sourced from production ponds. Therefore, there is no dependence on wild stocks for seed and the numerical score for Criterion 8: Source of Stock is 10.00 out of 10. The principal predators on U.S. prawn farms are wild fish, bullfrogs, and predacious insects. Due to the low-density biomass of prawns in ponds, avian and mammalian predators are not

8
common. However, ponds have the potential for wildlife mortality and therefore a minor adjustment based solely on precaution is warranted, so the numerical score for Exceptional Criterion 9X is −1.00 out of −10. There is no trans-waterbody or international shipment of live animals associated with U.S. prawn farming. Transport of live prawns—either broodstock, larvae, or juveniles—is confined to local and regional destinations. All hatcheries and nurseries in the U.S. are operated as closed recycle systems (Coyle et al. 2010); therefore, the risk of any occurrence of alien species being transported and introduced with them or across borders is null. As a result, Exceptional Criterion 10X is unnecessary to be scored and no adjustment is applied (i.e., a score of 0 out of −10). The final numerical score for freshwater prawns cultured in ponds in North, Central, and South America is 8.31 and, with no red criteria, the final ranking is “Green – Best Choice.”

9
Table of Contents About Seafood Watch® ................................................................................................................... 2 Guiding Principles ........................................................................................................................... 3 Final Seafood Recommendation ..................................................................................................... 5 Executive Summary ......................................................................................................................... 6 Introduction .................................................................................................................................. 10 Analysis ......................................................................................................................................... 13
Scoring guide ........................................................................................................................ 13 Criterion 1: Data quality and availability ............................................................................. 13 Criterion 2: Effluents ............................................................................................................ 15 Criterion 3: Habitat .............................................................................................................. 18 Criterion 4: Evidence or Risk of Chemical Use ..................................................................... 20 Criterion 5: Feed .................................................................................................................. 22 Criterion 6: Escapes ............................................................................................................. 25 Criterion 7: Disease; pathogen and parasite interactions ................................................... 28 Criterion 8: Source of Stock – independence from wild fisheries ....................................... 30 Criterion 9X: Wildlife and predator mortalities ................................................................... 31 Criterion 10X: Escape of unintentionally introduced species .............................................. 32
Acknowledgements ....................................................................................................................... 33 References .................................................................................................................................... 34 Appendix 1 – Data points and all scoring calculations ................................................................. 37

10
Introduction Scope of the analysis and ensuing recommendation Species Macrobrachium rosenbergii Geographic coverage North/Central/South America Production Methods Ponds Species Overview Freshwater prawns are a rather large group of decapod crustaceans within the genus Macrobrachium. There are about 230 species and all live at least a portion of their lives in freshwater (Holthuis and Ng 2010). The focus of this assessment is the species Macrobrachium rosenbergii; common names include the Giant River Prawn and the Giant Malaysian Prawn. This species must have access to brackish water to reproduce and complete its life cycle. In the wild, M. rosenbergii lives in rivers and tributaries and migrates to bays and estuaries where the eggs hatch and undergo 10–12 larval stages in brackish water (13–15 ppt). The larvae then metamorphose into post-larvae that migrate back up the rivers and inhabit freshwater (Brown et al. 2010). Its optimum temperature range is between 26 oC and 32 oC (78–90 oF) and it is unable to survive when temperatures drop below 12–15 oC (55–60 oF) (Boyd and Zimmerman 2010). They are opportunistic benthic omnivores, feeding mainly on aquatic invertebrates such as snails and insect larvae, but also plant materials, detritus, and fishes. Freshwater prawns can be grown on feeds with lower protein and higher carbohydrate levels than those found in feeds formulated for marine shrimp or other carnivorous farmed species (D’Abramo and New 2010). Production Statistics Global production of freshwater shrimp has expanded rapidly during the last decade. In 2012, production of M. rosenbergii was 220,254 t valued at USD 1.27 billion (FAO 2014). The main producers of M. rosenbergii in 2012 included China (57%), Bangladesh (19%), Thailand (11%), Vietnam (4%), India (3%), Taiwan (3%), and Myanmar (2%). All these countries are part of the Asian continent and are therefore outside the scope of this assessment. Compared to Asia, freshwater prawn production in North, Central, and South America is quite limited (a total production of 592 t in 2012) (FAO 2014). In South America, countries that have previously reported production of Macrobrachium include Argentina, Brazil, Colombia, Ecuador, Peru, and Venezuela (New and Kutty 2010). Despite a great resource potential, production of
11
M. rosenbergii in Brazil has declined since the 1990s (New and Nair 2012). Some of this decline appears to be associated with production of a closely related native species (M. amazonicum) that has become the focus of research in the region (Marques and Moraes-Valenti 2012). Production of M. rosenbergii in Peru has been reported as recently as 2005; however, none was exported to the United States. Production in all other South American countries appears to have ceased (New and Kutty 2010). Currently, M. rosenbergii is not exported from South America to the United States (pers. comm., Michal New and Wagner Valenti). Several Central American and Caribbean countries have reported production of M. rosenbergii, including Costa Rica, El Salvador, Guatemala, Panama, and the Dominican Republic. However, all current production is consumed within each country and no prawns are exported to the United States (New and Kutty 2010). For North America, production of freshwater prawns was 200 t in 2012 (FAO 2014) and was reported in 20 states in the United States (Tidwell 2012). A 2005 census conducted by the United States Department of Agriculture (USDA) revealed a total of 80 freshwater prawn farms, 76 of which were devoted to food-size production (USDA 2005). Almost all farming occurs on quite a small scale (e.g., ponds <1 ha, total farm area <5 ha). There are three commercial freshwater prawn hatcheries in the continental U.S., and all broodstock are selected from among mature prawns harvested from aquaculture growout ponds. These broodstock produce seed for the stocking of ponds for the ensuing season. During the past 5 years, the American Prawn Cooperative in North Carolina has operated a small processing plant and has achieved some success in supplying high-demand markets in California. Hawaii has a long history of prawn production: farming is practiced throughout the year, whereby market-sized prawns are periodically “cull-harvested” from production ponds and seed (juveniles) are subsequently stocked. At least one commercial hatchery operates in Hawaii. Most of Hawaii’s production is sold through ethnic seafood markets, or small specialty restaurants/food trucks along the North Shore area of Oahu. Some prawns are also sold to retail vendors around Honolulu’s Chinatown (New and Kutty 2010). Mexico began producing freshwater prawns in the 1970s. Production peaked at 410 MT (metric tons) in 1988. According to the FAO (2011), by 2009, prawn production in Mexico had decreased to 12 MT, which is reported to be consumed domestically, especially around the city of Veracruz (New and Kutty 2010). Some interest has recently developed in the farming of selected native species in Mexico, specifically M. carcinus and M. acanthurus. No production of freshwater prawns in Canada has been reported. Suitable water temperatures for outdoor pond production would substantially limit the growing season. Recently, interest in Canada has been redirected to the stocking of freshwater prawns as part of indoor recirculating aquaponics systems; however, no production data are yet available and these recirculating systems are outside the scope of this assessment.

12
Import and export sources and statistics All the available import/export records for “shrimp” are not specific down to the species level, so figures for M. rosenbergii are unable to be disaggregated from the following information. It is expected that the majority of “shrimp” cited in the following data are marine species (e.g., L. vannamei, P. monodon). According to the National Fisheries Institute (2012), shrimp is the top seafood consumed per capita per year in the U.S. During 2011, the average annual per capita consumption of shrimp in the U.S. was 1.9 kg (4.2 lb), a rate 60% greater than that of the second-most consumed seafood, canned tuna at 1.2 kg (2.6 lb). The National Marine Fisheries Service (NMFS 2011) reports that the volume of shrimp imported into the U.S. in 2011 was 575,110 MT. Valued at $5.2 billion, shrimp imports constitute 31% of the total value of edible imports. The U.S. is also an exporter of shrimp; however, almost all of this export volume emanates from wild harvest. According to NMFS, the major importers of shrimp from the U.S. were Canada (24%), Denmark (13%), Vietnam (9%), Mexico (6%), and China (5%). In 2011, the total volume of shrimp exports from the U.S. equaled 12 MT (USDA-ERS 2013). Currently, over 90% of the shrimp consumed in the U.S. is imported. Unfortunately, import statistics lump marine and freshwater species into a total shrimp category, thereby excluding statistics specific to freshwater shrimp. All the freshwater shrimp imported into the U.S. are from Asia and in frozen form. Although China is the largest global producer, all Chinese production is consumed domestically (Hongtuo et al. 2012) and export to the United States does not currently occur. Currently, the largest exporter of freshwater shrimp to the United States is Bangladesh (4,400 MT) (Wahab et al. 2012). Notably, a large portion of Bangladesh’s production is probably not farmed but derived from either wild or stock-enhanced capture. Other exporters to the United States include India (1,348 MT) (Nair and Salin 2012), Thailand (144 MT) (Na-Nakorn and Jintasataporn 2012), and Vietnam. Much, if not most, of the U.S. market for imported freshwater prawns appears to consist of consumers of Asian descent or restaurants serving Asian food (New and Kutty 2010). Common and market names Freshwater prawns, Freshwater shrimp, Scampi, Giant River Prawn, Giant Malaysian Prawn Product forms Live, whole fresh on ice, fresh tails on ice, frozen tails, frozen whole
13
Analysis
Scoring guide • With the exception of the exceptional factors (3.3x and 6.2X), all scores result in a zero to
ten final score for each criterion and the overall final rank. A zero score indicates lowest performance, while a score of ten indicates highest performance. In contrast, the two exceptional factors result in negative scores from zero to minus ten, and in these cases zero indicates no negative impact.
• The full Seafood Watch Aquaculture Criteria to which the following scores relate are available here
• The full data values and scoring calculations are available in Appendix 1
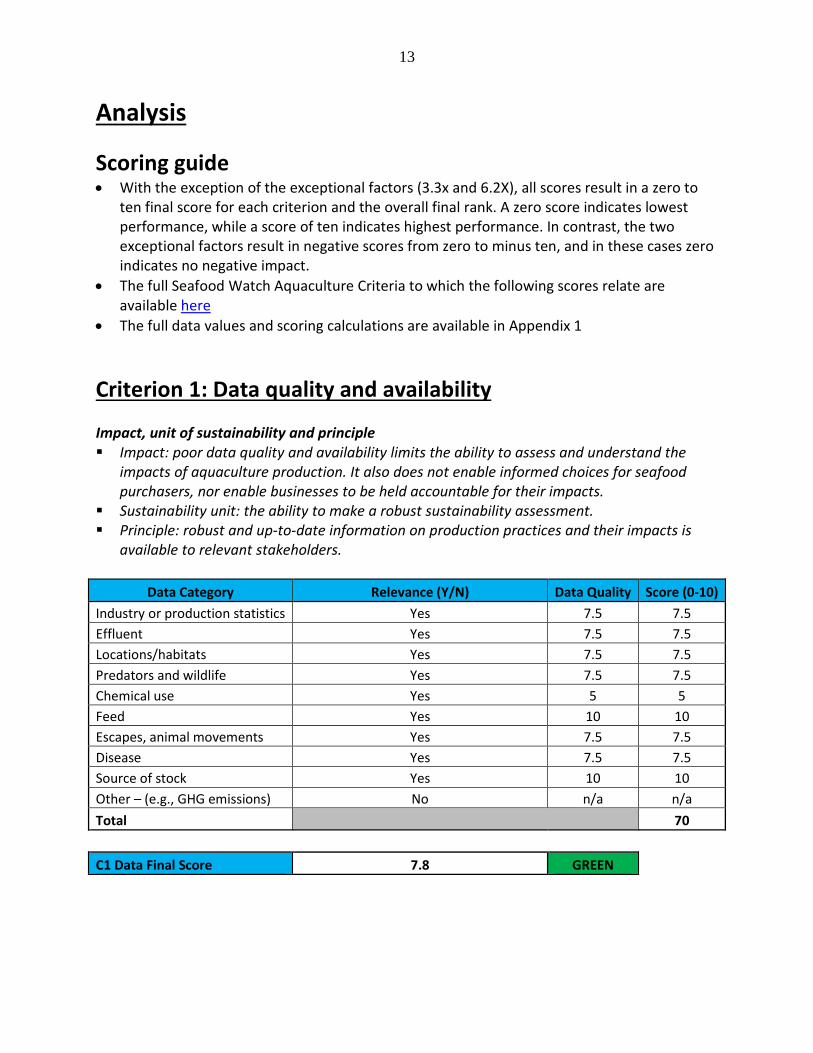
Criterion 1: Data quality and availability Impact, unit of sustainability and principle Impact: poor data quality and availability limits the ability to assess and understand the
impacts of aquaculture production. It also does not enable informed choices for seafood purchasers, nor enable businesses to be held accountable for their impacts.
Sustainability unit: the ability to make a robust sustainability assessment. Principle: robust and up-to-date information on production practices and their impacts is
available to relevant stakeholders.
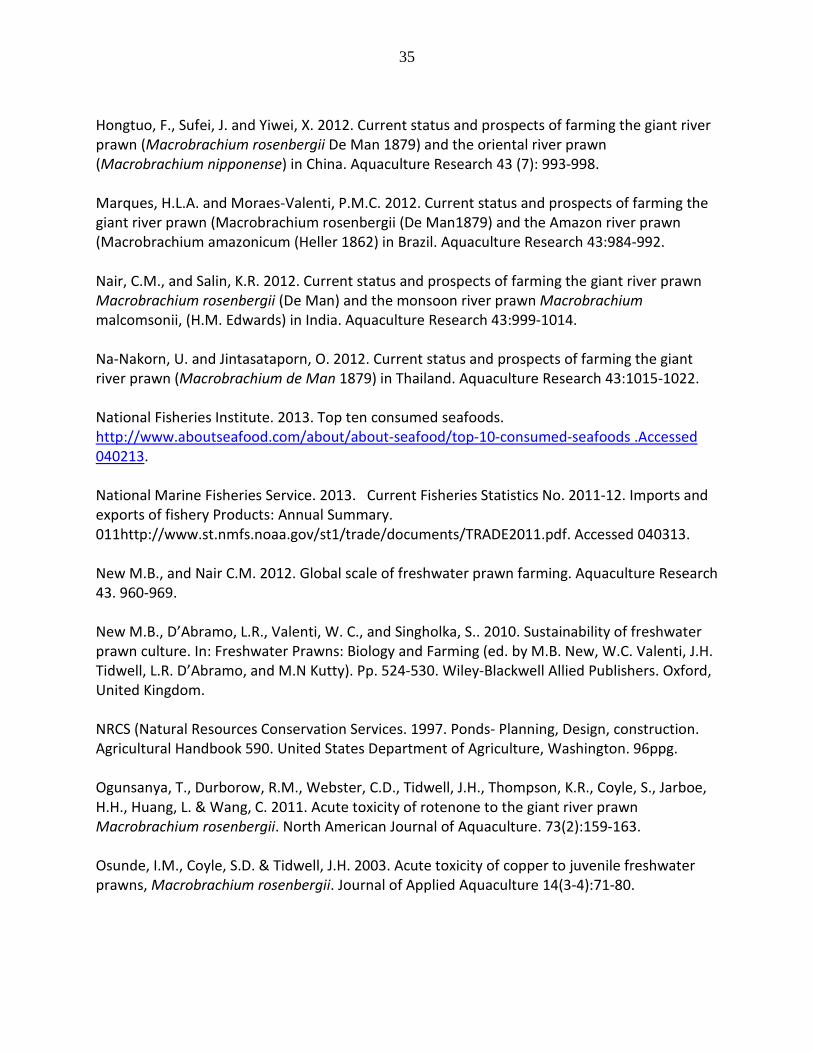
Data Category Relevance (Y/N) Data Quality Score (0-10) Industry or production statistics Yes 7.5 7.5 Effluent Yes 7.5 7.5 Locations/habitats Yes 7.5 7.5 Predators and wildlife Yes 7.5 7.5 Chemical use Yes 5 5 Feed Yes 10 10 Escapes, animal movements Yes 7.5 7.5 Disease Yes 7.5 7.5 Source of stock Yes 10 10 Other – (e.g., GHG emissions) No n/a n/a Total 70
C1 Data Final Score 7.8 GREEN
14
Brief Summary Data availability and quality is high for this assessment. The United States is the only country within the scope of this assessment whose production is available to U.S. consumers. The U.S. provides data through FAO reporting and actively publishes in scientific journals. Additionally, the author of this report has extensive personal experience in the industry and has been widely published in the scientific literature. The score for Criterion 1: Data is 7.8 out of 10. Justification of Ranking Papers concerning production methods, feeds used, production levels, feed efficiencies, and drug use can be found in the primary literature, many of which were published by the author of this Seafood Watch assessment. Notable examples that this assessment relies on include D’Abramo et al. 2006; Tidwell et al. 2004; Tidwell et al. 2005; Tidwell and D’Abramo 2010; Tidwell 2012. Another valuable source of information is a published bulletin (D’Abramo et al. 2011) designed to inform and guide potential prawn growers. Additionally, several important papers review commercial production, location, and facilities, as well as any use of drugs during different stages of production (New and Nair 2012; Marques and Moraes-Valenti 2012). All these sources are available in English. In the United States, the industry operates within a strict regulatory environment that is conducive to the collection of a relatively large amount of farm-level data; these data are reported to governing bodies and also made available to the public. The Census of Aquaculture published by the USDA 3 years after each 5-year Census of Agriculture provides a comprehensive summary of production and economic data that include specific reference to the freshwater prawn (USDA 2005). Additionally, the author of this report has extensive experience in the industry and has relied on this expertise to bridge any data gaps that may exist in the scientific literature. The numerical score for Criterion 1: Data Quality and Availability is 7.8 out of 10.

15
Criterion 2: Effluents Impact, unit of sustainability and principle Impact: aquaculture species, production systems and management methods vary in the
amount of waste produced and discharged per unit of production. The combined discharge of farms, groups of farms or industries contributes to local and regional nutrient loads.
Sustainability unit: the carrying or assimilative capacity of the local and regional receiving waters beyond the farm or its allowable zone of effect.
Principle: aquaculture operations minimize or avoid the production and discharge of wastes at the farm level in combination with an effective management or regulatory system to control the location, scale and cumulative impacts of the industry’s waste discharges beyond the immediate vicinity of the farm.
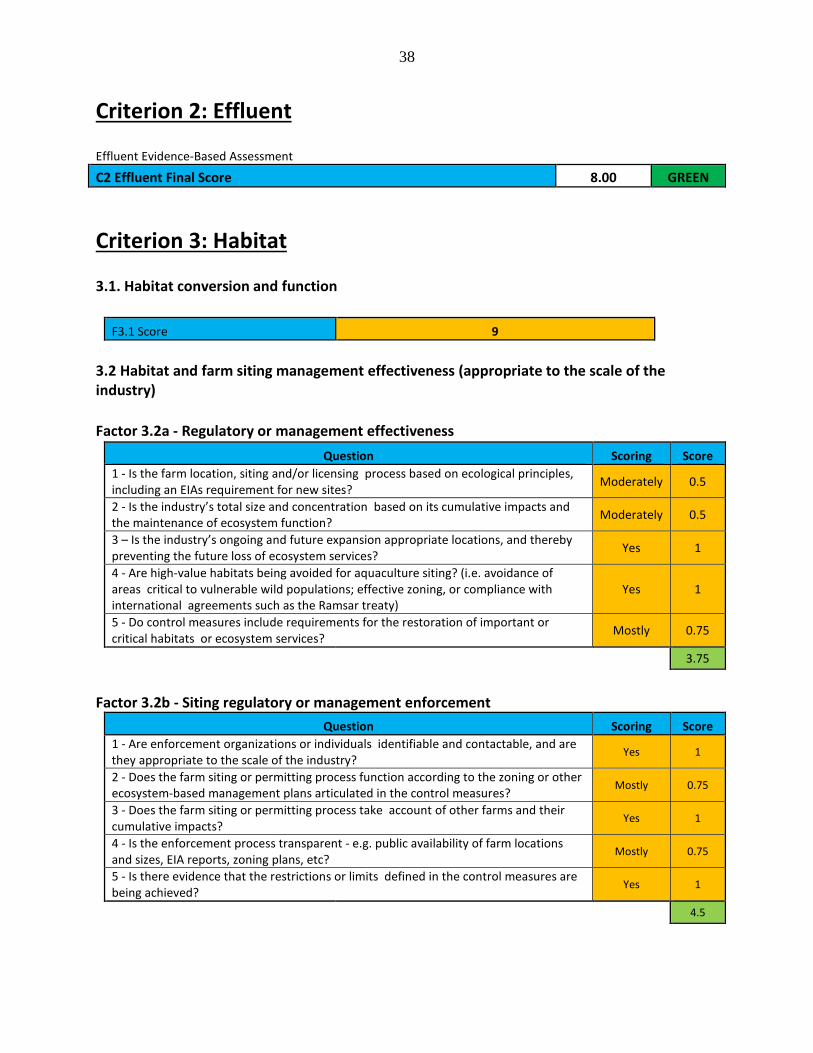
Criterion 2 Summary Effluent Evidence-Based Assessment C2 Effluent Final Score 8.00 GREEN
Because effluent data quality and availability is good (Criterion 1 score of 7.5 for the Effluent category), the Seafood Watch Evidence-Based Assessment was utilized. Brief Summary Small ponds, low feeding rates, and low prawn densities indicate that high concentrations of nutrients in effluent are unlikely. Additionally, ponds are static, meaning that there is no water exchange and effluent is only discharged once per cycle when ponds are drained for harvest. Because data show no evidence that effluents cause (or contribute to cumulative) local or regional impacts, the final numerical score for Criterion 2: Effluents is 8 out of 10. Justification of Ranking In North America, fed monoculture of prawns is practiced. However, maximum biomass densities in commercial production are limited to <1,500 kg/ha and feeding rates of <65 kg/ha/day (Tidwell and D’Abramo 2010). These levels/rates are low when compared to those of most other species, such as marine shrimp and channel catfish, and consequently minimize any incidence of water quality degradation. The majority of prawns grown in North America are raised in small ponds (0.1–1.0 ha) on small family farms with total pond acreages of <3–5 ha. The low resident biomass of prawns in ponds and correspondingly low feeding rates limit the potential of high concentrations of metabolites or waste nutrients in the culture water. Ponds are static and water is released only once per year during annual harvest. Ponds are allowed to dry and not refilled until just prior to stocking

16
of juveniles and the start of the next growing season. Most ponds commonly drain to terrestrial grassed systems such as pastures, or to local creeks or rivers. Water quality has been closely monitored and reported in research ponds over multiple production trials during the past two decades. Even in research ponds, with biomass densities much higher than those achieved in commercial ponds (2,500 kg/ha in research vs. <1,500 kg/ha in commercial ponds), low, non-detrimental concentrations of nitrogenous waste products have been documented (Tidwell et al. 2004). Aquaculture effluents in the United States are regulated under the National Pollutant Discharge Elimination System (NPDES) as part of the Federal Water Pollution Control Act of 1972 and its subsequent amendments. The Act designates the U.S. Environmental Protection Agency (EPA) to administer and enforce the NPDES, although states are encouraged to develop and operate their own programs in lieu of the Federal program. Though prawn-specific studies are not available, the aquaculture production of other species can be used as a proxy to demonstrate any effluent impacts (or lack thereof) from prawn farms. For example, in a comprehensive study funded by the USDA-Southern Regional Aquaculture Center, catfish pond effluents were characterized by sampling 45 commercial catfish ponds in Alabama and Mississippi over a 2-year period. A summary analysis indicated that catfish pond effluents were most likely to exceed regulatory limits only intermittently (usually during very infrequent pond draining) for suspended solids and total phosphorus. Other measured water quality variables, such as nitrogenous waste products, seldom or never exceeded national or state effluent standards (Sealy, Barziza, Davis, and Gatlin 1999). Since prawns only achieve biomass densities of approximately 25% of those of catfish (1,000–1500 kg/ha compared to 5,000–6000 kg/ha for catfish), prawn feeding rates are also proportionality lower. Feed is a primary source of nutrient input that can ultimately affect water and effluent quality. If pond culture of catfish is not considered to be a high concern for effluent impacts, then the lower maximum prawn biomass densities of <1,500 kg/ha, lower feeding rates, and relatively lower dietary protein levels of feed suggest that negative effluent impacts from prawn farms are extremely unlikely. The low impact on water quality of prawn production, even at their highest production rates (which are at most 1/3 of catfish production and feeding rates), was documented in (Tidwell et al. 2004), who compared different prawn production technologies in ponds and evaluated water quality variables associated with them. No levels of concern were identified, even at the highest prawn production and feeding rates. According to (D’Abramo, Silva and Frinsko 2009), “[T]he overall quality of the discharge water at harvest is as good as, or possibly better than, the quality of the water originally used to fill the pond.” Low biomass, low feeding rates, and small-scale ponds that only discharge water at harvest all mitigate potential effluent impacts from prawn farms. Because data show no evidence that

17
effluents cause (or contribute to cumulative) local or regional impacts, the numerical score for Criterion 2: Effluents is 8.00 out of 10.

18
Criterion 3: Habitat Impact, unit of sustainability and principle Impact: Aquaculture farms can be located in a wide variety of aquatic and terrestrial habitat
types and have greatly varying levels of impact to both pristine and previously modified habitats and to the critical “ecosystem services” they provide.
Sustainability unit: The ability to maintain the critical ecosystem services relevant to the habitat type.
Principle: aquaculture operations are located at sites, scales and intensities that cumulatively maintain the functionality of ecologically valuable habitats.
Criterion 3 Summary
Habitat parameters Value Score F3.1 Habitat conversion and function 9.00 F3.2a Content of habitat regulations 3.75 F3.2b Enforcement of habitat regulations 4.50 F3.2 Regulatory or management effectiveness score 6.75 C3 Habitat Final Score 8.25 GREEN Critical? NO Brief Summary Prawn ponds are built on previous pasture or cropland, so no sensitive habitats are affected during construction or operation. Prawn farming results in minimal habitat impacts with no overall loss of ecosystem services or habitat functionality. Strong regulation and enforcement in the United States mitigates the risk of any potential future habitat impacts. The numerical score for Criterion 3: Habitat is 8.25 out of 10. Justification of Ranking Factor 3.1. Habitat conversion and function The impact of habitat conversion for aquaculture purposes is measured in terms of the degree or level of change in the system’s ability to provide ecosystem services. Most prawn production in North America uses small ponds (<1 ha) on small farms (<3–5 ha), usually using lands that historically had been converted to pasture or cropland. Therefore, forest lands, coastal areas, and wetlands are not altered for construction of prawn production ponds. Any habitat impacts resulting from prawn aquaculture in earthen ponds will be minimal and accordingly maintain habitat functionality and ecosystem services. Therefore, Factor 3.1 scores 9 out of 10.
19
Factor 3.2. Habitat and farm siting management effectiveness (appropriate to the scale of the industry) Currently, the relatively small scale of the U.S. freshwater prawn industry indicates that the potential habitat impacts are minor. Most prawn production in North America utilizes small (<1 ha) purpose-constructed aquaculture ponds. Conversion of cropland to prawn ponds has occurred in the U.S.; however, the ponds are commonly located in areas of poorly drained soils where the row crop returns are low. In most U.S. states, government oversight is exercised as to where ponds can and cannot be constructed when there are flood plain conflicts. Under some circumstances, purview may fall under the Army Corps of Engineers. Pond construction guidelines are also available through the federal Natural Resources Conservation Service (NRCS 1997). Individual states exercise control of culture through the issue of culture permits that include effluent restrictions (based on total feed input), and the approval of use of non-native species. States requiring permits for prawn production are listed at (http://www.freshwaterprawn.org/links/permits.html). Other permitting and oversight requirements are similar to those for other pond-based species in the region. Appendix 1 at the end of this report contains all the numerical scores used in this report: Factor 3.2 has a numerical score of 6.75 and when combined with the Factor 3.1 score, the final numerical score for Criterion 3: Habitat is 8.25 out of 10.
20
Criterion 4: Evidence or Risk of Chemical Use Impact, unit of sustainability and principle Impact: Improper use of chemical treatments impacts non-target organisms and leads to
production losses and human health concerns due to the development of chemical-resistant organisms.
Sustainability unit: non-target organisms in the local or regional environment, presence of pathogens or parasites resistant to important treatments.
Principle: aquaculture operations by design, management or regulation avoid the discharge of chemicals toxic to aquatic life, and/or effectively control the frequency, risk of environmental impact and risk to human health of their use.
Criterion 4 Summary
Chemical Use parameters Score C4 Chemical Use Score 9.00 C4 Chemical Use Final Score 9.00 GREEN Critical? NO Brief Summary Although some chemicals have historically been used in prawn aquaculture, current small-scale and low-density practices avoid disease outbreaks and the subsequent need for treatment with chemicals. The use of any chemicals in U.S. prawn aquaculture is extremely rare, so Criterion 4: Chemical Use receives a score of 9.00 out of 10. Justification of Ranking Though published data on chemical use in prawn aquaculture is lacking, the author of this report has extensive personal experience in the industry and has relied on this experience to bridge any data gaps in the literature. Chemical use in prawn farming is minimal because freshwater prawns are not as susceptible to bacterial and viral diseases as marine shrimp, thus the need for chemical treatments is greatly reduced (Pillai, Johnson, and Bueno 2010). This characteristic may, in part, be due to farming prawns at much lower biomass densities than marine shrimp, and this minimizes the incidence of adverse water quality conditions (New et al. 2010). In early years, farming practices included the application of petroleum products to the surface of growout ponds prior to the stocking of prawns. This practice was designed to eliminate air breathing insects that were potentially predaceous on postlarvae or young juveniles that were stocked (D’Abramo et al. 1995). However, research indicated that vegetable oils could work just as well, so the use of petroleum products ceased (Bright et al. 2002). Currently, on commercial farms, larger juveniles are the choice for stocking and this pre-stocking treatment for insect control is no longer practiced.
21
Rotenone, a broad-spectrum insecticide and pesticide, had been recommended for eliminating potential finfish predators (Ogunsanya et al. 2011) but currently this treatment is no longer utilized in commercial production. Application of copper sulfate in prawn ponds for use as an algaecide has been considered, but cannot be safely used due to its toxicity to prawns at the recommended levels of application. In North America, any use of chemicals or therapeutants in the hatchery, nursery, or growout phases of freshwater prawn aquaculture is extremely rare and not part of any culture protocol. Therefore, the numerical score for Criterion 4: Chemicals is 9.00 out of 10.
22
Criterion 5: Feed Impact, unit of sustainability and principle Impact: feed consumption, feed type, ingredients used and the net nutritional gains or losses
vary dramatically between farmed species and production systems. Producing feeds and their ingredients has complex global ecological impacts, and their efficiency of conversion can result in net food gains, or dramatic net losses of nutrients. Feed use is considered to be one of the defining factors of aquaculture sustainability.
Sustainability unit: the amount and sustainability of wild fish caught for feeding to farmed fish, the global impacts of harvesting or cultivating feed ingredients, and the net nutritional gains or losses from the farming operation.
Principle: aquaculture operations source only sustainable feed ingredients, convert them efficiently and responsibly, and minimize and utilize the non-edible portion of farmed fish.
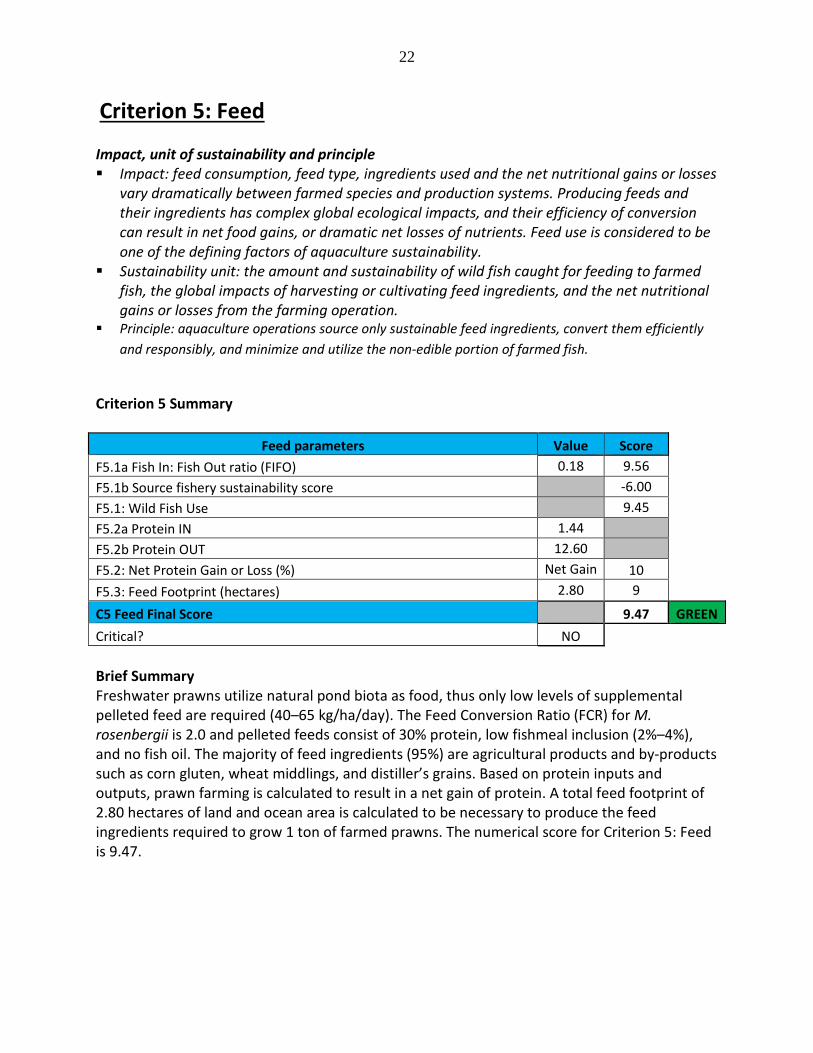
Criterion 5 Summary
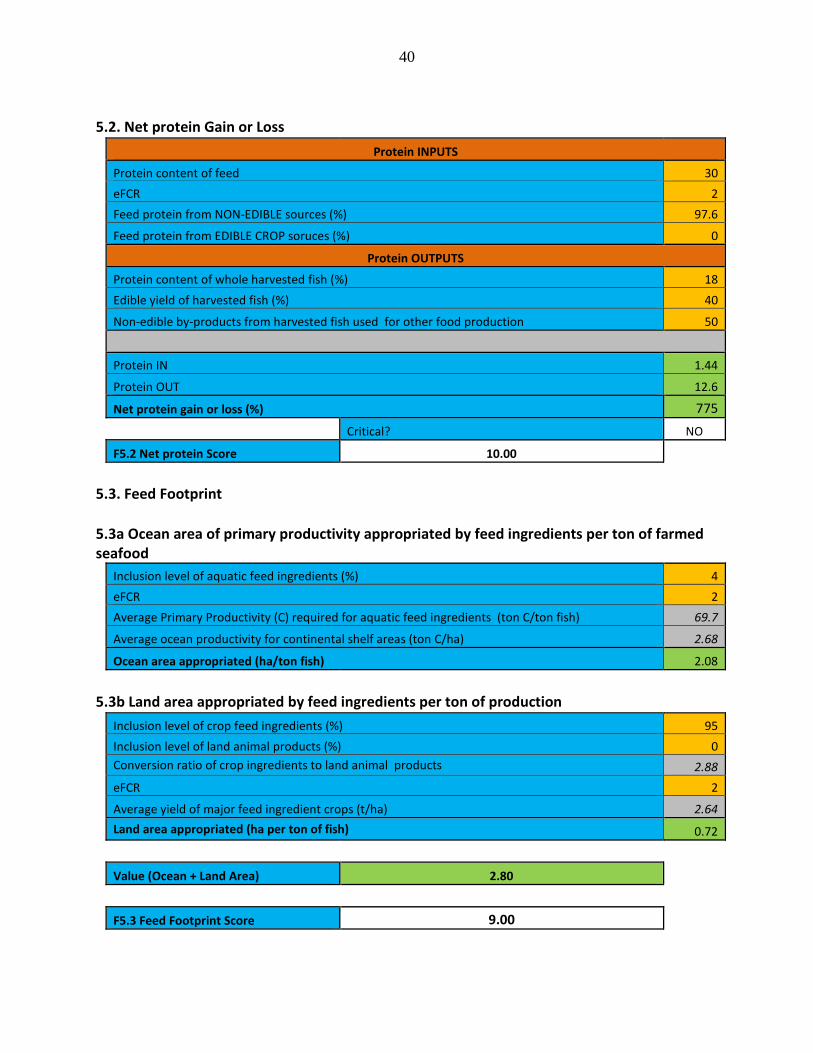
Feed parameters Value Score F5.1a Fish In: Fish Out ratio (FIFO) 0.18 9.56 F5.1b Source fishery sustainability score -6.00 F5.1: Wild Fish Use 9.45 F5.2a Protein IN 1.44 F5.2b Protein OUT 12.60 F5.2: Net Protein Gain or Loss (%) Net Gain 10 F5.3: Feed Footprint (hectares) 2.80 9 C5 Feed Final Score 9.47 GREEN Critical? NO Brief Summary Freshwater prawns utilize natural pond biota as food, thus only low levels of supplemental pelleted feed are required (40–65 kg/ha/day). The Feed Conversion Ratio (FCR) for M. rosenbergii is 2.0 and pelleted feeds consist of 30% protein, low fishmeal inclusion (2%–4%), and no fish oil. The majority of feed ingredients (95%) are agricultural products and by-products such as corn gluten, wheat middlings, and distiller’s grains. Based on protein inputs and outputs, prawn farming is calculated to result in a net gain of protein. A total feed footprint of 2.80 hectares of land and ocean area is calculated to be necessary to produce the feed ingredients required to grow 1 ton of farmed prawns. The numerical score for Criterion 5: Feed is 9.47.
23
Justification of Ranking Factor 5.1. Wild Fish Use Prawns are efficient omnivorous foragers, and culture at low-biomass densities in North America results in prawns being able to utilize natural pond biota for a majority of their diet (D’Abramo and New 2010). Due to this notable contribution of natural food, feeding rates are relatively low, <40 kg/ha/day in low input systems and <65 kg/ha/day in the more intensive systems (Tidwell and D’Abramo 2010). In low-input production systems, agricultural products and by-products such as corn gluten, wheat middlings, range cubes, and distiller’s grains are used rather than pelleted feeds (New et al 2010). Conversely, in more intensive commercial systems, pelleted feeds composed of wheat middling pellets, corn gluten pellets, range cubes and pellets, and dairy pellets, exclusively or in combination, have been successfully used as growout feeds. Pelleted feeds used contain relatively low levels of protein (30%). Diets made of Black Soldier Fly Larvae frass (excreta) are also being used in Ohio. Freshwater prawns exhibit a Feed Conversion Ratio (FCR) of 2.0 and pelleted feeds contain <2%–4% fishmeal inclusion and no fish oil (D’Abramo and New 2010). Half (50%) of the fishmeal utilized in feeds is sourced from processing by-products (D’Abramo and New 2010). Utilizing a global average of 22.5% fishmeal yield, the fish in:fish out (FIFO) value for fishmeal is calculated to be 0.18 (see Appendix 1 for calculations). This corresponds to an initial FIFO score of 9.56 out of 10. This FIFO score can be adjusted based on the relative sustainability of the source of wild fish (SSWF). Though it is recognized that only low levels of fishmeal are included, no information on the source of wild fishmeal used in prawn feeds was available at the time of this assessment, so a deduction of –6 is dictated by the SFW criteria based on unknown source fisheries and unknown sustainability. This corresponds to a SSWF adjustment of –0.11 and a final Factor 5.1 score of 9.45 out of 10, driven mainly by the low inclusion level of marine ingredients. Factor 5.2 Net protein gain or loss With respect to protein inputs, pelleted feeds contain 30% protein; this protein consists of both aquatic feed ingredients (fishmeal) and non-edible sources (wheat middling pellets, corn gluten pellets, range cubes and pellets, and dairy pellets). Since fishmeal itself is 60% protein, fishmeal constitutes 2.4% of the total protein in the feed. The remaining 97.6% of protein is from non-edible crop sources (New et al. 2010). With respect to protein outputs, the protein content of whole harvested farmed prawns is 18% (Boyd 2007) and the edible yield is 40%. Seafood Watch criteria presume that 50% of non-edible by-products from harvested prawns are used for other food production. As shown in the calculations in Appendix 1, freshwater prawn farming results in an overall net gain of protein, based on the utilization of natural pond biota as food as well as the high use of non-edible crop ingredients. This net protein gain results in a Factor 5.2 score of 10 out of 10.
24
Factor 5.3 Feed footprint With respect to feed footprint, the 4% fishmeal inclusion and 0% fish oil inclusion results in an ocean area of 2.08 hectares being required to produce the aquatic ingredients necessary to grow 1 ton of farmed prawns (see Appendix 1 for calculations). There is a 95% inclusion level of crop feed ingredients and 0% inclusion of land animal ingredients; the remaining 1% of feed ingredients consists of vitamins, minerals, and/or other feed additives. This level of terrestrial ingredient inclusion corresponds to a land area of 0.72 hectares being required to produce the ingredients necessary to grow 1 ton of farmed prawns. When the ocean and land areas are combined, the total feed footprint is calculated to be 2.80 hectares, corresponding to a Factor 5.3 score of 9 out of 10. This high score is again driven by the prawns efficient foraging ability and relatively low biomass densities and feeding rates. The final Criterion 5: Feed score is 9.47 out of 10. This high score is based on the utilization of natural food products in the ponds, low feeding rates, low levels of fishmeal inclusion, no inclusion of fish oil, a net protein gain, and a small feed footprint.

25
Criterion 6: Escapes Impact, unit of sustainability and principle Impact: competition, genetic loss, predation, habitat damage, spawning disruption, and
other impacts on wild fish and ecosystems resulting from the escape of native, non-native and/or genetically distinct fish or other unintended species from aquaculture operations.
Sustainability unit: affected ecosystems and/or associated wild populations. Principle: aquaculture operations pose no substantial risk of deleterious effects to wild
populations associated with the escape of farmed fish or other unintentionally introduced species.
Criterion 6 Summary
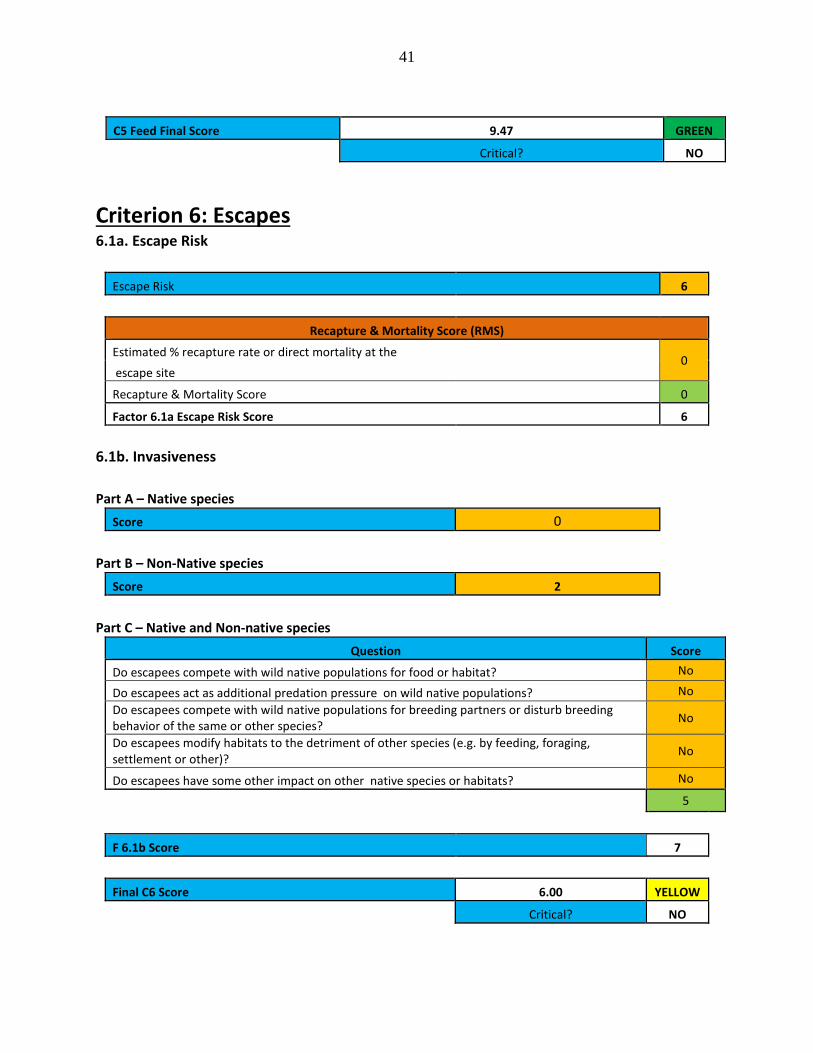
Escape parameters Value Score F6.1 Escape Risk 6.00 F6.1a Recapture and mortality (%) 0 F6.1b Invasiveness 6 C6 Escape Final Score 6.00 YELLOW Critical? NO
Brief Summary
The escape risk from static ponds (0%–3% water exchange per day) is considered low to moderate and results in a score of 6 out of 10 for Factor 6.1a. Freshwater prawns are non-native to the regions where they are cultured; however, they are not established and are highly unlikely to survive or establish viable populations due to temperature-related mortality (<15 oC) and salinity requirements for breeding (13–15 ppt). Though recognized as being short-lived, any prawns that do escape are expected to compete to some extent with native populations for food. The numerical score for Criterion 6: Escapes is 6.00 out of 10. Justification of Ranking Factor 6.1a. Escape risk Prawn production ponds have 0% daily water exchange and are only drained at harvest. Drain pipes are screened (D’Abramo, Silva and Frinsko 2009), but if a screen did fail, receiving waters are only short-term viable habitats for M. rosenbergii. In the continental U.S., ponds are drained in the fall (September–October), just weeks before water temperatures lethal to prawns (<15 oC) occur (New et al. 2010). Freshwater prawn culture has a history of over 40 years of research and commercial culture in the continental U.S., and reproducing populations outside the areas of culture have never been encountered. Once ponds are stocked, the opportunity for escape is minimal. In the U.S., summer production months are not subject to seasonal spring flooding, so escape of prawns due to floods is highly unlikely and has yet to be documented. Drain pipes in production ponds are screened. Even if
26
standpipe screens are not present, the standpipes pull from the top of the pond and prawns are benthic (live on the pond bottom). At harvest, standpipes are dropped and if a screen became dislodged, prawns could be lost; however’ most ponds drain to pasture land. Prawns that chanced to reach a water body at harvest would be exposed to lethal temperatures within a few weeks. Even if a thermal refuge were found, the need for saline water (13–15 ppt) for reproduction acts as a secondary control mechanism whereby reproducing populations are precluded from being established. Temporary survival of incidental release would not be sufficient to affect populations in receiving waters. Additionally, ponds can only be constructed within a 100-year flood plain through the issue of special permits. In most U.S. states, government oversight is exercised in reference to where ponds can and cannot be built relative to flood plain conflicts. Under some circumstances the issue of permits is controlled by the Army Corps of Engineers. Guidelines for pond construction are available from the Federal Natural Resources Conservation Service (NRCS 1997). State requirements to receive approval for culture, to meet effluent restrictions (based on total feed input), and grow a non-native species also exist. All U.S. states have a fish and wildlife or natural resource agency that determines whether a non-native species can be farmed, by judging whether it poses a threat to native species or habitats. The escape risk score can be adjusted based on evidence of recapture or direct mortality of escapes. Because no evidence in this regard is available, no adjustment has been applied. Based on the low daily water exchange in prawn ponds, the Factor 6.1a escape risk score is 6 out of 10. Factor 6.1b. Invasiveness M. rosenbergii is not native to North America but is not considered to be a highly invasive species. Although at least one report of escaped prawns being captured from the wild exists (Woodley et al 2002), the documented winter temperatures are too low for prawn survival and salinity levels are too low for reproduction. No evidence is available to substantiate reproduction of escaped individuals over the subsequent decade. There are no documented reports of the establishment of breeding populations of prawns that were introduced for aquaculture outside their native range (New et al. 2010). Because prawns are not established and are highly unlikely to survive or establish viable populations if they do escape, Factor 6.1b Part B (for non-native species) scores 2 out of 2.5. Both native and non-native species have the potential to impact surrounding ecosystems when they escape from farm systems. With respect to freshwater prawns, though the likelihood of establishment is null, any escapees are presumed to interact with native wild populations to some degree. For example, it is expected that, to some extent, escapees compete with wild native populations for food and add additional predation pressure on prey populations. However, escapees are not expected to compete with native wild populations for breeding partners, modify habitat to the detriment of other species, or have any additional impacts. For Factor 6.1b, Part C, the score is 4 out of 5.

27
When Parts B and C are combined, the numerical score for Factor 6.1b is 6 out of 10. The scores for Factors 6.1a and 6.1b combine to give a final Criterion 6: Escapes score of 6.00 out of 10.
28
Criterion 7: Disease; pathogen and parasite interactions Impact, unit of sustainability and principle Impact: amplification of local pathogens and parasites on fish farms and their
retransmission to local wild species that share the same water body. Sustainability unit: wild populations susceptible to elevated levels of pathogens and
parasites. Principle: aquaculture operations pose no substantial risk of deleterious effects to wild
populations through the amplification and retransmission of pathogens or parasites.
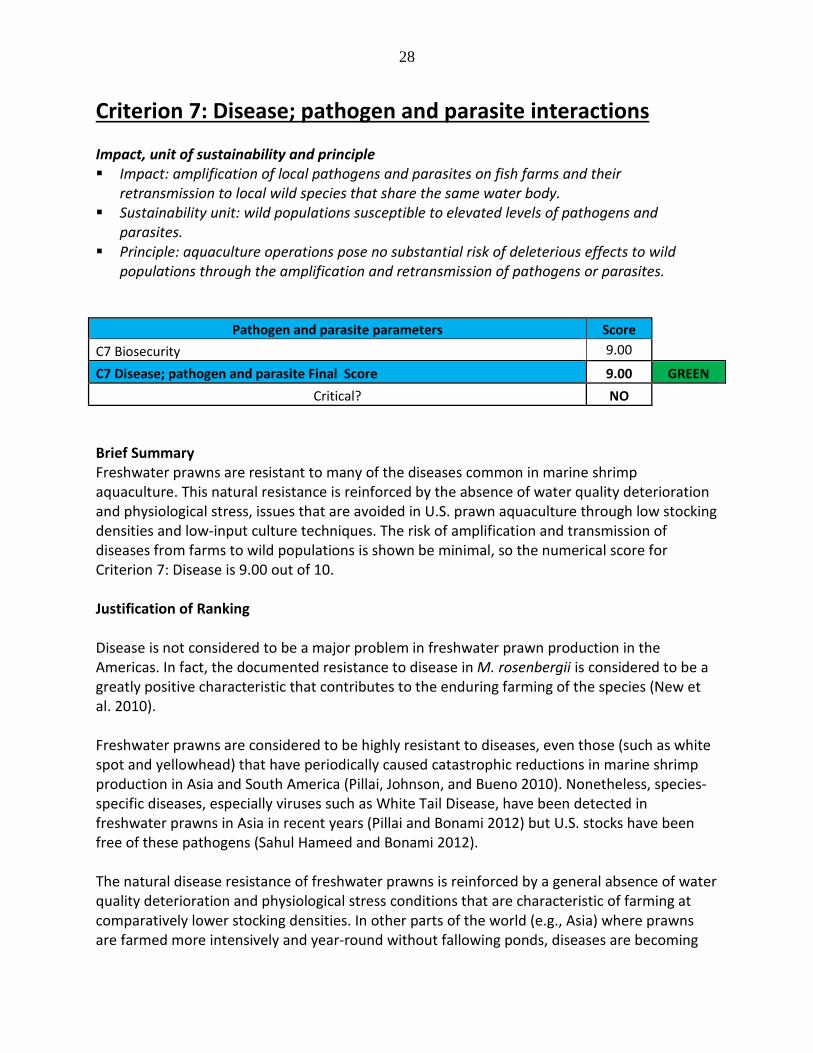
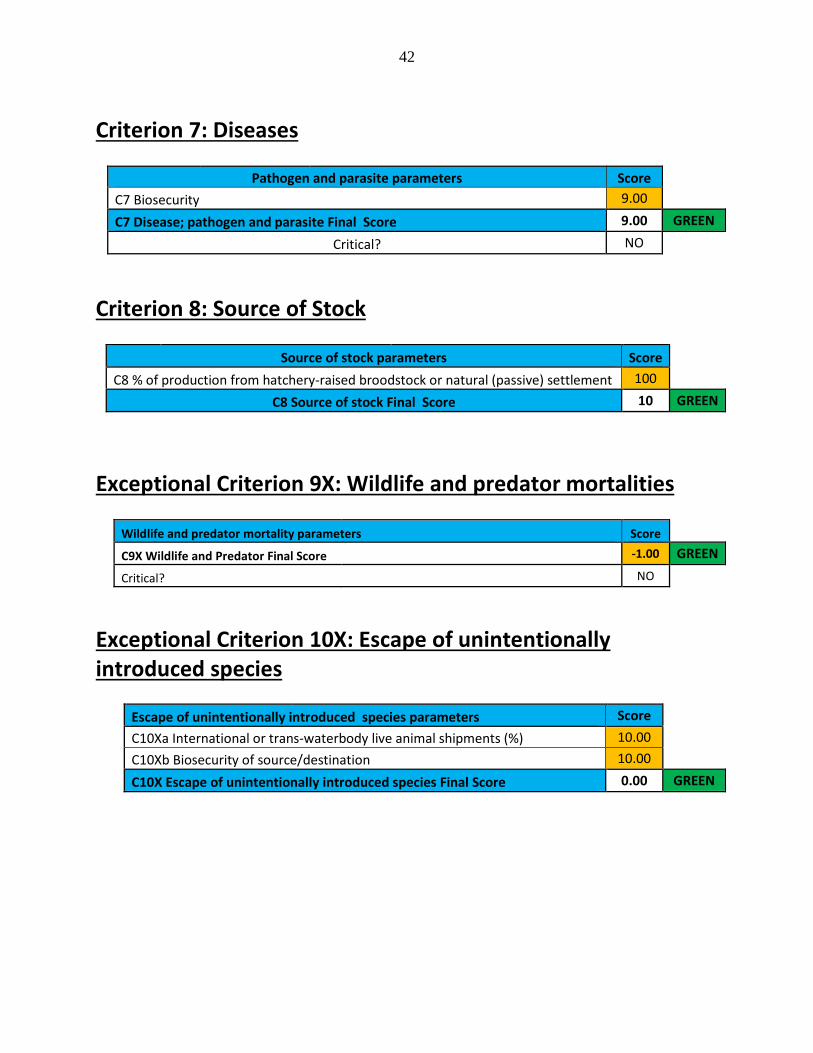
Pathogen and parasite parameters Score C7 Biosecurity 9.00 C7 Disease; pathogen and parasite Final Score 9.00 GREEN
Critical? NO
Brief Summary Freshwater prawns are resistant to many of the diseases common in marine shrimp aquaculture. This natural resistance is reinforced by the absence of water quality deterioration and physiological stress, issues that are avoided in U.S. prawn aquaculture through low stocking densities and low-input culture techniques. The risk of amplification and transmission of diseases from farms to wild populations is shown be minimal, so the numerical score for Criterion 7: Disease is 9.00 out of 10. Justification of Ranking Disease is not considered to be a major problem in freshwater prawn production in the Americas. In fact, the documented resistance to disease in M. rosenbergii is considered to be a greatly positive characteristic that contributes to the enduring farming of the species (New et al. 2010). Freshwater prawns are considered to be highly resistant to diseases, even those (such as white spot and yellowhead) that have periodically caused catastrophic reductions in marine shrimp production in Asia and South America (Pillai, Johnson, and Bueno 2010). Nonetheless, species-specific diseases, especially viruses such as White Tail Disease, have been detected in freshwater prawns in Asia in recent years (Pillai and Bonami 2012) but U.S. stocks have been free of these pathogens (Sahul Hameed and Bonami 2012). The natural disease resistance of freshwater prawns is reinforced by a general absence of water quality deterioration and physiological stress conditions that are characteristic of farming at comparatively lower stocking densities. In other parts of the world (e.g., Asia) where prawns are farmed more intensively and year-round without fallowing ponds, diseases are becoming

29
more of a concern. In addition, exchange of broodstock and seed stock within these regions without any health controls has increased transmission of pathogens. Though prawns are susceptible to certain common bacterial and fungal diseases affecting most crustacean species, the risk of disease amplification and transmission to wild populations in the U.S. is shown to be minimal. The numerical score for Criterion 7: Disease is 9.00 out of 10.

30
Criterion 8: Source of Stock – independence from wild fisheries Impact, unit of sustainability and principle Impact: the removal of fish from wild populations for on-growing to harvest size in farms. Sustainability unit: wild fish populations. Principle: aquaculture operations use eggs, larvae, or juvenile fish produced from farm-
raised broodstocks thereby avoiding the need for wild capture.
Source of stock parameters Score C8 % of production from hatchery-raised broodstock or natural (passive) settlement 100
C8 Source of stock Final Score 10.00 GREEN Justification of Ranking Prawn production in North America relies exclusively on hatchery produced post-larvae (PLs) for pond stocking (Tidwell 2012). Broodstock for hatcheries are sourced from production ponds. Therefore, there is no dependence on wild stocks for seed and the numerical score for Criterion 8 :Source of Stock is 10.00 out of 10.
31
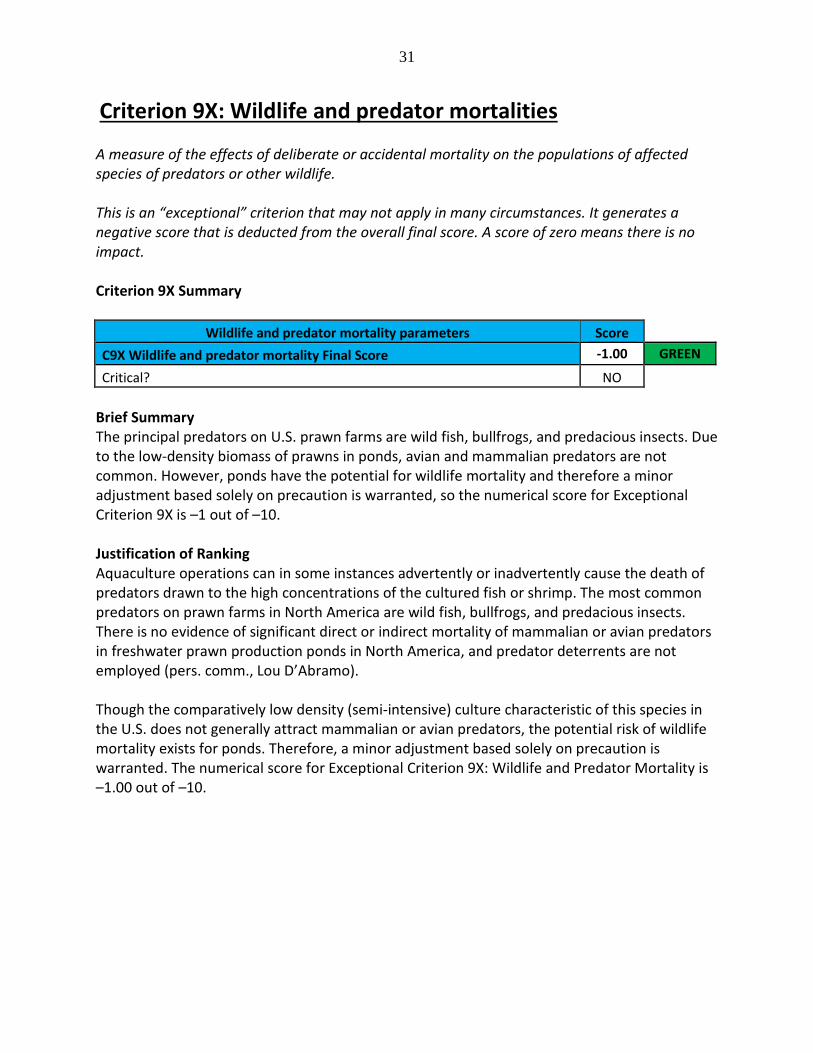
Criterion 9X: Wildlife and predator mortalities A measure of the effects of deliberate or accidental mortality on the populations of affected species of predators or other wildlife. This is an “exceptional” criterion that may not apply in many circumstances. It generates a negative score that is deducted from the overall final score. A score of zero means there is no impact. Criterion 9X Summary
Wildlife and predator mortality parameters Score C9X Wildlife and predator mortality Final Score -1.00 GREEN
Critical? NO Brief Summary The principal predators on U.S. prawn farms are wild fish, bullfrogs, and predacious insects. Due to the low-density biomass of prawns in ponds, avian and mammalian predators are not common. However, ponds have the potential for wildlife mortality and therefore a minor adjustment based solely on precaution is warranted, so the numerical score for Exceptional Criterion 9X is –1 out of –10. Justification of Ranking Aquaculture operations can in some instances advertently or inadvertently cause the death of predators drawn to the high concentrations of the cultured fish or shrimp. The most common predators on prawn farms in North America are wild fish, bullfrogs, and predacious insects. There is no evidence of significant direct or indirect mortality of mammalian or avian predators in freshwater prawn production ponds in North America, and predator deterrents are not employed (pers. comm., Lou D’Abramo). Though the comparatively low density (semi-intensive) culture characteristic of this species in the U.S. does not generally attract mammalian or avian predators, the potential risk of wildlife mortality exists for ponds. Therefore, a minor adjustment based solely on precaution is warranted. The numerical score for Exceptional Criterion 9X: Wildlife and Predator Mortality is –1.00 out of –10.
32
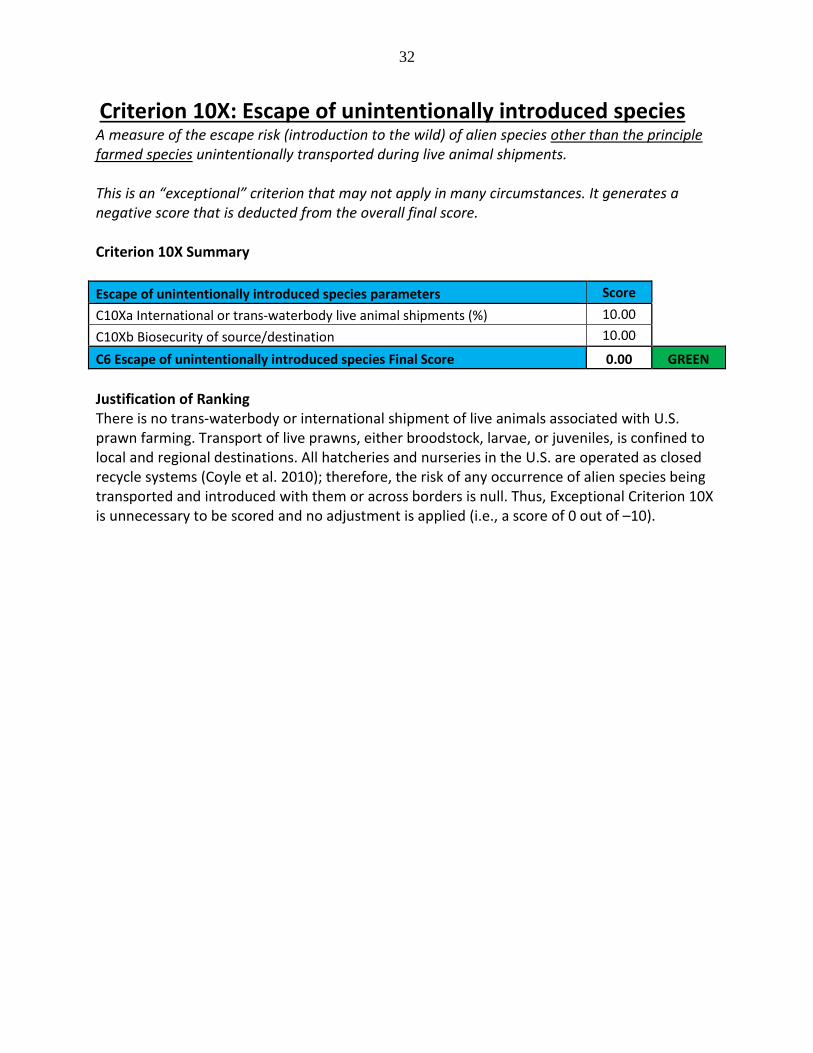
Criterion 10X: Escape of unintentionally introduced species A measure of the escape risk (introduction to the wild) of alien species other than the principle farmed species unintentionally transported during live animal shipments. This is an “exceptional” criterion that may not apply in many circumstances. It generates a negative score that is deducted from the overall final score. Criterion 10X Summary Escape of unintentionally introduced species parameters Score C10Xa International or trans-waterbody live animal shipments (%) 10.00 C10Xb Biosecurity of source/destination 10.00 C6 Escape of unintentionally introduced species Final Score 0.00 GREEN Justification of Ranking There is no trans-waterbody or international shipment of live animals associated with U.S. prawn farming. Transport of live prawns, either broodstock, larvae, or juveniles, is confined to local and regional destinations. All hatcheries and nurseries in the U.S. are operated as closed recycle systems (Coyle et al. 2010); therefore, the risk of any occurrence of alien species being transported and introduced with them or across borders is null. Thus, Exceptional Criterion 10X is unnecessary to be scored and no adjustment is applied (i.e., a score of 0 out of –10).
33
Acknowledgements Scientific review does not constitute an endorsement of the Seafood Watch® program, or its seafood recommendations, on the part of the reviewing scientists. Seafood Watch® is solely responsible for the conclusions reached in this report. Seafood Watch® would like to thank Dr. Louis R. D'Abramo, Mississippi State University (retired), Dr. William H. Daniels, Auburn University, and Laura Tiu, Ohio State University, for graciously reviewing this report for scientific accuracy.

34
References Boyd, C. and Zimmerman, S., 2010. Grow-out systems – Water quality and soli management. In: Freshwater Prawns: Biology and Farming (ed. by M.B. New, W.C. Valenti, J.H. Tidwell, L.R. D’Abramo, and M.N Kutty). Pp.256-277. Wiley-Blackwell Allied Publishers. Oxford, United Kingdom . Bright, L.A., Coyle, S., VanArnum, A. & Tidwell, J.H. 2002. Laboratory evaluation of the relative effectiveness of plant and animal source oils for control of Notonectidae in fish ponds. North American Journal of Aquaculture 64(3):210-211. Brown, J H., New, M.B. and Ismael, D., 2010. Biology. In: Freshwater Prawns: Biology and Farming (ed. by M.B. New, W.C. Valenti, J.H. Tidwell, L.R. D’Abramo, and M.N Kutty). Pp.256-277. Wiley-Blackwell Allied Publishers. Oxford, United Kingdom. Coyle, S.D. Alston, D.E. and Sampaio, M.S. 2010. Nursery System and Management. In: Freshwater Prawns: Biology and Farming (ed. by M.B. New, W.C. Valenti, J.H. Tidwell, L.R. D’Abramo, and M.N Kutty). Pp.108-126. Wiley-Blackwell Allied Publishers. Oxford, United Kingdom. D’Abramo, L.R. Daniels, W.H. , Fondren, M. and Brunson, M.W. 1995. Management practices for the culture of freshwater prawn (Macrobrachium rosenbergii) in temperate climates. Mississippi Agriculture and Forestry Experiment Station Technical Bulletin 1030. Mississippi State University, Mississippi. D’Abramo, L.R. and New, M.B., 2010. Nutrition, feeds and feeding. In: Freshwater Prawns: Biology and Farming (ed. by M.B. New, W.C. Valenti, J.H. Tidwell, L.R. D’Abramo, and M.N Kutty). Pp.256-277. Wiley-Blackwell Allied Publishers. Oxford, United Kingdom. D’Abramo, L.R., Silva J. and Frinsko, M. 2011. Sustainable Farming of Freshwater Prawns and the Assurance of Product Quality. Mississippi Agriculture and Forestry Experiment Station Technical Bulletin 1188. Mississippi State University, Mississippi. D’Abramo, L.R. Tidwell, J.H. , Fondren, M. and Ohs, C.L. 2006. Pond production of the freshwater prawn in temperate climates. Publication Number 484. Southern Regional Aquaculture Center, Stoneville, Mississippi. Food and Agriculture Organization (2010) Fishstat Plus Version 2, 30, FAO Available at: http://www.fao.org/fi/statist/FISOFT/FISHPLUS. (accessed March, 2010). Holthuis, L.B. and Ng, P.K.L. , 2010. Nomenclature and taxonomy. In: Freshwater Prawns: Biology and Farming (ed. by M.B. New, W.C. Valenti, J.H. Tidwell, L.R. D’Abramo, and M.N Kutty). Pp.256-277. Wiley-Blackwell Allied Publishers. Oxford, United Kingdom.
35
Hongtuo, F., Sufei, J. and Yiwei, X. 2012. Current status and prospects of farming the giant river prawn (Macrobrachium rosenbergii De Man 1879) and the oriental river prawn (Macrobrachium nipponense) in China. Aquaculture Research 43 (7): 993-998. Marques, H.L.A. and Moraes-Valenti, P.M.C. 2012. Current status and prospects of farming the giant river prawn (Macrobrachium rosenbergii (De Man1879) and the Amazon river prawn (Macrobrachium amazonicum (Heller 1862) in Brazil. Aquaculture Research 43:984-992. Nair, C.M., and Salin, K.R. 2012. Current status and prospects of farming the giant river prawn Macrobrachium rosenbergii (De Man) and the monsoon river prawn Macrobrachium malcomsonii, (H.M. Edwards) in India. Aquaculture Research 43:999-1014. Na-Nakorn, U. and Jintasataporn, O. 2012. Current status and prospects of farming the giant river prawn (Macrobrachium de Man 1879) in Thailand. Aquaculture Research 43:1015-1022. National Fisheries Institute. 2013. Top ten consumed seafoods. http://www.aboutseafood.com/about/about-seafood/top-10-consumed-seafoods .Accessed 040213. National Marine Fisheries Service. 2013. Current Fisheries Statistics No. 2011-12. Imports and exports of fishery Products: Annual Summary. 011http://www.st.nmfs.noaa.gov/st1/trade/documents/TRADE2011.pdf. Accessed 040313. New M.B., and Nair C.M. 2012. Global scale of freshwater prawn farming. Aquaculture Research 43. 960-969. New M.B., D’Abramo, L.R., Valenti, W. C., and Singholka, S.. 2010. Sustainability of freshwater prawn culture. In: Freshwater Prawns: Biology and Farming (ed. by M.B. New, W.C. Valenti, J.H. Tidwell, L.R. D’Abramo, and M.N Kutty). Pp. 524-530. Wiley-Blackwell Allied Publishers. Oxford, United Kingdom. NRCS (Natural Resources Conservation Services. 1997. Ponds- Planning, Design, construction. Agricultural Handbook 590. United States Department of Agriculture, Washington. 96ppg. Ogunsanya, T., Durborow, R.M., Webster, C.D., Tidwell, J.H., Thompson, K.R., Coyle, S., Jarboe, H.H., Huang, L. & Wang, C. 2011. Acute toxicity of rotenone to the giant river prawn Macrobrachium rosenbergii. North American Journal of Aquaculture. 73(2):159-163. Osunde, I.M., Coyle, S.D. & Tidwell, J.H. 2003. Acute toxicity of copper to juvenile freshwater prawns, Macrobrachium rosenbergii. Journal of Applied Aquaculture 14(3-4):71-80.
36
Pillai, D., Johnson, S.K. and Bueno, S.L.S. 2010.Health Management. In: Freshwater Prawns: Biology and Farming (ed. by M.B. New, W.C. Valenti, J.H. Tidwell, L.R. D’Abramo, and M.N. Kutty). Pp.256-277. Wiley-Blackwell Allied Publishers. Oxford, United Kingdom. Pillai D. & Bonami J.R. 2012. A review on the diseases of freshwater prawns with special focus on white tail disease of Macrobrachium rosenbergii. Aquaculture Research 43: 1029-1037. Sahul Hameed & Bonami J.R. 2012. White tail disease of freshwater prawn Macrobrachium rosenbergii. Indian Journal of Virology 23(2): 134–140. Seafood Watch. Freshwater Prawn Factsheet. http://www.montereybayaquarium.org//cr/SeafoodWatch/web/sfw_factsheet.aspx?fid=247. Accessed 062313. Sealy, W.M., Barziza, D.E. Davis, J.T. and Gatlin, D. M. 1999. Characterization and management of Effluents from aquaculture ponds in the southeastern United States. SRAC Publication No. 470. Texas A&M University, College Station, TX. Tidwell, J.H., Coyle, S.D., Dasgupta, S., Bright, L.A. & Yasharian, D.K. 2004. Impact of different management technologies on the production, population structure, and economics of freshwater prawn Macrobrachium rosenbergii culture in temperate climates. Journal of the World Aquaculture Society 35(4):498-505. Tidwell, J.H., D’Abramo, L.R., Coyle, S.D. & Yasharian, D.K. 2005. Overview of recent research and development in temperate culture of the freshwater prawn (Macrobrachium rosenbergii, de Man) in the South Central United States. Aquaculture Research. 36:264-277. Tidwell, J.H. and D’Abramo, L. R. 2010. Grow-out Systems – Culture in Temperate Zones. In: Freshwater Prawns: Biology and Farming (ed. by M.B. New, W.C. Valenti, J.H. Tidwell, L.R. D’Abramo, and M.N. Kutty). Pp.180-194. Wiley-Blackwell Allied Publishers. Oxford, United Kingdom. Tidwell, J.H. 2012. Current status and prospects of farming the giant river prawn (Macrobrachium rosenbergii De Man 1879) in the United States. Aquaculture Research 43 (7): 1023-1028. USDA-ERS (2013). Aquaculture Data. http://www.ers.usda.gov/data-products/aquaculture-data.aspx. Accessed 040213. USDA-National Agricultural Statistics Service. 2006. Census of Aquaculture (2005). Volume 3, Special Studies, Part 2. 88p and appendicies. Wahab, M.A., Nahid, S.A.a., Ahmad, No., Hague, M.M. and Karim, M. 2012. Current status and prospects of farming the giant river prawn in Bangladesh. Aquaculture Research 43:970-983.
37
Woodley C.M., Slack W.T., Peterson M.S., and Vervaeke, W.C. 2002. Occurrence of the non-indigenous Giant Malaysian Prawn (Macrobrachium rosenbergii De Man 1879) in Simmons Bayou, Mississippi. Crustaceana 75 (8): 1025-1031
Appendix 1 – Data points and all scoring calculations This is a condensed version of the criteria and scoring sheet to provide access to all data points and calculations. See the Seafood Watch Aquaculture Criteria document for a full explanation of the criteria, calculations and scores. Yellow cells represent data entry points.
Criterion 1: Data quality and availability Data Category Relevance (Y/N) Data Quality Score (0-10) Industry or production statistics Yes 7.5 7.5 Effluent Yes 7.5 7.5 Locations/habitats Yes 7.5 7.5 Predators and wildlife Yes 7.5 7.5 Chemical use Yes 5 5 Feed Yes 10 10 Escapes, animal movements Yes 7.5 7.5 Disease Yes 7.5 7.5 Source of stock Yes 10 10 Other – (e.g. GHG emissions) No 7.5 n/a Total 70 C1 Data Final Score 7.777777778 GREEN
38
Criterion 2: Effluent Effluent Evidence-Based Assessment C2 Effluent Final Score 8.00 GREEN
Criterion 3: Habitat 3.1. Habitat conversion and function F3.1 Score 9 3.2 Habitat and farm siting management effectiveness (appropriate to the scale of the industry) Factor 3.2a - Regulatory or management effectiveness Question Scoring Score
1 - Is the farm location, siting and/or licensing process based on ecological principles, including an EIAs requirement for new sites? Moderately 0.5
2 - Is the industry’s total size and concentration based on its cumulative impacts and the maintenance of ecosystem function? Moderately 0.5
3 – Is the industry’s ongoing and future expansion appropriate locations, and thereby preventing the future loss of ecosystem services? Yes 1
4 - Are high-value habitats being avoided for aquaculture siting? (i.e. avoidance of areas critical to vulnerable wild populations; effective zoning, or compliance with international agreements such as the Ramsar treaty)
Yes 1
5 - Do control measures include requirements for the restoration of important or critical habitats or ecosystem services? Mostly 0.75
3.75
Factor 3.2b - Siting regulatory or management enforcement Question Scoring Score
1 - Are enforcement organizations or individuals identifiable and contactable, and are they appropriate to the scale of the industry?
Yes 1
2 - Does the farm siting or permitting process function according to the zoning or other ecosystem-based management plans articulated in the control measures?
Mostly 0.75
3 - Does the farm siting or permitting process take account of other farms and their cumulative impacts?
Yes 1
4 - Is the enforcement process transparent - e.g. public availability of farm locations and sizes, EIA reports, zoning plans, etc?
Mostly 0.75
5 - Is there evidence that the restrictions or limits defined in the control measures are being achieved?
Yes 1
4.5

39
F3.2 Score (2.2a*2.2b/2.5) 6.75 C3 Habitat Final Score 8.25 GREEN Critical? NO
Criterion 4: Evidence or Risk of Chemical Use Chemical Use parameters Score C4 Chemical Use Score 9.00 C4 Chemical Use Final Score 9.00 GREEN
Critical? NO
Criterion 5: Feed 5.1. Wild Fish Use Factor 5.1a - Fish In: Fish Out (FIFO) Fishmeal inclusion level (%) 4 Fishmeal from by-products (%) 50 % FM 2 Fish oil inclusion level (%) 0 Fish oil from by-products (%) 0 % FO 0 Fishmeal yield (%) 22.5 Fish oil yield (%) 5 eFCR 2 FIFO fishmeal 0.18 FIFO fish oil 0.00 Greater of the 2 FIFO scores 0.18 FIFO Score 9.56 Factor 5.1b - Sustainability of the Source of Wild Fish (SSWF)
SSWF -6 SSWF Factor -0.106666667 F5.1 Wild Fish Use Score 9.45
40
5.2. Net protein Gain or Loss Protein INPUTS Protein content of feed 30 eFCR 2 Feed protein from NON-EDIBLE sources (%) 97.6
Feed protein from EDIBLE CROP soruces (%) 0
Protein OUTPUTS Protein content of whole harvested fish (%) 18 Edible yield of harvested fish (%) 40
Non-edible by-products from harvested fish used for other food production 50
Protein IN 1.44
Protein OUT 12.6
Net protein gain or loss (%) 775
Critical? NO
F5.2 Net protein Score 10.00 5.3. Feed Footprint 5.3a Ocean area of primary productivity appropriated by feed ingredients per ton of farmed seafood Inclusion level of aquatic feed ingredients (%) 4 eFCR 2 Average Primary Productivity (C) required for aquatic feed ingredients (ton C/ton fish) 69.7
Average ocean productivity for continental shelf areas (ton C/ha) 2.68
Ocean area appropriated (ha/ton fish) 2.08 5.3b Land area appropriated by feed ingredients per ton of production Inclusion level of crop feed ingredients (%) 95 Inclusion level of land animal products (%) 0 Conversion ratio of crop ingredients to land animal products 2.88 eFCR 2
Average yield of major feed ingredient crops (t/ha) 2.64
Land area appropriated (ha per ton of fish) 0.72
Value (Ocean + Land Area) 2.80
F5.3 Feed Footprint Score 9.00
41
C5 Feed Final Score 9.47 GREEN
Critical? NO
Criterion 6: Escapes 6.1a. Escape Risk Escape Risk 6
Recapture & Mortality Score (RMS)
Estimated % recapture rate or direct mortality at the 0
escape site
Recapture & Mortality Score 0
Factor 6.1a Escape Risk Score 6 6.1b. Invasiveness Part A – Native species Score 0 Part B – Non-Native species Score 2 Part C – Native and Non-native species Question Score Do escapees compete with wild native populations for food or habitat? No
Do escapees act as additional predation pressure on wild native populations? No
Do escapees compete with wild native populations for breeding partners or disturb breeding behavior of the same or other species? No
Do escapees modify habitats to the detriment of other species (e.g. by feeding, foraging, settlement or other)? No
Do escapees have some other impact on other native species or habitats? No
5
F 6.1b Score 7 Final C6 Score 6.00 YELLOW Critical? NO
42
Criterion 7: Diseases Pathogen and parasite parameters Score C7 Biosecurity 9.00 C7 Disease; pathogen and parasite Final Score 9.00 GREEN
Critical? NO
Criterion 8: Source of Stock Source of stock parameters Score C8 % of production from hatchery-raised broodstock or natural (passive) settlement 100 C8 Source of stock Final Score 10 GREEN
Exceptional Criterion 9X: Wildlife and predator mortalities Wildlife and predator mortality parameters Score
C9X Wildlife and Predator Final Score -1.00 GREEN
Critical? NO
Exceptional Criterion 10X: Escape of unintentionally introduced species Escape of unintentionally introduced species parameters Score C10Xa International or trans-waterbody live animal shipments (%) 10.00 C10Xb Biosecurity of source/destination 10.00 C10X Escape of unintentionally introduced species Final Score 0.00 GREEN