Embed Size (px)
Citation preview
WP/14/87
Central Bank Financial Strength in Central America and the Dominican Republic
Andrew Swiston, Florencia Frantischek, Przemek Gajdeczka, and Alexander Herman
© 2014 International Monetary Fund WP/14/87
IMF Working Paper
Western Hemisphere
Central Bank Financial Strength in Central America and the Dominican Republic
Prepared by Andrew Swiston, Florencia Frantischek, Przemek Gajdeczka, and Alexander Herman
May 2014
Abstract*
This paper examines the financial strength of central banks in Central America and the Dominican Republic (CADR). Some central banks are working off the effects of intervention in distressed financial institutions during the 1990’s and early 2000’s. Their net income has improved since then owing to lower interest rates, a reduction in interest-bearing debt, and recapitalization transfers. Claims on the government have fallen, but remain high and are typically reimbursed at below-market rates, and capital is negative when adjusting for this. Capital is sufficient to back a low inflation target given that the income position is supported by unremunerated reserve requirements. Capital is likely to increase over time, but only gradually, leaving countries vulnerable to macroeconomic risks. The capacity of CADR central banks to engage in macroeconomic stabilization would benefit from increased emphasis on low inflation as the primary objective of monetary policy and a stronger commitment by governments to recapitalization.
JEL Classification Numbers: E02, E42, E52, E58
Keywords: central bank, central bank financial strength, money demand, recapitalization, Central America, Costa Rica, Dominican Republic, Guatemala, Honduras, Nicaragua
Authors’ E-Mail Addresses: [email protected]; [email protected]; [email protected]
* The authors would like to thank staff at the central banks of Costa Rica, the Dominican Republic, Guatemala,Honduras, and Nicaragua who filled out questionnaires and provided data for this project. The authors would also like to thank Harold Zavarce and Ewa Gradzka, who worked on the project in its early stages.
This Working Paper should not be reported as representing the views of the IMF. The views expressed in this Working Paper are those of the author(s) and do not necessarily represent those of the IMF or IMF policy. Working Papers describe research in progress by the author(s) and are published to elicit comments and to further debate.
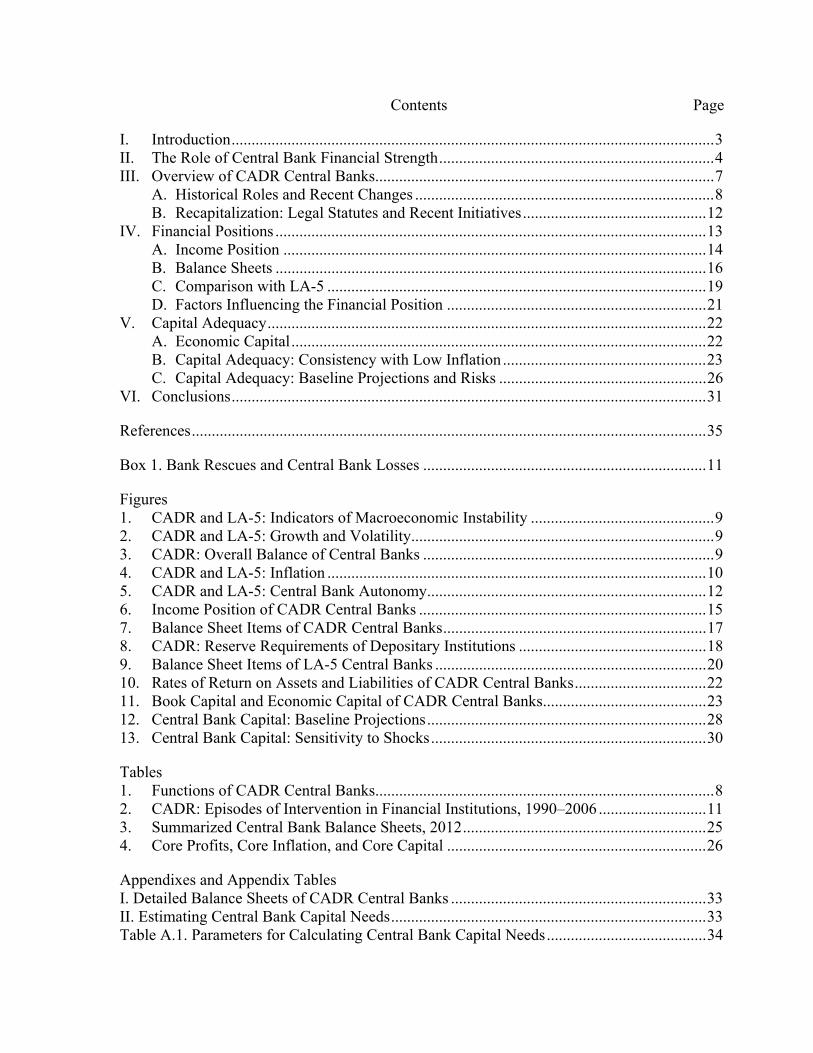
Contents Page
I. Introduction ......................................................................................................................... 3 II. The Role of Central Bank Financial Strength ..................................................................... 4 III. Overview of CADR Central Banks ..................................................................................... 7 A. Historical Roles and Recent Changes ........................................................................... 8 B. Recapitalization: Legal Statutes and Recent Initiatives .............................................. 12 IV. Financial Positions ............................................................................................................ 13 A. Income Position .......................................................................................................... 14 B. Balance Sheets ............................................................................................................ 16 C. Comparison with LA-5 ............................................................................................... 19 D. Factors Influencing the Financial Position ................................................................. 21 V. Capital Adequacy .............................................................................................................. 22 A. Economic Capital ........................................................................................................ 22 B. Capital Adequacy: Consistency with Low Inflation ................................................... 23 C. Capital Adequacy: Baseline Projections and Risks .................................................... 26 VI. Conclusions ....................................................................................................................... 31
References ................................................................................................................................. 35
Box 1. Bank Rescues and Central Bank Losses ....................................................................... 11
Figures 1. CADR and LA-5: Indicators of Macroeconomic Instability .............................................. 9 2. CADR and LA-5: Growth and Volatility ............................................................................ 9 3. CADR: Overall Balance of Central Banks ......................................................................... 9 4. CADR and LA-5: Inflation ............................................................................................... 10 5. CADR and LA-5: Central Bank Autonomy ...................................................................... 12 6. Income Position of CADR Central Banks ........................................................................ 15 7. Balance Sheet Items of CADR Central Banks .................................................................. 17 8. CADR: Reserve Requirements of Depositary Institutions ............................................... 18 9. Balance Sheet Items of LA-5 Central Banks .................................................................... 20 10. Rates of Return on Assets and Liabilities of CADR Central Banks ................................. 22 11. Book Capital and Economic Capital of CADR Central Banks ......................................... 23 12. Central Bank Capital: Baseline Projections ...................................................................... 28 13. Central Bank Capital: Sensitivity to Shocks ..................................................................... 30
Tables 1. Functions of CADR Central Banks..................................................................................... 8 2. CADR: Episodes of Intervention in Financial Institutions, 1990–2006 ........................... 11 3. Summarized Central Bank Balance Sheets, 2012 ............................................................. 25 4. Core Profits, Core Inflation, and Core Capital ................................................................. 26
Appendixes and Appendix Tables I. Detailed Balance Sheets of CADR Central Banks ................................................................ 33 II. Estimating Central Bank Capital Needs ............................................................................... 33 Table A.1. Parameters for Calculating Central Bank Capital Needs ........................................ 34
3
I. INTRODUCTION
Central banks around the world aim to safeguard macroeconomic stability. Before the global financial crisis of 2008–2009, central banks were given some share of the credit for the “great moderation” during which economic activity in many countries was stable at its full employment level and inflation was low (Bean 2010, Benati and Surico 2009). During the great moderation, innovations in central banking tended toward an expanded role in macroeconomic affairs, with targets on macroeconomic aggregates such as inflation gaining importance, and increased communication with markets and the general public. Since the crisis, central bank involvement in many economies has continued to escalate, in particular through quantitative easing and participation in making macroprudential policy.
Central bank financial strength could play a significant role in the setting of objectives and implementation of policy.1 Central bank financial strength has often been seen as secondary to the predominance of fiscal factors. Since the national treasury typically stands behind the balance sheet of the central bank, the two are frequently analyzed jointly, with the emphasis placed on the fiscal authority (Sargent and Wallace 1981, Sims 2004, Cochrane 2011). While the dominance of fiscal factors over monetary policy is clear at extremes of fiscal policy, the falling frequency of hyper- and high-inflation episodes in recent decades might imply that for many countries the relevance of fiscal dominance in current policy decisions has declined. However, political economy factors suggest that fiscal factors can still affect the implementation of monetary policy through their impact on the financial strength of a central bank (Vuletin and Zhu 2011). Central bank balance sheets have also grown in many countries as a result of quantitative easing or accumulation of international reserves, complicating balance sheet management. These trends point to the need for greater understanding of the role of central bank financial strength in making policy.
However, judging whether the financial strength of a central bank is adequate is subject to a high degree of uncertainty. Given heterogeneity in accounting standards and the complexity in valuing the monopoly rights to issue currency, among other factors, there is difficulty in even defining the net worth or net income of a central bank (Fry, 1993; Stella 1997, 2005; Sullivan 2003). Even if the current financial position is clear, it is not straightforward to assess how much it affects policy decisions, which could depend on the expected evolution of the financial position. The future financial position, in turn, is itself influenced by the potential for recapitalization from the national treasury. Thus, the relationship between central bank financial strength and policy may differ across countries based not just on quantitative indicators, but can also depend on accounting standards, expectations of the financial position in the future, and institutional factors such as relationships with the government and laws governing recapitalization.
1 This paper uses the term “central bank financial strength” to refer to a net income position and balance sheet that do not undermine the pursuit of its policy commitments.
4
This paper examines the financial strength of central banks in Central America and the Dominican Republic (CADR).2 This study focuses on a small group of countries with similar characteristics to be able to make more relevant comparisons. It also uses multiple approaches to draw common themes. After a review of the role of central bank financial strength in Section II, Section III discusses the institutional environment in which CADR central banks have operated, in particular their functions, episodes of losses, legal reforms, and issues of recapitalization. Section IV presents details on the net income and balance sheets of CADR central banks and the factors driving their evolution. Section V examines capital adequacy under two approaches. First, is central bank capital sufficient to support announced policy objectives? Second, what is its future path likely to be? This second approach also incorporates a sensitivity analysis. Finally, Section VI concludes.
This paper finds that the financial strength of CADR central banks is improving and is sufficient to support announced inflation objectives, but there remains room for more progress and there are risks of a setback. Past losses have stemmed mainly from banking crises and quasi-fiscal activities; improvements in supervision and legal reforms have reduced but not eliminated the risks from these sources. Audited financial statements (which are increasingly conforming to international accounting standards) show a reduction in net losses and improvement in balance sheet structure, as net foreign currency positions have increased and assets not earning interest have been reduced. However, book (accounting) capital is low, and if claims on the government were valued according to their cash flow, capital would be negative for all CADR central banks. Their financial positions are consistent with supporting announced inflation objectives, largely owing to the existence of unremunerated reserve requirements. Also, raising international reserves for macroeconomic stabilization objectives would imply a drag on net income and erode their financial positions. Capital is likely to increase in the future and for most countries eventually turn positive, but this would require several years of benign macroeconomic conditions, underscoring the potential risks from economic shocks. These findings point to the need to further bolster balance sheets by ensuring all assets earn market rates of return, sustaining recapitalization plans, and strengthening the monetary framework to enhance credibility and reduce financing costs in the long term.
II. THE ROLE OF CENTRAL BANK FINANCIAL STRENGTH
This section analyzes existing research on the adequate degree of central bank financial strength. The focus is on a central bank wholly owned by the central government since this is the arrangement in all CADR countries.3
The state’s ownership of the central bank implies that the national treasury is the central bank’s financial backstop of last resort. Thus, most macroeconomic models treat
2 The countries from Central America included in this study are Costa Rica, Guatemala, Honduras, and Nicaragua. El Salvador and Panama are not included because they are officially dollarized.
3 Stella (1997) and Stella and Lönnberg (2008) discuss these issues in more detail.
5
the central government and central bank as a consolidated entity.4 For obligations in foreign currency this relationship is straightforward, as investors are likely to treat central bank borrowing and sovereign borrowing similarly, at least in terms of the underlying credit risk (Stella 1997). In this case, any central bank losses (for example, from currency fluctuations) that could not be fully absorbed by capital would be expected to be covered by the government. For domestic currency liabilities, a different mechanism is at work.
The central bank’s authority to expand the monetary base rules out an outright default on obligations in domestic currency. The monetary base (currency and commercial bank reserves) is a liability denominated in domestic currency and payable on demand but, in the case of currency, with no explicit maturity. The ability to create more monetary base allows the central bank to always settle, at least in nominal terms, its domestic currency obligations. This potential for money creation to cover losses highlights a key difference from the rationale for capital at commercial banks.
However, monetary expansion has its limits as a financing option. A fundamental determinant of demand for currency is the confidence of the public in its real purchasing power (Buiter 2007, Beckerman 1997). This ultimately requires confidence in the ability of the national treasury to provide real resources in exchange for currency. If agents perceive that the central bank is relying excessively on money creation to finance its losses, they will seek to exchange their holdings of the monetary base for assets more likely to maintain their real value, leading to increased inflation, depreciation of the currency, and loss of international reserves (Leone 1994). Beyond a certain point, the reduced demand for real money balances would negate the initial gains from money creation (Buiter 2008).
In addition, the central bank’s policy objectives may make it unwilling to maximize its use of the monetary base as a source of financing. Stella and Lönnberg (2008) introduce the distinction between technical insolvency—a financial position in which outright default is the only option—and policy insolvency—a situation in which the central bank’s ability to meet its policy commitments is compromised by its financial position. The definition of policy insolvency could be augmented by including situations in which the financial weakness of the central bank influences it to set less ambitious policy commitments than it otherwise would. Since the central bank’s targets are typically the same variables affected by money creation—inflation, the exchange rate, and international reserves—a central bank with a weak financial position could be constantly managing the tradeoff between expansionary policies to finance losses and measures sufficient to maintain macroeconomic stability. Furthermore, political economy considerations mean that even the potential need to recur to treasury recapitalization could influence the central bank’s policy objectives or implementation. These issues provide a strong rationale for examining central bank financial strength apart from its impact on the finances of the consolidated public sector.
Empirical evidence on central bank financial strength and policy performance suggests that in practice these tradeoffs frequently come into play. A vast literature attempts to
4 Models analyzing the central bank balance sheet include Berriel and Bhattarai (2009), Buiter (2007), Ize (2005), Jeanne and Svensson (2007), Restrepo and others (2008), and Sims (2004).
6
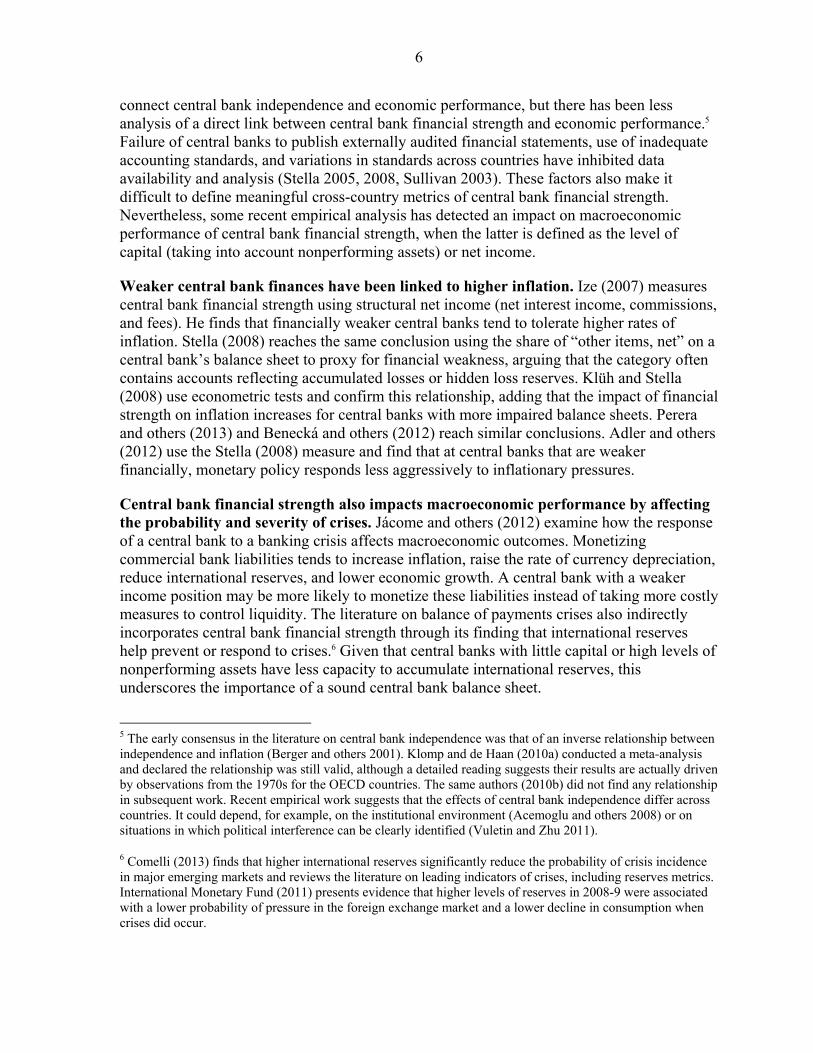
connect central bank independence and economic performance, but there has been less analysis of a direct link between central bank financial strength and economic performance.5 Failure of central banks to publish externally audited financial statements, use of inadequate accounting standards, and variations in standards across countries have inhibited data availability and analysis (Stella 2005, 2008, Sullivan 2003). These factors also make it difficult to define meaningful cross-country metrics of central bank financial strength. Nevertheless, some recent empirical analysis has detected an impact on macroeconomic performance of central bank financial strength, when the latter is defined as the level of capital (taking into account nonperforming assets) or net income.
Weaker central bank finances have been linked to higher inflation. Ize (2007) measures central bank financial strength using structural net income (net interest income, commissions, and fees). He finds that financially weaker central banks tend to tolerate higher rates of inflation. Stella (2008) reaches the same conclusion using the share of “other items, net” on a central bank’s balance sheet to proxy for financial weakness, arguing that the category often contains accounts reflecting accumulated losses or hidden loss reserves. Klüh and Stella (2008) use econometric tests and confirm this relationship, adding that the impact of financial strength on inflation increases for central banks with more impaired balance sheets. Perera and others (2013) and Benecká and others (2012) reach similar conclusions. Adler and others (2012) use the Stella (2008) measure and find that at central banks that are weaker financially, monetary policy responds less aggressively to inflationary pressures.
Central bank financial strength also impacts macroeconomic performance by affecting the probability and severity of crises. Jácome and others (2012) examine how the response of a central bank to a banking crisis affects macroeconomic outcomes. Monetizing commercial bank liabilities tends to increase inflation, raise the rate of currency depreciation, reduce international reserves, and lower economic growth. A central bank with a weaker income position may be more likely to monetize these liabilities instead of taking more costly measures to control liquidity. The literature on balance of payments crises also indirectly incorporates central bank financial strength through its finding that international reserves help prevent or respond to crises.6 Given that central banks with little capital or high levels of nonperforming assets have less capacity to accumulate international reserves, this underscores the importance of a sound central bank balance sheet.
5 The early consensus in the literature on central bank independence was that of an inverse relationship between independence and inflation (Berger and others 2001). Klomp and de Haan (2010a) conducted a meta-analysis and declared the relationship was still valid, although a detailed reading suggests their results are actually driven by observations from the 1970s for the OECD countries. The same authors (2010b) did not find any relationship in subsequent work. Recent empirical work suggests that the effects of central bank independence differ across countries. It could depend, for example, on the institutional environment (Acemoglu and others 2008) or on situations in which political interference can be clearly identified (Vuletin and Zhu 2011).
6 Comelli (2013) finds that higher international reserves significantly reduce the probability of crisis incidence in major emerging markets and reviews the literature on leading indicators of crises, including reserves metrics. International Monetary Fund (2011) presents evidence that higher levels of reserves in 2008-9 were associated with a lower probability of pressure in the foreign exchange market and a lower decline in consumption when crises did occur.
7
This paper applies various methods to assess the financial strength of CADR central banks. The areas examined include:7
Net income and balance sheet structure: This paper presents details on the net income of CADR central banks, the characteristics of their balance sheets, and factors driving their evolution. As noted in Ize (2007), structural deficiencies in cash flow could impede the formulation of sound policies. In addition, cumulated losses will erode central bank capital over time. Different balance sheet structures pose distinct exchange rate and interest rate risks.
Capital inconsistent with policy objectives: Ize (2005) points out that capital sufficiency depends on the central bank’s policy objectives, in particular the level that would allow the announced inflation target to be financed in the steady state. This paper implements Ize’s approach to evaluate whether central bank capital is sufficient to support a rate of inflation below 5 percent.
The likely future path of capital: This paper assesses the path of capital over time under plausible assumptions about the central bank balance sheet and macroeconomic conditions and subjects this baseline path to a sensitivity analysis, an approach similar to Roy (2009) and Restrepo and others (2008).
The paper adopts multiple approaches given the complexity of the concept of central bank financial strength and the difficulty of capturing it with a single indicator. For example, positive capital is neither necessary nor sufficient for policy credibility (Stella 1997); a central bank with positive capital may have a structural income deficit and be in need of recapitalization in the future, while a central bank with a strong net income position or high demand for its currency issue could operate with low or even negative capital.
III. OVERVIEW OF CADR CENTRAL BANKS
This section discusses the operations and institutional environment of CADR central banks, with a focus on aspects that have affected their financial position. In their early years CADR central banks generally contributed to macroeconomic stability by maintaining stable exchange rates. In recent years the nominal anchor has shifted in part to inflation targeting, but the transition is still ongoing. Other institutional reforms have strengthened autonomy, but there is room for further progress. Periodic banking crises owing mainly to gaps in financial supervision have led to central bank losses and generated the need for recapitalization, which has not always been carried out effectively owing to insufficient legal provisions and inadequate economic value provided under recapitalization efforts.
7 Examining net unclassified assets as in Stella (2008) would not yield meaningful results as most CADR central banks now book cumulative losses as claims on the government. This paper takes the approach of adjusting capital for below-market rates of return on claims on the government.
8
A. Historical Roles and Recent Changes
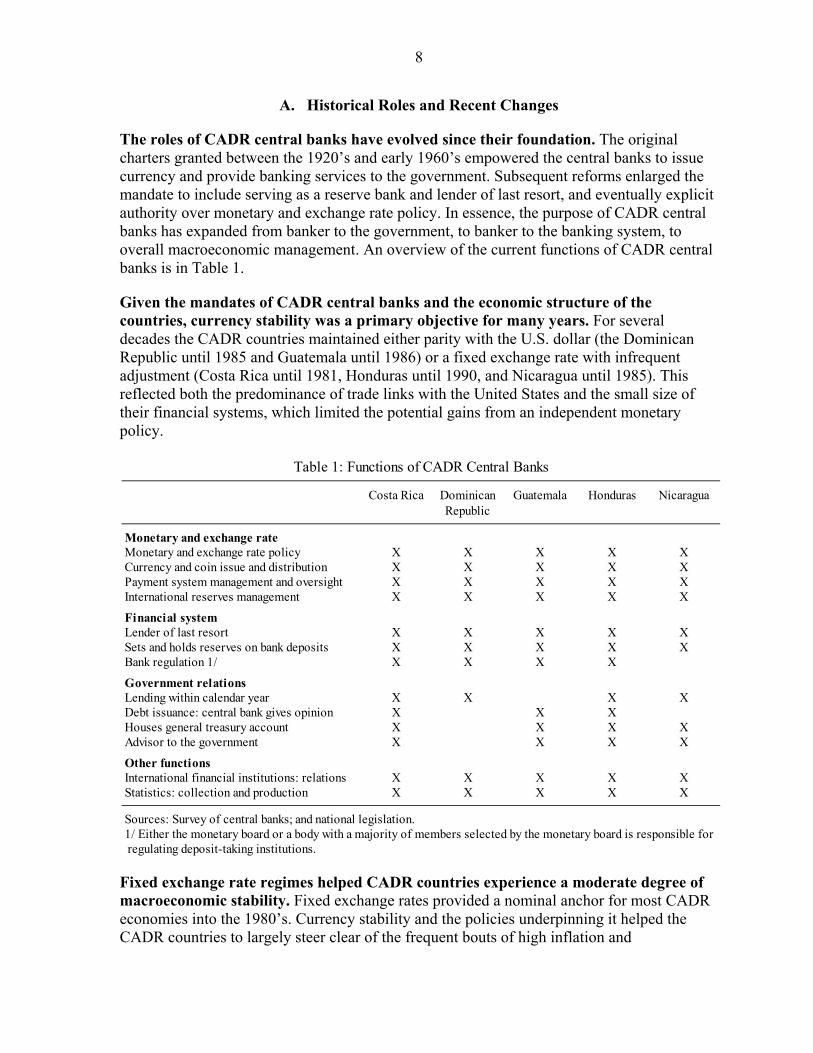
The roles of CADR central banks have evolved since their foundation. The original charters granted between the 1920’s and early 1960’s empowered the central banks to issue currency and provide banking services to the government. Subsequent reforms enlarged the mandate to include serving as a reserve bank and lender of last resort, and eventually explicit authority over monetary and exchange rate policy. In essence, the purpose of CADR central banks has expanded from banker to the government, to banker to the banking system, to overall macroeconomic management. An overview of the current functions of CADR central banks is in Table 1.
Given the mandates of CADR central banks and the economic structure of the countries, currency stability was a primary objective for many years. For several decades the CADR countries maintained either parity with the U.S. dollar (the Dominican Republic until 1985 and Guatemala until 1986) or a fixed exchange rate with infrequent adjustment (Costa Rica until 1981, Honduras until 1990, and Nicaragua until 1985). This reflected both the predominance of trade links with the United States and the small size of their financial systems, which limited the potential gains from an independent monetary policy.
Fixed exchange rate regimes helped CADR countries experience a moderate degree of macroeconomic stability. Fixed exchange rates provided a nominal anchor for most CADR economies into the 1980’s. Currency stability and the policies underpinning it helped the CADR countries to largely steer clear of the frequent bouts of high inflation and
Costa Rica Dominican Guatemala Honduras NicaraguaRepublic
Monetary and exchange rateMonetary and exchange rate policy X X X X XCurrency and coin issue and distribution X X X X XPayment system management and oversight X X X X XInternational reserves management X X X X X
Financial systemLender of last resort X X X X XSets and holds reserves on bank deposits X X X X XBank regulation 1/ X X X X
Government relationsLending within calendar year X X X XDebt issuance: central bank gives opinion X X XHouses general treasury account X X X XAdvisor to the government X X X X
Other functionsInternational financial institutions: relations X X X X XStatistics: collection and production X X X X X
Sources: Survey of central banks; and national legislation.
regulating deposit-taking institutions.
Table 1: Functions of CADR Central Banks
1/ Either the monetary board or a body with a majority of members selected by the monetary board is responsible for

9
hyperinflation experienced by many Latin American countries (Figure 1).8 Monetary stability also facilitated stability in the real economy. Rates of economic growth have been similar to those of large Latin American economies (the LA-5) but volatility in economic activity has been comparable or lower in CADR economies despite their smaller size and higher degree of openness (Figure 2).9
Nevertheless, CADR central banks have experienced periodic episodes of losses stemming from the rescue of financial institutions, sterilization costs, and, in some cases, from macroeconomic instability. Episodes of depreciation and inflation in the late 1980’s and early 1990’s across most countries contributed to central bank losses, but central bank deficits narrowed by the mid-1990’s (Figure 3).10 Since that time, financial instability has been the main driver of episodes of large losses at some CADR central banks, while ongoing losses related to the costs of sterilizing excess international reserves have also been incurred.11 All CADR countries intervened
8 The LA-5 economies are Brazil, Chile, Colombia, Mexico, and Peru. These countries were chosen as comparators because of their adoption of full-fledged inflation targeting and the attendant exchange rate flexibility. Results are similar if all South American countries and Mexico are considered. Figure 1 uses a 40 percent rate of inflation or depreciation as an indicator of macroeconomic instability as this is common in the literature (for example, Reinhart and Rogoff 2004).
9 Regional figures are unweighted averages of the individual countries.
10 Costa Rica also experienced losses relating to multiple exchange rate practices and subsidized lending; these activities were ended in the 1990’s.
11 Throughout this paper the term “excess international reserves” is used to refer to international reserves in excess of the monetary base.
0
10
20
30
40
50
60
1960-9 1970-9 1980-9 1990-9 2000-12
CADR: High inflationLA-5: High inflationCADR: High depreciationLA-5: High depreciation
Figure 1. CADR and LA-5: Indicators of Macroeconomic Instability (probability of y/y change greater than 40 percent)
Sources: IMF, International Financial Statistics; and IMF staff calculations.
-5
-4
-3
-2
-1
0
1
-5
-4
-3
-2
-1
0
1
1990 1992 1994 1996 1998 2000 2002 2004 2006 2008 2010 2012
CRI DOM GTM HND NIC
Figure 3. CADR: Overall Balance of Central Banks (percent of GDP)
Sources: National authorities; Stella and Lonnberg (2008); and IMF staff calculations.
0
1
2
3
4
5
6
7
1960-9 1970-9 1980-9 1990-9 2000-12
CADR: VolatilityLA-5: VolatilityCADR: GrowthLA-5: Growth
Figure 2. CADR and LA-5: Growth and Volatility (y/y percent change of real GDP and standard deviation of y/y percent change)
Sources: IMF, International Financial Statistics; and IMF staff calculations.
10
in commercial banks between 1994 and 2006, with multiple episodes in all countries except Costa Rica. In the majority of these episodes, stresses at financial institutions did not involve a large share of the system and were resolved without the central bank incurring significant losses. However, in some cases financial rescues, the resulting macroeconomic instability, or both led the central bank to incur losses, usually for several years (Box 1).
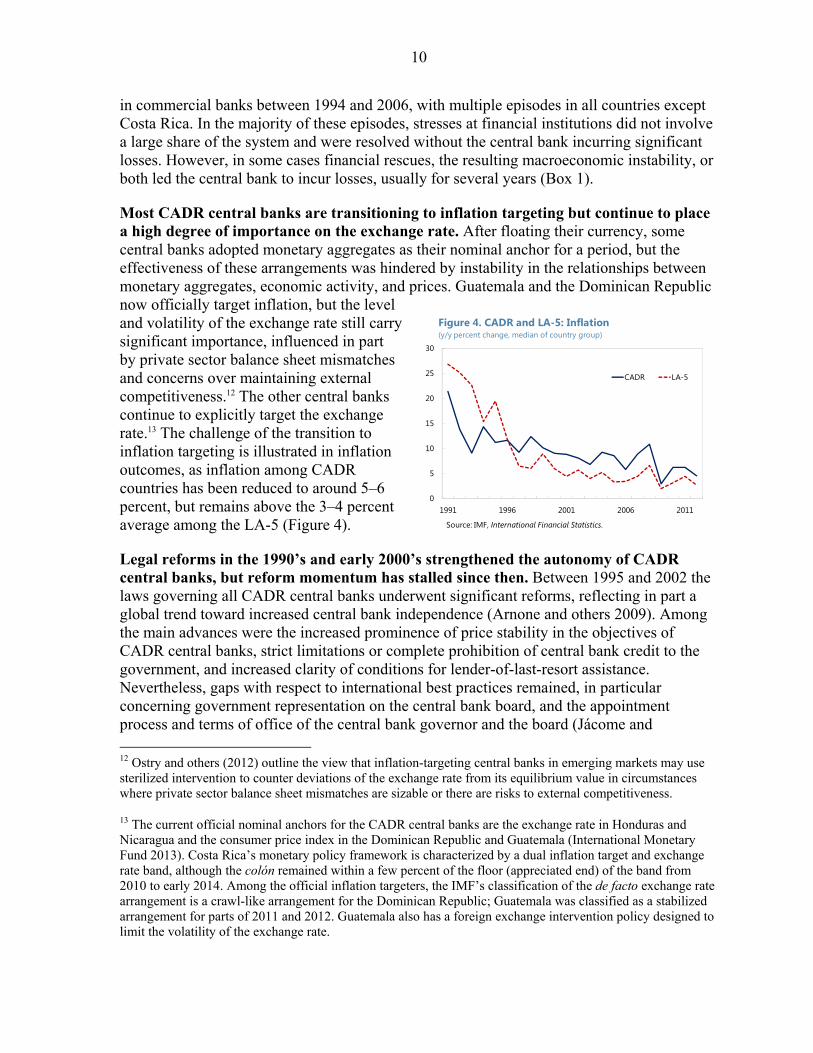
Most CADR central banks are transitioning to inflation targeting but continue to place a high degree of importance on the exchange rate. After floating their currency, some central banks adopted monetary aggregates as their nominal anchor for a period, but the effectiveness of these arrangements was hindered by instability in the relationships between monetary aggregates, economic activity, and prices. Guatemala and the Dominican Republic now officially target inflation, but the level and volatility of the exchange rate still carry significant importance, influenced in part by private sector balance sheet mismatches and concerns over maintaining external competitiveness.12 The other central banks continue to explicitly target the exchange rate.13 The challenge of the transition to inflation targeting is illustrated in inflation outcomes, as inflation among CADR countries has been reduced to around 5–6 percent, but remains above the 3–4 percent average among the LA-5 (Figure 4).
Legal reforms in the 1990’s and early 2000’s strengthened the autonomy of CADR central banks, but reform momentum has stalled since then. Between 1995 and 2002 the laws governing all CADR central banks underwent significant reforms, reflecting in part a global trend toward increased central bank independence (Arnone and others 2009). Among the main advances were the increased prominence of price stability in the objectives of CADR central banks, strict limitations or complete prohibition of central bank credit to the government, and increased clarity of conditions for lender-of-last-resort assistance. Nevertheless, gaps with respect to international best practices remained, in particular concerning government representation on the central bank board, and the appointment process and terms of office of the central bank governor and the board (Jácome and 12 Ostry and others (2012) outline the view that inflation-targeting central banks in emerging markets may use sterilized intervention to counter deviations of the exchange rate from its equilibrium value in circumstances where private sector balance sheet mismatches are sizable or there are risks to external competitiveness.
13 The current official nominal anchors for the CADR central banks are the exchange rate in Honduras and Nicaragua and the consumer price index in the Dominican Republic and Guatemala (International Monetary Fund 2013). Costa Rica’s monetary policy framework is characterized by a dual inflation target and exchange rate band, although the colón remained within a few percent of the floor (appreciated end) of the band from 2010 to early 2014. Among the official inflation targeters, the IMF’s classification of the de facto exchange rate arrangement is a crawl-like arrangement for the Dominican Republic; Guatemala was classified as a stabilized arrangement for parts of 2011 and 2012. Guatemala also has a foreign exchange intervention policy designed to limit the volatility of the exchange rate.
0
5
10
15
20
25
30
1991 1996 2001 2006 2011
CADR LA-5
Figure 4. CADR and LA-5: Inflation(y/y percent change, median of country group)
Source: IMF, International Financial Statistics.
11
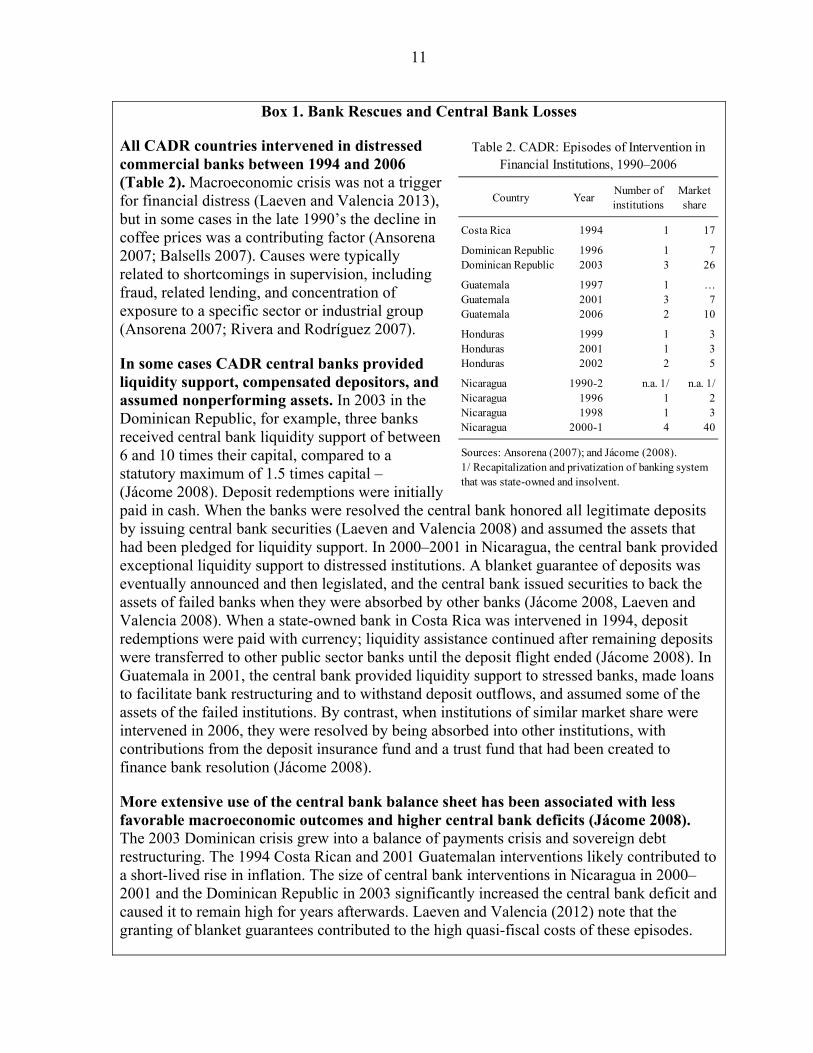
Box 1. Bank Rescues and Central Bank Losses
All CADR countries intervened in distressed commercial banks between 1994 and 2006 (Table 2). Macroeconomic crisis was not a trigger for financial distress (Laeven and Valencia 2013), but in some cases in the late 1990’s the decline in coffee prices was a contributing factor (Ansorena 2007; Balsells 2007). Causes were typically related to shortcomings in supervision, including fraud, related lending, and concentration of exposure to a specific sector or industrial group (Ansorena 2007; Rivera and Rodríguez 2007).
In some cases CADR central banks provided liquidity support, compensated depositors, and assumed nonperforming assets. In 2003 in the Dominican Republic, for example, three banks received central bank liquidity support of between 6 and 10 times their capital, compared to a statutory maximum of 1.5 times capital –(Jácome 2008). Deposit redemptions were initially paid in cash. When the banks were resolved the central bank honored all legitimate deposits by issuing central bank securities (Laeven and Valencia 2008) and assumed the assets that had been pledged for liquidity support. In 2000–2001 in Nicaragua, the central bank provided exceptional liquidity support to distressed institutions. A blanket guarantee of deposits was eventually announced and then legislated, and the central bank issued securities to back the assets of failed banks when they were absorbed by other banks (Jácome 2008, Laeven and Valencia 2008). When a state-owned bank in Costa Rica was intervened in 1994, deposit redemptions were paid with currency; liquidity assistance continued after remaining deposits were transferred to other public sector banks until the deposit flight ended (Jácome 2008). In Guatemala in 2001, the central bank provided liquidity support to stressed banks, made loans to facilitate bank restructuring and to withstand deposit outflows, and assumed some of the assets of the failed institutions. By contrast, when institutions of similar market share were intervened in 2006, they were resolved by being absorbed into other institutions, with contributions from the deposit insurance fund and a trust fund that had been created to finance bank resolution (Jácome 2008).
More extensive use of the central bank balance sheet has been associated with less favorable macroeconomic outcomes and higher central bank deficits (Jácome 2008). The 2003 Dominican crisis grew into a balance of payments crisis and sovereign debt restructuring. The 1994 Costa Rican and 2001 Guatemalan interventions likely contributed to a short-lived rise in inflation. The size of central bank interventions in Nicaragua in 2000–2001 and the Dominican Republic in 2003 significantly increased the central bank deficit and caused it to remain high for years afterwards. Laeven and Valencia (2012) note that the granting of blanket guarantees contributed to the high quasi-fiscal costs of these episodes.
Country YearNumber of institutions
Market share
Costa Rica 1994 1 17
Dominican Republic 1996 1 7Dominican Republic 2003 3 26
Guatemala 1997 1 …Guatemala 2001 3 7Guatemala 2006 2 10
Honduras 1999 1 3Honduras 2001 1 3Honduras 2002 2 5
Nicaragua 1990-2 n.a. 1/ n.a. 1/Nicaragua 1996 1 2Nicaragua 1998 1 3Nicaragua 2000-1 4 40
Sources: Ansorena (2007); and Jácome (2008).
Table 2. CADR: Episodes of Intervention inFinancial Institutions, 1990–2006
1/ Recapitalization and privatization of banking system that was state-owned and insolvent.
12
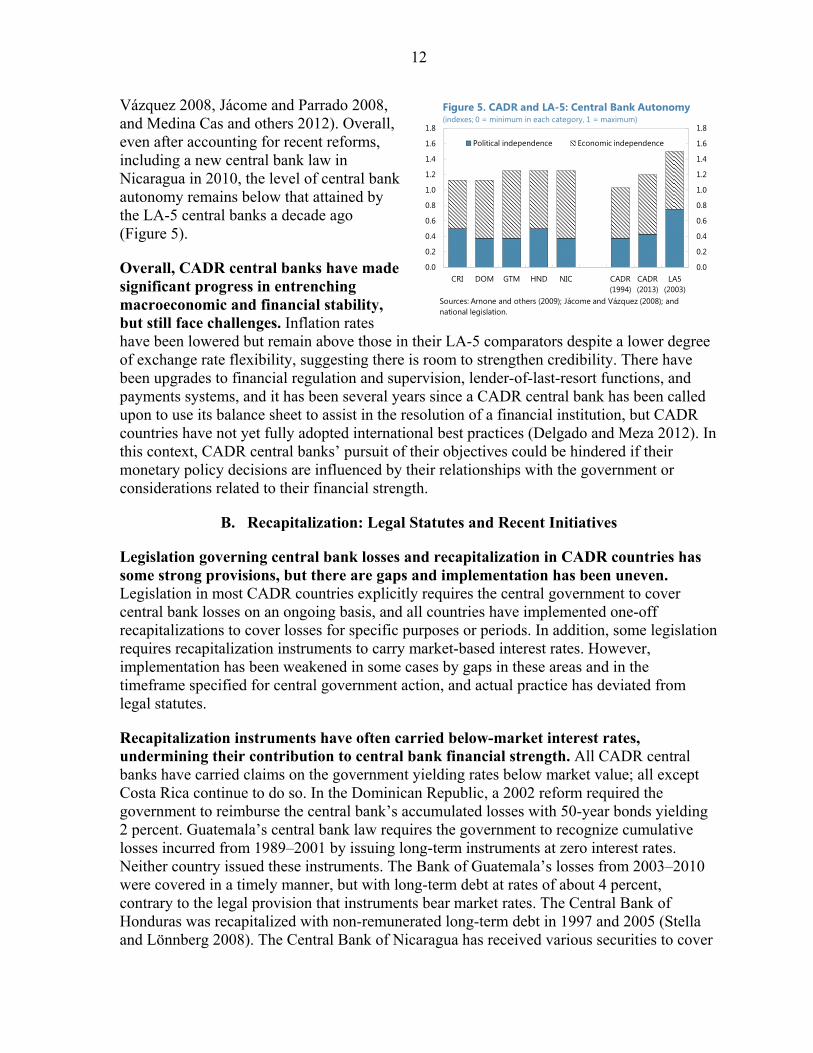
Vázquez 2008, Jácome and Parrado 2008, and Medina Cas and others 2012). Overall, even after accounting for recent reforms, including a new central bank law in Nicaragua in 2010, the level of central bank autonomy remains below that attained by the LA-5 central banks a decade ago (Figure 5).
Overall, CADR central banks have made significant progress in entrenching macroeconomic and financial stability, but still face challenges. Inflation rates have been lowered but remain above those in their LA-5 comparators despite a lower degree of exchange rate flexibility, suggesting there is room to strengthen credibility. There have been upgrades to financial regulation and supervision, lender-of-last-resort functions, and payments systems, and it has been several years since a CADR central bank has been called upon to use its balance sheet to assist in the resolution of a financial institution, but CADR countries have not yet fully adopted international best practices (Delgado and Meza 2012). In this context, CADR central banks’ pursuit of their objectives could be hindered if their monetary policy decisions are influenced by their relationships with the government or considerations related to their financial strength.
B. Recapitalization: Legal Statutes and Recent Initiatives
Legislation governing central bank losses and recapitalization in CADR countries has some strong provisions, but there are gaps and implementation has been uneven. Legislation in most CADR countries explicitly requires the central government to cover central bank losses on an ongoing basis, and all countries have implemented one-off recapitalizations to cover losses for specific purposes or periods. In addition, some legislation requires recapitalization instruments to carry market-based interest rates. However, implementation has been weakened in some cases by gaps in these areas and in the timeframe specified for central government action, and actual practice has deviated from legal statutes.
Recapitalization instruments have often carried below-market interest rates, undermining their contribution to central bank financial strength. All CADR central banks have carried claims on the government yielding rates below market value; all except Costa Rica continue to do so. In the Dominican Republic, a 2002 reform required the government to reimburse the central bank’s accumulated losses with 50-year bonds yielding 2 percent. Guatemala’s central bank law requires the government to recognize cumulative losses incurred from 1989–2001 by issuing long-term instruments at zero interest rates. Neither country issued these instruments. The Bank of Guatemala’s losses from 2003–2010 were covered in a timely manner, but with long-term debt at rates of about 4 percent, contrary to the legal provision that instruments bear market rates. The Central Bank of Honduras was recapitalized with non-remunerated long-term debt in 1997 and 2005 (Stella and Lönnberg 2008). The Central Bank of Nicaragua has received various securities to cover
0.0
0.2
0.4
0.6
0.8
1.0
1.2
1.4
1.6
1.8
0.0
0.2
0.4
0.6
0.8
1.0
1.2
1.4
1.6
1.8
CRI DOM GTM HND NIC CADR (1994)
CADR (2013)
LA5 (2003)
Political independence Economic independence
Figure 5. CADR and LA-5: Central Bank Autonomy(indexes; 0 = minimum in each category, 1 = maximum)
Sources: Arnone and others (2009); Jácome and Vázquez (2008); and national legislation.
13
losses, with most carrying a zero or low yield; other losses remain on the balance sheet as claims payable by the government, but do not earn interest.
There has been some progress towards recapitalization. The Central Bank of Costa Rica received recapitalization transfers totaling over 7 percent of GDP from 2000–2007. A 2007 law in the Dominican Republic specifies a 10-year recapitalization plan with annual cash transfers averaging 1 percent of GDP; through 2012 transfers were made in accordance with the law. In Nicaragua, provisions governing recapitalization were strengthened in central bank legislation enacted in 2010. Central bank losses in 2011 and 2012 were partially covered by cash transfers. In 2013, the central bank and government agreed on an amount of recapitalization bonds to cover losses for 2000–2010, to be remunerated at the same rate as earned on the central bank’s international reserves.
However, implementation has been incomplete. The Costa Rican government and central bank reached agreement in 2007 to promote legislation for further recapitalization but the initiative was not implemented, with the authorities citing a lack of fiscal space. In 2013 the Dominican government reduced its recapitalization transfer to 0.7 percent of GDP; the 2014 budget maintains this lower level.14 The Guatemalan government did not include a provision in its 2013 budget to cover the central bank’s 2011 loss. The Honduran authorities developed a recapitalization plan based on the transfer of marketable government securities to the central bank but have not begun implementation. The Nicaraguan government has not fully covered central bank losses since the legal reform, as the rate of return on recapitalization bonds remains below the funding costs of the central bank.
The experiences of CADR central banks illustrate some of the typical difficulties in attaining and maintaining central bank financial strength. Agreement must be reached with a political administration (and subsequently a national legislature) that faces many demands. When revenue and financing capacity are limited, as in CADR countries, running a primary surplus or diverting the proceeds of debt issuance to bolster the central bank balance sheet may not seem as pressing. Governments may be tempted to take less costly measures that give the appearance of addressing the issue but do not provide a long-term solution, with negative implications for transparency. The receipt of instruments with non-market terms also hinders central banks from liquidating them or using them for monetary policy purposes. Where claims on the government are financed by central bank securities carrying higher interest rates, this perpetuates the cycle of losses.
IV. FINANCIAL POSITIONS
CADR central banks have strengthened their income positions and balance sheets over the last decade, but continue to make losses and capital is thin or negative. This section presents trends in the financial positions of CADR central banks since 2001, finding that they have improved but weaknesses remain.
14 The annual budgets made ad hoc adjustments to 0.7 percent of GDP (from 1.1 and 1.2 percent of GDP, respectively, specified in the 2007 law).
14
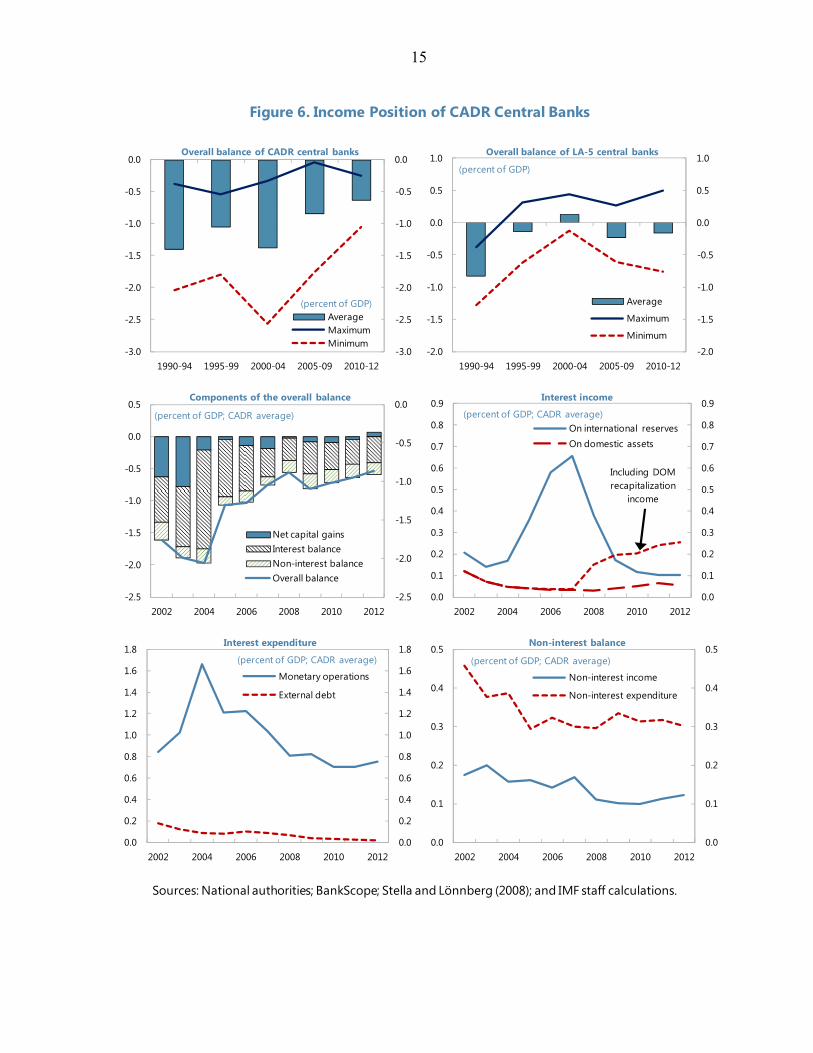
A. Income Position
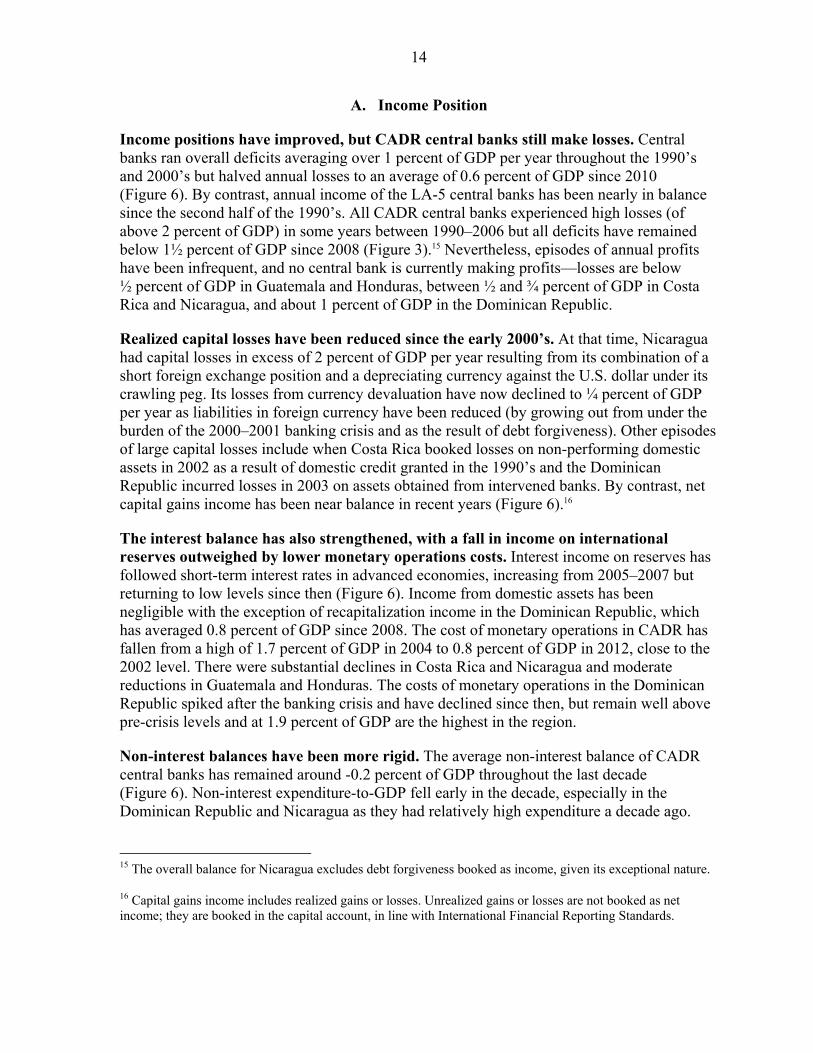
Income positions have improved, but CADR central banks still make losses. Central banks ran overall deficits averaging over 1 percent of GDP per year throughout the 1990’s and 2000’s but halved annual losses to an average of 0.6 percent of GDP since 2010 (Figure 6). By contrast, annual income of the LA-5 central banks has been nearly in balance since the second half of the 1990’s. All CADR central banks experienced high losses (of above 2 percent of GDP) in some years between 1990–2006 but all deficits have remained below 1½ percent of GDP since 2008 (Figure 3).15 Nevertheless, episodes of annual profits have been infrequent, and no central bank is currently making profits—losses are below ½ percent of GDP in Guatemala and Honduras, between ½ and ¾ percent of GDP in Costa Rica and Nicaragua, and about 1 percent of GDP in the Dominican Republic.
Realized capital losses have been reduced since the early 2000’s. At that time, Nicaragua had capital losses in excess of 2 percent of GDP per year resulting from its combination of a short foreign exchange position and a depreciating currency against the U.S. dollar under its crawling peg. Its losses from currency devaluation have now declined to ¼ percent of GDP per year as liabilities in foreign currency have been reduced (by growing out from under the burden of the 2000–2001 banking crisis and as the result of debt forgiveness). Other episodes of large capital losses include when Costa Rica booked losses on non-performing domestic assets in 2002 as a result of domestic credit granted in the 1990’s and the Dominican Republic incurred losses in 2003 on assets obtained from intervened banks. By contrast, net capital gains income has been near balance in recent years (Figure 6).16
The interest balance has also strengthened, with a fall in income on international reserves outweighed by lower monetary operations costs. Interest income on reserves has followed short-term interest rates in advanced economies, increasing from 2005–2007 but returning to low levels since then (Figure 6). Income from domestic assets has been negligible with the exception of recapitalization income in the Dominican Republic, which has averaged 0.8 percent of GDP since 2008. The cost of monetary operations in CADR has fallen from a high of 1.7 percent of GDP in 2004 to 0.8 percent of GDP in 2012, close to the 2002 level. There were substantial declines in Costa Rica and Nicaragua and moderate reductions in Guatemala and Honduras. The costs of monetary operations in the Dominican Republic spiked after the banking crisis and have declined since then, but remain well above pre-crisis levels and at 1.9 percent of GDP are the highest in the region.
Non-interest balances have been more rigid. The average non-interest balance of CADR central banks has remained around -0.2 percent of GDP throughout the last decade (Figure 6). Non-interest expenditure-to-GDP fell early in the decade, especially in the Dominican Republic and Nicaragua as they had relatively high expenditure a decade ago.
15 The overall balance for Nicaragua excludes debt forgiveness booked as income, given its exceptional nature.
16 Capital gains income includes realized gains or losses. Unrealized gains or losses are not booked as net income; they are booked in the capital account, in line with International Financial Reporting Standards.
15
Figure 6. Income Position of CADR Central Banks
Sources: National authorities; BankScope; Stella and Lönnberg (2008); and IMF staff calculations.
-3.0
-2.5
-2.0
-1.5
-1.0
-0.5
0.0
-3.0
-2.5
-2.0
-1.5
-1.0
-0.5
0.0
1990-94 1995-99 2000-04 2005-09 2010-12
AverageMaximumMinimum
Overall balance of CADR central banks
(percent of GDP)
-2.5
-2.0
-1.5
-1.0
-0.5
0.0
-2.5
-2.0
-1.5
-1.0
-0.5
0.0
0.5
2002 2004 2006 2008 2010 2012
Net capital gainsInterest balanceNon-interest balanceOverall balance
Components of the overall balance
(percent of GDP; CADR average)
0.0
0.1
0.2
0.3
0.4
0.5
0.6
0.7
0.8
0.9
0.0
0.1
0.2
0.3
0.4
0.5
0.6
0.7
0.8
0.9
2002 2004 2006 2008 2010 2012
On international reservesOn domestic assets
Interest income
Including DOM recapitalization
income
(percent of GDP; CADR average)
0.0
0.2
0.4
0.6
0.8
1.0
1.2
1.4
1.6
1.8
0.0
0.2
0.4
0.6
0.8
1.0
1.2
1.4
1.6
1.8
2002 2004 2006 2008 2010 2012
Monetary operations
External debt
Interest expenditure
(percent of GDP; CADR average)
0.0
0.1
0.2
0.3
0.4
0.5
0.0
0.1
0.2
0.3
0.4
0.5
2002 2004 2006 2008 2010 2012
Non-interest income
Non-interest expenditure
Non-interest balance
(percent of GDP; CADR average)
-2.0
-1.5
-1.0
-0.5
0.0
0.5
1.0
-2.0
-1.5
-1.0
-0.5
0.0
0.5
1.0
1990-94 1995-99 2000-04 2005-09 2010-12
Average
Maximum
Minimum
Overall balance of LA-5 central banks
(percent of GDP)
16
Meanwhile, average non-interest income has fallen slightly as a share of GDP, with an increase in Costa Rica offsetting a decline in the Dominican Republic. Non-interest balances among the LA-5 averaged -0.1 percent of GDP in 2012 (excluding Mexico, for which data was not available). This data suggests that administrative costs are not a significant factor in the higher deficits of CADR central banks, but that there is room for some compression of expenditure other than in Costa Rica and Guatemala, where administrative costs are lower than average.
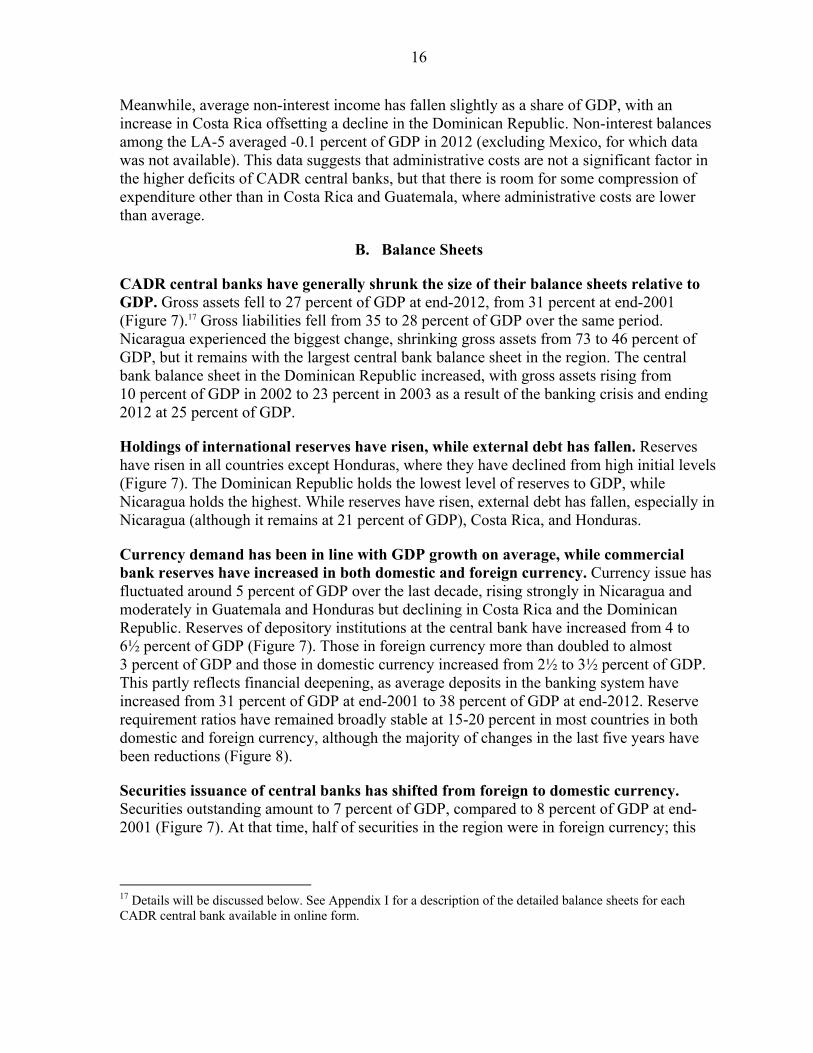
B. Balance Sheets
CADR central banks have generally shrunk the size of their balance sheets relative to GDP. Gross assets fell to 27 percent of GDP at end-2012, from 31 percent at end-2001 (Figure 7).17 Gross liabilities fell from 35 to 28 percent of GDP over the same period. Nicaragua experienced the biggest change, shrinking gross assets from 73 to 46 percent of GDP, but it remains with the largest central bank balance sheet in the region. The central bank balance sheet in the Dominican Republic increased, with gross assets rising from 10 percent of GDP in 2002 to 23 percent in 2003 as a result of the banking crisis and ending 2012 at 25 percent of GDP.
Holdings of international reserves have risen, while external debt has fallen. Reserves have risen in all countries except Honduras, where they have declined from high initial levels (Figure 7). The Dominican Republic holds the lowest level of reserves to GDP, while Nicaragua holds the highest. While reserves have risen, external debt has fallen, especially in Nicaragua (although it remains at 21 percent of GDP), Costa Rica, and Honduras.
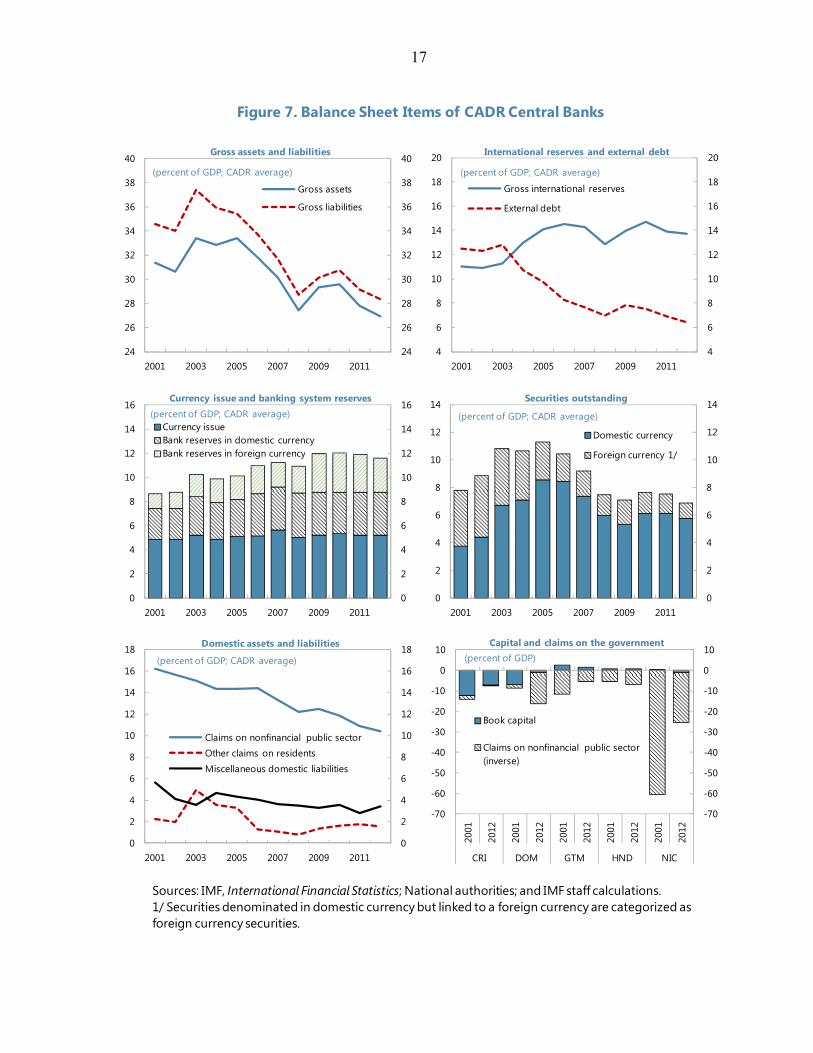
Currency demand has been in line with GDP growth on average, while commercial bank reserves have increased in both domestic and foreign currency. Currency issue has fluctuated around 5 percent of GDP over the last decade, rising strongly in Nicaragua and moderately in Guatemala and Honduras but declining in Costa Rica and the Dominican Republic. Reserves of depository institutions at the central bank have increased from 4 to 6½ percent of GDP (Figure 7). Those in foreign currency more than doubled to almost 3 percent of GDP and those in domestic currency increased from 2½ to 3½ percent of GDP. This partly reflects financial deepening, as average deposits in the banking system have increased from 31 percent of GDP at end-2001 to 38 percent of GDP at end-2012. Reserve requirement ratios have remained broadly stable at 15-20 percent in most countries in both domestic and foreign currency, although the majority of changes in the last five years have been reductions (Figure 8).
Securities issuance of central banks has shifted from foreign to domestic currency. Securities outstanding amount to 7 percent of GDP, compared to 8 percent of GDP at end-2001 (Figure 7). At that time, half of securities in the region were in foreign currency; this
17 Details will be discussed below. See Appendix I for a description of the detailed balance sheets for each CADR central bank available in online form.
17
Figure 7. Balance Sheet Items of CADR Central Banks
Sources: IMF, International Financial Statistics; National authorities; and IMF staff calculations.1/ Securities denominated in domestic currency but linked to a foreign currency are categorized as foreign currency securities.
24
26
28
30
32
34
36
38
40
24
26
28
30
32
34
36
38
40
2001 2003 2005 2007 2009 2011
Gross assets
Gross liabilities
Gross assets and liabilities
(percent of GDP; CADR average)
4
6
8
10
12
14
16
18
20
4
6
8
10
12
14
16
18
20
2001 2003 2005 2007 2009 2011
Gross international reserves
External debt
International reserves and external debt
(percent of GDP; CADR average)
0
2
4
6
8
10
12
14
16
0
2
4
6
8
10
12
14
16
2001 2003 2005 2007 2009 2011
Currency issueBank reserves in domestic currencyBank reserves in foreign currency
Currency issue and banking system reserves(percent of GDP; CADR average)
0
2
4
6
8
10
12
14
0
2
4
6
8
10
12
14
2001 2003 2005 2007 2009 2011
Domestic currency
Foreign currency 1/
Securities outstanding
(percent of GDP; CADR average)
-70
-60
-50
-40
-30
-20
-10
0
10
-70
-60
-50
-40
-30
-20
-10
0
10
2001
2012
2001
2012
2001
2012
2001
2012
2001
2012
CRI DOM GTM HND NIC
Book capital
Claims on nonfinancial public sector (inverse)
Capital and claims on the government(percent of GDP)
0
2
4
6
8
10
12
14
16
18
0
2
4
6
8
10
12
14
16
18
2001 2003 2005 2007 2009 2011
Claims on nonfinancial public sectorOther claims on residentsMiscellaneous domestic liabilities
Domestic assets and liabilities
(percent of GDP; CADR average)
18
has fallen to less than 20 percent.18 Costa Rica shifted its stock of securities from mostly foreign currency to almost exclusively domestic currency. Nicaragua continues to issue only foreign currency-linked securities, but the stock outstanding has been reduced by 8 percent of GDP. Conversely, the stock of securities in the Dominican Republic increased by 10 percent of GDP, but was all in domestic currency.19 Guatemala and Honduras relied mainly on domestic currency securities throughout the decade.
Claims on the public sector, mostly consisting of cumulative losses, have declined relative to GDP but remain high in most countries. As a result of improved income positions, the claims of CADR central banks on the nonfinancial public sector declined from 16 percent of GDP at end-2001 to 10 percent of GDP at end-2012 (Figure 7). Claims on the government fell sharply as a ratio to GDP in Nicaragua and were reduced in Guatemala, while they increased in the Dominican Republic after its banking crisis. Claims on other residents have averaged 2 percent of GDP or less except for a brief increase in the Dominican Republic during the banking crisis. Other liabilities to domestic residents, which consist mainly of public sector deposits and for some countries standing deposit facilities, have averaged 4 percent of GDP but have not varied significantly in recent years.20
18 Securities denominated in domestic currency but linked to a foreign currency are categorized as foreign currency securities.
19 Since 2010, the central bank has issued some certificates denominated in pesos but in auctions limited to financial institutions’ sale of foreign exchange to the central bank. However, since the securities themselves are not payable in or linked to foreign exchange, they are categorized as domestic currency securities.
20 These liabilities are in addition to currency issue, banks’ reserves, and securities, which are discussed above.
Figure 8. CADR: Reserve Requirements of Depositary Institutions
Sources: National authorities; and Central American Monetary Council.
0
5
10
15
20
25
0
5
10
15
20
25
2001 2003 2005 2007 2009 2011
CRIDOMGTMHNDNIC
CADR: Reserve requirements in domestic currency(percent)
0
10
20
30
40
50
60
0
10
20
30
40
50
60
2001 2003 2005 2007 2009 2011
CRIDOMGTMHNDNIC
CADR: Reserve requirements in foreign currency(percent)
19
The book capital of some CADR central banks is negative but its true value hinges critically on the valuation of claims on the public sector. In Costa Rica losses are booked as negative capital, and book capital is minus 7 percent of GDP. Book capital is about 1 percent of GDP in Guatemala and Honduras and about minus 1 percent of GDP in the Dominican Republic and Nicaragua (Figure 7). However, in all four countries, losses are booked as claims on the nonfinancial public sector and earn low or zero rates of return, reducing the actual value of these claims. Thus, while only Costa Rica reports a sizable negative book capital position, the capital of all CADR central banks calculated using international accounting standards would be negative, as will be shown in the next section.
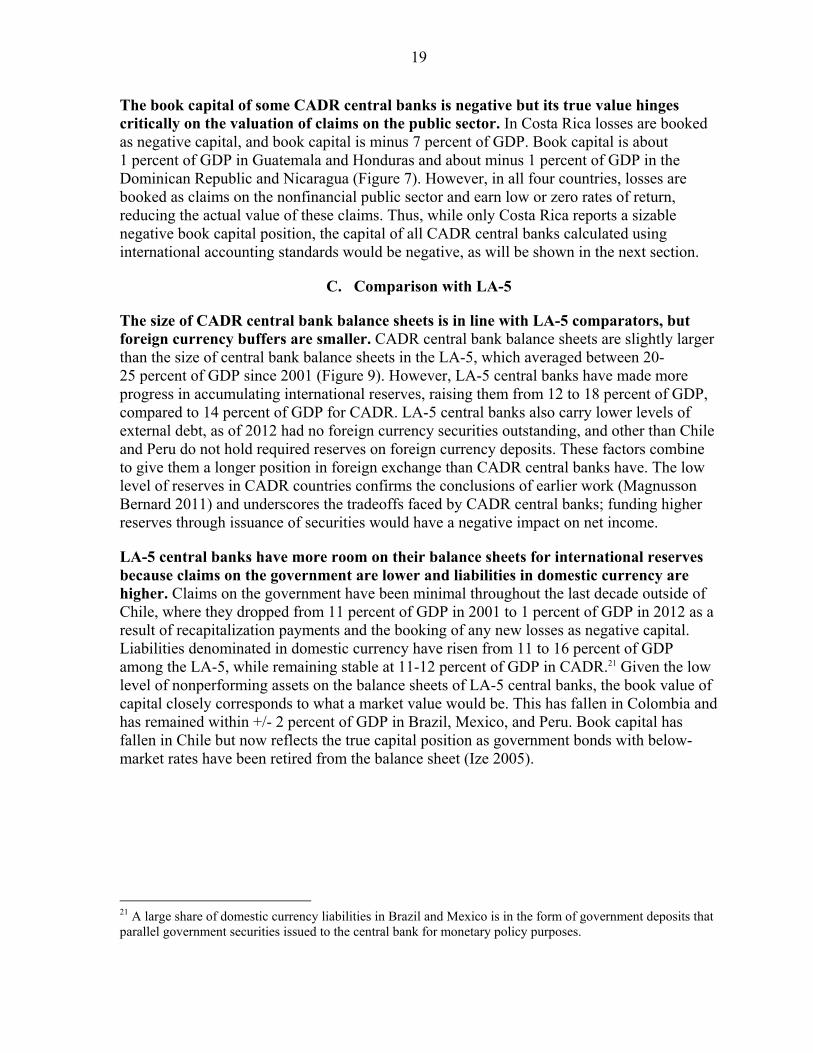
C. Comparison with LA-5
The size of CADR central bank balance sheets is in line with LA-5 comparators, but foreign currency buffers are smaller. CADR central bank balance sheets are slightly larger than the size of central bank balance sheets in the LA-5, which averaged between 20-25 percent of GDP since 2001 (Figure 9). However, LA-5 central banks have made more progress in accumulating international reserves, raising them from 12 to 18 percent of GDP, compared to 14 percent of GDP for CADR. LA-5 central banks also carry lower levels of external debt, as of 2012 had no foreign currency securities outstanding, and other than Chile and Peru do not hold required reserves on foreign currency deposits. These factors combine to give them a longer position in foreign exchange than CADR central banks have. The low level of reserves in CADR countries confirms the conclusions of earlier work (Magnusson Bernard 2011) and underscores the tradeoffs faced by CADR central banks; funding higher reserves through issuance of securities would have a negative impact on net income.
LA-5 central banks have more room on their balance sheets for international reserves because claims on the government are lower and liabilities in domestic currency are higher. Claims on the government have been minimal throughout the last decade outside of Chile, where they dropped from 11 percent of GDP in 2001 to 1 percent of GDP in 2012 as a result of recapitalization payments and the booking of any new losses as negative capital. Liabilities denominated in domestic currency have risen from 11 to 16 percent of GDP among the LA-5, while remaining stable at 11-12 percent of GDP in CADR.21 Given the low level of nonperforming assets on the balance sheets of LA-5 central banks, the book value of capital closely corresponds to what a market value would be. This has fallen in Colombia and has remained within +/- 2 percent of GDP in Brazil, Mexico, and Peru. Book capital has fallen in Chile but now reflects the true capital position as government bonds with below-market rates have been retired from the balance sheet (Ize 2005).
21 A large share of domestic currency liabilities in Brazil and Mexico is in the form of government deposits that parallel government securities issued to the central bank for monetary policy purposes.
20
Figure 9. Balance Sheet Items of LA-5 Central Banks
Sources: IMF, International Financial Statistics; National authorities; and IMF staff calculations.1/ Securities denominated in domestic currency but linked to a foreign currency are categorized as foreign currency securities.2/ Claims on the nonfinancial public sector exclude government securities held for monetary policy purposes.
15
20
25
30
35
15
20
25
30
35
2001 2003 2005 2007 2009 2011
Gross assets
Gross liabilities
Gross assets and liabilities
(percent of GDP; LA-5 average)
0
2
4
6
8
10
12
14
16
18
20
0
2
4
6
8
10
12
14
16
18
20
2001 2003 2005 2007 2009 2011
Gross international reserves
External debt
International reserves and external debt
(percent of GDP; LA-5 average)
0
2
4
6
8
10
12
0
2
4
6
8
10
12
2001 2003 2005 2007 2009 2011
Currency issueBank reserves in domestic currencyBank reserves in foreign currency
Currency issue and banking system reserves(percent of GDP; LA-5 average)
0
2
4
6
8
10
0
2
4
6
8
10
2001 2003 2005 2007 2009 2011
Domestic currency
Foreign currency 1/
Securities outstanding
(percent of GDP; LA-5 average)
-15
-10
-5
0
5
10
-15
-10
-5
0
5
10
2001
2012
2001
2012
2001
2012
2001
2012
2001
2012
BRA CHL COL MEX PER
Book capital
Claims on nonfinancial public sector (inverse) 2/
Capital and claims on the government
(percent of GDP)
0
2
4
6
8
10
12
0
2
4
6
8
10
12
2001 2003 2005 2007 2009 2011
Claims on nonfinancial public sector 2/Other claims on residentsMiscellaneous domestic liabilities
Domestic assets and liabilities
(percent of GDP; LA-5 average)
21
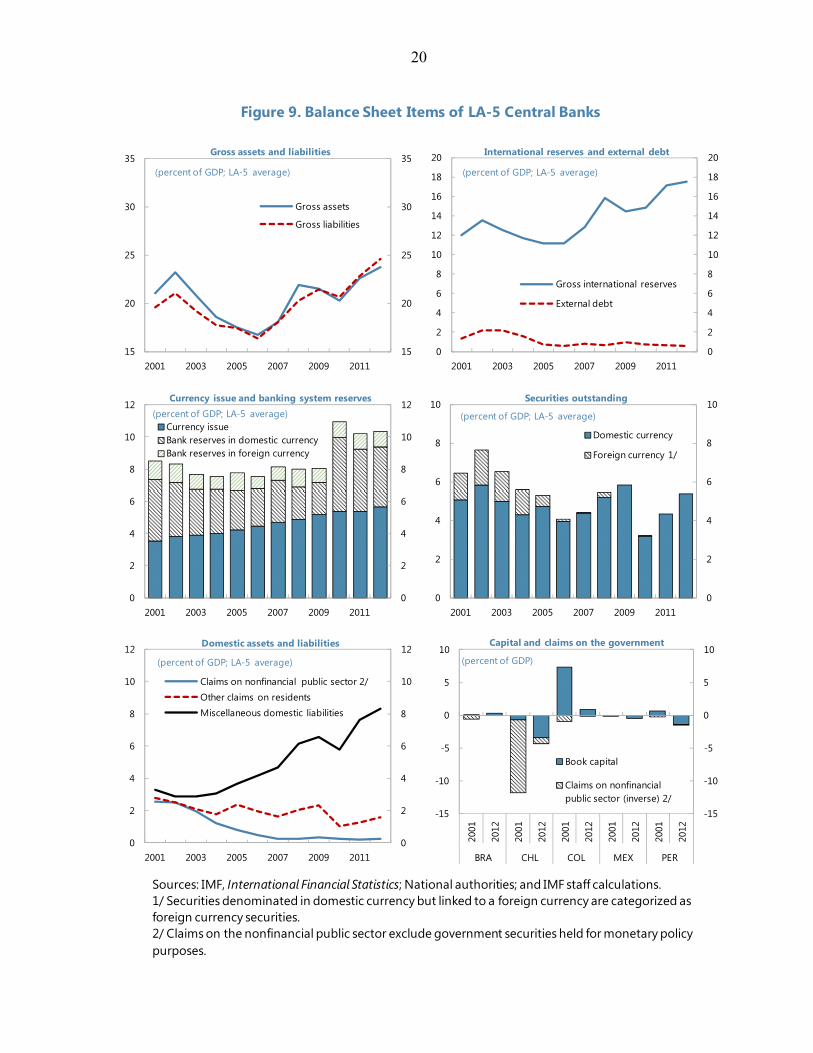
D. Factors Influencing the Financial Position
Monetary policy easing in advanced economies since 2008 has weighed on interest income. The implicit return on international reserves has moved with short-term interest rates on instruments in U.S. dollars, in line with the composition of reserve assets (Figure 10). This has driven a significant reduction in interest income on reserves. If interest rates prevailing from 2005–2008 had continued through 2009–2012, the interest income of CADR central banks would have been higher by 0.4 percent of GDP, on average.22 Interest expenditure on external debt would have been only 0.1 percent of GDP higher in similar conditions, as the rate paid by CADR central banks is less variable and external debt is less than half as large as international reserves (Figure 10).
This has been offset in part by lower interest rates on central bank securities. The highest quasi-fiscal losses in the Dominican Republic coincided with a spike in rates; they have fallen substantially from their peak after the banking crisis, but at over 10 percent in real terms they remain the highest in the region (Figure 10). Rates in Costa Rica have declined by half and rates in Nicaragua (which issues only dollar-linked securities) have come down, while rates in Guatemala remain the lowest in the region.23
The yield on domestic assets remains negligible. Domestic assets, consisting primarily of claims on the government, have yielded in the low single digits, and in many cases near zero (Figure 10). This is well below the cost of central bank securities and this gap in returns is a significant factor in the continuing losses of CADR central banks. Recapitalization transfers in the Dominican Republic have gradually raised the rate of return of claims on the government, but not yet to the level prevailing on its liabilities. If the rate of return on domestic assets of all CADR central banks were equal to the rate on central bank securities, their overall balance would be more positive by about 1 percent of GDP, on average.
The shrinking of balance sheets and improved foreign currency positions have helped losses decline. In most cases, the reduction in central bank liabilities has been in interest-bearing liabilities such as securities and external debt. Nominal growth of low-yielding claims on the public sector has been limited, with economic growth allowing their ratio to GDP to decrease. The combination of these two trends has helped improve interest balances. Financial deepening has also helped by growing unremunerated reserves of depository institutions as a share of GDP. In addition, the improvement in foreign currency positions noted above has helped reduce capital losses due to currency depreciation. Overall, then, the main factors that could help further improve the financial positions of CADR central banks are higher rates of return on international reserves and claims on the government, and shifting the composition of the balance sheet away from low-yielding domestic assets to international reserves.
22 This does not necessarily imply a commensurate improvement in net income, as interest rates on domestic liabilities could have been higher as a result of higher international interest rates.
23 The interest rate on Nicaragua’s dollar-linked securities is adjusted upward by the rate of crawl on the exchange rate to place the interest rate on a comparable footing to those on securities issued by the other countries denominated in domestic currency.
22
V. CAPITAL ADEQUACY
The economic value of the capital of CADR central banks is negative, and while it is likely to rise over time, the projected improvement is subject to risks. This section calculates the economic value of capital at CADR central banks (book capital adjusted for the rate of return differential between claims on the government and marketable securities of the central bank), estimates benchmark capital needs, projects the path of capital over time, and evaluates the sensitivity of these projections to potential risks.
A. Economic Capital
The economic value of the capital of each CADR central bank is calculated by adjusting for the rate of return differential between claims on the nonfinancial public sector and central bank securities. Since most CADR central banks receive non-negotiable
Figure 10. Rates of Return on Assets and Liabilities of CADR Central Banks
Sources: National authorities; Haver Analytics; and IMF staff calculations.1/ Adds rate of crawl to interest rate on dollar-linked securities.2/ Includes recapitalization transfers made under 2007 law.
0
1
2
3
4
5
6
7
0
1
2
3
4
5
6
7
2002 2004 2006 2008 2010 2012
CADR average
One-year LIBOR in U.S. dollars
Implicit interest rate on reserves(percent)
0
1
2
3
4
5
6
7
0
1
2
3
4
5
6
7
2002 2004 2006 2008 2010 2012
CADR average
Five-year U.S. Treasury yield
Implicit interest rate on external debt(percent)
5
10
15
20
25
30
5
10
15
20
25
30
2002 2004 2006 2008 2010 2012
CRI DOMGTM HNDNIC 1/
Implicit interest rate on domestic currency securities (percent)
2004: 38.6%
0
1
2
3
4
5
6
7
0
1
2
3
4
5
6
7
2002 2004 2006 2008 2010 2012
CRI DOM 2/GTM HNDNIC
Implicit interest rate on domestic assets(percent)

23
government securities bearing below-market interest rates to cover losses, the economic value of capital does not correspond to its book value. “Economic capital” is calculated by adjusting book capital for the difference between the rate of return on claims on the nonfinancial public sector and that on the marketable debt of the central bank. To the extent that the former rate of return is lower, the expected economic value of those claims is lower than the book value. The difference is subtracted from book capital to yield a measure of economic capital.
The economic value of capital is below book capital for most CADR central banks. The rate of return on CADR central banks’ claims on the NFPS is currently well below that on interest-bearing liabilities in all countries except Costa Rica (Figure 11). For the other countries, applying this return differential lowers the market value of these claims by more than half. Thus, the small positive values of book capital in Guatemala and Honduras become negative and the small negative values in the Dominican Republic and Nicaragua become substantially negative. Under this approach, central bank capital in the latter two countries was negative 9 percent of GDP and negative 15 percent of GDP, respectively, at end-2012. While these levels are not as negative as they had been in previous years, the magnitude underscores the challenges these central banks face in mending their balance sheets.
B. Capital Adequacy: Consistency with Low Inflation
This paper uses the approach in Ize (2005) to estimate central bank capital adequacy for CADR countries. Ize derived a quantitative approach to calculating “core profits” (the profits that a central bank would obtain without capital), the “core rate of inflation” (the minimum rate of inflation that a central bank would need to target in the absence of capital), and “core capital” (the minimum capital needed by a central bank to ensure the credibility of its inflation target). These concepts are explained in detail in Appendix II.
Figure 11. Book Capital and Economic Capital of CADR Central Banks
Sources: National authorities; IMF, International Financial Statistics; and IMF staff calculations.1/ The return on dollar-linked securities is adjusted for the rate of crawl of the domestic currency.
-20
-10
0
10
20
30
-20
-10
0
10
20
30
CRI
DO
M
GTM
HN
D
NIC CR
I
DO
M
GTM
HN
D
NIC
Claims on NFPS Capital
Book value
Market value
Claims on the government and capital, 2012(percent of GDP)
0
2
4
6
8
10
12
14
16
18
0
2
4
6
8
10
12
14
16
18
CRI DOM GTM HND NIC 1/
Central bank securities
Claims on nonfinancial public sector
Rates of return, 2012(in percent)
24
This paper calculates benchmark capital levels using various assumptions. The calculations are based on a projection of profits in a fully deterministic world, that is, where key policy and macroeconomic variables are known with certainty. All items of the balance sheet—especially excess international reserves—are assumed to grow at the same rate as currency; operating expenditures are also assumed to grow at this rate.24 This paper also assumes that all central bank domestic assets and liabilities other than the monetary base (currency and commercial bank reserves) and claims on the government are remunerated at market rates of interest, allowing them to be treated homogenously.25
The parameter values needed to calculate benchmark capital levels are shown in Appendix II. The parameters are: 1) elasticity of the monetary base with respect to GDP; 2) real GDP growth; 3) the real foreign interest rate; 4) the real interest rate on marketable debt of the central bank; 5) the target inflation rate; 6) international reserves; and 7) central bank operating expenditures net of non-interest income. These are set at historical values except for the target inflation rate, which was set at 5 percent for all countries.26
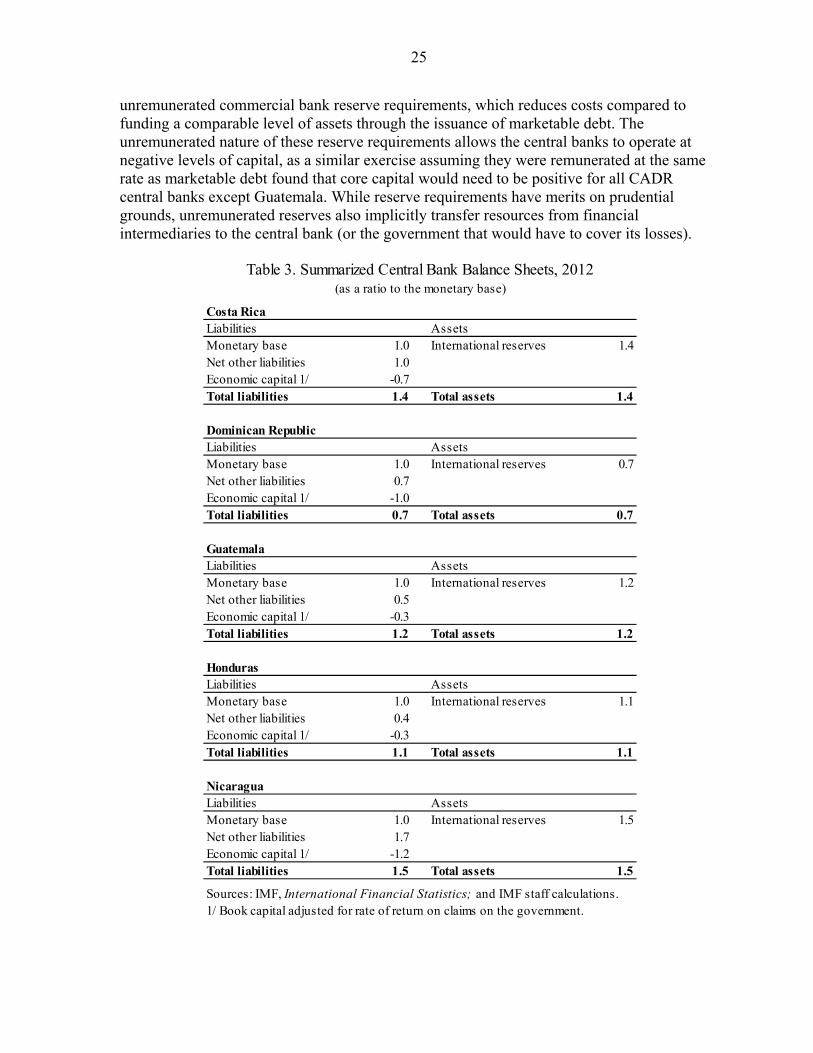
These parameters are applied to the stylized balance sheets to estimate core profits, the core rate of inflation, and core capital. The stylized balance sheets as of end-2012 are shown in Table 3. Note the aggregation of all assets other than international reserves and all liabilities other than the monetary base into “Net other liabilities”. Table 3 shows that in all countries other than the Dominican Republic international reserves exceed the monetary base and in all countries economic capital is negative, necessitating the issuance of other liabilities to fund the balance sheet. Thus, any difference between the rate of return on international reserves and that on the central bank’s interest-bearing liabilities will be a key driver of the income position and balance sheet dynamics under this approach. The other drivers are the rate of inflation, as this determines seignorage revenue derived from the monetary base, and the level of operating costs.
Under these assumptions, CADR central banks would eventually generate profits with their current balance sheet structure. Table 4 shows that with all variables at their steady state, core profits with zero capital would be positive at a 5 percent inflation rate for all countries. This would enable all central banks to maintain inflation below 5 percent with the current structure of their balance sheets. This suggests that the current level of capital, while negative, would be sufficient to back announced inflation objectives. The driving factors are the assumed return of international interest rates to their long-run average, which would increase income, and the ability to fund a significant portion of their balance sheets through
24 Ize (2005) employed scenarios using various assumptions for balance sheet growth. The results of those scenarios for CADR countries were not substantively different, so this paper focuses the results on the uniform growth scenario.
25 Ize (2005) abstracts from the possibility that a central bank could finance assets with unremunerated reserve requirements.
26 Some central banks have set lower inflation targets for the coming years, but using a value of 4 percent yielded similar results. Thus, 5 percent was used for all countries for comparative purposes.
25
unremunerated commercial bank reserve requirements, which reduces costs compared to funding a comparable level of assets through the issuance of marketable debt. The unremunerated nature of these reserve requirements allows the central banks to operate at negative levels of capital, as a similar exercise assuming they were remunerated at the same rate as marketable debt found that core capital would need to be positive for all CADR central banks except Guatemala. While reserve requirements have merits on prudential grounds, unremunerated reserves also implicitly transfer resources from financial intermediaries to the central bank (or the government that would have to cover its losses).
Costa RicaLiabilities AssetsMonetary base 1.0 International reserves 1.4Net other liabilities 1.0Economic capital 1/ -0.7Total liabilities 1.4 Total assets 1.4
Dominican RepublicLiabilities AssetsMonetary base 1.0 International reserves 0.7Net other liabilities 0.7Economic capital 1/ -1.0Total liabilities 0.7 Total assets 0.7
GuatemalaLiabilities AssetsMonetary base 1.0 International reserves 1.2Net other liabilities 0.5Economic capital 1/ -0.3Total liabilities 1.2 Total assets 1.2
HondurasLiabilities AssetsMonetary base 1.0 International reserves 1.1Net other liabilities 0.4Economic capital 1/ -0.3Total liabilities 1.1 Total assets 1.1
NicaraguaLiabilities AssetsMonetary base 1.0 International reserves 1.5Net other liabilities 1.7Economic capital 1/ -1.2Total liabilities 1.5 Total assets 1.5
Sources: IMF, International Financial Statistics; and IMF staff calculations.1/ Book capital adjusted for rate of return on claims on the government.
Table 3. Summarized Central Bank Balance Sheets, 2012(as a ratio to the monetary base)

26
C. Capital Adequacy: Baseline Projections and Risks
The above exercises find that in the steady state, the economic capital of CADR central banks is sufficient to back macroeconomic stability in the presence of unremunerated reserve requirements. This section addresses the transition to the steady state under broadly unchanged policies and the potential risks along the transition path by constructing a baseline projection of the balance sheet and net income of each central bank and evaluating its sensitivity to shocks, as in Roy (2009) and Restrepo and others (2008).
This exercise uses the same macroeconomic parameters, but a more detailed balance sheet disaggregation. Accounting for the heterogeneous nature of the assets and liabilities on central banks’ balance sheets permits finer estimates of net interest expenditure and net capital gains. Treatment of claims on the government and currency issue is as before. In addition, CADR central banks tend to be invested with government deposits at zero or low yields. The stylized scenarios also implicitly assumed that international reserves are the only item on the central bank balance sheet denominated in foreign currency, while these detailed scenarios account for the currency composition of all items on the balance sheet.
The average ratio of balance sheet quantities to GDP over 2010–2012 was taken as the starting point. Required reserves and most other liabilities excluding securities are projected to grow with nominal GDP, except external debt which is projected to grow with international reserves.27 International reserves and other external assets are assumed to grow with domestic liabilities excluding securities, generally resulting in a stable share of reserves to GDP. Since most claims on the nonfinancial public sector arise from cumulative losses, which in this exercise are capitalized, it is assumed that no new claims arise and they are thus fixed in nominal terms.28 Other assets are assumed to grow with nominal GDP. With the asset
27 For the Dominican Republic, outstanding obligations to the International Monetary Fund are assumed to be repaid before external debt begins to grow with GDP.
28 The Dominican Republic is an exception, as it has an ongoing recapitalization program, so claims on the nonfinancial public sector are endogenous to the central bank’s overall balance and recapitalization transfers.
Ω c π c k c
Core profits Core inflation Core capital
(percent of monetary base)
(percent) (ratio to monetary base)
Costa Rica 5.2 -0.2 -3.6Dominican Republic 0.2 4.8 0.0Guatemala 4.2 0.8 -3.9Honduras 4.4 0.6 -2.6Nicaragua 3.0 2.0 -6.2
Table 4. Core Profits, Core Inflation, and Core Capital
Source: IMF staff calculations.
27
structure of the balance sheet given by these assumptions, it is assumed that marketable securities are issued to fill in the remainder of the liability side of the balance sheet.
This exercise produces a projected path of capital over time. In contrast to the stylized approach, which evaluates the current level of capital with respect to a benchmark level, this detailed approach projects the path of capital of each CADR central bank over time. This is an important difference, as annual profits or losses that accrue to capital over a span of several years can significantly alter the financial position of a central bank. Historical rates of return and net operating balances are used to obtain an estimate of the central bank’s annual profit or loss.29 30 As with the stylized scenarios, it is assumed that a form of purchasing power parity holds, as each currency depreciates against the dollar at a rate equal to its inflation differential vis-à-vis the United States. This generates net capital gains equivalent to the rate of depreciation times the difference between assets and liabilities denominated in foreign currency. Once projected, the annual profit or loss is then added to economic capital to yield the value of capital under unchanged policies.
These scenarios find that the capital positions of most CADR central banks are likely to improve over time, albeit at a slow pace. Figure 12 shows projections of the annual overall balance and level of economic capital for each CADR central bank out to 2033. The emphasis when evaluating the results should be on the direction of the path of capital rather than on the exact number in any particular year. The results show that the capital positions of all CADR central banks are projected to eventually improve as the rate of return on international reserves increases. Over time economic capital would reach a steady-state value in positive territory in most countries.
These results are driven by the presence of low-cost liabilities, as well as stronger balance sheets and improved monetary policy credibility in recent years. Figure 12 shows that the implicit interest rate on all central bank liabilities excluding currency is far lower than the rate on marketable securities. This owes primarily to the presence of unremunerated reserve requirements and government deposits. In addition, net foreign currency positions have improved and write-downs of non-performing assets have been less common, supporting net capital gains. Furthermore, interest rates on central bank securities have come down, partly reflecting lower actual and expected inflation. These factors allow CADR central banks to fund international reserves in excess of the monetary base despite the presence of other low-yielding domestic assets on the balance sheet.
29 For a more realistic path on the rate of return on international reserves, the forecast for the six-month LIBOR was taken from the IMF’s World Economic Outlook for 2013–2018.
30 For the Dominican Republic, in light of the recent ad hoc changes to recapitalization transfers, a conservative path is chosen setting transfers at 1.0 percent of GDP until the central bank’s net income is positive, then gradually reducing them to 0.5 percent of GDP until claims on the government are extinguished. The results hinge critically on this assumption, as maintaining recapitalization transfers at 0.7 percent of GDP would result in an explosive negative path for central bank capital while transfers above 1 percent of GDP would place capital on an upward path before 2030. Thus, the results for the Dominican Republic should be seen as highly illustrative depending on the validity of this assumption.
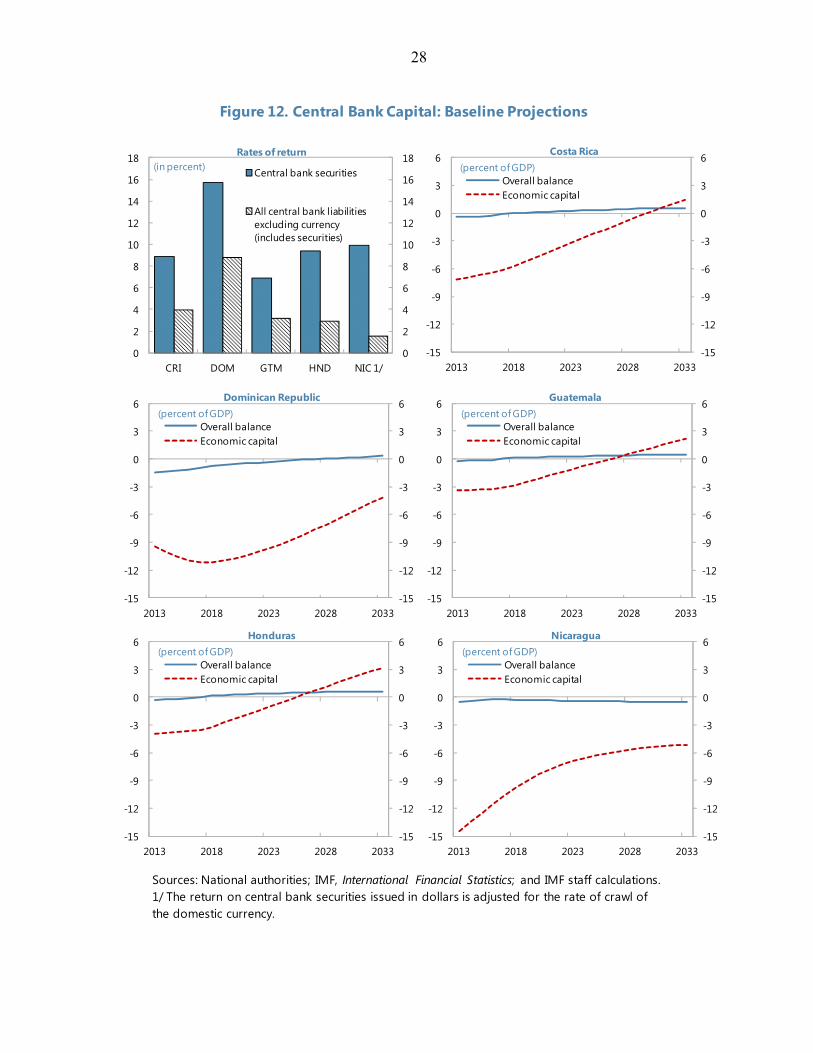
28
Figure 12. Central Bank Capital: Baseline Projections
Sources: National authorities; IMF, International Financial Statistics; and IMF staff calculations.1/ The return on central bank securities issued in dollars is adjusted for the rate of crawl of the domestic currency.
0
2
4
6
8
10
12
14
16
18
0
2
4
6
8
10
12
14
16
18
CRI DOM GTM HND NIC 1/
Central bank securities
All central bank liabilities excluding currency (includes securities)
Rates of return(in percent)
-15
-12
-9
-6
-3
0
3
6
-15
-12
-9
-6
-3
0
3
6
2013 2018 2023 2028 2033
Overall balanceEconomic capital
Costa Rica(percent of GDP)
-15
-12
-9
-6
-3
0
3
6
-15
-12
-9
-6
-3
0
3
6
2013 2018 2023 2028 2033
Overall balanceEconomic capital
Dominican Republic(percent of GDP)
-15
-12
-9
-6
-3
0
3
6
-15
-12
-9
-6
-3
0
3
6
2013 2018 2023 2028 2033
Overall balanceEconomic capital
Guatemala(percent of GDP)
-15
-12
-9
-6
-3
0
3
6
-15
-12
-9
-6
-3
0
3
6
2013 2018 2023 2028 2033
Overall balanceEconomic capital
Honduras(percent of GDP)
-15
-12
-9
-6
-3
0
3
6
-15
-12
-9
-6
-3
0
3
6
2013 2018 2023 2028 2033
Overall balanceEconomic capital
Nicaragua(percent of GDP)
29
These results suggest that the financial positions of most CADR central banks would eventually improve, but only after several years with negative capital and in the absence of economic shocks. Given the link between central bank financial strength and macroeconomic performance, a prolonged period of negative capital could challenge the credibility of monetary policy, pushing up inflation and rates on the central bank’s interest-bearing liabilities. Given their high level of openness and susceptibility to natural disasters, the CADR countries are also vulnerable to exogenous shocks (Swiston 2012). The associated capital outflows or supply shocks could raise expenses by increasing domestic interest rates or lowering the non-interest-bearing liabilities of the central bank.
Given the potential risks to the baseline scenario, the sensitivity of capital to shocks should be taken into account. Four scenarios were constructed in which one key variable is permanently shocked. The scenarios are: 1) Real GDP growth is reduced by one percentage point; 2) Interest rates on central bank securities are increased by one percentage point; 3) Gross international reserves-to-GDP are set at the maximum over 2010–2012; 4) The growth of non-interest-bearing liabilities other than currency issue is reduced by one percentage point.31 A fifth scenario combines these four shocks. As indicated in the discussion of the baseline, the emphasis is on the impact on the path of capital more than on the exact magnitude of the shock or the level of capital in a given year.32
An understanding of the transmission mechanisms through which these shocks would operate is critical to interpreting the results. In the model constructed here, lower real GDP growth would primarily affect the central bank balance sheet by reducing the rate of growth of the monetary base; holding constant the ratio of international reserves to GDP, this would necessitate the issuance of more securities, which would raise interest expenditure and reduce the overall balance relative to the baseline, resulting in lower capital. Higher interest rates would directly impact interest expenditure and the overall balance. For the other shocks, either higher international reserves or lower non-interest-bearing liabilities would necessitate the issuance of more securities to fund the balance sheet. In all cases, feedback from a lower overall balance to lower capital would generate a need for additional issuance of securities. The interest on these securities in future years would add to the impact on the overall balance and the path of capital.
The individual shocks do not dramatically alter the path of capital. For Costa Rica, the Dominican Republic, Guatemala, and Honduras, central bank capital would still begin to improve as monetary policy in advanced countries normalizes, raising the return on international reserves (Figure 13). For Nicaragua, the individual shocks have little impact because the balance sheet is hedged—international reserves are funded largely by external debt.
31 Currency issue already grows slower than GDP because of its maximum elasticity of 0.8, so this scenario only considers other non-interest-bearing liabilities, which in the baseline grow with nominal GDP.
32 For comparability, the shocks were set uniformly across countries rather than using magnitudes that would vary across countries such as historical standard deviations, which were used in Restrepo and others (2008).

30
Figure 13. Central Bank Capital: Sensitivity to Shocks
Source: IMF staff calculations.
-8
-6
-4
-2
0
2
-8
-6
-4
-2
0
2
2013 2018 2023 2028 2033
BaselineLower growthHigher reservesHigher interest ratesLower non-interest-bearing liabilitiesCombined
Costa Rica(percent of GDP)
-15
-12
-9
-6
-3
0
-15
-12
-9
-6
-3
0
2013 2018 2023 2028 2033
Nicaragua(percent of GDP)
-6
-4
-2
0
2
4
-6
-4
-2
0
2
4
2013 2018 2023 2028 2033
Honduras(percent of GDP)
-5
-4
-3
-2
-1
0
1
2
3
-5
-4
-3
-2
-1
0
1
2
3
2013 2018 2023 2028 2033
Guatemala(percent of GDP)
-30
-25
-20
-15
-10
-5
0
-30
-25
-20
-15
-10
-5
0
2013 2018 2023 2028 2033
Dominican Republic(percent of GDP)

31
The scenario combining shocks suggests that in a worst-case scenario, the capital of all CADR central banks would remain negative for a prolonged period. Given the permanent nature of the shocks and the low likelihood that all would be experienced simultaneously, the combined scenario should be seen as revealing which central bank balance sheets are relatively more resistant to major macroeconomic stress. For Costa Rica, Guatemala, and Honduras, central bank capital would dip slightly, then begin improving after 2018 (when world interest rates return to typical levels, generating income on international reserves), but more slowly than in the baseline and remaining negative for over two decades (Figure 13). For Nicaragua, the combined scenario has little impact, as was the case for the individual shocks.33 For the Dominican Republic, the combined scenario results in a trajectory of capital that does not improve in the long run. While this outcome should be interpreted with caution because of the uncertainty inherent in such long-term projections, it does underscore the vulnerability of the baseline capital projection.
VI. CONCLUSIONS
The financial strength of CADR central banks is improving. Since 2010 net losses have been reduced to levels lower than at any time over the past 25 years. This improvement appears likely to be durable, as several structural factors have contributed. These include improvements to financial supervision and legal reforms that should reduce the probability and costs of central bank intervention in future banking crises; longer positions in foreign exchange that are yielding capital gains when currencies depreciate; a decline in low-yielding claims on the government and parallel reduction in the stock of interest-bearing central bank securities; and lower rates on these securities, as inflation has fallen and the credibility of monetary policy increased.
However, some weaknesses remain. CADR central banks continue to make losses, as both interest and operating expenses are higher than income from those sources. The deficit in interest income persists despite significant unremunerated reserve requirements and a relatively low level of international reserves. Claims on the government stemming from cumulative losses remain high in some countries and most are not remunerated at a rate high enough to compensate for funding costs. Adjusting capital for this below-market rate of return reveals that economic capital is negative for all CADR central banks. By contrast, the financial position of LA-5 central banks is stronger, as net income is roughly balanced, international reserves are higher, and governments have removed cumulated losses from central bank balance sheets.
Under current policies, the financial strength of CADR central banks should improve, but only gradually and if risks do not materialize. Since capital at CADR central banks is negative, the existence of unremunerated reserve requirements plays a key role in backing current inflation objectives. Given current balance sheet structures and rates of return, the capital position of most CADR central banks is sufficient to support announced inflation objectives, and should improve over time. However, shocks have the potential to lengthen the
33 The main impact is from lower GDP growth, as this lowers the denominator of capital-to-GDP.
32
period of negative capitalization, posing risks to the capacity of central banks to maintain macroeconomic stability.
Further reforms and a stronger commitment to recapitalization would help entrench central bank financial strength. Increasing the emphasis on low inflation as the primary objective of monetary policy would reduce funding costs, improving net income. Some reforms that would aid CADR central banks in pursuing this objective are increased exchange rate flexibility and enhanced autonomy of the central bank board, including through lengthening the terms of office, introducing checks and balances to the appointment and dismissal processes, and revisiting the issue of government representation on the board. Improving recapitalization procedures and increasing their clarity would strengthen the financial position of CADR central banks and enhance transparency. Central bank laws should require prompt reimbursement of losses; when recapitalization bonds are transferred, the rate of return should equal the cost to the central bank of issuing a similar instrument. Low-yielding claims on the government currently held by central banks could be swapped for instruments bearing market rates. These reforms would require political will to implement, but would yield long-term benefits by boosting monetary policy credibility and increasing the capacity of CADR central banks to engage in macroeconomic stabilization.
33
Appendix I. Detailed Balance Sheets of CADR Central Banks
The online appendix to this paper contains the end-year balance sheets of CADR central banks since 2001, as a percent of GDP. The information is drawn from data submitted for the IMF’s International Financial Statistics. Data for some countries was adjusted to ensure consistency in categorization across countries, using details from the audited financial statements of each central bank. Data on GDP is from the IMF’s World Economic Outlook.
Appendix II. Estimating Central Bank Capital Needs
Ize (2005) derived a quantitative approach to calculating “core profits”, which are the profits that a central bank would obtain without capital, the “core rate of inflation”, which is the minimum rate of inflation that a central bank would need to target in the absence of capital, and “core capital”, which is the minimum capital needed by a central bank to ensure the credibility of its inflation target. This approach is based on a projection of profits in a fully deterministic world, i.e., where all key policy and macroeconomic variables are known with certainty, including the growth rate of all items on the central bank’s balance sheet. This approach assumes that all central bank domestic assets and liabilities except the monetary base are remunerated at market rates of interest, allowing them to be treated homogenously in these calculations.
Concepts and definitions
Core profits (Ωc) are derived as a function of the real interest rate on public securities of the reserve country (r*), the targeted inflation rate (π), the interest rate premium on central bank debt (φ), international reserves held in excess of the monetary base (u), and central bank operating expenditures (o).34 Central banks with a lower risk premium, that hold fewer excess international reserves, or that have low operating expenditures would have larger core profits.
Ωc = r* + π – φµ – o (1)
The core rate of inflation (πc) is defined as the threshold rate of inflation that ensures zero core profitability, and is a function of the risk premium on central bank debt, the level of international reserves, and operating expenditures.
πc = φµ + o – r* (2)
Core capital (kc) is a function of the above variables and the projected rate of growth (g) of currency issued. Core capital is directly related to core profits (Ωc), as a central bank with positive core profits does not need positive core capital.
kc = (φµ + o – (r* + π))/rn= –Ωc/ rn (3)
34 International reserves in excess of currency are expressed as a ratio to the stock of currency issued. Central bank operating expenditures are expressed in percent of the stock of currency issued.

34
where (rn) is the domestic interest rate adjusted for real growth of currency issued:
rn = r* + φ – g (4)
Parameter values
Table A1 presents values for the parameters needed in order to calculate the above concepts. The value for r* is the 20-year average of the three-month U.S. dollar LIBOR rate minus the annual rate of U.S. CPI inflation, as the return on CADR countries’ international reserves was found to move most closely with this interest rate. The value for r is the 4-year historical average implicit rate of return on each central bank’s interest-bearing local currency instruments minus the annual rate of CPI inflation.35 The target rate of inflation (π) is uniformly set at 5 percent, which is near the current targets for the countries in the region that are in the process of adopting inflation targeting frameworks.36 Average inflation (πavg) over the last 10 years is shown for information. The parameters for excess international reserves (u) and central bank operating expenditures (o) are the average values over 2010–2012. The elasticity of the demand for real currency balances (η) with respect to real GDP was estimated over the period since the early 1990s and capped at a value of 0.8.37 This elasticity and IMF staff forecasts of medium-term real GDP growth were used to calculate the real rate of growth of currency (g).
Following the methodology of Ize (2005), the parameters in Table A1 are applied to the quantities in Table 3 in the text to yield the estimates of core profits, the core rate of inflation, and core capital shown in the text.
35 The shorter history is used to reflect more closely recent performance for the average inflation rate and nominal interest rates on central bank securities. For the Dominican Republic an average of the interest rates on recent placements was used, since rates have been lower than the weighted average of the outstanding stock.
36 Using 4 percent as the target yields similar results.
37 This cap was set to obtain a positive value for rn, a necessary condition to avoid situations in which a central bank could service its debt indefinitely by issuing new currency.
r* r φ π π avg u o η g r n
Costa Rica 1.3 4.4 3.1 5.0 9.2 0.2 0.4 0.7 2.9 1.4Dominican Republ 1.3 11.4 10.1 5.0 11.9 0.3 3.3 0.7 3.1 8.2Guatemala 1.3 3.9 2.6 5.0 6.2 0.2 1.5 0.8 2.8 1.1Honduras 1.3 4.1 2.8 5.0 7.0 0.2 1.2 0.8 2.4 1.7Nicaragua 1.3 3.7 2.4 5.0 8.7 0.4 2.2 0.8 3.2 0.5
Table A1. Parameters for Calculating Capital Needs
Sources: National Authorities; Haver Analytics; IMF, International Financial Statistics; IMF, World Economic Outlook; and IMF staff calculations.
35
References
Acemoglu, D., S. Johnson, P. Querubín, and J. Robinson, 2008, “When Does Policy Reform Work? The Case of Central Bank Independence,” Brookings Papers on Economic Activity, Spring 2008, pp. 351–417.
Adler, G., P. Castro, and C. Tovar, 2012, “Does Central Bank Capital Matter for Monetary Policy?” IMF Working Paper 12/60 (Washington: International Monetary Fund).
Ansorena, C., 2007, “Competencia y regulación en la banca: el caso de Nicaragua,” CEPAL Serie estudios y perspectivas 85 (Mexico City: ECLAC).
Arnone, M., B. Laurens, J. Segalotto, and M. Sommer, 2009, “Central Bank Autonomy: Lessons from Global Trends,” IMF Staff Papers, Vol. 56, No. 2, pp. 263–296.
Balsells, E., 2007, “Competencia y regulación en el sector de la banca en Guatemala,” CEPAL (Mexico City: ECLAC). Available via the Internet: http://www.eclac.org/cgi-bin/getProd.asp?xml=/publicaciones/xml/3/27793/P27793.xml&xsl=/mexico/tpl/p9f.xsl&base=/mexico/tpl/top-bottom.xsl
Bean, C., 2010, “The Great Moderation, the Great Panic, and the Great Contraction,” Journal of the European Economic Association, Vol. 8, No. 2–3, pp. 289–325.
Beckerman, P., 1997, “Central-Bank Decapitalization in Developing Economies,” World Development, Vol. 25, No. 2, pp. 167–178.
Benati, L., and P. Surico, 2009, “VAR Analysis and the Great Moderation,” American Economic Review, Vol. 99, No. 4, pp. 1636–1652.
Benecká, S., T. Holub, N. Kadlčáková, and I. Kubicová, 2012, “Does Central Bank Financial Strength Matter for Inflation? An Empirical Analysis,” CNB Working Paper Series 3/2012 (Prague: Czech National Bank).
Berger, H., J. de Haan, and S. Eijffinger, 2001, “Central Bank Independence: An Update of Theory and Evidence,” Journal of Economic Surveys, Vol. 15, No. 1, pp. 3–40.
Berriel, T., and S. Bhattarai, 2009, “Monetary Policy and Central Bank Balance Sheet Concerns,” The B.E. Journal of Macroeconomics, Vol. 9, No. 1, pp. 1–31.
Buiter, W., 2007, “Seigniorage,” economics - The Open-Access, Open-Assessment E-Journal, 2007-10. http://www.economics-ejournal.org/economics/journalarticles/2007-10.
_______, 2008, “Can Central Banks Go Broke?” CEPR Discussion Paper No. 6827 (London: Centre for Economic Policy Research).
Cochrane, J., 2011, “Understanding Policy in the Great Recession: Some Unpleasant Fiscal Arithmetic,” European Economic Review, Vol. 55, pp. 2–30.
Comelli, F., 2013, “Comparing Parametric and Non-Parametric Early Warning Systems for Currency Crises in Emerging Market Economies,” IMF Working Paper 13/134 (Washington: International Monetary Fund).
Delgado, F., and M. Meza, 2012, “Financial Supervision and Macroprudential Policies,” in M. Piñón and others (eds.), Central America, Panama, and the Dominican Republic: Challenges Following the 2008–09 Global Crisis (Washington: International Monetary Fund).
36
Fry, M., 1993, “The Fiscal Abuse of Central Banks,” IMF Working Paper 93/58 (Washington: International Monetary Fund).
International Monetary Fund, 2011, “Assessing Reserve Adequacy,” IMF Policy Paper (Washington: International Monetary Fund). Available via the Internet: http://www.imf.org/external/pp/longres.aspx?id=4547
_______, 2013, Annual Report on Exchange Arrangements and Exchange Restrictions (Washington: International Monetary Fund).
Ize, A., 2005, “Capitalizing Central Banks: A Net Worth Approach,” IMF Staff Papers, Vol. 52, No. 2, pp. 289–310.
_______, 2007, “Spending Seigniorage: Do Central Banks Have a Governance Problem?” IMF Staff Papers, Vol. 54, No. 3, pp. 563–589.
Jácome, L., 2008, “Central Bank Involvement in Banking Crises in Latin America,” IMF Working Paper 08/135 (Washington: International Monetary Fund).
_______, and E. Parrado, 2008, “Characterizing Monetary Policy,” in D. Desruelle and A. Schipke (eds.), IMF Occasional Paper 257, Economic Growth and Integration in Central America (Washington: International Monetary Fund).
_______, and F. Vázquez, 2008, “Is There Any Link Between Central Bank Independence and Inflation? Evidence from Latin America and the Caribbean,” European Journal of Political Economy, Vol. 24, pp. 788–801.
_______, T. Saadi Sedik, and S. Townsend, 2012, “Can Emerging Market Central Banks Bail Out Banks? A Cautionary Tale from Latin America,” Emerging Markets Review, Vol. 13, No. 4, pp. 424–448.
Jeanne, O., and L. Svensson, 2007, “Credible Commitment to Optimal Escape from a Liquidity Trap: The Role of the Balance Sheet of an Independent Central Bank,” American Economic Review, Vol. 97, No. 1, pp. 474–490.
Klomp, J., and J. de Haan, 2010a, “Inflation and Central Bank Independence: A Meta-Regression Analysis,” Journal of Economic Surveys, Vol. 24, No. 4, pp. 593–621.
_______, and _______, 2010b, “Central Bank Independence and Inflation Revisited,” Public Choice, Vol. 144, No. 3–4, pp. 445–457.
Klüh, U., and P. Stella, 2008, “Central Bank Financial Strength and Policy Performance: An Econometric Evaluation,” IMF Working Paper 08/176 (Washington: International Monetary Fund).
Laeven, L., and F. Valencia, 2008, “Systemic Banking Crises: A New Database,” IMF Working Paper 08/224 (Washington: International Monetary Fund).
_______, and _______, 2012, “The Use of Blanket Guarantees in Banking Crises,” Journal of International Money and Finance, Vol. 31, No. 5, pp. 1220–1248.
_______, and _______, 2013, “Systemic Banking Crises Database,” IMF Economic Review, Vol. 61, No. 2, pp. 225–270.

37
Leone, A., 1994, “Institutional and Operational Aspects of Central Bank Losses,” in T. Baliño and C. Cottarelli (eds.), Frameworks for Monetary Stability: Policy Issues and Country Experience (Washington: International Monetary Fund).
Magnusson Bernard, K., 2011, “International Reserve Adequacy in Central America,” IMF Working Paper 11/144 (Washington: International Monetary Fund).
Medina Cas, S., A. Carrión-Menéndez, and F. Frantischek, 2012, “Monetary Policy Frameworks,” in M. Piñón and others (eds.), Central America, Panama, and the Dominican Republic: Challenges Following the 2008–09 Global Crisis (Washington: International Monetary Fund).
Ostry, J., A. Ghosh, and M. Chamon, 2012, “Two Targets, Two Instruments: Monetary and Exchange Rate Policies in Emerging Market Economies,” IMF Staff Discussion Note SDN/12/01 (Washington: International Monetary Fund).
Perera, A., D. Ralston, and J. Wickramanayake, 2013, “Central Bank Financial Strength and Inflation: Is There a Robust Link?” Journal of Financial Stability, Vol. 9, No. 3, pp. 399–414.
Reinhart, C., and K. Rogoff, 2004, “The Modern History of Exchange Rate Arrangements: A Reintepretation,” Quarterly Journal of Economics, Vol. 119, No. 1, pp. 1–48.
Restrepo, J., L. Salomó, and R. Valdés, 2008, “Macroeconomics, Monetary Policy and the Central Bank of Chile’s Net Worth,” CBCh Working Paper 497 (Santiago: Central Bank of Chile).
Rivera, E., and A. Rodríguez, 2007, “Competencia y regulación en la banca de Centroamérica y México. Un estudio comparativo,” CEPAL Serie estudios y perspectivas 71 (Mexico City: ECLAC).
Roy, T., 2009, “Strengthening the Central Bank,” in A. Santos (ed.), Paraguay: Addressing the Stagnation and Instability Trap (Washington: International Monetary Fund).
Sargent, T., and N. Wallace, 1981, “Some Unpleasant Monetarist Arithmetic,” Federal Reserve Bank of Minneapolis Quarterly Review, Vol. 5, No. 3, pp. 1–17.
Sims, C., 2004, “Fiscal Aspects of Central Bank Independence,” in H. Sinn, M. Widgren, and M. Kothenburger (eds.), European Monetary Integration (Cambridge and London: MIT).
Stella, P., 1997, “Do Central Banks Need Capital?” IMF Working Paper 97/83 (Washington: International Monetary Fund).
_______, 2005, “Central Bank Financial Strength, Transparency, and Policy Credibility,” IMF Staff Papers, Vol. 52, No. 2, pp. 335–365.
_______, 2008, “Central Bank Financial Strength, Policy Constraints, and Inflation,” IMF Working Paper 08/49 (Washington: International Monetary Fund).
_______, and A. Lönnberg, 2008, “Issues in Central Bank Finance and Independence,” IMF Working Paper 08/37 (Washington: International Monetary Fund).
Sullivan, K., 2003, “Profits, Dividends and Capital—Considerations for Central Banks,” in Accounting Standards for Central Banks (London: Central Banking Publications).
38
Swiston, A., 2012, “External Linkages and Economic Integration as of 2009,” in M. Piñón and others (eds.), Central America, Panama, and the Dominican Republic: Challenges Following the 2008–09 Global Crisis (Washington: International Monetary Fund).
Vuletin, G., and L. Zhu, 2011, “Replacing a ‘Disobedient’ Central Bank Governor with a ‘Docile’ One: A Novel Measure of Central Bank Independence and Its Effect on Inflation,” Journal of Money, Credit, and Banking, Vol. 43, No. 6, pp. 1185–1215.