Embed Size (px)
Citation preview
North American Steel IndustryNAFTA Region Update
OECD Steel Committee/WorldSteel AssociationRaw Materials Workshop
December 15-16, 2008 Kuala Lumpur, Malaysia
*American Iron and Steel Institute (AISI)Steel Manufacturers Association (SMA)
Specialty Steel Industry of North America (SSINA)Canadian Steel Producers Association (CSPA)
Mexican Steel Producers Association (CANACERO)
2
Presentation Summary
1. NAFTA Steel Market ConditionsA. Significant Decline in Steel and Major End-Use MarketsB. Growing Trade Concerns
2. North America is a Major Producer, Consumer and Trader of Raw Materials
3. Key Concerns About Raw Materials: Trade and Investment Barriers
4. Key Policy Conclusions
3
1. NAFTA Steel Market Conditions – Part A:Significant Decline in Steel and Major End-Use Markets
4
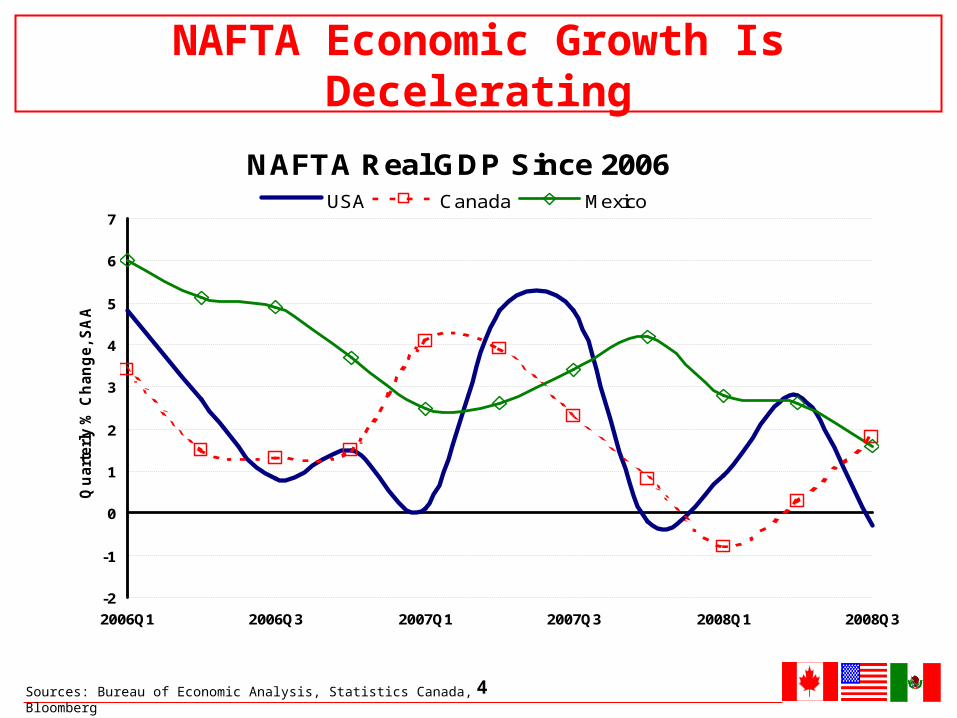
NAFTA Economic Growth Is Decelerating
NAFTA Real GDP Since 2006
-2
-1
0
1
2
3
4
5
6
7
2006Q1 2006Q3 2007Q1 2007Q3 2008Q1 2008Q3
Qu
art
erl
y %
Ch
an
ge, S
AA
R
USA Canada Mexico
Sources: Bureau of Economic Analysis, Statistics Canada, Bloomberg
5
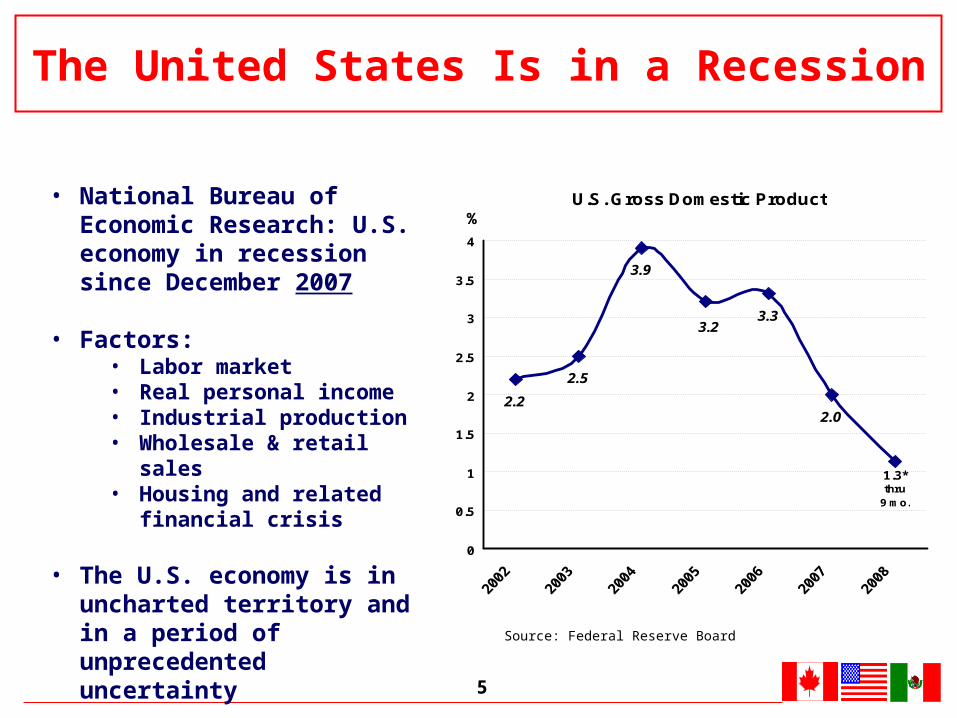
U.S. Gross Domestic Product
2.2
2.5
3.9
3.3
1.3*thru
9 mo.
3.2
2.0
0
0.5
1
1.5
2
2.5
3
3.5
4
%
Source: Federal Reserve Board
The United States Is in a Recession
• National Bureau of Economic Research: U.S. economy in recession since December 2007
• Factors:• Labor market• Real personal income• Industrial production• Wholesale & retail sales• Housing and related financial
crisis
• The U.S. economy is in uncharted territory and in a period of unprecedented uncertainty
6
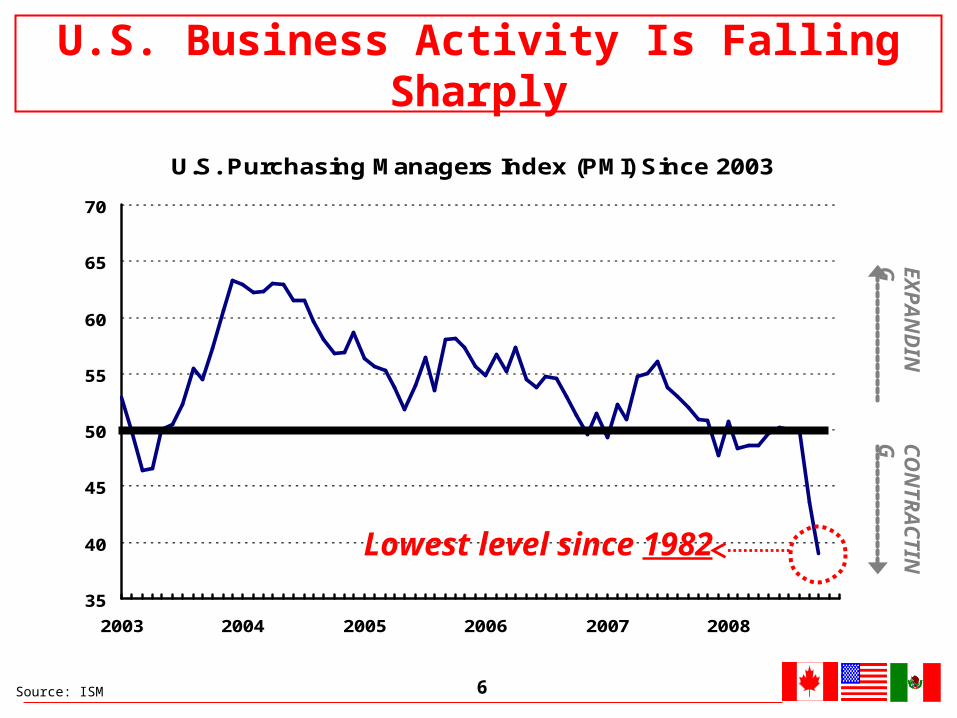
U.S. Purchasing Managers Index (PMI) Since 2003
35
40
45
50
55
60
65
70
2003 2004 2005 2006 2007 2008
EX
PA
ND
ING
CO
NT
RA
CT
ING
Lowest level since 1982
Source: ISM
U.S. Business Activity Is Falling Sharply
7
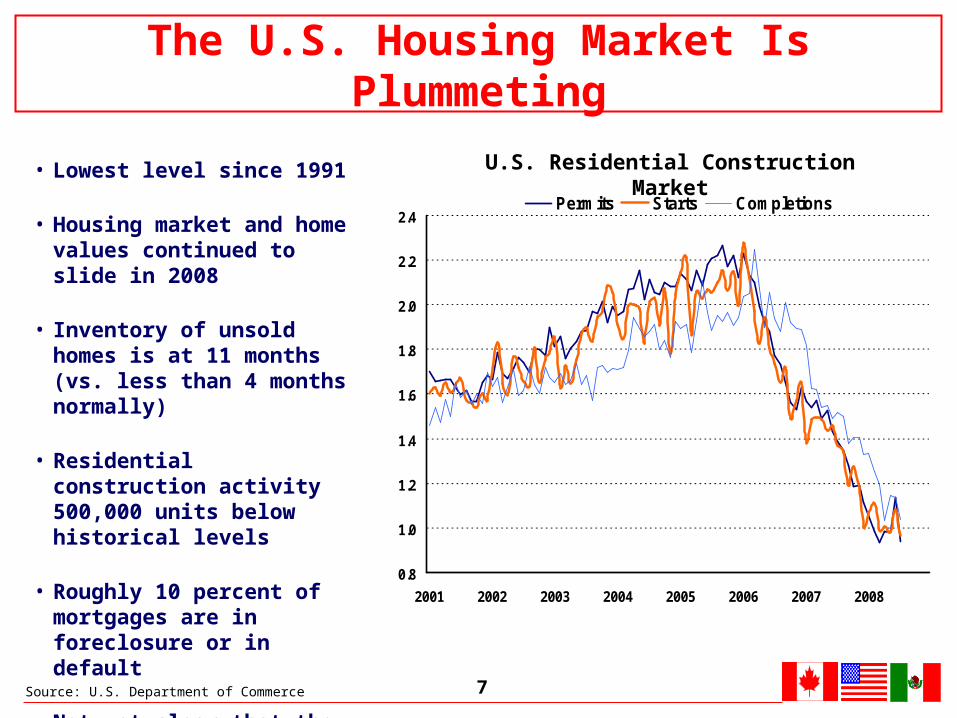
0.8
1.0
1.2
1.4
1.6
1.8
2.0
2.2
2.4
2001 2002 2003 2004 2005 2006 2007 2008
Permits Starts Completions
• Lowest level since 1991
• Housing market and home values continued to slide in 2008
• Inventory of unsold homes is at 11 months (vs. less than 4 months normally)
• Residential construction activity 500,000 units below historical levels
• Roughly 10 percent of mortgages are in foreclosure or in default
• Not yet clear that the housing market has hit bottom
U.S. Residential Construction Market
The U.S. Housing Market Is Plummeting
Source: U.S. Department of Commerce
8
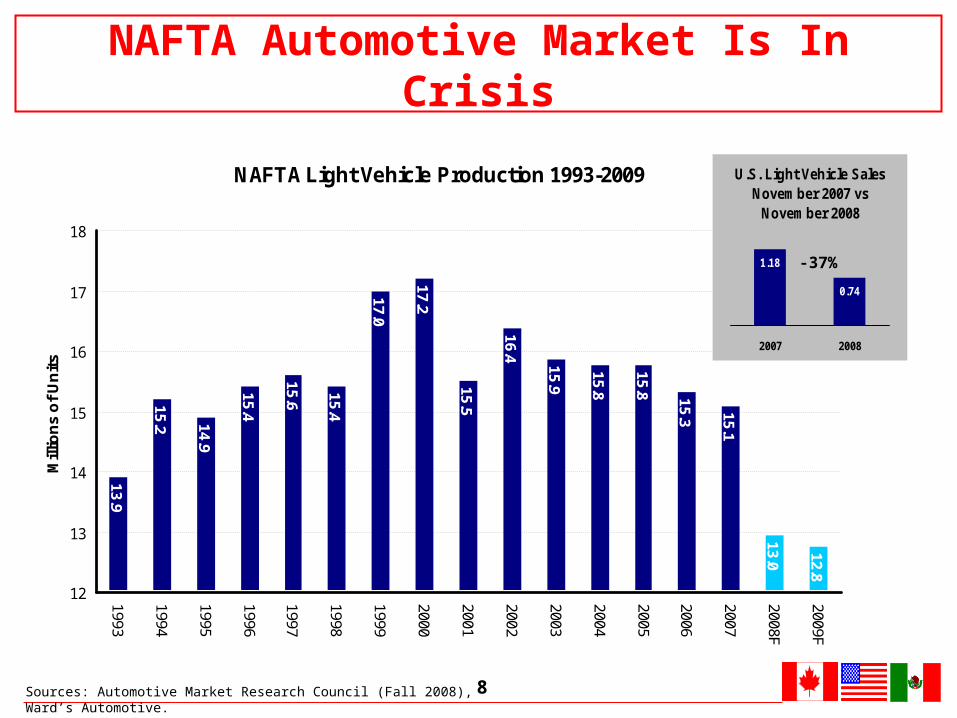
NAFTA Automotive Market Is In Crisis
NAFTA Light Vehicle Production 1993-2009
13.9
15.2 14.9
15.4
15.6
15.4
17.0
17.2
15.5
16.4
15.9
15.8
15.8 15.3 15.1
13.0
12.8
12
13
14
15
16
17
18
1993
1994
1995
1996
1997
1998
1999
2000
2001
2002
2003
2004
2005
2006
2007
2008F
2009F
Mill
ion
s o
f U
nit
s
U.S. Light Vehicle Sales November 2007 vs
November 2008
1.18
0.74
2007 2008
-37%
Sources: Automotive Market Research Council (Fall 2008), Ward’s Automotive.

9
7,000
8,000
9,000
10,000
11,000
12,000
13,000
2008 Weekly
Do
w J
on
es
Va
lue
500
700
900
1,100
1,300
1,500
1,700
1,900
2,100
2,300
2,500
Dow Jones Daily Closing Value U.S. Weekly Raw Steel Production
Prod
uction (000 M
etric Tons)
Source: Dow Jones Industrial Index, AISI
U.S. Steel Production Has Declined Dramatically, Following Both Wall Street And The Real Economy
10
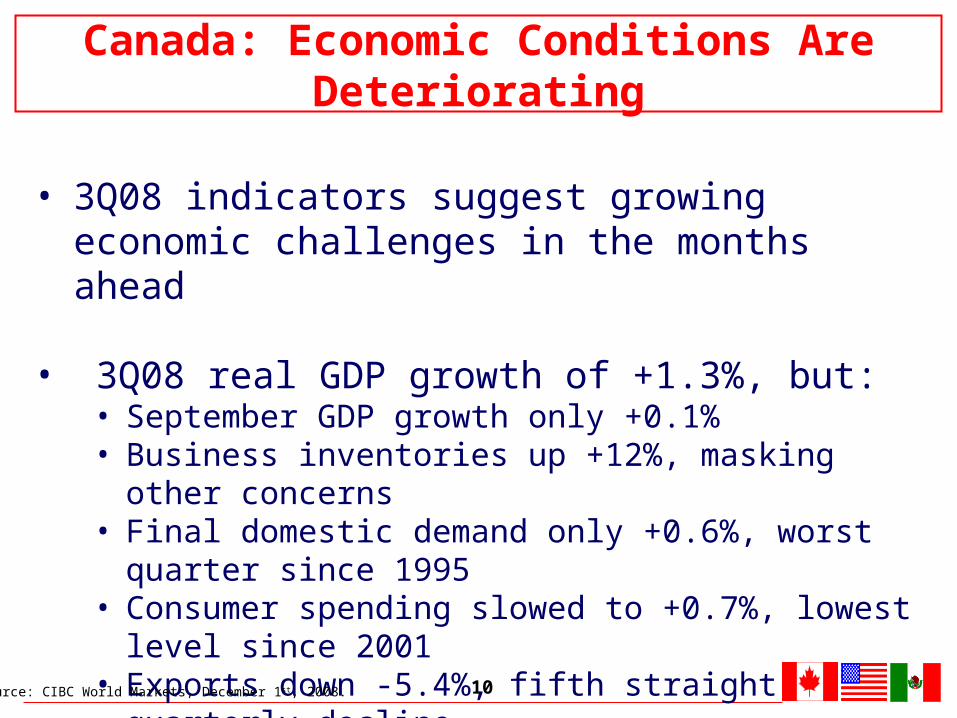
• 3Q08 indicators suggest growing economic challenges in the months ahead
• 3Q08 real GDP growth of +1.3%, but:• September GDP growth only +0.1%• Business inventories up +12%, masking other concerns• Final domestic demand only +0.6%, worst quarter since 1995• Consumer spending slowed to +0.7%, lowest level since 2001• Exports down -5.4%, fifth straight quarterly decline• Real disposable income grew only +0.1%
Source: CIBC World Markets, December 1st, 2008.
Canada: Economic Conditions Are Deteriorating
11
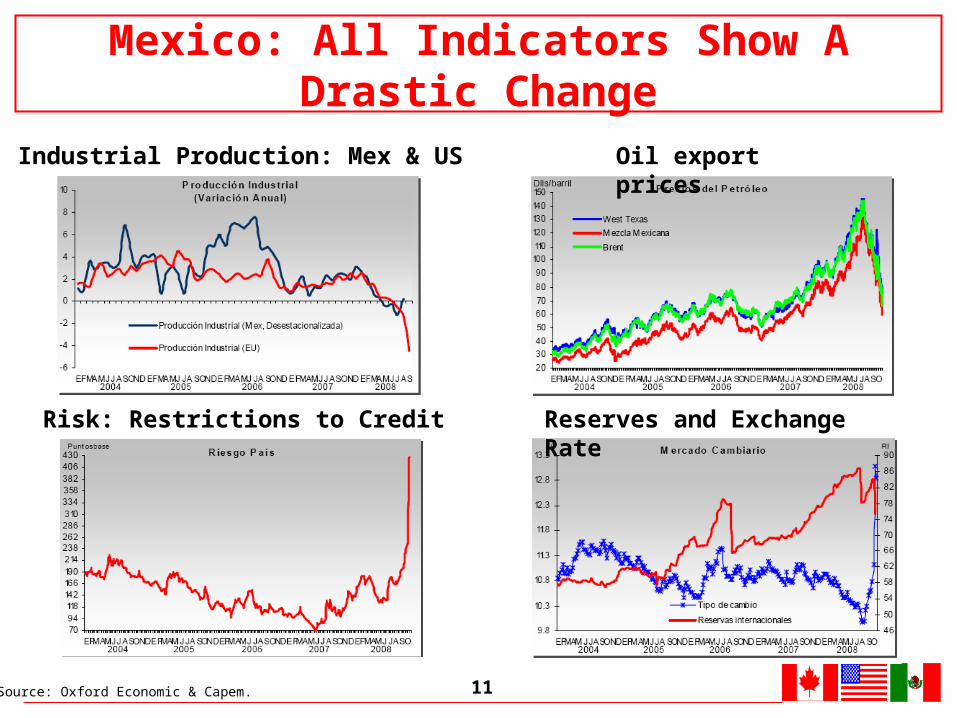
Risk: Restrictions to Credit
Industrial Production: Mex & US Oil export prices
Reserves and Exchange Rate
Source: Oxford Economic & Capem.
Mexico: All Indicators Show A Drastic Change
12
1. NAFTA Steel Market Conditions – Part B:Growing Trade Concerns
13
1,000
1,050
1,100
1,150
1,200
1,250
1,300
1,350
1,400
1,450
1,500
1Q2005
2Q2005
3Q2005
4Q2005
1Q2006
2Q2006
3Q2006
4Q2006
1Q2007
2Q2007
3Q2007
4Q2007
1Q2008
2Q2008
3Q2008(e)
Mil
lio
ns
of
MT
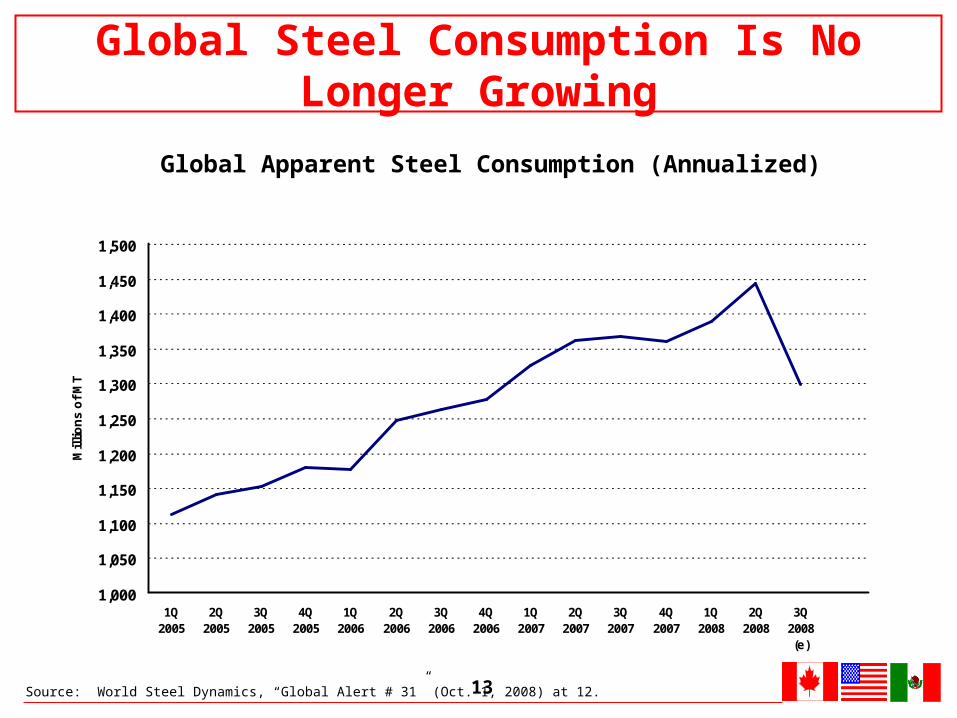
Global Apparent Steel Consumption (Annualized)
Source: World Steel Dynamics, “Global Alert # 31” (Oct. 1, 2008) at 12.
Global Steel Consumption Is No Longer Growing
14
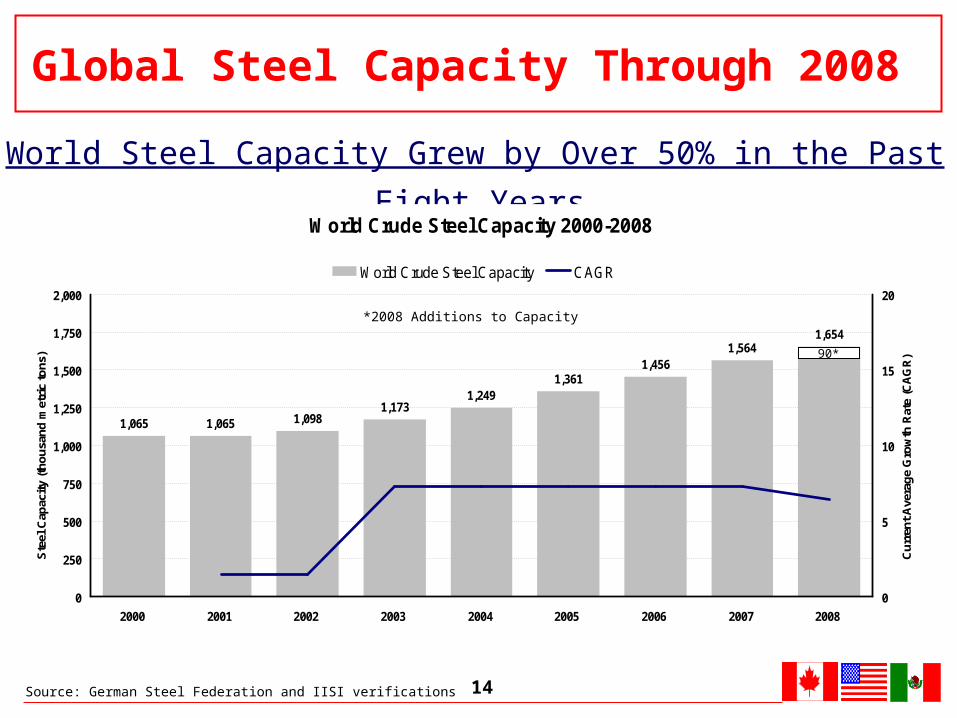
World Steel Capacity Grew by Over 50% in the Past Eight Years
Source: German Steel Federation and IISI verifications
Global Steel Capacity Through 2008
World Crude Steel Capacity 2000-2008
1,065 1,065 1,0981,173
1,2491,361
1,4561,564
1,654
0
250
500
750
1,000
1,250
1,500
1,750
2,000
2000 2001 2002 2003 2004 2005 2006 2007 2008
Ste
el C
apac
ity
(th
ou
san
d m
etri
c to
ns)
0
5
10
15
20
Cu
rren
t A
vera
ge
Gro
wth
Rat
e (C
AG
R)
World Crude Steel Capacity CAGR
90*
*2008 Additions to Capacity
15
NAFTA Steel: Positioned To Compete
• During the crisis of 1998-2003, the NAFTA steel industry strengthened from within through extensive consolidation, restructuring and capital investment
• The new business model that emerged is one that enables us to compete effectively with fairly traded steel in the global marketplace
• When conditions do start to improve, and with pro-competitive policies (e.g., on climate change), the North American steel industry is positioned to participate in the recovery
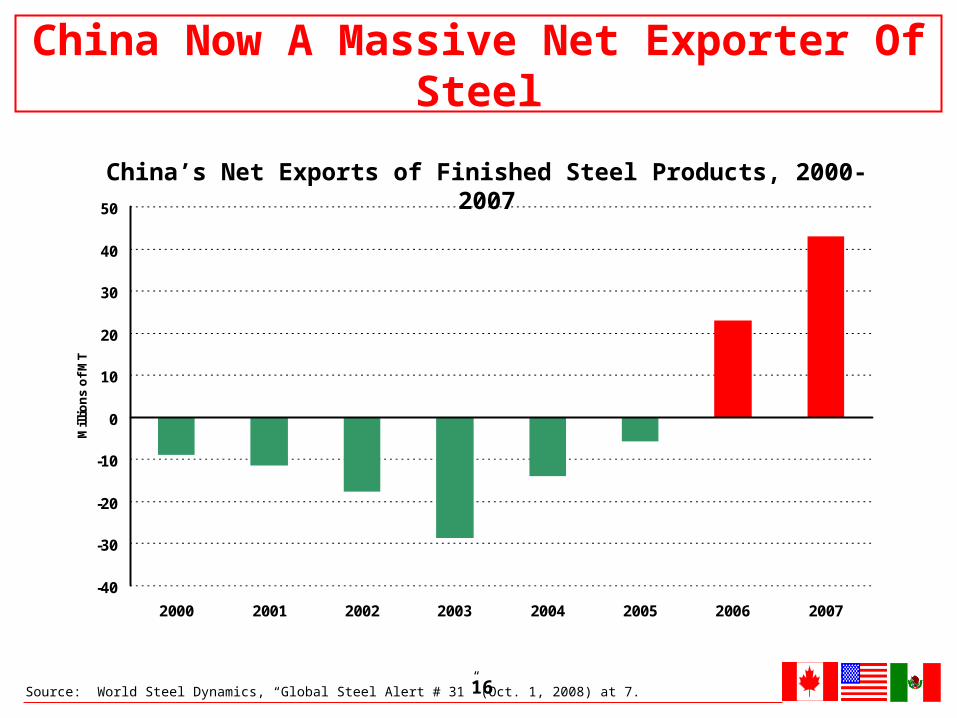
16Source: World Steel Dynamics, “Global Steel Alert # 31” (Oct. 1, 2008) at 7.
-40
-30
-20
-10
0
10
20
30
40
50
2000 2001 2002 2003 2004 2005 2006 2007
Mil
lio
ns
of
MT
China’s Net Exports of Finished Steel Products, 2000-2007
China Now A Massive Net Exporter Of Steel
17
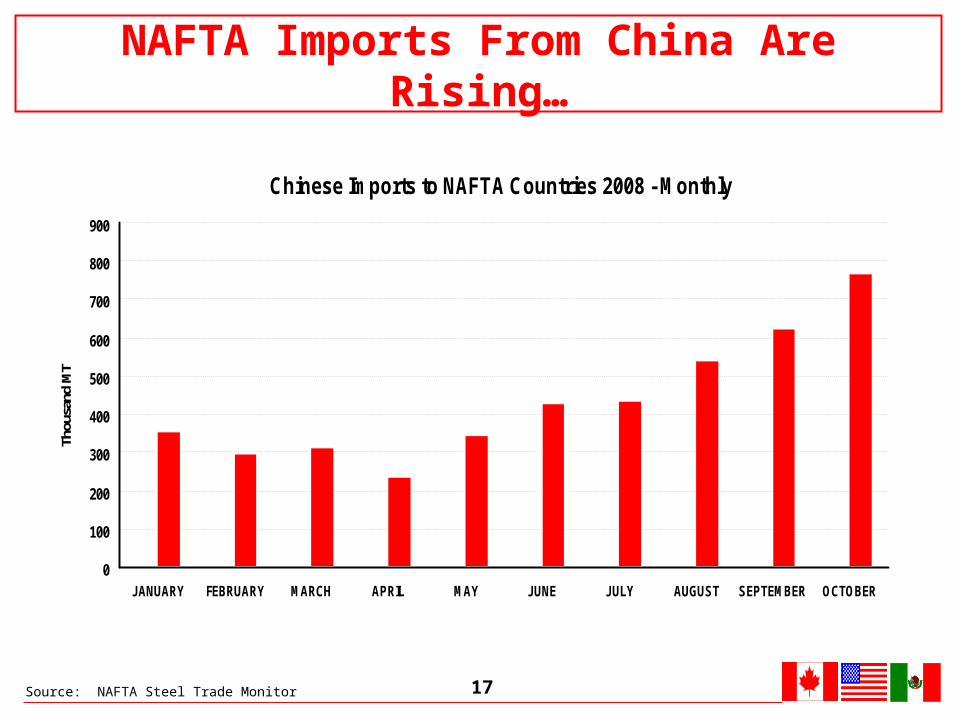
Chinese Imports to NAFTA Countries 2008 - Monthly
0
100
200
300
400
500
600
700
800
900
JANUARY FEBRUARY MARCH APRIL MAY JUNE JULY AUGUST SEPTEMBER OCTOBER
Thou
sand
MT
NAFTA Imports From China Are Rising…
Source: NAFTA Steel Trade Monitor
18
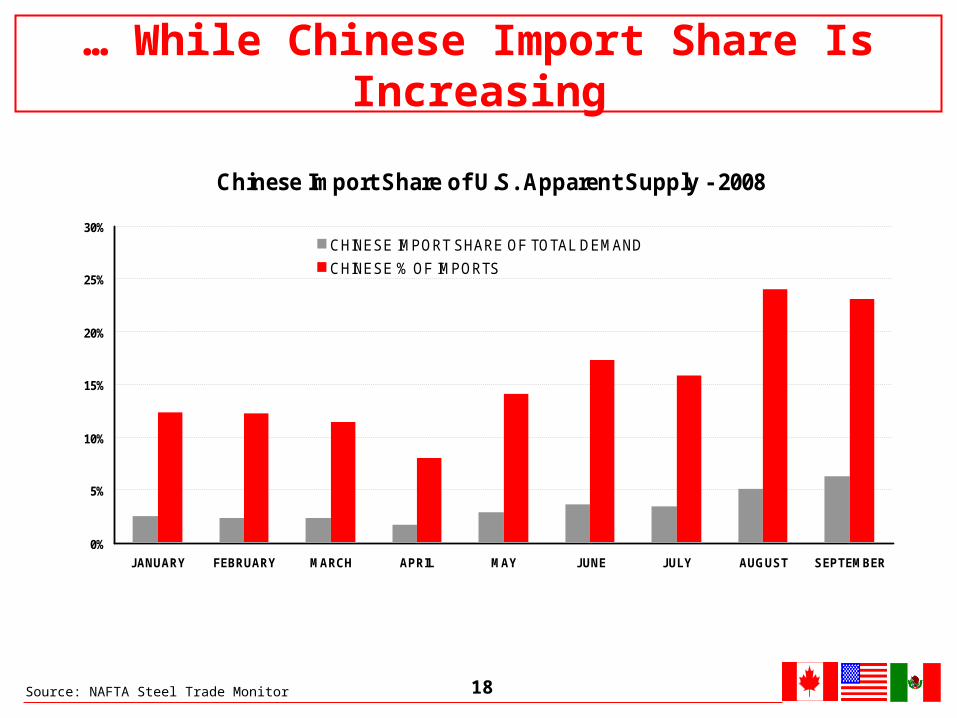
Chinese Import Share of U.S. Apparent Supply - 2008
0%
5%
10%
15%
20%
25%
30%
JANUARY FEBRUARY MARCH APRIL MAY JUNE JULY AUGUST SEPTEMBER
CHINESE IMPORT SHARE OF TOTAL DEMAND
CHINESE % OF IMPORTS
… While Chinese Import Share Is Increasing
Source: NAFTA Steel Trade Monitor
19
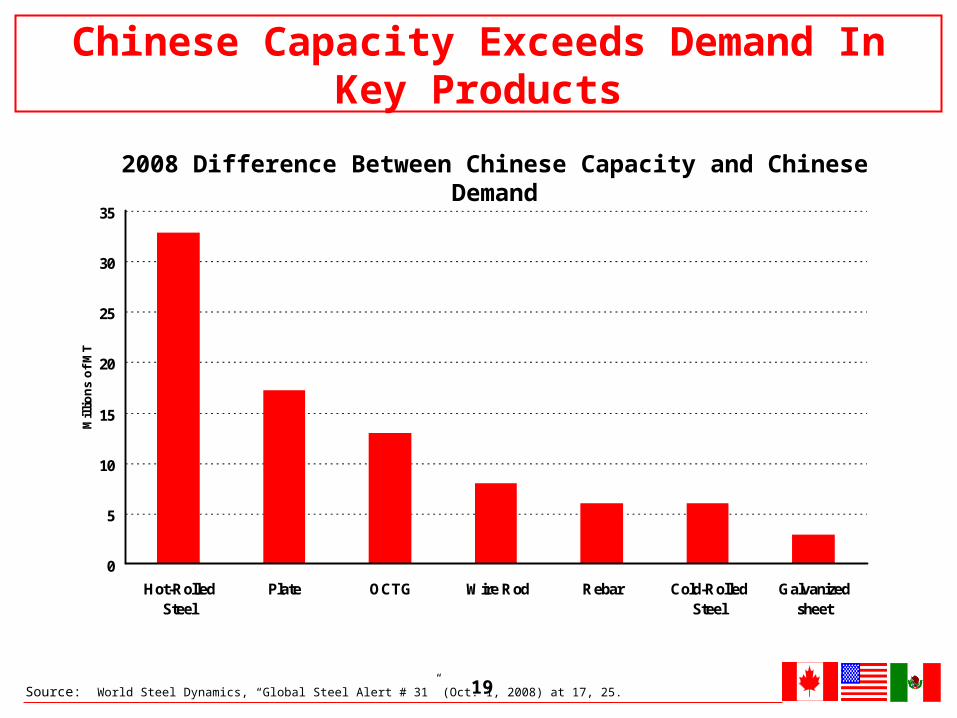
0
5
10
15
20
25
30
35
Hot-RolledSteel
Plate OCTG Wire Rod Rebar Cold-RolledSteel
Galvanizedsheet
Mil
lio
ns
of
MT
2008 Difference Between Chinese Capacity and Chinese Demand
Source: World Steel Dynamics, “Global Steel Alert # 31” (Oct. 1, 2008) at 17, 25.
Chinese Capacity Exceeds Demand In Key Products
20
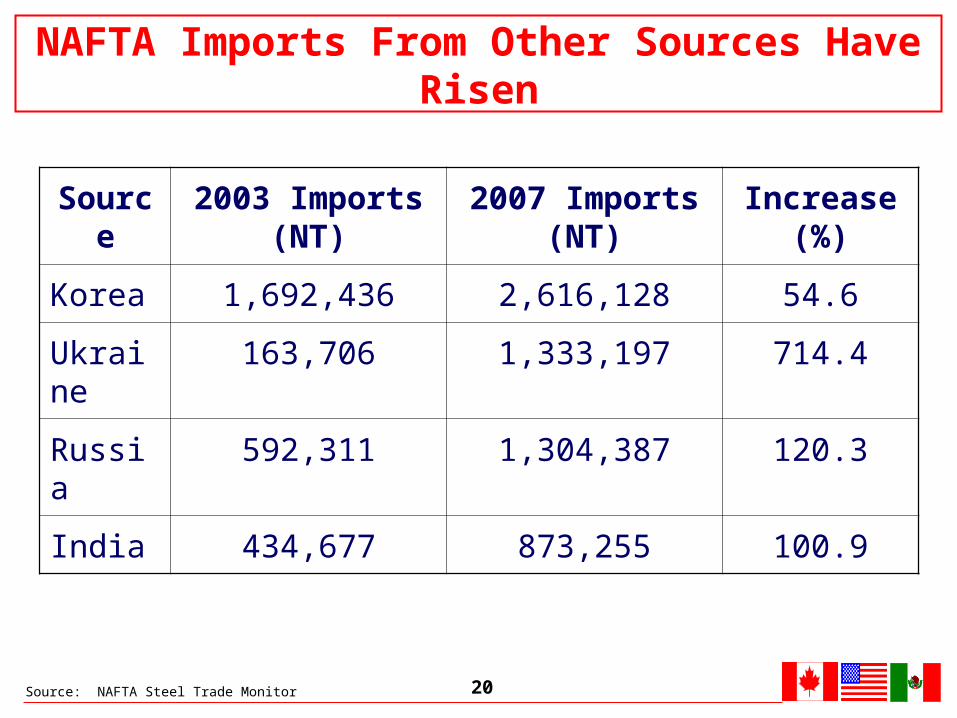
Source 2003 Imports (NT) 2007 Imports (NT) Increase (%)
Korea 1,692,436 2,616,128 54.6
Ukraine 163,706 1,333,197 714.4
Russia 592,311 1,304,387 120.3
India 434,677 873,255 100.9
Source: NAFTA Steel Trade Monitor
NAFTA Imports From Other Sources Have Risen
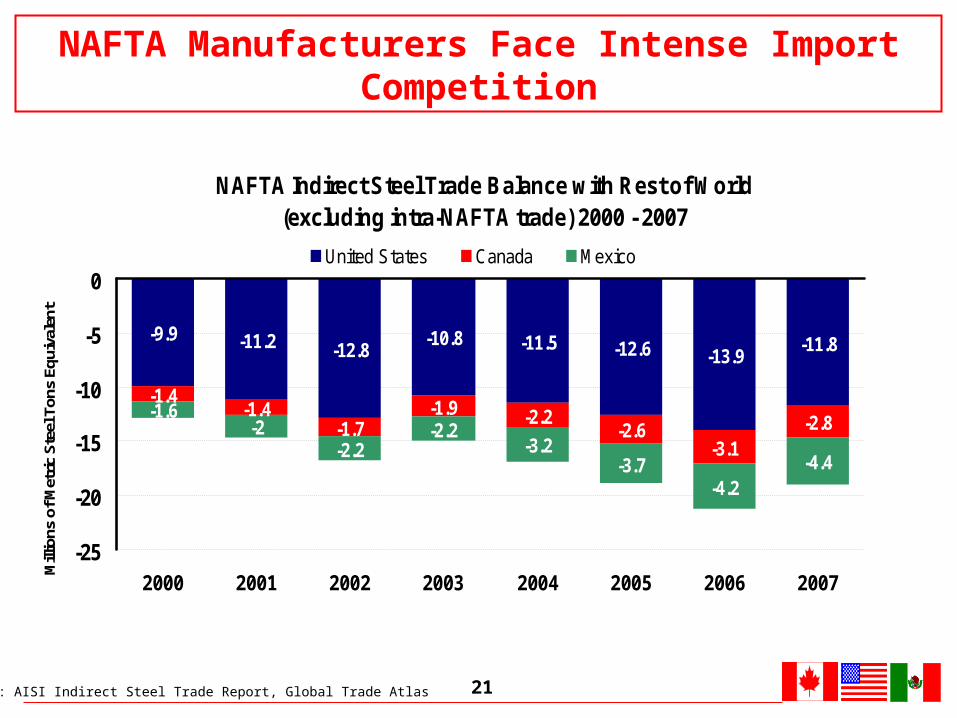
21Source: AISI Indirect Steel Trade Report, Global Trade Atlas
NAFTA Manufacturers Face Intense Import Competition
NAFTA Indirect Steel Trade Balance with Rest of World(excluding intra-NAFTA trade) 2000 - 2007
-9.9 -11.2 -12.8-10.8 -11.5 -12.6 -13.9
-11.8
-1.4-1.4
-1.7-1.9 -2.2
-2.6-3.1
-2.8-1.6
-2-2.2
-2.2-3.2
-3.7-4.2
-4.4
-25
-20
-15
-10
-5
0
2000 2001 2002 2003 2004 2005 2006 2007Mill
ions
of M
etric
Ste
el T
ons
Equi
vale
nt
United States Canada Mexico
22
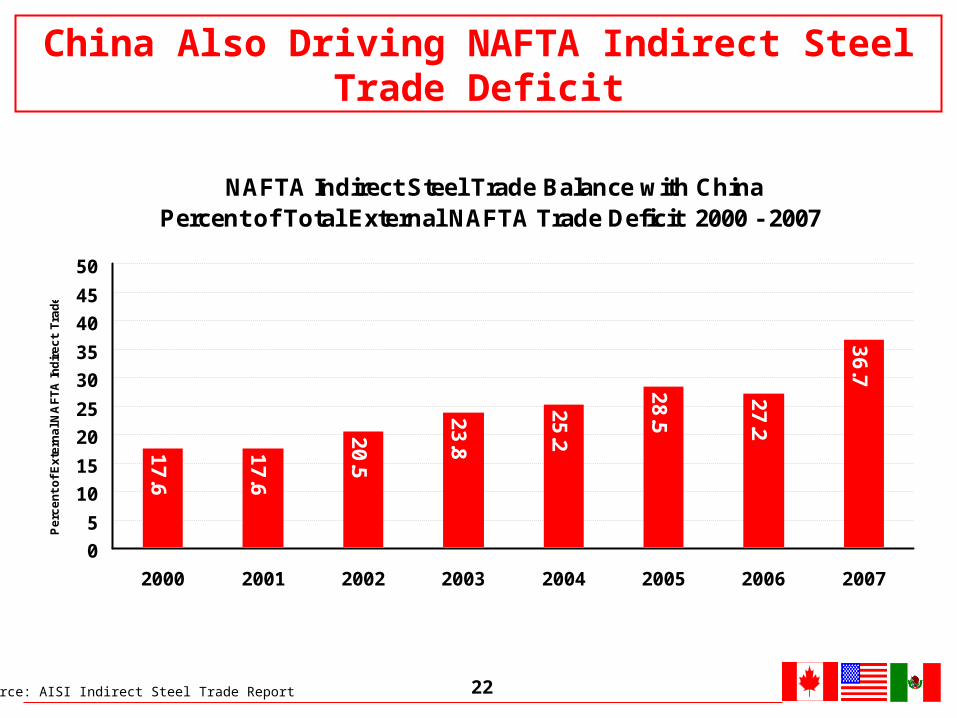
NAFTA Indirect Steel Trade Balance with China Percent of Total External NAFTA Trade Deficit 2000 - 2007
17
.6
17
.6
20
.5
23
.8
25
.2
28
.5
27
.2
36
.7
0
5
10
15
20
25
30
35
40
45
50
2000 2001 2002 2003 2004 2005 2006 2007
Pe
rce
nt
of
Ex
tern
al N
AF
TA
Ind
ire
ct
Tra
de
Source: AISI Indirect Steel Trade Report
China Also Driving NAFTA Indirect Steel Trade Deficit
23
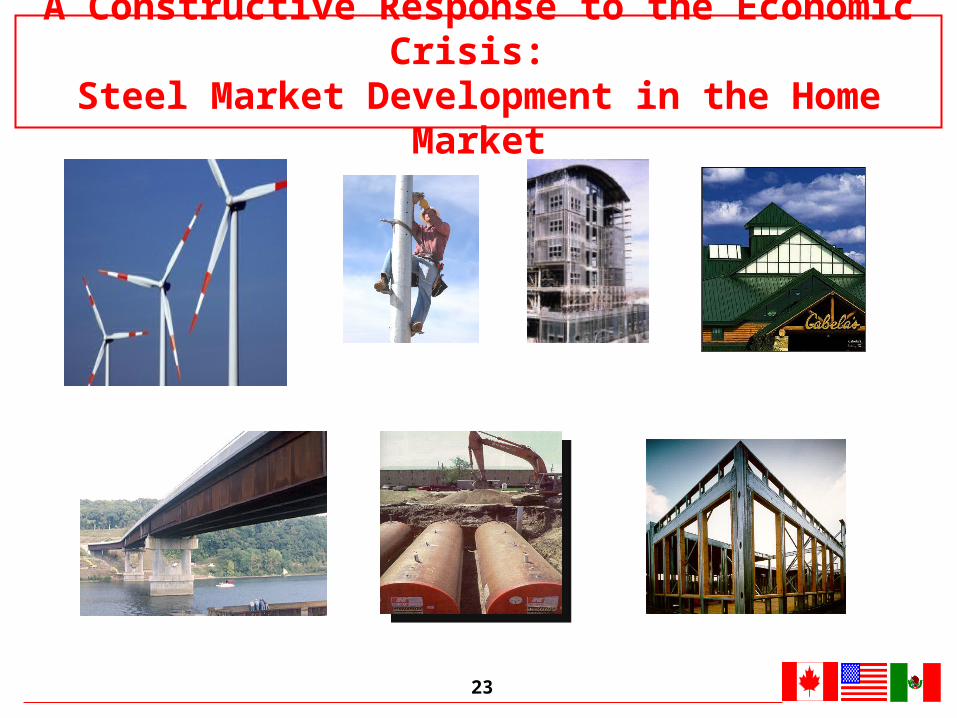
A Constructive Response to the Economic Crisis: Steel Market Development in the Home Market
24
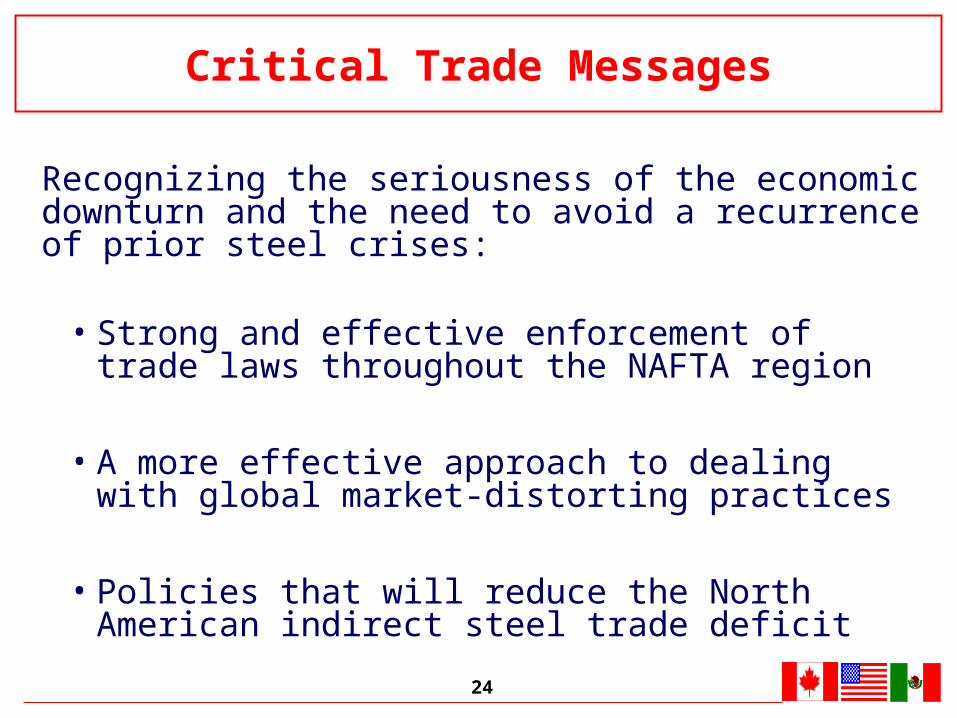
Critical Trade Messages
Recognizing the seriousness of the economic downturn and the need to avoid a recurrence of prior steel crises:
• Strong and effective enforcement of trade laws throughout the NAFTA region
• A more effective approach to dealing with global market-distorting practices
• Policies that will reduce the North American indirect steel trade deficit
25
2. North America Is A Major Producer, Consumer And Trader Of Raw Materials
26
Mil
lio
n M
etr
ic T
on
s
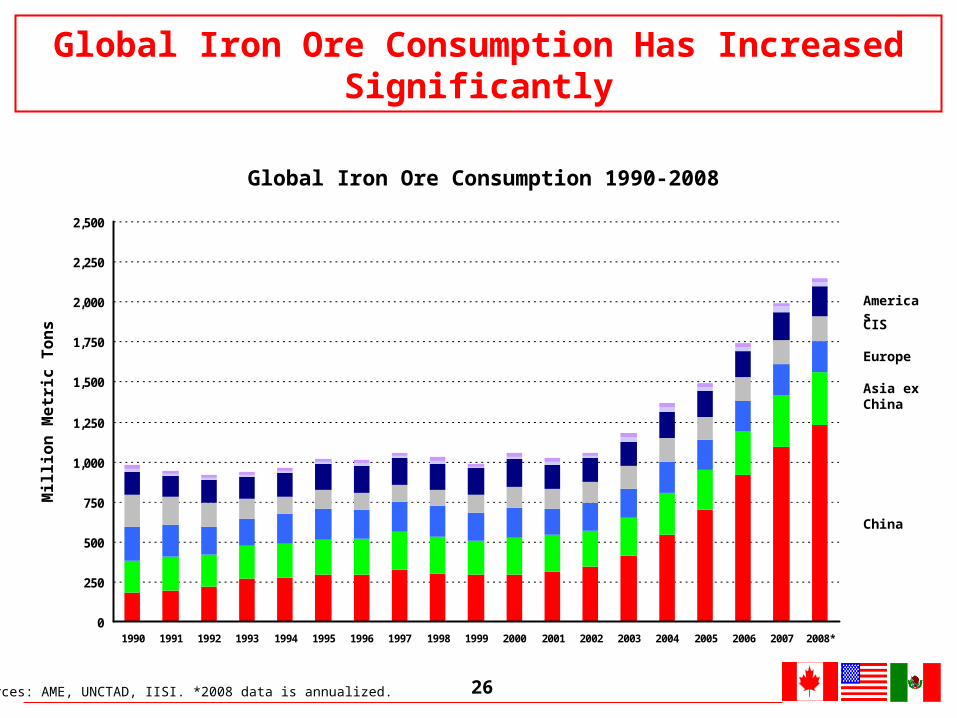
Global Iron Ore Consumption Has Increased Significantly
Sources: AME, UNCTAD, IISI. *2008 data is annualized.
Global Iron Ore Consumption 1990-2008
0
250
500
750
1,000
1,250
1,500
1,750
2,000
2,250
2,500
1990 1991 1992 1993 1994 1995 1996 1997 1998 1999 2000 2001 2002 2003 2004 2005 2006 2007 2008*
China
Asia ex China
Europe
CIS
Americas
27
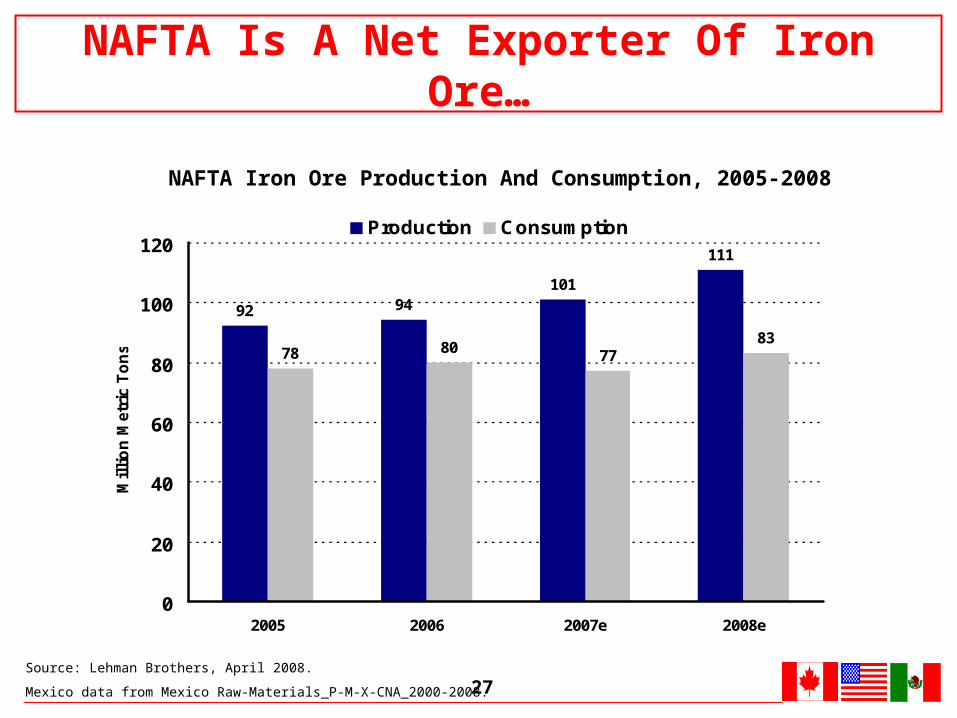
92 94101
111
78 80 7783
0
20
40
60
80
100
120
2005 2006 2007e 2008e
Mil
lio
n M
etr
ic T
on
s
Production Consumption
NAFTA Iron Ore Production And Consumption, 2005-2008
Source: Lehman Brothers, April 2008.
Mexico data from Mexico Raw-Materials_P-M-X-CNA_2000-2008.
NAFTA Is A Net Exporter Of Iron Ore…
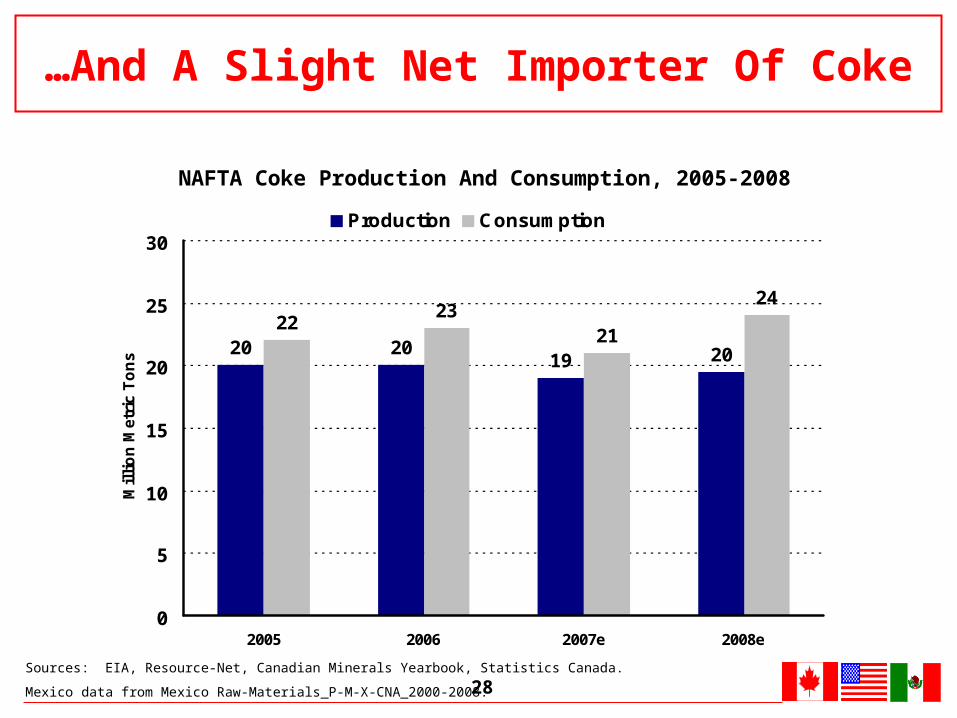
28Sources: EIA, Resource-Net, Canadian Minerals Yearbook, Statistics Canada.
Mexico data from Mexico Raw-Materials_P-M-X-CNA_2000-2008.
…And A Slight Net Importer Of Coke
NAFTA Coke Production And Consumption, 2005-2008
20 2019
2223
21
24
20
0
5
10
15
20
25
30
2005 2006 2007e 2008e
Mil
lio
n M
etri
c T
on
s
Production Consumption
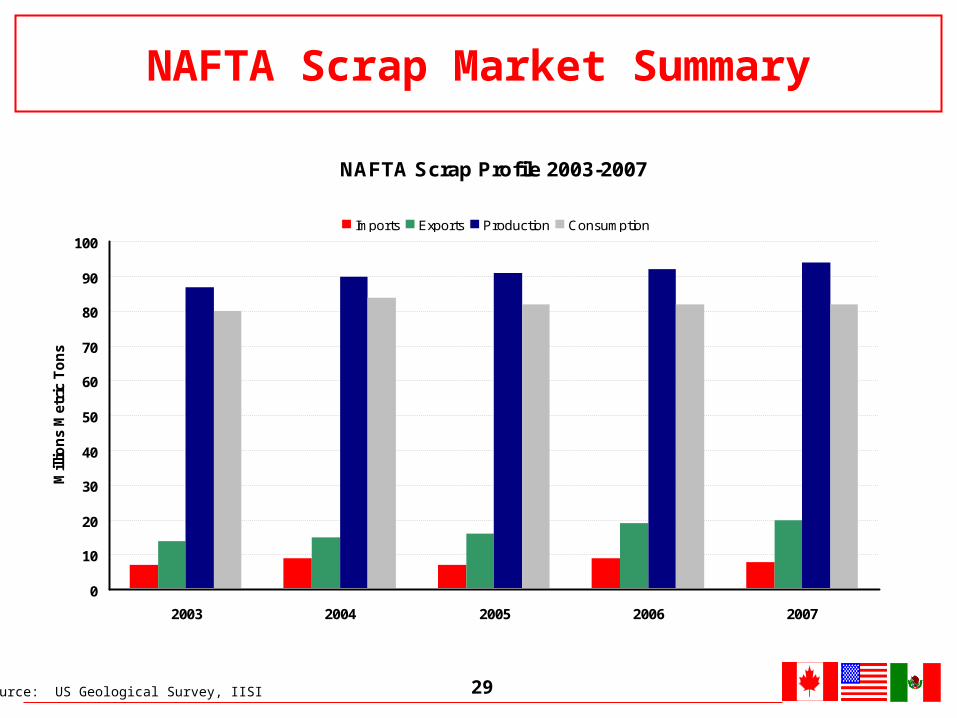
29Source: US Geological Survey, IISI
NAFTA Scrap Profile 2003-2007
0
10
20
30
40
50
60
70
80
90
100
2003 2004 2005 2006 2007
Mill
ion
s M
etri
c T
on
s
Imports Exports Production Consumption
NAFTA Scrap Market Summary
30
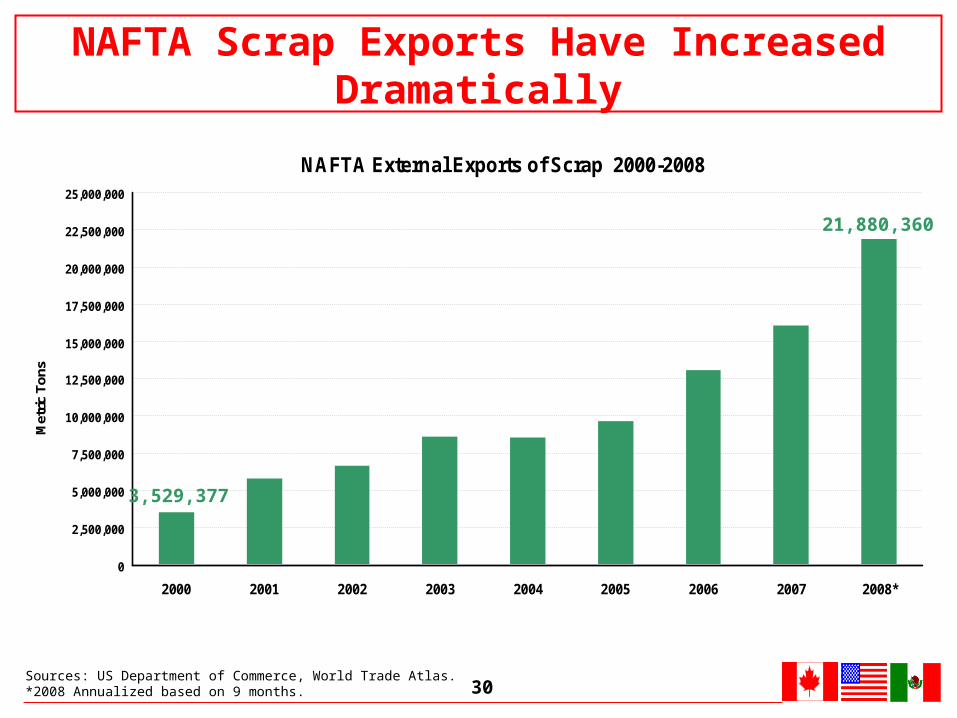
NAFTA External Exports of Scrap 2000-2008
0
2,500,000
5,000,000
7,500,000
10,000,000
12,500,000
15,000,000
17,500,000
20,000,000
22,500,000
25,000,000
2000 2001 2002 2003 2004 2005 2006 2007 2008*
Met
ric
To
ns
Sources: US Department of Commerce, World Trade Atlas. *2008 Annualized based on 9 months.
NAFTA Scrap Exports Have Increased Dramatically
21,880,360
3,529,377
31
3. Key Concerns About Raw Materials: Trade And Investment Barriers
32
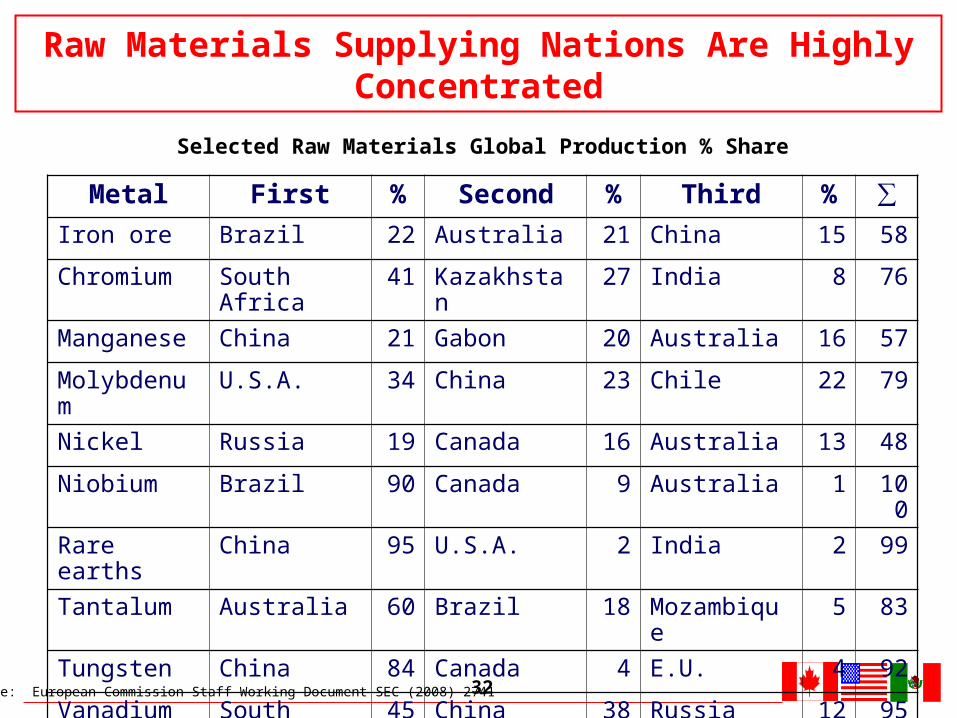
Metal First % Second % Third % ∑
Iron ore Brazil 22 Australia 21 China 15 58
Chromium South Africa 41 Kazakhstan 27 India 8 76
Manganese China 21 Gabon 20 Australia 16 57
Molybdenum U.S.A. 34 China 23 Chile 22 79
Nickel Russia 19 Canada 16 Australia 13 48
Niobium Brazil 90 Canada 9 Australia 1 100
Rare earths China 95 U.S.A. 2 India 2 99
Tantalum Australia 60 Brazil 18 Mozambique 5 83
Tungsten China 84 Canada 4 E.U. 4 92
Vanadium South Africa 45 China 38 Russia 12 95
Selected Raw Materials Global Production % Share
Raw Materials Supplying Nations Are Highly Concentrated
Source: European Commission Staff Working Document SEC (2008) 2741
33
• Countries worldwide have enacted substantial export barriers:• Export taxes of 25-50%, duties ranging from 5-15%
• At least six countries have temporarily or permanently banned the export of steel scrap
• Use of export quotas expanding and growing more restrictive
• Licenses – costly, facilitate government control
• Harmful impacts of export barriers:• Shield domestic industries from global competition
• Act as subsidies for domestic producers
• Contribute to “hoarding” raw materials for domestic use, while distorting global markets for producers everywhere
Export Barriers Of Concern
Source: American Scrap Coalition, “Raw Deal: How Governmental Trade Barriers and Subsidies are Distorting Global Trade in Raw Materials”
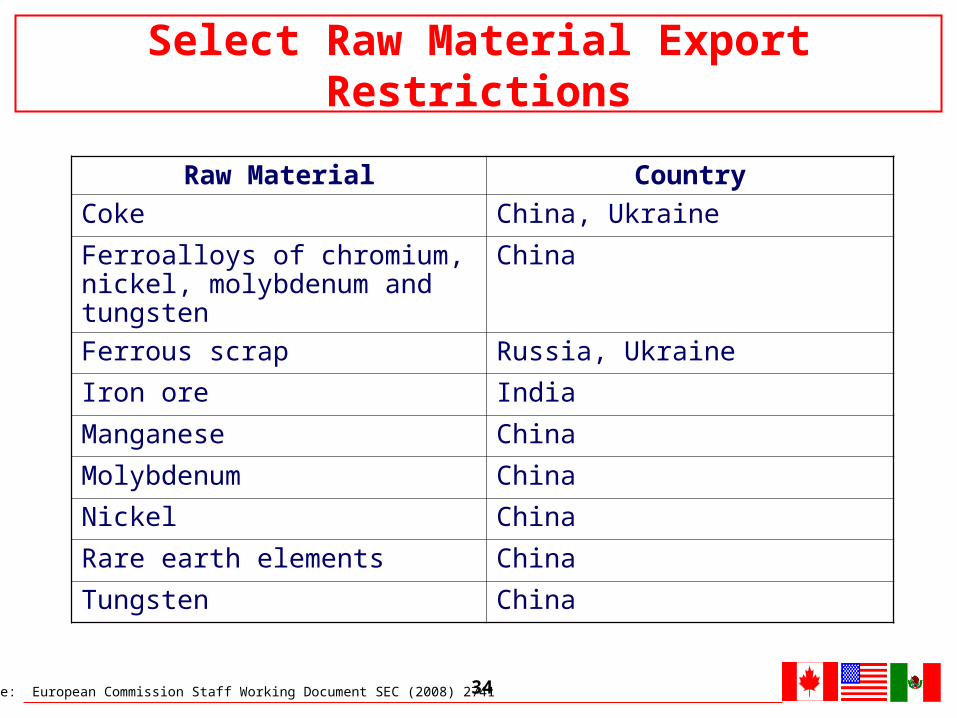
34
Raw Material Country
Coke China, Ukraine
Ferroalloys of chromium, nickel, molybdenum and tungsten
China
Ferrous scrap Russia, Ukraine
Iron ore India
Manganese China
Molybdenum China
Nickel China
Rare earth elements China
Tungsten China
Select Raw Material Export Restrictions
Source: European Commission Staff Working Document SEC (2008) 2741
35
• Several countries have erected barriers to foreign investment in raw materials:• Outright bans of foreign entities from mining
• Preventing certain companies from having an ownership interest in mining entities
• Harmful impact of investment barriers:• May benefit domestic industries / “national champions” only
• May prevent foreign companies from further developing raw materials in these countries
Raw Materials Investment Barriers
Source: American Scrap Coalition, “Raw Deal: How Governmental Trade Barriers and Subsidies are Distorting Global Trade in Raw Materials”
36
• While restricting foreign investment, some governments are using public resources to target overseas markets • State-owned enterprises, state-owned banks
• Sovereign wealth funds
• Potential harmful effects of subsidies:• May benefit domestic industries / “national champions” only
• May distort global raw materials trade in favor of subsidizing countries
Subsidized Raw Materials Acquisitions
Source: American Scrap Coalition, “Raw Deal: How Governmental Trade Barriers and Subsidies are Distorting Global Trade in Raw Materials”
37
• Distort trade and market outcomes
• Raise costs for material users
• Unfairly tilt the playing field throughout the global manufacturing economy
• Arguably violate WTO agreements, free trade agreements, or bilateral investment treaties
Summary: Raw Materials Trade Barriers Impact
38
4. Key Policy Conclusions
39
• Market forces must apply for steel, raw materials and steel-containing goods• Dumped /subsidized imports and export/investment restrictions
distort market forces
• NAFTA region at risk due to global steel market deterioration
• WTO-consistent trade law application not “protectionism” • Counters trade and market-distorting practices• Restores free market principles and ensures rules-based trade
• Lessons of 1998 steel crisis:• NAFTA will not be “dumping ground” for excess offshore steel • Urge NAFTA governments to remain vigilant and firmly committed
to strong trade laws, strictly enforced
Rules-Based Trade Is Fair Trade
40
• Government interference in raw materials trade and investment is a growing source of steel trade distortions
• Export taxes, minimum price programs, export bans and quotas are all restrictive• Manipulation of export restriction regimes causes significant market
uncertainty, distortions and disruptions
• Raw materials export restrictions create artificial advantages for exporting steel producers• Increasing domestic supply while lowering domestic prices• Simultaneously curbing supply and raising prices for foreign competitors
• Artificially low domestic prices for raw materials also create disadvantages for commodity producers• Reduces incentives for investment and modernization
Market Principles For Raw Materials
41
• WTO Doha “NAMA” negotiations should produce more effective rules on export manipulation• Address export taxes and quotas
• Import/Export licensing must be:• Transparent (e.g notice and public comment)• Non-discriminatory – use of objective criteria
• Metals/minerals investment policies should follow the Extractive Industries Transparency Initiative
• Malaysian government deserves praise for removing its steel scrap export ban • Malaysia and all governments should eliminate all restrictions (including duties) on
raw materials exports
• “Lack of availability” no longer relevant due to global economic crisis and reduced demand• Now is the time to remove market access barriers
Market Principles For Raw Materials