Embed Size (px)
Citation preview
NORTH AMERICAN INVESTOR SITE VISIT
3 DECEMBER 2012
FORT WORTH, TEXAS
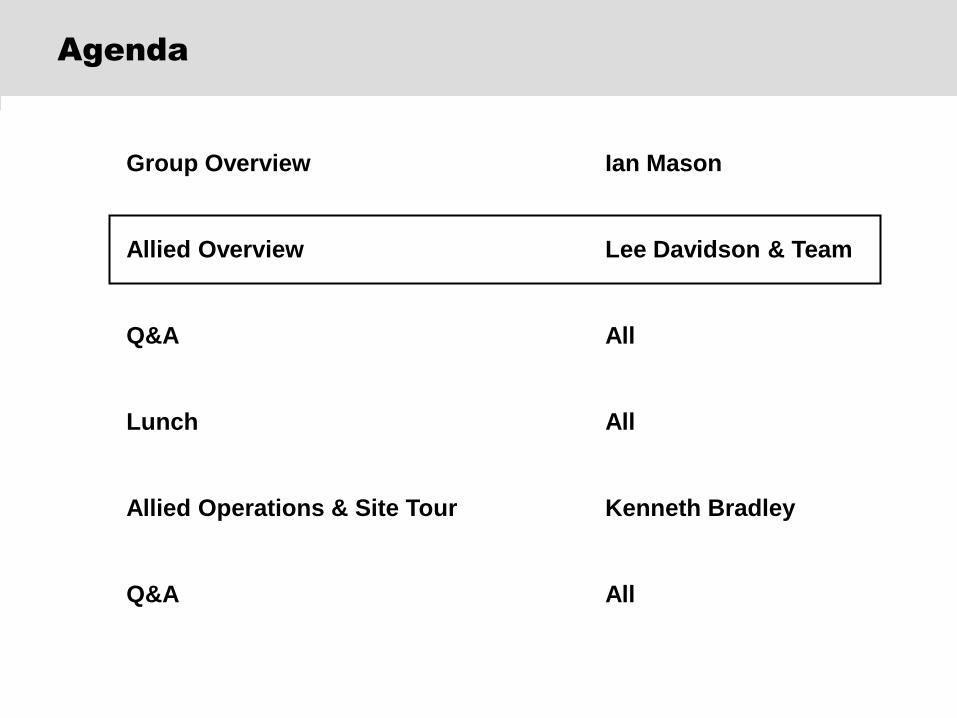
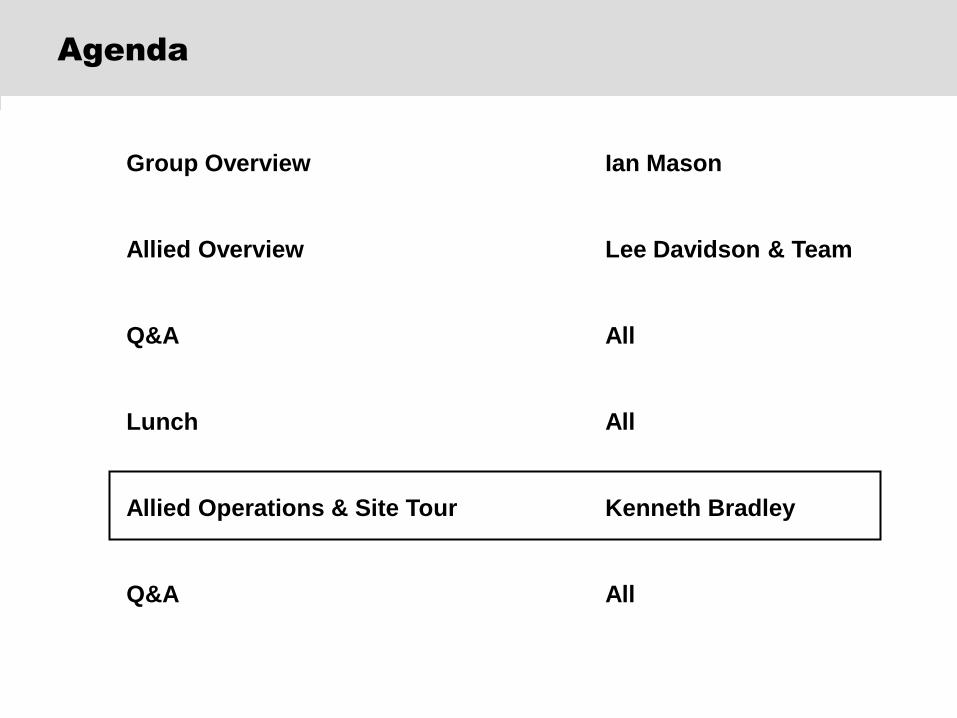
Agenda
Group Overview Ian Mason
Allied Overview Lee Davidson & Team
Q&A All
Lunch All
Allied Operations & Site Tour Kenneth Bradley
Q&A All
33
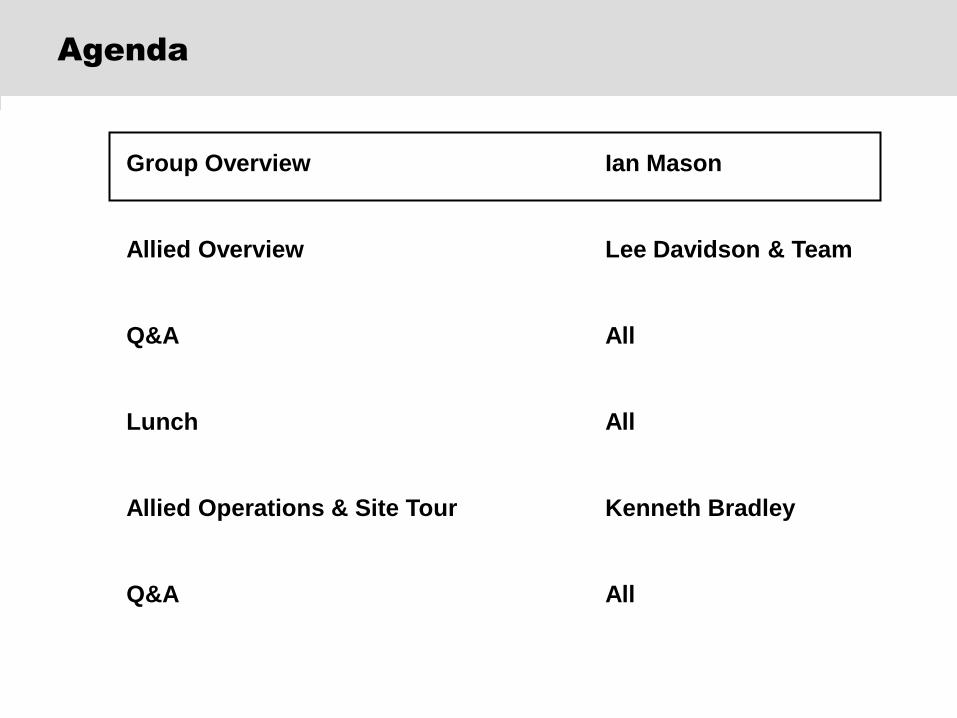
800K Catalogues 54% eCommerce
44,000 Parcels Daily
> 1m Customers
Strong Brands
2,500 Major Suppliers > 550,000 Products
17 Distribution Centres 90+% of World GDP
Electrocomponents: who we are
The World’s distributor of choice
3
44
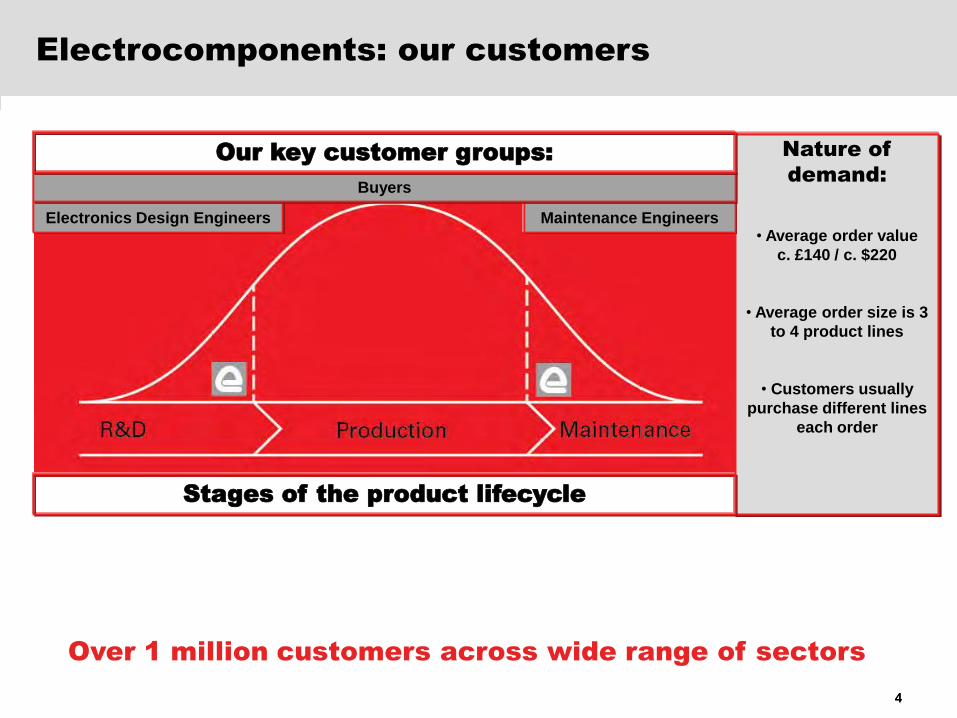
Electrocomponents: our customers
Over 1 million customers across wide range of sectors
Nature of
demand:
• Average order value
c. £140 / c. $220
• Average order size is 3
to 4 product lines
• Customers usually
purchase different lines
each order
Stages of the product lifecycle
Electronics Design Engineers Maintenance Engineers
Buyers
Our key customer groups:
4
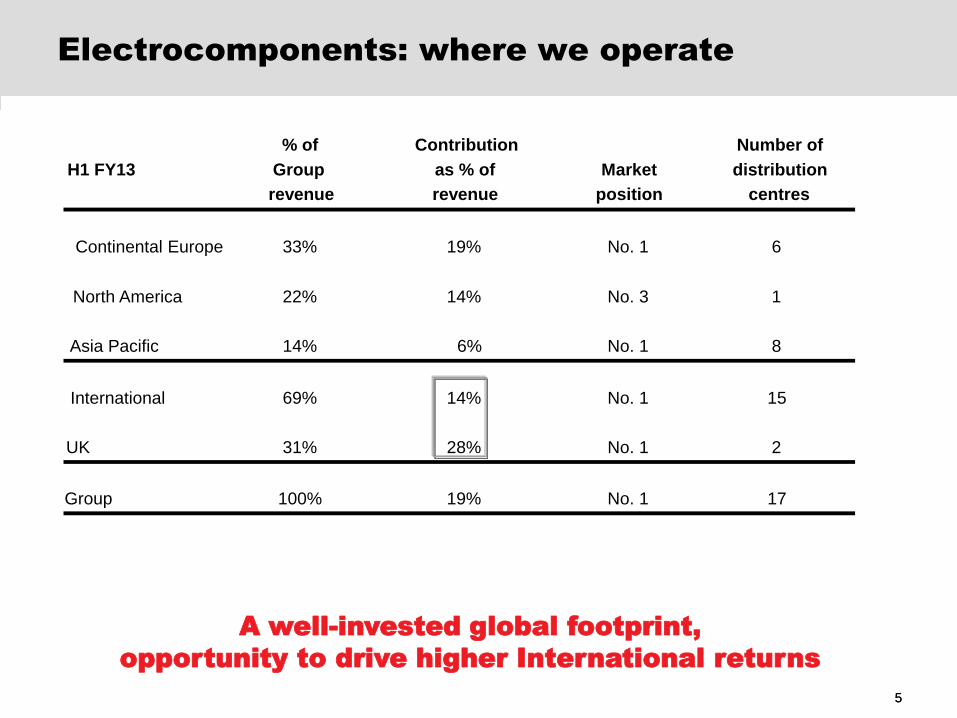
% of Contribution Number of
H1 FY13 Group as % of Market distribution
revenue revenue position centres
Continental Europe 33% 19% No. 1 6
North America 22% 14% No. 3 1
Asia Pacific 14% 6% No. 1 8
International 69% 14% No. 1 15
UK 31% 28% No. 1 2
Group 100% 19% No. 1 17
5
Electrocomponents: where we operate
A well-invested global footprint,
opportunity to drive higher International returns
5
A
B
C
D
E
F
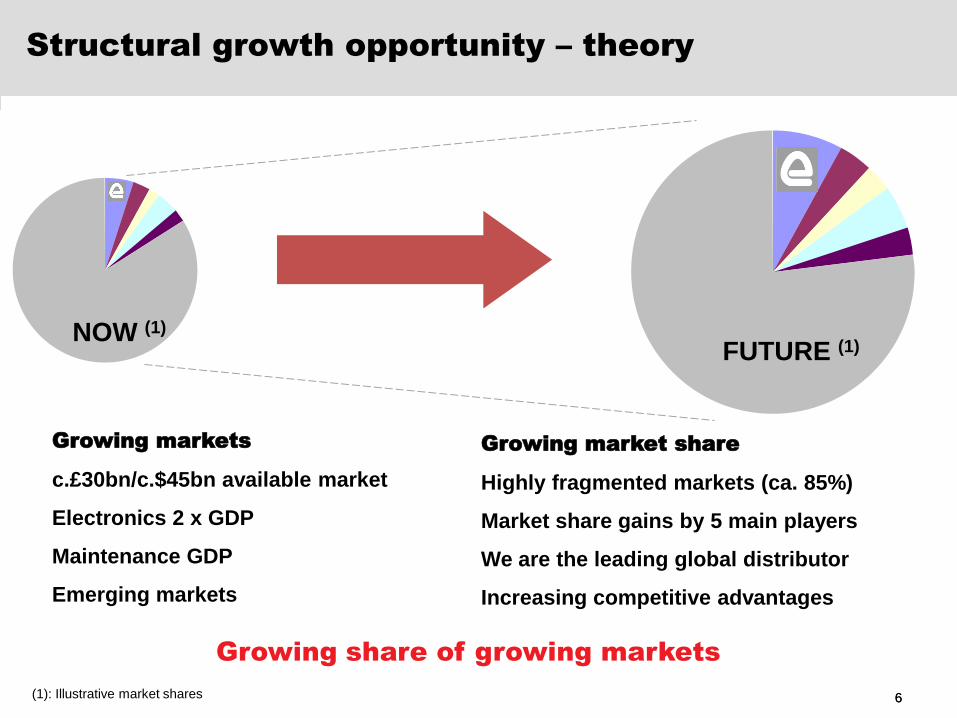
Structural growth opportunity – theory
Growing market share
Highly fragmented markets (ca. 85%)
Market share gains by 5 main players
We are the leading global distributor
Increasing competitive advantages
Growing markets
c.£30bn/c.$45bn available market
Electronics 2 x GDP
Maintenance GDP
Emerging markets
Growing share of growing markets
NOW (1)
FUTURE (1)
(1): Illustrative market shares 66
77
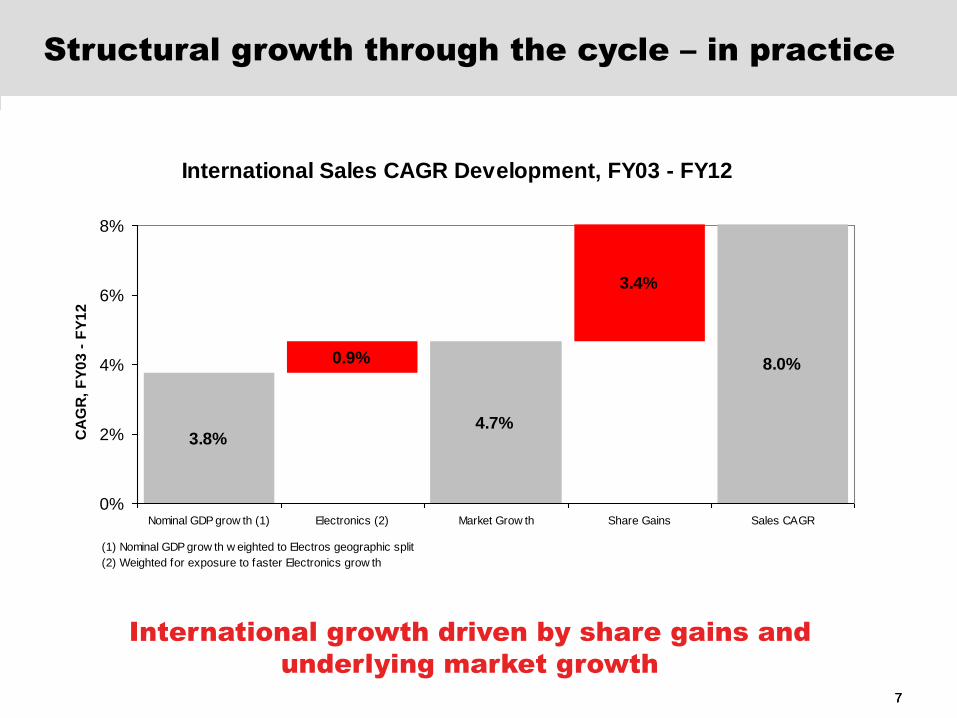
International growth driven by share gains and
underlying market growth
Structural growth through the cycle – in practice
International Sales CAGR Development, FY03 - FY12
0.9%
3.4%
3.8%4.7%
8.0%
0%
2%
4%
6%
8%
Nominal GDP grow th (1) Electronics (2) Market Grow th Share Gains Sales CAGR
CA
GR
, F
Y0
3 -
FY
12
(1) Nominal GDP grow th w eighted to Electros geographic split
(2) Weighted for exposure to faster Electronics grow th
7
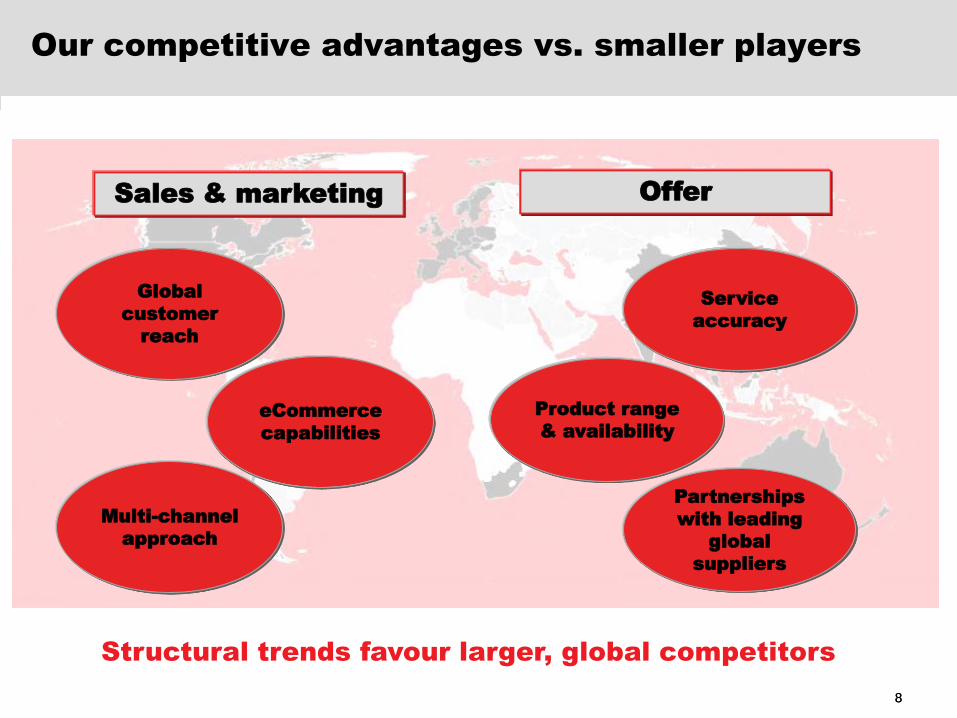
Our competitive advantages vs. smaller players
Structural trends favour larger, global competitors
8
Service
accuracy
Product range
& availability
Partnerships
with leading
global
suppliers
Offer
Multi-channel
approach
Global
customer
reach
Sales & marketing
eCommerce
capabilities
8
99
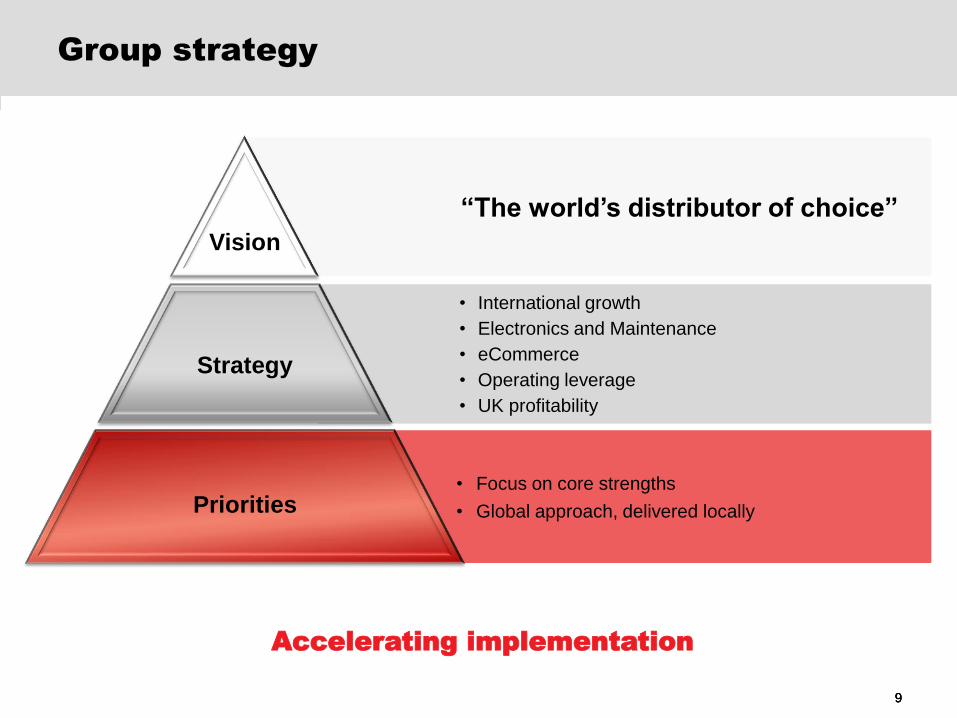
Group strategy
• Focus on core strengths
• Global approach, delivered locally
• International growth
• Electronics and Maintenance
• eCommerce
• Operating leverage
• UK profitability
“The world’s distributor of choice”
Vision
Strategy
Priorities
Accelerating implementation
9
IT FINANCE HR
SALESOFFER MARKETING
STRATEGY
1010
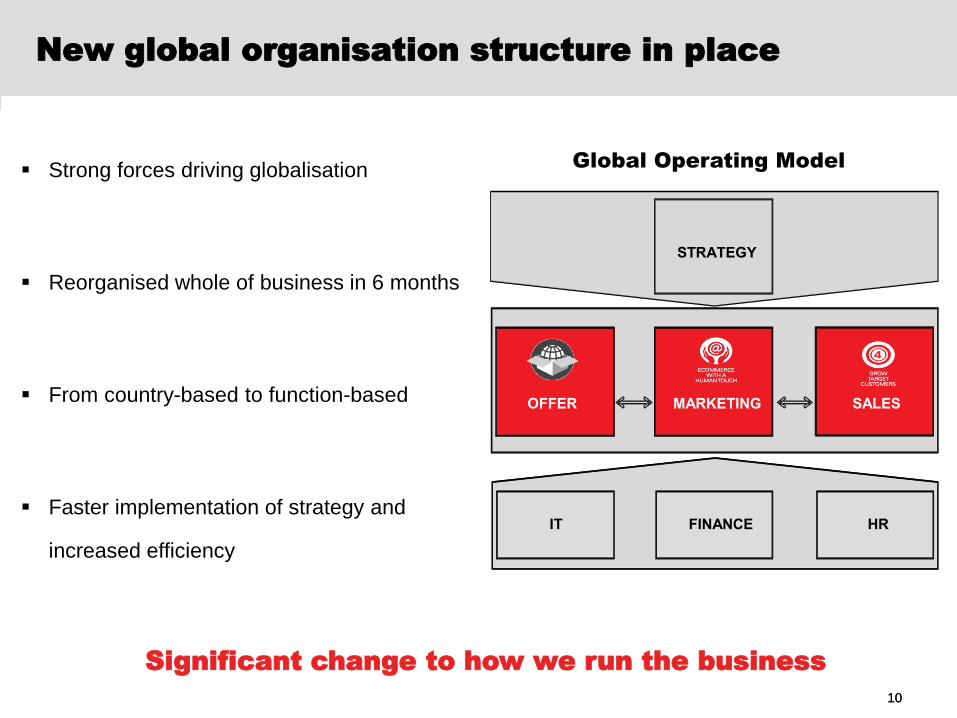
New global organisation structure in place
Significant change to how we run the business
Strong forces driving globalisation
Reorganised whole of business in 6 months
From country-based to function-based
Faster implementation of strategy and
increased efficiency
Global Operating Model
1111
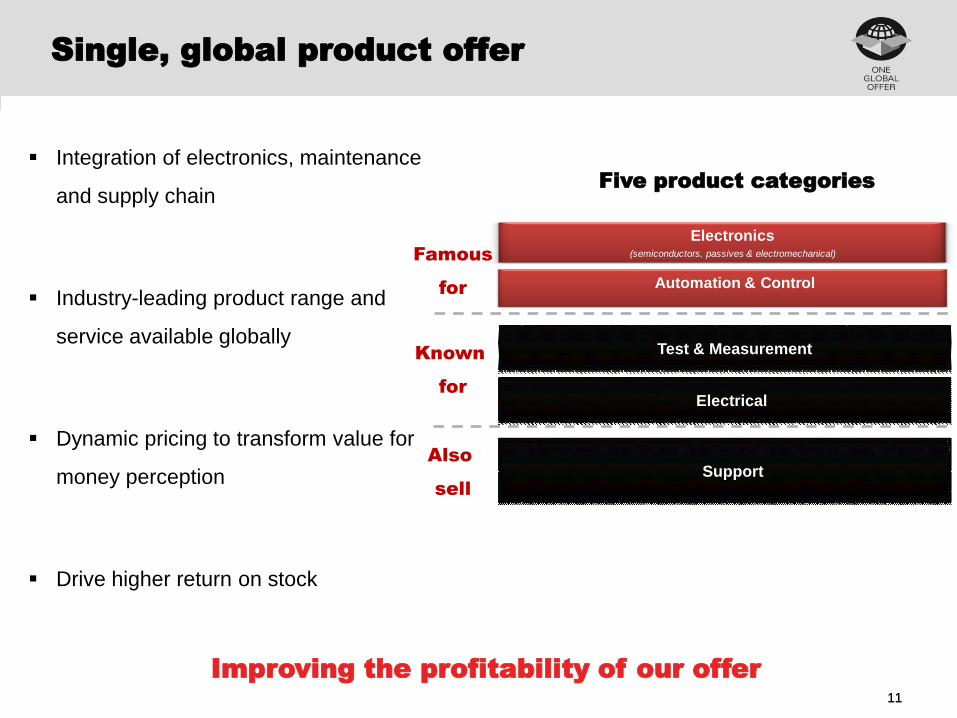
Single, global product offer
Improving the profitability of our offer
Integration of electronics, maintenance
and supply chain
Industry-leading product range and
service available globally
Dynamic pricing to transform value for
money perception
Drive higher return on stock
Five product categories
Famous
for
Known
for
Also
sell
Electronics (semiconductors,
passives &
electromechanical)
Automation & Control
Test & Measurement
Support
Electrical
Electronics(semiconductors, passives & electromechanical)
Automation & Control
1212
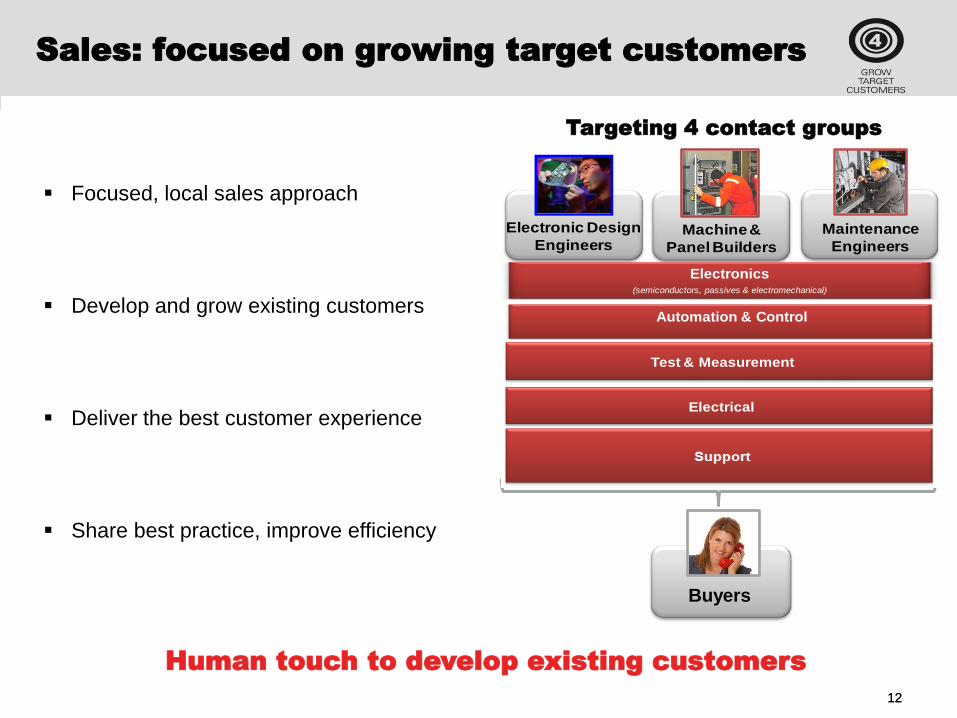
Sales: focused on growing target customers
Human touch to develop existing customers
Focused, local sales approach
Develop and grow existing customers
Deliver the best customer experience
Share best practice, improve efficiency
Targeting 4 contact groups
Electronic Design
EngineersMachine &
Panel Builders
Maintenance
Engineers
Buyers
Test & Measurement
Electrical
Electronics(semiconductors, passives & electromechanical)
Automation & Control
13
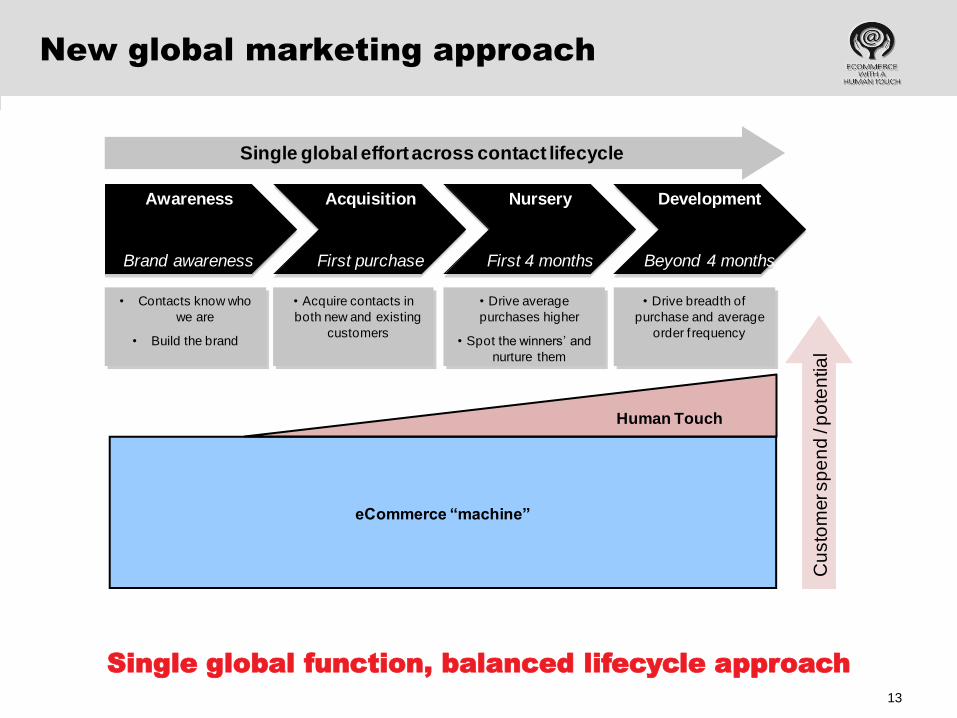
New global marketing approach
Single global function, balanced lifecycle approach
eCommerce “machine”
Human Touch
Cu
sto
mer sp
en
d / p
ote
ntia
l
Awareness
Brand awareness
Nursery
First 4 months
Development
Beyond 4 months
Acquisition
First purchase
• Contacts know who
we are
• Build the brand
• Acquire contacts in
both new and existing
customers
• Drive average
purchases higher
• Spot the winners’ and
nurture them
• Drive breadth of
purchase and average
order f requency
Single global effort across contact lifecycle

14
Highly attractive financial characteristics
A result of our business model and market position
EPS Growth
0.0
2.0
4.0
6.0
8.0
10.0
12.0
14.0
16.0
18.0
20.0
FY08 FY09 FY10 FY11 FY12
pen
ce
7% CAGR through the global
economic recession
Strong cash conversion
0%
20%
40%
60%
80%
100%
120%
140%
FY08 FY09 FY10 FY11 FY12
Co
nvers
ion
of
net
pro
fit
to f
ree c
ash
flo
w
5-yr average
101%
Strong balance sheet
0.0
0.5
1.0
1.5
2.0
FY08 FY09 FY10 FY11 FY12
Net
deb
t to
EB
ITD
A (
x)
5-yr average 1.3x
High return on capital employed
0%
10%
20%
30%
FY08 FY09 FY10 FY11 FY12
RO
CE
5-yr avge 21.6%
14
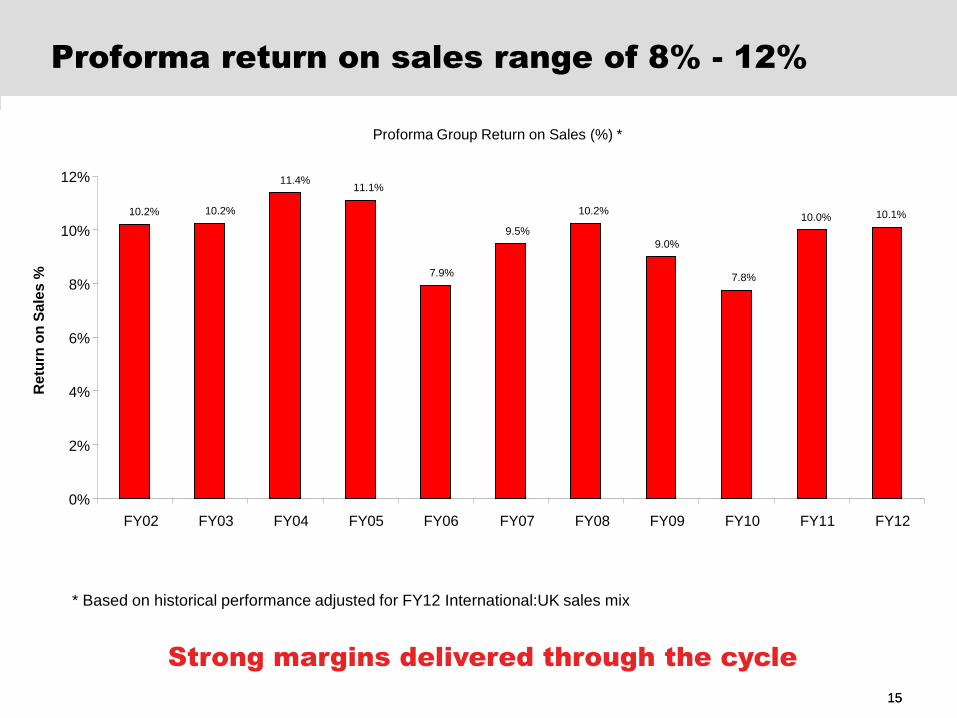
Proforma return on sales range of 8% - 12%
* Based on historical performance adjusted for FY12 International:UK sales mix
Strong margins delivered through the cycle
Proforma Group Return on Sales (%) *
10.0% 10.1%10.2% 10.2%
11.4%11.1%
10.2%
7.8%
9.5%
7.9%
9.0%
0%
2%
4%
6%
8%
10%
12%
FY02 FY03 FY04 FY05 FY06 FY07 FY08 FY09 FY10 FY11 FY12
Re
turn
on
Sa
les
%
1515
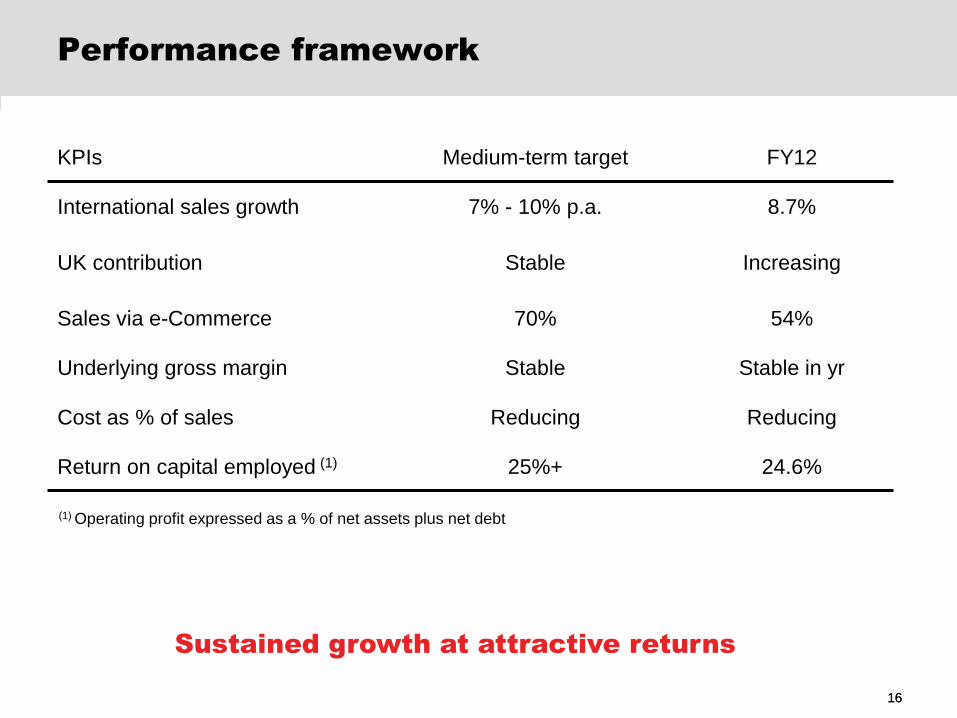
Performance framework
KPIs Medium-term target FY12
International sales growth 7% - 10% p.a. 8.7%
UK contribution Stable Increasing
Sales via e-Commerce 70% 54%
Underlying gross margin Stable Stable in yr
Cost as % of sales Reducing Reducing
Return on capital employed (1) 25%+ 24.6%
(1) Operating profit expressed as a % of net assets plus net debt
Sustained growth at attractive returns
1616
17
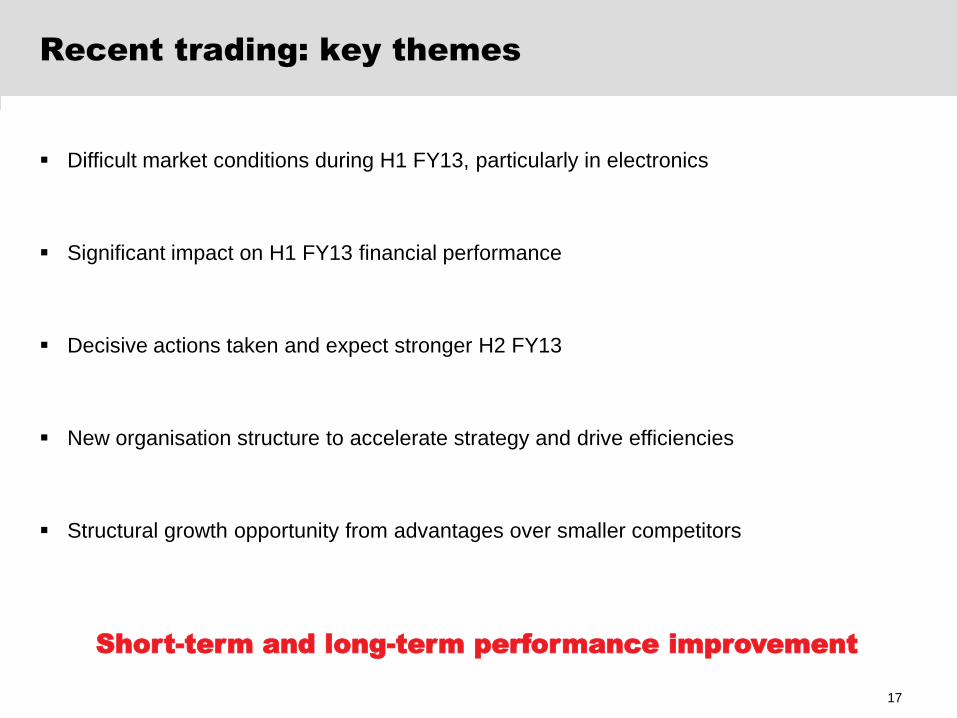
Recent trading: key themes
Short-term and long-term performance improvement
Difficult market conditions during H1 FY13, particularly in electronics
Significant impact on H1 FY13 financial performance
Decisive actions taken and expect stronger H2 FY13
New organisation structure to accelerate strategy and drive efficiencies
Structural growth opportunity from advantages over smaller competitors
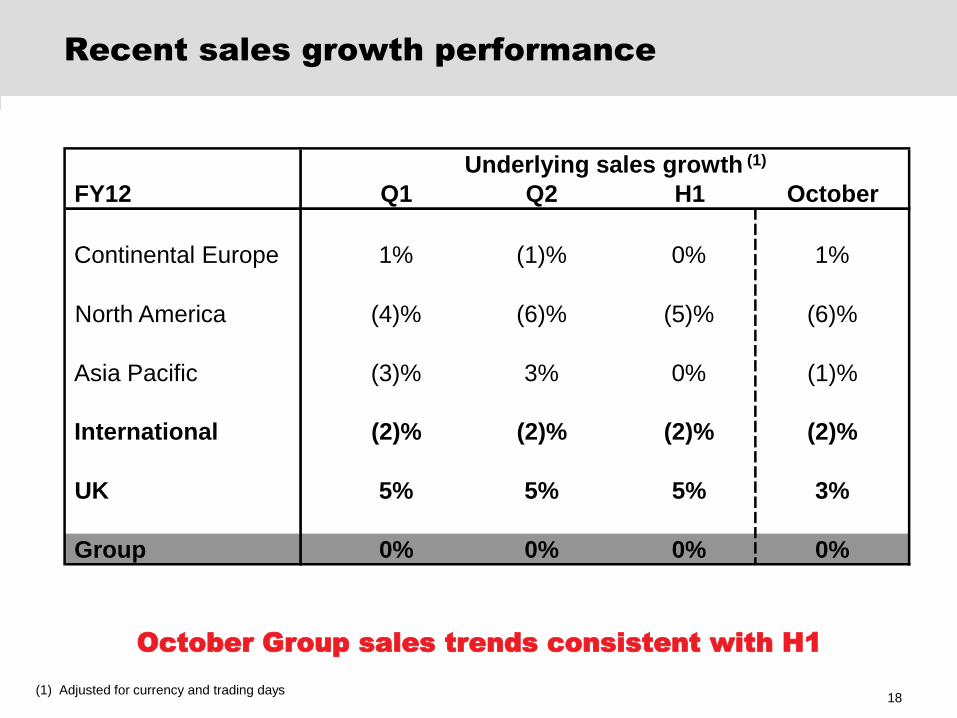
Recent sales growth performance
October Group sales trends consistent with H1
FY12 Q1 Q2 H1 October
Continental Europe 1% (1)% 0% 1%
North America (4)% (6)% (5)% (6)%
Asia Pacific (3)% 3% 0% (1)%
International (2)% (2)% (2)% (2)%
UK 5% 5% 5% 3%
Group 0% 0% 0% 0%
Underlying sales growth (1)
(1) Adjusted for currency and trading days18
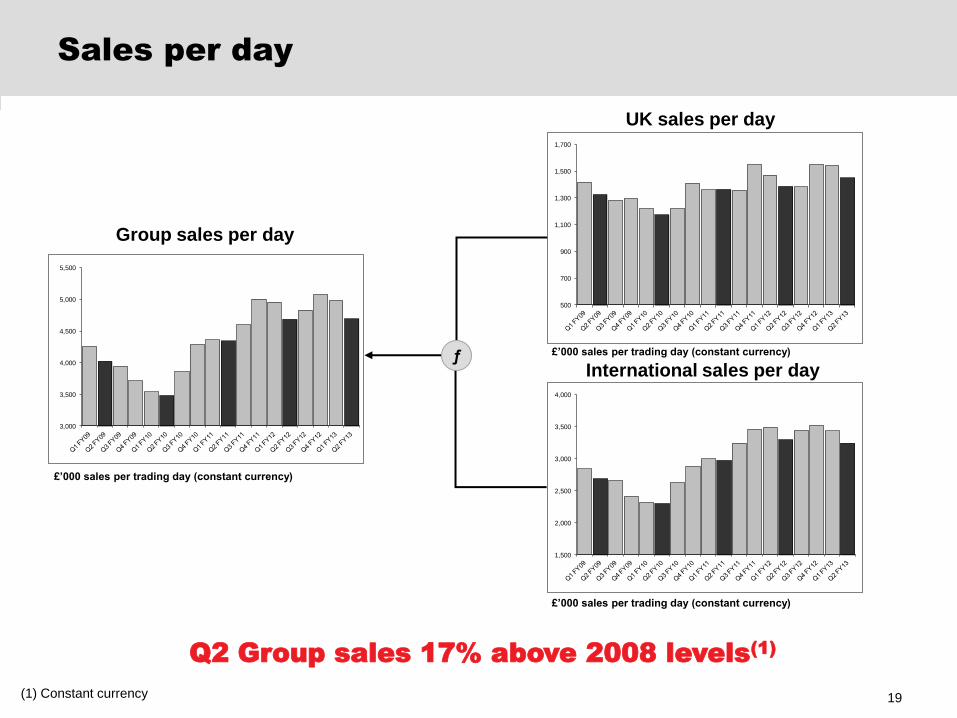
Sales per day
Q2 Group sales 17% above 2008 levels(1)
ƒ
£’000 sales per trading day (constant currency)
£’000 sales per trading day (constant currency)
£’000 sales per trading day (constant currency)
(1) Constant currency
3,000
3,500
4,000
4,500
5,000
5,500
500
700
900
1,100
1,300
1,500
1,700
1,500
2,000
2,500
3,000
3,500
4,000
Group sales per day
UK sales per day
International sales per day
19
2020
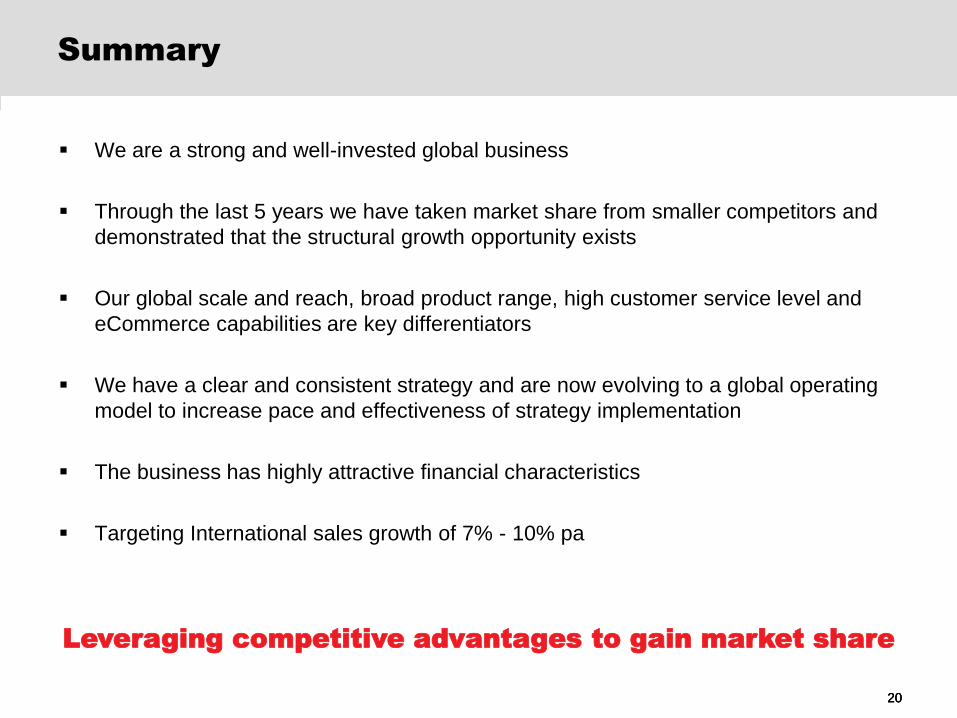
Summary
We are a strong and well-invested global business
Through the last 5 years we have taken market share from smaller competitors and
demonstrated that the structural growth opportunity exists
Our global scale and reach, broad product range, high customer service level and
eCommerce capabilities are key differentiators
We have a clear and consistent strategy and are now evolving to a global operating
model to increase pace and effectiveness of strategy implementation
The business has highly attractive financial characteristics
Targeting International sales growth of 7% - 10% pa
Leveraging competitive advantages to gain market share
20
Agenda
Group Overview Ian Mason
Allied Overview Lee Davidson & Team
Q&A All
Lunch All
Allied Operations & Site Tour Kenneth Bradley
Q&A All
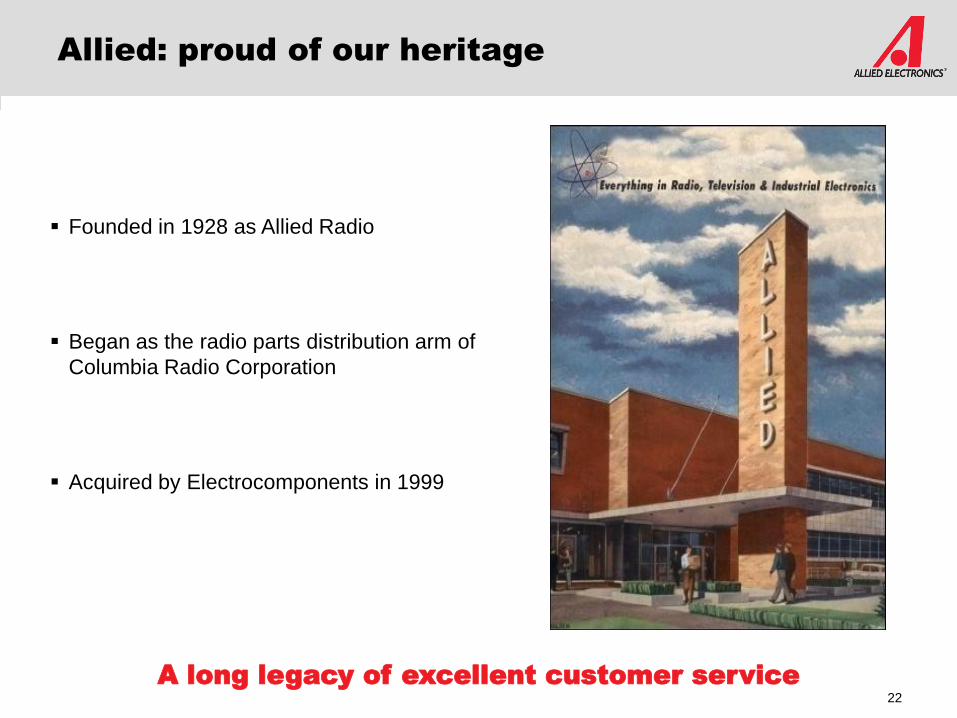
Allied: proud of our heritage
Founded in 1928 as Allied Radio
Began as the radio parts distribution arm of
Columbia Radio Corporation
Acquired by Electrocomponents in 1999
A long legacy of excellent customer service
22
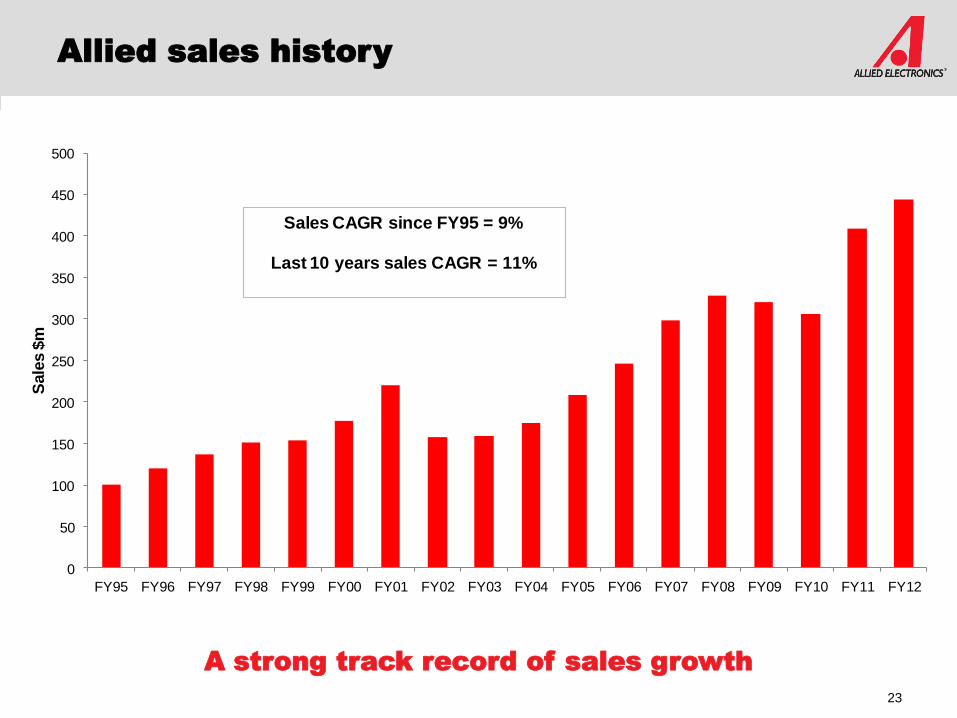
Allied sales history
23
A strong track record of sales growth
0
50
100
150
200
250
300
350
400
450
500
FY95 FY96 FY97 FY98 FY99 FY00 FY01 FY02 FY03 FY04 FY05 FY06 FY07 FY08 FY09 FY10 FY11 FY12
Sale
s $
m
Sales CAGR since FY95 = 9%
Last 10 years sales CAGR = 11%
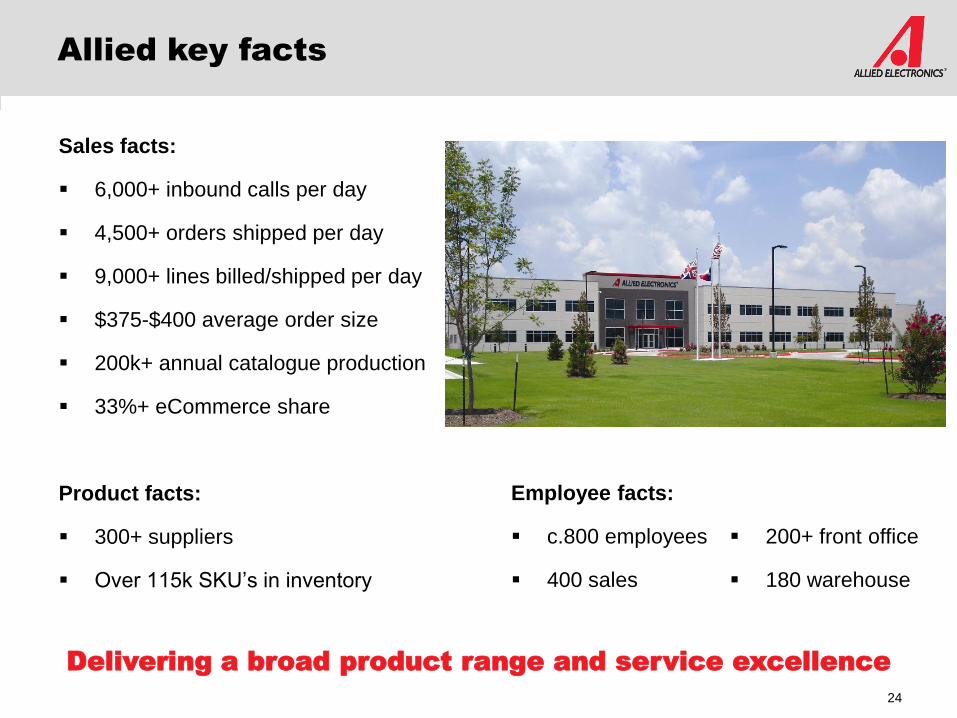
Sales facts:
6,000+ inbound calls per day
4,500+ orders shipped per day
9,000+ lines billed/shipped per day
$375-$400 average order size
200k+ annual catalogue production
33%+ eCommerce share
Product facts:
300+ suppliers
Over 115k SKU’s in inventory
Allied key facts
Employee facts:
c.800 employees
400 sales
200+ front office
180 warehouse
Delivering a broad product range and service excellence
24
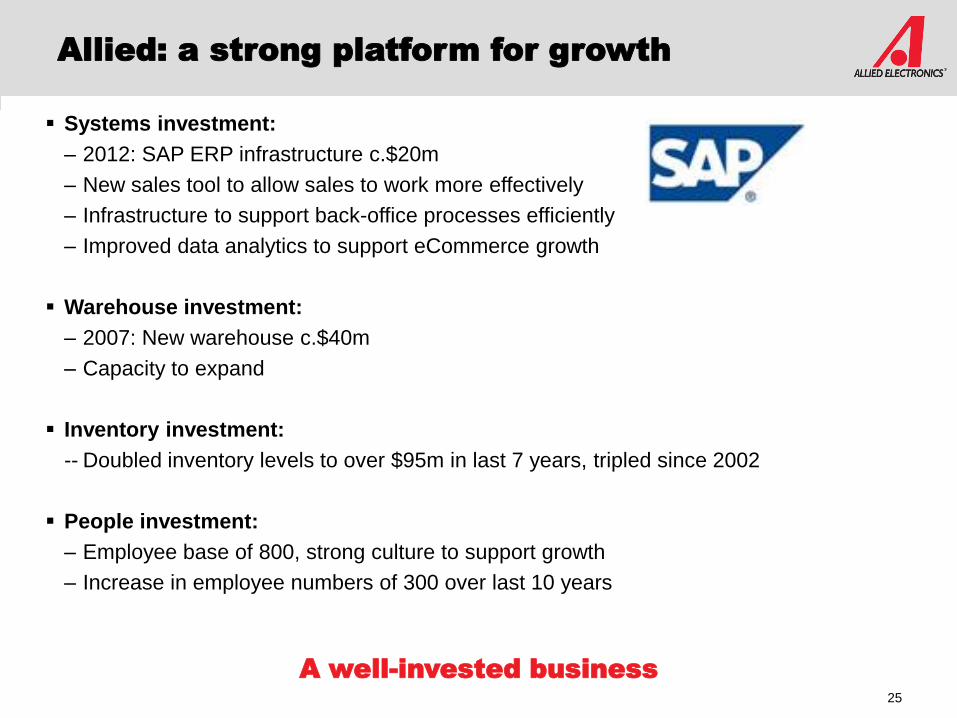
Systems investment:
– 2012: SAP ERP infrastructure c.$20m
– New sales tool to allow sales to work more effectively
– Infrastructure to support back-office processes efficiently
– Improved data analytics to support eCommerce growth
Warehouse investment:
– 2007: New warehouse c.$40m
– Capacity to expand
Inventory investment:
-- Doubled inventory levels to over $95m in last 7 years, tripled since 2002
People investment:
– Employee base of 800, strong culture to support growth
– Increase in employee numbers of 300 over last 10 years
Allied: a strong platform for growth
A well-invested business
25

Market environment:
Industrial Production key lead indicator
Correlation to the industrial business cycle
26
-70%
-60%
-50%
-40%
-30%
-20%
-10%
0%
10%
20%
30%
40%
50%
-20%
-18%
-16%
-14%
-12%
-10%
-8%
-6%
-4%
-2%
0%
2%
4%
6%
8%
10%
Growth in US Industrial Production compared to daily sales growth : from Jan 2007
US Industrial
Production Growth
Allied Sales
Growth
US
In
du
str
ial P
rodu
ction
Gro
wth
Alli
ed D
aily
Sa
les G
row
th
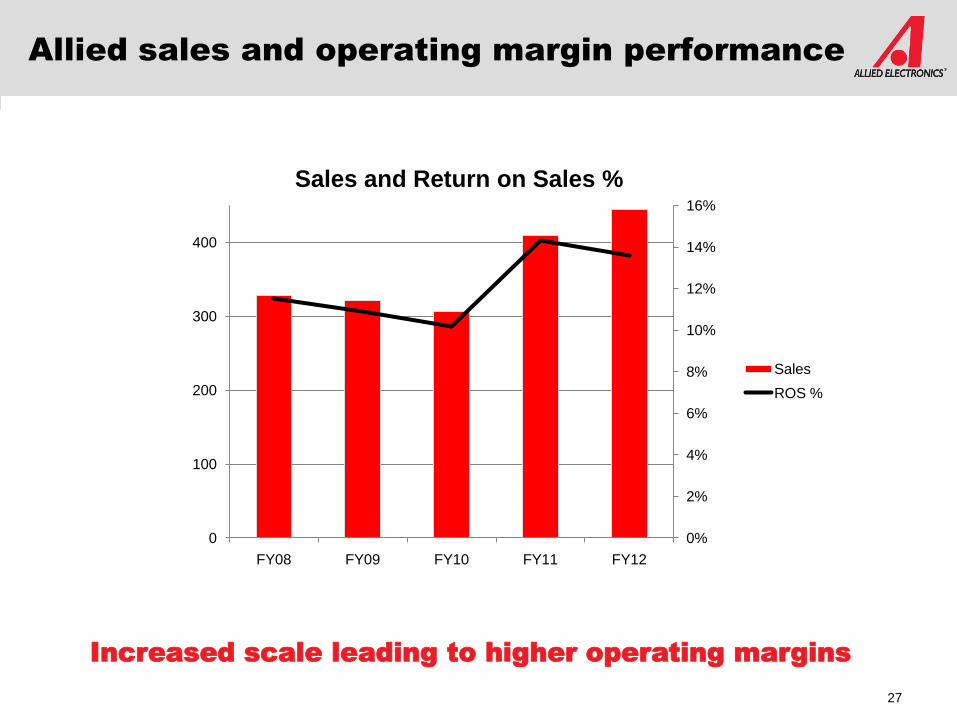
Allied sales and operating margin performance
Increased scale leading to higher operating margins
27
0%
2%
4%
6%
8%
10%
12%
14%
16%
0
100
200
300
400
FY08 FY09 FY10 FY11 FY12
Sales and Return on Sales %
Sales
ROS %
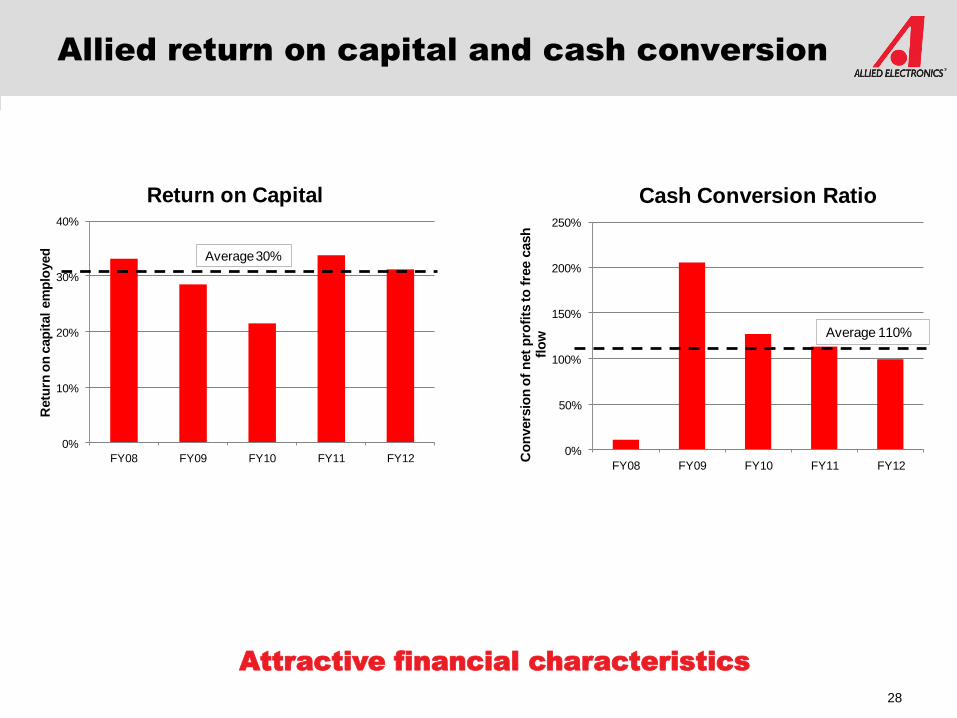
Allied return on capital and cash conversion
Attractive financial characteristics
28
0%
10%
20%
30%
40%
FY08 FY09 FY10 FY11 FY12
Retu
rn o
n c
ap
ital
em
plo
yed
Return on Capital
Average30%
0%
50%
100%
150%
200%
250%
FY08 FY09 FY10 FY11 FY12
Co
nvers
ion
of
net
pro
fits
to
fre
e c
ash
fl
ow
Cash Conversion Ratio
Average 110%
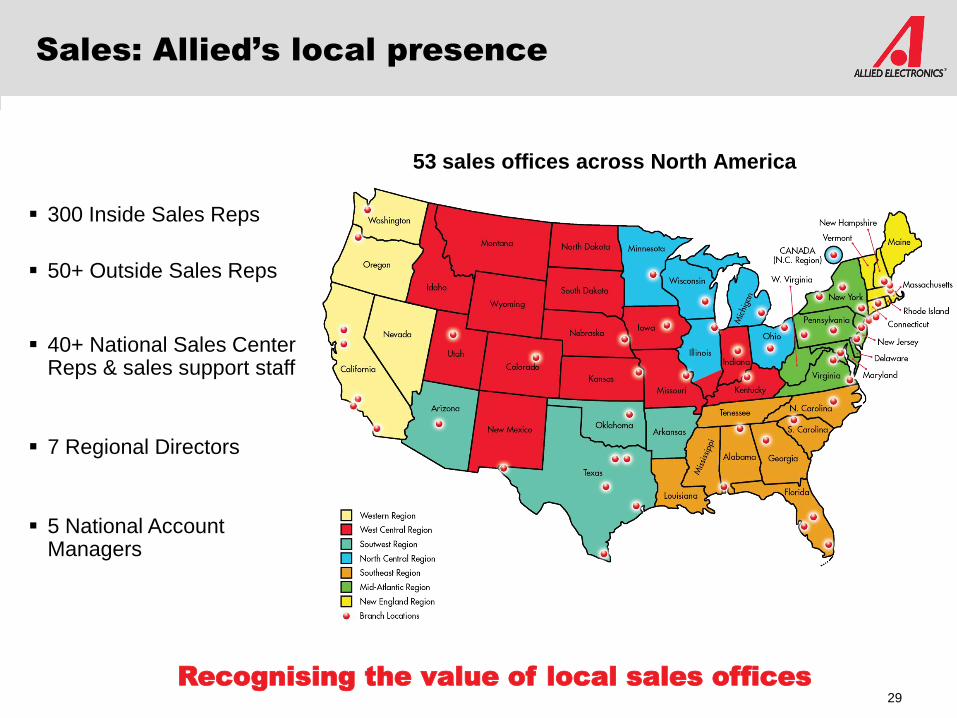
53 sales offices across North America
Sales: Allied’s local presence
300 Inside Sales Reps
50+ Outside Sales Reps
40+ National Sales Center Reps & sales support staff
7 Regional Directors
5 National Account Managers
Recognising the value of local sales offices
29
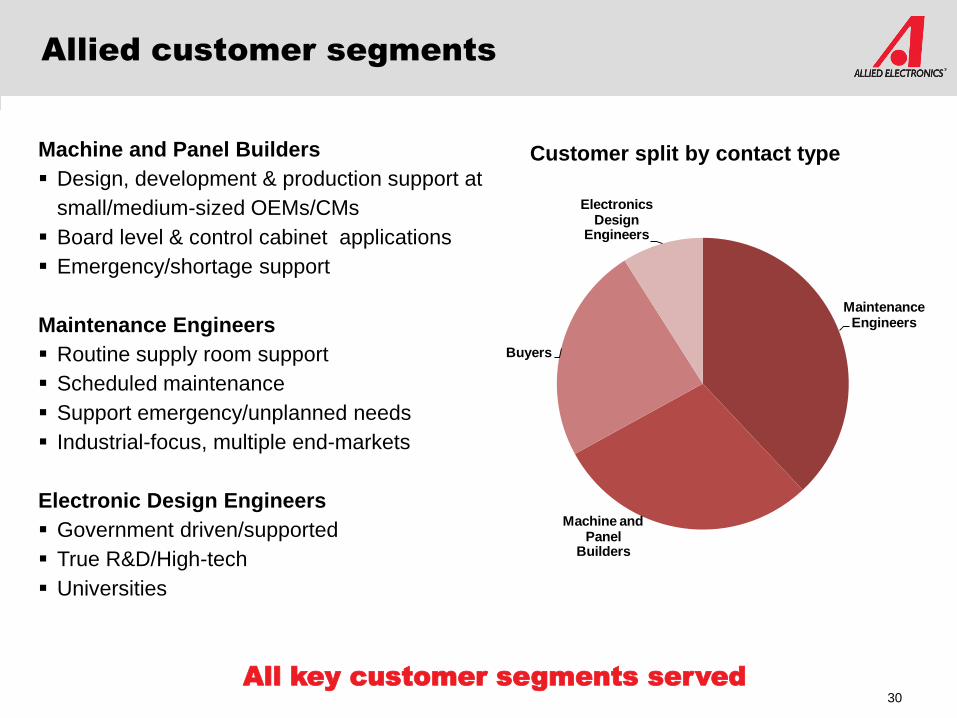
Machine and Panel Builders
Design, development & production support at
small/medium-sized OEMs/CMs
Board level & control cabinet applications
Emergency/shortage support
Maintenance Engineers
Routine supply room support
Scheduled maintenance
Support emergency/unplanned needs
Industrial-focus, multiple end-markets
Electronic Design Engineers
Government driven/supported
True R&D/High-tech
Universities
Allied customer segments
All key customer segments served
30
Customer split by contact type
Maintenance Engineers
Machine and Panel
Builders
Buyers
Electronics Design
Engineers
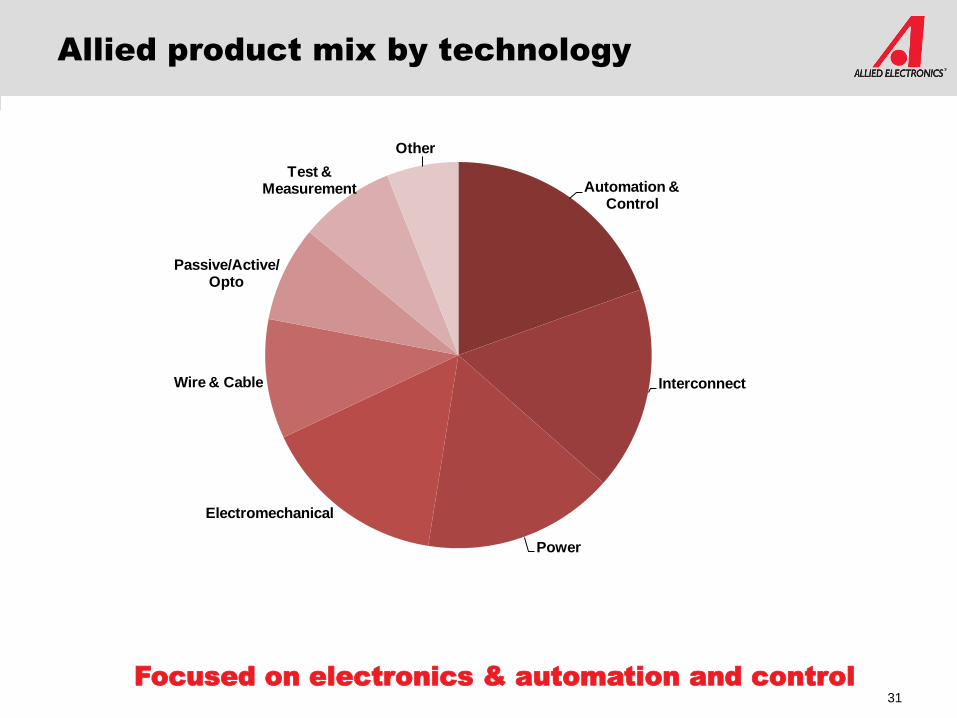
Allied product mix by technology
Focused on electronics & automation and control
31
Automation & Control
Interconnect
Power
Electromechanical
Wire & Cable
Passive/Active/ Opto
Test & Measurement
Other
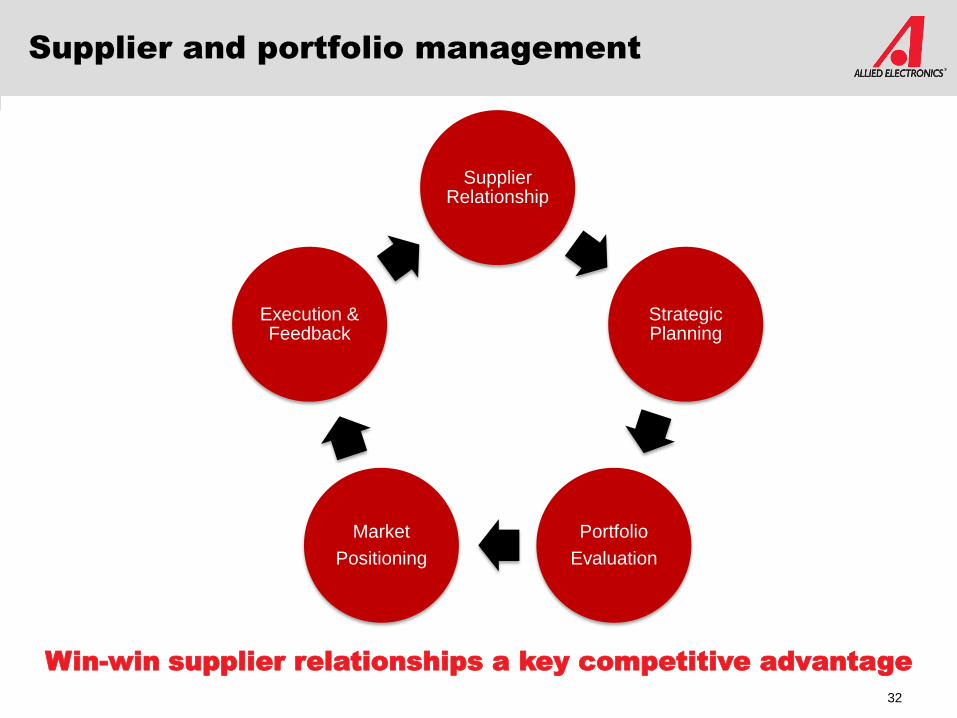
Supplier and portfolio management
Supplier Relationship
Strategic Planning
Portfolio
Evaluation
Market
Positioning
Execution & Feedback
32
Win-win supplier relationships a key competitive advantage
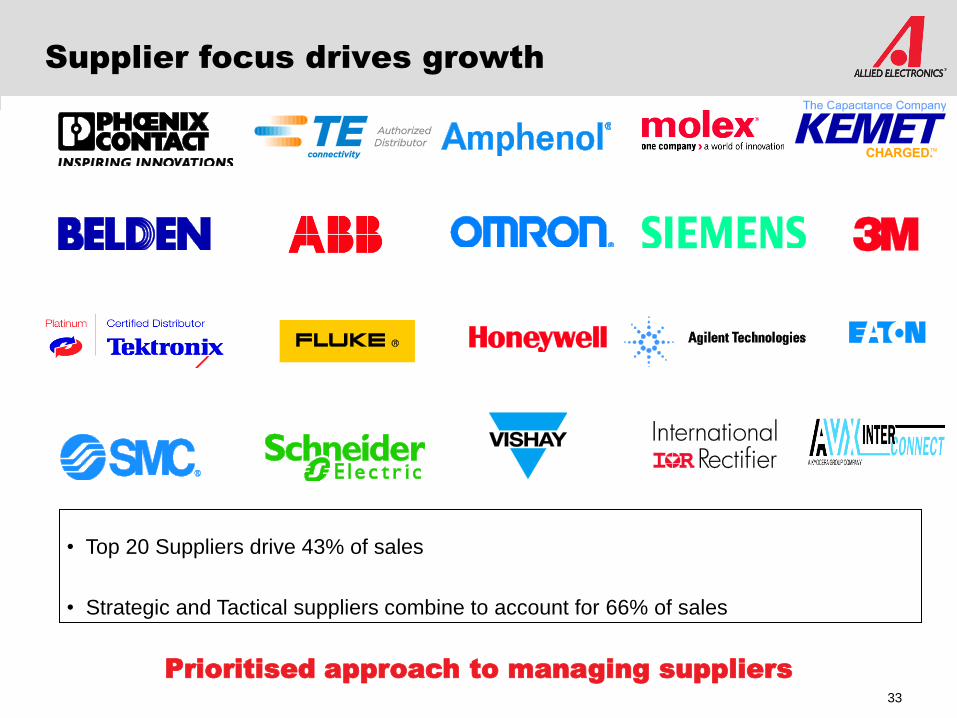
• Top 20 Suppliers drive 43% of sales
• Strategic and Tactical suppliers combine to account for 66% of sales
Supplier focus drives growth
Prioritised approach to managing suppliers
33

Print marketing
Reaching over 20 million customers per year
34

Online marketing
Over 70 million customer touch points per year
35
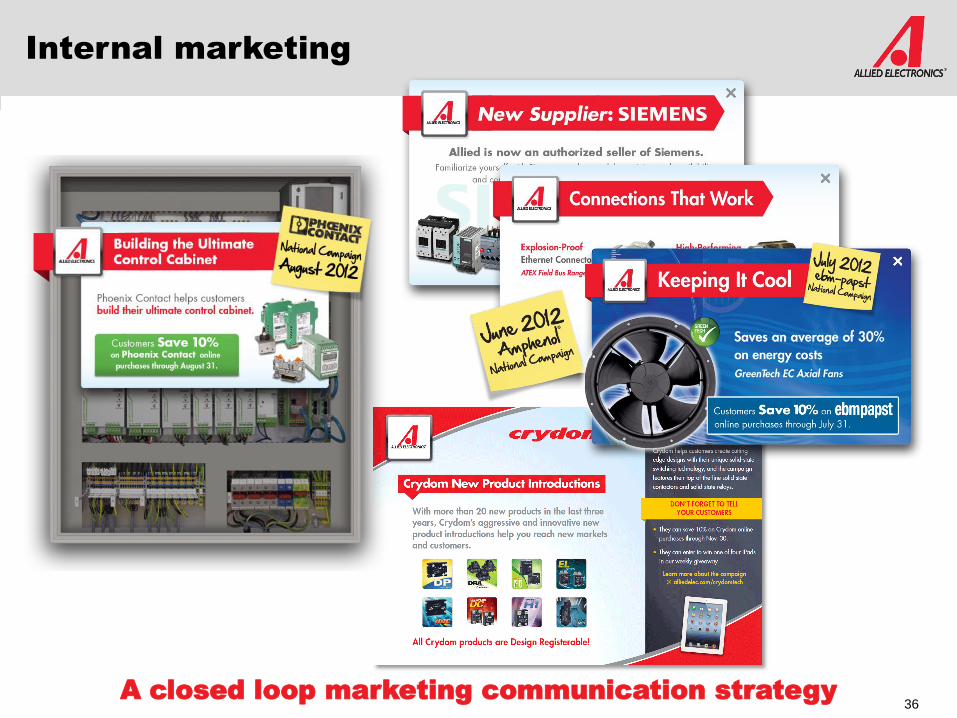
Internal marketing
A closed loop marketing communication strategy 36
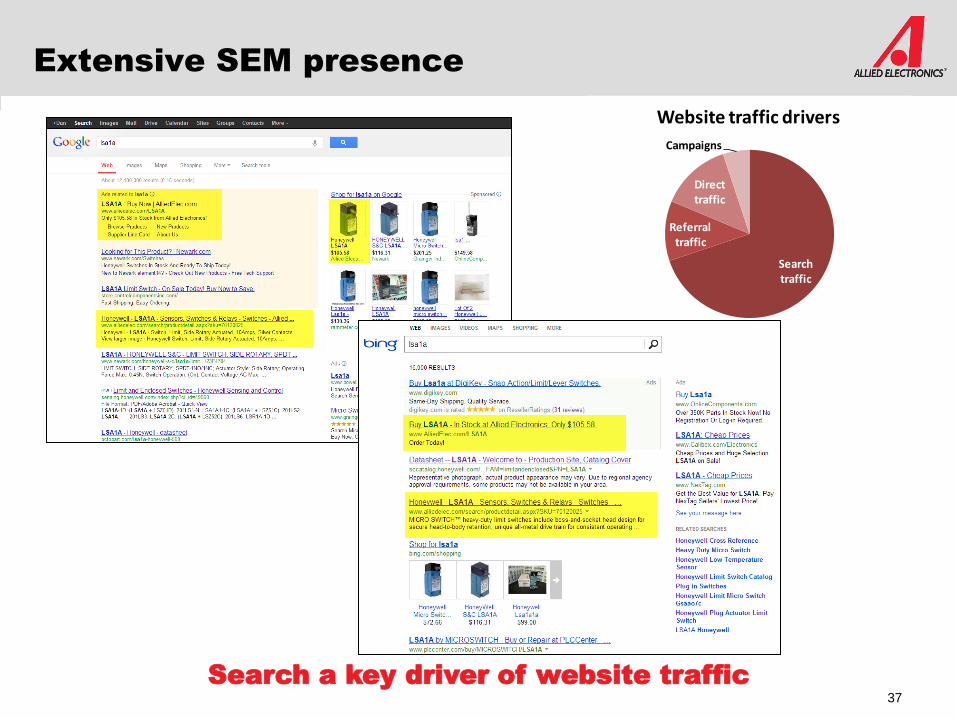
Search traffic
Referral traffic
Direct traffic
Campaigns
Website traffic drivers
Extensive SEM presence
Search a key driver of website traffic
37

Engaging email program
Targeted and relevant email campaigns
38
Conclusion
Business has a good financial characteristics
– Strong cash flow and returns
– Ability to leverage cost base to deliver return to bottom line
– Solid financial investment base to support growth
Focused business with strong local sales presence within a clear global strategy
Win-win partnerships with key suppliers
Market fundamentals supporting a multi-channel marketing approach
Well-invested business, confidence in the future
Committed to delivering a great experience
39

Agenda
Group Overview Ian Mason
Allied Overview Lee Davidson & Team
Q&A All
Lunch All
Allied Operations & Site Tour Kenneth Bradley
Q&A All
Agenda
Group Overview Ian Mason
Allied Overview Lee Davidson & Team
Q&A All
Lunch All
Allied Operations & Site Tour Kenneth Bradley
Q&A All
Agenda
Group Overview Ian Mason
Allied Overview Lee Davidson & Team
Q&A All
Lunch All
Allied Operations & Site Tour Kenneth Bradley
Q&A All
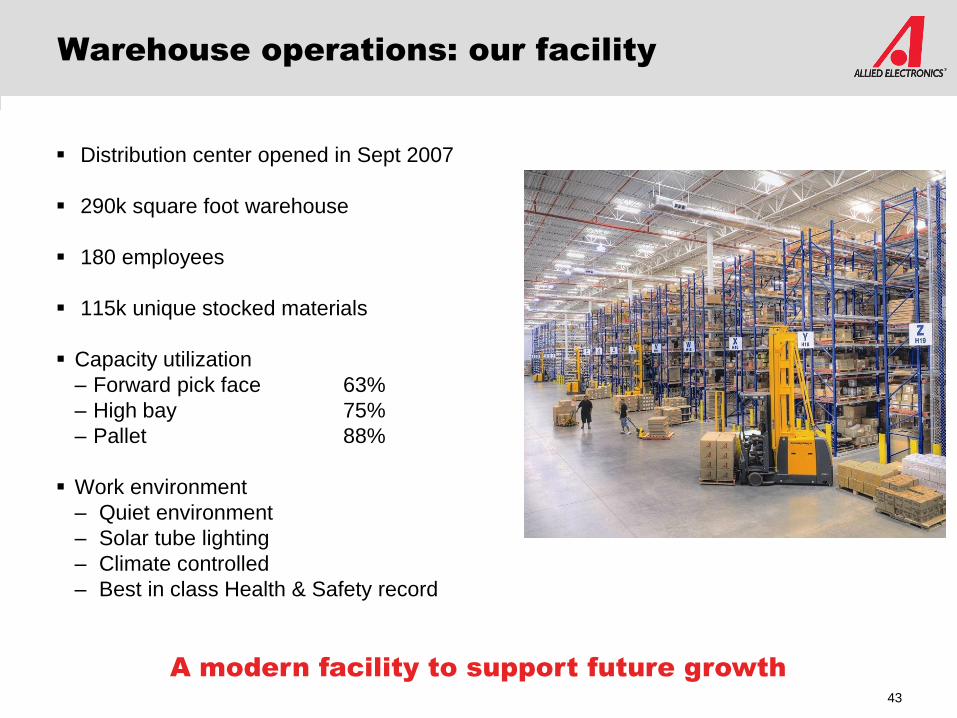
Warehouse operations: our facility
Distribution center opened in Sept 2007
290k square foot warehouse
180 employees
115k unique stocked materials
Capacity utilization
– Forward pick face 63%
– High bay 75%
– Pallet 88%
Work environment
– Quiet environment
– Solar tube lighting
– Climate controlled
– Best in class Health & Safety record
43
A modern facility to support future growth
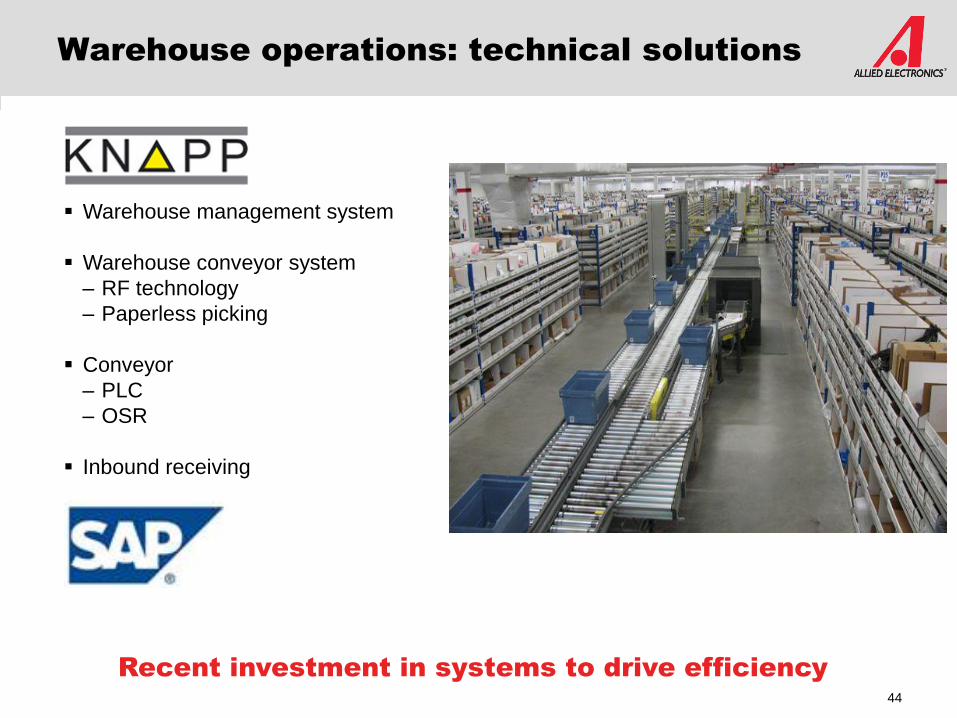
Warehouse operations: technical solutions
Warehouse management system
Warehouse conveyor system
– RF technology
– Paperless picking
Conveyor
– PLC
– OSR
Inbound receiving
44
Recent investment in systems to drive efficiency
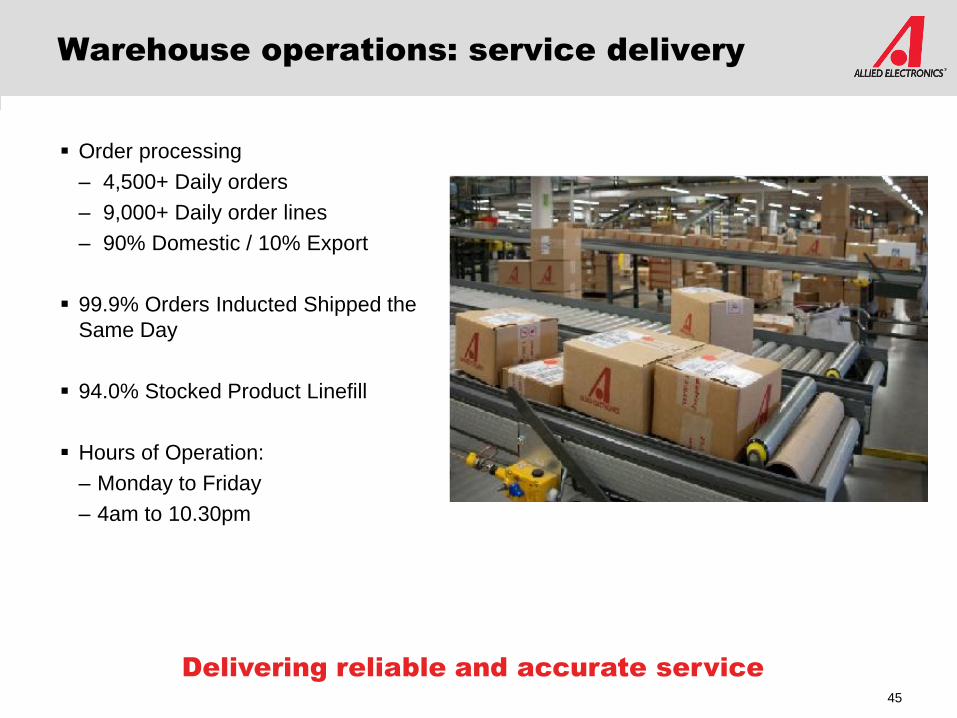
Order processing
– 4,500+ Daily orders
– 9,000+ Daily order lines
– 90% Domestic / 10% Export
99.9% Orders Inducted Shipped the
Same Day
94.0% Stocked Product Linefill
Hours of Operation:
– Monday to Friday
– 4am to 10.30pm
Warehouse operations: service delivery
45
Delivering reliable and accurate service
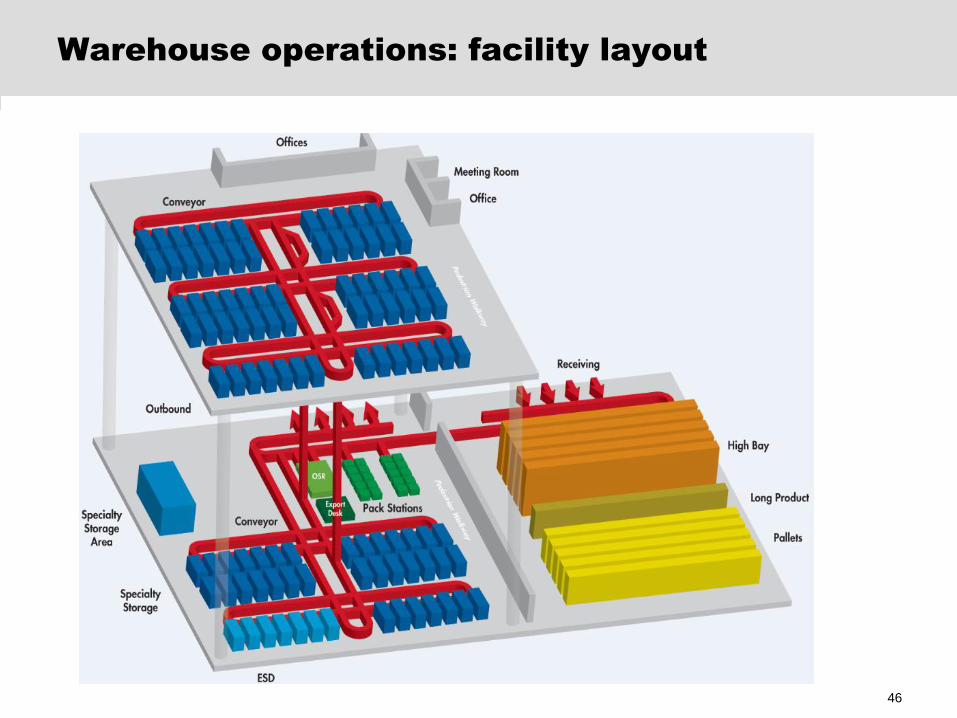
Warehouse operations: facility layout
46

Agenda
Group Overview Ian Mason
Allied Overview Lee Davidson & Team
Q&A All
Lunch All
Allied Operations & Site Tour Kenneth Bradley
Q&A All
Allied Electronics
Committed to Delivering a Great
Customer Experience
Appendix
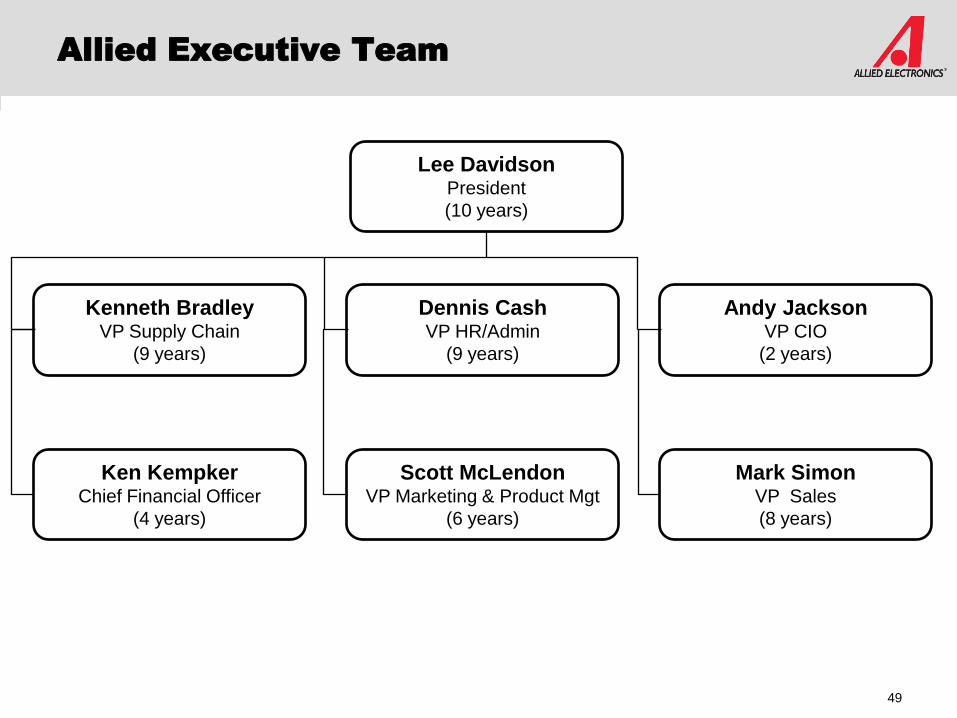
Allied Executive Team
Lee DavidsonPresident
(10 years)
Mark SimonVP Sales
(8 years)
Scott McLendonVP Marketing & Product Mgt
(6 years)
Dennis CashVP HR/Admin
(9 years)
Ken KempkerChief Financial Officer
(4 years)
Andy JacksonVP CIO
(2 years)
Kenneth BradleyVP Supply Chain
(9 years)
49
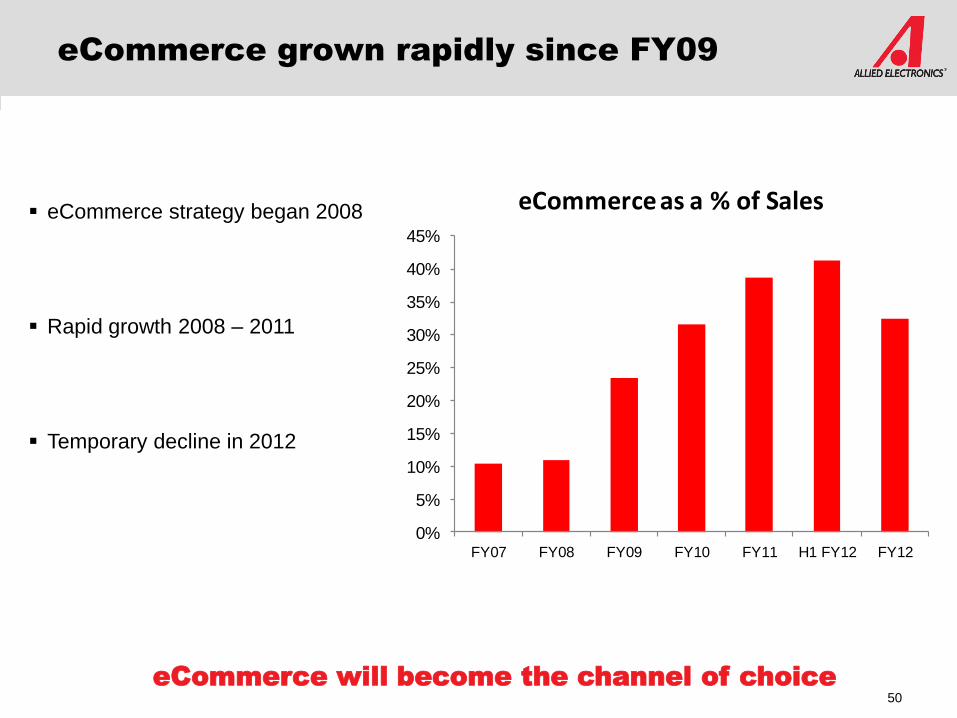
eCommerce grown rapidly since FY09
eCommerce will become the channel of choice
eCommerce strategy began 2008
Rapid growth 2008 – 2011
Temporary decline in 2012
50
0%
5%
10%
15%
20%
25%
30%
35%
40%
45%
FY07 FY08 FY09 FY10 FY11 H1 FY12 FY12
eCommerce as a % of Sales