Embed Size (px)
Citation preview

NormanWellsWindEnergyPre‐feasibilityUpdate
Jean‐Paul Pinard, P. Eng., PhD 703 Wheeler St., Whitehorse, Yukon Y1A 2P6 Tel. (867) 393‐2977; Email [email protected],
John F. Maissan, P. Eng., Leading Edge Projects Inc. 219 Falcon Drive, Whitehorse, Yukon Y1A 0A2 Tel. (867) 668‐3535; Fax (867) 668‐3533; Email [email protected], and Annika Trimble (Ed.), Aurora Research Institute 191 Mackenzie Road, Inuvik, NT X0E 0T0 Phone: (867) 777‐3298; Fax: (867) 777‐4264; Email [email protected]
March 2011
Location of wind monitoring
station on Kee Scarp
Town of Norman Wells

2
ExecutiveSummaryThis study updates the prefeasibility study completed in early 2008 on a possible wind project for the
community of Norman Wells, specifically on Kee Scarp 5 km northeast of town. There is now actual
wind data available from Kee Scarp, and the wind turbine options and costs for a project have been
updated in some detail.
The community of Norman Wells has a population of about 800 whose power is provided by Northwest
Territories Power Corporation (NTPC). The current electrical load is about 10,000 megawatt hours
(MWh) per year, and almost all of the power is purchased by NTPC and generated by natural gas.
A wind monitoring station on Kee Scarp ran for two years and the measurements show that this site has
a projected long‐term mean wind resource of 5.0 m/s at 40 m above ground level (AGL). The long‐term
mean wind speeds are also estimated to be 5.5 m/s at 50 m AGL, and 6.3 m/s at 80 m AGL.
The community and its electrical load are large enough to allow some economies of scale in a wind
project. To perform an economic assessment of a possible wind energy project in Norman Wells, the
100 kilowatt (kW) NorthWind 100 (37 m, tallest tower available) and Aeronautica (formerly Norwin)
225kW (50 m tallest tower) wind turbines were considered. Wind energy projects of about 400/450 kW
and 900 kW were estimated to cost from $4.24 to $4.75 million and from $6.69 to $8.28 million,
respectively, depending on the wind turbine considered.
The levelized cost of energy produced from an unsubsidized wind project with a 20 year life was
estimated to cost from $0.572 per kWh for a 900 kW project, to $0.967 for the 400/450 kW project. The
20‐year levelized cost of diesel generation is $0.380 per kWh for fuel costing $1.00 per litre and $0.467
per kWh for fuel costing $1.25 per litre. The wind project will become competitive when diesel costs
$1.60 per litre. A 400/450 kW wind project would reduce greenhouse gas (GHG) emissions in Norman
Wells by over 425 tonnes per year, and a 900 kW project would reduce GHG emissions by over 958
tonnes per year.
Larger wind turbines (e.g. 800 kW and up) with taller towers (60 ‐ 80 m typical) are available for this
project. A larger scale wind project was outside the scope of this study as this implies a more complex
power and energy control system which has not been implemented to any great extent in Canada. These
high penetration systems are being used in Alaska however, and should be considered as a future phase.
In the North, the impact of capital costs on the cost of wind energy is very significant. The authors have
provided capital and operating cost estimates on the basis that experienced developers and operators
will be completing and operating the projects. Cost estimates do not make allowances for this project
being a first in the territory and thus incurring extra costs. However, the authors also believe that with
experience there is still room to lower the capital costs for wind projects in Northwest Territories.
The Canadian Wind Energy Association (CanWEA) continues to make the proposed Northern and
Remote Community Wind Incentive Program a very high priority. Any other factors such as reduced
capital cost, reduced operating cost, or increased diesel fuel cost (or revenue from carbon credits or
green attribute sales) would serve to further increase the competitiveness of a wind project.
3
BackgroundJP Pinard, P.Eng., PhD. and John Maissan, P.Eng. (Leading Edge Projects Inc.), have been retained by the
Aurora Research Institute (ARI) to conduct a pre‐feasibility study for wind energy generation in Norman
Wells. This study examines wind data from the ARI wind monitoring station, the weather balloon (upper‐
air) station, the airport meteorological station, as well as information from maps and satellite images of
the community to identify potential wind monitoring sites. In addition, the project group has consulted
with the Hamlet of Norman Wells, NTPC and Imperial Oil about the current and future power systems in
Norman Wells. This study provides the following information:
1) An analysis of wind data to estimate long‐term mean wind speed and direction. 2) Estimates of the wind speeds around the hamlet generated with computer models. 3) A list of possibleareas for a wind project. 4) A description of the power system in the hamlet which includes the size, capacity and condition of present system. 5) An analysis of the potential wind energy production from different wind turbine models. 6) Preliminary estimates of the cost of wind generation for the hamlet. 7) Estimates of power production and fuel displacement through the integration of wind power. 8) An outline of next steps needed to pursue the integration of wind power in the hamlet.
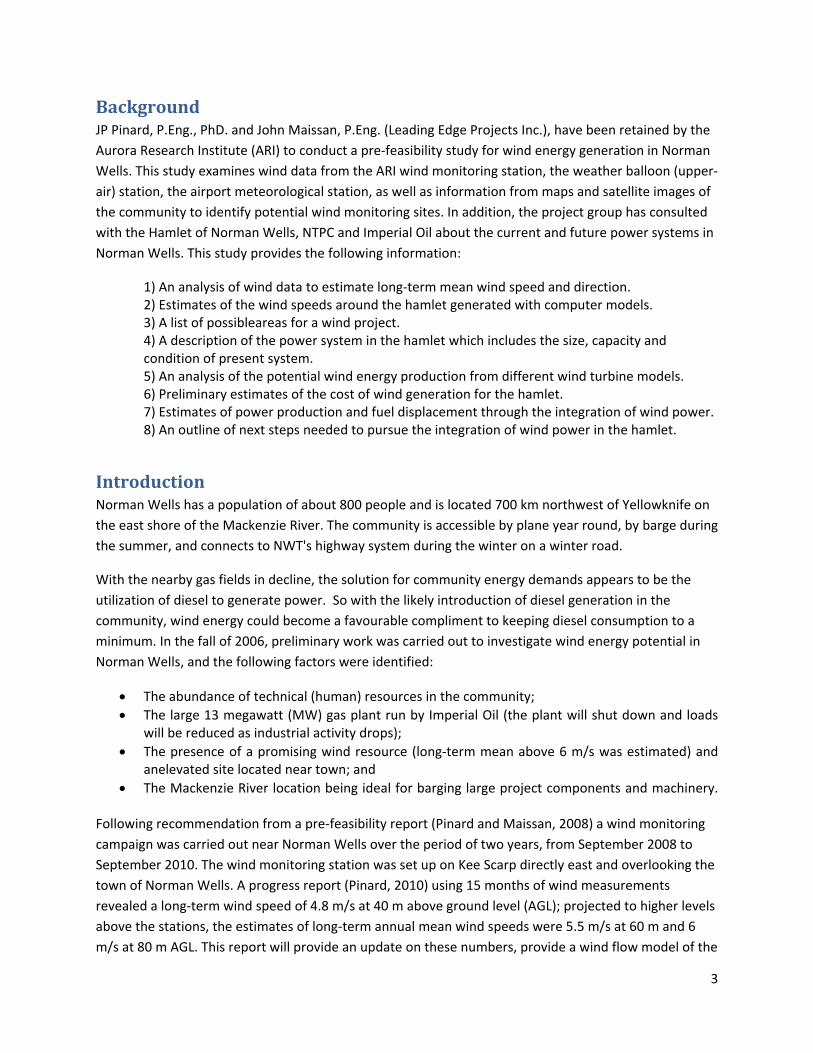
IntroductionNorman Wells has a population of about 800 people and is located 700 km northwest of Yellowknife on
the east shore of the Mackenzie River. The community is accessible by plane year round, by barge during
the summer, and connects to NWT's highway system during the winter on a winter road.
With the nearby gas fields in decline, the solution for community energy demands appears to be the
utilization of diesel to generate power. So with the likely introduction of diesel generation in the
community, wind energy could become a favourable compliment to keeping diesel consumption to a
minimum. In the fall of 2006, preliminary work was carried out to investigate wind energy potential in
Norman Wells, and the following factors were identified:
The abundance of technical (human) resources in the community;
The large 13 megawatt (MW) gas plant run by Imperial Oil (the plant will shut down and loads will be reduced as industrial activity drops);
The presence of a promising wind resource (long‐term mean above 6 m/s was estimated) and anelevated site located near town; and
The Mackenzie River location being ideal for barging large project components and machinery.
Following recommendation from a pre‐feasibility report (Pinard and Maissan, 2008) a wind monitoring
campaign was carried out near Norman Wells over the period of two years, from September 2008 to
September 2010. The wind monitoring station was set up on Kee Scarp directly east and overlooking the
town of Norman Wells. A progress report (Pinard, 2010) using 15 months of wind measurements
revealed a long‐term wind speed of 4.8 m/s at 40 m above ground level (AGL); projected to higher levels
above the stations, the estimates of long‐term annual mean wind speeds were 5.5 m/s at 60 m and 6
m/s at 80 m AGL. This report will provide an update on these numbers, provide a wind flow model of the
4
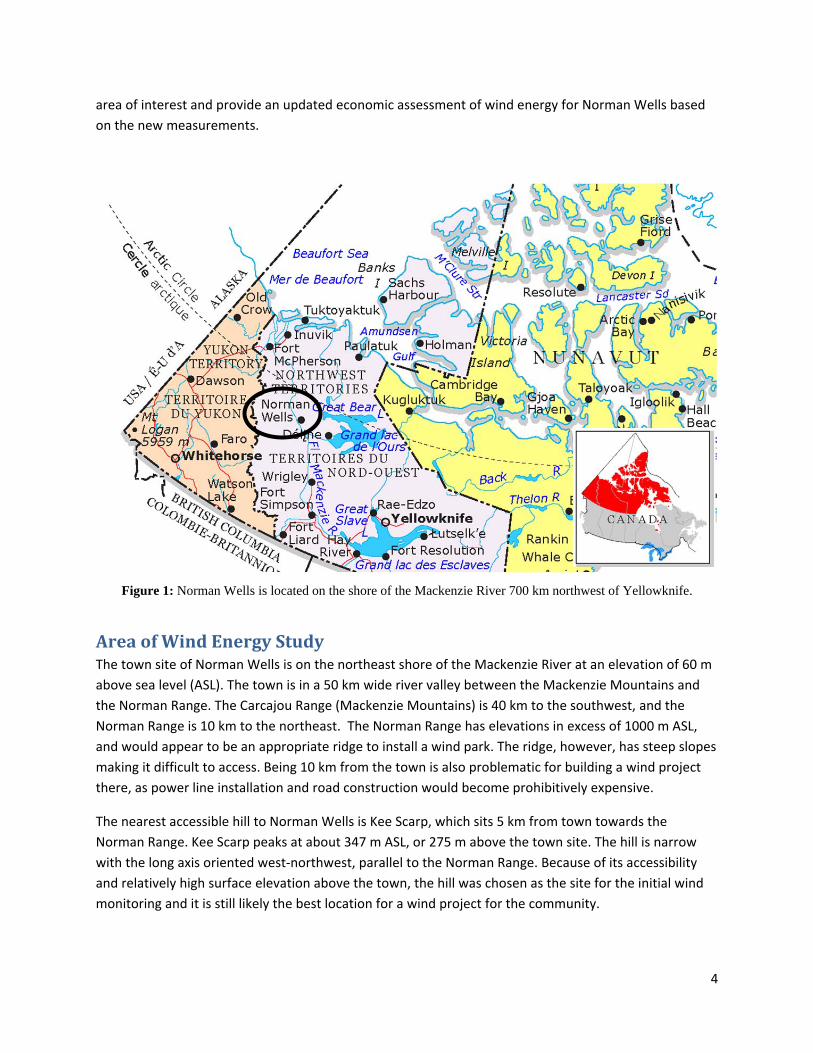
area of interest and provide an updated economic assessment of wind energy for Norman Wells based
on the new measurements.
Figure 1: Norman Wells is located on the shore of the Mackenzie River 700 km northwest of Yellowknife.
AreaofWindEnergyStudyThe town site of Norman Wells is on the northeast shore of the Mackenzie River at an elevation of 60 m
above sea level (ASL). The town is in a 50 km wide river valley between the Mackenzie Mountains and
the Norman Range. The Carcajou Range (Mackenzie Mountains) is 40 km to the southwest, and the
Norman Range is 10 km to the northeast. The Norman Range has elevations in excess of 1000 m ASL,
and would appear to be an appropriate ridge to install a wind park. The ridge, however, has steep slopes
making it difficult to access. Being 10 km from the town is also problematic for building a wind project
there, as power line installation and road construction would become prohibitively expensive.
The nearest accessible hill to Norman Wells is Kee Scarp, which sits 5 km from town towards the
Norman Range. Kee Scarp peaks at about 347 m ASL, or 275 m above the town site. The hill is narrow
with the long axis oriented west‐northwest, parallel to the Norman Range. Because of its accessibility
and relatively high surface elevation above the town, the hill was chosen as the site for the initial wind
monitoring and it is still likely the best location for a wind project for the community.
5
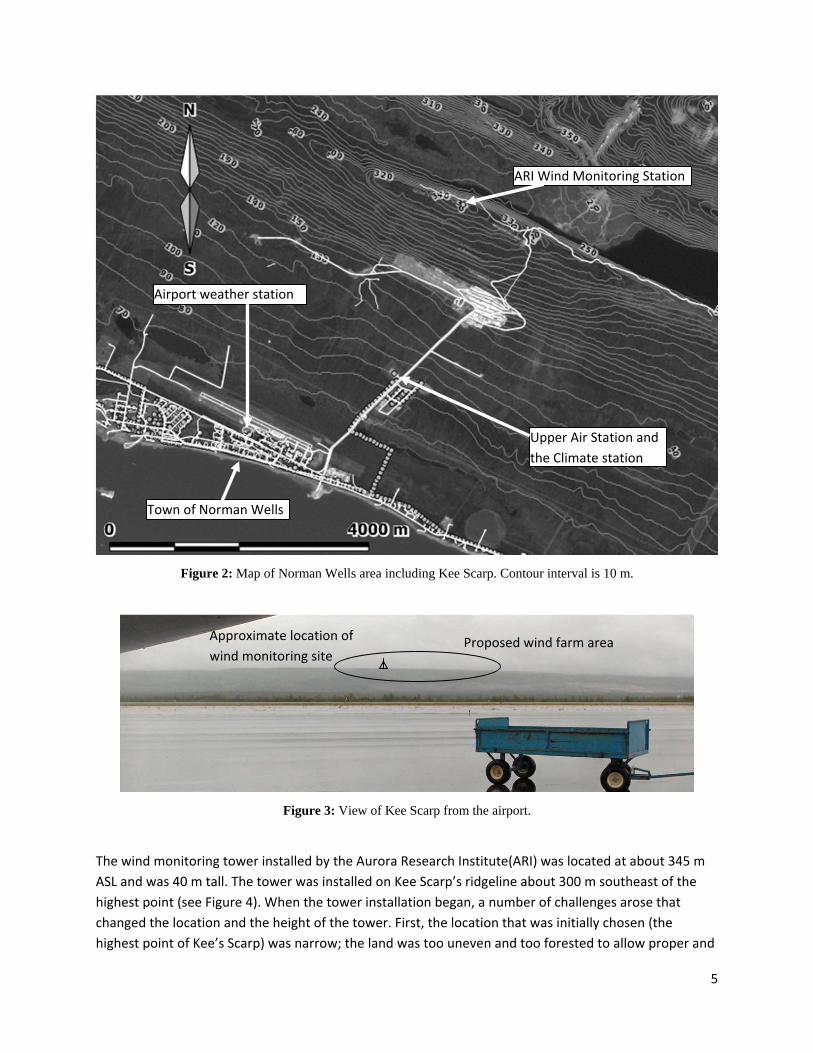
Figure 2: Map of Norman Wells area including Kee Scarp. Contour interval is 10 m.
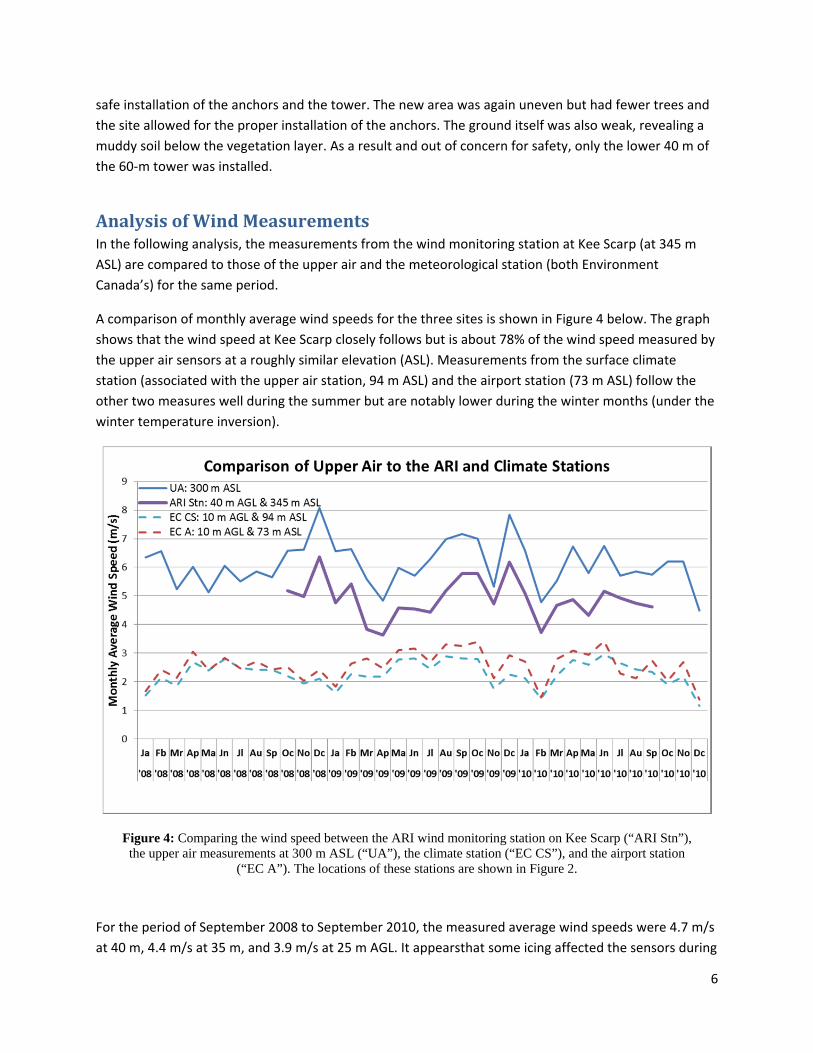
Figure 3: View of Kee Scarp from the airport.
The wind monitoring tower installed by the Aurora Research Institute(ARI) was located at about 345 m
ASL and was 40 m tall. The tower was installed on Kee Scarp’s ridgeline about 300 m southeast of the
highest point (see Figure 4). When the tower installation began, a number of challenges arose that
changed the location and the height of the tower. First, the location that was initially chosen (the
highest point of Kee’s Scarp) was narrow; the land was too uneven and too forested to allow proper and
Proposed wind farm area Approximate location of
wind monitoring site
ARI Wind Monitoring Station
Upper Air Station and
the Climate station
Airport weather station
Town of Norman Wells
6
safe installation of the anchors and the tower. The new area was again uneven but had fewer trees and
the site allowed for the proper installation of the anchors. The ground itself was also weak, revealing a
muddy soil below the vegetation layer. As a result and out of concern for safety, only the lower 40 m of
the 60‐m tower was installed.
AnalysisofWindMeasurementsIn the following analysis, the measurements from the wind monitoring station at Kee Scarp (at 345 m
ASL) are compared to those of the upper air and the meteorological station (both Environment
Canada’s) for the same period.
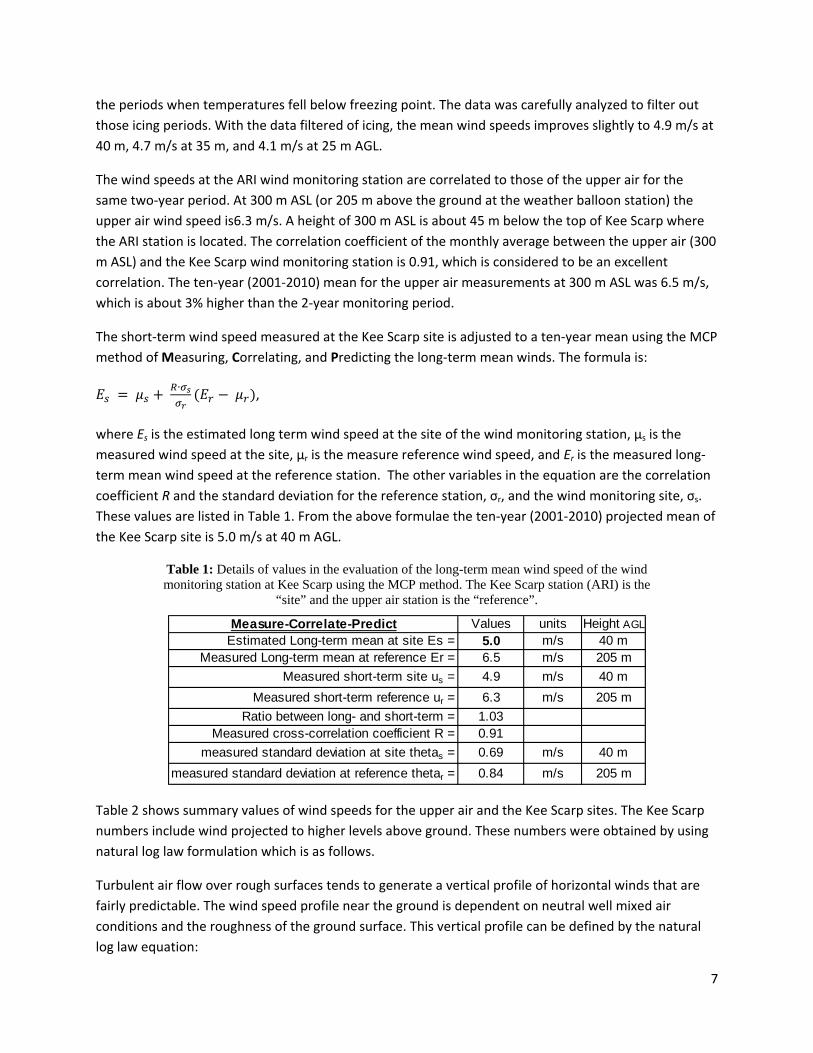
A comparison of monthly average wind speeds for the three sites is shown in Figure 4 below. The graph
shows that the wind speed at Kee Scarp closely follows but is about 78% of the wind speed measured by
the upper air sensors at a roughly similar elevation (ASL). Measurements from the surface climate
station (associated with the upper air station, 94 m ASL) and the airport station (73 m ASL) follow the
other two measures well during the summer but are notably lower during the winter months (under the
winter temperature inversion).
Figure 4: Comparing the wind speed between the ARI wind monitoring station on Kee Scarp (“ARI Stn”), the upper air measurements at 300 m ASL (“UA”), the climate station (“EC CS”), and the airport station
(“EC A”). The locations of these stations are shown in Figure 2.
For the period of September 2008 to September 2010, the measured average wind speeds were 4.7 m/s
at 40 m, 4.4 m/s at 35 m, and 3.9 m/s at 25 m AGL. It appearsthat some icing affected the sensors during
7
the periods when temperatures fell below freezing point. The data was carefully analyzed to filter out
those icing periods. With the data filtered of icing, the mean wind speeds improves slightly to 4.9 m/s at
40 m, 4.7 m/s at 35 m, and 4.1 m/s at 25 m AGL.
The wind speeds at the ARI wind monitoring station are correlated to those of the upper air for the
same two‐year period. At 300 m ASL (or 205 m above the ground at the weather balloon station) the
upper air wind speed is6.3 m/s. A height of 300 m ASL is about 45 m below the top of Kee Scarp where
the ARI station is located. The correlation coefficient of the monthly average between the upper air (300
m ASL) and the Kee Scarp wind monitoring station is 0.91, which is considered to be an excellent
correlation. The ten‐year (2001‐2010) mean for the upper air measurements at 300 m ASL was 6.5 m/s,
which is about 3% higher than the 2‐year monitoring period.
The short‐term wind speed measured at the Kee Scarp site is adjusted to a ten‐year mean using the MCP
method of Measuring, Correlating, and Predicting the long‐term mean winds. The formula is:
∙
,
where Es is the estimated long term wind speed at the site of the wind monitoring station, µs is the
measured wind speed at the site, µr is the measure reference wind speed, and Er is the measured long‐
term mean wind speed at the reference station. The other variables in the equation are the correlation
coefficient R and the standard deviation for the reference station, σr, and the wind monitoring site, σs.
These values are listed in Table 1. From the above formulae the ten‐year (2001‐2010) projected mean of
the Kee Scarp site is 5.0 m/s at 40 m AGL.
Table 1: Details of values in the evaluation of the long-term mean wind speed of the wind monitoring station at Kee Scarp using the MCP method. The Kee Scarp station (ARI) is the
“site” and the upper air station is the “reference”.
Table 2 shows summary values of wind speeds for the upper air and the Kee Scarp sites. The Kee Scarp
numbers include wind projected to higher levels above ground. These numbers were obtained by using
natural log law formulation which is as follows.
Turbulent air flow over rough surfaces tends to generate a vertical profile of horizontal winds that are
fairly predictable. The wind speed profile near the ground is dependent on neutral well mixed air
conditions and the roughness of the ground surface. This vertical profile can be defined by the natural
log law equation:
Measure-Correlate-Predict Values units Height AGL
Estimated Long-term mean at site Es = 5.0 m/s 40 mMeasured Long-term mean at reference Er = 6.5 m/s 205 m
Measured short-term site us = 4.9 m/s 40 m
Measured short-term reference ur = 6.3 m/s 205 m
Ratio between long- and short-term = 1.03Measured cross-correlation coefficient R = 0.91
measured standard deviation at site thetas = 0.69 m/s 40 m
measured standard deviation at reference thetar = 0.84 m/s 205 m
8
ln ⁄
ln ⁄
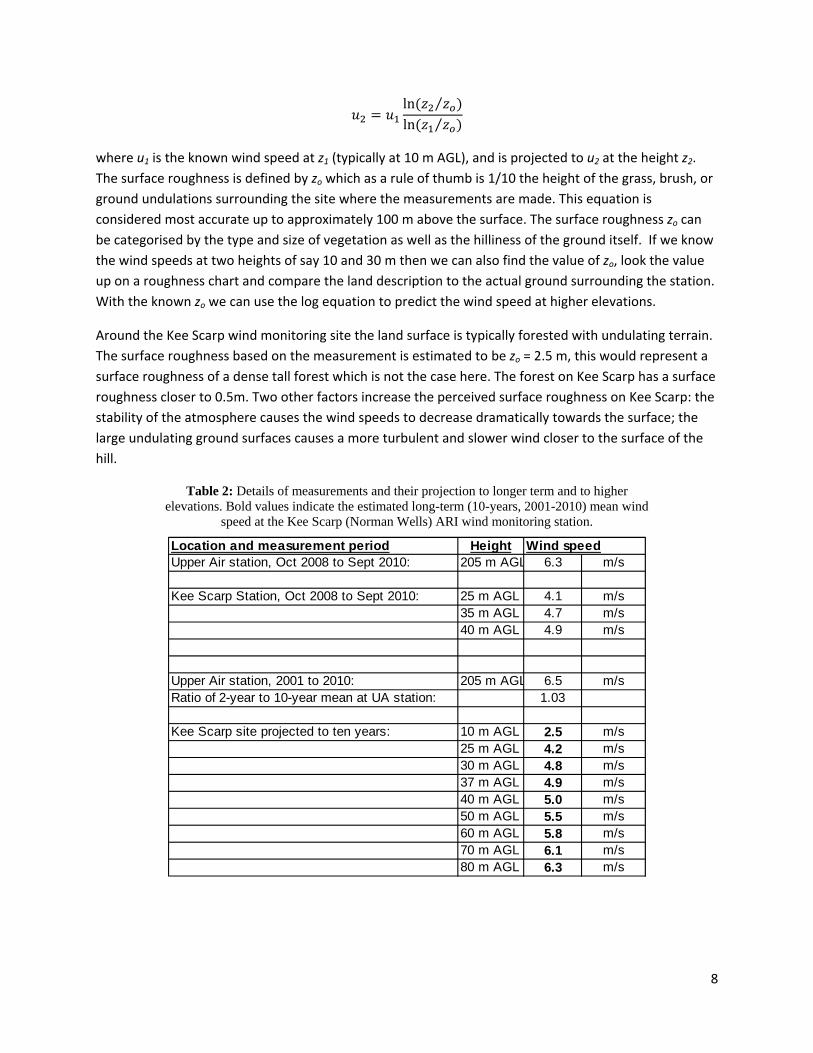
where u1 is the known wind speed at z1 (typically at 10 m AGL), and is projected to u2 at the height z2.
The surface roughness is defined by zo which as a rule of thumb is 1/10 the height of the grass, brush, or
ground undulations surrounding the site where the measurements are made. This equation is
considered most accurate up to approximately 100 m above the surface. The surface roughness zo can
be categorised by the type and size of vegetation as well as the hilliness of the ground itself. If we know
the wind speeds at two heights of say 10 and 30 m then we can also find the value of zo, look the value
up on a roughness chart and compare the land description to the actual ground surrounding the station.
With the known zo we can use the log equation to predict the wind speed at higher elevations.
Around the Kee Scarp wind monitoring site the land surface is typically forested with undulating terrain.
The surface roughness based on the measurement is estimated to be zo = 2.5 m, this would represent a
surface roughness of a dense tall forest which is not the case here. The forest on Kee Scarp has a surface
roughness closer to 0.5m. Two other factors increase the perceived surface roughness on Kee Scarp: the
stability of the atmosphere causes the wind speeds to decrease dramatically towards the surface; the
large undulating ground surfaces causes a more turbulent and slower wind closer to the surface of the
hill.
Table 2: Details of measurements and their projection to longer term and to higher elevations. Bold values indicate the estimated long-term (10-years, 2001-2010) mean wind
speed at the Kee Scarp (Norman Wells) ARI wind monitoring station.
Location and measurement period Height Wind speedUpper Air station, Oct 2008 to Sept 2010: 205 m AGL 6.3 m/s
Kee Scarp Station, Oct 2008 to Sept 2010: 25 m AGL 4.1 m/s35 m AGL 4.7 m/s40 m AGL 4.9 m/s
Upper Air station, 2001 to 2010: 205 m AGL 6.5 m/sRatio of 2-year to 10-year mean at UA station: 1.03
Kee Scarp site projected to ten years: 10 m AGL 2.5 m/s25 m AGL 4.2 m/s30 m AGL 4.8 m/s37 m AGL 4.9 m/s40 m AGL 5.0 m/s50 m AGL 5.5 m/s60 m AGL 5.8 m/s70 m AGL 6.1 m/s80 m AGL 6.3 m/s
9
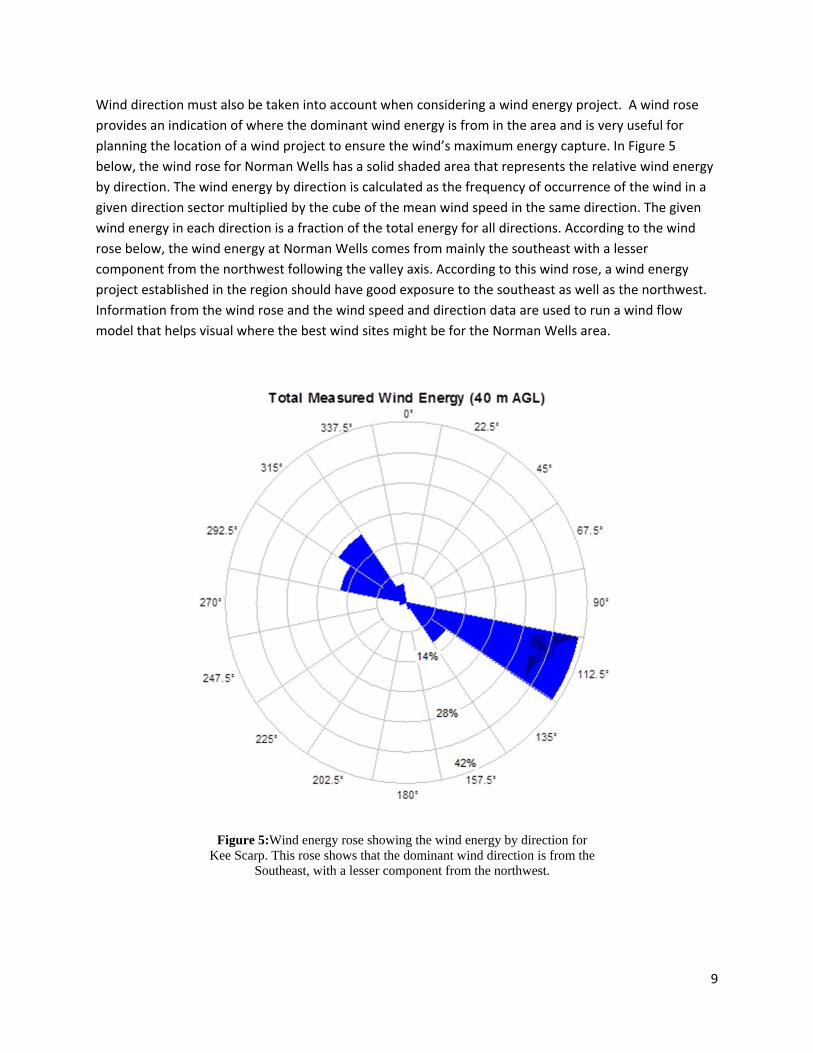
Wind direction must also be taken into account when considering a wind energy project. A wind rose
provides an indication of where the dominant wind energy is from in the area and is very useful for
planning the location of a wind project to ensure the wind’s maximum energy capture. In Figure 5
below, the wind rose for Norman Wells has a solid shaded area that represents the relative wind energy
by direction. The wind energy by direction is calculated as the frequency of occurrence of the wind in a
given direction sector multiplied by the cube of the mean wind speed in the same direction. The given
wind energy in each direction is a fraction of the total energy for all directions. According to the wind
rose below, the wind energy at Norman Wells comes from mainly the southeast with a lesser
component from the northwest following the valley axis. According to this wind rose, a wind energy
project established in the region should have good exposure to the southeast as well as the northwest.
Information from the wind rose and the wind speed and direction data are used to run a wind flow
model that helps visual where the best wind sites might be for the Norman Wells area.
Figure 5:Wind energy rose showing the wind energy by direction for Kee Scarp. This rose shows that the dominant wind direction is from the
Southeast, with a lesser component from the northwest.

10
Fine‐ScaleWindModellingoftheKeeScarpAreaThe wind model used to create the wind map for the Kee Scarp area is OpenWind by AWS Truewind
(www.awstruewind.com). OpenWind uses a mass‐consistent wind flow model to project winds from one
location to another. As input, the model uses surface elevation data, surface roughness, and a table of
wind speed distribution by direction. The elevation data is obtained in part from the Geobase website
(http://www.geobase.ca), and from the MACA (Municipal and Community Affairs) website. The surface
roughness is assumed to be zo = 0.5 m, which is representative of the area’s forest type and density. The
table of wind speed distribution is derived from the two‐year wind speed data set (Sept 2008 to Sept
2010) from the ARI wind monitoring station on Kee Scarp.
The wind flow modeling portion of OpenWind creates a wind map for each wind flow direction. The
wind speeds in the wind maps are directly associated to the table of wind speed distributions. The
OpenWind wind speed map in Figure 6 shows the summarized wind speed contours over a satellite
image of LutselK’e. One possible location is suggested for turbine placements. The area outlined by a
rectangle in Figure 6 is about 120 by 700 metres across the top of Kee Scarp has wind speeds above 5
m/s (at 40 m above ground). There is probably room to install up to ten Aeronautica A225, depending
on the ground conditions and further feasibility studies.
Figure 6:An aerial image of the Kee Scarp area superimposed by a contour line of modelled wind speeds at 40 m above the surface. The wind speed contour interval is 0.1 m/s. The highest wind speed contour is
5.1 m/s and it appears just east of where the ARI wind monitoring station was located.
Highest modelled wind speeds

11
PowerRequirementsandCostsThe community of Norman Wells has two power suppliers: Imperial Oil operates a 13 MW gas fired
power plant to serve the oil related industrial loads in the area and sells power to NTPC for distribution
to serve the local community’s residential and general service loads and street lights; and NTPC owns
and operates a diesel plant composed of a Caterpillar 3516 rated at 1,400 kW and a Caterpillar D399
rated at 720 kW. This plant provides a small amount of diesel generated power to augment the power
purchased from the gas power plant.
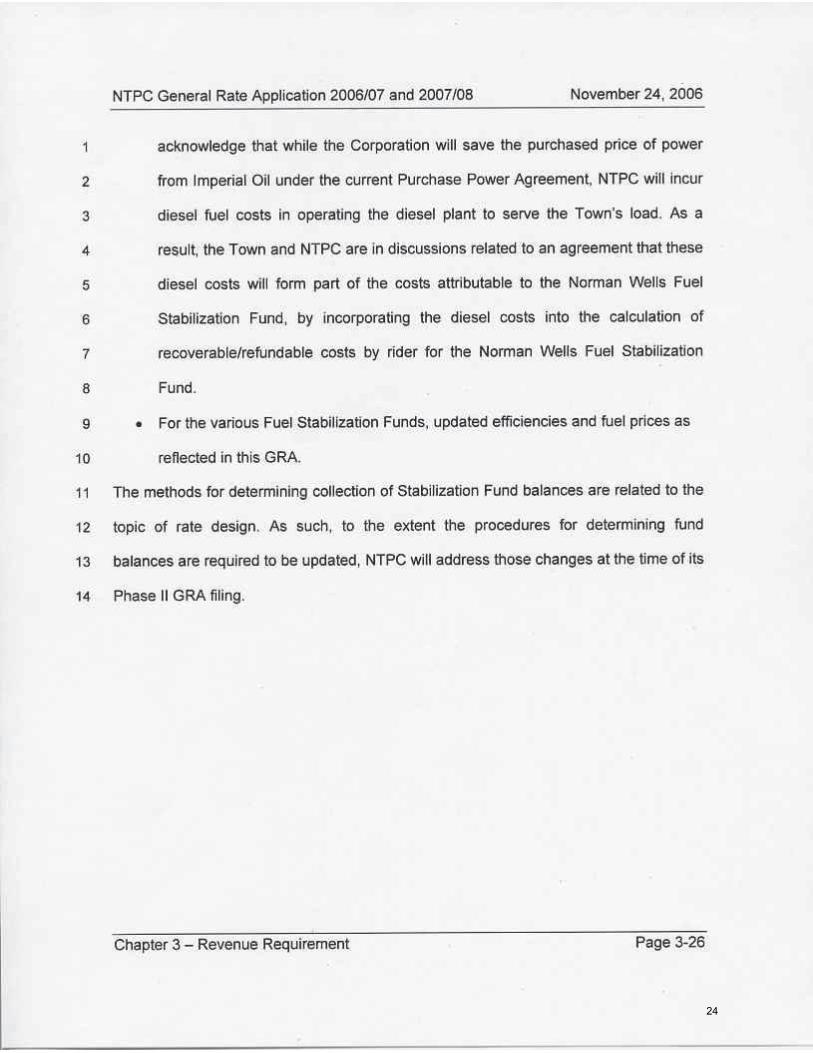
The 2007/8 actual power requirement in the community was 9,683 MWh of which 99% was purchased
from Imperial Oil at a general rate application (GRA) forecasted price of $0.279 per kWh (indexed to the
price of diesel) and the remainder was at a GRA forecasted $0.246 per kWh ($0.841 per litre and 3.414
kWh per litre). Relevant excerpts of the GRA are attached as Appendix 1.
The 2011 annual energy requirement has been conservatively estimated (by the authors) at 10,000
MWh which indicates an average load of 1.142 MW and a peak load estimated at 1.700 MW (a load
factor of 65.1% was forecasted in the GRA). Based on these figures the minimum load is estimated to be
about 600 kW. For this prefeasibility study, a smaller wind energy project size of about 400 to 450 kW
and a larger project size of about 900 kW were considered and are consistent with a low and medium
penetration levels. This study did not examine a high penetration project as the authors feel that more
experience with simpler wind‐diesel projects in NWT is required before the more technically
complicated high penetration systems are taken on.
The authors understand that the supply of gas may be running low and that NTPC may be required to
supply all of the community power demand from diesel generation in the future. For the purposes of
this prefeasibility study it has been assumed that the industrial loads would continue to be served by
privately owned power plants and are thus not included in this study. It has also been assumed that
NTPC would install a state of the art diesel power plant that would generate 3.7 kWh per litre of diesel
fuel. This diesel plant would produce energy at a levelized cost of $0.380 per kWh over 20 years with
diesel fuel starting at $1.00 per litre ($0.467 per kWh with diesel fuel starting at $1.25 per litre). Other
relevant assumptions are: variable diesel O&M expense is $0.03 per kWh (the Yukon Utilities Board
accepted cost in Yukon for Yukon Energy and Yukon Electrical Company Limited); and diesel fuel inflates
at 3% per year while general inflation is 2%.
WindPowerProjectCosts
Developer–OperatorFor the purpose of this report it was assumed that a wind project will be only large enough to displace
significant electrical diesel consumption without compromising the quality of the electric grid. A larger
wind project will require a more complex power and energy control system to divert the excess wind
energy. This creates an opportunity to utilise the excess wind energy for space heating (and eventually,
local transportation) which will add greater benefits to the community at large.This level of high
contribution (high penetration) has however, not been implemented to any great extent in Canada. High

12
penetration systems are being used in Alaska and Australia and should be considered as a future phase
for this community.
For this report it is also assumed that if a wind project were to be developed in Norman Wells it would
be done by a developer with some amount of wind project experience in the NWT. There is no
allowance in the project cost estimates for overcoming a learning curve for inexperienced
developers/operators. If a project were to be developed by an inexperienced firm the capital costs
would likely be higher. In the opinion of the authors, the ideal project developer/operator would be
NTPC as they already own the diesel power plant, have significant technical resources, and have
experience in construction in the remote communities. As well, the integration of the wind and diesel
plants (including power purchase agreement issues) would be relatively seamless.
WindTurbinesBased on other recent work by the authors, two wind turbine models were selected for consideration in
Norman Wells. These include Northern Power Systems’ NorthWind 100 which has a 21 meter rotor and
a 37 meter tower, and Aeronautica’s 225kW (the design of the former Danish manufacturer Norwin, of
which there are many in operation) which has a 29 meter rotor and a 50 meter tower. The NorthWind
100 has available an option for operation down to ‐40°C (included in the authors’ pricing), but the
Aeronautica standard very low temperature option only permits operation down to ‐30°C. However,
based on discussions with the supplier it may be possible to extend this range at some additional cost.
At this time no extra cost has been included in this study as a detailed wind energy‐temperature analysis
would need to be undertaken to determine whether this modification would be necessary. The
advantages of the Aeronautica 225 is its 50 meter tower, which reaches up into far better wind speeds
than the 37 meter NorthWind tower, and economies of scale – meaning fewer larger turbines. The
Aeronautica 225 is also a lower cost turbine per unit nameplate capacity. For convenience, the
NorthWind 100 is referred to as the NW100 in this report and the Aeronautica (Norwin) turbine is
referred to as the A225.
The tower heights of these two wind turbines are the maximum heights available for each model.
Considering the wind climate on Kee Scarp taller towers would be preferred as the wind energy
available increases sharply as a function of wind speed (wind energy is proportional to the cube of the
wind speed). There are larger turbines that are available on the market, for example the EWT 900 kW
wind turbine is available with a 75 m tower. There is an EWT 900 kW operating in Delta Junction, Alaska
which has a similar climate as Norman Wells. This size of turbine is large and more expensive to install
and so would require some economy of scale by installing more than one. There is also an Enercon E53
800kW turbine that would fit this community that is to be used in a wind‐diesel project in northern
Quebec. This then causes the wind project to become a higher wind energy contributor to the
community grid which adds more complexity that is beyond the scope of this study. A larger project
utilizing larger turbines has the potential to lower wind energy costs. This also creates (and requires) an
opportunity for wind energy to provide spacing heating in the community, but again, this will require
more detailed analysis which is beyond the scope of this study.

13
EnergyProductionThe annual energy production from each of the two selected wind turbines is calculated using the
HOMER model. HOMER was developed by the National Renewable Energy Laboratory of the US
Government and is now distributed and supported by HOMER Energy (www.homerenergy.com).
HOMER is a power system analysis and optimization model. The energy model uses published wind
turbine power curves, diesel plant production specifications, and a one‐year hourly time series
measurements of both wind speed and community power load to model the energy output of various
power generators.
The inputs for the HOMER model consists of the diesel generators described earlier, the wind system
and the community load estimated from the average, maximum and minimum load of the community.
The wind resource data used as input for the HOMER is a one‐year data set based on on‐site wind mast
measurements at Kee Scarp projected to the ten‐year (2001‐2010) mean. As shown in the wind flow
model results in Figure 6, the wind speed at the top of Kee Scarp are expected to be above 5 m/s at 40
m AGL for an area large enough to fit up to 10 wind generators.
The energy produced by the NW100 and A225 turbines are based on the published power curves, less
5% to adjust for a turbine availability of 95%. An additional 10% of the production is then subtracted to
account for losses (turbulence losses, array losses, mechanical losses, cold and icing performance losses,
transformer losses, and transmission line losses) to arrive at the net energy production available to
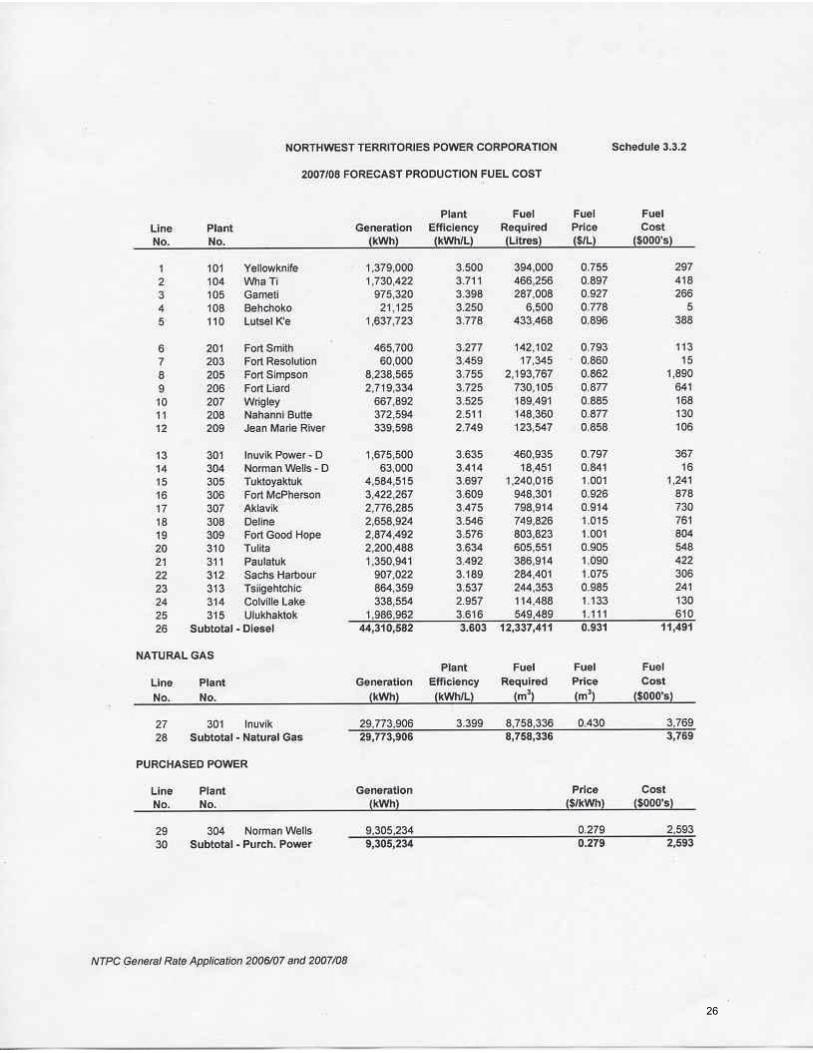
displace diesel energy. Appendix 2 presents a table of energy production from the two different wind
farm sizes using each of the two wind turbine models described. Often there is an adjustment for
increased production at higher air densities due to cold temperatures which, in this case, would likely be
5% or a bit higher. However, to be conservative no air density adjustments were made in this study.
The calculations indicate that the net energy production at the annual average wind speed at the
turbine hub height represents a capacity factor of about 15.0% for the NW100 and 16.9% for the A225.
The A225 has a higher capacity factor largely because of its taller 50‐m tower compared to the NW100
at 37 m. Net generation is the HOMER calculated ideal generation less availability and other losses
(total 15% of ideal generation).
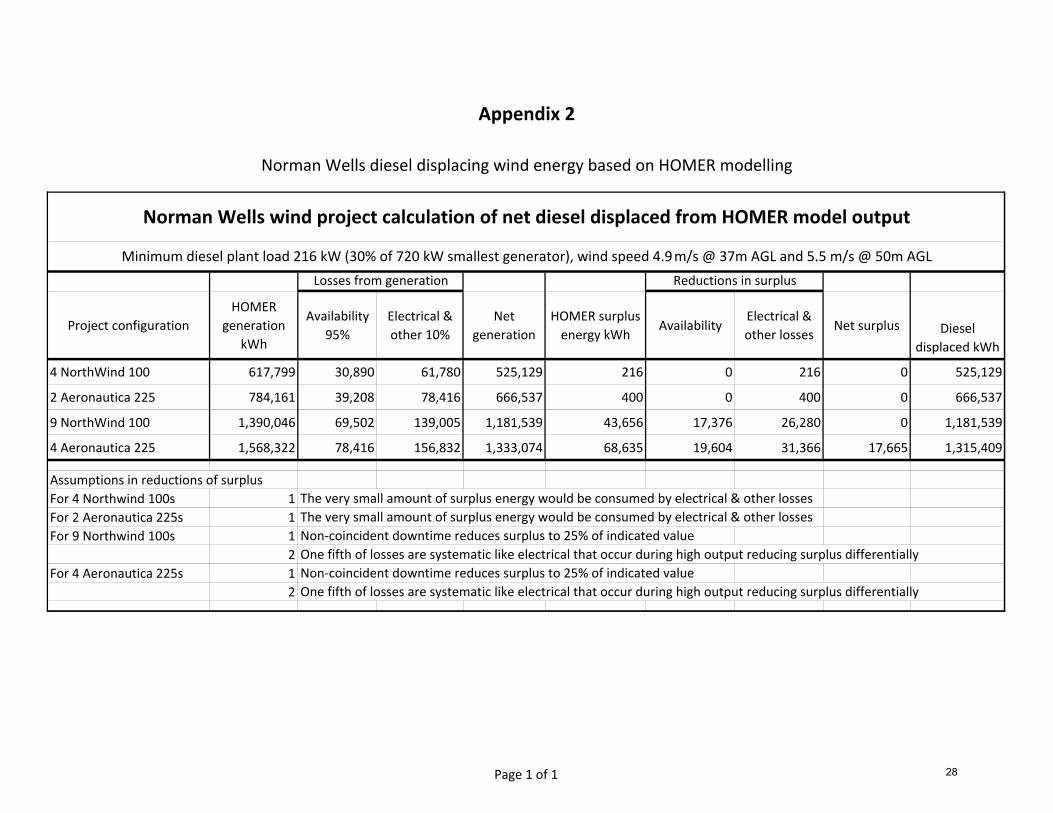
CapitalCostsThe estimated capital costs for the 400/450 kW and 900 kW projects are presented in some detail in
Appendix 3 and are summarized below.
1. A 400 kW project based on four NW100 turbines was estimated to cost about $4.751 million or $11,877 per kW;
2. A 450 kW project based on two A225 turbines was estimated to cost about $4.240 million or $9,423 per kW;
3. The estimate for a 900 kW project based on nine NW100s was $8.284 million or $9,205 per kW; and
4. The estimate for a 900 kW project based on four A225s was $6.686 million or $7,429 per kW.

14
The unit cost reduction in scaling up from a 400/450 kW project to a 900 kW project ranged from about
$2,000 per kW for the A225 based projects to about $2,600 per kW for the NW100 based projects.
The most significant fixed cost items (not directly a function of project size) are the power line estimated
at $900,000 (4.5 km at $200,000 per km), the mobilization and demobilization of a crane at $100,000 to
$150,000, the foundation design and the associated geotechnical work at about $130,000 to $170,000,
and the integration with the diesel plant/power system estimated at about $100,000 to $200,000.
A power line to the proposed wind farm area closely following the road would have to be 5.5 km long. A
straight line from Kee Scarp to the nearest power line could reduce the power line distance to 3.5 km,
but to be prudent a straight alignment in two segments generally following the road (one to Kee Scarp
and one along Kee Scarp) to the middle of the proposed development site was chosen and the
estimated 4.5km provides for power collection from the turbines. As the power line is a major cost
component of any project, it would be important to examine cost reduction alternatives carefully.
The capital costs of a wind project are a major energy cost driver, so it is critical for any developer to pay
considerable attention to all capital cost components. For the same reason larger projects provide
economies of scale that reduce costs per unit of installed capacity and for this reason the authors chose
relatively larger projects for this study.
OperatingandMaintenanceCostsThe annual operating and maintenance (O&M) costs were based on other recent work by the authors.
For a project of about 400kW in size based on four NW100s, the O&M was estimated to be about
$45,000 per year, and for a 450kW project based on two A225s was estimated to be $50,000 per year.
For a 900kW project employing either nine NW100s or four A225s the annual O&M was estimated to be
$95,000. This cost is based on the simple requirements to keep a project running and does not include
costs that may be associated with establishing and running a corporation for the wind project only. The
effective assumption is that the wind project is owned and operated by an appropriate existing
organization.
The operating and maintenance cost is intended to include all overhead, insurance, lease, and tax costs
as well as the actual maintenance costs. The estimated costs fall between $0.07 and $0.09 per kWh.
For the economic analysis (presented in the following subsection) the cost of capital was assumed to be
7.5%, which represents a regulated utility. Incorporated in the cost of capital is a return on equity which
would be earned by the project owners and is separate and distinct from the annual operating and
maintenance costs. The authors believe that funding assistance would likely be necessary to interest a
wind project developer and this would increase the effective return on equity or reduce the cost of
debt. A project developer would need to calculate the economics of a project based on their own
circumstances.
15
CostofWindEnergyandEconomicAnalysesIn order to compare an energy project to another we calculate the average annual or levelized cost of
energy, which is the net present value of total life cycle costs of the project divided by the quantity of
energy produced over the system life. The levelized cost of wind energy over a 20 year project life was
calculated for each of the four project configurations and compared to the levelized cost of diesel
generation over 20 years. Appendix 4 presents the economic model outputs of the levelized cost of
wind energy for the four project variations. Appendix 5 presents the economic model outputs for
continued diesel generation with different starting prices for diesel fuel. The variables and assumptions
used in the economic model include the project capital cost, its capacity in kW, its annual diesel
displacing energy production, the useful life of a project (20 years), the cost of capital (7.5%), the
general inflation rate (2%), and the annual operating costs. The model calculates the levelized cost of
energy over the life of the projects.
For continued diesel generation the assumptions include a variable operating and maintenance cost of
$0.03 per kWh, a plant efficiency of 3.7 kWh per litre of diesel, and diesel fuel is assumed to inflate at
3% per year while general inflation is 2% per year. As the authors were unable to obtain present diesel
fuel pricing from NTPC, present fuel prices of $1.00 per litre and $1.25 per litre were considered. The
economic model outputs for diesel generation are contained in Appendix 5.
The levelized incremental (or variable) cost of diesel energy over 20 years with diesel fuel commencing
at $1.00 per litre was calculated by the model to be $0.380 per kWh, and for fuel starting at $1.25 per
kWh was calculated to be $0.467 per kWh.
The 400 kW project composed of four NW100s was projected to produce a levelized cost of energy of
$0.967 per kWh over its life, and the 450 kW project composed of two A225 turbines was projected to
produce energy at a levelized cost $0.777 per kWh over its life. A 900 kW project composed of nine
NW100s was projected to produce power at a levelized cost of $0.766 per kWh over its life and a 900
kW project composed of four A225s was projected to produce energy at a levelized cost of $0.572 per
kWh over its life.
The above analyses show that electrical energy from wind power projects would be more expensive
than electrical energy from diesel generation. The analyses also show two other important things. The
first is that larger wind projects produce electrical energy at a far lower cost than smaller projects –
economies of scale do make a big difference. In this case doubling the project size from 400‐450kW to
900kW reduced the cost of electrical energy by $0.20 per kWh for both turbine types.
The second thing is that taller wind towers can make a significant difference to the cost of electrical
energy. In this project case, the A225 turbine outperforms the NW100 turbine despite having a smaller
swept area per kW of capacity and a less attractive power curve than the NW100. The difference is that
the NW100 has a tower height of 37 meters and harvests energy at a wind speed of 4.9m/s whereas the
A225 has a tower 50 meters in height and harvests wind energy at a wind speed of 5.5m/s. Since the
energy in wind is proportional to the cube of the wind speed, this makes big difference, and reduces the
cost of wind energy by about $0.20 per kWh.
16
In order to make wind energy economic, one of two things must happen (or a combination of the two
could happen). The first is that the cost of diesel fuel would need to increase to about $1.60 per litre
(and still inflate at 3% per year relative to inflation at 2% per year) in which case the 20 year levelized of
energy would be about $0.58 per kWh – just over the cost of energy from a 900kW wind project with
four Aeronautica turbines.
The second thing that could happen is that the Canadian Wind Energy Association’s (CanWEA) proposed
Northern and Remote Community Wind Incentive Program (NoRWIP) could be adopted by the federal
government. The proposed program would subsidize the project cost by 30% to a maximum of $4,000
per kW of installed capacity. This would reduce the levelized cost of energy from the 900kW A225
project to about $0.426 per kWh – comparable to diesel‐generated electrical energy with fuel prices
somewhere between $1.00 and $1.25 per litre. Applying NoRWIP to the 900kW project composed of
nine NW100 turbines would reduce the levelized cost of energy to about $0.565 per kWh – still above
the cost of diesel fuel starting at $1.25 per litre. Appendix 6 provides the economic model outputs of
these two cases.
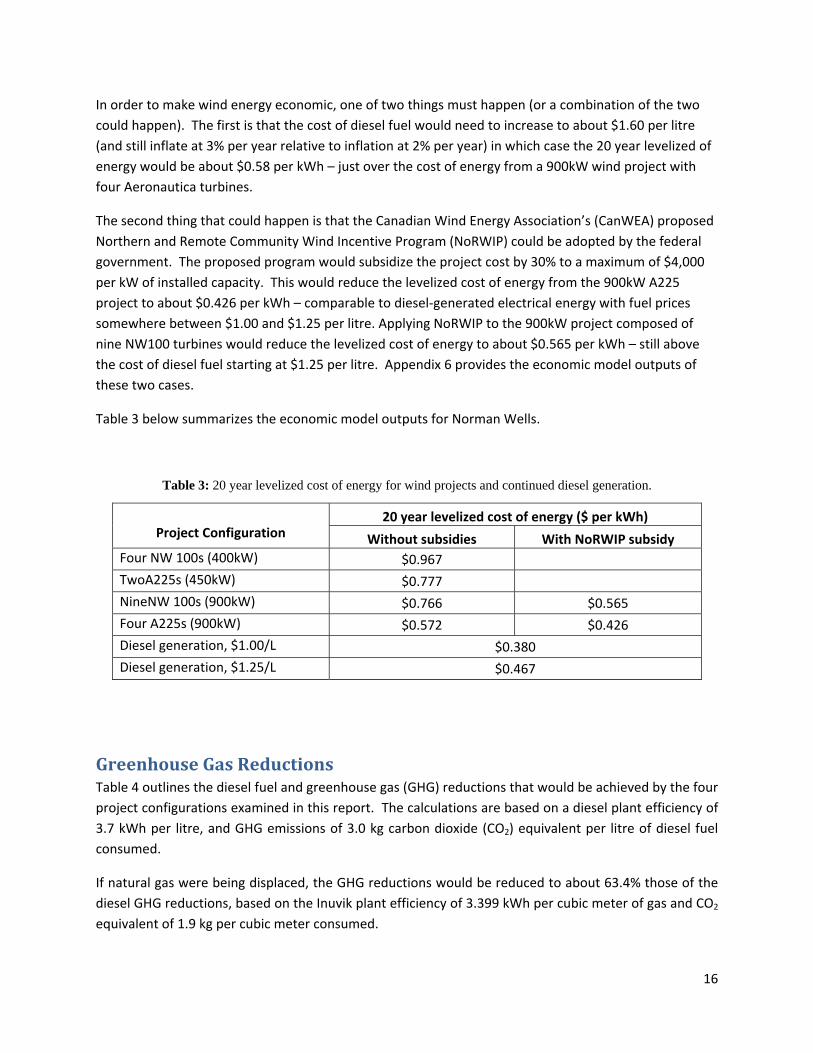
Table 3 below summarizes the economic model outputs for Norman Wells.
Table 3: 20 year levelized cost of energy for wind projects and continued diesel generation.
Project Configuration 20 year levelized cost of energy ($ per kWh)
Without subsidies With NoRWIP subsidy
Four NW 100s (400kW) $0.967
TwoA225s (450kW) $0.777
NineNW 100s (900kW) $0.766 $0.565
Four A225s (900kW) $0.572 $0.426
Diesel generation, $1.00/L $0.380
Diesel generation, $1.25/L $0.467
GreenhouseGasReductionsTable 4 outlines the diesel fuel and greenhouse gas (GHG) reductions that would be achieved by the four
project configurations examined in this report. The calculations are based on a diesel plant efficiency of
3.7 kWh per litre, and GHG emissions of 3.0 kg carbon dioxide (CO2) equivalent per litre of diesel fuel
consumed.
If natural gas were being displaced, the GHG reductions would be reduced to about 63.4% those of the
diesel GHG reductions, based on the Inuvik plant efficiency of 3.399 kWh per cubic meter of gas and CO2
equivalent of 1.9 kg per cubic meter consumed.

17
Table 4: Annual GHG reductions from modelled wind projects.
Project Configuration Diesel Electricity
Displaced (kWh)
Diesel Fuel Saved
(L)
GHG Reductions
(kg CO2 equivalent)
Four NW100s 525,129 141,927 425,780
TwoA225s 666,537 180,145 540,435
Nine NW100s 1,181,539 319,335 958,005
Four A225s 1,315,409 355,516 1,066,548
Conclusions1. Kee Scarp has potential as a wind development site. It is within 5 km of the community and has
road access via a 6‐km of all‐weather road and 4X4/ATV trails.
2. Based on two years of site monitoring correlated to local airport and local weather balloon data as well as on site wind monitoring over two years, the long term annual average wind speed at 37m AGL at Kee Scarp is calculated to be 4.9 m/s and at 50m AGL is calculated to be 5.5 m/s.
3. The present NTPC diesel plant serves as a back‐up plant as more than 99% of the approximate 10,000 MWh annual load (residential, general service, and streetlights) is served by gas generated power purchased from Imperial Oil’s 13 MW gas power plant (at a price tied to diesel fuel cost). The gas power plant also serves an industrial load. The peak NTPC load is 1.700 MW, the average load is 1.124 MW (65.1% load factor) and the minimum load is estimated by the authors to be about 600 kW.
4. The available information indicates that the gas supply is limited and may be running low, while the population and NTPC power loads are forecasted to grow. The 2007/8 NTPC actual load information was used in this study. This project did not consider NTPC’s power load growth beyond this or industrial loads in the calculations.
5. Costs for 400 kW (four NW100s) and the 450 kW (two A225s) wind projects were estimated to be about $4.751 million ($11,877 per kW) and $4.240 million ($9,423 per kW), respectively. The costs for the 900 kW projects were estimated to be $8.284 million or $9,205 per kW (nine NW100s), and $6.686 million or $7,429 per kW (four A225s).
6. Projects of 400/450 kW would produce power at a cost of $0.967per kWh (400 kW with four NW100s) and $0.777 per kWh (450kW with two A225s). The 900kW project with nine NW100s would produce power at $0.766 per kWh and the 900kW project of four A225s would produce power at $0.572 per kWh. No subsidies were assumed in these calculations.
7. Both wind project size and tower height are very important factors in the cost of wind energy with larger projects and taller turbine towers resulting in lower costs for wind energy.

18
8. Diesel generation over twenty years would have a levelized cost of $0.380 per kWh with diesel fuel starting at $1.00 per litre and $0.467 per kWh with diesel fuel starting at $1.25 per litre.
9. The proposed NoRWIP subsidies of up to 30% of capital cost or to a maximum of $4,000 per kW installed would reduce the energy costs from a 900kW project to $0.426 per kWh if A225 turbines are used and to $0.565 per kWh if NW 100 turbines are used. A 900kW A225 wind project would thus be competitive with diesel generation when diesel fuel is between $1.00 and $1.25 per litre.
10. Diesel generation with fuel costing about $1.60 per litre would cost about the same as an unsubsidized 900 kW wind project using A225 turbines.
11. GHG reductions on an annual basis would range from over 425 tonnes per year to over 540 tonnes of CO2 equivalent for the 400/450kW wind project and over 958 tonnes to over 1,066 tonnes of CO2 equivalent per year for the 900kW wind project.
NextSteps1. A preliminary review of the land tenure at Kee Scarp should take place to confirm if the site could be
available for development.
2. Discussions should be initiated with Imperial Oil and NTPC to determine with greater certainty the situation with respect to gas availability and future power loads.
3. Seek out funding that may be available from Indian and North Affairs to carry out more detailed studies and to seek permitting that will advance this potential wind project. Funding may also be available from the GNWT to aid the feasibility work.
4. If the CanWEA’s NoRWIP proposal is adopted by the federal government, a 900kW or larger wind farm may become economic. A detailed feasibility study should be carried out if this transpires and if there is a desire to do a wind project in Norman Wells. Particular attention would be required to minimize the capital costs of such a project and to find the most appropriate size wind turbines with towers as tall as possible.
ReferencePinard, J.P., and J.F. Maissan, 2008. Norman Wells Wind Energy Pre‐feasibility Report. Prepared for the
Aurora Research Institute, Inuvik, NT.
Pinard, J.P., 2010. Progress Report on the Norman Wells Wind Monitoring.Prepared for the Aurora
Research Institute, Inuvik, NT.

Appendix 1
19

20

21

22

23
24

25
26

27
Appendix 2
Norman Wells diesel displacing wind energy based on HOMER modelling
Project configurationHOMER
generation kWh
Availability 95%
Electrical & other 10%
Net generation
HOMER surplus energy kWh
AvailabilityElectrical & other losses
Net surplus Diesel displaced kWh
4 NorthWind 100 617,799 30,890 61,780 525,129 216 0 216 0 525,129
2 Aeronautica 225 784,161 39,208 78,416 666,537 400 0 400 0 666,537
9 NorthWind 100 1,390,046 69,502 139,005 1,181,539 43,656 17,376 26,280 0 1,181,539
4 Aeronautica 225 1,568,322 78,416 156,832 1,333,074 68,635 19,604 31,366 17,665 1,315,409
Assumptions in reductions of surplusFor 4 Northwind 100s 1 The very small amount of surplus energy would be consumed by electrical & other lossesFor 2 Aeronautica 225s 1 The very small amount of surplus energy would be consumed by electrical & other lossesFor 9 Northwind 100s 1 Non‐coincident downtime reduces surplus to 25% of indicated value
2 One fifth of losses are systematic like electrical that occur during high output reducing surplus differentiallyFor 4 Aeronautica 225s 1 Non‐coincident downtime reduces surplus to 25% of indicated value
2 One fifth of losses are systematic like electrical that occur during high output reducing surplus differentially
Losses from generation Reductions in surplus
Norman Wells wind project calculation of net diesel displaced from HOMER model output
Minimum diesel plant load 216 kW (30% of 720 kW smallest generator), wind speed 4.9 m/s @ 37m AGL and 5.5 m/s @ 50m AGL
Page 1 of 1 28

Appendix 3
Norman Wells wind project capital costs
low penetration low penetration medium penetration medium penetration
Cost category 4 NW100 turbines 2 A225 turbines 9 NW100 turbines 4 A225 turbines
Project Design & Mgmtproject design $50,000 $50,000 $75,000 $75,000environmental assessment & permitting $25,000 $25,000 $35,000 $35,000project management $50,000 $50,000 $75,000 $75,000
Site Preparationroad construction ($150,000/km) 10 rotor dia/turbine $13,000 $9,000 $29,000 $18,000road upgrading ($50,000 per km), 1.5 km $75,000 $75,000 $75,000 $75,000site and crane pad construction $15,000/turbine $60,000 $30,000 $135,000 $60,000powerline construction ($200,000 per km), 4.5km $900,000 $900,000 $900,000 $900,000turbine power collection ($400/m) 10 rotor dia/turbine $34,000 $24,000 $76,000 $48,000
Wind Equipment Purchasewind turbines + towers+ SCADA $1,436,000 $1,218,000 $3,060,000 $2,316,000shipping to Hay River $170,000 $170,000 $370,000 $330,000shipping Hay River to Norman Wells $58,000 $56,000 $128,000 $108,000transformers $75,000 $75,000 $125,000 $125,000
Installationgeotehnical $60,000 first + $10k/turbine max +30k $90,000 $70,000 $90,000 $90,000foundation design $50,000 first + $10k/turbine max +30k $80,000 $60,000 $80,000 $80,000foundation installation $400,000 $250,000 $900,000 $500,000crane mob & demob $100,000 $150,000 $100,000 $150,000crane on site $40,000 $30,000 $90,000 $60,000equipment rental $40,000 $40,000 $60,000 $60,000control buildings $25,000 $25,000 $25,000 $25,000utility interconnection $50,000 $50,000 $75,000 $75,000commissioning $80,000 $40,000 $205,000 $105,000labour - assembly & supervision $110,000 $100,000 $235,000 $180,000travel and accommodation $50,000 $50,000 $75,000 $75,000
Diesel Plant Modificationshigh speed comm. & controller $50,000 $50,000 $50,000 $50,000dump load $50,000 $50,000plant modifications $50,000 $50,000 $100,000 $100,000
Otherinitial spare parts $10,000 $10,000 $20,000 $20,000Insurance $25,000 $25,000 $50,000 $50,000other overhead costs (contracts etc) $50,000 $50,000 $75,000 $75,000
SUBTOTAL CONSTRUCTION $4,196,000 $3,732,000 $7,363,000 $5,910,000
Contingency 10% $419,600 $373,200 $736,300 $591,000
TOTAL CONSTRUCTION $4,615,600 $4,105,200 $8,099,300 $6,501,000
Owners Costsmanage project organization $50,000 $50,000 $75,000 $75,000negotiate agreements $50,000 $50,000 $75,000 $75,000staff training $35,000 $35,000 $35,000 $35,000
TOTAL OWNERS' COSTS $135,000 $135,000 $185,000 $185,000
TOTAL PROJECT COST $4,750,600 $4,240,200 $8,284,300 $6,686,000
Installed capacity kW 400 450 900 900
Installed cost per kW $11,877 $9,423 $9,205 $7,429
Annual O&M costs $45,000 $50,000 $95,000 $95,000
NW100 base cost CDN$377,000 each 5% discount for 4 $359,000 rounded up to next 00010% discount for 9 $340,000
Aeronautica 225 base cost CDN$609,000 each no discount for 2 $609,000 rounded up to next 0005% discount for 4 $579,000
Shipping to Hay River NW100 $50,000 first, $40,000 each subsequentA225 $90,000 first, $80,000 each subsequent
Shipping Hay River to Norman Wells NW100 $16,000 first, $14,000 each subsequent estimates based on 2010 NTCL rates & repacking A225 $30,000 first, $26,000 each subsequent
Norman Wells Project Capital Costs
Project location: Kee Scarp
Page 1 of 1
29
Appendix 4
Norman Wells 400kW wind project of four Northwind 100 turbines
Capital cost $4,750,600 Capacity 400 kW Fixed O&M $45,000 per year Discount rate 5.39%Cost of capital 7.50% Debt & equity Annual Energy 525,129 kWh Variable O&M per kWh
Inflation 2.00% per year Project life 20 Years Capacity factor
Year Capital Cost of Cap Depreciation Fixed O&M Variable O&M Total Ann cost Ann energy Cost per kWh Discounted costDiscounted energy
Discounted cost per kWh
1 $4,750,600 $356,295 $237,530 $45,000 $0 $638,825 525,129 $1.217 $638,825 525,129 $1.2172 $4,513,070 $338,480 $237,530 $45,900 $0 $621,910 525,129 $1.184 $590,092 498,262 $1.1843 $4,275,540 $320,666 $237,530 $46,818 $0 $605,014 525,129 $1.152 $544,689 472,769 $1.1524 $4,038,010 $302,851 $237,530 $47,754 $0 $588,135 525,129 $1.120 $502,403 448,581 $1.1205 $3,800,480 $285,036 $237,530 $48,709 $0 $571,275 525,129 $1.088 $463,033 425,631 $1.0886 $3,562,950 $267,221 $237,530 $49,684 $0 $554,435 525,129 $1.056 $426,392 403,854 $1.0567 $3,325,420 $249,407 $237,530 $50,677 $0 $537,614 525,129 $1.024 $392,302 383,192 $1.0248 $3,087,890 $231,592 $237,530 $51,691 $0 $520,813 525,129 $0.992 $360,598 363,587 $0.9929 $2,850,360 $213,777 $237,530 $52,725 $0 $504,032 525,129 $0.960 $331,125 344,985 $0.96010 $2,612,830 $195,962 $237,530 $53,779 $0 $487,271 525,129 $0.928 $303,736 327,334 $0.92811 $2,375,300 $178,148 $237,530 $54,855 $0 $470,532 525,129 $0.896 $278,296 310,587 $0.89612 $2,137,770 $160,333 $237,530 $55,952 $0 $453,815 525,129 $0.864 $254,676 294,696 $0.86413 $1,900,240 $142,518 $237,530 $57,071 $0 $437,119 525,129 $0.832 $232,756 279,619 $0.83214 $1,662,710 $124,703 $237,530 $58,212 $0 $420,446 525,129 $0.801 $212,423 265,313 $0.80115 $1,425,180 $106,889 $237,530 $59,377 $0 $403,795 525,129 $0.769 $193,573 251,739 $0.76916 $1,187,650 $89,074 $237,530 $60,564 $0 $387,168 525,129 $0.737 $176,106 238,859 $0.73717 $950,120 $71,259 $237,530 $61,775 $0 $370,564 525,129 $0.706 $159,930 226,638 $0.70618 $712,590 $53,444 $237,530 $63,011 $0 $353,985 525,129 $0.674 $144,959 215,043 $0.67419 $475,060 $35,630 $237,530 $64,271 $0 $337,431 525,129 $0.643 $131,110 204,041 $0.64320 $237,530 $17,815 $237,530 $65,557 $0 $320,901 525,129 $0.611 $118,308 193,601 $0.611
$6,455,331 6,673,459 $0.967
Real levelized cost of energy $0.967
Leading Edge Projects Generation LCOE Economic Model
Project: Norman Wells 4 NorthWind 100 wind turbines
Page 1 of 4 30
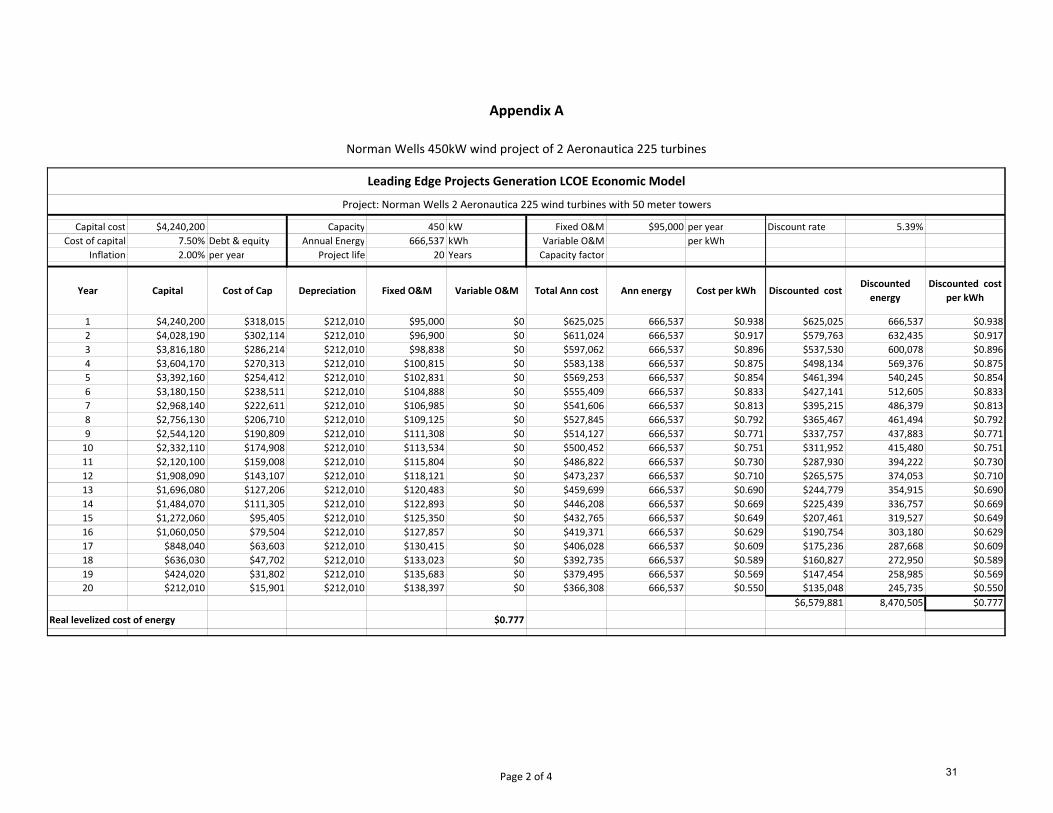
Appendix A
Norman Wells 450kW wind project of 2 Aeronautica 225 turbines
Capital cost $4,240,200 Capacity 450 kW Fixed O&M $95,000 per year Discount rate 5.39%Cost of capital 7.50% Debt & equity Annual Energy 666,537 kWh Variable O&M per kWh
Inflation 2.00% per year Project life 20 Years Capacity factor
Year Capital Cost of Cap Depreciation Fixed O&M Variable O&M Total Ann cost Ann energy Cost per kWh Discounted costDiscounted energy
Discounted cost per kWh
1 $4,240,200 $318,015 $212,010 $95,000 $0 $625,025 666,537 $0.938 $625,025 666,537 $0.9382 $4,028,190 $302,114 $212,010 $96,900 $0 $611,024 666,537 $0.917 $579,763 632,435 $0.9173 $3,816,180 $286,214 $212,010 $98,838 $0 $597,062 666,537 $0.896 $537,530 600,078 $0.8964 $3,604,170 $270,313 $212,010 $100,815 $0 $583,138 666,537 $0.875 $498,134 569,376 $0.8755 $3,392,160 $254,412 $212,010 $102,831 $0 $569,253 666,537 $0.854 $461,394 540,245 $0.8546 $3,180,150 $238,511 $212,010 $104,888 $0 $555,409 666,537 $0.833 $427,141 512,605 $0.8337 $2,968,140 $222,611 $212,010 $106,985 $0 $541,606 666,537 $0.813 $395,215 486,379 $0.8138 $2,756,130 $206,710 $212,010 $109,125 $0 $527,845 666,537 $0.792 $365,467 461,494 $0.7929 $2,544,120 $190,809 $212,010 $111,308 $0 $514,127 666,537 $0.771 $337,757 437,883 $0.77110 $2,332,110 $174,908 $212,010 $113,534 $0 $500,452 666,537 $0.751 $311,952 415,480 $0.75111 $2,120,100 $159,008 $212,010 $115,804 $0 $486,822 666,537 $0.730 $287,930 394,222 $0.73012 $1,908,090 $143,107 $212,010 $118,121 $0 $473,237 666,537 $0.710 $265,575 374,053 $0.71013 $1,696,080 $127,206 $212,010 $120,483 $0 $459,699 666,537 $0.690 $244,779 354,915 $0.69014 $1,484,070 $111,305 $212,010 $122,893 $0 $446,208 666,537 $0.669 $225,439 336,757 $0.66915 $1,272,060 $95,405 $212,010 $125,350 $0 $432,765 666,537 $0.649 $207,461 319,527 $0.64916 $1,060,050 $79,504 $212,010 $127,857 $0 $419,371 666,537 $0.629 $190,754 303,180 $0.62917 $848,040 $63,603 $212,010 $130,415 $0 $406,028 666,537 $0.609 $175,236 287,668 $0.60918 $636,030 $47,702 $212,010 $133,023 $0 $392,735 666,537 $0.589 $160,827 272,950 $0.58919 $424,020 $31,802 $212,010 $135,683 $0 $379,495 666,537 $0.569 $147,454 258,985 $0.56920 $212,010 $15,901 $212,010 $138,397 $0 $366,308 666,537 $0.550 $135,048 245,735 $0.550
$6,579,881 8,470,505 $0.777
Real levelized cost of energy $0.777
Leading Edge Projects Generation LCOE Economic Model
Project: Norman Wells 2 Aeronautica 225 wind turbines with 50 meter towers
Page 2 of 4 31
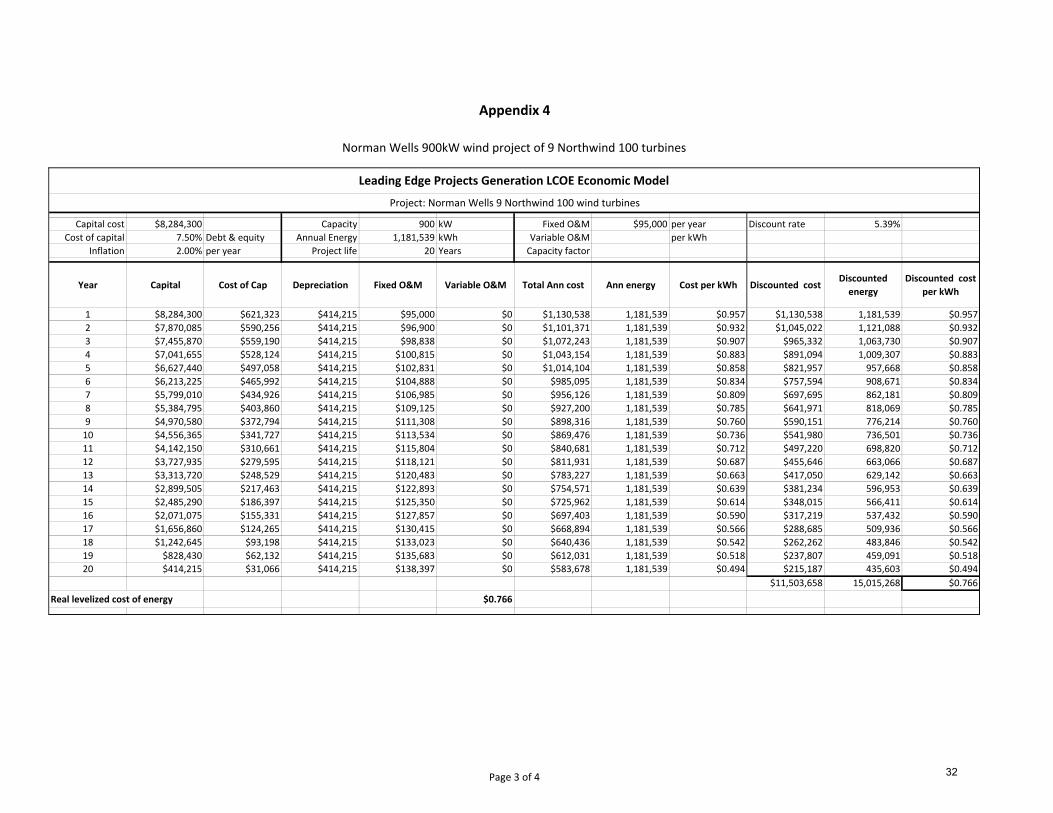
Appendix 4
Norman Wells 900kW wind project of 9 Northwind 100 turbines
Capital cost $8,284,300 Capacity 900 kW Fixed O&M $95,000 per year Discount rate 5.39%Cost of capital 7.50% Debt & equity Annual Energy 1,181,539 kWh Variable O&M per kWh
Inflation 2.00% per year Project life 20 Years Capacity factor
Year Capital Cost of Cap Depreciation Fixed O&M Variable O&M Total Ann cost Ann energy Cost per kWh Discounted costDiscounted energy
Discounted cost per kWh
1 $8,284,300 $621,323 $414,215 $95,000 $0 $1,130,538 1,181,539 $0.957 $1,130,538 1,181,539 $0.9572 $7,870,085 $590,256 $414,215 $96,900 $0 $1,101,371 1,181,539 $0.932 $1,045,022 1,121,088 $0.9323 $7,455,870 $559,190 $414,215 $98,838 $0 $1,072,243 1,181,539 $0.907 $965,332 1,063,730 $0.9074 $7,041,655 $528,124 $414,215 $100,815 $0 $1,043,154 1,181,539 $0.883 $891,094 1,009,307 $0.8835 $6,627,440 $497,058 $414,215 $102,831 $0 $1,014,104 1,181,539 $0.858 $821,957 957,668 $0.8586 $6,213,225 $465,992 $414,215 $104,888 $0 $985,095 1,181,539 $0.834 $757,594 908,671 $0.8347 $5,799,010 $434,926 $414,215 $106,985 $0 $956,126 1,181,539 $0.809 $697,695 862,181 $0.8098 $5,384,795 $403,860 $414,215 $109,125 $0 $927,200 1,181,539 $0.785 $641,971 818,069 $0.7859 $4,970,580 $372,794 $414,215 $111,308 $0 $898,316 1,181,539 $0.760 $590,151 776,214 $0.76010 $4,556,365 $341,727 $414,215 $113,534 $0 $869,476 1,181,539 $0.736 $541,980 736,501 $0.73611 $4,142,150 $310,661 $414,215 $115,804 $0 $840,681 1,181,539 $0.712 $497,220 698,820 $0.71212 $3,727,935 $279,595 $414,215 $118,121 $0 $811,931 1,181,539 $0.687 $455,646 663,066 $0.68713 $3,313,720 $248,529 $414,215 $120,483 $0 $783,227 1,181,539 $0.663 $417,050 629,142 $0.66314 $2,899,505 $217,463 $414,215 $122,893 $0 $754,571 1,181,539 $0.639 $381,234 596,953 $0.63915 $2,485,290 $186,397 $414,215 $125,350 $0 $725,962 1,181,539 $0.614 $348,015 566,411 $0.61416 $2,071,075 $155,331 $414,215 $127,857 $0 $697,403 1,181,539 $0.590 $317,219 537,432 $0.59017 $1,656,860 $124,265 $414,215 $130,415 $0 $668,894 1,181,539 $0.566 $288,685 509,936 $0.56618 $1,242,645 $93,198 $414,215 $133,023 $0 $640,436 1,181,539 $0.542 $262,262 483,846 $0.54219 $828,430 $62,132 $414,215 $135,683 $0 $612,031 1,181,539 $0.518 $237,807 459,091 $0.51820 $414,215 $31,066 $414,215 $138,397 $0 $583,678 1,181,539 $0.494 $215,187 435,603 $0.494
$11,503,658 15,015,268 $0.766
Real levelized cost of energy $0.766
Leading Edge Projects Generation LCOE Economic Model
Project: Norman Wells 9 Northwind 100 wind turbines
Page 3 of 4 32

Appendix 4
Norman Wells 900kW wind project of 4 Aeronautica 225 turbines
Capital cost $6,686,000 Capacity 900 kW Fixed O&M $95,000 per year Discount rate 5.39%Cost of capital 7.50% Debt & equity Annual Energy 1,315,409 kWh Variable O&M per kWh
Inflation 2.00% per year Project life 20 Years Capacity factor
Year Capital Cost of Cap Depreciation Fixed O&M Variable O&M Total Ann cost Ann energy Cost per kWh Discounted costDiscounted energy
Discounted cost per kWh
1 $6,686,000 $501,450 $334,300 $95,000 $0 $930,750 1,315,409 $0.708 $930,750 1,315,409 $0.7082 $6,351,700 $476,378 $334,300 $96,900 $0 $907,578 1,315,409 $0.690 $861,143 1,248,109 $0.6903 $6,017,400 $451,305 $334,300 $98,838 $0 $884,443 1,315,409 $0.672 $796,257 1,184,252 $0.6724 $5,683,100 $426,233 $334,300 $100,815 $0 $861,347 1,315,409 $0.655 $735,789 1,123,663 $0.6555 $5,348,800 $401,160 $334,300 $102,831 $0 $838,291 1,315,409 $0.637 $679,457 1,066,173 $0.6376 $5,014,500 $376,088 $334,300 $104,888 $0 $815,275 1,315,409 $0.620 $626,993 1,011,625 $0.6207 $4,680,200 $351,015 $334,300 $106,985 $0 $792,300 1,315,409 $0.602 $578,149 959,867 $0.6028 $4,345,900 $325,943 $334,300 $109,125 $0 $769,368 1,315,409 $0.585 $532,692 910,758 $0.5859 $4,011,600 $300,870 $334,300 $111,308 $0 $746,478 1,315,409 $0.567 $490,400 864,161 $0.56710 $3,677,300 $275,798 $334,300 $113,534 $0 $723,631 1,315,409 $0.550 $451,069 819,948 $0.55011 $3,343,000 $250,725 $334,300 $115,804 $0 $700,829 1,315,409 $0.533 $414,505 777,997 $0.53312 $3,008,700 $225,653 $334,300 $118,121 $0 $678,073 1,315,409 $0.515 $380,527 738,192 $0.51513 $2,674,400 $200,580 $334,300 $120,483 $0 $655,363 1,315,409 $0.498 $348,965 700,424 $0.49814 $2,340,100 $175,508 $334,300 $122,893 $0 $632,700 1,315,409 $0.481 $319,661 664,589 $0.48115 $2,005,800 $150,435 $334,300 $125,350 $0 $610,085 1,315,409 $0.464 $292,465 630,587 $0.46416 $1,671,500 $125,363 $334,300 $127,857 $0 $587,520 1,315,409 $0.447 $267,238 598,324 $0.44717 $1,337,200 $100,290 $334,300 $130,415 $0 $565,005 1,315,409 $0.430 $243,848 567,712 $0.43018 $1,002,900 $75,218 $334,300 $133,023 $0 $542,540 1,315,409 $0.412 $222,173 538,666 $0.41219 $668,600 $50,145 $334,300 $135,683 $0 $520,128 1,315,409 $0.395 $202,098 511,107 $0.39520 $334,300 $25,073 $334,300 $138,397 $0 $497,770 1,315,409 $0.378 $183,515 484,957 $0.378
$9,557,694 16,716,518 $0.572
Real levelized cost of energy $0.572
Leading Edge Projects Generation LCOE Economic Model
Project: Norman Wells 4 Aeronautica 225 wind turbines with 50 meter towers
Page 4 of 4 33

Appendix 5
Norman Wells diesel generation with diesel fuel starting at $1.00 per litre
Capital cost $0 Capacity kW Fixed O&M $30,000 per year Discount rate 5.39%Cost of capital 7.50% Debt & equity Annual Energy 1,000,000 kWh Fuel $0.270 per kWh
Inflation 2.00% per year Project life 20 Years Capacity factor Fuel inflation 3.00%
Year Capital Cost of Cap Depreciation Fixed O&M Variable O&M Total Ann cost Ann energy Cost per kWh Discounted costDiscounted energy
Discounted cost per kWh
1 $0 $0 $0 $30,000 $270,000 $300,000 1,000,000 $0.300 $300,000 1,000,000 $0.3002 $0 $0 $0 $30,600 $278,100 $308,700 1,000,000 $0.309 $292,906 948,837 $0.3093 $0 $0 $0 $31,212 $286,443 $317,655 1,000,000 $0.318 $285,982 900,292 $0.3184 $0 $0 $0 $31,836 $295,036 $326,873 1,000,000 $0.327 $279,225 854,231 $0.3275 $0 $0 $0 $32,473 $303,887 $336,360 1,000,000 $0.336 $272,629 810,526 $0.3366 $0 $0 $0 $33,122 $313,004 $346,126 1,000,000 $0.346 $266,191 769,057 $0.3467 $0 $0 $0 $33,785 $322,394 $356,179 1,000,000 $0.356 $259,907 729,710 $0.3568 $0 $0 $0 $34,461 $332,066 $366,527 1,000,000 $0.367 $253,774 692,376 $0.3679 $0 $0 $0 $35,150 $342,028 $377,178 1,000,000 $0.377 $247,788 656,952 $0.37710 $0 $0 $0 $35,853 $352,289 $388,142 1,000,000 $0.388 $241,944 623,341 $0.38811 $0 $0 $0 $36,570 $362,857 $399,427 1,000,000 $0.399 $236,241 591,449 $0.39912 $0 $0 $0 $37,301 $373,743 $411,044 1,000,000 $0.411 $230,673 561,189 $0.41113 $0 $0 $0 $38,047 $384,955 $423,003 1,000,000 $0.423 $225,239 532,477 $0.42314 $0 $0 $0 $38,808 $396,504 $435,312 1,000,000 $0.435 $219,934 505,234 $0.43515 $0 $0 $0 $39,584 $408,399 $447,984 1,000,000 $0.448 $214,756 479,384 $0.44816 $0 $0 $0 $40,376 $420,651 $461,027 1,000,000 $0.461 $209,702 454,858 $0.46117 $0 $0 $0 $41,184 $433,271 $474,454 1,000,000 $0.474 $204,768 431,586 $0.47418 $0 $0 $0 $42,007 $446,269 $488,276 1,000,000 $0.488 $199,951 409,505 $0.48819 $0 $0 $0 $42,847 $459,657 $502,504 1,000,000 $0.503 $195,250 388,553 $0.50320 $0 $0 $0 $43,704 $473,447 $517,151 1,000,000 $0.517 $190,660 368,674 $0.517
$4,827,521 12,708,229 $0.380
Real levelized cost of energy $0.380
Leading Edge Projects Generation LCOE Economic Model
Project: Norman Wells incremental diesel generation, 3.7 kWh per litre, fuel at $1.00 per litre, fuel inflation at 3% per year, variable O&M $0.03 per kWh
Page 1 of 2 34
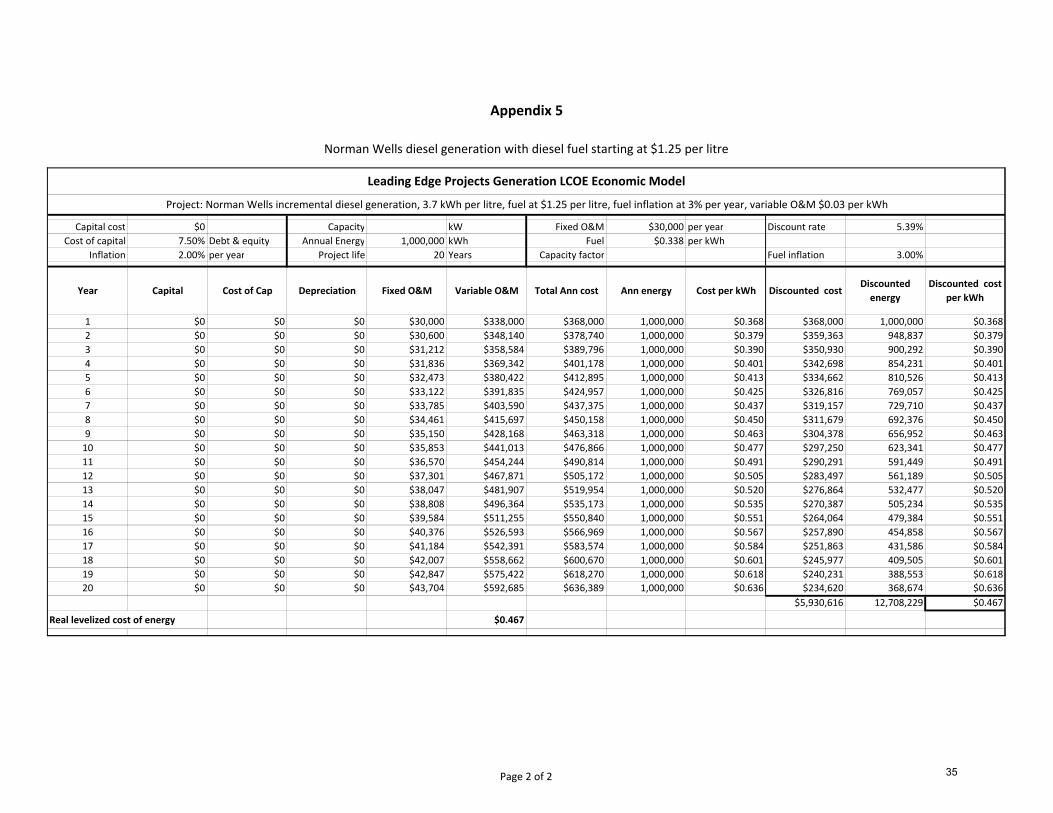
Appendix 5
Norman Wells diesel generation with diesel fuel starting at $1.25 per litre
Capital cost $0 Capacity kW Fixed O&M $30,000 per year Discount rate 5.39%Cost of capital 7.50% Debt & equity Annual Energy 1,000,000 kWh Fuel $0.338 per kWh
Inflation 2.00% per year Project life 20 Years Capacity factor Fuel inflation 3.00%
Year Capital Cost of Cap Depreciation Fixed O&M Variable O&M Total Ann cost Ann energy Cost per kWh Discounted costDiscounted energy
Discounted cost per kWh
1 $0 $0 $0 $30,000 $338,000 $368,000 1,000,000 $0.368 $368,000 1,000,000 $0.3682 $0 $0 $0 $30,600 $348,140 $378,740 1,000,000 $0.379 $359,363 948,837 $0.3793 $0 $0 $0 $31,212 $358,584 $389,796 1,000,000 $0.390 $350,930 900,292 $0.3904 $0 $0 $0 $31,836 $369,342 $401,178 1,000,000 $0.401 $342,698 854,231 $0.4015 $0 $0 $0 $32,473 $380,422 $412,895 1,000,000 $0.413 $334,662 810,526 $0.4136 $0 $0 $0 $33,122 $391,835 $424,957 1,000,000 $0.425 $326,816 769,057 $0.4257 $0 $0 $0 $33,785 $403,590 $437,375 1,000,000 $0.437 $319,157 729,710 $0.4378 $0 $0 $0 $34,461 $415,697 $450,158 1,000,000 $0.450 $311,679 692,376 $0.4509 $0 $0 $0 $35,150 $428,168 $463,318 1,000,000 $0.463 $304,378 656,952 $0.46310 $0 $0 $0 $35,853 $441,013 $476,866 1,000,000 $0.477 $297,250 623,341 $0.47711 $0 $0 $0 $36,570 $454,244 $490,814 1,000,000 $0.491 $290,291 591,449 $0.49112 $0 $0 $0 $37,301 $467,871 $505,172 1,000,000 $0.505 $283,497 561,189 $0.50513 $0 $0 $0 $38,047 $481,907 $519,954 1,000,000 $0.520 $276,864 532,477 $0.52014 $0 $0 $0 $38,808 $496,364 $535,173 1,000,000 $0.535 $270,387 505,234 $0.53515 $0 $0 $0 $39,584 $511,255 $550,840 1,000,000 $0.551 $264,064 479,384 $0.55116 $0 $0 $0 $40,376 $526,593 $566,969 1,000,000 $0.567 $257,890 454,858 $0.56717 $0 $0 $0 $41,184 $542,391 $583,574 1,000,000 $0.584 $251,863 431,586 $0.58418 $0 $0 $0 $42,007 $558,662 $600,670 1,000,000 $0.601 $245,977 409,505 $0.60119 $0 $0 $0 $42,847 $575,422 $618,270 1,000,000 $0.618 $240,231 388,553 $0.61820 $0 $0 $0 $43,704 $592,685 $636,389 1,000,000 $0.636 $234,620 368,674 $0.636
$5,930,616 12,708,229 $0.467
Real levelized cost of energy $0.467
Leading Edge Projects Generation LCOE Economic Model
Project: Norman Wells incremental diesel generation, 3.7 kWh per litre, fuel at $1.25 per litre, fuel inflation at 3% per year, variable O&M $0.03 per kWh
Page 2 of 2 35

Appendix 6
Norman Wells 900kW wind project of 9 Northwind 100 turbines and NoRWIP subsidy
225g6Capital cost $5,799,010 Capacity 900 kW Fixed O&M $95,000 per year Discount rate 5.39%
Cost of capital 7.50% Debt & equity Annual Energy 1,181,539 kWh Variable O&M per kWhInflation 2.00% per year Project life 20 Years Capacity factor
Year Capital Cost of Cap Depreciation Fixed O&M Variable O&M Total Ann cost Ann energy Cost per kWh Discounted costDiscounted energy
Discounted cost per kWh
1 $5,799,010 $434,926 $289,951 $95,000 $0 $819,876 1,181,539 $0.694 $819,876 1,181,539 $0.6942 $5,509,060 $413,179 $289,951 $96,900 $0 $800,030 1,181,539 $0.677 $759,098 1,121,088 $0.6773 $5,219,109 $391,433 $289,951 $98,838 $0 $780,222 1,181,539 $0.660 $702,427 1,063,730 $0.6604 $4,929,159 $369,687 $289,951 $100,815 $0 $760,452 1,181,539 $0.644 $649,601 1,009,307 $0.6445 $4,639,208 $347,941 $289,951 $102,831 $0 $740,722 1,181,539 $0.627 $600,374 957,668 $0.6276 $4,349,258 $326,194 $289,951 $104,888 $0 $721,032 1,181,539 $0.610 $554,515 908,671 $0.6107 $4,059,307 $304,448 $289,951 $106,985 $0 $701,384 1,181,539 $0.594 $511,807 862,181 $0.5948 $3,769,357 $282,702 $289,951 $109,125 $0 $681,777 1,181,539 $0.577 $472,046 818,069 $0.5779 $3,479,406 $260,955 $289,951 $111,308 $0 $662,214 1,181,539 $0.560 $435,043 776,214 $0.56010 $3,189,456 $239,209 $289,951 $113,534 $0 $642,693 1,181,539 $0.544 $400,617 736,501 $0.54411 $2,899,505 $217,463 $289,951 $115,804 $0 $623,218 1,181,539 $0.527 $368,601 698,820 $0.52712 $2,609,555 $195,717 $289,951 $118,121 $0 $603,788 1,181,539 $0.511 $338,839 663,066 $0.51113 $2,319,604 $173,970 $289,951 $120,483 $0 $584,404 1,181,539 $0.495 $311,181 629,142 $0.49514 $2,029,654 $152,224 $289,951 $122,893 $0 $565,067 1,181,539 $0.478 $285,491 596,953 $0.47815 $1,739,703 $130,478 $289,951 $125,350 $0 $545,779 1,181,539 $0.462 $261,638 566,411 $0.46216 $1,449,753 $108,731 $289,951 $127,857 $0 $526,539 1,181,539 $0.446 $239,501 537,432 $0.44617 $1,159,802 $86,985 $289,951 $130,415 $0 $507,350 1,181,539 $0.429 $218,965 509,936 $0.42918 $869,852 $65,239 $289,951 $133,023 $0 $488,212 1,181,539 $0.413 $199,925 483,846 $0.41319 $579,901 $43,493 $289,951 $135,683 $0 $469,126 1,181,539 $0.397 $182,281 459,091 $0.39720 $289,951 $21,746 $289,951 $138,397 $0 $450,094 1,181,539 $0.381 $165,938 435,603 $0.381
$8,477,765 15,015,268 $0.565
Real levelized cost of energy $0.565
Leading Edge Projects Generation LCOE Economic Model
Project: Norman Wells 9 NorthWind 100 wind turbines, with NoRWIP at 30% ($2,485,290)
Page 1 of 2 36

Appendix 6
Norman Wells 900kW wind project of 4 Aeronautica turbines and NoRWIP subsidy
Capital cost $4,680,200 Capacity 900 kW Fixed O&M $95,000 per year Discount rate 5.39%Cost of capital 7.50% Debt & equity Annual Energy 1,315,409 kWh Variable O&M per kWh
Inflation 2.00% per year Project life 20 Years Capacity factor
Year Capital Cost of Cap Depreciation Fixed O&M Variable O&M Total Ann cost Ann energy Cost per kWh Discounted costDiscounted energy
Discounted cost per kWh
1 $4,680,200 $351,015 $234,010 $95,000 $0 $680,025 1,315,409 $0.517 $680,025 1,315,409 $0.5172 $4,446,190 $333,464 $234,010 $96,900 $0 $664,374 1,315,409 $0.505 $630,383 1,248,109 $0.5053 $4,212,180 $315,914 $234,010 $98,838 $0 $648,762 1,315,409 $0.493 $584,075 1,184,252 $0.4934 $3,978,170 $298,363 $234,010 $100,815 $0 $633,188 1,315,409 $0.481 $540,888 1,123,663 $0.4815 $3,744,160 $280,812 $234,010 $102,831 $0 $617,653 1,315,409 $0.470 $500,624 1,066,173 $0.4706 $3,510,150 $263,261 $234,010 $104,888 $0 $602,159 1,315,409 $0.458 $463,095 1,011,625 $0.4587 $3,276,140 $245,711 $234,010 $106,985 $0 $586,706 1,315,409 $0.446 $428,125 959,867 $0.4468 $3,042,130 $228,160 $234,010 $109,125 $0 $571,295 1,315,409 $0.434 $395,551 910,758 $0.4349 $2,808,120 $210,609 $234,010 $111,308 $0 $555,927 1,315,409 $0.423 $365,217 864,161 $0.42310 $2,574,110 $193,058 $234,010 $113,534 $0 $540,602 1,315,409 $0.411 $336,979 819,948 $0.41111 $2,340,100 $175,508 $234,010 $115,804 $0 $525,322 1,315,409 $0.399 $310,701 777,997 $0.39912 $2,106,090 $157,957 $234,010 $118,121 $0 $510,087 1,315,409 $0.388 $286,255 738,192 $0.38813 $1,872,080 $140,406 $234,010 $120,483 $0 $494,899 1,315,409 $0.376 $263,522 700,424 $0.37614 $1,638,070 $122,855 $234,010 $122,893 $0 $479,758 1,315,409 $0.365 $242,390 664,589 $0.36515 $1,404,060 $105,305 $234,010 $125,350 $0 $464,665 1,315,409 $0.353 $222,753 630,587 $0.35316 $1,170,050 $87,754 $234,010 $127,857 $0 $449,621 1,315,409 $0.342 $204,514 598,324 $0.34217 $936,040 $70,203 $234,010 $130,415 $0 $434,628 1,315,409 $0.330 $187,579 567,712 $0.33018 $702,030 $52,652 $234,010 $133,023 $0 $419,685 1,315,409 $0.319 $171,863 538,666 $0.31919 $468,020 $35,102 $234,010 $135,683 $0 $404,795 1,315,409 $0.308 $157,284 511,107 $0.30820 $234,010 $17,551 $234,010 $138,397 $0 $389,958 1,315,409 $0.296 $143,767 484,957 $0.296
$7,115,590 16,716,518 $0.426
Real levelized cost of energy $0.426
Leading Edge Projects Generation LCOE Economic Model
Project: Norman Wells 4 Aeronautica 225 wind turbines with 50 meter towers; with 30% NoRWIP ($2,005,800)
Page 2 of 2 37