Embed Size (px)
Citation preview

NBIM is the investment management division of Norges Bank - the central bank of Norway
Norges Bank Investment Management (NBIM) Performance results
NBIM claims compliance with the Global Investment Performance Standards (GIPS®) and has prepared and presented this report in compliance with the GIPS standards. NBIM has been independently verified for the periods 31 December 1997 through 31 December 2012. The verification reports are available upon request. Verification assesses whether (1) the firm has complied with all the composite construction requirements of the GIPS standards on a firm-wide basis and (2) the firm’s policies and procedures are designed to calculate and present performance in compliance with the GIPS standards. Verification does not ensure the accuracy of any specific composite presentation.
Page Composite Inception/creation Composition
2 General disclosures
4 The Government Pension Fund Global 31 Dec 1997
Pension Fund, equity Pension Fund, fixed income Pension Fund, real estate
9 The Government Pension Fund Global, ex real estate 31 Dec 1997 Pension Fund, equity
Pension Fund, fixed income
17 The Government Pension Fund Global, equity 31 Dec 1998 Pension Fund, equity
22 The Government Pension Fund Global, fixed income 31 Dec 1997 Pension Fund, fixed income
27 The Government Pension Fund Global, real estate 31 Mar 2011 Pension Fund, real estate
30 The investment portfolio of Norges Bank’s foreign exchange reserves 31 Dec 1997 Reserves Fund, equity
Reserves Fund, fixed income
36 The investment portfolio of Norges Bank’s foreign exchange reserves, equity 31 Dec 2001 Reserves Fund, equity
40 The investment portfolio of Norges Bank’s foreign exchange reserves, fixed income 31 Dec 1997 Reserves Fund, fixed income

2
General disclosures Verification
NBIM has been independently verified for the period 31 December 1997 through 31 December 2012. The third
party verifier’s report is available at our website www.nbim.no.
The firm
NBIM as the firm is the investment management division of Norges Bank – the central bank of Norway. NBIM
manages the Government Pension Fund Global (Pension Fund) and the major part of Norges Bank’s foreign
exchange reserves (Reserves Fund).
Firm assets
Total firms assets are defined as the sum of the Government Pension Fund Global and the investment portfolio
of Norges Bank’s foreign exchange reserves. The money market portfolio of Norges Bank’s foreign exchange
reserves is managed by the Market Operations and Analysis Department of the Norges Bank Monetary
Policy division and is not part of firm assets. On close of 31 December 2010 the Government Petroleum
Insurance Fund was terminated and the assets were transferred to the Pension Fund. On June 1 2012, the
management of the Petroleum Buffer portfolio was transferred to Norges Bank Markets and Banking services
division and hence the portfolio is not part of Firm assets year-end 2012.
Calculation methodology
NBIM implements a time-weighted monthly rate of return methodology in the return calculations. The assets’
fair value is determined on the day of an external cash flow and interim returns are geometrically linked. NBIM
does not operate with a minimum asset level. NBIM has not adopted a significant cash flow policy. All
portfolios are accounted for in the composite. All composite returns are calculated net of non-reclaimable
withholding taxes on dividend, interest and capital gains. Withholding taxes are recognized when incurred.
NBIM uses accrual accounting for interest income and dividends.
Assets and liabilities are reported on a fair value basis and in Norwegian kroner (NOK). Fair value is the
estimated realisable value of an asset or the estimated cost of settling a liability in an arm’s length transaction
between well-informed and willing parties. The sources of valuation and pricing follow the NBIM pricing
hierarchy which is well aligned with the GIPS standards’ recommendation. Performance is reported in terms of
an international currency basket corresponding to the currency composition of the fund’s benchmark portfolio.
This measure reflects the actual performance of the Fund and isolates the effects of NOK fluctuations versus the
currencies in which the benchmark is invested. Movements in the NOK do not affect the international purchasing
power of the fund.
Carve-out
The asset class composites constitute carve-outs from the total portfolio. Cash is allocated to each carve-out
separately. For each annual period presented in the equity and fixed income composites (applies to Pension Fund
and Reserves fund) and the real estate composite (applies to Pension Fund), the share of composite assets
represented by carve-outs equals 100%.

3
Additional information
NBIM’s list of composite descriptions is available upon request. Policies for valuing portfolios, calculating
performance, and preparing compliant presentations are available upon request.
A large extent of information is available at our website www.nbim.no.

4
Performance results: Government Pension Fund Global 31 December 1997 – 31 December 2012
Report presented as of: 31 December 2012 Reported assets currency: NOK Reported returns currency: CCY*
Calendar year
Composite return
3 years annualised ex-post standard deviation,
composite return Number of portfolios
Composite assets
Firm assets
1998 9.26 1 171 832 279 205 1999 12.44 1 222 408 340 855 2000 2.49 5.68 1 386 450 522 544 2001 -2.47 5.89 1 613 686 739 116 2002 -4.74 5.91 1 609 007 743 670 2003 12.59 6.27 1 845 306 1 044 264 2004 8.94 5.33 1 1 016 402 1 236 653 2005 11.09 4.00 1 1 399 050 1 648 874 2006 7.92 3.36 1 1 783 683 2 047 074 2007 4.26 3.60 1 2 018 643 2 261 368 2008 -23.31 9.39 1 2 275 426 2 498 961 2009 25.62 12.27 1 2 640 043 2 851 020 2010 9.62 13.30 1 3 077 420 3 317 700 2011 -2.54 10.52 1 3 311 572 3 539 396 2012 13.42 8.24 1 3 815 769 4 043 153
Note: Returns are gross of fee and stated in per cent. Assets stated in millions. A measure of internal dispersion is not provided since the composite contains only one portfolio.
Key metrics (annualised) 1 year 3 years 5 years 7 years 10 years Inception
Composite return
13.42
6.61
3.14
3.97
5.99
5.05 Ex – post standard deviation, composite return
6.42
8.24
11.31
9.71
8.44
7.74
Note: Returns are gross of fee and stated in per cent. Standard deviation stated in per cent.
* CCY is the currency basket corresponding to the currency composition in the fund’s benchmark portfolio. The basket consists of 35 currencies internationally. The use of the currency basket is mandated by the Ministry of Finance.

5
Composite creation date and inception date
The composite inception date and the composite creation date of the Government Pension Fund Global is 31
December 1997.
Composite description
The Government Pension Fund Global is NBIM’s largest investment mandate. The Pension Fund was set up in
1990 as a tool to support the long-term management of Norway’s petroleum revenues. NBIM manages the
Pension Fund on behalf of the Ministry of Finance. This composite is the aggregate of the equity, fixed income
and real estate composites. Accrued costs and deposits on real estate are included in the composite’s assets and
firm assets prior to inception of real estate 31 March 2011.
Derivatives, leverage and short-selling
NBIM’s access to the use of financial derivatives is regulated as part of the provisions on the management of the
Government Pension Fund Global laid down by the Norwegian Ministry of Finance and available on their web
site. Specifically, derivatives that are naturally related to equity and fixed-income securities may be used. In
accordance with the investment mandate, the Pension Fund may use exchange traded future and option contracts
and over-the-counter (OTC) derivative contracts such as interest-rate swaps, credit-default swaps and equity
swaps in order to achieve the lowest possible transaction cost, and to efficiently rebalance the portfolio. The
segmented net fair values and exposure of the financial derivatives for the last three years is shown in the table
below. For options the exposure is delta adjusted. Foreign exchange contracts consist of foreign currency
exchange contracts with normal settlement for future delivery and non-deliverable contracts. Exchange traded
futures consist of equity index futures and listed government bonds futures. Equity swaps are agreements to
exchange cash flows based on an underlying equity index or specific shares. Interest-rate swaps are agreements
where NBIM receives or pays a fixed rate of interest in exchange for a floating rate. Credit-default swaps are
agreements where NBIM has purchased or sold credit risk protection on underlying securities issued by
corporates and governments. Swap options and currency options are contracts where the underlying is an
interest-rate swap or a currency.
Financial
derivatives
Asset
class
Average exposure through year (NOKm)
2012 2011 2010
Net fair value
Year-end (NOKm)
Purchased Sold Purchased Sold Purchased Sold 2012 2011 2010
Foreign exchange contracts Common 81 006 - 64 778 - 27 468 - -57 639 86 Exchange traded futures Common 302 10 708 5 228 9 851 20 557 16 267 130 -219 21
Equity swaps Equity 458 217 25 550 823 85 191 24 -56
Interest-rate swaps Fixed
income 5 333 15 849 20 106 52 806 14 035 70 908 -1 417 -4 176 -5 453 Credit-default swaps
Fixed income 728 5 19 373 280 30 926 2 434 - 2 -708
Swap options and FX options
Fixed income - - 14 464 11 987 24 829 15 840 - - -194

6
The use of leverage is not regulated in the current provisions on the management of the Government Pension
Fund Global. However, additional restrictions are laid down as part of the CEO investment mandate issued by
Norges Bank’s Executive Board. Historically, leverage has predominantly been used within the fixed-income
composite to exploit differences in rates or credit spreads by combining derivatives, forward contracts and
repurchase agreements. This activity is reflected in the Pension Fund’s balance sheet when the gross value of the
bonds exceeds the fair value of the fixed-income composite. Leverage as described above was scaled back in the
second half of 2009 due to changes in market conditions and a reorganization of NBIM’s fixed-income
management. Within the equity segment leverage is mainly used to efficiently handle fund management
activities and has historically been insignificant. In 2011, NBIM’s definition for net leverage changed. Rather
than looking at the net sum of all cash positions, the metric is now calculated by comparing net exposure and
actual market value (net asset value). Net exposure is found by converting all derivatives to underlying exposure.
The new methodology was implemented as of 1 January 2011 and no numbers are restated. Below, the net
leverage in per cent of the composite’s fair value is shown as a times series. A negative value means the
composite is unlevered. The red dashed line indicates the average value within a year.
Short-selling (shorting) is permitted in the management of the Pension Fund given that NBIM has access to
established loan facilities. However, restrictions are laid down as part of the CEO investment mandate issued by
Norges Bank’s Executive Board. Shorting on the equity side was zero throughout 2012. Shorting on the fixed
income side was close to zero except for a trade on the last day in August. The graph below shows the amount of
shorting as a percentage of the composite fair value. Shorting is defined as the sum of negative net asset values at
security level. The total is the sum of equity and fixed income shorts. The red dashed line indicates the average
value within the year.

7
Sub-advisors
NBIM uses external managers to handle parts of the portfolio. NBIM awards management mandates to
organizations with expertise in clearly defined sectors and/or regions. The fund’s externally managed mandates
had assets under management worth NOK 150 billion at the end of 2012. This is equivalent to 4 per cent of the
fund’s total value. External equity mandates accounted for 97% of the total external assets under management.
There were a total of 56 mandates managed by 51 different organizations, 55 of which were equity mandates.
The graph below shows the composition of externally managed assets at year-end since inception as well as a
share of the total Pension Fund. The complete list of organizations managing assets on behalf of NBIM is
detailed in the Annual reports available on www.nbim.no.
Benchmark description
The strategic benchmark weights are assigned by the Ministry of Finance and are currently 60% equity and 40%
fixed income with a planned 5% transition to Real Estate over the next several years. Thus at any time, the
strategic weight for fixed income is 40% less the composite’s share invested in real estate. The benchmark of the

8
Pension Fund is a custom benchmark composed of an equity benchmark with combined market capitalization
and factor weights, a GDP weighted fixed income benchmark and a real estate benchmark compiled by the FTSE
Group, Barclays Capital and Investment Property Databank respectively. As the real estate portfolio is in its
development phase no meaningful comparison to the benchmark can be made and as such, no benchmark returns
are presented.
Fee schedule
Performance numbers are gross of management fees and custodial fees but net of all trading expenses
(transaction costs). In addition, non-reclaimable withholding taxes are deducted in the performance numbers.
NBIM does not operate with a fee schedule as mutual funds do. The Ministry of Finance has defined an upper
limit of 9 basis points of average assets under management of which NBIM will be reimbursed. Costs above this
upper limit are not covered. In addition, performance based fees to external managers are covered. As of 31
December 2012 the annual total expense ratio was 0.06% down from 0.08% one year prior. The table below
shows the different components of the total management costs. Note that this table also covers internal costs
(like personnel costs, IT/support systems costs) in relation to real estate investment management.
NBIM management costs 2012
NOK 1000 Per cent
2011
NOK 1000 Per cent
Internal costs 937 778 894 325
Custody and settlement costs 350 528 406 276
Minimum fees to external managers 271 844 370 993
Performance based fees to external managers 307 402 546 375
Other costs 325 382 321 376
Total management costs 2 192 935 0.06 2 539 345 0.08 Total management cost excl. performance based fees 1 885 533 0.05 1 992 969 0.06
9
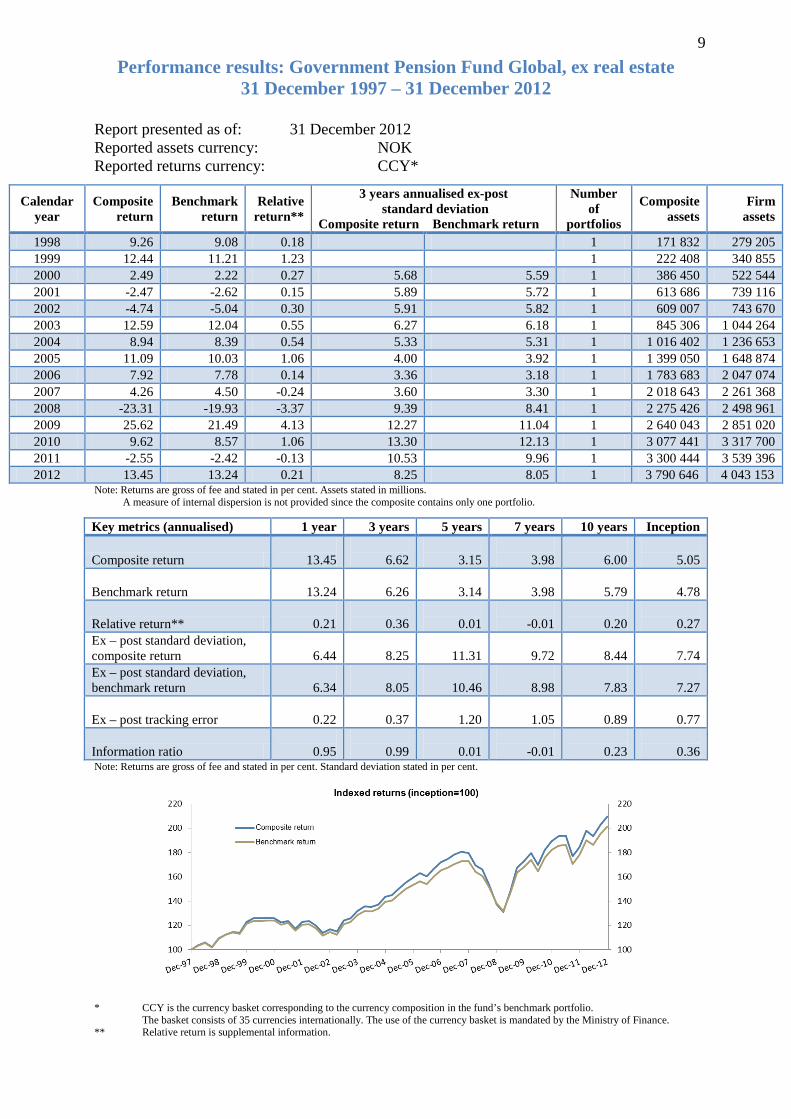
Performance results: Government Pension Fund Global, ex real estate 31 December 1997 – 31 December 2012
Report presented as of: 31 December 2012 Reported assets currency: NOK Reported returns currency: CCY*
Calendar year
Composite return
Benchmark return
Relative return**
3 years annualised ex-post standard deviation
Composite return Benchmark return
Number of
portfolios
Composite assets
Firm assets
1998 9.26 9.08 0.18 1 171 832 279 205 1999 12.44 11.21 1.23 1 222 408 340 855 2000 2.49 2.22 0.27 5.68 5.59 1 386 450 522 544 2001 -2.47 -2.62 0.15 5.89 5.72 1 613 686 739 116 2002 -4.74 -5.04 0.30 5.91 5.82 1 609 007 743 670 2003 12.59 12.04 0.55 6.27 6.18 1 845 306 1 044 264 2004 8.94 8.39 0.54 5.33 5.31 1 1 016 402 1 236 653 2005 11.09 10.03 1.06 4.00 3.92 1 1 399 050 1 648 874 2006 7.92 7.78 0.14 3.36 3.18 1 1 783 683 2 047 074 2007 4.26 4.50 -0.24 3.60 3.30 1 2 018 643 2 261 368 2008 -23.31 -19.93 -3.37 9.39 8.41 1 2 275 426 2 498 961 2009 25.62 21.49 4.13 12.27 11.04 1 2 640 043 2 851 020 2010 9.62 8.57 1.06 13.30 12.13 1 3 077 441 3 317 700 2011 -2.55 -2.42 -0.13 10.53 9.96 1 3 300 444 3 539 396 2012 13.45 13.24 0.21 8.25 8.05 1 3 790 646 4 043 153
Note: Returns are gross of fee and stated in per cent. Assets stated in millions. A measure of internal dispersion is not provided since the composite contains only one portfolio.
Key metrics (annualised) 1 year 3 years 5 years 7 years 10 years Inception
Composite return
13.45
6.62
3.15
3.98
6.00
5.05
Benchmark return
13.24
6.26
3.14
3.98
5.79
4.78
Relative return**
0.21
0.36
0.01
-0.01
0.20
0.27 Ex – post standard deviation, composite return
6.44
8.25
11.31
9.72
8.44
7.74
Ex – post standard deviation, benchmark return
6.34
8.05
10.46
8.98
7.83
7.27
Ex – post tracking error
0.22
0.37
1.20
1.05
0.89
0.77
Information ratio
0.95
0.99
0.01
-0.01
0.23
0.36 Note: Returns are gross of fee and stated in per cent. Standard deviation stated in per cent.
* CCY is the currency basket corresponding to the currency composition in the fund’s benchmark portfolio. The basket consists of 35 currencies internationally. The use of the currency basket is mandated by the Ministry of Finance.
** Relative return is supplemental information.
10
Composite creation date and inception date
The composite inception date and the composite creation date of the Government Pension Fund Global, ex real
estate is 31 December 1997.
Composite description
The Government Pension Fund Global is NBIM’s largest investment mandate. The Pension Fund was set up in
1990 as a tool to support the long-term management of Norway’s petroleum revenues. NBIM manages the
Pension Fund on behalf of the Ministry of Finance. This composite is the aggregate of the equity and fixed
income composites. The strategic asset class weights were 60% equity and 40% fixed income in 2012. NBIM
seeks to achieve the highest possible return after management costs in the currency basket assigned by the actual
benchmark index. External managers may be used for that purpose and active ownership strategies may be used
in order to safeguard the Pension Fund’s financial interest. NBIM invests in tradable debt securities and
instruments, equities listed on a regulated marketplace, unlisted equities where the company’s board has
expressed an intention to seek listing, and financial derivatives naturally linked to the prior mentioned securities.
NBIM cannot invest in securities the Ministry has excluded from the investment universe and further not in
Norwegian companies or NOK denominated securities. NBIM cannot hold more than a 10% voting per cent in
any individual company.
From the second quarter of 2000 and up to the fourth quarter of 2002, a tactical allocation fund was included in
the numbers for the Government Pension Fund Global but not at asset class level. Its mandate was to invest
across asset classes using quantitative analysis and had average total assets under management of NOK 4 billion
during that period.
The Ministry of Finance has set limits for how much risk NBIM may take in its active management. The most
important limit is expressed as expected tracking error (relative volatility) and sets a ceiling on how much the
return of the Pension Fund may be expected to deviate from the return on the benchmark portfolio. The expected
tracking error limit is 100 basis points or 1.0 percentage points. The Executive Board has further defined
additional risk restrictions relating to the Pension Fund, amongst other relating to maximum allowed leverage,
short-selling and liquidity. NBIM aims to invest new capital in the markets at the lowest possible cost and to
manage the invested capital to maintain the market portfolio cost-effectively. NBIM seeks to increase returns
through active investment decisions and through active ownership. Active management seeks to generate a
higher return than the benchmark portfolio thus adding value for future generations. It involves management of
the market portfolio and fundamentally based active strategies. Managing the market portfolio involves daily
decisions, when to add or reduce the holdings of securities, whether the Pension Fund should participate in initial
public offerings, etc. Active investment decisions may include fundamental strategies to invest in companies.
Portfolio managers analyse issuers of securities to find and exploit assets that represent long-term value or may
be mispriced. Knowledge of specific industries and companies is an important part of this strategy. The Pension
Fund’s long-term investment outlook permits investments in assets expected to yield higher returns over time
compared to the benchmark.
11
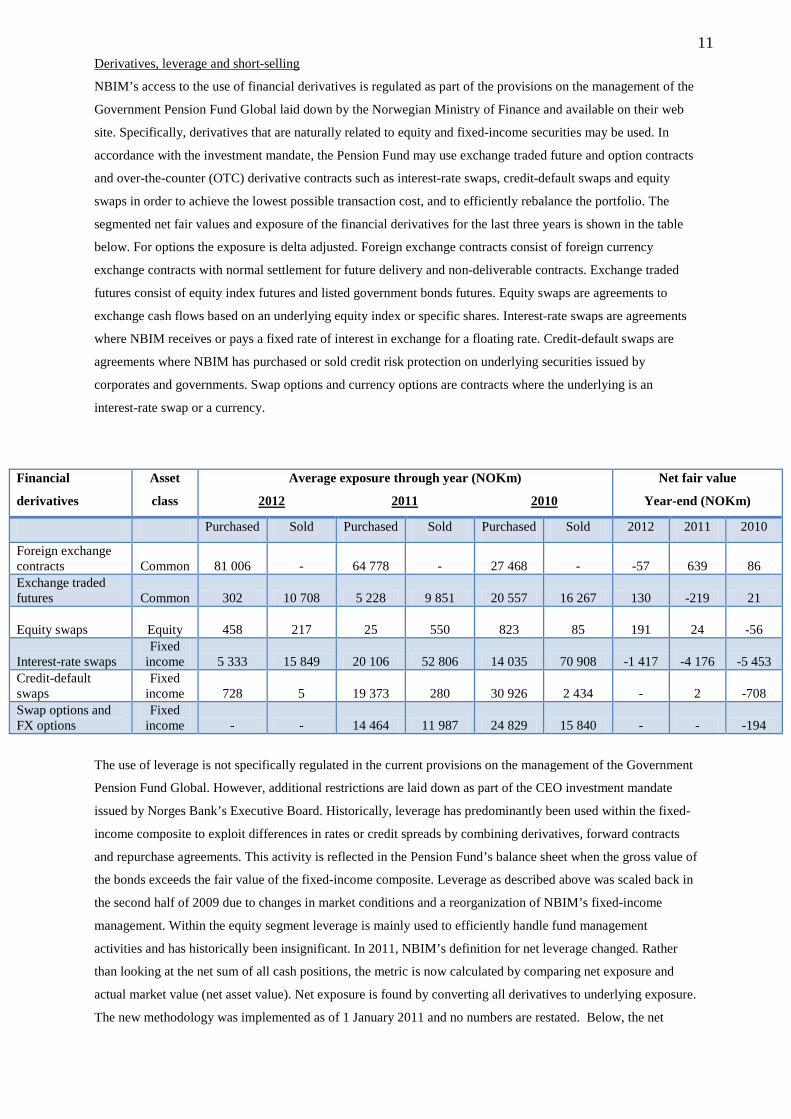
Derivatives, leverage and short-selling
NBIM’s access to the use of financial derivatives is regulated as part of the provisions on the management of the
Government Pension Fund Global laid down by the Norwegian Ministry of Finance and available on their web
site. Specifically, derivatives that are naturally related to equity and fixed-income securities may be used. In
accordance with the investment mandate, the Pension Fund may use exchange traded future and option contracts
and over-the-counter (OTC) derivative contracts such as interest-rate swaps, credit-default swaps and equity
swaps in order to achieve the lowest possible transaction cost, and to efficiently rebalance the portfolio. The
segmented net fair values and exposure of the financial derivatives for the last three years is shown in the table
below. For options the exposure is delta adjusted. Foreign exchange contracts consist of foreign currency
exchange contracts with normal settlement for future delivery and non-deliverable contracts. Exchange traded
futures consist of equity index futures and listed government bonds futures. Equity swaps are agreements to
exchange cash flows based on an underlying equity index or specific shares. Interest-rate swaps are agreements
where NBIM receives or pays a fixed rate of interest in exchange for a floating rate. Credit-default swaps are
agreements where NBIM has purchased or sold credit risk protection on underlying securities issued by
corporates and governments. Swap options and currency options are contracts where the underlying is an
interest-rate swap or a currency.
Financial
derivatives
Asset
class
Average exposure through year (NOKm)
2012 2011 2010
Net fair value
Year-end (NOKm)
Purchased Sold Purchased Sold Purchased Sold 2012 2011 2010
Foreign exchange contracts Common 81 006 - 64 778 - 27 468 - -57 639 86 Exchange traded futures Common 302 10 708 5 228 9 851 20 557 16 267 130 -219 21
Equity swaps Equity 458 217 25 550 823 85 191 24 -56
Interest-rate swaps Fixed
income 5 333 15 849 20 106 52 806 14 035 70 908 -1 417 -4 176 -5 453 Credit-default swaps
Fixed income 728 5 19 373 280 30 926 2 434 - 2 -708
Swap options and FX options
Fixed income - - 14 464 11 987 24 829 15 840 - - -194
The use of leverage is not specifically regulated in the current provisions on the management of the Government
Pension Fund Global. However, additional restrictions are laid down as part of the CEO investment mandate
issued by Norges Bank’s Executive Board. Historically, leverage has predominantly been used within the fixed-
income composite to exploit differences in rates or credit spreads by combining derivatives, forward contracts
and repurchase agreements. This activity is reflected in the Pension Fund’s balance sheet when the gross value of
the bonds exceeds the fair value of the fixed-income composite. Leverage as described above was scaled back in
the second half of 2009 due to changes in market conditions and a reorganization of NBIM’s fixed-income
management. Within the equity segment leverage is mainly used to efficiently handle fund management
activities and has historically been insignificant. In 2011, NBIM’s definition for net leverage changed. Rather
than looking at the net sum of all cash positions, the metric is now calculated by comparing net exposure and
actual market value (net asset value). Net exposure is found by converting all derivatives to underlying exposure.
The new methodology was implemented as of 1 January 2011 and no numbers are restated. Below, the net

12
leverage in per cent of the composite’s fair value is shown as a times series. A negative value means the
composite is unlevered. The red dashed line indicates the average value within a year.
Short-selling (shorting) is permitted in the management of the Pension Fund given that NBIM has access to
established loan facilities. However, restrictions are laid down as part of the CEO investment mandate issued by
Norges Bank’s Executive Board. Shorting on the equity side was zero throughout 2012. Shorting on the fixed
income side was close to zero except for a trade on the last day in August. The graph below shows the amount of
shorting as a percentage of the composite fair value. Shorting is defined as the sum of negative net asset values at
security level. The total is the sum of equity and fixed income shorts. The red dashed line indicates the average
value within the year.
Sub-advisors
NBIM uses external managers to handle parts of the portfolio. NBIM awards management mandates to
organizations with expertise in clearly defined sectors and/or regions. The fund’s externally managed mandates
had assets under management worth NOK 150 billion at the end of 2012. This is equivalent to 4 per cent of the
fund’s total value. External equity mandates accounted for 97% of the total external assets under management.
There were a total of 56 mandates managed by 51 different organizations, 55 of which were equity mandates.
The graph below shows the composition of externally managed assets at year-end since inception as well as a
share of the total Pension Fund. The complete list of organizations managing assets on behalf of NBIM is
detailed in the Annual reports available on www.nbim.no.
13
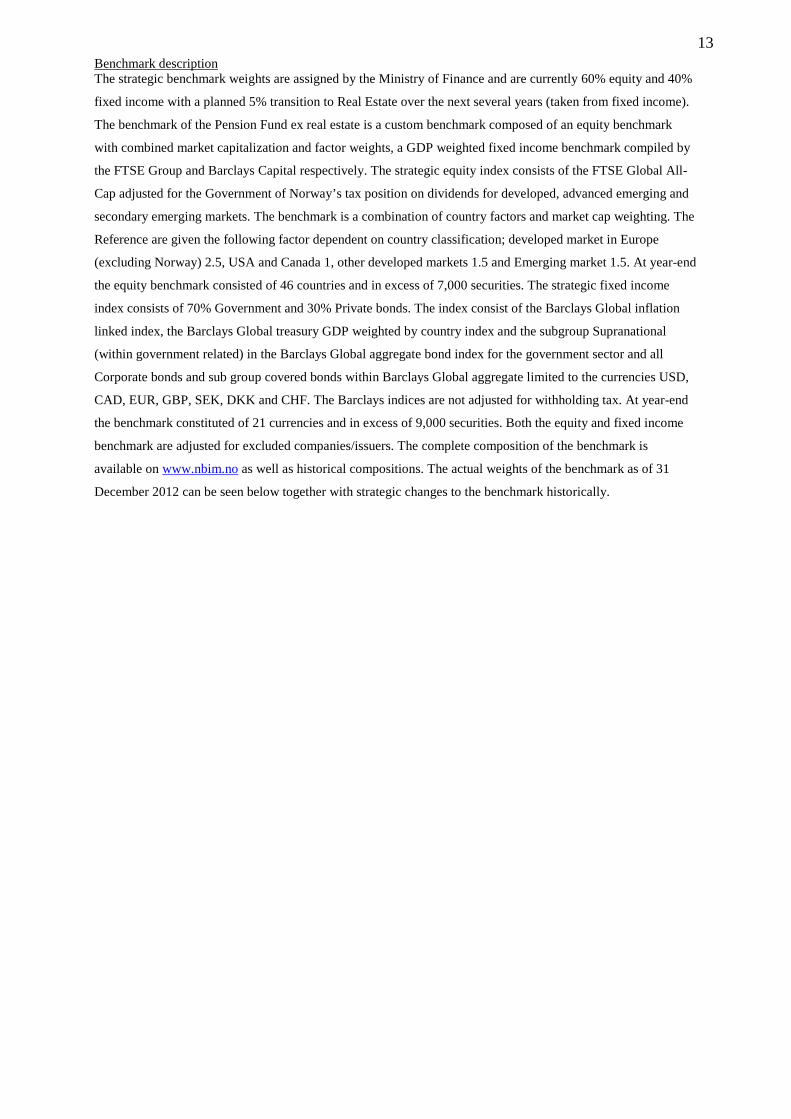
Benchmark description The strategic benchmark weights are assigned by the Ministry of Finance and are currently 60% equity and 40%
fixed income with a planned 5% transition to Real Estate over the next several years (taken from fixed income).
The benchmark of the Pension Fund ex real estate is a custom benchmark composed of an equity benchmark
with combined market capitalization and factor weights, a GDP weighted fixed income benchmark compiled by
the FTSE Group and Barclays Capital respectively. The strategic equity index consists of the FTSE Global All-
Cap adjusted for the Government of Norway’s tax position on dividends for developed, advanced emerging and
secondary emerging markets. The benchmark is a combination of country factors and market cap weighting. The
Reference are given the following factor dependent on country classification; developed market in Europe
(excluding Norway) 2.5, USA and Canada 1, other developed markets 1.5 and Emerging market 1.5. At year-end
the equity benchmark consisted of 46 countries and in excess of 7,000 securities. The strategic fixed income
index consists of 70% Government and 30% Private bonds. The index consist of the Barclays Global inflation
linked index, the Barclays Global treasury GDP weighted by country index and the subgroup Supranational
(within government related) in the Barclays Global aggregate bond index for the government sector and all
Corporate bonds and sub group covered bonds within Barclays Global aggregate limited to the currencies USD,
CAD, EUR, GBP, SEK, DKK and CHF. The Barclays indices are not adjusted for withholding tax. At year-end
the benchmark constituted of 21 currencies and in excess of 9,000 securities. Both the equity and fixed income
benchmark are adjusted for excluded companies/issuers. The complete composition of the benchmark is
available on www.nbim.no as well as historical compositions. The actual weights of the benchmark as of 31
December 2012 can be seen below together with strategic changes to the benchmark historically.

14
Equities Fixed income Real estate Country for equity benchmark Currency for fixed income benchmark
Strategic benchmark indices
Actual benchmark indices
Strategic benchmark indices
Actual benchmark index
Benchmark index
Asset class weights 60.0 60.5 39.3 38.8 0.7 Belgium 0.9 Finland 0.7 France 7.1 Greece 0.1 Ireland 0.2 Italy 1.9 Netherlands 1.9 Portugal 0.2 Spain 2.2 Germany 6.3 Austria 0.3 Euro-area (EUR) 21.9 32.2 UK (GBP) 15.6 6.9 Denmark (DKK) 0.9 0.6 Switzerland (CHF) 6.2 1.4 Sweden (SEK) 2.4 1.3 Czech Republic (CZK) 0.1 0.3 Turkey 0.4 Hungary 0.1 Poland (PLN) 0.3 0.7 Russia 1.1 Total Europa 48.9 43.4 United Arab Emirates 0.0 Egypt 0.0 Israel (ILS) 0.2 0.3 Morocco 0.0 South Africa (ZAR) 0.9 0.6 Total Middle East and Africa 1.2 0.9 Brazil 1.4 Canada (CAD) 2.6 3.2 Chile (CLP) 0.2 0.3 Colombia 0.1 Mexico (MXN) 0.5 1.6 Peru 0.0 USA (USD) 28.1 37.3 Total Americas 33.1 42.5 Australia (AUD 2.5 2.0 China 1.6 Hong Kong (HKD) 1.5 0.3 Indonesia 0.3 India 0.8 Japan (JPY) 5.4 7.9 South Korea (KRW) 1.7 1.5 Malaysia (MYR) 0.5 0.4 New Zealand (NZD) 0.1 0.2 Philippines 0.1 Pakistan 0.0 Singapore (SGD) 0.6 0.4 Thailand (THB) 0.3 0.5 Taiwan 1.4 Total Asia/ Oceania 16.8 13.2
15
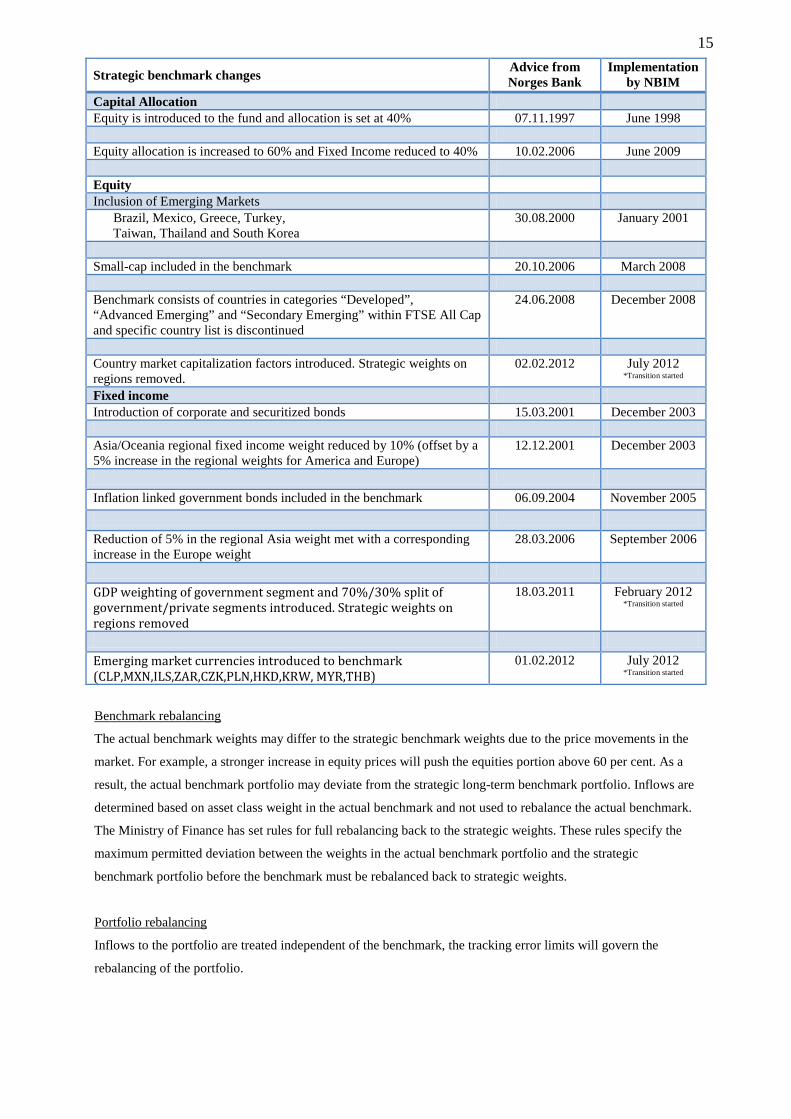
Benchmark rebalancing
The actual benchmark weights may differ to the strategic benchmark weights due to the price movements in the
market. For example, a stronger increase in equity prices will push the equities portion above 60 per cent. As a
result, the actual benchmark portfolio may deviate from the strategic long-term benchmark portfolio. Inflows are
determined based on asset class weight in the actual benchmark and not used to rebalance the actual benchmark.
The Ministry of Finance has set rules for full rebalancing back to the strategic weights. These rules specify the
maximum permitted deviation between the weights in the actual benchmark portfolio and the strategic
benchmark portfolio before the benchmark must be rebalanced back to strategic weights.
Portfolio rebalancing
Inflows to the portfolio are treated independent of the benchmark, the tracking error limits will govern the
rebalancing of the portfolio.
Strategic benchmark changes Advice from Norges Bank
Implementation by NBIM
Capital Allocation Equity is introduced to the fund and allocation is set at 40% 07.11.1997 June 1998 Equity allocation is increased to 60% and Fixed Income reduced to 40% 10.02.2006 June 2009 Equity Inclusion of Emerging Markets Brazil, Mexico, Greece, Turkey, Taiwan, Thailand and South Korea
30.08.2000 January 2001
Small-cap included in the benchmark 20.10.2006 March 2008 Benchmark consists of countries in categories “Developed”, “Advanced Emerging” and “Secondary Emerging” within FTSE All Cap and specific country list is discontinued
24.06.2008 December 2008
Country market capitalization factors introduced. Strategic weights on regions removed.
02.02.2012 July 2012 *Transition started
Fixed income Introduction of corporate and securitized bonds 15.03.2001 December 2003 Asia/Oceania regional fixed income weight reduced by 10% (offset by a 5% increase in the regional weights for America and Europe)
12.12.2001 December 2003
Inflation linked government bonds included in the benchmark 06.09.2004 November 2005 Reduction of 5% in the regional Asia weight met with a corresponding increase in the Europe weight
28.03.2006 September 2006
GDP weighting of government segment and 70%/30% split of government/private segments introduced. Strategic weights on regions removed
18.03.2011 February 2012 *Transition started
Emerging market currencies introduced to benchmark (CLP,MXN,ILS,ZAR,CZK,PLN,HKD,KRW, MYR,THB)
01.02.2012 July 2012 *Transition started

16
Fee schedule
Performance numbers are gross of management fees and custodial fees but net of all trading expenses
(transaction costs). In addition, non-reclaimable withholding taxes are deducted in the performance numbers.
NBIM does not operate with a fee schedule as mutual funds do. The Ministry of Finance has defined an upper
limit of 9 basis points of average assets under management of which NBIM will be reimbursed. Costs above this
upper limit are not covered. In addition, performance based fees to external managers are covered. As of 31
December 2012 the annual total expense ratio was 0.06% down from 0.08% one year prior. The table on page 8
shows the different components of the total management costs. Note that this table also covers internal costs
(like personnel costs, IT/support systems costs) in relation to real estate investment management.

17
Performance results: Government Pension Fund Global, equity 31 December 1998 – 31 December 2012
Report presented as of: 31 December 2012 Reported assets currency: NOK Reported returns currency: CCY*
Calendar year
Composite return
Benchmark return
Relative return**
3 years annualised ex-post standard deviation
Composite return Benchmark return
Number of portfolios
Composite assets
Firm assets
1999 34.81 31.32 3.49 1 93 651 340 855 2000 -5.82 -6.31 0.49 1 152 829 522 544 2001 -14.60 -14.66 0.06 15.24 14.81 1 246 412 739 116 2002 -24.39 -24.47 0.07 16.94 16.74 1 230 993 743 670 2003 22.84 22.33 0.51 18.15 18.02 1 361 165 1 044 264 2004 13.00 12.21 0.79 15.30 15.26 1 416 298 1 236 653 2005 22.49 20.33 2.16 9.71 9.53 1 582 305 1 648 874 2006 17.04 17.13 -0.09 7.66 7.17 1 725 922 2 047 074 2007 6.82 5.67 1.15 8.70 8.25 1 957 895 2 261 368 2008 -40.71 -39.56 -1.15 17.01 16.28 1 1 128 937 2 498 961 2009 34.27 32.41 1.86 20.85 20.19 1 1 644 106 2 851 020 2010 13.34 12.61 0.73 22.20 21.56 1 1 891 250 3 317 700 2011 -8.84 -8.36 -0.48 17.74 17.46 1 1 944 722 3 539 396 2012 18.06 17.54 0.52 14.29 14.03 1 2 335 830 4 043 153
Note: Returns are gross of fee and stated in per cent. Assets stated in millions. A measure of internal dispersion is not provided since the composite contains only one portfolio.
Key metrics (annualised) 1 year 3 years 5 years 7 years 10 years Inception
Composite return
18.06
6.85
-0.59
2.81
7.52
3.83
Benchmark return
17.54
6.65
-0.59
2.66
7.09
3.29
Relative return**
0.52
0.20
0.01
0.15
0.42
0.54 Ex – post standard deviation, composite return
11.25
14.29
19.11
16.79
15.09
15.65
Ex – post standard deviation, benchmark return
11.14
14.03
18.60
16.32
14.68
15.28
Ex – post tracking error
0.29
0.40
0.84
0.85
0.80
0.86
Information ratio
1.80
0.49
0.01
0.18
0.52
0.62 Note: Returns are gross of fee and stated in per cent. Standard deviation stated in per cent.
* CCY is the currency basket corresponding to the currency composition in the fund’s benchmark portfolio. The basket consists of 35 currencies internationally. The use of the currency basket is mandated by the Ministry of Finance.
** Relative return is supplemental information.

18
Composite creation date and inception date
The composite inception date and the composite creation date of the Government Pension Fund Global, equity is
31 December 1998.
Composite description
The Government Pension Fund Global, equity is the equity composite of the total Pension Fund. The investment
strategy for equity management has been relatively stable throughout its history with enhanced indexing and
with specialised fundamental sector management as the core strategy. During 1998, the equity part of the
Pension Fund was established as part of a transition process. In this process, large cash inflows and subsequent
large asset purchases were incurred. No return numbers or assets are reported for 1998. Irrespective of this, the
equity portfolio’s fair value is included in the total Pension Fund’s assets and the Firm’s assets as of 31
December 1998.
Derivatives, leverage and short-selling
NBIM’s access to the use of financial derivatives is regulated as part of the provisions on the management of the
Government Pension Fund Global laid down by the Norwegian Ministry of Finance and available on their web
site. Specifically, derivatives that are naturally related to equity and fixed-income securities may be used. In
accordance with this investment mandate, the Pension Fund may use exchange traded future and option contracts
and over-the-counter (OTC) derivative contracts such as interest-rate swaps, credit-default swaps and equity
swaps in order to achieve the lowest possible transaction cost, and to efficiently rebalance the portfolio. Within
the equity asset class the use of derivatives has been limited to exchange traded futures and equity swaps and
have been used for efficient portfolio management. Historically the sizes have not been of any meaningful size.
The segmented net fair values and exposure of the financial derivatives for the last three years are shown in a
table below. For options the exposure is delta adjusted. Descriptions of these instruments can be found elsewhere
in the presentation.
Financial
derivatives
Asset
class
Average exposure through year (NOKm)
2012 2011 2010
Net fair value
Year-end (NOKm)
Purchased Sold Purchased Sold Purchased Sold 2012 2011 2010
Foreign exchange contracts Common 81 006 - 64 778 - 27 468 - -57 639 86 Exchange traded futures Common 302 10 708 5 228 9 851 20 557 16 267 130 -219 21
Equity swaps Equity 458 217 25 550 823 85 191 24 -56
The use of leverage is not regulated in the current provisions on the management of the Government Pension
Fund Global. However, restrictions are laid down as part of the CEO investment mandate issued by Norges
Bank’s Executive Board. Within the equity segment leverage is mainly used to efficiently handle fund
management activities and has historically not been material. In 2011, NBIM’s definition for net leverage
changed. Rather than looking at the net sum of all cash positions, the metric is now calculated by comparing net
exposure and actual market value (net asset value). Net exposure is found by converting all derivatives to
underlying exposure. The new methodology was implemented as of 1 January 2011 and no numbers are restated.
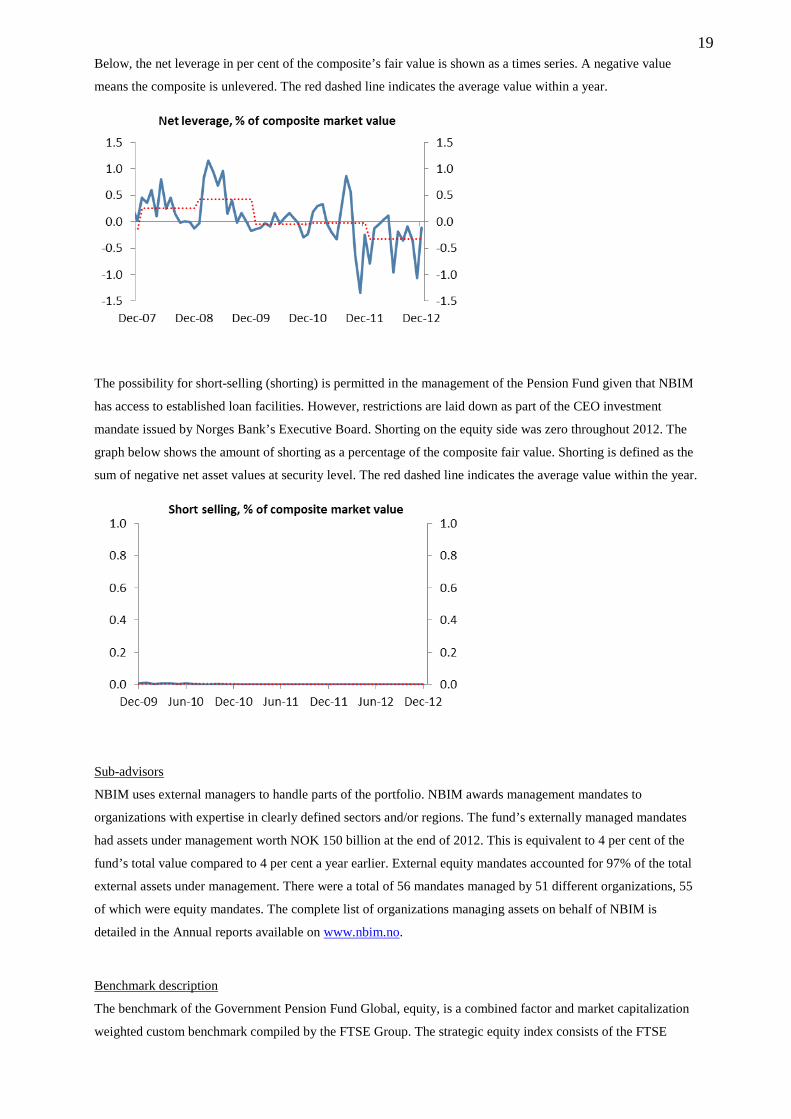
19
Below, the net leverage in per cent of the composite’s fair value is shown as a times series. A negative value
means the composite is unlevered. The red dashed line indicates the average value within a year.
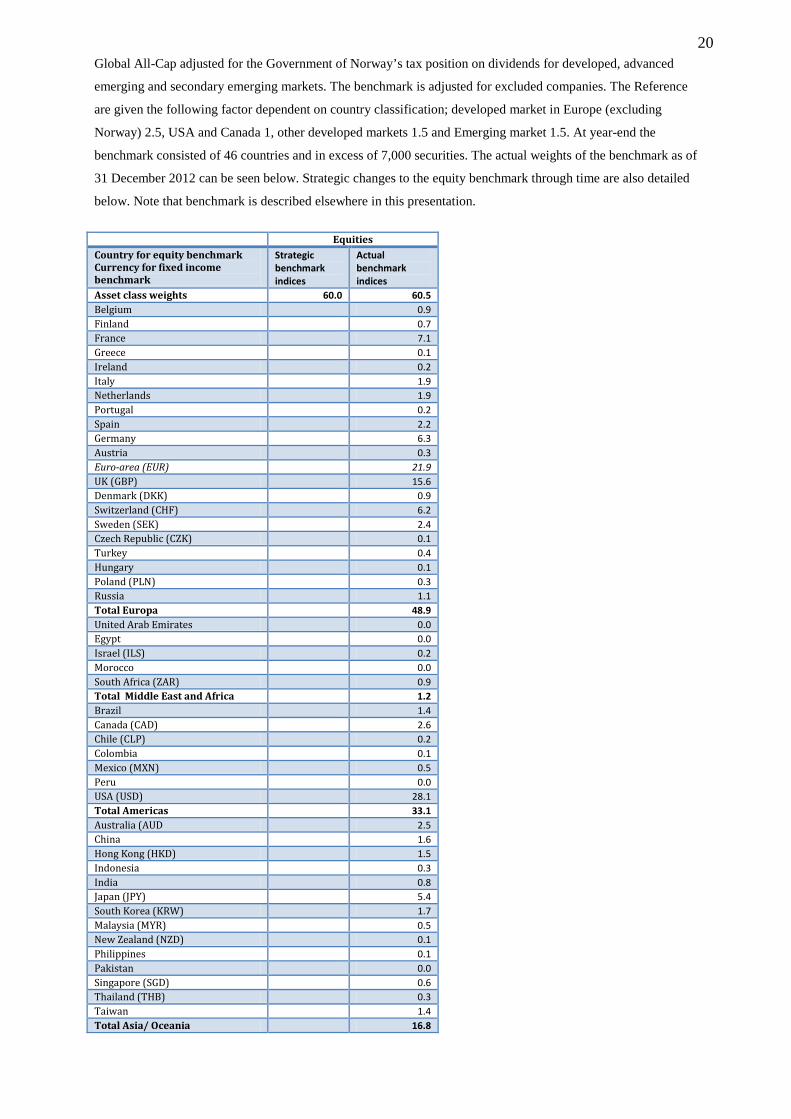
The possibility for short-selling (shorting) is permitted in the management of the Pension Fund given that NBIM
has access to established loan facilities. However, restrictions are laid down as part of the CEO investment
mandate issued by Norges Bank’s Executive Board. Shorting on the equity side was zero throughout 2012. The
graph below shows the amount of shorting as a percentage of the composite fair value. Shorting is defined as the
sum of negative net asset values at security level. The red dashed line indicates the average value within the year.
Sub-advisors
NBIM uses external managers to handle parts of the portfolio. NBIM awards management mandates to
organizations with expertise in clearly defined sectors and/or regions. The fund’s externally managed mandates
had assets under management worth NOK 150 billion at the end of 2012. This is equivalent to 4 per cent of the
fund’s total value compared to 4 per cent a year earlier. External equity mandates accounted for 97% of the total
external assets under management. There were a total of 56 mandates managed by 51 different organizations, 55
of which were equity mandates. The complete list of organizations managing assets on behalf of NBIM is
detailed in the Annual reports available on www.nbim.no.
Benchmark description
The benchmark of the Government Pension Fund Global, equity, is a combined factor and market capitalization
weighted custom benchmark compiled by the FTSE Group. The strategic equity index consists of the FTSE
20
Global All-Cap adjusted for the Government of Norway’s tax position on dividends for developed, advanced
emerging and secondary emerging markets. The benchmark is adjusted for excluded companies. The Reference
are given the following factor dependent on country classification; developed market in Europe (excluding
Norway) 2.5, USA and Canada 1, other developed markets 1.5 and Emerging market 1.5. At year-end the
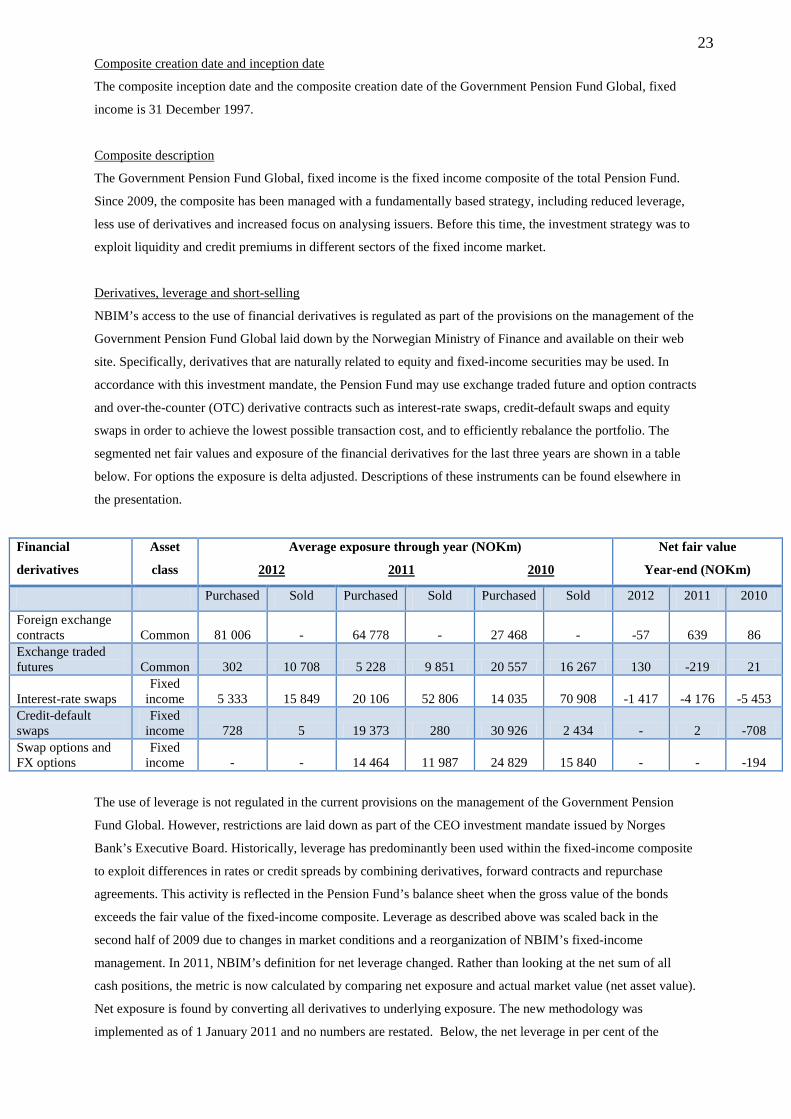
benchmark consisted of 46 countries and in excess of 7,000 securities. The actual weights of the benchmark as of
31 December 2012 can be seen below. Strategic changes to the equity benchmark through time are also detailed
below. Note that benchmark is described elsewhere in this presentation.
Equities Country for equity benchmark Currency for fixed income benchmark
Strategic benchmark indices
Actual benchmark indices
Asset class weights 60.0 60.5 Belgium 0.9 Finland 0.7 France 7.1 Greece 0.1 Ireland 0.2 Italy 1.9 Netherlands 1.9 Portugal 0.2 Spain 2.2 Germany 6.3 Austria 0.3 Euro-area (EUR) 21.9 UK (GBP) 15.6 Denmark (DKK) 0.9 Switzerland (CHF) 6.2 Sweden (SEK) 2.4 Czech Republic (CZK) 0.1 Turkey 0.4 Hungary 0.1 Poland (PLN) 0.3 Russia 1.1 Total Europa 48.9 United Arab Emirates 0.0 Egypt 0.0 Israel (ILS) 0.2 Morocco 0.0 South Africa (ZAR) 0.9 Total Middle East and Africa 1.2 Brazil 1.4 Canada (CAD) 2.6 Chile (CLP) 0.2 Colombia 0.1 Mexico (MXN) 0.5 Peru 0.0 USA (USD) 28.1 Total Americas 33.1 Australia (AUD 2.5 China 1.6 Hong Kong (HKD) 1.5 Indonesia 0.3 India 0.8 Japan (JPY) 5.4 South Korea (KRW) 1.7 Malaysia (MYR) 0.5 New Zealand (NZD) 0.1 Philippines 0.1 Pakistan 0.0 Singapore (SGD) 0.6 Thailand (THB) 0.3 Taiwan 1.4 Total Asia/ Oceania 16.8

21
Fee schedule
Performance numbers are gross of management fees and custodial fees but net of all trading expenses
(transaction costs). In addition, non-reclaimable withholding taxes are deducted in the performance numbers.
NBIM does not operate with a fee schedule as mutual funds do. The Ministry of Finance has defined an upper
limit of 9 basis points of average assets under management of which NBIM will be reimbursed. Costs above this
upper limit are not covered. In addition, performance based fees to external managers are covered. As of 31
December 2012 the annual total expense ratio was 0.06% down from 0.08% one year prior.
Strategic benchmark changes Advice from Norges Bank
Implementation by NBIM
Equity Inclusion of Emerging Markets Brazil, Mexico, Greece, Turkey, Taiwan, Thailand and South Korea
30.08.2000 January 2001
Small-cap included in the benchmark 20.10.2006 March 2008 Benchmark consists of countries in categories “Developed”, “Advanced Emerging” and “Secondary Emerging” within FTSE All Cap and specific country list is discontinued
24.06.2008 December 2008
Country market capitalization factors introduced. Strategic weights on regions removed.
02.02.2012 July 2012 *Transition started

22
Performance results: Government Pension Fund Global, fixed income 31 December 1997 – 31 December 2012
Report presented as of: 31 December 2012 Reported assets currency: NOK Reported returns currency: CCY*
Calendar year
Composite return
Benchmark return
Relative return**
3 years annualised ex-post standard deviation
Composite return Benchmark return
Number of portfolios
Composite assets
Firm assets
1998 9.31 9.10 0.21 1 102 300 279 205 1999 -0.99 -1.00 0.01 1 128 751 340 855 2000 8.41 8.34 0.07 2.67 2.69 1 227 323 522 544 2001 5.04 4.96 0.08 2.95 2.93 1 362 945 739 116 2002 9.90 9.41 0.49 3.11 3.08 1 378 014 743 670 2003 5.26 4.77 0.48 3.93 3.90 1 484 141 1 044 264 2004 6.10 5.73 0.37 3.70 3.70 1 600 104 1 236 653 2005 3.82 3.46 0.36 3.39 3.40 1 816 746 1 648 874 2006 1.93 1.68 0.25 2.63 2.67 1 1 057 761 2 047 074 2007 2.96 4.26 -1.29 2.45 2.59 1 1 060 749 2 261 368 2008 -0.54 6.06 -6.60 4.19 3.90 1 1 146 489 2 498 961 2009 12.49 5.13 7.36 5.02 4.06 1 995 937 2 851 020 2010 4.11 2.58 1.53 5.20 4.22 1 1 186 191 3 317 700 2011 7.03 6.51 0.52 3.79 3.17 1 1 355 722 3 539 396 2012 6.68 6.97 -0.29 2.72 2.81 1 1 454 816 4 043 153
Note: Returns are gross of fee and stated in per cent. Assets stated in millions. A measure of internal dispersion is not provided since the composite contains only one portfolio.
Key metrics (annualised) 1 year 3 years 5 years 7 years 10 years Inception
Composite return
6.68
5.93
5.87
4.88
4.93
5.37
Benchmark return
6.97
5.33
5.44
4.72
4.70
5.16
Relative return**
-0.29
0.60
0.43
0.16
0.23
0.21 Ex – post standard deviation, composite return
2.08
2.72
4.27
3.84
3.70
3.50
Ex – post standard deviation, benchmark return
2.13
2.81
3.62
3.37
3.36
3.26
Ex – post tracking error
0.22
0.49
1.96
1.68
1.40
1.16
Information ratio
-1.27
1.24
0.22
0.09
0.16
0.18 Note: Returns are gross of fee and stated in per cent. Standard deviation stated in per cent.
* CCY is the currency basket corresponding to the currency composition in the fund’s benchmark portfolio. The basket consists of 35 currencies internationally. The use of the currency basket is mandated by the Ministry of Finance.
** Relative return is supplemental information.
23
Composite creation date and inception date
The composite inception date and the composite creation date of the Government Pension Fund Global, fixed
income is 31 December 1997.
Composite description
The Government Pension Fund Global, fixed income is the fixed income composite of the total Pension Fund.
Since 2009, the composite has been managed with a fundamentally based strategy, including reduced leverage,
less use of derivatives and increased focus on analysing issuers. Before this time, the investment strategy was to
exploit liquidity and credit premiums in different sectors of the fixed income market.
Derivatives, leverage and short-selling
NBIM’s access to the use of financial derivatives is regulated as part of the provisions on the management of the
Government Pension Fund Global laid down by the Norwegian Ministry of Finance and available on their web
site. Specifically, derivatives that are naturally related to equity and fixed-income securities may be used. In
accordance with this investment mandate, the Pension Fund may use exchange traded future and option contracts
and over-the-counter (OTC) derivative contracts such as interest-rate swaps, credit-default swaps and equity
swaps in order to achieve the lowest possible transaction cost, and to efficiently rebalance the portfolio. The
segmented net fair values and exposure of the financial derivatives for the last three years are shown in a table
below. For options the exposure is delta adjusted. Descriptions of these instruments can be found elsewhere in
the presentation.
Financial
derivatives
Asset
class
Average exposure through year (NOKm)
2012 2011 2010
Net fair value
Year-end (NOKm)
Purchased Sold Purchased Sold Purchased Sold 2012 2011 2010
Foreign exchange contracts Common 81 006 - 64 778 - 27 468 - -57 639 86 Exchange traded futures Common 302 10 708 5 228 9 851 20 557 16 267 130 -219 21
Interest-rate swaps Fixed
income 5 333 15 849 20 106 52 806 14 035 70 908 -1 417 -4 176 -5 453 Credit-default swaps
Fixed income 728 5 19 373 280 30 926 2 434 - 2 -708
Swap options and FX options
Fixed income - - 14 464 11 987 24 829 15 840 - - -194
The use of leverage is not regulated in the current provisions on the management of the Government Pension
Fund Global. However, restrictions are laid down as part of the CEO investment mandate issued by Norges
Bank’s Executive Board. Historically, leverage has predominantly been used within the fixed-income composite
to exploit differences in rates or credit spreads by combining derivatives, forward contracts and repurchase
agreements. This activity is reflected in the Pension Fund’s balance sheet when the gross value of the bonds
exceeds the fair value of the fixed-income composite. Leverage as described above was scaled back in the
second half of 2009 due to changes in market conditions and a reorganization of NBIM’s fixed-income
management. In 2011, NBIM’s definition for net leverage changed. Rather than looking at the net sum of all
cash positions, the metric is now calculated by comparing net exposure and actual market value (net asset value).
Net exposure is found by converting all derivatives to underlying exposure. The new methodology was
implemented as of 1 January 2011 and no numbers are restated. Below, the net leverage in per cent of the

24
composite’s fair value is shown as a times series. A negative value means the composite is unlevered. The red
dashed line indicates the average value within a year.
The possibility for short-selling is permitted in the management of the Pension Fund given that NBIM has access
to established loan facilities. However, restrictions are laid down as part of the CEO investment mandate issued
by Norges Bank’s Executive Board. Shorting on the fixed income side was close to zero in 2012 except from a
trade on the last day of August. The graph below shows the amount of shorting as a percentage of the composite
fair value. Shorting is defined as the sum of negative net asset values at security level. The red dashed line
indicates the average value within the year.
Sub-advisors
NBIM uses external managers to handle parts of the portfolio. NBIM awards management mandates to
organizations with expertise in clearly defined sectors and/or regions. The fund’s externally managed mandates
had assets under management worth NOK 150 billion at the end of 2012. This is equivalent to 4 per cent of the
fund’s total value compared to 4 per cent a year earlier. External fixed income mandates accounted for 3% of the
total external assets under management. The complete list of organizations managing assets on behalf of NBIM
is detailed in the Annual reports available on www.nbim.no.

25
Benchmark
The benchmark of the Government Pension Fund Global, fixed income, is weighted by 70% Government and
30% Private bonds. The index consist of the Barclays Global inflation linked index, the Barclays Global treasury
GDP weighted by country index and the subgroup Supranational (within government related) in the Barclays
Global aggregate bond index for the government sector and all Corporate bonds and sub group covered bonds
within Barclays Global aggregate limited to the currencies USD, CAD, EUR, GBP, SEK, DKK and CHF. The
Barclays indices are not adjusted for withholding tax. At year-end the benchmark constituted of 21 currencies
and in excess of 9,000 securities. The benchmark is adjusted for excluded companies/issuers. The actual weights
of the benchmark as of 31 December 2012 can be seen below. Strategic changes to the fixed income benchmark
through time are also detailed below. Note that benchmark is described elsewhere in this presentation.
Fixed income
Country for equity benchmark Currency for fixed income benchmark
Strategic benchmark indices
Actual benchmark index
Asset class weights 39.3 38.8
Euro-area (EUR) 32.2
UK (GBP) 6.9
Denmark (DKK) 0.6
Switzerland (CHF) 1.4
Sweden (SEK) 1.3
Czech Republic (CZK) 0.3
Poland (PLN) 0.7
Total Europa 43.4
Israel (ILS) 0.3
South Africa (ZAR) 0.6
Total Middle East and Africa 0.9
Canada (CAD) 3.2
Chile (CLP) 0.3
Mexico (MXN) 1.6
USA (USD) 37.3
Total Americas 42.5
Australia (AUD 2.0
Hong Kong (HKD) 0.3
Japan (JPY) 7.9
South Korea (KRW) 1.5
Malaysia (MYR) 0.4
New Zealand (NZD) 0.2
Singapore (SGD) 0.4
Thailand (THB) 0.5
Total Asia/ Oceania 13.2
26
Fee schedule
Performance numbers are gross of management fees and custodial fees but net of all trading expenses
(transaction costs). In addition, non-reclaimable withholding taxes are deducted in the performance numbers.
NBIM does not operate with a fee schedule as mutual funds do. The Ministry of Finance has defined an upper
limit of 9 basis points of average assets under management of which NBIM will be reimbursed. Costs above this
upper limit are not covered. In addition, performance based fees to external managers are covered. As of 31
December 2012 the annual total expense ratio was 0.06% down from 0.08% one year prior.
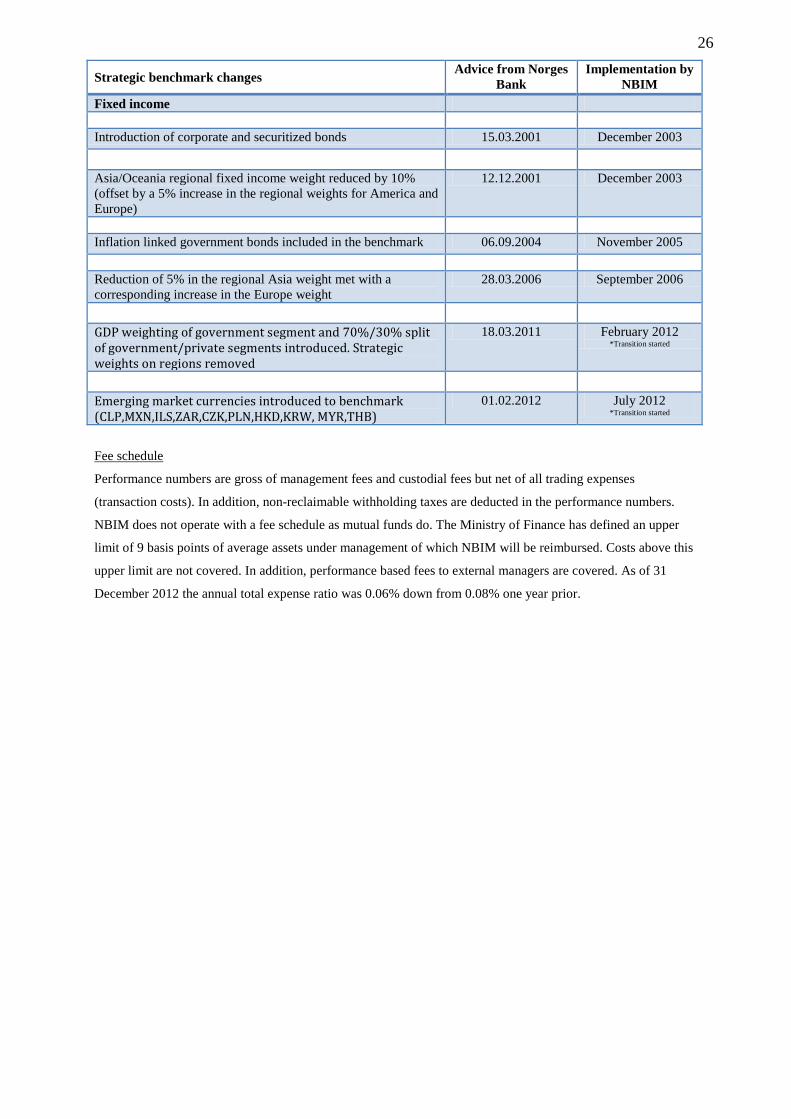
Strategic benchmark changes Advice from Norges Bank
Implementation by NBIM
Fixed income Introduction of corporate and securitized bonds 15.03.2001 December 2003 Asia/Oceania regional fixed income weight reduced by 10% (offset by a 5% increase in the regional weights for America and Europe)
12.12.2001 December 2003
Inflation linked government bonds included in the benchmark 06.09.2004 November 2005 Reduction of 5% in the regional Asia weight met with a corresponding increase in the Europe weight
28.03.2006 September 2006
GDP weighting of government segment and 70%/30% split of government/private segments introduced. Strategic weights on regions removed
18.03.2011 February 2012 *Transition started
Emerging market currencies introduced to benchmark (CLP,MXN,ILS,ZAR,CZK,PLN,HKD,KRW, MYR,THB)
01.02.2012 July 2012 *Transition started

27
Performance results: Government Pension Fund Global, real estate 31 March 2011 – 31 December 2012
Report presented as of: 31 December 2012 Reported assets currency: NOK Reported returns currency: CCY*
Calendar year
Composite total return
Income return
Capital return
Number of portfolios
Composite assets
External valuation %
Firm assets
2011 -4.37 2.11 -6.35 1 11 129 100.00 3 539 396 2012 5.77 4.23 1.53 1 25 123 100.00 4 043 153
Note: Returns presented gross of fee and stated in per cent. Assets stated in millions. A measure of internal dispersion is not provided since the composite contains only one portfolio.
Key metrics (annualised) 1 year 3 years 5 years 7 years 10 years Inception**
Composite total return 5.77 - - - - 0.66
Income return 4.23 - - - - 3.62
Capital return 1.53 - - - - -2.84 Note: Returns stated gross of fee and stated in per cent.
* CCY is the currency basket corresponding to the currency composition in the fund’s benchmark portfolio. The basket consists of 35 currencies internationally. The use of the currency basket is mandated by the Ministry of Finance.
** From 31 March 2011.

28
Composite creation date and inception date
The composite inception date and the composite creation date of the Government Pension Fund Global, real
estate is 31 March 2011.
Composite description
The Government Pension Fund Global, real estate is the real estate composite of the total Pension Fund. In
March 2010, the fund was given a mandate to invest as much as 5% of its assets in real estate within Europe,
while correspondingly reducing the share of fixed income investments. Real estate investments will take place
over time and be spread over different types of sectors and countries. The real estate portfolio will mainly invest
in traditional commercial property types located within well-developed markets.
The Ministry of Finance has set forth a general framework for the management of the real estate composite.
NBIM may invest in European real estate through Norwegian or other legal entities but not in real estate located
in Norway. Capital shall not be invested in securities issued by enterprises that the Ministry has excluded from
the investment universe. The Executive Board has further set specific limits on real estate management.
Derivatives and leverage
NBIM’s access to the use of financial derivatives is regulated as part of the provisions on the management of the
Government Pension Fund Global laid down by the Norwegian Ministry of Finance and available on their web
site. Specifically, derivatives that are naturally related to real estate securities may be used. However, there was
no use of derivatives in the composite in 2012.
Regarding leverage, the Executive Board has specified that the debt ratio of the real estate portfolio shall not
exceed 50%. At year-end, one of the real estate investments was levered. The amount was 16% of total real
estate assets.
Description of discretion
Within the mandate, NBIM has discretion in its investment selection activities. Regarding rights to dispose of the
assets, there exist general lock-up provisions on the current portfolio of investments as set forth in the
agreements with NBIM’s counterparts.
Valuation
The basis of accounting is International Financial Reporting Standards (IFRS). Real estate investments are
measured at fair value. At each calendar year end real estate investments are adjusted to reflect their fair values
as estimated by external independent valuation specialists using the discounted cash flow method (DCF) and the
yield method, unless it is deemed that the acquisition price is a better estimate of fair value. At each calendar
quarter end an independent external valuation is obtained. On a monthly basis the value used in the performance
calculations is the last quarter’s value adjusted for changes in the cash position due to operating expenses and
rental income in addition to FX movements.

29
Calculation methodology – real estate
In addition to the general disclosures on calculation methodology, this section describes specific methodology
related to real estate. Composite total returns are calculated monthly and component returns (income and capital
return) are calculated daily both on a time weighted basis and geometrically linked across months. Returns
include cash and cash equivalents. Component returns are calculated separately. The linking of component
returns across months will result in a residual when comparing annual total returns and the sum of component
returns. This residual is normal and acceptable as component returns are approximations. No adjustment is made
to counter this effect. Returns are gross of fee. Returns are presented after transaction costs and after expensed
operating costs relating to the operations of the real estate investment structure. Operating costs include bank
charges, consulting and legal fees and administration expenses. Transaction costs and operating costs are
included in the capital return component. Returns are presented before NBIM’s internal costs related to real
estate such as salaries to the real estate investment team. Returns are measured in the currency basket
corresponding to the currencies in the Pension Fund’s equity and fixed income benchmark.
Benchmark description
The benchmark of the Government Pension Fund Global, real estate, is the Investment Property Databank’s
(IPD) Global Property benchmark, European part (excluding Norway). As the real estate portfolio is in its
development phase no meaningful comparison to the benchmark can be made and as such, no benchmark returns
are presented. Note that benchmark and portfolio rebalancing is described elsewhere in this presentation.
Fee schedule
NBIM does not operate with a fee schedule as other real estate managers. The Ministry of Finance has defined
an upper limit of 9 basis points of average assets under management of which NBIM will be reimbursed. Costs
above this upper limit are not covered. In addition, performance based fees to external managers are covered.
Please refer to the detailed management costs table presented elsewhere in the report.
30
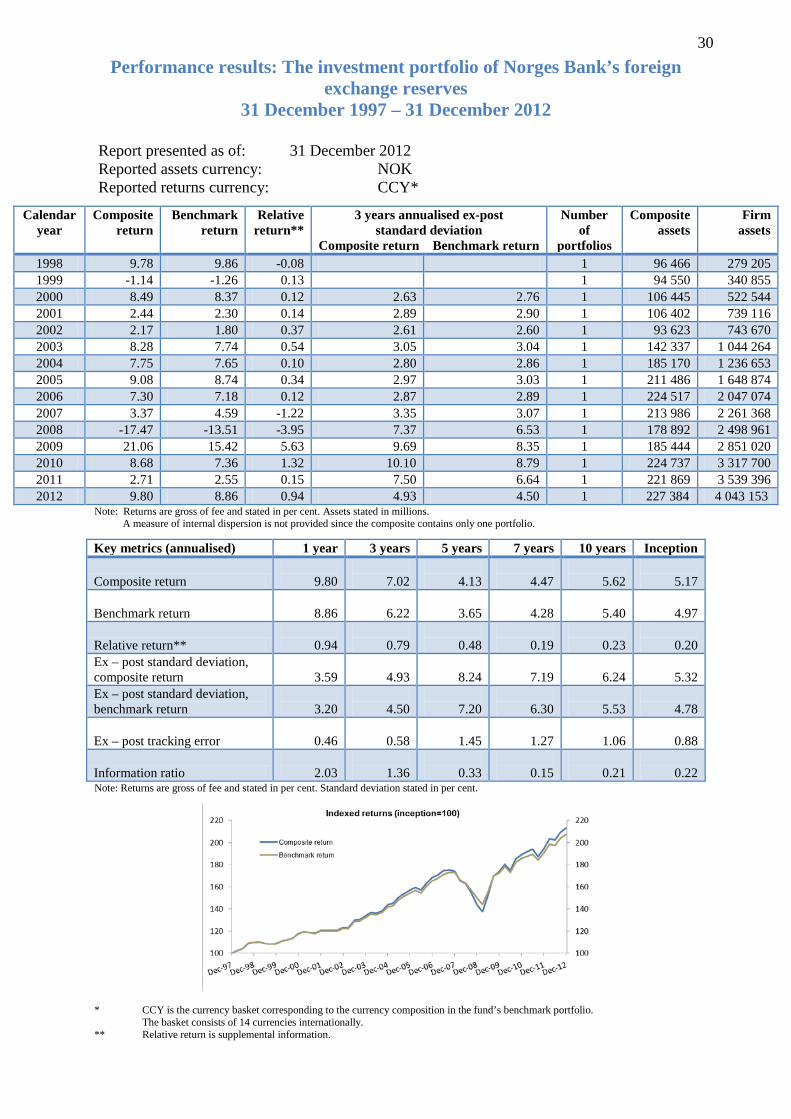
Performance results: The investment portfolio of Norges Bank’s foreign exchange reserves
31 December 1997 – 31 December 2012
Report presented as of: 31 December 2012 Reported assets currency: NOK Reported returns currency: CCY*
Calendar year
Composite return
Benchmark return
Relative return**
3 years annualised ex-post standard deviation
Composite return Benchmark return
Number of
portfolios
Composite assets
Firm assets
1998 9.78 9.86 -0.08 1 96 466 279 205 1999 -1.14 -1.26 0.13 1 94 550 340 855 2000 8.49 8.37 0.12 2.63 2.76 1 106 445 522 544 2001 2.44 2.30 0.14 2.89 2.90 1 106 402 739 116 2002 2.17 1.80 0.37 2.61 2.60 1 93 623 743 670 2003 8.28 7.74 0.54 3.05 3.04 1 142 337 1 044 264 2004 7.75 7.65 0.10 2.80 2.86 1 185 170 1 236 653 2005 9.08 8.74 0.34 2.97 3.03 1 211 486 1 648 874 2006 7.30 7.18 0.12 2.87 2.89 1 224 517 2 047 074 2007 3.37 4.59 -1.22 3.35 3.07 1 213 986 2 261 368 2008 -17.47 -13.51 -3.95 7.37 6.53 1 178 892 2 498 961 2009 21.06 15.42 5.63 9.69 8.35 1 185 444 2 851 020 2010 8.68 7.36 1.32 10.10 8.79 1 224 737 3 317 700 2011 2.71 2.55 0.15 7.50 6.64 1 221 869 3 539 396 2012 9.80 8.86 0.94 4.93 4.50 1 227 384 4 043 153
Note: Returns are gross of fee and stated in per cent. Assets stated in millions. A measure of internal dispersion is not provided since the composite contains only one portfolio.
Key metrics (annualised) 1 year 3 years 5 years 7 years 10 years Inception
Composite return
9.80
7.02
4.13
4.47
5.62
5.17
Benchmark return
8.86
6.22
3.65
4.28
5.40
4.97
Relative return**
0.94
0.79
0.48
0.19
0.23
0.20 Ex – post standard deviation, composite return
3.59
4.93
8.24
7.19
6.24
5.32
Ex – post standard deviation, benchmark return
3.20
4.50
7.20
6.30
5.53
4.78
Ex – post tracking error
0.46
0.58
1.45
1.27
1.06
0.88
Information ratio
2.03
1.36
0.33
0.15
0.21
0.22 Note: Returns are gross of fee and stated in per cent. Standard deviation stated in per cent.
* CCY is the currency basket corresponding to the currency composition in the fund’s benchmark portfolio. The basket consists of 14 currencies internationally.
** Relative return is supplemental information.

31
Composite creation date and inception date
The composite inception date and the composite creation date of the investment portfolio of Norges Bank’s
foreign exchange reserves is 31 December 1997.
Composite description
NBIM is by mandate from Norges Bank’s Executive Board responsible for the management of the investment
portfolio of the Norges Bank’s foreign exchange reserves. The investment portfolio has a long-term investment
horizon where the aim is to generate the highest possible return within the constraints set out in the guidelines
issued by the Executive Board. This composite is the aggregate of the equity and fixed income composites. The
strategic asset class weights were 40% equity and 60% fixed income in 2012. Until 2010 the management of the
portfolio was based on the same overall processes and procedures as the management for the Pension Fund,
albeit different investment mandates. However, in February 2010 the Executive Board adopted new guidelines as
the experience from the financial crisis showed that the need for foreign currency in Norges Bank’s tradition
central banking activities was greater than previously assumed. It was therefore necessary to improve the
liquidity of the portfolio. The major changes were the removal of the corporate, securitized and inflation-linked
sector of the bond index, the removal of emerging markets and the implementation of market capitalization
weights instead of custom regional weights on the equity index. The fixed income benchmark now only consists
of treasuries and the highest graded government related bonds. The bonds are denominated in US dollars, euro,
pounds sterling and Japanese yen. The changes were effective from 30 June 2010 on the benchmark side while
the changes in the portfolio will be implemented gradually. In March 2011, the fixed income benchmark was
limited to only government bonds in the previously mentioned currencies. The Executive Board has set limits for
how much risk NBIM may take in its active management. The most important limit is expressed as expected
tracking error (relative volatility) and puts a ceiling on how much the return on the fund may be expected to
deviate from the return on the benchmark portfolio. The expected tracking error limit is 100 basis points. The
Executive Board has put further risk restrictions relating to the Reserves Fund, amongst other relating to
maximum allowed leverage, short-selling and liquidity. NBIM seeks to increase returns through active
investment decisions and through active ownership within the limits set by the mandate.
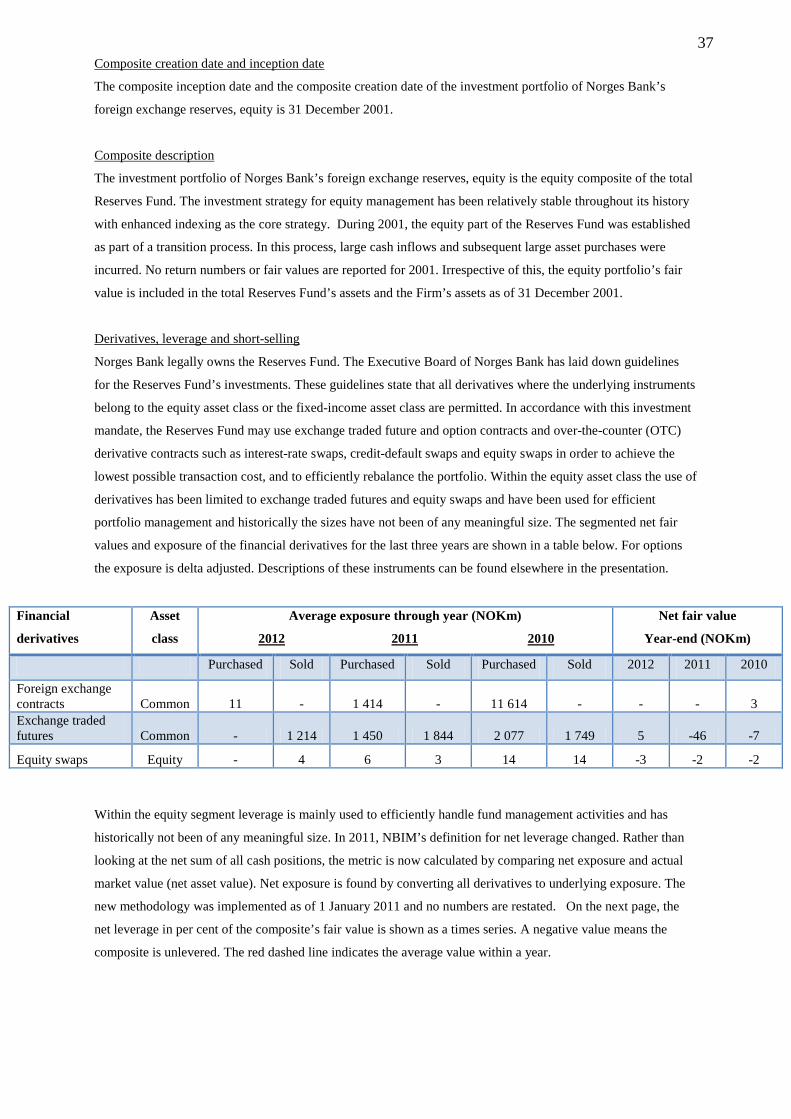
Derivatives, leverage and short-selling
Norges Bank legally owns the Reserves Fund. The Executive Board of Norges Bank has laid down guidelines
for the Reserves Fund’s investments. These guidelines state that all derivatives where the underlying instruments
belong to the equity asset class or the fixed-income asset class are permitted. In accordance with this investment
mandate, the Reserves Fund can make use of exchange traded future and option contracts and over-the-counter
(OTC) derivative contracts such as interest-rate swaps, credit-default swaps and equity swaps in order to achieve
the lowest possible transaction cost, and to efficiently rebalance the portfolio. The segmented net fair values and
exposure of the financial derivatives for the last three years are shown in a table below. For options the exposure
is delta adjusted. Descriptions of these instruments can be found elsewhere in the presentation.

32
Financial
derivatives
Asset
class
Average exposure through year (NOKm)
2012 2011 2010
Net fair value
Year-end (NOKm)
Purchased Sold Purchased Sold Purchased Sold 2012 2011 2010
Foreign exchange contracts Common 11 - 1 414 - 11 614 - - - 3 Exchange traded futures Common - 1 214 1 450 1 844 2 077 1 749 5 -46 -7 Equity swaps Equity - 4 6 3 14 14 -3 -2 -2
Interest-rate swaps Fixed
income - - - 1 035 1 248 4 386 - - -185 Credit-default swaps
Fixed income - - - - 198 36 - - -
Swap options and FX options
Fixed income - - - - 1 135 608 - - -
Historically, leverage has predominantly been used within the fixed-income composite to exploit differences in
rates or credit spreads by combining derivatives, forward contracts and repurchase agreements. This activity is
reflected in the Reserves Fund’s balance sheet when the gross value of the bonds exceeds the fair value of the
fixed-income composite. Leverage as described above was scaled back the second half of 2009 due to changes in
market conditions and a reorganization of NBIM’s fixed-income management. Within the equity segment
leverage is mainly used to efficiently handle fund management activities and has historically been insignificant.
In 2011, NBIM’s definition for net leverage changed. Rather than looking at the net sum of all cash positions,
the metric is now calculated by comparing net exposure and actual market value (net asset value). Net exposure
is found by converting all derivatives to underlying exposure. The new methodology was implemented as of 1
January 2011 and no numbers are restated. Below, the net leverage in per cent of the composite’s fair value is
shown as a times series. A negative value means the composite is unlevered. The red dashed line indicates the
average value within a year.
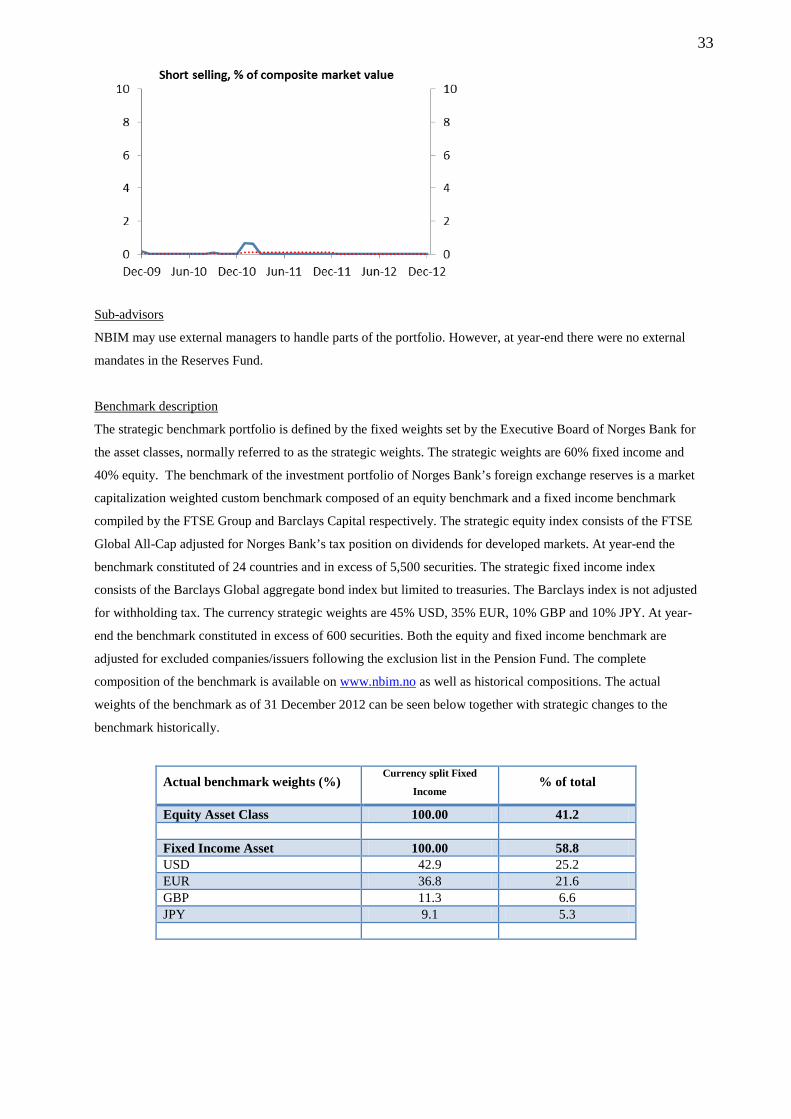
Shorting on the equity and fixed income side was zero throughout 2012. Shorting is defined as the sum of
negative net asset values at security level. The total is the sum of equity and fixed income shorts. The red dashed
line indicates the average value within the year.
33
Sub-advisors
NBIM may use external managers to handle parts of the portfolio. However, at year-end there were no external
mandates in the Reserves Fund.
Benchmark description
The strategic benchmark portfolio is defined by the fixed weights set by the Executive Board of Norges Bank for
the asset classes, normally referred to as the strategic weights. The strategic weights are 60% fixed income and
40% equity. The benchmark of the investment portfolio of Norges Bank’s foreign exchange reserves is a market
capitalization weighted custom benchmark composed of an equity benchmark and a fixed income benchmark
compiled by the FTSE Group and Barclays Capital respectively. The strategic equity index consists of the FTSE
Global All-Cap adjusted for Norges Bank’s tax position on dividends for developed markets. At year-end the
benchmark constituted of 24 countries and in excess of 5,500 securities. The strategic fixed income index
consists of the Barclays Global aggregate bond index but limited to treasuries. The Barclays index is not adjusted
for withholding tax. The currency strategic weights are 45% USD, 35% EUR, 10% GBP and 10% JPY. At year-
end the benchmark constituted in excess of 600 securities. Both the equity and fixed income benchmark are
adjusted for excluded companies/issuers following the exclusion list in the Pension Fund. The complete
composition of the benchmark is available on www.nbim.no as well as historical compositions. The actual
weights of the benchmark as of 31 December 2012 can be seen below together with strategic changes to the
benchmark historically.
Actual benchmark weights (%) Currency split Fixed
Income % of total
Equity Asset Class 100.00 41.2 Fixed Income Asset 100.00 58.8 USD 42.9 25.2 EUR 36.8 21.6 GBP 11.3 6.6 JPY 9.1 5.3

34
Benchmark rebalancing
The strategic benchmark portfolio is defined by the fixed weights set by the Executive Board of Norges Bank for
the asset classes, normally referred to as the strategic weights. These are the initial weights in the actual
benchmark portfolio that the fund’s management follows and is measured against. Divergent price movements in
the different asset classes will over time lead to weight changes in the actual benchmark portfolio. For example,
a stronger increase in equity prices will push the equities portion above 40 per cent. As a result, the actual
benchmark portfolio may deviate from the strategic long-term benchmark portfolio. Rebalancing is the process
of bringing the weights in the actual benchmark portfolio closer to the strategic weights by buying or selling
assets. The rebalancing regime set by the Executive Board of Norges Bank details that the benchmark will be
rebalanced within three months if the actual benchmark asset class weights deviate by more than a set limit
measured as of the last trading day of the month.
Strategic benchmark changes Decision by Executive Board
Implementation by NBIM
Capital Allocation Equity allocation is set at 20% 19.07.2000 Starts December 2000 Equity allocation is increased from 20% to 40% 03.07.2002 December 2002 Equity Inclusion of developed Emerging Markets 01.07.2004 November 2004 Benchmark changed from FTSE All World to FTSE All Cap 12.06.2007 September 2007 Emerging markets removed from the benchmark 03.02.2010 June 2010 Fixed income Inclusion of non-Government Guaranteed Bonds 03.07.2002 March 2003 Inclusion of Inflation Index Bonds 01.07.2004 November 2004 Benchmark to only include government securities (treasuries) and securities issued by international organizations of the highest credit quality (government-related)
03.02.2010 June 2010
Currencies limited to USD, JPY, EUR and GBP 03.02.2010 June 2010 Benchmark to only include government securities (treasuries) 16.03.2011 April 2011

35
Fee schedule
Performance numbers are gross of management fees and custodial fees but net of all trading expenses
(transaction costs). In addition, non-reclaimable withholding taxes are deducted in the performance numbers.
NBIM does not operate with a fee schedule as mutual funds do and costs for the management of the Reserves
Fund are not reimbursed as for the Pension Fund. As of 31 December 2012 the annual total expense ratio was
0.04%. The table below shows the different components of the total management costs.
NBIM management costs 2012
NOK 1000 Per cent
2011
NOK 1000 Per cent
Internal costs 56 638 60 309
Custody and settlement costs 12 311 19 086
Minimum fees to external managers - 921
Performance based fees to external managers - -
Other costs 19 886 21 996
Total management costs 88 835 0.04 102 312 0.05 Total management cost excl. performance based fees 88 835 0.04 102 312 0.05
36
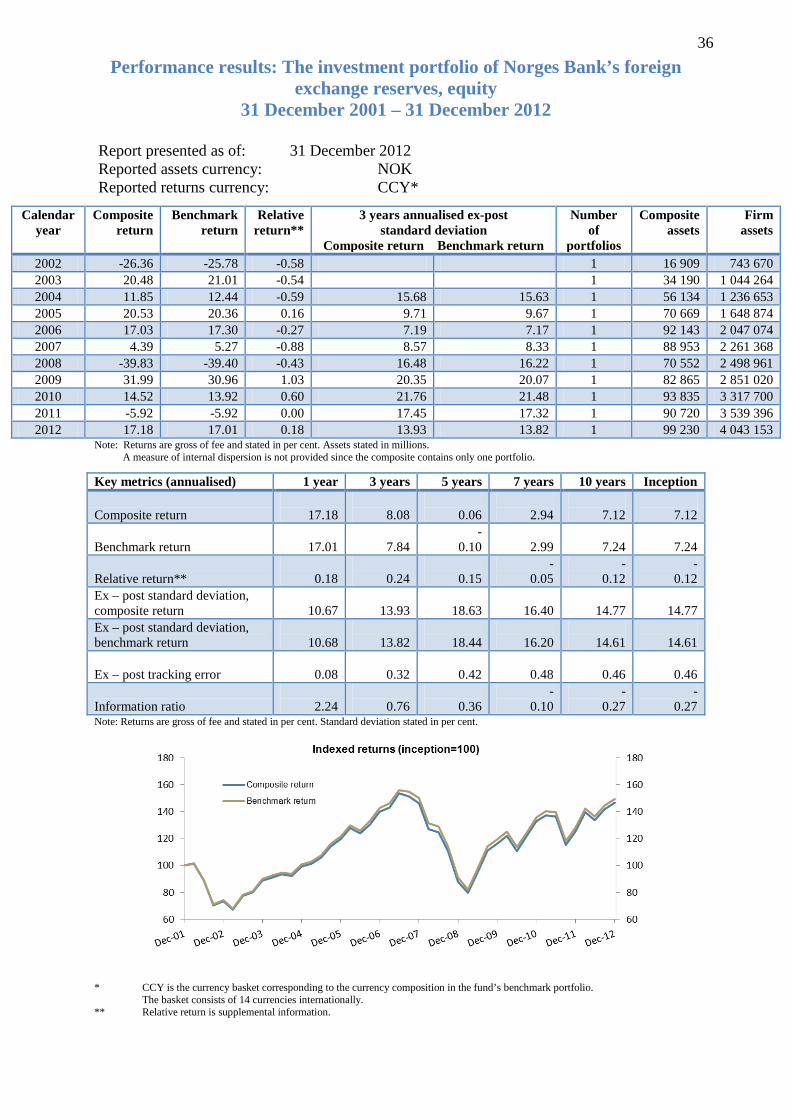
Performance results: The investment portfolio of Norges Bank’s foreign exchange reserves, equity
31 December 2001 – 31 December 2012
Report presented as of: 31 December 2012 Reported assets currency: NOK Reported returns currency: CCY*
Calendar year
Composite return
Benchmark return
Relative return**
3 years annualised ex-post standard deviation
Composite return Benchmark return
Number of
portfolios
Composite assets
Firm assets
2002 -26.36 -25.78 -0.58 1 16 909 743 670 2003 20.48 21.01 -0.54 1 34 190 1 044 264 2004 11.85 12.44 -0.59 15.68 15.63 1 56 134 1 236 653 2005 20.53 20.36 0.16 9.71 9.67 1 70 669 1 648 874 2006 17.03 17.30 -0.27 7.19 7.17 1 92 143 2 047 074 2007 4.39 5.27 -0.88 8.57 8.33 1 88 953 2 261 368 2008 -39.83 -39.40 -0.43 16.48 16.22 1 70 552 2 498 961 2009 31.99 30.96 1.03 20.35 20.07 1 82 865 2 851 020 2010 14.52 13.92 0.60 21.76 21.48 1 93 835 3 317 700 2011 -5.92 -5.92 0.00 17.45 17.32 1 90 720 3 539 396 2012 17.18 17.01 0.18 13.93 13.82 1 99 230 4 043 153
Note: Returns are gross of fee and stated in per cent. Assets stated in millions. A measure of internal dispersion is not provided since the composite contains only one portfolio.
Key metrics (annualised) 1 year 3 years 5 years 7 years 10 years Inception
Composite return
17.18
8.08
0.06
2.94
7.12
7.12
Benchmark return
17.01
7.84 -
0.10
2.99
7.24
7.24
Relative return**
0.18
0.24
0.15 -
0.05 -
0.12 -
0.12 Ex – post standard deviation, composite return
10.67
13.93
18.63
16.40
14.77
14.77
Ex – post standard deviation, benchmark return
10.68
13.82
18.44
16.20
14.61
14.61
Ex – post tracking error
0.08
0.32
0.42
0.48
0.46
0.46
Information ratio
2.24
0.76
0.36 -
0.10 -
0.27 -
0.27 Note: Returns are gross of fee and stated in per cent. Standard deviation stated in per cent.
* CCY is the currency basket corresponding to the currency composition in the fund’s benchmark portfolio. The basket consists of 14 currencies internationally.
** Relative return is supplemental information.
37
Composite creation date and inception date
The composite inception date and the composite creation date of the investment portfolio of Norges Bank’s
foreign exchange reserves, equity is 31 December 2001.
Composite description
The investment portfolio of Norges Bank’s foreign exchange reserves, equity is the equity composite of the total
Reserves Fund. The investment strategy for equity management has been relatively stable throughout its history
with enhanced indexing as the core strategy. During 2001, the equity part of the Reserves Fund was established
as part of a transition process. In this process, large cash inflows and subsequent large asset purchases were
incurred. No return numbers or fair values are reported for 2001. Irrespective of this, the equity portfolio’s fair
value is included in the total Reserves Fund’s assets and the Firm’s assets as of 31 December 2001.
Derivatives, leverage and short-selling
Norges Bank legally owns the Reserves Fund. The Executive Board of Norges Bank has laid down guidelines
for the Reserves Fund’s investments. These guidelines state that all derivatives where the underlying instruments
belong to the equity asset class or the fixed-income asset class are permitted. In accordance with this investment
mandate, the Reserves Fund may use exchange traded future and option contracts and over-the-counter (OTC)
derivative contracts such as interest-rate swaps, credit-default swaps and equity swaps in order to achieve the
lowest possible transaction cost, and to efficiently rebalance the portfolio. Within the equity asset class the use of
derivatives has been limited to exchange traded futures and equity swaps and have been used for efficient
portfolio management and historically the sizes have not been of any meaningful size. The segmented net fair
values and exposure of the financial derivatives for the last three years are shown in a table below. For options
the exposure is delta adjusted. Descriptions of these instruments can be found elsewhere in the presentation.
Financial
derivatives
Asset
class
Average exposure through year (NOKm)
2012 2011 2010
Net fair value
Year-end (NOKm)
Purchased Sold Purchased Sold Purchased Sold 2012 2011 2010
Foreign exchange contracts Common 11 - 1 414 - 11 614 - - - 3 Exchange traded futures Common - 1 214 1 450 1 844 2 077 1 749 5 -46 -7 Equity swaps Equity - 4 6 3 14 14 -3 -2 -2
Within the equity segment leverage is mainly used to efficiently handle fund management activities and has
historically not been of any meaningful size. In 2011, NBIM’s definition for net leverage changed. Rather than
looking at the net sum of all cash positions, the metric is now calculated by comparing net exposure and actual
market value (net asset value). Net exposure is found by converting all derivatives to underlying exposure. The
new methodology was implemented as of 1 January 2011 and no numbers are restated. On the next page, the
net leverage in per cent of the composite’s fair value is shown as a times series. A negative value means the
composite is unlevered. The red dashed line indicates the average value within a year.

38
The graph below shows the amount of shorting as a percentage of the composite fair value. Shorting is defined
as the sum of negative net asset values at security level. The red dashed line indicates the average value within
the year.
Sub-advisors
NBIM may use external managers to handle parts of the portfolio. However, at year-end there were no external
mandates in the Reserves Fund.
Benchmark description
The benchmark of the investment portfolio of Norges Bank’s foreign exchange reserves, equity is a market
capitalization weighted custom benchmark compiled by the FTSE Group. The strategic equity index consists of
the FTSE Global All-Cap for developed markets adjusted for Norges Bank’s tax position on dividends. The
equity benchmark is adjusted for excluded companies following the exclusion list in the Pension Fund. At year-
end the benchmark constituted of 24 countries and in excess of 5,500 securities. The actual benchmark weight
for equity was 41.2% at year-end 2012. The complete composition of the benchmark is available on
www.nbim.no as well as historical compositions. Historical strategic benchmark changes on the equity side are
detailed below. Note that benchmark and portfolio rebalancing is described elsewhere in this presentation.

39
Fee schedule
Performance numbers are gross of management fees and custodial fees but net of all trading expenses
(transaction costs). In addition, non-reclaimable withholding taxes are deducted in the performance numbers.
NBIM does not operate with a fee schedule as mutual funds do and costs for the management of the Reserves
Fund are not reimbursed as for the Pension Fund. As of 31 December 2012 the annual total expense ratio was
0.04%.
Strategic benchmark changes Decision by Executive Board
Implementation finalized by NBIM
Equity Inclusion of developed Emerging Markets 01.07.2004 November 2004 Benchmark changed from FTSE All World to FTSE All Cap 12.06.2007 September 2007
Emerging markets removed from the benchmark 03.02.2010 June 2010

40
Performance results: The investment portfolio of Norges Bank’s foreign exchange reserves, fixed income
31 December 1997 – 31 December 2012
Report presented as of: 31 December 2012 Reported assets currency: NOK Reported returns currency: CCY*
Calendar year Composite
return Benchmark
return Relative
return**
3 years annualised ex-post standard deviation
Composite return Benchmark return
Number of
portfolios
Composite assets
Firm assets
1998 9.78 9.87 -0.08 1 96 466 279 205 1999 -1.14 -1.26 0.13 1 94 550 340 855 2000 8.49 8.37 0.12 2.63 2.76 1 106 445 522 544 2001 5.11 4.95 0.16 3.09 3.11 1 83 414 739 116 2002 10.14 9.59 0.55 3.31 3.32 1 76 714 743 670 2003 4.51 3.97 0.54 4.02 4.02 1 108 147 1 044 264 2004 6.15 5.86 0.29 3.71 3.74 1 129 036 1 236 653 2005 4.12 3.78 0.34 3.33 3.36 1 140 817 1 648 874 2006 1.83 1.49 0.34 2.69 2.76 1 132 374 2 047 074 2007 2.68 4.13 -1.45 2.48 2.64 1 125 033 2 261 368 2008 -0.95 5.69 -6.65 3.89 3.82 1 108 340 2 498 961 2009 13.73 5.29 8.44 4.74 3.94 1 102 578 2 851 020 2010 4.50 2.69 1.81 4.97 4.15 1 130 901 3 317 700 2011 8.99 8.63 0.36 3.90 3.44 1 131 149 3 539 396 2012 4.69 3.80 0.89 3.25 3.37 1 128 153 4 043 153
Note: Returns are gross of fee and stated in per cent. Assets stated in millions. A measure of internal dispersion is not provided since the composite contains only one portfolio.
Key metrics (annualised) 1 year 3 years 5 years 7 years 10 years Inception
Composite return
4.69
6.04
6.08
4.97
4.96
5.43
Benchmark return
3.80
5.01
5.20
4.51
4.52
5.08
Relative return**
0.89
1.03
0.88
0.46
0.44
0.35 Ex – post standard deviation, composite return
3.03
3.25
4.30
3.88
3.71
3.53
Ex – post standard deviation, benchmark return
3.05
3.37
3.83
3.53
3.46
3.38
Ex – post tracking error
0.39
0.68
2.18
1.89
1.58
1.30
Information ratio
2.29
1.51
0.40
0.24
0.28
0.27 Note: Returns are gross of fee and stated in per cent. Standard deviation stated in per cent
* CCY is the currency basket corresponding to the currency composition in the fund’s benchmark portfolio. The basket consists of 14 currencies internationally.
** Relative return is supplemental information.
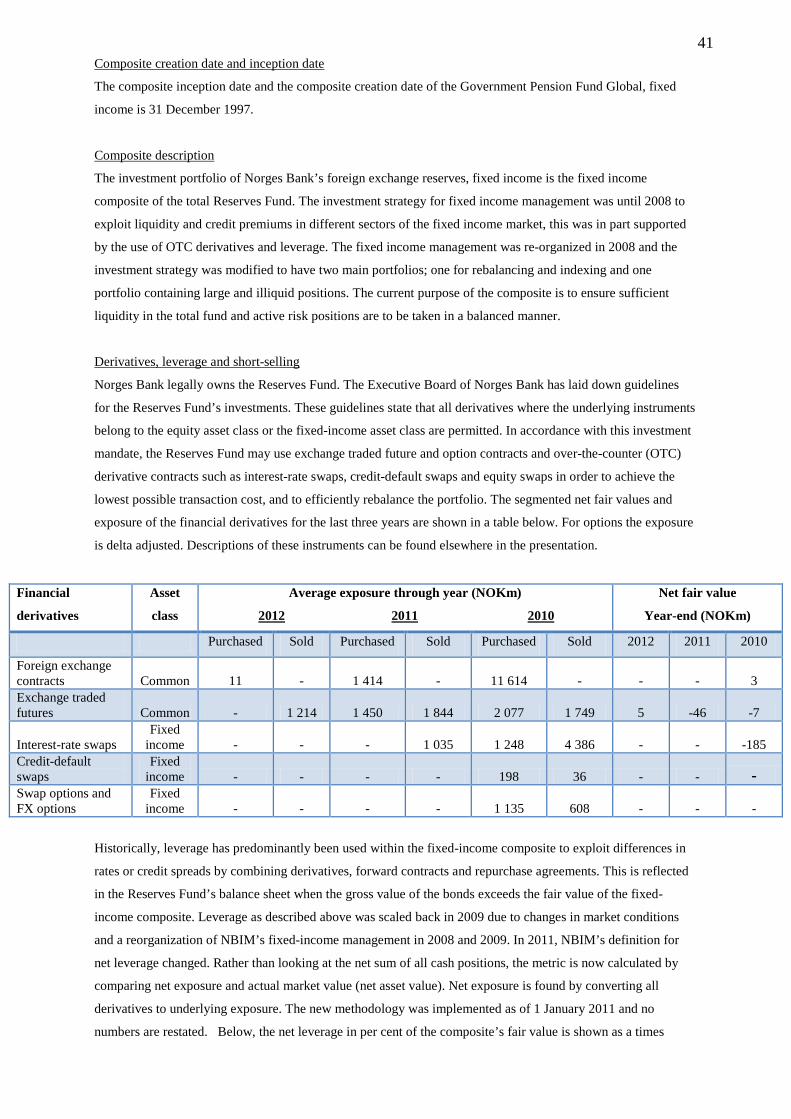
41
Composite creation date and inception date
The composite inception date and the composite creation date of the Government Pension Fund Global, fixed
income is 31 December 1997.
Composite description
The investment portfolio of Norges Bank’s foreign exchange reserves, fixed income is the fixed income
composite of the total Reserves Fund. The investment strategy for fixed income management was until 2008 to
exploit liquidity and credit premiums in different sectors of the fixed income market, this was in part supported
by the use of OTC derivatives and leverage. The fixed income management was re-organized in 2008 and the
investment strategy was modified to have two main portfolios; one for rebalancing and indexing and one
portfolio containing large and illiquid positions. The current purpose of the composite is to ensure sufficient
liquidity in the total fund and active risk positions are to be taken in a balanced manner.
Derivatives, leverage and short-selling
Norges Bank legally owns the Reserves Fund. The Executive Board of Norges Bank has laid down guidelines
for the Reserves Fund’s investments. These guidelines state that all derivatives where the underlying instruments
belong to the equity asset class or the fixed-income asset class are permitted. In accordance with this investment
mandate, the Reserves Fund may use exchange traded future and option contracts and over-the-counter (OTC)
derivative contracts such as interest-rate swaps, credit-default swaps and equity swaps in order to achieve the
lowest possible transaction cost, and to efficiently rebalance the portfolio. The segmented net fair values and
exposure of the financial derivatives for the last three years are shown in a table below. For options the exposure
is delta adjusted. Descriptions of these instruments can be found elsewhere in the presentation.
Financial
derivatives
Asset
class
Average exposure through year (NOKm)
2012 2011 2010
Net fair value
Year-end (NOKm)
Purchased Sold Purchased Sold Purchased Sold 2012 2011 2010
Foreign exchange contracts Common 11 - 1 414 - 11 614 - - - 3 Exchange traded futures Common - 1 214 1 450 1 844 2 077 1 749 5 -46 -7
Interest-rate swaps Fixed
income - - - 1 035 1 248 4 386 - - -185 Credit-default swaps
Fixed income - - - - 198 36 - - -
Swap options and FX options
Fixed income - - - - 1 135 608 - - -
Historically, leverage has predominantly been used within the fixed-income composite to exploit differences in
rates or credit spreads by combining derivatives, forward contracts and repurchase agreements. This is reflected
in the Reserves Fund’s balance sheet when the gross value of the bonds exceeds the fair value of the fixed-
income composite. Leverage as described above was scaled back in 2009 due to changes in market conditions
and a reorganization of NBIM’s fixed-income management in 2008 and 2009. In 2011, NBIM’s definition for
net leverage changed. Rather than looking at the net sum of all cash positions, the metric is now calculated by
comparing net exposure and actual market value (net asset value). Net exposure is found by converting all
derivatives to underlying exposure. The new methodology was implemented as of 1 January 2011 and no
numbers are restated. Below, the net leverage in per cent of the composite’s fair value is shown as a times
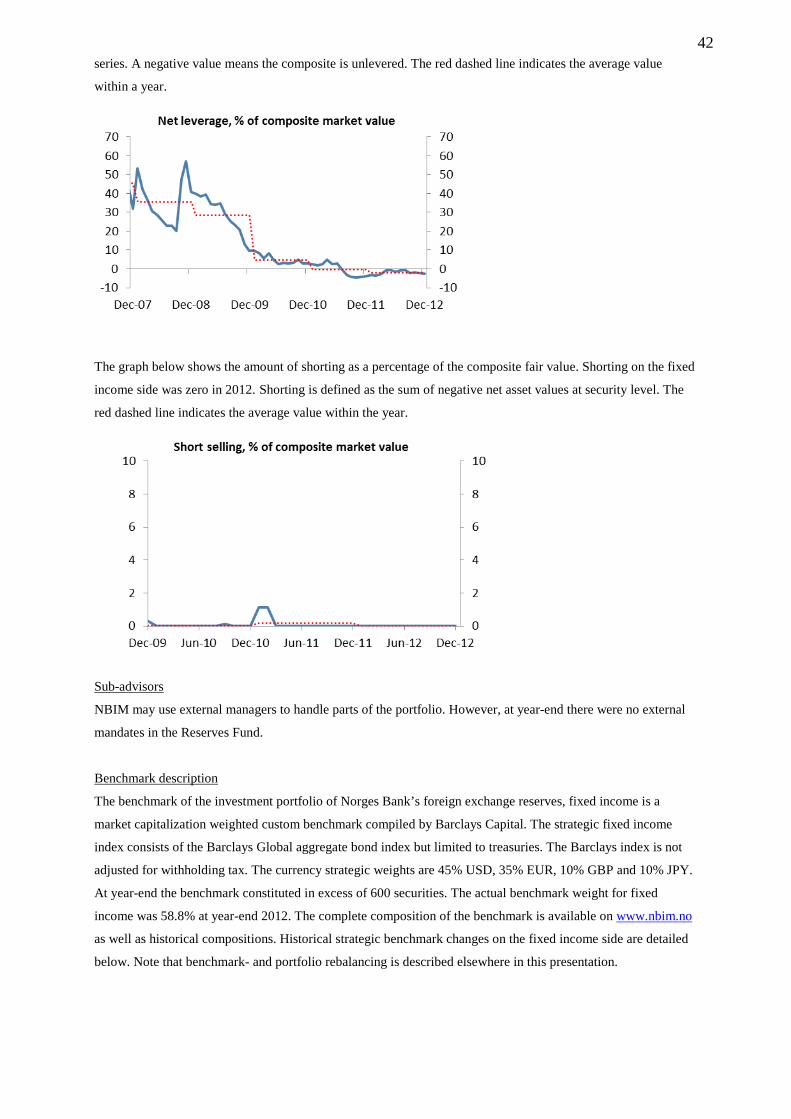
42
series. A negative value means the composite is unlevered. The red dashed line indicates the average value
within a year.
The graph below shows the amount of shorting as a percentage of the composite fair value. Shorting on the fixed
income side was zero in 2012. Shorting is defined as the sum of negative net asset values at security level. The
red dashed line indicates the average value within the year.
Sub-advisors
NBIM may use external managers to handle parts of the portfolio. However, at year-end there were no external
mandates in the Reserves Fund.
Benchmark description
The benchmark of the investment portfolio of Norges Bank’s foreign exchange reserves, fixed income is a
market capitalization weighted custom benchmark compiled by Barclays Capital. The strategic fixed income
index consists of the Barclays Global aggregate bond index but limited to treasuries. The Barclays index is not
adjusted for withholding tax. The currency strategic weights are 45% USD, 35% EUR, 10% GBP and 10% JPY.
At year-end the benchmark constituted in excess of 600 securities. The actual benchmark weight for fixed
income was 58.8% at year-end 2012. The complete composition of the benchmark is available on www.nbim.no
as well as historical compositions. Historical strategic benchmark changes on the fixed income side are detailed
below. Note that benchmark- and portfolio rebalancing is described elsewhere in this presentation.

43
Fee schedule
Performance numbers are gross of management fees and custodial fees but net of all trading expenses
(transaction costs). In addition, non-reclaimable withholding taxes are deducted in the performance numbers.
NBIM does not operate with a fee schedule as mutual funds do and costs for the management of the Reserves
Fund are not reimbursed as for the Pension Fund. As of 31 December 2012 the annual total expense ratio was
0.04%.
Strategic benchmark changes Decision by Executive Board
Implementation finalized by NBIM
Fixed income Inclusion of non Government Guaranteed Bonds 03.07.2002 March 2003 Inclusion of Inflation Index Bonds 01.07.2004 November 2004 Benchmark to only include government securities (treasuries) and securities issued by international organizations of the highest credit quality (government related)
03.02.2010 June 2010
Currencies limited to USD, JPY, EUR and GBP 03.02.2010 June 2010 Benchmark to only include government securities (treasuries) 16.03.2011 April 2011