Embed Size (px)
Citation preview
Annual Report 2017 – Nordea Bank S.A. 1
Annual Report 2017 Nordea Bank S.A.
Annual Report 2017 – Nordea Bank S.A. 2
Contents
Management report page 3
Audit report page 4
Statement of profit or loss and other comprehensive income page 8
Statement of financial position page 9
Statement of changes in equity page 10
Statement of cash flows page 11
Notes to the Financial Statements page 13-47

3Annual Report 2017 – Nordea Bank S.A.
The main focus of 2017 for Nordea Bank S.A. (the Bank), was to continue the efforts started in 2016. Transformation of the business in the form of implementing new regulations meant that significant resources were moved from customer engagement to internal projects.
Preparation and implementation of EMIR, MiFID II and IFRS 9 as well as delivery of the action plan created following the Panama Papers enquiry of 2016 were the main topics on the agenda. Unsurprisingly, the significant investments in these regulatory programmes have negatively impacted the finan-cial results for the year.
In July 2017 the Board of Directors appointed Mr. Flemming Lauridsen as Chief Executive Officer, and Ms. Åsa Carlevi as Chief Operating Officer.
Nordea Private BankingAs part of the transformation, in March 2017 the Board of Directors decided on a number of important strategic initiatives.
Firstly, the Transfer Agency and Fund Administration, as well as the 35 employees engaged in this activity, were transferred to Nordea Investment Funds S.A. (NIFSA) as contribution in kind (see note 15). Subsequently, ownership of NIFSA was transferred to another legal entity within the Nordea Group. This transfer was effective 10 July 2017.
Secondly, the Board of Directors decided to close the branch in Zürich, Switzerland, as part of the strategic refocus of the markets the Bank operates in. Client portfolios were either transferred to the Bank in Luxembourg, or to other banks, according to the wishes of the client. It is expected that the banking licence will be returned to the Swiss financial super-visory authority, FINMA, by mid-2018.
Finally, in a move directed at maintaining focus on the work needed to strengthen the Bank’s financial crime prevention efforts, the Board of Directors decided to suspend on-board-ing new clients until all new procedures and mitigating actions were fully implemented and tested.
These changes in strategic direction engendered adjustments to both the operating model and the organisation of the Bank. Provisions for restructuring were created which added to the negative financial impact of the year.
In December 2017 the Bank was one of 9 supervised entities to receive an administrative fine from the Luxembourg financial supervisory authority, the CSSF, for shortcomings in connection with documentation related to account openings for a number of clients in the period January 1988 to May 2016. The Bank is taking these lessons learned very seriously and is undertaking a major programme of improvements to its anti-money laun-dering and compliance procedures, as mentioned above. The Bank continues to co-operate fully with requests from domes-tic and foreign tax authorities. The Bank has placed significant emphasis on improving the risk and compliance culture, with strong focus on personal conduct and accountability.
Despite the high attention on internal topics, the Bank saw increased assets under management in its core and strategic markets. Total AuM decreased due to strategic wind-down of
the Zürich branch. Income from Private Banking operations remained in line with last year, but below expectations.
Financial position and dividendNordea Bank S.A. remains financially strong, with a CET1 cap-ital ratio of 21.5%, which is well above the legal requirement. Capital and reserves amounted to mEUR 427 at the end of 2017. Profit for the year, before depreciation, provisions and tax amounted to mEUR 94.1.
After depreciation and provisions, pre-tax profit amounted to mEUR 71.4 and net profit for the year was mEUR 71.9.
2017 profit is impacted by mEUR 0.6 in recovered provisions for net loan losses, mainly related to distressed mortgage loans in France and Spain. 2017 profits are also impacted by the strategic decisions taken, as mentioned above.
At the Annual General Meeting, the Board of Directors will propose a dividend of mEUR 75, which will be conditional on that the Bank maintains a Total Capital Ratio above 13% fol-lowing the dividend payment, including considerations on the costs and income streams related to the sale of parts of the Bank’s private banking business as well as the Bank’s running costs (both pre and post completion of the APA).
On 25 January 2018, the Bank entered into an agreement with UBS Europe SE for the sale of a major part of the Private Banking portfolio, including assets in both Luxembourg and Singapore. The Asset Purchase Agreement (APA) foresees the transfer of part of clients, assets and approximately 150 employees to UBS. The transaction and its completion, cur-rently planned for the second half of 2018, remain subject to applicable regulatory approvals and certain conditions.
After the completion of the Asset Purchase Agreement, the Bank will continue to service the clients not transferred to UBS. This operation is expected to be of minor size and not adequate alone to sustain the future cost scenarios. The Bank has initiated further analysis to guide the decision on how the Bank can plan for the future after completion of the transac-tion. The outcome of this analysis is expected during Q2 2018. There are neither current plans nor intentions to repatriate the capital until the restructuring of the Company is completed.
Otherwise, there have been no material events after the reporting date. Please refer to Note 37 of the financial statements.
The Bank’s financial risk management objectives and policies, as well as exposures to market risk, credit risk, liquidity risk and other types of risk is detailed in Note 33 of the financial statements.
The Bank has no research and development activities. The Bank did not acquire its own shares.
9 March 2018
Flemming Lauridsen Snorre Storset Chief Executive Officer Chairman of the Board of Directors
Management report 2017

Annual Report 2017 – Nordea Bank S.A. 4
Audit report
To the Board of Directors of Nordea Bank S.A.
Report on the audit of the financial statements
Our opinion In our opinion, the accompanying financial statements give a true and fair view of the financial position of Nordea Bank S.A. (the “Bank”) as at 31 December 2017, and of its financial performance and its cash flows for the year then ended in accordance with International Financial Reporting Standards (IFRSs) as adopted by the European Union.
What we have audited The Bank’s financial statements comprise:
• the statement of financial position as at 31 December 2017;• the statement of profit or loss and other comprehensive income for the year then ended;• the statement of changes in equity for the year then ended;• the statement of cash flows for the year then ended; and• the notes to the financial statements, which include a summary of significant accounting policies.
Basis for opinion We conducted our audit in accordance with the EU Regulation No 537/2014, the Law of 23 July 2016 on the audit profession (Law of 23 July 2016) and with International Standards on Auditing (ISAs) as adopted for Luxembourg by the “Commission de Surveillance du Secteur Financier” (CSSF). Our responsibilities under those Regulation, Law and standards are further described in the “Responsibilities of the “Réviseur d’entreprises agréé” for the audit of the financial statements” section of our report.
We believe that the audit evidence we have obtained is sufficient and appropriate to provide a basis for our opinion.
We are independent of the Bank in accordance with the International Ethics Standards Board for Accountants’ Code of Ethics for Professional Accountants (IESBA Code) as adopted for Luxembourg by the CSSF together with the ethical requirements that are relevant to our audit of the financial statements. We have fulfilled our other ethical responsibilities under those ethical requirements.
To the best of our knowledge and belief, we declare that we have not provided non-audit services that are prohibited under Article 5(1) of Regulation (EU) No 537/2014.
Material Uncertainty Related to Going ConcernWe draw attention to note 37 in the financial statements, which indicates that in January 2018 the Bank made decision to sell a significant part of the Private Banking business. These events or conditions indicate that a material uncertainty exists that may cast significant doubt on the Bank's ability to continue as a going concern. Our opinion is not modified in respect of this matter.
Key audit mattersKey audit matters are those matters that, in our professional judgment, were of most significance in our audit of the financial statements of the current period, and include the most significant assessed risks of material misstatement (whether or not due to fraud). These matters were addressed in the context of our audit of the financial statements as a whole, and in forming our opinion thereon, and we do not provide a separate opinion on these matters.

5Annual Report 2017 – Nordea Bank S.A.
Key audit matter
Impairment of loans and advances to the publicAs at 31 December 2017, the caption loans and receivables to the public encompass lombard and mortgage loans. Consid-ering high requirements for the level and qualitative of the collateral, no individual impairments were recognised in respect to lombard loans. In respect to mortgage loans, indi-vidual impairments of EUR 3.35 million were recorded. Such provision is assessed on individual basis and the Manage-ment applies judgement over timing of recognition of impair-ment and the size of any such impairment allowance. As of 31 December 2017 the Bank did not recognise any collective impairment provision.
Important area of focus in respect of loans and receiveables to the public relates to assumptions and estimates made by the Management underlying the calculation of individual impairment allowances on loans. Examples of these relate to the hair-cuts applied to the collateral valuation, discounting rates and property index value adjustments.
Another area of focus was the verification of the disclosures in respect of the transition from IAS 39 to IFRS 9 (effective as from 1 January 2018).
Refer to the note 12 “Loans and receivables” and note 31 “IFRS 9 transitional balances on 1 January 2018” of the finan-cial statements.
How our audit addressed the Key audit matter Our audit included a combination of internal controls and substantive testing.
We assessed and tested the design and operating effective-ness of the controls over:
– individually assessed loan impairment calculations on mortgage loans; – critical commitments monitoring; – sufficient collateral coverage on investment loans.
We tested the completeness and accuracy of the data used in the impairment calculation file by performing detailed testing of a sample of loans, traced amounts to supporting docu-ments and verified the mathematical accuracy of Manage-ment’s calculation file.
We challenged key assumptions used within the impairment calculation file by comparing them with external data market data.
In respect of the transition from IAS 39 to IFRS 9, we obtained undertanding of the revised impairment methodology and ensured that it is in line with new requirements. Also we checked computation of the collective and individual provi-sions under IFRS 9 and ensured that it is complete, accurate and reflects principles outlined in the revised impairment methodology.
Revenue recognitionThe Bank has multiple revenue streams, but the main focus was on the accuracy of the most significant revenue streams:
– interest income in respect of loans and advances to cred-it institutions and loans and receiveables to the public; – fee and commission income in respect of the portfolio management and custody services provided to the pri-vate banking clients, trading and other transactions relat-ed fees.
We identified this as an area of focus due to the high volume of low value transactions, each of which is reliant upon the correct charging structures and calculations within the sys-tem and adequacy of the controls in place.
Refer to note 4 “Net interest income” and note 5 “Net fee and commission income” in the financial statements.
Our audit included a combination of testing of internal con-trols and substantive testing.
We assessed and tested the design of operating effectiveness of the controls over:
– interest margin monitoring; – transactional and other fees monitoring.
We also validated with the responsible departments the pro-cess in respect of interest and commission rates input into the system T24.
By engaging Computer Assisted Audit Techniques, we ensured completeness of the journal entries posted to reve-nue accounts.
As a part of the test of details, we performed the following: – we reviewed underlying contracts and service level agreements and checked the accounting for consistency with those documents; – for the computations performed manually, we validated computation details and logic applied; – for automatically computed interest and commission streams, we performed IT enhanced procedures and rec-omputed the whole population based on the historical data extracted from T24; – we performed analytical review of the revenue streams by analysing historical trends and development of the respective fee base and investigated any unusual varia-tions comparing to the prior period.
Also, we reviewed management reporting in order to under-stand Management's monitoring practices over the revenue of the bank.

Annual Report 2017 – Nordea Bank S.A. 6
Key audit matter
The IT environment and IT General Controls (ITGCs) The Bank’s financial reporting processes is highly dependent on IT systems supporting automated accounting and reconcil-iation procedures. To ensure complete and accurate financial records it is important that the IT general controls are designed and operate effectively.
The Bank’s new core banking system was introduced life on 1st January 2016 and it is not yet fully stabilised. This resulted in fragmental interruption or operational inefficiency of some of the key controls done by the Bank during the year.
How our audit addressed the Key audit matter We evaluated the design and tested operating effectiveness of the IT General Controls, that are relevant for the financial reporting, focusing specifically on controls over access to pro-grams and data, program changes, IT operations and program development. Where necessary, we carried out direct tests of certain aspect of the security of the Bank’s IT systems, includ-ing logical access management and segregation of duties. For this purpose we involved specialists.
Additionally, we performed completeness testing over the journal entries throughout the year engaging CAATs to ensure integrity of the accounting data provided.

7Annual Report 2017 – Nordea Bank S.A.
Other information The Board of Directors is responsible for the other informa-tion. The other information comprises the information stated in the Management report and the Corporate Governance Statement but does not include the financial statements and our audit report thereon.
Our opinion on the financial statements does not cover the other information and we do not express any form of assur-ance conclusion thereon.
In connection with our audit of the financial statements, our responsibility is to read the other information identified above and, in doing so, consider whether the other information is materially inconsistent with the financial statements or our knowledge obtained in the audit, or otherwise appears to be materially misstated. If, based on the work we have per-formed, we conclude that there is a material misstatement of this other information, we are required to report that fact. We have nothing to report in this regard.
Responsibilities of the Board of Directors and those charged with governance for the financial statementsThe Board of Directors is responsible for the preparation and fair presentation of the financial statements in accordance with IFRSs, and for such internal control as the Board of Directors determines is necessary to enable the preparation of financial statements that are free from material misstate-ment, whether due to fraud or error.
In preparing the financial statements, the Board of Directors is responsible for assessing the Bank's ability to continue as a going concern, disclosing, as applicable, matters related to going concern and using the going concern basis of account-ing unless the Board of Directors either intends to liquidate the Bank or to cease operations, or has no realistic alternative but to do so.
Those charged with governance are responsible for oversee-ing the Bank’s financial reporting process.
Responsibilities of the “Réviseur d’entreprises agréé” for the audit of the financial statementsThe objectives of our audit are to obtain reasonable assurance about whether the financial statements as a whole are free from material misstatement, whether due to fraud or error, and to issue an audit report that includes our opinion. Reason-able assurance is a high level of assurance, but is not a guar-antee that an audit conducted in accordance with the EU Reg-ulation No 537/2014, the Law of 23 July 2016 and with ISAs as adopted for Luxembourg by the CSSF will always detect a material misstatement when it exists. Misstatements can arise from fraud or error and are considered material if, individually or in the aggregate, they could reasonably be expected to influence the economic decisions of users taken on the basis of these financial statements.
As part of an audit in accordance with the EU Regulation No 537/2014, the Law of 23 July 2016 and with ISAs as adopted for Luxembourg by the CSSF, we exercise professional judg-ment and maintain professional scepticism throughout the audit. We also:• identify and assess the risks of material misstatement of
the financial statements, whether due to fraud or error, design and perform audit procedures responsive to those risks, and obtain audit evidence that is sufficient and
appropriate to provide a basis for our opinion. The risk of not detecting a material misstatement resulting from fraud is higher than for one resulting from error, as fraud may involve collusion, forgery, intentional omissions, misrep-resentations, or the override of internal control;
• obtain an understanding of internal control relevant to the audit in order to design audit procedures that are appropri-ate in the circumstances, but not for the purpose of expressing an opinion on the effectiveness of the Bank's internal control;
• evaluate the appropriateness of accounting policies used and the reasonableness of accounting estimates and relat-ed disclosures made by the Board of Directors;
• conclude on the appropriateness of the Board of Directors' use of the going concern basis of accounting and, based on the audit evidence obtained, whether a material uncertain-ty exists related to events or conditions that may cast sig-nificant doubt on the Bank's ability to continue as a going concern. If we conclude that a material uncertainty exists, we are required to draw attention in our audit report to the related disclosures in the financial statements or, if such disclosures are inadequate, to modify our opinion. Our con-clusions are based on the audit evidence obtained up to the date of our audit report. However, future events or con-ditions may cause the Bank to cease to continue as a going concern;
• evaluate the overall presentation, structure and content of the financial statements, including the disclosures, and whether the financial statements represent the underlying transactions and events in a manner that achieves fair presentation;
We communicate with those charged with governance regarding, among other matters, the planned scope and tim-ing of the audit and significant audit findings, including any significant deficiencies in internal control that we identify during our audit.
We also provide those charged with governance with a state-ment that we have complied with relevant ethical require-ments regarding independence, and to communicate with them all relationships and other matters that may reasonably be thought to bear on our independence, and where applica-ble, related safeguards.
From the matters communicated with those charged with governance, we determine those matters that were of most significance in the audit of the financial statements of the current period and are therefore the key audit matters. We describe these matters in our audit report unless law or regu-lation precludes public disclosure about the matter.
Report on other legal and regulatory requirements The Management report is consistent with the financial state-ments and has been prepared in accordance with applicable legal requirements.
We have been appointed as “Réviseur d’Entreprises Agréé” of the Bank by the General Meeting of the Shareholders on 31 March 2017 and the duration of our uninterrupted engage-ment, including previous renewals and reappointments, is 3 years.
PricewaterhouseCoopers, Société coopérative Luxembourg, 20 March 2018
Represented by
Rima Adas
PricewaterhouseCoopers, Société coopérative, 2 rue Gerhard Mercator, B.P. 1443, L-1014 Luxembourg T: +352 494848 1, F: +352 494848 2900, www.pwc.lu
Cabinet de révision agréé. Expert-comptable(autorisation gouvernementale n°10028256) R.C.S. Luxembourg B65 477 - TVA LU25482518

Annual Report 2017 – Nordea Bank S.A. 8
Statement of profit or loss and other comprehensive income for the year ended 31 December 2017
The following notes form an integral part of these financial statements
EUR ‘000 Note(s) 2017 2016
Operating income
Interest income 4 33,353 32,177
Interest expense 4 -16,278 -11,062
Net interest income 17,075 21,115
Fee and commission income 5 54,379 60,895
Fee and commission expense 5 -9,047 -8,163
Net fee and commission income 45,332 52,732
Net gains/losses on items at fair value and other foreign exchange revaluation results 6 16,160 27,611
Dividends 80,000 35,000
Other operating income 7 3,771 1,205
Total gross banking income 162,338 137,663
Net loan losses / release of provisions 12 575 -307
Total net banking income 162,913 137,356
Operating expenses
General administrative expenses:
Staff costs 8 -53,454 -57,893
Other administrative expenses 9 -63,052 -22,353
Depreciation/amortisation of tangible and intangible assets 16 -8,084 -7,759
Total operating expenses -124,590 -88,005
Operating profit 38,323 49,351
Income tax expense / reimbursement 10 9,484 -5,002
Profit for the year from continuing operations 47,807 44,349
Profit for the year from discontinued operations 1) 36 24,129 60,616
Total profit for the year 71,936 104,965
Total profit for the year attributable to:
Equity holders of the Bank 71,936 104,965
71,936 104,965
1) Discontinued operations includes the Funds Administration & Transfer Agency which was transferred to NIFSA as a contribution in kind prior to the divestment (note 15).
9Annual Report 2017 – Nordea Bank S.A.
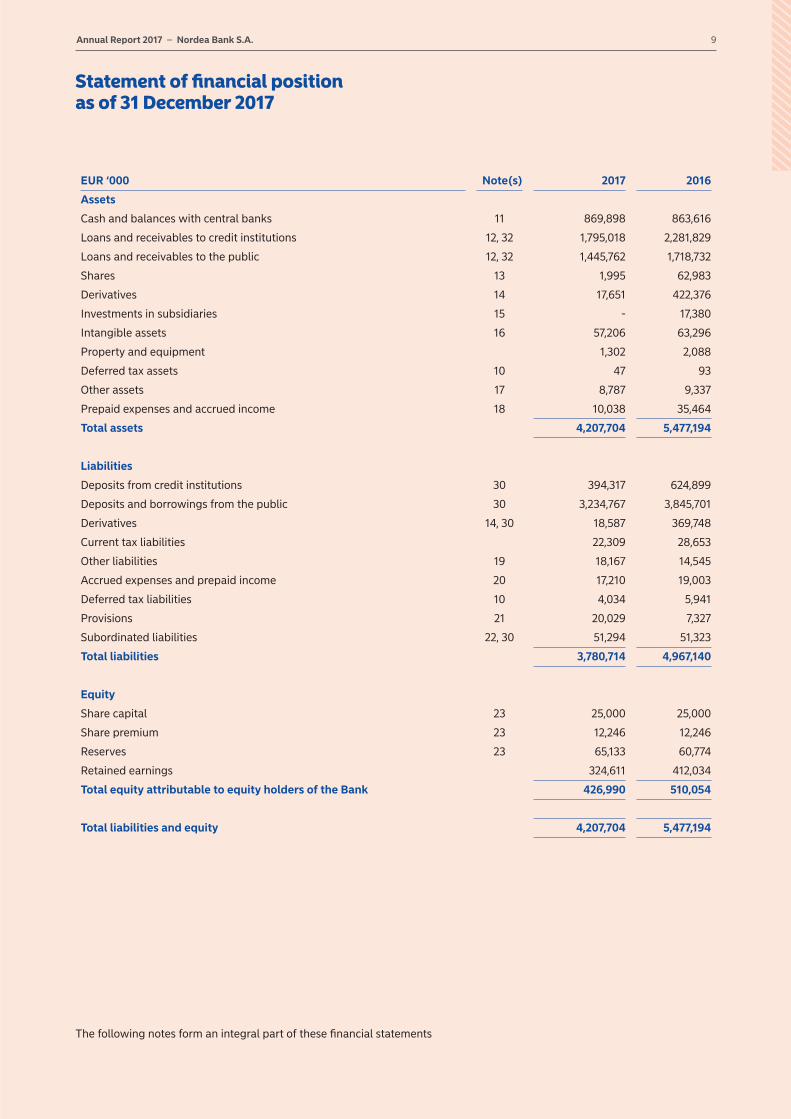
EUR ‘000 Note(s) 2017 2016
Assets
Cash and balances with central banks 11 869,898 863,616
Loans and receivables to credit institutions 12, 32 1,795,018 2,281,829
Loans and receivables to the public 12, 32 1,445,762 1,718,732
Shares 13 1,995 62,983
Derivatives 14 17,651 422,376
Investments in subsidiaries 15 - 17,380
Intangible assets 16 57,206 63,296
Property and equipment 1,302 2,088
Deferred tax assets 10 47 93
Other assets 17 8,787 9,337
Prepaid expenses and accrued income 18 10,038 35,464
Total assets 4,207,704 5,477,194
Liabilities
Deposits from credit institutions 30 394,317 624,899
Deposits and borrowings from the public 30 3,234,767 3,845,701
Derivatives 14, 30 18,587 369,748
Current tax liabilities 22,309 28,653
Other liabilities 19 18,167 14,545
Accrued expenses and prepaid income 20 17,210 19,003
Deferred tax liabilities 10 4,034 5,941
Provisions 21 20,029 7,327
Subordinated liabilities 22, 30 51,294 51,323
Total liabilities 3,780,714 4,967,140
Equity
Share capital 23 25,000 25,000
Share premium 23 12,246 12,246
Reserves 23 65,133 60,774
Retained earnings 324,611 412,034
Total equity attributable to equity holders of the Bank 426,990 510,054
Total liabilities and equity 4,207,704 5,477,194
Statement of financial position as of 31 December 2017
The following notes form an integral part of these financial statements

Annual Report 2017 – Nordea Bank S.A. 10
EUR ‘000 Share
capitalShare
premium ReservesRetained earnings Total
Note(s) 23 23 23
At 31 December 2015 25,000 12,246 51,899 385,944 475,089
Profit for the year - - - 104,965 104,965
Distribution to equity holders - - - -70,000 -70,000
Shareholders contribution - - - - -
Appropriations of profit:
- Transfer to reserve - - 8,875 -8,875 -
At 31 December 2016 25,000 12,246 60,774 412,034 510,054
Profit for the year - - - 71,936 71,936
Distribution to equity holders - - - -155,000 -155,000
Shareholders contribution - - - - -
Appropriations of profit:
- Transfer to reserve - - 27,249 -27,249 -
- Release from reserve - - -22,890 22,890 -
At 31 December 2017 25,000 12,246 65,133 324,611 426,990
Statement of changes in equity as of 31 December 2017
The following notes form an integral part of these financial statements

11Annual Report 2017 – Nordea Bank S.A.
EUR ‘000 Note(s) 2017 2016
Operating activities
Operating profit 10 38,323 49,351
Adjustments for items not included in cash flow 27,380 11,416
Dividend received -80,000 -35,000
Income taxes paid / reimbursed 1,279 27,976
Cash inflow from operating activities before changes in operating assets and liabilities -13,018 53,743
Changes in operating assets
Change in deposits to central banks -6,282 -247,657
Change in loans and receivables to credit institutions 589,389 -1,056,038
Change in loans and receivables to the public 272,970 53,500
Change in shares and participation interest 49,697 9,196
Change in derivatives, net 53,688 17,948
Change in other assets 537 3,549
Changes in operating liabilities
Change in deposits from credit institutions and subordinated liabilities -230,582 560,681
Change in deposits and borrowings from the public -610,934 -271,872
Change in other liabilities and provisions -1,868 44
Change in accruals -1,793 -6,471
Cash inflow from operating activities 101,804 -883,377
Investing activities
Dividend received 80,000 35,000
Sale of subsidiaries 15 26,948 -
Acquisition of property and equipment, own use -165 -185
Acquisitions of intangible assets -1,446 -11,603
Cash inflow from investing activities 105,337 23,212
Financing activities
Dividend paid -155,000 -70,000
Cash outflow from financing activities -155,000 -70,000
Cash flow from discontinued operations 1) 36 49,568 56,941
Net (decrease)/increase in cash and cash equivalents 101,709 -873,224
Cash and cash equivalents at the beginning of year 1,018,598 1,891,822
Cash and cash equivalents at the end of year 1,120,307 1,018,598
1) Discontinued operations includes the Funds Administration & Transfer Agency which was transferred to NIFSA prior to the divestment.
Statement of cash flows for the year ended 31 December 2017
The following notes form an integral part of these financial statements

Annual Report 2017 – Nordea Bank S.A. 12
Comments on the Statement of cash flowsThe Statement of cash flow shows inflows and outflows of cash and cash equivalents during the year for total operations. Cash flow statement has been prepared in accordance with the indirect method, whereby operating profit is adjusted for effects of non-cash transactions such as depreciation and loan losses. The cash flows are classified by operating, investing and financing activities.
Operating activitiesOperating activities are the principal revenue-producing activities and cash flows are mainly derived from the operating profit for the year with adjustment for items not included in cash flow and income taxes paid.
Investing activitiesInvesting activities include acquisitions and disposals of non-current assets, like property and equipment, intangible and financial assets.
Financing activitiesFinancing activities are activities that result in changes in equity and subordinated liabilities, such as new issue of shares, dividends and issued/amortised subordinated liabilities.
Cash and cash equivalentsCash and cash equivalents included in the Statement of cash flows comprise the below amounts:
EUR ‘000 31 Dec 2017 31 Dec 2016
Cash in hand (Note 11) 100 394
Loans and receivables on demand to credit institutions (Note 30) 1,120,207 1,018,204
1,120,307 1,018,598
Cash comprises legal tender and bank notes in foreign currencies.
Loans and receivables on demand to credit institutions includes liquid assets not represented by bonds or other interest-bear-ing securities.

13Annual Report 2017 – Nordea Bank S.A.
Notes to the Financial Statements for the year ended 31 December 2017
1 General
Corporate mattersNordea Bank S.A. (“the Bank” or “Nordea”) was incorporated in Luxembourg on 30 September 1976 as a “société anonyme”. The registered office of the Bank is located in 562, Rue de Neudorf, L-2220 Luxembourg.
The Bank is a majority-owned subsidiary of Nordea Bank AB (publ) (“the Parent Company”), a company incorporated under the laws of Sweden, which is both immediate and ultimate parent company of the Bank. The members of the Board of Directors are senior executives of companies forming part of the Nordea Group or external industry experts. The business policy and valuation principles, unless prescribed by Luxembourg rules and regulations, are determined and monitored by the Board of Directors in accordance with those applied in the Nordea Group.
The Bank operates from its Luxembourg head office and from two branches, located in Zurich, Switzerland (currently under liquidation) and in Singapore, Singapore.
The Bank is also included in the consolidated accounts of Nordea Bank AB (publ), which may be obtained from Nordea, Investor relations, SE - 10571 Stockholm, Sweden.
Nature of the Bank’s businessThe statutory objective of the Bank is to undertake all bank-ing and financial operations whatsoever.
Financial statementsThese financial statements are presented in EUR considering that is the currency of the primary economic environment in which the Bank operates and currency in which the capital is expressed.
The Bank’s financial year is the calendar year.
On 9 March 2018 the Board of Directors approved the finan-cial statements, subject to final approval of the Annual Gener-al Meeting on 3 April 2018.
2 Summary of significant accounting policies and valuation rules
The accounting policies adopted in respect of the items that are considered material for the results and the financial posi-tion of the Bank are stated below.
2.1 Basis for presentation and statement of complianceThe financial statements of the Bank have been prepared in accordance with the International Financial Reporting Stand-ards (“IFRSs”) and interpretations of such standards by the International Financial Reporting Standards Interpretations Committee (“IFRS IC”, formerly “IFRIC”), as endorsed by the European Union (“EU”). Additional information is included in the accompanying financial statements in order to comply with Luxembourg legal requirements.
The disclosures, required in the standards, recommendations and legislation above, have been included in the notes, the Risk, Liquidity and Capital management section or in other parts of the “Financial statements”.
2.2 Accounting convention and presentationThe financial statements have been prepared under the his-torical cost convention except for the revaluation of certain financial instruments, in accordance with accounting princi-ples which conform, in all material respects with IFRSs as endorsed by the EU. The accounting policies, basis for calcu-lations and presentation are, in all material aspects, unchanged in comparison with the 2016 Annual Report, except for reclassifications in note 25 Related Party transac-tions. Reclassifications in this note are due to:• Nordea Investment Funds S.A. changed status from Sub-
sidiary to Affiliated company with the divestment in July 2017.
• Nordea Bank Denmark, Nordea Bank Finland and Nordea Bank Norway changed status from Affiliated company to Parent company, as they were all changed to branch of Nordea Bank Sweden AB 1 January 2017.
2.3 Foreign currency translationForeign currency transactions are recorded in the financial statements at rates of exchange ruling at the date of transac-tions or at contracted rates, where appropriate. Monetary assets and liabilities denominated in foreign currencies are translated at rates of exchange ruling at the reporting date. Gains and losses on exchange are dealt with through the statement of profit or loss and other comprehensive income under profit and loss.
Non-monetary assets and liabilities that are measured at fair value in a foreign currency are translated into the functional currency at the spot exchange rate at the date on which the fair value is determined. Non-monetary items that are meas-ured based on historical cost in a foreign currency are trans-lated using the spot exchange rate at the date of the transaction.
Exchange differences arising on the settlement of transac-tions at rates different from those at the date of the transac-tion, and unrealised translation differences on unsettled for-eign currency monetary assets and liabilities, are recognised in the statement of profit or loss and other comprehensive income in the item “Net gains/(losses) on items at fair value and other foreign exchange revaluation results”.
2.4 Use of estimates and judgementsThe preparation of financial statements in conformity with IFRSs as endorsed by the EU requires the use of certain criti-cal accounting estimates. It also requires management to exercise its judgment in the process of applying the Bank’s accounting policies. The areas involving a higher degree of judgment or complexity, or areas where assumptions and estimates are significant to the financial statements are dis-closed in Note 3.

Annual Report 2017 – Nordea Bank S.A. 14
2.5 Interest income and expenseInterest income and expense are recognised on an accrual basis. Interest income and expense are calculated and recog-nised based on the effective interest rate method.
2.6 Fee and commission income and expenseThe Bank earns commission income from different services provided to its customers. The recognition of commission income depends on the purpose for which the fees are received. Fees are either recognised as revenue when services are provided or in connection to the execution of a significant act. Fees received in connection with performed services are recognised as income in the period these services are provided.
Commission expenses are normally transaction based and recognised in the period when the services are received.
Commission fees mainly include asset management commis-sions, custody fees and commissions from trading activities.
2.7 Dividend incomeDividend income from investments is recognised when the Bank’s right to receive payment has been established.
2.8 Net gains/(losses) on items at fair value and other foreign exchange revaluation resultsRealised and unrealised gains and losses on financial instru-ments measured at fair value are recognised in the item “Net gains/(losses) on items at fair value and other foreign exchange revaluation results”.
Realised and unrealised gains and losses mainly derive from shares and share related instruments, interest-related instru-ments, currency-related instruments and foreign exchange gains/losses.
2.9 Employee Benefits
Defined contribution planThe Bank has pension obligations from a defined contribution plan. The Bank’s defined contribution plan is the main pen-sion scheme and covers all employees of the Bank in Luxem-bourg. Defined contribution plans are not reflected on the statement of financial position.
A defined contribution plan is a post-employment benefit plan under which the Bank pays fixed contributions into a separate entity and will have no legal or constructive obligation to pay further amounts. Obligation for contributions to defined con-tribution pension plans are recognised as an employee benefit expense in profit and loss when they are due. Prepaid contri-butions are recognised as an asset to the extent that a cash refund or a reduction in future payments is available.
Defined benefit planContributions to defined benefit retirement plans are recog-nised as an expense when employees have rendered service entitling them to the contributions.
Calculation of defined benefit obligations is performed by external actuaries and is based on the actuarial assumptions fixed for the Bank’s pension plan. When the calculation results in a potential asset for the Bank, the recognised asset is limited to the present value of economic benefits available in the form of any future refunds from the plan or reductions in future contributions to the plan. To calculate the present value of economic benefits, consideration is given to any applicable minimum funding requirements.
Remeasurements of the net defined benefit liability, which comprise actuarial gains and losses, the return on plan assets (excluding interest) and the effect of the asset ceiling (if any, excluding interest), are recognised immediately in other com-prehensive income. The Bank determines the net interest expense (income) on the net defined benefit liability (asset) for the period by applying the discount rate used to measure the defined benefit obligation at the beginning of the annual period to the then-net defined benefit liability (asset), taking into account any changes in the net defined benefit liability (asset) during the period as a result of contributions and ben-efit payments. Net interest expense and other expenses relat-ed to defined benefit plans are recognised in staff costs in profit or loss.
When the benefits of a plan are changed or when a plan is curtailed, the resulting change in benefit that relates to past service or the gain or loss on curtailment is recognised imme-diately in profit or loss. The Bank recognises gains and losses on the settlement of a defined benefit plan when the settle-ment occurs.
2.10 Share-based paymentEquity-settled share-based payments to employees and oth-ers providing similar services are measured at the fair value of the equity instruments at the grant date. The Bank’s Parent Company has granted the right to its equity instruments directly to the employees of the Bank.
The fair value determined at the grant date of the equity-set-tled share-based payments is expensed on a straight-line basis over the vesting period, based on the Group’s estimate of equity instruments that will eventually vest. At each report-ing date, the Group revises its estimate of the number of equi-ty instruments expected to vest. The impact of the revision of the original estimates, if any, is recognised in profit or loss over the remaining vesting period, with a corresponding adjustment to shareholders contributions.
Equity-settled share-based payment transactions with other parties are measured at the fair value of the goods or services received, except where the fair value cannot be estimated reli-ably, in which case they are measured at the fair value of the equity instruments granted, measured at the date the entity obtains the goods or the counterparty renders the service.
The Group also operates share-linked deferrals on parts of variable compensation for certain employee categories, indexed with the Total Shareholder Returns (“TSR”) and either vesting after three years or vesting in equal instalments over a three to five year period. Since 2011 the Group also operates TSR-linked retention on part of variable compensa-tion for certain employee categories under a cash-settled share-based payment programme.
This programme is fully vested when the payments of varia-ble salaries are initially deferred and the fair value of the obli-gation is remeasured on a continuous basis. The remeasure-ments are, together with the related social security charges, recognised in the statement of profit or loss and other com-prehensive income in the item “Net gains/(losses) on items at fair value and other foreign exchange revaluation results”.
2.11 TaxationIncome tax expense represents the sum of the current tax and deferred tax.
Current taxCorporation tax is charged on the annual taxable profit on the basis of tax legislation and tax rates which are applicable in the

15Annual Report 2017 – Nordea Bank S.A.
Grand Duchy of Luxembourg. Corporation tax for the Bank’s branches is calculated based on the tax legislation and tax rates applicable at their domicile, Switzerland and Singapore respectively. The computation also takes into consideration the loss currently realised at the level of the branch in Singapore.
The tax currently payable is based on taxable profit for the year. Taxable profit differs from profit as reported in the state-ment of profit or loss and other comprehensive income under profit or loss because it excludes items of income or expense that are taxable or deductible in other years and it further excludes items that are exempt or non-deductible in accord-ance with the tax legislation applicable in the Grand Duchy of Luxembourg. The Bank’s liability for current tax is calculated using the tax rates that have been enacted or substantively enacted by the reporting date.
Deferred taxDeferred tax is recognised on differences between the carry-ing amounts of assets and liabilities in the financial state-ments and the corresponding tax bases used in the computa-tion of taxable profit, and is accounted for using the balance sheet liability method.
Deferred tax assets arising from deductible temporary differ-ences are only recognised to the extent that it is probable that there will be sufficient taxable profits against which to utilise the benefits of the temporary differences and they are expected to reverse in the foreseeable future.
The carrying amount of deferred tax assets is reviewed at each reporting date and reduced to the extent that it is no longer probable that sufficient taxable profits will be available to allow all or part of the asset to be recovered.
Deferred tax assets and liabilities are measured at the tax rates that are expected to apply in the period in which the liability is settled or the asset realised, based on tax rates (and tax laws) that have been enacted or substantively enacted by the report-ing date. The measurement of deferred tax liabilities and assets reflects the tax consequences that would follow from the man-ner in which the Bank expects, at the reporting date, to recover or settle the carrying amount of its assets and liabilities.
Deferred income tax assets and liabilities are offset when there is a legally enforceable right to offset current tax assets against current tax liabilities, when the deferred tax income relates to the same fiscal authority.
Net Wealth Tax reserveOn 19 November 2015, the Luxembourg Tax Authorities issued circular letter I. Fort. n° 47bis (Circular). The Circular followed the 2014 introduction of the annual determination of net wealth tax (NWT) and the amendments to the mechanism for obtaining an NWT reduction. It applied for the first time to the NWT's “unitary value” determination as at 1 January 2015.
Terms and conditions for claiming the NWT reduction:1) An amount corresponding to five times the NWT reduction
claimed must be allocated to a special NWT reserve in the Equity and maintained for the five following years.
2) The amount of the NWT reduction is subject to two limitations. i. It cannot exceed the corporate income tax (CIT)
liability of the preceding year. Therefore, CIT in year N constitutes a limit for the NWT reduction in year N+1.
ii. It is reduced by the minimum CIT (increased by the contribution to the employment fund and before application of any tax credit) which would be due (i.e., on a theoretical basis) according to the provisions of article 174 (6) Income Tax Law.
2.12 Profit from discontinued operationsDiscontinued operations consist of Transfer Agency and Fund Administration, that was transferred to Nordea Investment Funds S.A. in May 2017 as contribution in kind (see note 15). These operations have been classified as discontinued opera-tions as they represent a major line of business.
The net result from discontinued operations, is presented as a single amount after net profit for the period from continuing operations. Comparative figures are restated.
A specification of profit and cash flows from discontinued operations for the year and prior year can be found in note 36.
2.13 Cash and balances with central banksCash comprises legal tender and bank notes in foreign cur-rencies. Balances with central banks consist of deposits in accounts with central banks and postal giro systems under government authority, where the following conditions are fulfilled• The central bank or the postal giro system is domiciled in
the country where the institutions is established• The balance is readily available at any time
2.14 Financial assets and financial liabilitiesInvestments are recognised and derecognised on trade date where the purchase or sale of an investment is under a con-tract whose terms require delivery of the investment within the timeframe established by the market concerned, and are initially measured at fair value, plus transaction costs, except for those financial assets classified as at fair value through profit or loss, which are initially measured at fair value.
Financial assets are classified into the following specified cat-egories: financial assets “at fair value through profit or loss” and “loans and receivables”.
The classification depends on the nature and purpose of the financial assets and is determined at the time of initial recognition.
Financial liabilities are classified as either financial liabilities “at fair value through profit and loss” or “other financial liabilities”.
Effective interest methodThe effective interest method is a method of calculating the amortised cost of a financial asset and of allocating interest income over the relevant period. The effective interest rate is the rate that exactly discounts estimated future cash receipts (including all fees on points paid or received that form an integral part of the effective interest rate, transaction costs and other premiums or discounts) through the expected life of the financial asset, or, where appropriate, a shorter period.
Income is recognised on an effective interest basis for debt instruments other than those financial assets designated as at fair value through profit and loss.
Financial assets and financial liabilities at fair value through profit and lossFinancial assets and financial liabilities are classified as at fair value through profit and loss where the financial asset/finan-cial liability is either held for trading or it is designated as at fair value through profit and loss.
Annual Report 2017 – Nordea Bank S.A. 16
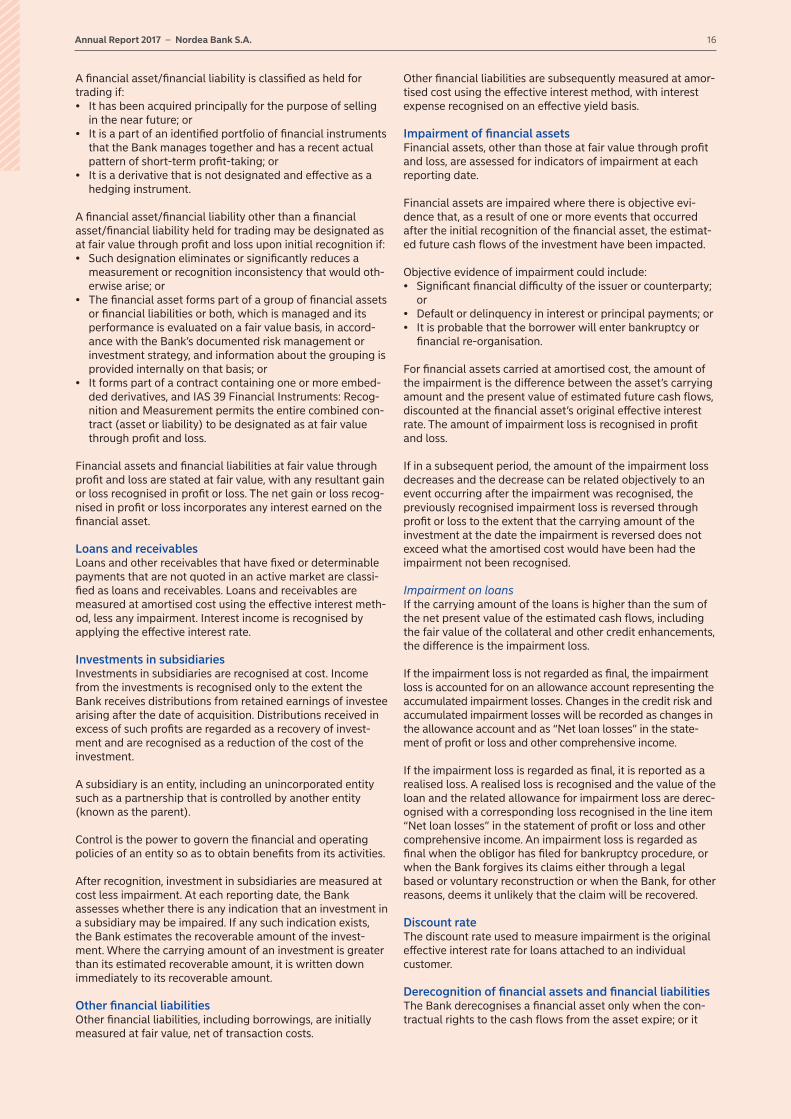
A financial asset/financial liability is classified as held for trading if:• It has been acquired principally for the purpose of selling
in the near future; or• It is a part of an identified portfolio of financial instruments
that the Bank manages together and has a recent actual pattern of short-term profit-taking; or
• It is a derivative that is not designated and effective as a hedging instrument.
A financial asset/financial liability other than a financial asset/financial liability held for trading may be designated as at fair value through profit and loss upon initial recognition if:• Such designation eliminates or significantly reduces a
measurement or recognition inconsistency that would oth-erwise arise; or
• The financial asset forms part of a group of financial assets or financial liabilities or both, which is managed and its performance is evaluated on a fair value basis, in accord-ance with the Bank’s documented risk management or investment strategy, and information about the grouping is provided internally on that basis; or
• It forms part of a contract containing one or more embed-ded derivatives, and IAS 39 Financial Instruments: Recog-nition and Measurement permits the entire combined con-tract (asset or liability) to be designated as at fair value through profit and loss.
Financial assets and financial liabilities at fair value through profit and loss are stated at fair value, with any resultant gain or loss recognised in profit or loss. The net gain or loss recog-nised in profit or loss incorporates any interest earned on the financial asset.
Loans and receivablesLoans and other receivables that have fixed or determinable payments that are not quoted in an active market are classi-fied as loans and receivables. Loans and receivables are measured at amortised cost using the effective interest meth-od, less any impairment. Interest income is recognised by applying the effective interest rate.
Investments in subsidiariesInvestments in subsidiaries are recognised at cost. Income from the investments is recognised only to the extent the Bank receives distributions from retained earnings of investee arising after the date of acquisition. Distributions received in excess of such profits are regarded as a recovery of invest-ment and are recognised as a reduction of the cost of the investment.
A subsidiary is an entity, including an unincorporated entity such as a partnership that is controlled by another entity (known as the parent).
Control is the power to govern the financial and operating policies of an entity so as to obtain benefits from its activities.
After recognition, investment in subsidiaries are measured at cost less impairment. At each reporting date, the Bank assesses whether there is any indication that an investment in a subsidiary may be impaired. If any such indication exists, the Bank estimates the recoverable amount of the invest-ment. Where the carrying amount of an investment is greater than its estimated recoverable amount, it is written down immediately to its recoverable amount.
Other financial liabilitiesOther financial liabilities, including borrowings, are initially measured at fair value, net of transaction costs.
Other financial liabilities are subsequently measured at amor-tised cost using the effective interest method, with interest expense recognised on an effective yield basis.
Impairment of financial assetsFinancial assets, other than those at fair value through profit and loss, are assessed for indicators of impairment at each reporting date.
Financial assets are impaired where there is objective evi-dence that, as a result of one or more events that occurred after the initial recognition of the financial asset, the estimat-ed future cash flows of the investment have been impacted.
Objective evidence of impairment could include:• Significant financial difficulty of the issuer or counterparty;
or• Default or delinquency in interest or principal payments; or• It is probable that the borrower will enter bankruptcy or
financial re-organisation.
For financial assets carried at amortised cost, the amount of the impairment is the difference between the asset’s carrying amount and the present value of estimated future cash flows, discounted at the financial asset’s original effective interest rate. The amount of impairment loss is recognised in profit and loss.
If in a subsequent period, the amount of the impairment loss decreases and the decrease can be related objectively to an event occurring after the impairment was recognised, the previously recognised impairment loss is reversed through profit or loss to the extent that the carrying amount of the investment at the date the impairment is reversed does not exceed what the amortised cost would have been had the impairment not been recognised.
Impairment on loansIf the carrying amount of the loans is higher than the sum of the net present value of the estimated cash flows, including the fair value of the collateral and other credit enhancements, the difference is the impairment loss.
If the impairment loss is not regarded as final, the impairment loss is accounted for on an allowance account representing the accumulated impairment losses. Changes in the credit risk and accumulated impairment losses will be recorded as changes in the allowance account and as “Net loan losses” in the state-ment of profit or loss and other comprehensive income.
If the impairment loss is regarded as final, it is reported as a realised loss. A realised loss is recognised and the value of the loan and the related allowance for impairment loss are derec-ognised with a corresponding loss recognised in the line item “Net loan losses” in the statement of profit or loss and other comprehensive income. An impairment loss is regarded as final when the obligor has filed for bankruptcy procedure, or when the Bank forgives its claims either through a legal based or voluntary reconstruction or when the Bank, for other reasons, deems it unlikely that the claim will be recovered.
Discount rateThe discount rate used to measure impairment is the original effective interest rate for loans attached to an individual customer.
Derecognition of financial assets and financial liabilitiesThe Bank derecognises a financial asset only when the con-tractual rights to the cash flows from the asset expire; or it

17Annual Report 2017 – Nordea Bank S.A.
transfers the financial asset and substantially all the risks and rewards of ownership of the asset to another entity.
The Bank derecognises financial liabilities when, and only when, the Bank’s obligations are discharged, cancelled or they expire.
OffsettingFinancial assets and financial liabilities are offset and the net amount presented in the statement of financial position when, and only when, the Bank currently has a legally enforceable right to set off the amounts and it intends either to settle them on a net basis or to realise the asset and settle the liability simultaneously.
Income and expenses are presented on a net basis only when permitted under IFRS, or for gains and losses arising from a group of similar transactions such as in the Bank’s trading activity.
As at the end of 2017 and 2016, the Bank had no financial instruments subject to an enforceable master netting arrangement or similar agreement.
2.15 DerivativesAll derivatives are recognised on the statement of financial position and measured at fair value through profit and loss at the date a derivative contract is entered into and are subse-quently remeasured to their fair value at each reporting date.
Derivatives with a positive fair value, including any accrued interest, are recognised as assets in the item “Derivatives”. Derivatives with a negative fair value, including any accrued interest, are recognised as liabilities in the item “Derivatives”.
Realised and unrealised gains and losses from derivatives are recognised in the statement of profit or loss and other com-prehensive income in the item “Net gains/(losses) on items at fair value and other foreign exchange revaluation results”.
2.16 Determination of fair value of financial instrumentsFinancial assets and liabilities classified as “financial assets/liabilities at fair value through profit or loss” and “derivative instruments” are recorded at fair value on the statement of financial position with changes in fair value recognised in the statement of profit or loss and other comprehensive income in the item “Net gains/(losses) on items at fair value and other foreign exchange revaluation results”.
Fair value is defined by IFRS 13 as the price that would be received to sell an asset or paid to transfer a liability in an orderly transaction between market participants the meas-urement date.
The existence of published price quotations in an active mar-ket is the best evidence of fair value and when they exist they are used to measure financial assets and financial liabilities. The Bank is using published price quotations to establish fair value for items disclosed under the following statement of financial position items:
• Shares (listed shares)
Fair value of non-listed shares and derivatives is determined by using valuation techniques. For the different instruments, the Bank is allowed by the Group to use various models, such as cash flow discounting, linear rate model, etc.
The Bank uses widely recognised valuation models for deter-mining the fair value of common and simple financial instru-
ments, such as interest rate and currency swaps that use only observable market data and require little management judge-ment and estimation. Observable prices or model inputs are usually available in the market for listed debt and equity secu-rities, exchange-traded derivatives and simple OTC derivatives such as interest rate swaps. Availability of observable market prices and model inputs reduces the need for management judgement and estimation and also reduces the uncertainty associated with determining fair values. Availability of observ-able market prices and inputs varies depending on the prod-ucts and markets and is prone to changes based on specific events and general conditions in the financial markets.
Fair value is estimated to be equal to the book value (amor-tised cost) as its reasonable approximation for loans and receivables and deposits and borrowings. For further infor-mation, see Note 28 “Assets and liabilities at fair value”.
2.17 Property and equipment and intangible assetsProperty and equipment and intangible assets are stated at cost net of accumulated depreciation/amortisation and are depreciated according to the straight line method over their estimated useful lives using the following rates: Leasehold improvements 2.5% - 20% Motor vehicles 20% Furniture and equipment 20% Fixture and fittings 20% Computer software and hardware 20% T24 (core banking system) 8%
When the carrying amounts of property and equipment and intangible assets exceed their recoverable values, assets are written down, and impairment losses are recorded in the statement of profit or loss and other comprehensive income under profit and loss.
The estimated useful lives, residual values and depreciation method are reviewed at each year end, with the effect of any changes in estimate accounted for on a prospective basis.
The gain or loss arising on the disposal or retirement of an item of property and equipment and intangible assets is determined as the difference between the sales proceeds and the carrying amount of the asset and is recognised in profit or loss.
2.18 Impairment of property and equipment and intangible assets At each reporting date, the Bank reviews the carrying amounts of its property and equipment and intangible assets to determine whether there is any indication that those assets have suffered an impairment loss. If any such indication exists, the recoverable amount of the asset is estimated in order to determine the extent of the impairment loss (if any).
The recoverable amount is the higher of fair value less costs to sell and value in use. In assessing value in use, the estimat-ed future cash flows are discounted to their present value using a pre-tax discount rate that reflects current market assessments of the time value of money and the risks specific to the asset for which the estimates of future cash flows have not been adjusted.
If the recoverable amount of an asset is estimated to be less than its carrying amount, the carrying amount of the asset is reduced to its recoverable amount. An impairment loss is rec-ognised immediately in profit and loss.
2.19 ProvisionsProvisions are recognised when the Bank has a present obli-gation (legal or structural) as a result of a past event, it is
Annual Report 2017 – Nordea Bank S.A. 18
probable that the Bank will be required to settle the obliga-tion, and a reliable estimate can be made of the amount of the obligation.
The amount recognised as a provision is the best estimate of the consideration required to settle the present obligation at the reporting date, taking into account the risks and uncer-tainties surrounding the obligation.
Where a provision is measured using the cash flows estimat-ed to settle the present obligation, its carrying amount is the present value of those cash flows. When some or all of the economic benefits required to settle a provision are expected to be recovered from a third party, the receivable is recog-nised as an asset if it is virtually certain that reimbursement will be received and the amount of the receivable can be measured reliably.
2.20 Operating leasesOperating leases are not recognised on the Bank’s statement of financial position. For operating leases the lease payments are recognised as expenses in the statement of profit and loss and other comprehensive income on a straight-line basis over the lease term. The original lease terms normally range between 3 to 25 years.
Operating leasing is mainly related to office premises con-tracts and office equipment contracts normal to the business.
Lease incentives received are recognised as an integral part of the total lease expense, over the term of the lease.
2.21 Standards adopted as from 1 January 2017The following new and amended standards and interpreta-tions were implemented 1 January 2017 but have not had any significant impact on the financial statements of the Bank:• Amendments to IAS 12: “Recognition of Deferred Tax
Assets for Unrealised Losses”.• Amendments to IAS 7: “Disclosure Initiative”.• IFRS 12 related amendments being part of Annual
Improvements cycle 2014-16.
2.22 Standards and interpretations not yet adopted
IFRS 9 “Financial instruments”IFRS 9 covers classification and measurement, impairment and general hedge accounting and replaces the current require-ments covering these areas in IAS 39. IFRS 9 is effective as from annual periods beginning on or after 1 January 2018. The standard is endorsed by the EU-commission. Earlier applica-tion is permitted, but the Bank has not early adopted the standard. The new classification, measurement and impair-ment requirements will be applied by adjusting the balance sheet on 1 January 2018, the date of initial application, with no restatement of comparative period financial information.
See note 31 for more information on the impact from IFRS 9.
Classification and measurementThe classification and measurement requirements in IFRS 9 states that financial assets should be classified as and meas-ured at amortised cost, fair value through profit and loss or fair value through other comprehensive income. The classifi-cation of a financial instrument is dependent on the business model for the portfolio where the instrument is included and on whether the cash flows are solely payments of principal and interest (“SPPI”).
In order to assess the business model, the Bank has divided its financial assets into portfolios and/or sub-portfolios based
on how groups of financial assets are managed together to achieve a particular business objective. To derive the right level on which portfolios are determined, the Bank has taken the current business area structure into account. When deter-mining the business model for each portfolio the Bank has analysed the objective with the financial assets as well as for instance past sales behaviour and management compensation.
The Bank has analysed whether the cash flows from the financial assets held as of 31 December 2017 are SPPI compli-ant. This has been performed by grouping contracts which are homogenous from a cash flow perspective and conclu-sions have been drawn for all contracts within that group.
The analysis of the business model and the SPPI review described above has not resulted in any significant changes compared to how the financial instruments are measured under IAS 39.
No significant impact is thus expected on the Bank’s financial position, financial performance or equity in the period of initial application. No significant impact on the capital adequacy, large exposures, risk management or alternative performance measures are expected in the period of initial application.
ImpairmentThe impairment requirements in IFRS 9 are based on an expected loss model as opposed to the current incurred loss model in IAS 39. The scope of IFRS 9 impairment require-ments is also broader than IAS 39. IFRS 9 requires all assets measured at amortised cost, fair value through other compre-hensive income, a lease receivable, a contract asset or loan commitment and a financial guarantee contract, to be includ-ed in the impairment test. Currently the Bank does not calcu-late collective provisions for off balance sheet exposures or the financial instruments classified into the measurement cat-egory Available for Sale (“AFS”).
The assets to test for impairment will be divided into three groups depending on the stage of credit deterioration. Stage 1 includes assets where there has been no significant increase in credit risk, stage 2 includes assets where there has been a significant increase in credit risk and stage 3 includes default-ed assets. Significant assets in stage 3 are tested for impair-ment on an individual basis, while for insignificant assets a collective assessment is performed. In stage 1, the provisions should equal the 12 month expected loss. In stage 2 and 3, the provisions should equal the lifetime expected losses.
One important driver for size of provisions under IFRS 9 is the trigger for transferring an asset from stage 1 to stage 2. For assets held at transition, the Bank has decided to use the change in internal rating and scoring data to determine whether there has been a significant increase in credit risk or not. For assets to be recognised going forward, changes to the lifetime Probability of Default (“PD”) will be used as the trig-ger. The Bank has concluded it is not possible to calculate the lifetime PDs at origination without undue cost or effort and without the use of hindsight for assets already recognised on the balance sheet at transition. For assets evaluated based on lifetime PDs, the Bank has decided to use relative changes in PD as the transfer criterion. In addition, customers with for-bearance measures and customers with payments more than thirty days past due will also be transferred to stage 2.
The provisions under IFRS 9 will be calculated as the expo-sure at default times the probability of default times the loss given default. For assets in stage 1 this calculation will only be

19Annual Report 2017 – Nordea Bank S.A.
based on the coming 12 months, while it for assets in stage 2 will be based on the expected lifetime of the asset.
For assets where there has been a significant increase in credit risk, the Bank currently holds provisions based on a 12 month expected loss, while IFRS 9 will require provisions equal to the lifetime expected loss.
When calculating lifetime losses under IFRS 9, including the staging assessment, the calculation will be based on proba-bility weighted forward looking information. The Bank has tentatively decided to apply three macro-economic scenarios to address the non-linearity in expected credit losses. The dif-ferent scenarios are used to adjust the relevant parameters for calculating expected losses and a probability weighted average of the expected losses under each scenario are rec-ognised as provisions.
The quantitative impact from the new impairment require-ments on total allowances and provisions for on- and off-bal-ance exposures, including debt instruments accounted for at fair value through other comprehensive income (“FVOCI”), is an increase of 1.0 mEUR (see Note 31). This corresponds to an increase of 29% of total allowances and provisions for on- and off-balance exposures. Equity is reduced by 0.7 mEUR. The impact on the Common Equity Tier 1 capital ratio, after adjustment of the shortfall deduction and before transition rules, is insignificant.
Impairment calculations under IFRS 9 will require more expe-rienced credit judgements than is required by IAS 39 today and a higher subjectivity is thus introduced. The inclusion of forward looking information adds complexity and makes pro-visions more dependent on the future economic outlook. It is expected that the impairment calculations under IFRS 9 will be more volatile and pro-cyclical than under IAS 39, mainly due to the significant subjectivity applied in the forward look-ing scenarios.
Amendments to IFRS 10 and IAS 28 “Sale or Contribution of Assets between an Investor and its Associate or Joint Venture”The IASB has amended the requirements in IFRS 10 and IAS 28 regarding sales and contributions of assets between an investor and its associated undertaking or joint venture due to inconsistent treatment of gains and losses of such transac-tions in those standards. The IASB has thereafter proposed to defer indefinitely the effective date and permit earlier appli-cation. The amendments are not yet endorsed by the EU-commission. The Bank does not currently intend to early adopt the amendments. The new requirements are not expected to have any impact on the Bank’s financial state-ments, capital adequacy, or large exposures in the period of initial application as the new requirements are in line with the Bank’s current accounting policies.
IFRS 15 “Revenue from Contracts with Customers”The IASB published the new standard, IFRS 15 “Revenue from Contracts with Customers” in 2014. Clarifications to the stand-ard were published in April 2016. The new standard outlines a single comprehensive model of accounting for revenue aris-ing from contracts with customers and supersedes current revenue recognition standards and interpretations within IFRS, such as IAS 18 “Revenue”. The standard does not apply to financial instruments, insurance contracts or lease con-tracts. The new standard is effective for annual periods begin-ning on or after 1 January 2018, with earlier application per-mitted. The standard and its clarifications have been endorsed by the EU-commission. The Bank has not early adopted the standard.
The standard will be implemented using the modified retro-spective approach, meaning that the cumulative effect, if any, of the change is recognised as an adjustment to equity in the opening balance 2018. Comparable figures for 2017 are not restated. An opening balance adjustment amounting to nil mEUR, recognised directly in equity (after tax), will be recog-nised at transition 1 January 2018. IFRS 15 will consequently not have any impact on the Bank’s financial statements, capi-tal adequacy or large exposures in the period of initial application.
IFRS 16 “Leases”The IASB has published the new standard, IFRS 16 “Leases”. The new standard changes the accounting requirements for lessees. All leases (except for short term- and small ticket leas-es) should be accounted for on the balance sheet of the lessee as a right to use the asset and a corresponding liability, and the lease payments should be recognised as amortisation and interest expense. The accounting requirements for lessors are unchanged. Additional disclosures are also required. The new standard is effective for annual periods beginning on or after 1 January 2019 and earlier application is permitted. The amend-ments were endorsed by the EU-commission in 2017. The Bank does not currently intend to early adopt the standard.
The main impact on the Bank’s financial statements is expect-ed to come from the accounting of property leases. Such leas-ing contracts will be accounted for on the balance sheet to a larger extent than today. No significant impact is currently expected on the income statement or equity, although the presentation is expected to change in the income statement. It is too early to comment on the impact on large exposures and capital adequacy as the relevant requirements are not yet final.
The IASB has published the following new or amended standards that are assessed to have no significant impact on the Bank’s financial statement, capital adequacy or large exposures in the period of initial application:• Amendments to IFRS 4 “Applying IFRS 9 Financial Instru-
ments with IFRS 4 Insurance Contracts”.• Amendments to IFRS 2: “Classification and Measurement of
Share based Payment Transactions (not yet endorsed by EU).
• New standard IFRS 17 “Insurance contracts” (not yet endorsed by EU).
• Amendments to IAS 40: “Transfers of Investment Property” (not yet endorsed by EU).
• Amendments to IFRS 9: “Financial instruments” in respect of prepayment features with negative compensation (not yet endorsed by EU).
• Annual improvements 2014-16 apart from IFRS 12 related amendments (not yet endorsed by EU).
• IFRIC 22: “Foreign currency transactions and advance con-sideration” (not yet endorsed by EU).
• IFRIC 23: “Uncertainty over income tax treatments” (not yet endorsed by EU).
• Annual improvements cycle 2015-17 (not yet endorsed by EU).

Annual Report 2017 – Nordea Bank S.A. 20
3 Critical judgements and estimation uncertainty
The preparation of financial statements in conformity with IFRS as adopted by the EU requires management to make estimates and assumptions that affect the reported amounts of assets and liabilities and disclosure of off-balance sheet items at the date of the financial statements and the reported amounts of revenues and expenses during the reporting peri-od. The estimates are based on past experience and assump-tions that Management believes are fair and reasonable. Actual results may differ from those estimates.
The estimates and underlying assumptions are reviewed on an on-going basis. Revisions to accounting estimates are rec-ognised in the period in which the estimate is revised if the revision affects only that period or in the period of the revision and future periods if the revision affects both current and future periods.
These critical judgments and estimates are in particular asso-ciated with:(a) The fair value measurement of certain financial instru-
ments (non listed shares and derivatives) Where valuation techniques (for example, models) are
used to determine fair values, they are validated and peri-odically reviewed by qualified personnel independent of the area that created them. All models are calibrated to ensure that outputs reflect actual data and comparative market prices. To the extent practical, models use only observable data; however, areas such as credit risk (both own and counterparty), volatilities and correlations require management to make estimates. Changes in assumptions about these factors could affect reported fair value of financial instruments.
(b) The impairment tests of loans and receivables The Bank reviews its loan portfolios to assess impairment
on a quarterly basis. In determining whether an impair-ment loss should be recorded in the statement of profit or loss and other comprehensive income under profit and loss, the Bank makes judgements as to whether there is any observable data indicating that there is a decrease in the estimated future cash flows from a loan. Elements con-sidered as evidence of impairment are disclosed in Note 12.
(c) Useful lives of property and equipment and intangible assets
The Bank reviews the estimated useful lives of property, plant and equipment at the end of each annual reporting period in order to determine the depreciation rates.
(d) Provision for claims All litigation provisions for claims that the Bank is
involved in are analysed at each reporting date and adjusted to reflect the current best estimate. When neces-sary, legal advice is sought and provisions are recorded.
(e) Income taxes The Bank is subject to income tax in Luxembourg, Switzer-
land and Singapore. Estimates are required in determining the provision for income taxes. There are transactions and calculations for which the ultimate tax determination is uncertain during the ordinary course of business. The Bank recognises tax liabilities for anticipated tax audit issues based on estimates of whether additional taxes will be due. Where the final tax outcome of these matters is differ-ent from the amounts that were initially recorded, such dif-ferences will impact the income tax and deferred tax pro-visions in the period in which such determination is made.
21Annual Report 2017 – Nordea Bank S.A.
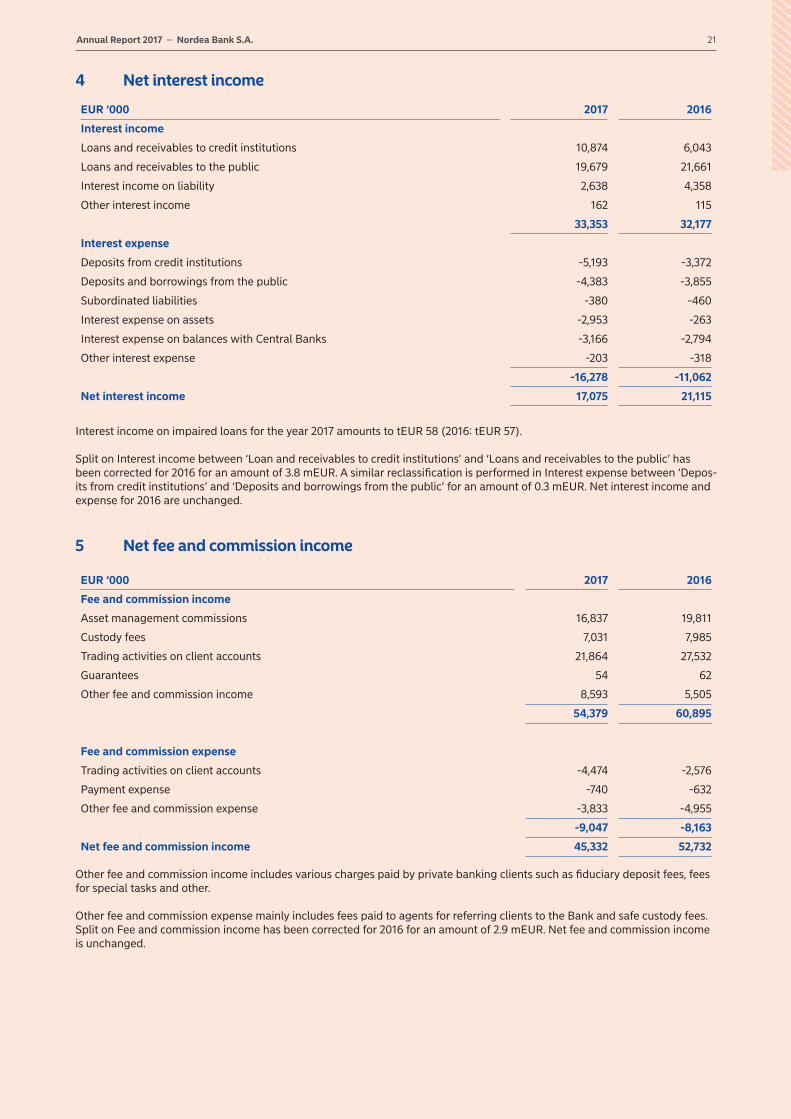
4 Net interest income
EUR ‘000 2017 2016
Interest income
Loans and receivables to credit institutions 10,874 6,043
Loans and receivables to the public 19,679 21,661
Interest income on liability 2,638 4,358
Other interest income 162 115
33,353 32,177
Interest expense
Deposits from credit institutions -5,193 -3,372
Deposits and borrowings from the public -4,383 -3,855
Subordinated liabilities -380 -460
Interest expense on assets -2,953 -263
Interest expense on balances with Central Banks -3,166 -2,794
Other interest expense -203 -318
-16,278 -11,062
Net interest income 17,075 21,115
Interest income on impaired loans for the year 2017 amounts to tEUR 58 (2016: tEUR 57).
Split on Interest income between ‘Loan and receivables to credit institutions’ and ‘Loans and receivables to the public’ has been corrected for 2016 for an amount of 3.8 mEUR. A similar reclassification is performed in Interest expense between ‘Depos-its from credit institutions’ and ‘Deposits and borrowings from the public’ for an amount of 0.3 mEUR. Net interest income and expense for 2016 are unchanged.
5 Net fee and commission income
EUR ‘000 2017 2016
Fee and commission income
Asset management commissions 16,837 19,811
Custody fees 7,031 7,985
Trading activities on client accounts 21,864 27,532
Guarantees 54 62
Other fee and commission income 8,593 5,505
54,379 60,895
Fee and commission expense
Trading activities on client accounts -4,474 -2,576
Payment expense -740 -632
Other fee and commission expense -3,833 -4,955
-9,047 -8,163
Net fee and commission income 45,332 52,732
Other fee and commission income includes various charges paid by private banking clients such as fiduciary deposit fees, fees for special tasks and other.
Other fee and commission expense mainly includes fees paid to agents for referring clients to the Bank and safe custody fees. Split on Fee and commission income has been corrected for 2016 for an amount of 2.9 mEUR. Net fee and commission income is unchanged.

Annual Report 2017 – Nordea Bank S.A. 22
6 Net gains/losses on items at fair value and other foreign exchange revaluation results
EUR ‘000 2017 2016
Equity related instruments 3,593 3,062
Interest related instruments 124 135
Currency related instruments -2,249 854
Foreign exchange gains/losses 14,692 23,560
Total 16,160 27,611
7 Other operating income
EUR ‘000 2017 2016
Group internal allocation 1) 1,020 743
Divestment of shares 2) 871 -
Other 1,880 462
Total 3,771 1,205 1) Group internal allocation is mainly related to Service Level Agreements with an affiliated company for providing administrative support services. 2) Related to sale of subsidiaries – see note 15.
8 Staff costs
EUR ‘000 2017 2016
Wages and salaries 44,893 48,980
Pension costs 1,344 2,062
Social insurance contributions 3,956 4,216
Other staff costs 3,261 2,635
Total 53,454 57,893
The allocation of employees by category is as follows:
Average number of employees: 2017 2016
Senior management/Executives 5 6
Middle management 28 32
Employees 328 340
Total 361 378 Executives are the members of the Authorised Management. Executives amount to an average of 5.25 individuals (2016: 5.5) and middle management amount to an average of 27.50 individuals (2016: 31.75).
Remuneration of tEUR 9,414 has been paid to the Executives and middle management (average 32.75 persons) in respect of the year ended 31 December 2017 (2016: tEUR 11,008), of which allocation to profit sharing represented tEUR 37 (2016: tEUR 100).
At 31 December 2017, no loans and advances have been granted to the Executives and middle management (2016: EUR nil). During 2017 the Independent Director was paid a Directors Fee in an amount of tEUR 10 (2016: EUR nil). At 31 December 2017, no loans and advances have been granted to members of the Board of Directors (2016: EUR nil).
As at 31 December 2017, the Bank did not have a commitment relating to pension on behalf of Executives and middle manage-ment nor on behalf of Board of Directors’ members (2016: EUR nil).
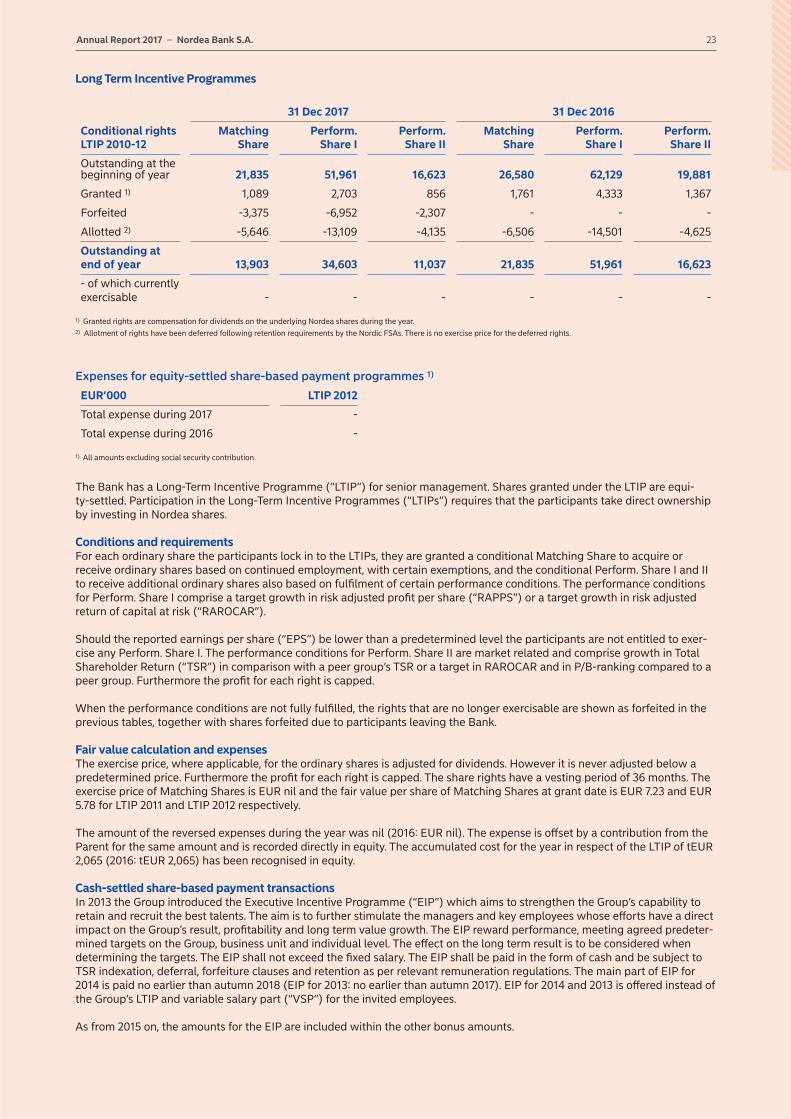
23Annual Report 2017 – Nordea Bank S.A.
Long Term Incentive Programmes
31 Dec 2017 31 Dec 2016
Conditional rights LTIP 2010-12
Matching Share
Perform. Share I
Perform. Share II
Matching Share
Perform. Share I
Perform. Share II
Outstanding at the beginning of year 21,835 51,961 16,623 26,580 62,129 19,881
Granted 1) 1,089 2,703 856 1,761 4,333 1,367
Forfeited -3,375 -6,952 -2,307 - - -
Allotted 2) -5,646 -13,109 -4,135 -6,506 -14,501 -4,625
Outstanding at end of year 13,903 34,603 11,037 21,835 51,961 16,623
- of which currently exercisable - - - - - -
1) Granted rights are compensation for dividends on the underlying Nordea shares during the year. 2) Allotment of rights have been deferred following retention requirements by the Nordic FSAs. There is no exercise price for the deferred rights.
Expenses for equity-settled share-based payment programmes 1)
EUR’000 LTIP 2012
Total expense during 2017 -
Total expense during 2016 -
1) All amounts excluding social security contribution.
The Bank has a Long-Term Incentive Programme (“LTIP”) for senior management. Shares granted under the LTIP are equi-ty-settled. Participation in the Long-Term Incentive Programmes (“LTIPs”) requires that the participants take direct ownership by investing in Nordea shares.
Conditions and requirementsFor each ordinary share the participants lock in to the LTIPs, they are granted a conditional Matching Share to acquire or receive ordinary shares based on continued employment, with certain exemptions, and the conditional Perform. Share I and II to receive additional ordinary shares also based on fulfilment of certain performance conditions. The performance conditions for Perform. Share I comprise a target growth in risk adjusted profit per share (“RAPPS”) or a target growth in risk adjusted return of capital at risk (“RAROCAR”).
Should the reported earnings per share (“EPS”) be lower than a predetermined level the participants are not entitled to exer-cise any Perform. Share I. The performance conditions for Perform. Share II are market related and comprise growth in Total Shareholder Return (“TSR”) in comparison with a peer group’s TSR or a target in RAROCAR and in P/B-ranking compared to a peer group. Furthermore the profit for each right is capped.
When the performance conditions are not fully fulfilled, the rights that are no longer exercisable are shown as forfeited in the previous tables, together with shares forfeited due to participants leaving the Bank.
Fair value calculation and expensesThe exercise price, where applicable, for the ordinary shares is adjusted for dividends. However it is never adjusted below a predetermined price. Furthermore the profit for each right is capped. The share rights have a vesting period of 36 months. The exercise price of Matching Shares is EUR nil and the fair value per share of Matching Shares at grant date is EUR 7.23 and EUR 5.78 for LTIP 2011 and LTIP 2012 respectively.
The amount of the reversed expenses during the year was nil (2016: EUR nil). The expense is offset by a contribution from the Parent for the same amount and is recorded directly in equity. The accumulated cost for the year in respect of the LTIP of tEUR 2,065 (2016: tEUR 2,065) has been recognised in equity.
Cash-settled share-based payment transactionsIn 2013 the Group introduced the Executive Incentive Programme (“EIP”) which aims to strengthen the Group’s capability to retain and recruit the best talents. The aim is to further stimulate the managers and key employees whose efforts have a direct impact on the Group’s result, profitability and long term value growth. The EIP reward performance, meeting agreed predeter-mined targets on the Group, business unit and individual level. The effect on the long term result is to be considered when determining the targets. The EIP shall not exceed the fixed salary. The EIP shall be paid in the form of cash and be subject to TSR indexation, deferral, forfeiture clauses and retention as per relevant remuneration regulations. The main part of EIP for 2014 is paid no earlier than autumn 2018 (EIP for 2013: no earlier than autumn 2017). EIP for 2014 and 2013 is offered instead of the Group’s LTIP and variable salary part (“VSP”) for the invited employees.
As from 2015 on, the amounts for the EIP are included within the other bonus amounts.

Annual Report 2017 – Nordea Bank S.A. 24
9 Other administrative expenses
EUR ‘000 2017 2016
Information technology 1), 3) -17,948 -6,777
Rents, premises and real estate -4,581 -5,382
Travel expenses -1,494 -1,506
Marketing and representation -708 -917
Consulting fees 3) -16,346 -1,514
Postage, telephone and office expenses -1,229 -805
Group internal allocation 2) -1,060 -1,649
Deposit guarantee schemes (Note 35) -1,591 -943
Other 3) -18,095 -2,860
Total -63,052 -22,353
1) Information technology relates mostly to expenses on IT suppliers and IT consultants. 2) Group internal allocation is mainly related to Service Level Agreements with the parent company for providing administrative services.3) Increased cost in Information Technology, Consulting fees and Other expenses are mainly due to liquidation of Zürich branch, and expenses related to compliance and regulatory
projects.
Other expenses include fees paid to statutory auditor for the following services (excluding VAT):
EUR ‘000 2017 2016
Audit fees 440 410
Audit related fees 64 -
Other fees 3 224
507 634
The services performed by the independent auditor during the year ending December 2017 included statutory audit, controls report, trainings and personal tax consulting.
10 Income tax expense
Amounts recognised in profit or loss from continuing operations
EUR ‘000 2017 2016
Current tax 7,938 -4,554
Deferred tax 1,860 -299
Direct taxes from previous period - 77
Other direct taxes -314 -226
Total 9,484 -5,002 Tax related to discontinued operations is shown in note 36.
Reconciliation of effective tax rateThe reconciliation between the tax expense and the accounting profit based on the applicable tax rates is set out below:
EUR ‘000 2017 2016
Operating profit before tax 38,323 49,351
Tax calculated at a tax rate of 20.33% (2016: 22,47%) -7,791 -11,089
Municipal business tax at a tax rate of 6.75% -2,587 -3,331
Effect of different tax rates in other countries -2,324 -314
Other direct taxes -314 -226
Direct taxes from previous period - 77
Tax-exempt income 22,500 9,881
Income tax expense / reimbursement 9,484 -5,002

25Annual Report 2017 – Nordea Bank S.A.
Deferred tax
Deferred tax assets Deferred tax liabilities
EUR ‘000 31 Dec 2017 31 Dec 2016 31 Dec 2017 31 Dec 2016
Derivatives 47 93 - -
Fixed assets - - 5 139
Investments - - 242 822
Retirement benefits - - - -
Provisions - - 3,732 4,921
Other - - 55 59
Total 47 93 4,034 5,941 There is no deferred tax relating to temporary differences associated with investments in group undertakings.
11 Cash and balances with central banks
EUR ‘000 31 Dec 2017 31 Dec 2016
Reserve deposit with central banks 869,798 863,222
Cash in hand 100 394
869,898 863,616
of which:
Restricted reserves with Luxembourg Central Bank 1) 34,572 40,512
LCR 2) related deposit with Luxembourg Central Bank 745,000 745,000
Placements with Swiss National Bank 69,197 55,541
Placements with Monetary Authority of Singapore 21,029 22,169
1) related to minimum restricted reserves that approximate to 1% of the Bank’s deposits and debt certificates maturing within two years.2) LCR is short for Liquidity Coverage Ratio.
12 Loans and receivables
The balances, which are past due or impaired and related allowances are set out below:
EUR ‘000 31 Dec 2017 31 Dec 2016
Loans and receivables, not impaired 3,232,253 3,988,659
Out of which: past due loans 42,939 23,893
Impaired loans and receivables 11,874 18,213
Loans and receivables before allowances and write offs 3,244,127 4,006,872
Allowances and write offs for individually assessed impaired loans -3,347 -6,311
Allowances and write offs -3,347 -6,311
Loans and receivables, carrying amount 3,240,780 4,000,561 Loans with the carrying amount of tEUR 42,939 (2016: tEUR 23,893) are past due at the reporting date but not impaired as there has not been a significant change in credit quality and the amounts are still considered recoverable. These loans and receivables include only the amounts granted to the public.
Maturity information on past due but not impaired loans:
Public
EUR ‘000 31 Dec 2017 31 Dec 2016
Remaining maturity (book value)
Less than 3 months 15,798 6,034
3-12 months 2,559 8,026
1-5 years 10,625 8,901
More than 5 years 13,957 932
Total 42,939 23,893

Annual Report 2017 – Nordea Bank S.A. 26
Reconciliation of allowance for impaired loans is as follows:
EUR ‘000 31 Dec 2017 31 Dec 2016
Allowance balance at 1 January 6,311 8,517
Provisions 926 868
Reversals -1,501 -561
Utilisations -2,310 -2,522
Currency revaluation impact -79 9
Allowance balance at 31 December 3,347 6,311 In determining the recoverability of loans and receivables, the Bank considers any change in the credit quality of the loans and receivables from the date credit was initially granted up to the reporting date.
The allowance for impaired loans represents the difference between the carrying amount of these loans and receivables and the present value of the expected future cash flows.
Information about allocation of secured and unsecured loans and receivables to the public is as follows:
EUR ‘000 31 Dec 2017 31 Dec 2016
Loans and receivables to the public
Secured 1,430,659 1,705,249
Unsecured 15,103 13,483
Total 1,445,762 1,718,732
13 Shares
EUR ‘000 31 Dec 2017 31 Dec 2016
Unlisted shares 1,995 1,870
Fund units, equity related - 61,113
1,995 62,983
Following the sale of Nordea Investment Funds S.A., the Banks participation in seeding of funds has ended.
14 Derivatives
31 December 2017 Fair valueTotal nominal
amountEUR ‘000 Positive Negative
Derivatives held for trading
Interest rate derivatives
Swaps - 182 21,271
Total - 182 21,271
Equity derivatives
Options 4,979 4,979 187,235
Total 4,979 4,979 187,235
Foreign exchange derivatives
Currency forwards 12,232 12,980 1,545,962
Options 424 424 112,406
Other 16 22 19,543
Total 12,672 13,426 1,677,911
Total derivatives held for trading 17,651 18,587 1,886,417

27Annual Report 2017 – Nordea Bank S.A.
31 December 2016 Fair valueTotal nominal
amountEUR ‘000 Positive Negative
Derivatives held for trading
Interest rate derivatives
Swaps - 300 21,680
Total - 300 21,680
Equity derivatives
Options 10,638 10,638 322,914
Total 10,638 10,638 322,914
Foreign exchange derivatives
Currency forwards 409,484 356,683 41,119,252
Options 574 608 255,065
Other 1,680 1,519 1,128,541
Total 411,738 358,810 42,502,858
Total derivatives held for trading 422,376 369,748 42,847,452
Following the sale of Nordea Investment Funds S.A., the banks participation in “hedged share class” activities has ended, hence the decrease of all derivative trading.
15 Investments in subsidiaries
EUR ‘000 2017 2016
At 1 January 17,380 17,380
Share premium CIK 1) 8,697 -
Sale of subsidiaries -26,077 -
Net book values 31 December - 17,380
1) Contribution in kind (“CIK”) on the Transfer Agency and Fund Administration.
Following the decision of the Board of Directors the Bank sold its shares in Nordea Investment Funds S.A. and Nordea Fonds Service GmbH effective 10 July 2017 to Nordea Asset Management Holding AB (SE). Sale of subsidiaries resulted in a profit of tEUR 871 – see note 7.
16 Intangible assets
EUR ‘000 2017 2016
Acquisition cost
At 1 January 76,908 65,305
Additions 1,446 11,603
Disposals -413 -
At 31 December 77,941 76,908
Amortisation
At 1 January 13,612 6,877
Charge for the year 7,493 6,735
Disposals -370 -
At 31 December 20,735 13,612
Net book values 31 December 57,206 63,296 Intangible assets are mainly related to T24 (core banking system). The remaining amortization period per 31 Dec 2017 is 10 years. Impairment test performed showed no need for impairment and no need for changes to the expected useful lifetime of the asset.

Annual Report 2017 – Nordea Bank S.A. 28
17 Other assets
EUR ‘000 31 Dec 2017 31 Dec 2016
Receivables on securities settlement 615 1,536
Cash items in the process of collection 6,657 5,738
Other 1,515 2,063
8,787 9,337
18 Prepaid expenses and accrued income
EUR ‘000 31 Dec 2017 31 Dec 2016
Accrued fees income linked to funds 4,429 29,868
Prepaid expenses 5,609 5,596
10,038 35,464
Decrease in ‘Accrued fees income linked to funds’ is caused by the transfer of the Fund Administration and Transfer Agency to NIFSA in May 2017.
19 Other liabilities
EUR ‘000 31 Dec 2017 31 Dec 2016
Other tax liabilities 3,630 3,324
Accounts payable 1,751 1,766
Other 12,786 9,455
18,167 14,545 Liabilities classified as other are mainly related to securities settlement proceeds.
20 Accrued expenses and prepaid income
EUR ‘000 31 Dec 2017 31 Dec 2016
Other accrued expenses and prepaid income 17,210 19,003
17,210 19,003 Other accrued expenses and prepaid income are primarily related to employees and accruals for late invoices.
21 Provisions
Movements in provisions are as follows:
2017
EUR ‘000 Litigation provisionsRestructuring and
other provisions Total
At beginning of year 3,224 4,103 7,327
New provisions made 915 17,277 18,192
Reversals - - -
Utilisations - -5,282 -5,282
Translation differences -208 - -208
At 31 December 3,931 16,098 20,029
Litigation provisions are analysed at each reporting date and adjusted to reflect the current best estimate. When necessary, appropriate legal advice is taken into consideration in order to make an assessment of the amount of provisions to be recorded.
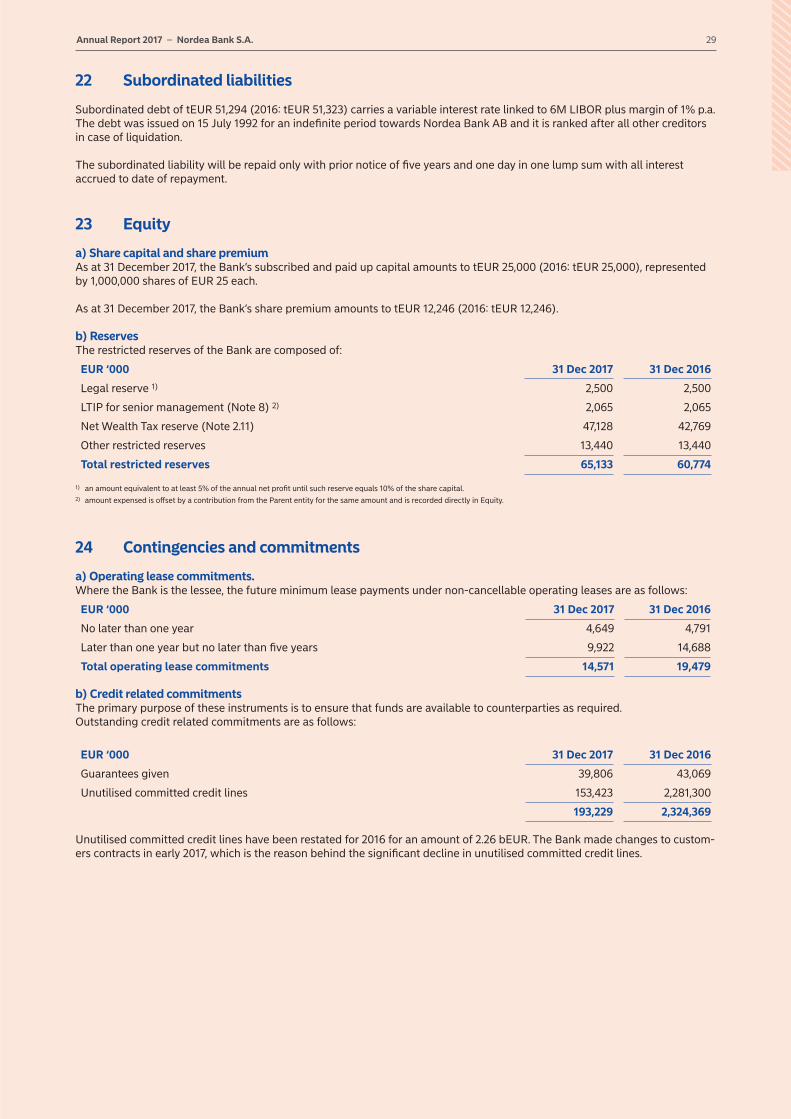
29Annual Report 2017 – Nordea Bank S.A.
22 Subordinated liabilities
Subordinated debt of tEUR 51,294 (2016: tEUR 51,323) carries a variable interest rate linked to 6M LIBOR plus margin of 1% p.a. The debt was issued on 15 July 1992 for an indefinite period towards Nordea Bank AB and it is ranked after all other creditors in case of liquidation.
The subordinated liability will be repaid only with prior notice of five years and one day in one lump sum with all interest accrued to date of repayment.
23 Equity
a) Share capital and share premiumAs at 31 December 2017, the Bank’s subscribed and paid up capital amounts to tEUR 25,000 (2016: tEUR 25,000), represented by 1,000,000 shares of EUR 25 each.
As at 31 December 2017, the Bank’s share premium amounts to tEUR 12,246 (2016: tEUR 12,246).
b) ReservesThe restricted reserves of the Bank are composed of:
EUR ‘000 31 Dec 2017 31 Dec 2016
Legal reserve 1) 2,500 2,500
LTIP for senior management (Note 8) 2) 2,065 2,065
Net Wealth Tax reserve (Note 2.11) 47,128 42,769
Other restricted reserves 13,440 13,440
Total restricted reserves 65,133 60,774
1) an amount equivalent to at least 5% of the annual net profit until such reserve equals 10% of the share capital.2) amount expensed is offset by a contribution from the Parent entity for the same amount and is recorded directly in Equity.
24 Contingencies and commitments
a) Operating lease commitments.Where the Bank is the lessee, the future minimum lease payments under non-cancellable operating leases are as follows:
EUR ‘000 31 Dec 2017 31 Dec 2016
No later than one year 4,649 4,791
Later than one year but no later than five years 9,922 14,688
Total operating lease commitments 14,571 19,479
b) Credit related commitmentsThe primary purpose of these instruments is to ensure that funds are available to counterparties as required.Outstanding credit related commitments are as follows:
EUR ‘000 31 Dec 2017 31 Dec 2016
Guarantees given 39,806 43,069
Unutilised committed credit lines 153,423 2,281,300
193,229 2,324,369 Unutilised committed credit lines have been restated for 2016 for an amount of 2.26 bEUR. The Bank made changes to custom-ers contracts in early 2017, which is the reason behind the significant decline in unutilised committed credit lines.
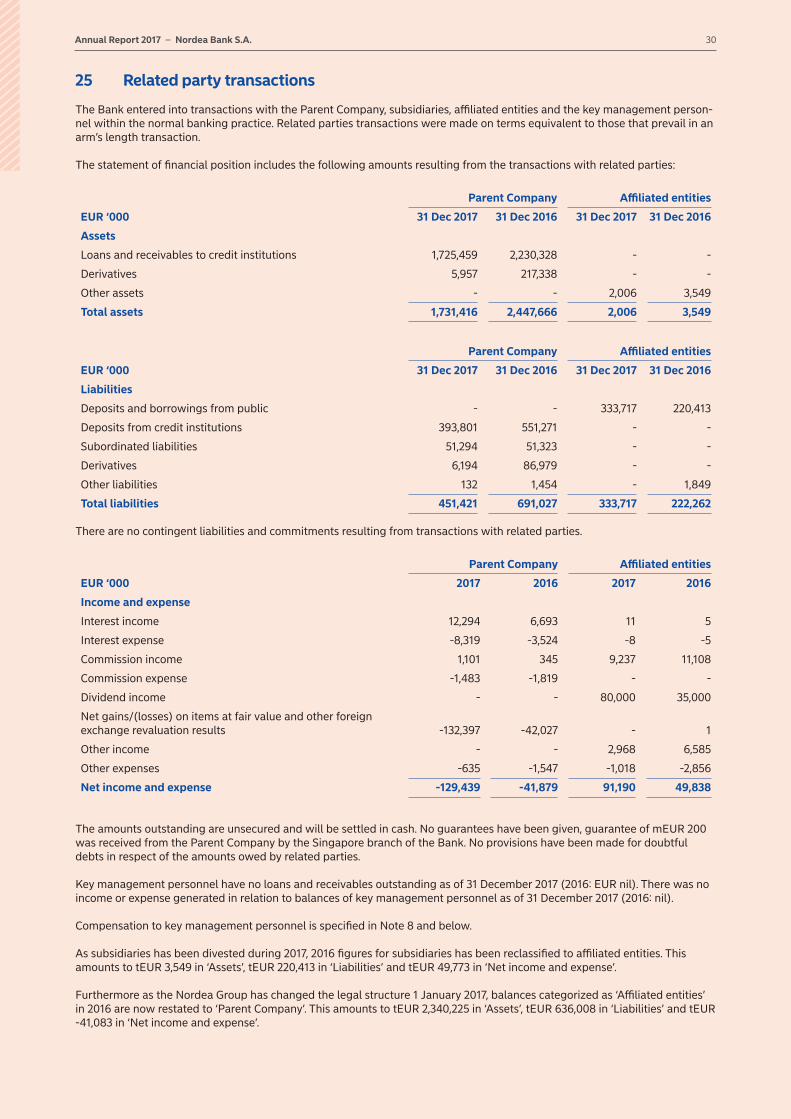
Annual Report 2017 – Nordea Bank S.A. 30
25 Related party transactions
The Bank entered into transactions with the Parent Company, subsidiaries, affiliated entities and the key management person-nel within the normal banking practice. Related parties transactions were made on terms equivalent to those that prevail in an arm’s length transaction.
The statement of financial position includes the following amounts resulting from the transactions with related parties:
Parent Company Affiliated entities
EUR ‘000 31 Dec 2017 31 Dec 2016 31 Dec 2017 31 Dec 2016
Assets
Loans and receivables to credit institutions 1,725,459 2,230,328 - -
Derivatives 5,957 217,338 - -
Other assets - - 2,006 3,549
Total assets 1,731,416 2,447,666 2,006 3,549
Parent Company Affiliated entities
EUR ‘000 31 Dec 2017 31 Dec 2016 31 Dec 2017 31 Dec 2016
Liabilities
Deposits and borrowings from public - - 333,717 220,413
Deposits from credit institutions 393,801 551,271 - -
Subordinated liabilities 51,294 51,323 - -
Derivatives 6,194 86,979 - -
Other liabilities 132 1,454 - 1,849
Total liabilities 451,421 691,027 333,717 222,262 There are no contingent liabilities and commitments resulting from transactions with related parties.
Parent Company Affiliated entities
EUR ‘000 2017 2016 2017 2016
Income and expense
Interest income 12,294 6,693 11 5
Interest expense -8,319 -3,524 -8 -5
Commission income 1,101 345 9,237 11,108
Commission expense -1,483 -1,819 - -
Dividend income - - 80,000 35,000
Net gains/(losses) on items at fair value and other foreign exchange revaluation results -132,397 -42,027 - 1
Other income - - 2,968 6,585
Other expenses -635 -1,547 -1,018 -2,856
Net income and expense -129,439 -41,879 91,190 49,838
The amounts outstanding are unsecured and will be settled in cash. No guarantees have been given, guarantee of mEUR 200 was received from the Parent Company by the Singapore branch of the Bank. No provisions have been made for doubtful debts in respect of the amounts owed by related parties.
Key management personnel have no loans and receivables outstanding as of 31 December 2017 (2016: EUR nil). There was no income or expense generated in relation to balances of key management personnel as of 31 December 2017 (2016: nil).
Compensation to key management personnel is specified in Note 8 and below.
As subsidiaries has been divested during 2017, 2016 figures for subsidiaries has been reclassified to affiliated entities. This amounts to tEUR 3,549 in ‘Assets’, tEUR 220,413 in ‘Liabilities’ and tEUR 49,773 in ‘Net income and expense’.
Furthermore as the Nordea Group has changed the legal structure 1 January 2017, balances categorized as ‘Affiliated entities’ in 2016 are now restated to ‘Parent Company’. This amounts to tEUR 2,340,225 in ‘Assets’, tEUR 636,008 in ‘Liabilities’ and tEUR -41,083 in ‘Net income and expense’.

31Annual Report 2017 – Nordea Bank S.A.
Remuneration of key management personnelThe remuneration of the key management personnel of the Bank, or Executives, is set out below for each of the categories specified in IAS 24 “Related Party Disclosures”.
EUR ‘000 2017 2016
Short-term employee benefits 2,154 3,086
Post-employment benefits 89 94
2,243 3,180
Short term employee benefits include salaries, social security contributions, paid annual leave and paid sick leave, profit-shar-ing and bonuses (if payable within twelve months of the end of the period) and non-monetary benefits (such as medical care, housing, cars and free or subsidised goods or services).
Post-employment benefits include pensions, other retirement benefits, post-employment life insurance and post-employment medical care.
Other long-term benefits include long-service leave or sabbatical leave, jubilee or other long-services benefits, long-term disa-bility benefits and, if they are not payable wholly within twelve months after the end of the period, profit sharing, bonuses and deferred compensation.
26 Investment management services and underwriting functions
The Bank provides its customers with, among others, the following services:• Private Banking;• Custody; and• Fiduciary representation.
Assets managed on behalf of third parties are as follows:
EUR ‘000 31 Dec 2017 31 Dec 2016
Custody and administration of transferrable securities 1) 7,649,935 7,995,029
Fiduciary representation - 17,421
Wealth management 3,000,777 3,405,419
10,650,712 11,417,8691) Amount in custody for 2016 has been restated. Amount stated for 2016 is mEUR 1,116 lower than reported in 2016 financial statements.
27 Classification of financial instruments
31 December 2017
EUR ‘000 Loans and receivables
Designated at fair value through
profit and loss Total
Assets
Cash and balances with central banks 869,898 - 869,898
Loans and receivables to credit institutions 1,795,018 - 1,795,018
Loans and receivables to the public 1,445,762 - 1,445,762
Shares - 1,995 1,995
Derivatives - 17,651 17,651
Other assets 8,787 - 8,787
Accrued income (excluding prepayments) 4,429 - 4,429
Total 4,123,894 19,646 4,143,540
31 December 2017
EUR ‘000
Designated at fair value through profit
and lossOther financial
liabilities Total
Liabilities
Deposits from credit institutions 394,317 394,317
Deposits and borrowings from the public 3,234,767 3,234,767
Derivatives 18,587 18,587
Other liabilities 18,167 18,167
Accrued expenses and prepaid income 17,210 17,210
Subordinated liabilities 51,294 51,294
Total 18,587 3,715,755 3,734,342

Annual Report 2017 – Nordea Bank S.A. 32
31 December 2016 EUR ‘000
Loans and receivables
Designated at fair value through
profit and loss Total
Assets
Cash and balances with central banks 863,616 - 863,616
Loans and receivables to credit institutions 2,281,829 - 2,281,829
Loans and receivables to the public 1,718,732 - 1,718,732
Shares - 62,983 62,983
Derivatives - 422,376 422,376
Other assets 9,337 - 9,337
Accrued income (excluding prepayments) 29,868 - 29,868
Total 4,903,382 485,359 5,388,741
31 December 2016 EUR ‘000
Designated at fair value through profit
and lossOther financial
liabilities Total
Liabilities
Deposits from credit institutions - 624,899 624,899
Deposits and borrowings from the public - 3,845,701 3,845,701
Derivatives 369,748 - 369,748
Other liabilities - 14,545 14,545
Accrued expenses and prepaid income - 19,003 19,003
Subordinated liabilities - 51,323 51,323
Total 369,748 4,555,471 4,925,219
28 Assets and liabilities at fair value
31 Dec 2017 31 Dec 2016
EUR ‘000 Book value Fair value Book value Fair value
Assets
Loans and receivables to credit institutions 1,795,018 1,795,018 2,281,829 2,281,829
Loans and receivables to the public 1,445,762 1,445,762 1,718,732 1,718,592
Shares 1,995 1,995 62,983 62,983
Derivatives 17,651 17,651 422,376 422,376
3,260,426 3,260,426 4,485,920 4,485,780
Liabilities
Deposits from credit institutions 394,317 394,317 624,899 624,899
Deposits and borrowings from the public 3,234,767 3,234,767 3,845,701 3,845,701
Derivatives 18,587 18,587 369,748 369,748
Subordinated liabilities 51,294 51,294 51,323 51,323
3,698,965 3,698,965 4,891,671 4,891,671
Estimation of fair value for assets and liabilitiesFinancial assets and financial liabilities on the statement of financial position are generally measured at amortised cost.
Fair value is estimated to be equal to the book value (amortised cost) as its reasonable approximation for loans and receiva-bles other than loans and receivables to the public and deposits and borrowings.
Loans and receivables mainly consist of investment loans whose interest repricing period is up to 3 months and mortgage loans with interest repricing period of one year. Fair value of investment loans is considered to approximate its book value due to short maturity and low volatility in interest rates. Fair value of mortgage loans differs to its book value due to longer interest repricing period and higher volatility in interest rates.
Fair value is estimated to be equal to the carrying amount for short-term financial assets and financial liabilities including cash and balances with central banks. The carrying amount is a reasonable approximation of fair value due to limited credit risk and short time to maturity.

33Annual Report 2017 – Nordea Bank S.A.
Valuation of unquoted equity instruments is normally based on one of the following:• Recent arm’s length market transactions;• Current fair value of another instrument that is substantially the same;• Expected cash flows discounted at current rates applicable for items with similar terms and risk characteristics; or• Other valuation models.
Determination of fair value from quoted market prices or valuation techniquesThe following table presents the valuation methods used to determine fair values of financial instruments carried at fair value.
31 December 2017 EUR ‘000
Instruments with quoted prices
(Level 1)
Valuation technique using observable data
(Level 2)
Valuation tech-nique using non-observable data
(Level 3) Total
Assets
Loans and receivables to credit institutions - 1,795,018 - 1,795,018
Loans and receivables to the public - 1,445,762 - 1,445,762
Shares 1) 985 1,000 10 1,995
Derivatives - 17,651 - 17,651
Liabilities
Deposits from credit institutions - 394,317 - 394.317
Deposits and borrowings from the public - 3,234,767 - 3,234,767
Derivatives - 18,587 - 18,587
Subordinated liabilities - 51,294 - 51,294
31 December 2016 EUR ‘000
Instruments with quoted prices
(Level 1)
Valuation technique using observable data
(Level 2)
Valuation tech-nique using non-observable data
(Level 3) Total
Assets
Loans and receivables to credit institutions - 2,281,829 - 2,281,829
Loans and receivables to the public - 1,718,592 - 1,718,592
Shares 1) 61,180 1,759 44 62,983
Derivatives - 422,376 - 422,376
Liabilities
Deposits from credit institutions - 624,899 - 624,899
Deposits and borrowings from the public - 3,845,701 - 3,845,701
Derivatives - 369,748 - 369,748
Subordinated liabilities - 51,323 - 51,323
1) The level 3 assets consist of unlisted shares, which grant to the Bank membership rights to particular services.
Level 1 includes financial assets and financial liabilities valued using unadjusted quoted prices in active markets for identical assets or liabilities. This category includes listed equity shares, exchange-traded derivatives and listed securities.
Level 2 includes financial assets and financial liabilities which do not have quoted market prices directly available from an active market, and where fair values are estimated using valuation techniques or models, based wherever possible on assump-tions supported by observable market prices or rates prevailing at the reporting date. The Bank’s OTC derivatives and unlisted shares fall within this category.
Level 3 includes financial assets and financial liabilities where the valuation technique includes inputs not based on observable data and the unobservable inputs have a significant effect on the instrument’s valuation. This category includes instruments that are valued based on quoted prices for similar instruments where significant unobservable adjustments or assumptions are required to reflect differences between the instruments.
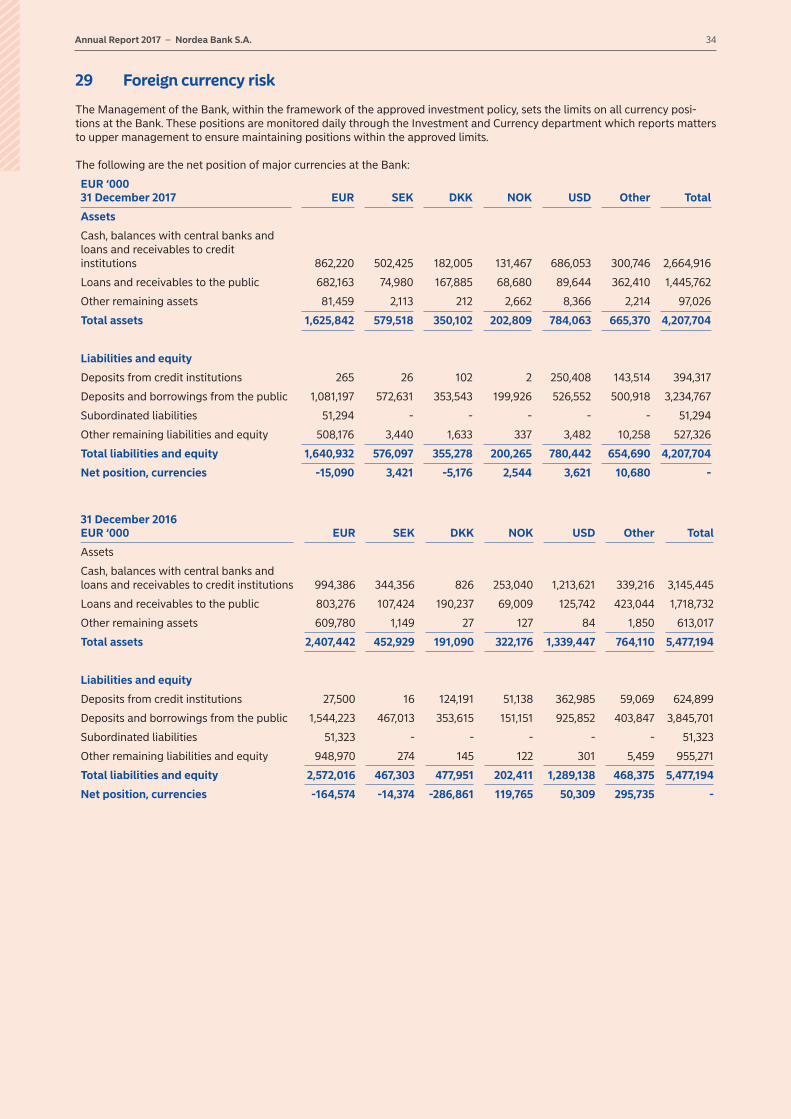
Annual Report 2017 – Nordea Bank S.A. 34
29 Foreign currency risk
The Management of the Bank, within the framework of the approved investment policy, sets the limits on all currency posi-tions at the Bank. These positions are monitored daily through the Investment and Currency department which reports matters to upper management to ensure maintaining positions within the approved limits.
The following are the net position of major currencies at the Bank:
EUR ‘000 31 December 2017 EUR SEK DKK NOK USD Other Total
Assets
Cash, balances with central banks and loans and receivables to credit institutions 862,220 502,425 182,005 131,467 686,053 300,746 2,664,916
Loans and receivables to the public 682,163 74,980 167,885 68,680 89,644 362,410 1,445,762
Other remaining assets 81,459 2,113 212 2,662 8,366 2,214 97,026
Total assets 1,625,842 579,518 350,102 202,809 784,063 665,370 4,207,704
Liabilities and equity
Deposits from credit institutions 265 26 102 2 250,408 143,514 394,317
Deposits and borrowings from the public 1,081,197 572,631 353,543 199,926 526,552 500,918 3,234,767
Subordinated liabilities 51,294 - - - - - 51,294
Other remaining liabilities and equity 508,176 3,440 1,633 337 3,482 10,258 527,326
Total liabilities and equity 1,640,932 576,097 355,278 200,265 780,442 654,690 4,207,704
Net position, currencies -15,090 3,421 -5,176 2,544 3,621 10,680 -
31 December 2016 EUR ‘000 EUR SEK DKK NOK USD Other Total
Assets
Cash, balances with central banks and loans and receivables to credit institutions 994,386 344,356 826 253,040 1,213,621 339,216 3,145,445
Loans and receivables to the public 803,276 107,424 190,237 69,009 125,742 423,044 1,718,732
Other remaining assets 609,780 1,149 27 127 84 1,850 613,017
Total assets 2,407,442 452,929 191,090 322,176 1,339,447 764,110 5,477,194
Liabilities and equity
Deposits from credit institutions 27,500 16 124,191 51,138 362,985 59,069 624,899
Deposits and borrowings from the public 1,544,223 467,013 353,615 151,151 925,852 403,847 3,845,701
Subordinated liabilities 51,323 - - - - - 51,323
Other remaining liabilities and equity 948,970 274 145 122 301 5,459 955,271
Total liabilities and equity 2,572,016 467,303 477,951 202,411 1,289,138 468,375 5,477,194
Net position, currencies -164,574 -14,374 -286,861 119,765 50,309 295,735 -

35Annual Report 2017 – Nordea Bank S.A.
30 Maturity analysis for assets and liabilities
Remaining maturity
31 December 2017 EUR ‘000
Payable on demand
Maximum 3 months
3-12 months 1-5 years
More than 5 years Total
Cash and balances with central banks 869,898 - - - - 869,898
Loans and receivables to credit institutions 1,120,207 424,433 125,189 125,189 - 1,795,018
Loans and receivables to the public 128,805 786,077 49,937 237,952 242,991 1,445,762
Derivatives - 13,745 2,467 1,439 - 17,651
Total assets with fixed maturities 2,118,910 1,224,255 177,593 364,580 242,991 4,128,329
Deposits from credit institutions 140,731 - 125,189 128,397 - 394,317
Deposits and borrowings from the public 2,954,213 268,290 12,264 - - 3,234,767
Derivatives - 14,235 2,776 1,576 - 18,587
Subordinated liabilities - - - - 51,294 51,294
Total liabilities with fixed maturities 3,094,944 282,525 140,229 129,973 51,294 3,698,965
31 December 2016 EUR ‘000
Payable on demand
Maximum 3 months
3-12 months 1-5 years
More than 5 years Total
Cash and balances with central banks 863,616 - - - - 863,616
Loans and receivables to credit institutions 1,018,204 878,488 242,749 142,388 - 2,281,829
Loans and receivables to the public 717,123 475,003 113,492 208,503 204,611 1,718,732
Derivatives - 412,225 6,943 3,208 - 422,376
Total assets with fixed maturities 2,598,943 1,765,716 363,184 354,099 204,611 5,286,553
Deposits from credit institutions 220,790 47,849 213,872 142,388 - 624,899
Deposits and borrowings from the public 3,650,199 138,338 57,164 - - 3,845,701
Derivatives - 358,432 7,807 3,509 - 369,748
Subordinated liabilities - - - - 51,323 51,323
Total liabilities with fixed maturities 3,870,989 544,619 278,843 145,897 51,323 4,891,671 The maturity analysis is based on contractual maturity.
31 IFRS 9 transitional balances on 1 January 2018
Accounting principles for financial instruments under IFRS 9 are described under Note 2.
Reclassification of financial assets before transition (IAS 39)
EUR ‘000Amortised
cost
Fair value through P/L
(mandat.)
Non-financial assets and associated
undertakingsAssets held
for sale Total
Assets
Cash and balances with central banks 869,898 - - - 869,898
Loans and receivables to credit institutions 1,795,018 - - - 1,795,018
Loans and receivables to the public 1,445,762 - - - 1,445,762
Shares - 1,995 - - 1,995
Derivatives - 17,651 - - 17,651
Investments in subsidiaries - - - - -
Intangible assets - - 57,206 - 57,206
Property and equipment - - 1,302 - 1,302
Deferred tax assets - - 47 - 47
Other assets 8,787 - - - 8,787
Prepaid expenses and accrued income 4,429 - 5,609 - 10,038
Total assets 4,123,894 19,646 64,164 - 4,207,704

Annual Report 2017 – Nordea Bank S.A. 36
EUR ‘000Amortised
cost
Fair value through P/L
(mandat.)Non-financial
liabilitiesLiabilities
held for sale Total
Liabilities
Deposits from credit institutions 394,317 - - - 394,317
Deposits and borrowings from the public 3,234,767 - - - 3,234,767
Derivatives - 18,587 - - 18,587
Current tax liabilities - - 22,309 - 22,309
Other liabilities 18,167 - - - 18,167
Accrued expenses and prepaid income 17,210 - - - 17,210
Deferred tax liabilities - - 4,034 - 4,034
Provisions - - 20,029 - 20,029
Subordinated liabilities 51,294 - - - 51,294
Total liabilities 3,715,755 18,587 46,372 - 3,780,714
Reclassification of financial assets at transition (from IAS 39 to IFRS 9)
EUR ‘000Amortised
cost
Fair value through P/L
(mandat.)
Fair value through P/L
(optional) Total
Assets
Closing balances 31 December 2017 under IAS39 4,123,894 - 19,646 4,143,540
Reclassification from FVPL (IAS39) to AC (IFRS9) – required classification 1) - - - -
Reclassification from fair value option (under IAS 39) to FVPL mandatorily (IFRS 9) - required classification based on classification criteria 2) - 19,646 -19,646 -
Reclassification from FVPL (under IAS 39) to fair value option (IFRS 9) - fair value option elected at 1 Jan 2018 3) - - - -
Reclassification from AC (IAS 39) to FVPL (IFRS 9) - required classification based on classification criteria 4) - - - -
Remeasurement under IFRS 9 - - -
Opening balances 1 Jan 2018 under IFRS 9 4,123,894 19,646 - 4,143,540
Retained earnings effect 1 Jan 2018 5) -713 - -713
Equity effect 1 Jan 2018 -713 - -713 1) The reclassification is related to loans.2) Shares of 2 mEUR and derivatives of 17.7 mEUR have been reclassified from fair value option (under IAS 39) to fair value through profit and loss - mandatorily (under IFRS 9) due to
required classification based on classification criteria.3) The reclassification is mainly related to interest bearing securities pledged as collateral.4) The reclassification is related to loans.5) Retained earnings effect 1 January 2018 is related to post tax effect of remeasurement of provisions
Reclassification of provisions at transition (from IAS 39 to IFRS 9)
EUR ‘000Loans &
receivablesAmortised
cost Available for sale Off balance Total
Closing provisions 2017, IAS39 3,347 - - - 3,347
Reclassification to AC -3,347 3,347 - - -
Reclassification to FVTPL - - - - -
Opening provisions 2018, IAS 39 - 3,347 - - 3,347
Remeasurement under IFRS 9, model based provisions - 849 - 18 867
Remeasurement under IFRS 9, individually calculated provisions - 115 - - 115
Opening provisions 2018, IFRS 9 - 4,311 - 18 4,329
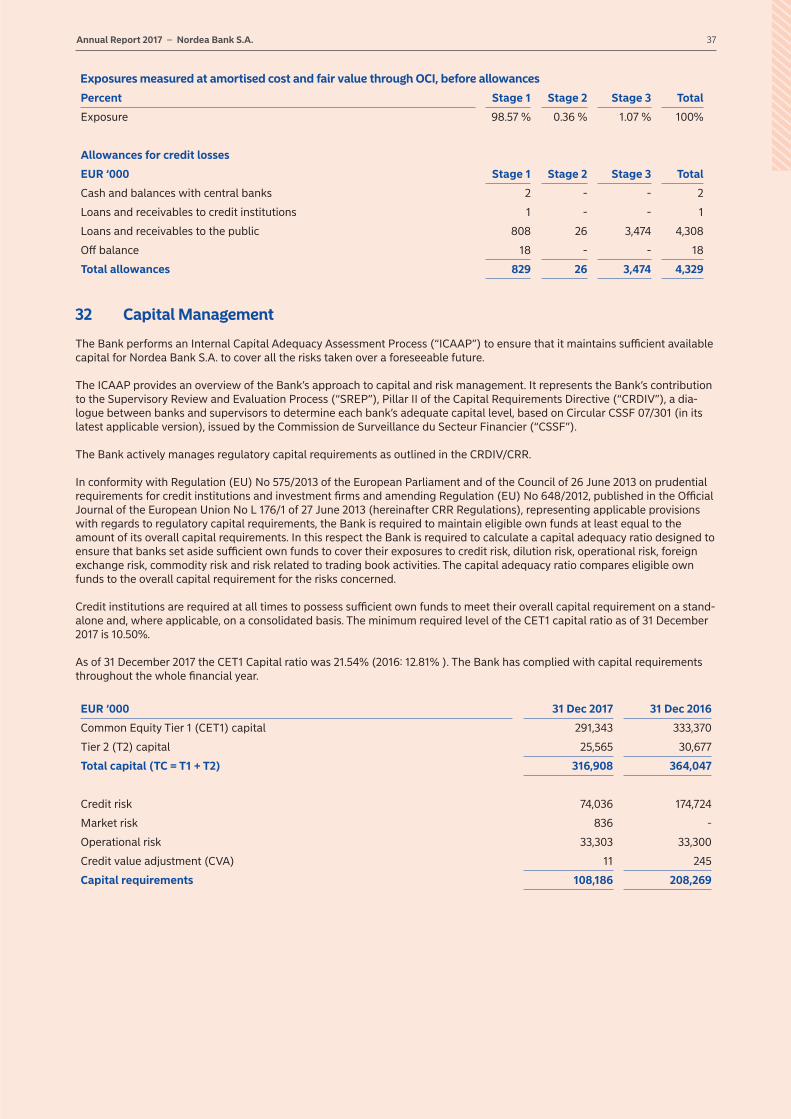
37Annual Report 2017 – Nordea Bank S.A.
Exposures measured at amortised cost and fair value through OCI, before allowances
Percent Stage 1 Stage 2 Stage 3 Total
Exposure 98.57 % 0.36 % 1.07 % 100%
Allowances for credit losses
EUR ‘000 Stage 1 Stage 2 Stage 3 Total
Cash and balances with central banks 2 - - 2
Loans and receivables to credit institutions 1 - - 1
Loans and receivables to the public 808 26 3,474 4,308
Off balance 18 - - 18
Total allowances 829 26 3,474 4,329
32 Capital Management
The Bank performs an Internal Capital Adequacy Assessment Process (“ICAAP”) to ensure that it maintains sufficient available capital for Nordea Bank S.A. to cover all the risks taken over a foreseeable future.
The ICAAP provides an overview of the Bank’s approach to capital and risk management. It represents the Bank’s contribution to the Supervisory Review and Evaluation Process (“SREP”), Pillar II of the Capital Requirements Directive (“CRDIV”), a dia-logue between banks and supervisors to determine each bank’s adequate capital level, based on Circular CSSF 07/301 (in its latest applicable version), issued by the Commission de Surveillance du Secteur Financier (“CSSF”).
The Bank actively manages regulatory capital requirements as outlined in the CRDIV/CRR.
In conformity with Regulation (EU) No 575/2013 of the European Parliament and of the Council of 26 June 2013 on prudential requirements for credit institutions and investment firms and amending Regulation (EU) No 648/2012, published in the Official Journal of the European Union No L 176/1 of 27 June 2013 (hereinafter CRR Regulations), representing applicable provisions with regards to regulatory capital requirements, the Bank is required to maintain eligible own funds at least equal to the amount of its overall capital requirements. In this respect the Bank is required to calculate a capital adequacy ratio designed to ensure that banks set aside sufficient own funds to cover their exposures to credit risk, dilution risk, operational risk, foreign exchange risk, commodity risk and risk related to trading book activities. The capital adequacy ratio compares eligible own funds to the overall capital requirement for the risks concerned.
Credit institutions are required at all times to possess sufficient own funds to meet their overall capital requirement on a stand-alone and, where applicable, on a consolidated basis. The minimum required level of the CET1 capital ratio as of 31 December 2017 is 10.50%.
As of 31 December 2017 the CET1 Capital ratio was 21.54% (2016: 12.81% ). The Bank has complied with capital requirements throughout the whole financial year.
EUR ‘000 31 Dec 2017 31 Dec 2016
Common Equity Tier 1 (CET1) capital 291,343 333,370
Tier 2 (T2) capital 25,565 30,677
Total capital (TC = T1 + T2) 316,908 364,047
Credit risk 74,036 174,724
Market risk 836 -
Operational risk 33,303 33,300
Credit value adjustment (CVA) 11 245
Capital requirements 108,186 208,269

Annual Report 2017 – Nordea Bank S.A. 38
33 Financial risk management
During the normal course of business, the Bank is exposed to market risk (interest rate risk, equity risk, and foreign exchange risk), liquidity risk, credit risk (counterparty risk, settlement risk) and operational risk. These risks are monitored and managed through internal risk reports which analyse exposure by degree and magnitude of risks. The aim of risk management within the Bank is to identify and measure, to monitor and control risks and follow closely risk lines and limits, report risks and follow up on risks.
a) Market risk (including foreign exchange and interest rate risks) Market risk is the risk of loss in market value of the Bank’s positions with market risk exposure as a result of movements in market factors related to interest rates, equity prices and foreign exchange rates. The Bank's consolidated market risks are assessed from a Euro based currency perspective.
Value at Risk (“VaR”) is the main measure of market risk in the Bank for normal market conditions. VaR estimates the loss in market value that could be expected in rare events in a normal market environment for deep and liquid financial markets.
The VaR models in place as of 31 December 2017 are based on historical changes in market prices and rates over the last 500 days, a holding period of ten banking days and a probability of 99%. The Bank uses historical simulation based on the so-called expected tail loss approach, using the average of the three (or a lower number) most adverse simulation results as an estimate of VaR, and therefore label it tVaR (tail VaR).
tVaR figures are calculated for each type of risk and as total tVaR (across risk categories) for the Bank.
The purpose of the implemented market risk control is to ensure that risks the Bank is exposed to be effectively monitored. The control is carried out by the Bank’s Risk & Capital department on a business daily basis according to the Bank's market risk policy.
The Group has set up the systems and models needed for calculating the market risk. The Bank’s end of-day transactions and positions bearing market risk are sent electronically to the Group's market risk system at night. Market risk figures are calculat-ed and results are returned to the Bank the following morning. Risk figures are calculated on the basis of Group models, parameters and prices.
The Risk & Capital department has access to an intranet reporting interface provided by the Group (“MARS”). Any risk figures received daily from the Group’s system are controlled, validated and approved against the actual limits granted to the Bank via the Bank's overall market risk instructions.
The Bank has limits in place for its market risk exposures as per below; Value-at-Risk, total risk limit: tEUR 1,600 (2016: tEUR 2,000) Value-at-Risk, total exposure: tEUR 116 (2016: tEUR 387)
In addition the Bank is also limiting and controlling the risks related to the Drawdown risk as well as the Stressed loss. In case of any limit being exceeded the Risk & Capital department will investigate and explanation reports are established jointly with the responsible front office department. Any line excess is reported to Executive Management, the Board and the Group, and corrective measures are taken.
Exchange rate riskThe exchange rate risk is the risk that the value of the financial assets will fluctuate as a result of foreign exchange rate move-ments. This risk is controlled by adhering to approved currency risk limits, covered through the Bank’s market risk system (“MARS”) and the daily controls performed by the Risk & Capital department.
Foreign exchange VaR limit: tEUR 800 (2016: tEUR 1,000)
Foreign exchange risk (VaR): tEUR 118 (2016: tEUR 223)
Interest rate riskInterest rate risk is the potential impact on the Bank’s earnings and net asset values arising from changes in interest rates. Interest rate risk arises, when the Bank’s principal and interest cash flows (including final maturity), both on- and off-balance sheet, have mismatched re-pricing dates or there is a mismatch of floating versus fixed interests.
The Bank has a measurement system for interest rate risk which incorporates each of these risk items. The system for linear risk is based on VaR on the interest rate risk ladders from all interest bearing items and covers the usual yield curve and basic risk. Any non-linear risk stemming from options is based on scenario simulation.
Interest rate VaR limit: tEUR 800 (2016: tEUR 1,250)
Interest rate risk (VaR): tEUR 52 (2016: tEUR 322)
The interest sensitivity ladder is calculated for a given currency by choosing a number of predefined ladder points on the yield curve (1M, 2M etc., usually 12 points up to 10Y) and calculating the sensitivity to that yield curve point.
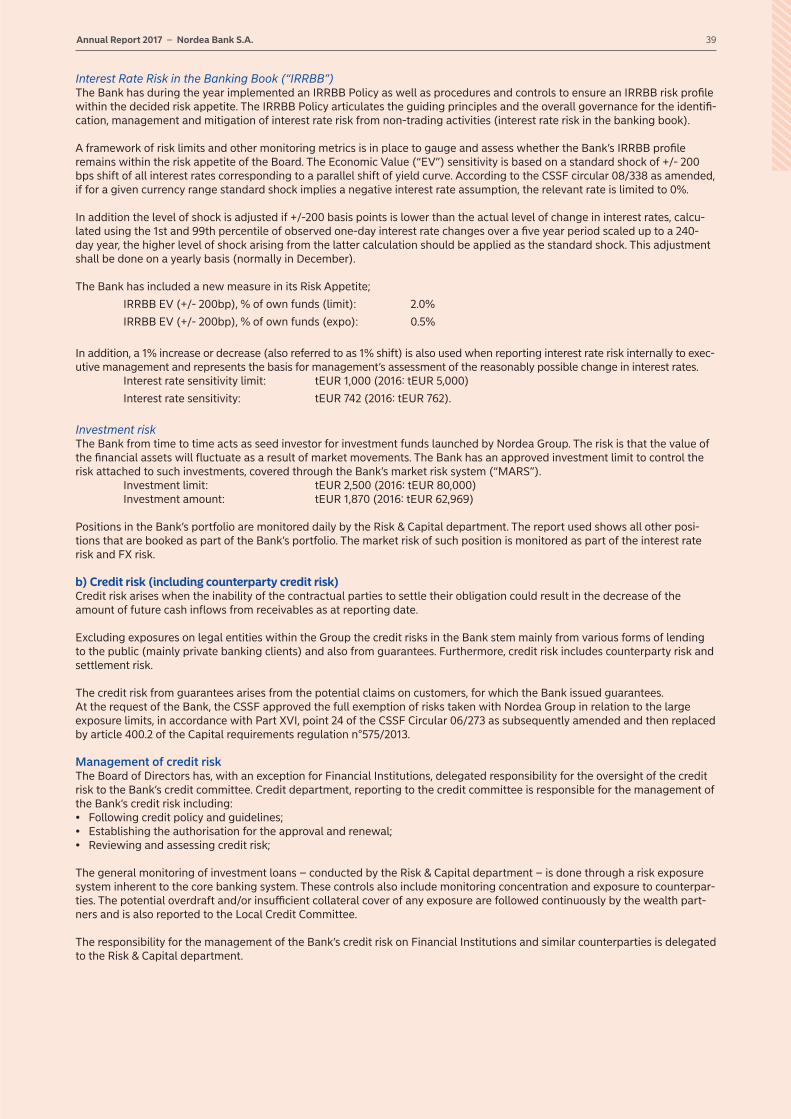
39Annual Report 2017 – Nordea Bank S.A.
Interest Rate Risk in the Banking Book (“IRRBB”)The Bank has during the year implemented an IRRBB Policy as well as procedures and controls to ensure an IRRBB risk profile within the decided risk appetite. The IRRBB Policy articulates the guiding principles and the overall governance for the identifi-cation, management and mitigation of interest rate risk from non-trading activities (interest rate risk in the banking book).
A framework of risk limits and other monitoring metrics is in place to gauge and assess whether the Bank’s IRRBB profile remains within the risk appetite of the Board. The Economic Value (“EV”) sensitivity is based on a standard shock of +/- 200 bps shift of all interest rates corresponding to a parallel shift of yield curve. According to the CSSF circular 08/338 as amended, if for a given currency range standard shock implies a negative interest rate assumption, the relevant rate is limited to 0%.
In addition the level of shock is adjusted if +/-200 basis points is lower than the actual level of change in interest rates, calcu-lated using the 1st and 99th percentile of observed one-day interest rate changes over a five year period scaled up to a 240-day year, the higher level of shock arising from the latter calculation should be applied as the standard shock. This adjustment shall be done on a yearly basis (normally in December).
The Bank has included a new measure in its Risk Appetite;
IRRBB EV (+/- 200bp), % of own funds (limit): 2.0%
IRRBB EV (+/- 200bp), % of own funds (expo): 0.5%
In addition, a 1% increase or decrease (also referred to as 1% shift) is also used when reporting interest rate risk internally to exec-utive management and represents the basis for management’s assessment of the reasonably possible change in interest rates. Interest rate sensitivity limit: tEUR 1,000 (2016: tEUR 5,000)
Interest rate sensitivity: tEUR 742 (2016: tEUR 762).
Investment riskThe Bank from time to time acts as seed investor for investment funds launched by Nordea Group. The risk is that the value of the financial assets will fluctuate as a result of market movements. The Bank has an approved investment limit to control the risk attached to such investments, covered through the Bank’s market risk system (“MARS”). Investment limit: tEUR 2,500 (2016: tEUR 80,000) Investment amount: tEUR 1,870 (2016: tEUR 62,969)
Positions in the Bank’s portfolio are monitored daily by the Risk & Capital department. The report used shows all other posi-tions that are booked as part of the Bank’s portfolio. The market risk of such position is monitored as part of the interest rate risk and FX risk.
b) Credit risk (including counterparty credit risk)Credit risk arises when the inability of the contractual parties to settle their obligation could result in the decrease of the amount of future cash inflows from receivables as at reporting date.
Excluding exposures on legal entities within the Group the credit risks in the Bank stem mainly from various forms of lending to the public (mainly private banking clients) and also from guarantees. Furthermore, credit risk includes counterparty risk and settlement risk.
The credit risk from guarantees arises from the potential claims on customers, for which the Bank issued guarantees. At the request of the Bank, the CSSF approved the full exemption of risks taken with Nordea Group in relation to the large exposure limits, in accordance with Part XVI, point 24 of the CSSF Circular 06/273 as subsequently amended and then replaced by article 400.2 of the Capital requirements regulation n°575/2013.
Management of credit riskThe Board of Directors has, with an exception for Financial Institutions, delegated responsibility for the oversight of the credit risk to the Bank’s credit committee. Credit department, reporting to the credit committee is responsible for the management of the Bank’s credit risk including:• Following credit policy and guidelines;• Establishing the authorisation for the approval and renewal;• Reviewing and assessing credit risk;
The general monitoring of investment loans – conducted by the Risk & Capital department – is done through a risk exposure system inherent to the core banking system. These controls also include monitoring concentration and exposure to counterpar-ties. The potential overdraft and/or insufficient collateral cover of any exposure are followed continuously by the wealth part-ners and is also reported to the Local Credit Committee.
The responsibility for the management of the Bank’s credit risk on Financial Institutions and similar counterparties is delegated to the Risk & Capital department.

Annual Report 2017 – Nordea Bank S.A. 40
Maximum exposure to credit risk(Excluding cash in hand and balances with central banks)
EUR ‘000 31 Dec 2017 31 Dec 2016
Assets:
Loans and receivables to credit institutions 1,795,018 2,281,829
Loans and receivables to the public 1,445,762 1,718,732
Derivatives 17,651 422,376
Off-balance sheet commitments:
Guarantees given 39,806 43,069
Unutilised committed lines 153,423 2,281,300
3,451,660 6,747,306
The breakdown of loans and receivables to the public by type is as follows:
EUR ‘000 31 Dec 2017 31 Dec 2016
Loans and receivables to the public
Investment loans 333,180 485,511
Mortgage loans 529,558 543,155
Other 583,024 690,066
1,445,762 1,718,732
Split on Loans and receivables to the public between ‘Mortgage loans’ and ‘Other’ has been corrected for 2016 for an amount of 17.7 mEUR. Net loans and receivables to the public for 2016 are unchanged.
The loans granted to the public are mostly those with private individuals (or where the ultimate risk is towards a private individual).
The collateral for the above presented credit exposures mainly consists of pledged deposits, and/or securities and mortgages on residential properties.
Exposures that have been past due more than 90 days are by definition regarded as non-performing, and reported as impaired or not impaired depending on the deemed loss potential.
The gross and net exposures of loans and receivables are as follows:
31 December 2017
EUR ‘000 Credit institutions The public Total
Neither past due nor impaired 1,795,018 1,394,296 3,189,314
Past due but not impaired - 42,939 42,939
Impaired loans:
past due and impaired - 11,874 11,874
Loans before allowances 1,795,018 1,449,109 3,244,127
Allowances for individually assessed impaired loans
past due and impaired - -3,347 -3,347
Allowances - -3,347 -3,347
Loans, carrying amount 1,795,018 1,445,762 3,240,780
31 December 2016
EUR ‘000 Credit institutions The public Total
Neither past due nor impaired 2,281,829 1,682,937 3,964,766
Past due but not impaired - 23,893 23,893
Impaired loans:
past due and impaired - 18,213 18,213
Loans before allowances 2,281,829 1,725,043 4,006,872
Allowances for individually assessed impaired loans
past due and impaired - -6,311 -6,311
Allowances - -6,311 -6,311
Loans, carrying amount 2,281,829 1,718,732 4,000,561

41Annual Report 2017 – Nordea Bank S.A.
Forbearance is renegotiating terms or restructuring due to a borrower’s financial stress. The intention with granting forbearance for a limited period of time is to ensure full repayment of the outstanding debt. Examples of renegotiated terms are changes in amortisation profile, repayment schedule, customer margin as well as ease of financial covenants. Forbearance is undertaken on a selective and individual basis and followed by impairment testing. Loan loss provisions are recognised, if necessary. Forborne customer balances without impairment charges are fully covered by either collateral and/or the net present value of future cash flows.
Exposures are treated as forborne if a concession has been made, irrespective of whether any amount is past-due or impaired in accordance with the applicable accounting standards or as defaulted in accordance with Article 178 of Regulation (EU) No 575/2013.
If a performing forborne contract under probation (24 months) is extended additional forbearance measures or becomes more than 30 days past-due, it shall be classified as non-performing.
The gross and net exposures of forborne loans and receivables are as follows:
31 Dec 2017 31 Dec 2016
EUR ‘000 The public Total The public Total
Performing 7,355 7,355 4,249 4,249
Non-performing 6,595 6,595 5,016 5,016
Forborne loans before allowances 13,950 13,950 9,265 9,265
Allowances for individually assessedforborne loans
Performing -1,032 -1,032 -100 -100
Non-performing -543 -543 -963 -963
Allowances -1,575 -1,575 -1,063 -1,063
Forborne loans, carrying amount 12,375 12,375 8,202 8,202 Allowances for individually assessed forborne loans has been restated for 2016 by -1.1 mEUR.
Geographical riskAn analysis of geographical concentration of credit risk of loans and receivables, shares and interest bearing securities and derivatives by residence of a counterparty is presented as follows:
31 December 2017 EUR ‘000
Loans and receivables
Shares and interest-bearing
securities Derivatives Total
Luxembourg 97,193 1,995 1,527 100,715
Denmark 168,898 - 525 169,423
Finland 1,525,031 - 76 1,525,107
Great Britain 305,165 - 2,797 307,962
Norway 332,302 - 376 332,678
Sweden 102,760 - 6,816 109,576
Switzerland 186,612 - 591 187,203
Other 522,819 - 4,943 527,762
3,240,780 1,995 17,651 3,260,426
31 December 2016 EUR ‘000
Loans and receivables
Shares and interest-bearing
securities Derivatives Total
Luxembourg 117,302 60,338 188,261 365,901
Denmark 192,568 - 442 193,010
Finland 1,658,204 - 215,211 1,873,415
Great Britain 346,582 - 8,284 354,866
Norway 669,145 - 160 669,305
Sweden 229,294 - 4,778 234,072
Switzerland 186,393 - 827 187,220
Other 601,073 2,645 4,413 608,131
4,000,561 62,983 422,376 4,485,920

Annual Report 2017 – Nordea Bank S.A. 42
Mortgage loansThe Bank grants mortgage loans - primary for residential purposes - to Private Banking clients with residential properties situ-ated mainly in the United Kingdom, France, and Spain.
A mortgage loan program is established for retail clients from Nordea branches in Denmark, Finland, Norway and Sweden.
Mortgage loans by location of purchased property are presented as follows:
EUR ‘000 31 Dec 2017 31 Dec 2016
France 173,243 173,163
Spain 117,828 101,358
United Kingdom 212,802 230,200
Other 25,685 38,434
529,558 543,155
Mortgage loans for 2016 has been restated for an amount of 17.7 mEUR.
Investment loansUnder this scheme, clients may leverage their investments depending on the collateral composition of the portfolio held with the Bank. The assets, including the assets acquired by the loan proceeds, are deposited with the Bank and are pledged as col-lateral for the loan. Given the structure of the product, investment loans do not bear a direct geographical risk.
Industry sector allocation of risksAs at 31 December 2017 and 2016, the breakdown by industry sector of the risks held in the securities (except for trading posi-tions and derivatives held for hedging) and loans and receivables before taking into account collateral held and other credit enhancements can be summarized as follows:
31 December 2017 EUR ‘000
Loans and receivables
Shares and interest-bearing
securities Derivatives Total
Credit institutions 1,795,018 - 7,947 1,802,965
Non-financial corporations 12,379 - 259 12,638
Households 1,212,096 - 4,079 1,216,175
Other 221,287 1,995 5,366 228,648
3,240,780 1,995 17,651 3,260,426
31 December 2016 EUR ‘000
Loans and receivables
Shares and interest-bearing
securities Derivatives Total
Credit institutions 2,281,829 - 221,605 2,503,434
Non-financial corporations 18,163 - 127 18,290
Households 1,278,447 - 8,291 1,286,738
Other 422,122 62,983 192,353 677,458
4,000,561 62,983 422,376 4,485,920
Collateral held and other credit enhancements
31 December 2017 EUR ‘000
Net carrying amount Of which secured by
Of which unsecured
Property Guarantees Other
Loans and receivables to credit institutions 1,795,018 - - - 1,795,018
Loans and receivables to the public
Mortgage loans 529,558 445,575 634 72,745 10,604
Investment loans 333,180 13,614 1,067 314,000 4,499
Other 583,024 - - 583,024 -
1,445,762 459,189 1,701 969,769 15,103
3,240,780 459,189 1,701 969,769 1,810,121
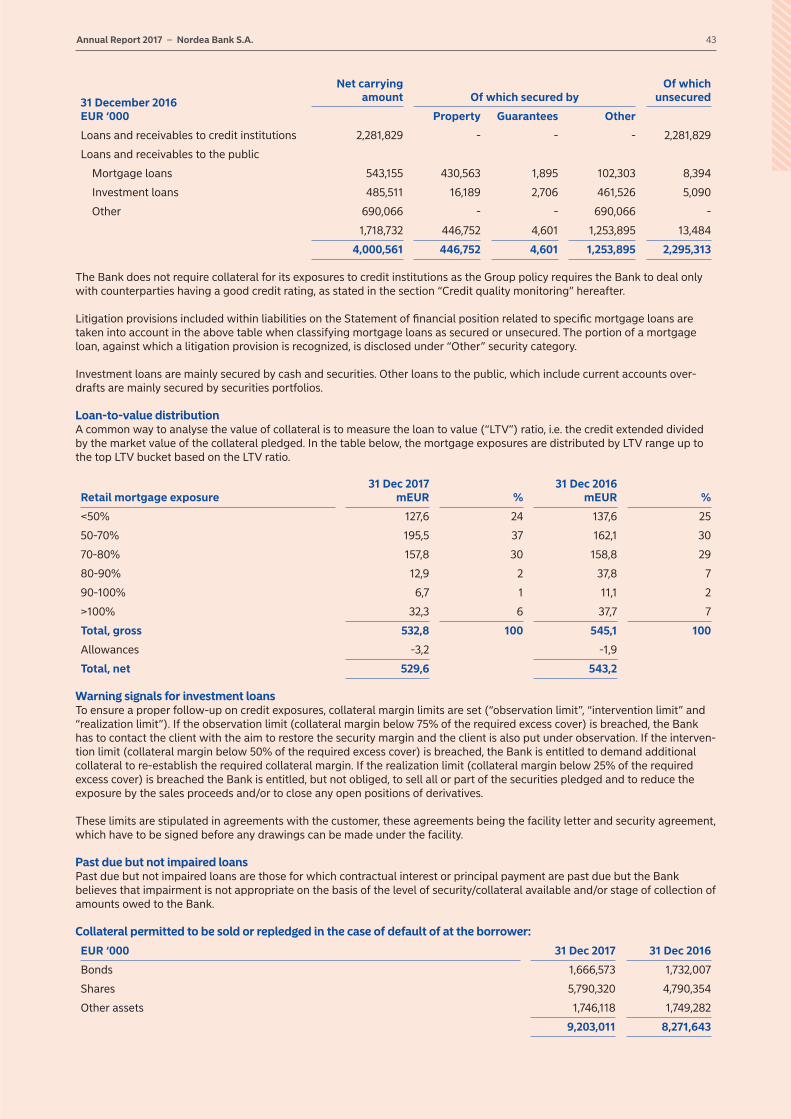
43Annual Report 2017 – Nordea Bank S.A.
31 December 2016 EUR ‘000
Net carrying amount Of which secured by
Of which unsecured
Property Guarantees Other
Loans and receivables to credit institutions 2,281,829 - - - 2,281,829
Loans and receivables to the public
Mortgage loans 543,155 430,563 1,895 102,303 8,394
Investment loans 485,511 16,189 2,706 461,526 5,090
Other 690,066 - - 690,066 -
1,718,732 446,752 4,601 1,253,895 13,484
4,000,561 446,752 4,601 1,253,895 2,295,313 The Bank does not require collateral for its exposures to credit institutions as the Group policy requires the Bank to deal only with counterparties having a good credit rating, as stated in the section “Credit quality monitoring” hereafter.
Litigation provisions included within liabilities on the Statement of financial position related to specific mortgage loans are taken into account in the above table when classifying mortgage loans as secured or unsecured. The portion of a mortgage loan, against which a litigation provision is recognized, is disclosed under “Other” security category.
Investment loans are mainly secured by cash and securities. Other loans to the public, which include current accounts over-drafts are mainly secured by securities portfolios.
Loan-to-value distributionA common way to analyse the value of collateral is to measure the loan to value (“LTV”) ratio, i.e. the credit extended divided by the market value of the collateral pledged. In the table below, the mortgage exposures are distributed by LTV range up to the top LTV bucket based on the LTV ratio.
31 Dec 2017 mEUR
31 Dec 2016 mEURRetail mortgage exposure % %
<50% 127,6 24 137,6 25
50-70% 195,5 37 162,1 30
70-80% 157,8 30 158,8 29
80-90% 12,9 2 37,8 7
90-100% 6,7 1 11,1 2
>100% 32,3 6 37,7 7
Total, gross 532,8 100 545,1 100
Allowances -3,2 -1,9
Total, net 529,6 543,2
Warning signals for investment loansTo ensure a proper follow-up on credit exposures, collateral margin limits are set (“observation limit”, “intervention limit” and “realization limit”). If the observation limit (collateral margin below 75% of the required excess cover) is breached, the Bank has to contact the client with the aim to restore the security margin and the client is also put under observation. If the interven-tion limit (collateral margin below 50% of the required excess cover) is breached, the Bank is entitled to demand additional collateral to re-establish the required collateral margin. If the realization limit (collateral margin below 25% of the required excess cover) is breached the Bank is entitled, but not obliged, to sell all or part of the securities pledged and to reduce the exposure by the sales proceeds and/or to close any open positions of derivatives.
These limits are stipulated in agreements with the customer, these agreements being the facility letter and security agreement, which have to be signed before any drawings can be made under the facility.
Past due but not impaired loans Past due but not impaired loans are those for which contractual interest or principal payment are past due but the Bank believes that impairment is not appropriate on the basis of the level of security/collateral available and/or stage of collection of amounts owed to the Bank.
Collateral permitted to be sold or repledged in the case of default of at the borrower:
EUR ‘000 31 Dec 2017 31 Dec 2016
Bonds 1,666,573 1,732,007
Shares 5,790,320 4,790,354
Other assets 1,746,118 1,749,282
9,203,011 8,271,643
Annual Report 2017 – Nordea Bank S.A. 44
Assets in the amount of tEUR 9,203,011 (2016: tEUR 8,271,643) are held as collateral for facilities granted to customers. These facilities represent investment facilities granted to customers to invest in securities and derivatives. Under the terms of the facility agreement, should the collateral margin fall to or below 50% and 25% of the required excess cover, subject to written notice to the customer of 5 days and 3 days respectively, the Bank is entitled to sell all or part of the pledged assets sufficient to restore the collateral margin to 100%.
During the year the Bank did not force sale on any pledged securities (2016: EUR nil).
Allowances for impairmentThe Bank establishes an allowance for impairment losses on assets carried at amortized cost that represents its estimate of incurred losses in its loan and investment debt security portfolio. The main components of this allowance are a specific loss component that relates to individually significant exposures. Assets carried at fair value through profit and loss are not subject to impairment testing as the measure of fair value reflects the credit quality of each asset.
Write-off policyThe Bank writes off a loan or advances, and any related allowances for impairment losses, when the Bank’s credit committee determines that the loan or advance is uncollectible. This determination is reached after considering information such as the occurrence of significant changes in the borrower’s financial position such that the borrower can no longer pay the obligation, or that proceeds from collateral will not be sufficient to pay back the entire exposure.
Credit quality monitoring
Lending to credit institutions The Bank’s network comprises custody and settlements accounts with custodian and clearing banks as well as cash accounts with bank-correspondents.
Following the Group’s policy, the correspondent network selection procedures are centralised with International Banks divi-sion. This division issues and monitors a list of authorised correspondents for all Group entities. Respective credit limits for each counterparty are also determined in a centralized manner and communicated to the Bank on an annual basis. These credit limits are granted based on the group-wide counterparty’ credit risk analysis.
Generally, the following criteria are applied to the bank-correspondents: • Long-term rating at Moody’s or Standard and Poor’s of A3/A- or better or a short-term rating of P 1/A-1 if a long-term rating
is not available; • One of the largest within its jurisdiction measured by capital and should be of significant importance for the local economy; • One of the largest within its field of services and should have a client base including a significant proportion of large foreign
institutions.
In addition, the correspondent should have a good reputation in the market regarding operational reliability and prudent bank-ing practice.
Moreover, EMIR has introduced a legal obligation to exchange collateral – both initial and variation margins – for OTC deriva-tives transactions with financial counterparties. The Bank has in place a timely, accurate collateral process to exchange Varia-tion Margin with the Nordea Group for FX swaps and currency options. For this purpose, legal agreement, business procedures were updated and a web based application for margin communication was introduced in GOS. Variation margin exchange for physically settled FX forwards becomes mandatory with the entry into force of MiFID II. For trades with Nordea Group, the internal Variation Margin calculation was amended to also include FX forwards traded as of 02 January 2018.
Lending to the public In order to ensure proper follow-up of credit exposures to the public the Bank closely monitors their security margin. Security margin is a ratio built on the weighted average value of collateral and customer’s credit exposure. For fully secured commit-ments the security margin should be maintained at 100% or above. If the security margin falls below 100% the Bank has proce-dures in place aiming to restore the security margin above 100%. In critical cases, the Bank has the right (but not the obliga-tion) to realise collateral or to reduce respective exposure and therefore the to limit the risk of loss to the Bank.
c) Liquidity riskThe liquidity risk relates to losses the Bank may suffer from the possible weakness to fulfil its obligations mainly with regard to the repayment of deposits and the granting of advances. To deal with the liquidity risk, the Bank is closely monitoring the ori-gin of deposits and their expiry date and complies with the liquidity regulations of the Central Bank of Luxembourg.
The Bank is making use of the Group liquidity risk application (Treasury Risk Calculator) in order to measure and control the Bank’s overall liquidity/funding gap for each day. The report is reviewed on a daily basis by Risk & Capital department to ensure that the limit is respected. The liquidity gap is also reported business-daily to Nordea Group Treasury which aggregates liquidity risk information for Nordea Group.
Funding gap limit: mEUR 600 (2016: mEUR 1,200) for the timeframe of up to 30 days
Funding gap utilisation: mEUR 180 (2016: mEUR 326)
The Bank’s liquidity is monitored and controlled by use of the above mentioned report application and also include a monitor-ing the report on individual currency mismatch positions.

45Annual Report 2017 – Nordea Bank S.A.
The contractual undiscounted cash outflows of the Bank’s non-derivative financial liabilities are presented in the table below:
31 December 2017 EUR ‘000
Up to 1 month
1 to 3 months
3 to 12 months
1 to 5 years
More than 5 years Total
Deposits from credit institutions 140,731 - 125,189 128,397 - 394,317
Deposits and borrowings from the public 2,954,213 268,290 12,264 - - 3,234,767
Subordinated liabilities - - - - 51,294 51,294
Other liabilities 35,377 - 20,029 - - 55,406
Total 3,130,321 268,290 157,482 128,397 51,294 3,735,784
31 December 2016 EUR ‘000
Up to 1 month
1 to 3 months
3 to 12 months
1 to 5 years
More than 5 years Total
Deposits from credit institutions 220,790 47,849 213,872 142,388 - 624,899
Deposits and borrowings from the public 3,650,199 138,338 57,164 - - 3,845,701
Subordinated liabilities - - - - 51,323 51,323
Other liabilities 33,548 - 7,327 - - 40,875
Total 3,904,537 186,187 278,363 142,388 51,323 4,562,798
The contractual undiscounted cash outflows of the Bank’s derivative financial assets and liabilities are presented in the table below:
31 December 2017 EUR ‘000
Up to 1 month
1 to 3 months
3 to 12 months
1 to 5 years
More than 5 years Total
Derivatives 981,426 537,461 159,024 - - 1,677,911
31 December 2016 EUR ‘000
Up to 1 month
1 to 3 months
3 to 12 months
1 to 5 years
More than 5 years Total
Derivatives 14,435,314 27,609,244 457,790 510 - 42,502,858
The contractual undiscounted cash flows of the Bank’s derivative financial assets and liabilities result from the currency-relat-ed derivative contracts.
d) Operational riskOperational risk is the risk of direct or indirect loss arising from a wide variety of causes associated with the Bank’s processes, personnel, technology and infrastructure, and from external factors other than credit, market and liquidity risks such as those arising from legal and regulatory requirements and generally accepted standards of corporate behaviour. Operational risk aris-es from each of the Bank’s operations.
The Bank’s objective is to manage operational risk so as to balance the avoidance of financial losses and damage to the Bank’s reputation with overall cost effectiveness and to avoid control procedures that restrict initiative and creativity.
The primary responsibility for the development and implementation of controls to address operational risk is assigned to sen-ior management. This responsibility is supported by the development of overall Bank’s policies for the management of opera-tional risk in the following areas:• Requirements for appropriate segregation of duties, including the independent authorisation of transactions;• Requirements for the reconciliation and monitoring of transactions;• Compliance with regulatory and other legal requirements;• Documentation of controls and procedures;• Requirements for the periodic assessment of operational risks faced, and the adequacy of controls and procedures to
address the risks identified;• Requirements for the reporting of operational losses and proposed remedial action;• Development of business continuity and crisis management plans;• Training and professional development;• Ethical and business standards;• Risk mitigation, including insurance where this is effective.
Compliance with the Bank’s policies is supported by a program of periodic reviews undertaken by Internal Audit. The results of Internal Audit reviews are discussed with the management of the business unit to which they relate.
Litigation riskLitigation risk is the risk of financial loss, interruption of the Bank’s operations or any other under sizable situation that arises from the possibility of non-execution or violation of legal contracts and consequentially of lawsuits. The risk is restricted through the contracts used by the Bank to execute its operations.

Annual Report 2017 – Nordea Bank S.A. 46
Reputation riskThe risk of loss of reputation arising from the negative publicity relating to the Bank’s operations (whether true or false) may affect the client basis and result in a reduction in revenue and legal cases against the Bank.
Other risksThe general economic environment prevailing internationally may affect the Bank’s operations to a certain extent. Concepts such as inflation, unemployment, and development of the gross domestic product are directly linked to the economic course of every country and any variation in these and the economic environment in general may create chain reactions in all areas hence affecting the Bank.
34 Return on assets
The return on assets of the Bank for the year ended 31 December 2017 stands to 1.71% (2016: 1.92%).
The return on assets is calculated as being the net profit divided by the total assets.
35 Deposit guarantee schemes
The Law of 18 December 2015 on the resolution, reorganisation and winding-up measures of credit institutions and certain investment firms and on deposit guarantee and investor compensation schemes transposed the Bank Recovery and Resolution Directive (Directive 2014/59/UE) and the Deposit Guarantee Schemes Directive (Directive 2014/49/UE). The Deposit Guarantee and Investors Compensation Schemes currently set up by l'Association pour la Garantie des Dépôts Luxembourg (AGDL) has been replaced by an ex-ante contribution scheme.
The aggregate eligible deposits of each depositor will be covered up to EUR 100,000 (Luxembourg Deposit Guarantee Schemes) and the aggregate eligible investment transactions of each investor will be covered up to the amount of EUR 20,000 (Luxembourg Investors Compensation Schemes). Deposits resulting from private real estate transactions that serve social pur-poses or linked to the payment of insurance benefits or compensation for criminal injuries or wrongful conviction will be cov-ered over EUR 100,000 for 12 months at the maximum.
The funded amount of the Fonds de Résolution Luxembourg (“FRL”) shall reach by the end of 2024 at least 1% of covered deposits, as defined in article 1 number 36 of the Law, of all authorized credit institutions in all participating Member States.
This amount will be collected from the credit institutions through annual contributions during the years 2015 to 2024.
The target level of funding of the Fonds de garantie des dêpôts Luxembourg (“FGDL”) is set at 0.8% of covered deposits, as defined in article 163 number 8 of the Law, of the relevant credit institutions and is to be reached by the end of 2018 through annual contributions. The contributions are to be made in the form of annual payments during the years 2016 to 2018. When the level of 0.8% is reached, the Luxembourgish credit institutions are to continue to contribute for 8 additional years in order to constitute an additional safety buffer of 0.8% of covered deposits as defined in article 163 number 8 of the Law.
During the year 2017 the Bank received reimbursement of AGDL of tEUR nil and contributed tEUR 1.183 and tEUR 408 to FRL and FGDL respectively (Note 9).
36 Discontinued operations
In May 2017 the Bank transferred the operations of the Fund Administration & Transfer Agency to Nordea Investment Funds S.A. as contribution in kind (see note 15). The post-tax profit and cash flows from this activity are as follows.
The profit from discontinued operations is comprised of :
EUR ‘000 2017 1) 2016
Net interest income 1,450 410
Fee and commission income 34,333 92,740
Fee and commission expense -2 -704
Net gains/losses on items at fair value and other foreign exchange revaluation results
Other operating income 3 -160
974 2,921
Total gross banking income 36,758 95,207
Staff cost -1,270 -3,690
Other administrative expenses -2,398 -5,877
Total operating expenses -3,668 -9,567
Operating profit 33,090 85,640
Income tax expense -8,961 -25,024
Profit after tax 24,129 60,6161) 2017 figures are for the period 01.01.2017 – 30.04.2017.

47Annual Report 2017 – Nordea Bank S.A.
Cash flow from discontinued operations:
Operating cash flows 49,568 56,941
Total cash flows 49,568 56,941
37 Subsequent events
On 25 January 2018 it was announced the Bank entered into an agreement to sell a significant part of the Private Banking portfolio to UBS Europe SE. The Asset Purchase Agreement (APA) foresees the transfer of the major part of clients, assets and approx. 150 employees to UBS.
The individual assets and liabilities will be derecognized in NBSA and a net proceed from the transaction will be recognized in the Profit or Loss and Other Comprehensive Income at the date of completion.
The transaction and its completion, currently planned for the second half of 2018, remain subject to applicable regulatory approvals and certain conditions.
The shareholder of the Bank will support and secure the entire restructuring process of the Bank to be carried out in a proper, professional and orderly manner. There are neither current plans nor intentions to repatriate the capital until the restructuring of the Bank is completed. We consider appropriate for the accounts ended 31 December 2017 to be prepared on a going con-cern basis.
Assets and liabilities in scope to be included in the Asset Purchase Agreement are as follows 1):
EUR ‘000 31 Dec 2017
Assets
Loans and receivables to the public 1,341,967
Derivatives 11,353
Prepaid expenses and accrued income 1,324
1,354,644
Liabilities
Deposits and borrowings from the public 2,560,064
Derivatives 4,605
Accrued expenses and prepaid income 124
Provisions 2,731
2,567,524
Assets managed on behalf of third parties (off balance): Assets under Management, administration, custody and wealth 10,195,695
1) The amounts are not yet final as being subject to due diligence and other approval procedures.
Apart from the above, there are no other significant subsequent events.

Annual Report 2017 – Nordea Bank S.A. 48
LuxembourgNordea Bank S.A.562, rue de NeudorfP.O. Box 562L-2015 LuxembourgTel +352 43 88 77 77Fax +352 43 88 76 [email protected]
SwitzerlandNordea Bank S.A. Luxemburg,Zweigniederlassung ZurichMainaustrasse 21-23PostfachCH-8034 ZurichTel +41 44 421 42 42Fax +41 44 421 42 [email protected]
SingaporeNordea Bank S.A. Singapore Branch138 Market Street #09-03 CapitaGreen Singapore 048946Tel +65 6597 1070Fax +65 6597 [email protected]
www.nordeaprivatebanking.com