Embed Size (px)
Citation preview

Interim Report January–June 2015
Nordea Bank Finland Plc
Nordea's vision is to be a Great European bank, acknowledged for its people, creating superior value for customers and shareholders. We are making it possible for our customers to reach their goals by providing a wide range of products, services and solutions within banking, asset management and insurance. Nordea has around 11 million customers, approximately 650 branch office locations and is among the ten largest universal banks in Europe in terms of total market capitalisation. The Nordea share is listed on the NASDAQ OMX Nordic Exchange in Stockholm, Helsinki and Copenhagen.
www.nordea.com

Nordea Bank Finland – Interim Report, January - June 2015 2
Nordea Bank Finland Group
Result summary January-June 2015 The first half of 2015 showed an increase of 14% in total income to EUR 1,389m (1,219). Total expenses decreased 11% and amounted to EUR 480m (538). Net loan losses increased slightly to EUR 55m (49). (The comparison figures in brackets refer to the first six months of 2014.) NBF’s operating profit increased 35% compared to the same period last year and amounted to EUR 854m (632). Return on equity was 13.5 % (10.8) and the cost/income ratio 35% (44). Net profit increased 30% to EUR 656m (506).
Macroeconomic trend
The global economy continued to grow at a moderate pace in the first half of the year. After a weak start of the year, the US economy gained momentum in the second quarter. The overall positive picture induced the Federal Reserve to cautiously signal that policy rate hikes could be announced later this year. The Euro-area economy started to show positive signs of momentum as activity pick up after several years of lacklustre development. Core inflation increased from the low levels witnessed in the beginning of the year while lending growth to banks and households showed the strongest increase since the beginning of 2012. Developments in the negotiations between the Greek government and Greece’s creditors have been a predominant market driver for risk appetite in the financial markets during the first half of 2015.
Market performance in Finland in January–June 2015 The Finnish economy contracted 0.1% in Q1 compared to the previous quarter, a second decline in a row. Shockingly, the economy has grown in only two quarters over the past three years. Based on what we know about Q2, no major improvement has taken place in the big picture. The economic weakness continues to be stubborn and broad-based. In the absence of growth the outlook for H2 remains challenging for investment, employment, household sector purchasing power and consumption. Unemployment has risen somewhat higher than expected. Depressed demand is reflected as one of the lowest economic sentiments within EU countries. On the positive side, new mortgages are now trending up and
sales volumes in the housing market have increased moderately especially in the capital area, while prices have still declined slightly. The economic sentiment should, however, improve towards the end of 2015. The global upswing is spreading wider and wider, and should gradually strengthen international demand and eventually boost Finnish exports. Legal structure of the Nordea Group As part of the simplification of the processes Nordea has initiated preparatory work and dialogue with the authorities in the Nordic countries regarding the legal structure. The purpose is to continue to simplify the legal structure by changing the Norwegian, Danish and Finnish subsidiary banks to branches. By simplifying and changing into a branch structure we will strengthen governance, decrease administrative complexity and become more efficient. It will not lead to changes in our presence in each country nor to changes for our employees or the way we service our customers, but will support our work to increase our agility and scale benefits. Discussions with the authorities have been initiated and the process is expected to take approximately two years. The changes in legal structure depend on approval and a satisfactory outcome of the discussions with the authorities in each country. A decision about a future legal structure is subject to approval by Nordea´s shareholders at a general meeting. Changes in NBF’s group structure Nordea Bank Finland Plc sold on 1 January 2015 its operations in London and Frankfurt branches to the parent company Nordea Bank AB (publ). Operations in the Baltic branches and some Baltic subsidiaries were sold on 1 April 2014 to Nordea Bank AB (publ) as well. The transferred operations have continued as before in Nordea. The impact of the transaction on NBF is not material. However, the income statement impact including both the sale of London and Frankfurt branches and the sale of the Baltic operations is presented in a separate Note 12 for comparison purposes. The balance sheet impact of the sale was EUR -0.7bn as of year-end 2014.
Throughout this report, ”Nordea Bank Finland” and ”NBF” refer to the parent company Nordea Bank Finland Plc, business identity code 1680235-8, with its subsidiaries. The registered office of the company is in Helsinki. Nordea Bank Finland Plc is a wholly-owned subsidiary of Nordea Bank AB (publ), the listed parent company of the whole Nordea Group. The business operations of the Nordea Group have been organised in three business areas, with full responsibility for their value chains: Retail Banking, Wholesale Banking and Wealth Management. The consolidated interim report of Nordea Bank AB (publ) embraces all the activities of the Nordea Group and provides the most complete and fair view. This statutory interim report covers the operations of the legal entity Nordea Bank Finland Plc with its subsidiaries.
Nordea Bank Finland – Interim Report, January - June 2015 3
Comments on the income statement
Income
Net interest income decreased 11% compared to the first half last year and amounted to EUR 527m (595). The decrease is mainly due to the above mentioned sale of foreign operations to Nordea Bank AB (publ). Lending volumes increased 5% year-on-year. Excluding reverse repurchase agreements, lending decreased 2%. Deposits and borrowings from the public increased 6% year-on-year. Excluding repurchase agreements, total deposits were up 7 %. Lending margins increased compared to the first half of 2014 whereas deposit margins are still under pressure. Net fee and commission income was EUR 27m (40). Commission income was somewhat lower than in the first half of 2014 due to the sale of foreign operations and amounted to EUR 382m (400). Savings-related commissions developed positively. Commission expenses decreased to EUR 355m as no bank tax was paid in 2015. Higher transaction fees partly offset the positive impact from the bank tax. Net result from items at fair value increased 41% to EUR 786m (556), due to higher activity in the customer business and favourable market making conditions. Profit from companies accounted for under the equity method was to EUR 2m (1). Other operating income was EUR 47m (27). EUR 35m related to the sale of foreign operations to Nordea Bank AB (publ).
Expenses
Total operating expenses decreased to EUR 480m (538). Staff costs decreased 11% to EUR 264 (296), explained mainly by the redundancy reservations in the first half of 2014 as well as the sale of foreign operations. The number of employees has decreased by around 160 from the first half of 2014 and by around 40 compared to the year-end 2014. Other operating expenses were lower than in the corresponding period last year and totalled EUR 202m (221). Main part of the decrease relates to the sold operations but also marketing and real estate expenses were lower. Depreciation of tangible and intangible assets amounted to EUR 14m (21). The cost/income ratio was 35% (44) in the first half of 2015.
Loan losses
Net loan losses increased somewhat to EUR 55m (49) corresponding to a loan loss ratio of 10 basis points (9). The impact of the guarantee between NBF and Nordea Bank AB (publ) was EUR 3m negative (EUR 27m positive). Taxes
The effective tax rate for the first half of 2015 was approximately 23% (20). Net profit Net profit increased 30% to EUR 656m (506), corresponding to a return on equity of 13.5 % compared to 10.8% in the first half of last year. Comments on the balance sheet (Comparison figures in brackets refer to December 2014 figures.) The total assets of NBF amounted to EUR 356bn (346). Total loans to the public increased 2% compared to the end of 2014. Excluding repurchase agreements, lending decreased 4%. Excluding repurchase agreements and the sale of London and Frankfurt operations, lending increased 2%. Asset values of derivatives decreased 18% to 86bn (105) as an outcome of a rise in the long-term interest rates in the latter part of the second quarter. The corresponding change was seen in the derivatives liabilities. Deposits and borrowings from the public increased from the year-end level and amounted to EUR 82bn (77). Excluding repurchase agreements, deposits decreased 2% to EUR 52bn. Excluding repurchase agreements and the transfer of London and Frankfurt operations, deposits increased 7%. Capital position and capital management At the end of June, NBF’s risk exposure amount (REA) was EUR 61.1bn, compared to EUR 61.3bn at year-end 2014 and EUR 57.8bn one year ago. The Tier 1 ratio including profit and including Basel I transitional rules was 16.6% and the total capital ratio 16.8%. Excluding profit and including Basel I transitional rules the Tier 1 ratio was 15.4% and total capital ratio 15.6%. On 30 June the Board of the Financial Supervisory Authority (FIN-FSA) decided not to impose a countercyclical capital buffer requirement, nor to otherwise tighten macro prudential policy that affects credit cycles.
Nordea Bank Finland – Interim Report, January - June 2015 4
The Board of the Financial Supervisory Authority (FIN-FSA) designated Nordea Bank Finland Plc as a systemically important credit institution (so called O-SII) on 6 July 2015. The Board on FIN-FSA imposed to NBF an additional capital requirement of 2%, which has to be covered by Common Equity Tier 1 capital (CET1 capital). The new requirement must be fulfilled as of 7 January 2016. NBF already complies with the increased capital requirement. Credit portfolio Total lending was EUR 116bn (114) at the end of June 2015. The share of lending to corporate customers was 67% (67). Impaired loans gross decreased and amounted to EUR 1,060m at the end of June 2015 compared to EUR 1,480m at the end of December 2014. Individually assessed impaired loans, net, amounted to EUR 559m (964), representing 0.34% of total loans before allowances. At year-end 2014 the ratio was 0.64 %. Off-balance sheet commitments The total amount of off-balance sheet commitments was EUR 27.3bn compared to EUR 31.7bn at year-end 2014.
Risks and uncertainties Nordea’s revenue base reflects the Group’s business with a large and diversified customer base, comprising household customers, corporate customers and financial institutions, representing different geographic areas and industries. Nordea’s main risk exposure is credit risk. The Group also assumes risks such as market risk, liquidity risk, operational risk and life insurance risk. For further information on risk composition, see the Annual Report. The financial crisis and the deteriorated macroeconomic situation have not had any material impact on Nordea’s financial position. However, the macroeconomic development remains uncertain. None of the above exposures and risks is expected to have any significant adverse effect on the Group or its financial position in the medium term. Within the framework of the normal business operations, the Group faces claims in civil lawsuits and other disputes, most of which involve relatively limited amounts. None of these disputes are considered likely to have any significant adverse effect on the Group or its financial position in the next six months.
Helsinki, 16 July 2015 Board of Directors

Nordea Bank Finland – Interim Report, January - June 2015 5
Key financial figures Income statement Jan-Jun Jan-Jun Change Full year
EURm 2015 2014 % 2014
Net interest income 527 595 -11 1,189
Net fee and commission income 27 40 -33 75
Net result from items at fair value 786 556 41 970
Equity method 2 1 3
Other operating income 47 27 74 41
Total operating income 1,389 1,219 14 2,278 Staff costs -264 -296 -11 -559
Other expenses -202 -221 -9 -433
Depreciation of tangible and intangible assets -14 -21 -33 -92
Total operating expenses -480 -538 -11 -1,084 Profit before loan losses 909 681 33 1,194 Net loan losses -55 -49 12 -60
Operating profit 854 632 35 1,134 Income tax expense -198 -126 57 -232
Net profit for the period 656 506 30 902
Net profit for the period from transferred operations - 12 57
Business volumes, key items 1
30 Jun 30 Jun Change 31 Dec Change
EURm 2015 2014 % 2014 %
Loans to the public 116,430 110,951 5 113,748 2
Loans to the public, excl. repos 66,339 67,789 -2 68,971 -4
Deposits and borrowings from the public 81,868 76,936 6 76,879 6
Equity 9,882 9,215 7 9,618 3
Total assets 355,622 317,523 12 346,198 3 1 End of period
Nordea Bank Finland – Interim Report, January - June 2015 6
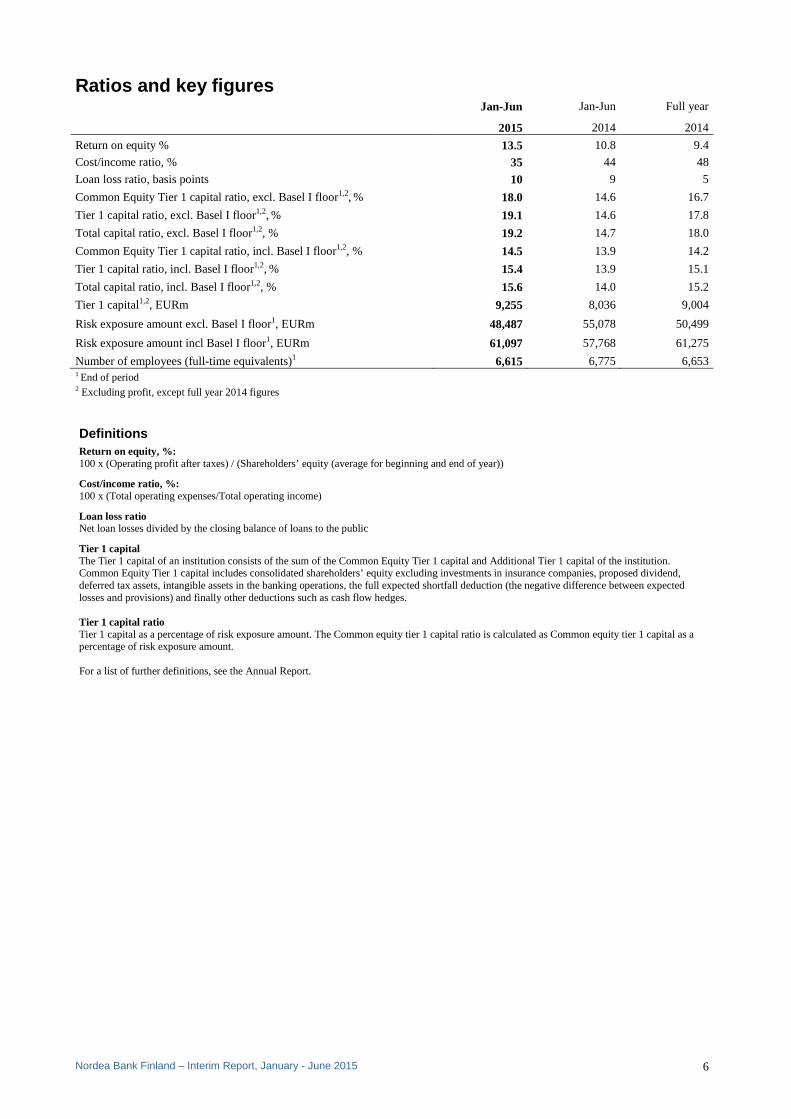
Ratios and key figures Jan-Jun Jan-Jun Full year
2015 2014 2014
Return on equity % 13.5 10.8 9.4
Cost/income ratio, % 35 44 48
Loan loss ratio, basis points 10 9 5
Common Equity Tier 1 capital ratio, excl. Basel I floor1,2, % 18.0 14.6 16.7
Tier 1 capital ratio, excl. Basel I floor1,2, % 19.1 14.6 17.8
Total capital ratio, excl. Basel I floor1,2, % 19.2 14.7 18.0
Common Equity Tier 1 capital ratio, incl. Basel I floor1,2, % 14.5 13.9 14.2
Tier 1 capital ratio, incl. Basel I floor1,2, % 15.4 13.9 15.1
Total capital ratio, incl. Basel I floor1,2, % 15.6 14.0 15.2
Tier 1 capital1,2, EURm 9,255 8,036 9,004
Risk exposure amount excl. Basel I floor1, EURm 48,487 55,078 50,499
Risk exposure amount incl Basel I floor1, EURm 61,097 57,768 61,275
Number of employees (full-time equivalents)1 6,615 6,775 6,653 1 End of period 2 Excluding profit, except full year 2014 figures Definitions Return on equity, %: 100 x (Operating profit after taxes) / (Shareholders’ equity (average for beginning and end of year))
Cost/income ratio, %: 100 x (Total operating expenses/Total operating income)
Loan loss ratio Net loan losses divided by the closing balance of loans to the public
Tier 1 capital The Tier 1 capital of an institution consists of the sum of the Common Equity Tier 1 capital and Additional Tier 1 capital of the institution. Common Equity Tier 1 capital includes consolidated shareholders’ equity excluding investments in insurance companies, proposed dividend, deferred tax assets, intangible assets in the banking operations, the full expected shortfall deduction (the negative difference between expected losses and provisions) and finally other deductions such as cash flow hedges. Tier 1 capital ratio Tier 1 capital as a percentage of risk exposure amount. The Common equity tier 1 capital ratio is calculated as Common equity tier 1 capital as a percentage of risk exposure amount. For a list of further definitions, see the Annual Report.

Nordea Bank Finland – Interim Report, January - June 2015 7
Income statement Jan-Jun Jan-Jun Full year EURm Note 2015 2014 2014
Operating income Interest income 781 923 1,806
Interest expense -254 -328 -617
Net interest income 527 595 1,189 Fee and commission income 382 400 794
Fee and commission expense -355 -360 -719
Net fee and commission income 3 27 40 75 Net result from items at fair value 4 786 556 970
Profit from companies accounted for under the equity method 2 1 3
Other operating income 47 27 41
Total operating income 1,389 1,219 2,278 Operating expenses General administrative expenses: Staff costs -264 -296 -559 Other expenses -202 -221 -433
Depreciation, amortisation and impairment charges of tangible and intangible assets -14 -21 -92
Total operating expenses -480 -538 -1,084 Profit before loan losses 909 681 1,194 Net loan losses 6 -55 -49 -60
Operating profit 854 632 1,134 Income tax expense -198 -126 -232
Net profit for the period 656 506 902
Attributable to:
Shareholders of Nordea Bank Finland Plc 656 506 902
Non-controlling interests - - -
Total 656 506 902
Nordea Bank Finland – Interim Report, January - June 2015 8
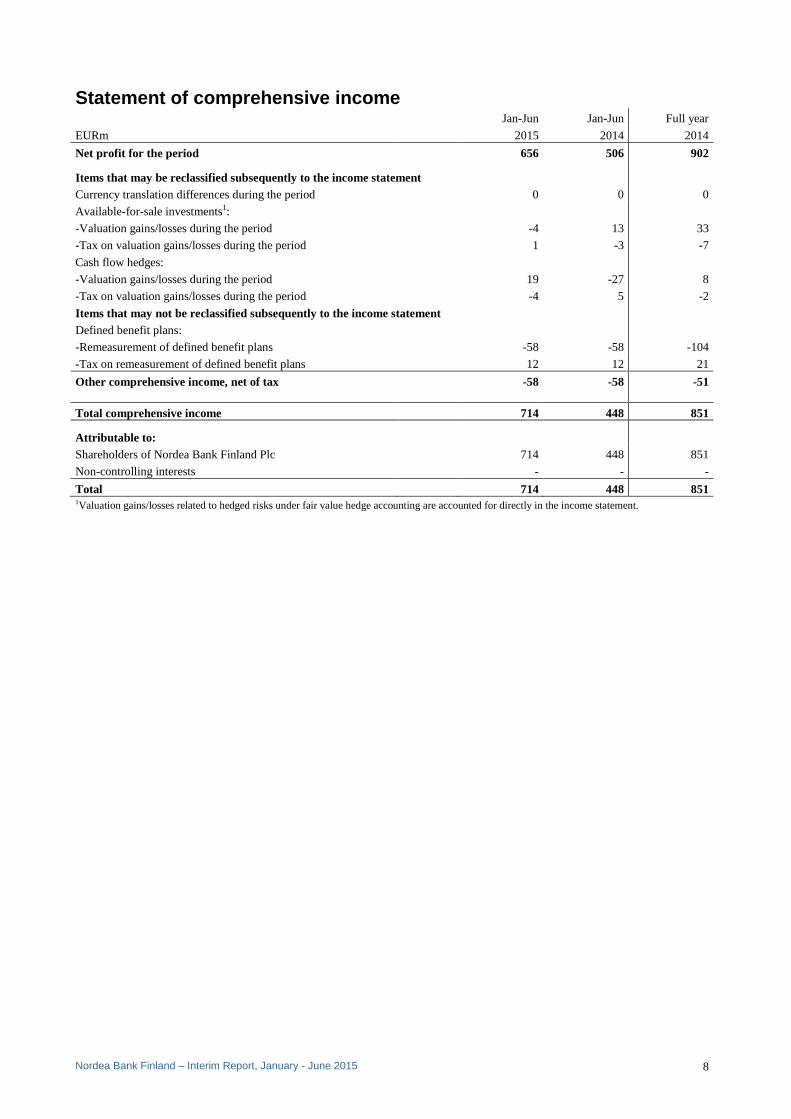
Statement of comprehensive income Jan-Jun Jan-Jun Full year
EURm 2015 2014 2014
Net profit for the period 656 506 902 Items that may be reclassified subsequently to the income statement
Currency translation differences during the period 0 0 0
Available-for-sale investments1:
-Valuation gains/losses during the period -4 13 33
-Tax on valuation gains/losses during the period 1 -3 -7
Cash flow hedges: -Valuation gains/losses during the period 19 -27 8
-Tax on valuation gains/losses during the period -4 5 -2
Items that may not be reclassified subsequently to the income statement
Defined benefit plans:
-Remeasurement of defined benefit plans -58 -58 -104
-Tax on remeasurement of defined benefit plans 12 12 21
Other comprehensive income, net of tax -58 -58 -51
Total comprehensive income 714 448 851 Attributable to:
Shareholders of Nordea Bank Finland Plc 714 448 851
Non-controlling interests - - -
Total 714 448 851 1Valuation gains/losses related to hedged risks under fair value hedge accounting are accounted for directly in the income statement.

Nordea Bank Finland – Interim Report, January - June 2015 9
Balance sheet
30 Jun 31 Dec 30 Jun
EURm Note 2015 2014 2014
Assets
Cash and balances with central banks 39,511 28,846 23,038
Loans to central banks 7 4,300 300 1,663
Loans to credit institutions 7 44,956 35,051 44,117
Loans to the public 7 116,430 113,748 110,951
Interest-bearing securities 34,300 34,643 36,817
Financial instruments pledged as collateral 9,372 11,058 9,532
Shares 2,088 1,918 895
Derivatives 85,894 105,254 78,467 Fair value changes of the hedged items in portfolio hedge of interest rate risk 58 76 77
Investments in associated undertakings 39 39 37
Intangible assets 47 47 95
Properties and equipment 76 84 91
Investment property 1 2 2
Deferred tax assets 11 43 35
Current tax assets 1 0 0
Retirement benefit assets 86 25 133
Other assets 18,015 14,624 10,996
Prepaid expenses and accrued income 437 440 577
Total assets 355,622 346,198 317,523 Liabilities
Deposits by credit institutions 113,979 87,368 87,323
Deposits and borrowings from the public 81,868 76,879 76,936
Debt securities in issue 37,256 48,472 44,782
Derivatives 88,120 102,876 73,287 Fair value changes of the hedged items in portfolio hedge of interest rate risk 490 773 672
Current tax liabilities 64 41 10
Other liabilities 22,549 18,577 23,771
Accrued expenses and prepaid income 631 804 850
Deferred tax liabilities 58 57 53
Provisions 74 85 101
Retirement benefit obligations 27 28 76
Subordinated liabilities 624 620 447
Total liabilities 345,740 336,580 308,308 Equity
Non-controlling interests - - 1
Share capital 2,319 2,319 2,319
Share premium reserve 599 599 599
Other reserves 2,882 2,824 2,817
Retained earnings 4,082 3,876 3,479
Total equity 9,882 9,618 9,215
Total liabilities and equity 355,622 346,198 317,523 Assets pledged as security for own liabilities 42,134 43,426 36,368
Other assets pledged 5,772 5,017 6,721
Contingent liabilities 13,176 14,906 14,470
Credit commitments1 13,679 16,021 16,269
Other commitments 437 769 395 1 Including unutilised portion of approved overdraft facilities of EUR 7,370m (31 Dec 2014: EUR 7,760m, 30 Jun 2014: EUR 11,012m)..

Nordea Bank Finland – Interim Report, January - June 2015 10
Statement of changes in equity Attributable to shareholders of Nordea Bank Finland Plc
Other reserves:
EURm Share
capital1
Share premium
reserve
Cash flow
hedges
Available-for-sale invest-
ments Other
reserves
Defined benefit
plans Retained earnings Total
Non- control-
ling interests
Total equity
Balance at 1 Jan 2015 2,319 599 -2 43 2,848 -65 3,876 9,618 - 9,618 Net profit for the period 656 656 656 Other comprehensive income, net of tax 15 -3 - 46 0 58 58 Total comprehensive income 15 -3 - 46 656 714 - 714
Share-based payments 0 0 0
Dividend for 2014 -450 -450 -450
Balance at 30 Jun 2015 2,319 599 13 40 2,848 -19 4,082 9,882 - 9,882
Attributable to shareholders of Nordea Bank Finland Plc
Other reserves:
EURm Share
capital1
Share premium
reserve
Cash flow
hedges
Available-for-sale invest-
ments Other
reserves
Defined benefit
plans Retained earnings Total
Non- control-
ling interests
Total equity
Balance at 1 Jan 2014 2,319 599 -8 17 2,848 18 3,720 9,513 1 9,514 Net profit for the period 902 902 902 Other comprehensive income, net of tax 6 26 - -83 0 -51 -51 Total comprehensive income 6 26 - -83
902 851 - 851
Share-based payments 2 2 2
Dividend for 2013 -750 -750 -750
Other changes 0 2 2 -1 1
Balance at 31 Dec 2014 2,319 599 -2 43 2,848 -65 3,876 9,618 0 9,618 1 Total shares registered were 1,030.8 million (31 Dec 2014: 1,030.8 million, 30 Jun 2014: 1,030.8 million).
Nordea Bank Finland – Interim Report, January - June 2015 11
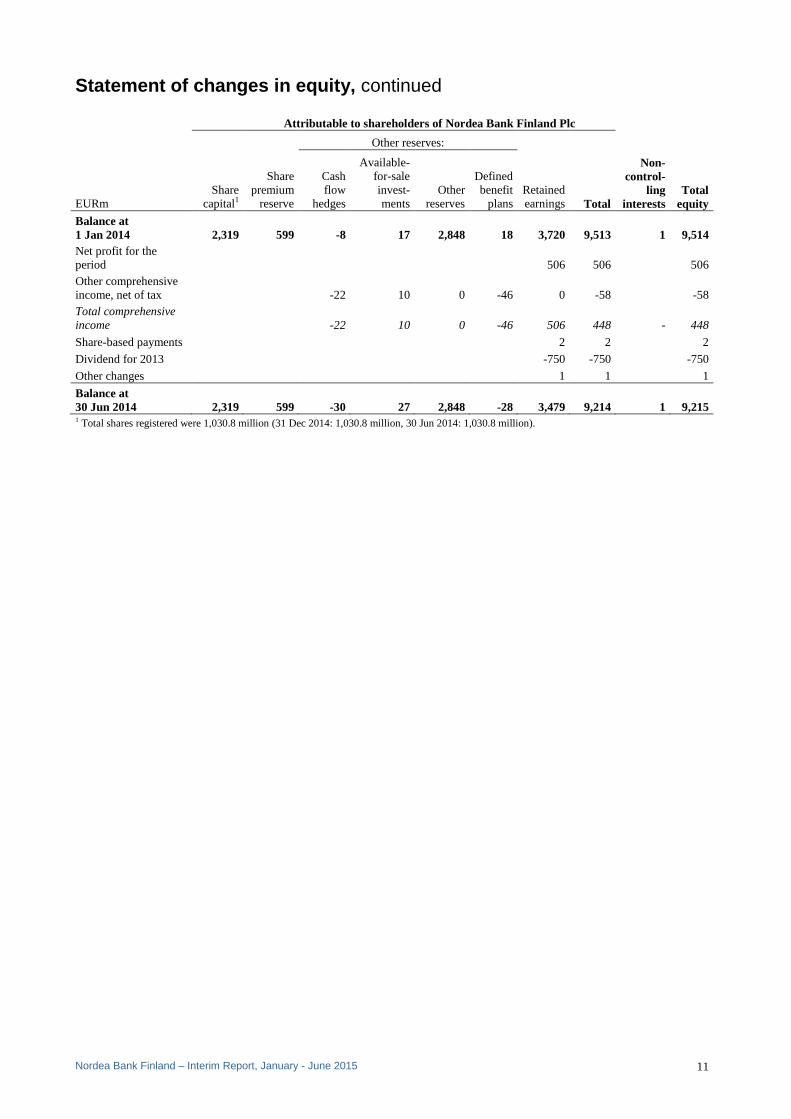
Statement of changes in equity, continued
Attributable to shareholders of Nordea Bank Finland Plc
Other reserves:
EURm Share
capital1
Share premium
reserve
Cash flow
hedges
Available-for-sale invest-
ments Other
reserves
Defined benefit
plans Retained earnings Total
Non- control-
ling interests
Total equity
Balance at 1 Jan 2014 2,319 599 -8 17 2,848 18 3,720 9,513 1 9,514 Net profit for the period 506 506 506 Other comprehensive income, net of tax -22 10 0 -46 0 -58 -58 Total comprehensive income -22 10 0 -46 506 448 - 448
Share-based payments 2 2 2
Dividend for 2013 -750 -750 -750
Other changes 1 1 1
Balance at 30 Jun 2014 2,319 599 -30 27 2,848 -28 3,479 9,214 1 9,215 1 Total shares registered were 1,030.8 million (31 Dec 2014: 1,030.8 million, 30 Jun 2014: 1,030.8 million).

Nordea Bank Finland – Interim Report, January - June 2015 12
Cash flow statement, condensed – Total operations Jan-Jun Jan-Jun Full year
EURm 2015 2014 2014
Operating activities
Operating profit 854 619 1,073
Operating profit for the period from transferred operations - 13 61
Adjustments for items not included in cash flow 1,270 722 891
Income taxes paid -158 -137 -218
Cash flow from operating activities before changes in operating assets and liabilities 1,966 1,217 1,807
Changes in operating assets and liabilities 12,308 -12,074 -13,327
Cash flow from operating activities 14,274 -10,857 -11,520
Investing activities
Sale/acquisition of business operations 0 33 31
Properties and equipment -13 -40 -47
Intangible assets -6 -7 -20
Net investments in debt securities, held to maturity 0 1,620 2,183
Other financial fixed assets 1 -3 2
Cash flow from investing activities -18 1,603 2,149
Financing activities
Issued/amortised subordinated liabilities 4 18 191
Dividend paid -450 -750 -750
Other changes 140 -35 -34
Cash flow from financing activities -306 -767 -593 Cash flow for the period 13,950 -10,021 -9,964 Cash and cash equivalents at beginning of the period 29,714 36,324 36,324 Translation difference -1,910 -312 -3,354
Cash and cash equivalents at end of the period 45,574 26,615 29,714
Change 13,950 -10,021 -9,964
Cash and cash equivalents 30 Jun 30 Jun 31 Dec
The following items are included in cash and cash equivalents (EURm): 2015 2014 2014
Cash and balances with central banks 39,511 23,039 28,846
Loans to credit institutions 6,063 3,576 868
Total cash and cash equivalents 45,574 26,615 29,714
Cash comprises legal tender and bank notes in foreign currencies. Balances with central banks consist of deposits in accounts with central banks and postal giro systems under government authority, where the following conditions are fulfilled: - the central bank or the postal giro system is domiciled in the country where the institution is established - the balance on the account is readily available at any time. Loans to credit institutions, payable on demand include liquid assets not represented by bonds or other interest-bearing securities.

Nordea Bank Finland – Interim Report, January - June 2015 13
Notes to the financial statements
Note 1 Accounting policies NBF’s consolidated financial statements are prepared in accordance with International Financial Reporting Standards (IFRS) and interpretations of such standards by the International Financial Reporting Standards Interpretations Committee (IFRS IC), as endorsed by the EU Commission. In addition, certain rules in the Finnish Accounting Act, the Finnish Credit Institutions Act, the Financial Supervisory Authority’s regulations and guidelines and the Decree of the Ministry of Finance on the financial statements and consolidated financial statements of credit institutions, have also been applied. These statements are presented in accordance with IAS 34 “Interim Financial Reporting”. The interim report is unaudited. Changed accounting policies and presentation The accounting policies, basis for calculations and presentation are, in all material aspects, unchanged in comparison with the 2014 Annual Report. The following amendments published by the IASB were implemented on 1 January 2015 but have not had any significant impact on Nordea’s financial statements:
• Amendments to IAS 19 “Defined benefit plans: Employee Contributions”
• Annual Improvements to IFRSs, 2010–2012 Cycle
• Annual Improvements to IFRSs, 2011–2013 Cycle
• IFRIC 21 “Levies” IFRIC 21 “Levies” The new interpretation IFRIC 21 “Levies”, published by IASB was implemented on 1 January 2015. IFRIC 21 is an interpretation of IAS 37 “Provisions, Contingent Liabilities and Contingent Assets”. IFRIC 21 clarifies that if a levy is triggered by operating as a bank at the end of the reporting period, the liability for the levy is not recognised prior that date.
Impact on capital adequacy from new or amended IFRS standards IFRS 9 “Financial instruments” IFRS 9 “Financial Instruments” covering classification and measurement, impairment and general hedging has been adopted by the IASB but has not yet been implemented by Nordea. The changes in classification and measurement are not expected to have a significant impact on Nordea’s income statement or balance sheet as the mixed measurement model will be maintained. Significant reclassifications between fair value and amortised cost or impact on the capital adequacy or large exposures are not expected, but this is naturally dependent on the financial instruments on Nordea’s balance sheet at transition. The impairment requirements in IFRS 9 are based on an expected loss model as opposed to the current incurred loss model in IAS 39. At transition, it is expected that the new requirements will have a negative impact on loan loss provisions, equity and capital adequacy, while we do not expect any significant impact over time. Nordea has not yet finalised any impact assessment. The main change to the general hedging requirements is that the standard aligns hedge accounting more closely with the risk management activities. As Nordea generally uses macro (portfolio) hedge accounting Nordea’s assessment is that the new requirements will not have any significant impact on Nordea’s financial statements, capital adequacy or large exposures in the period of initial application. IFRS 15 “Revenue form Contracts with Customers” The IASB has also adopted IFRS 15 “Revenue from Contracts with Customers”. The new standard has not yet been implemented by Nordea. It is not expected that the standard will have any significant impact on Nordea’s financial statements, capital adequacy or large exposures in the period of initial application. Other amendments to IFRS Other amendments to IFRS are not assessed to have any significant impact on Nordea’s financial statement, capital adequacy or large exposures in the period of initial application.
Nordea Bank Finland – Interim Report, January - June 2015 14
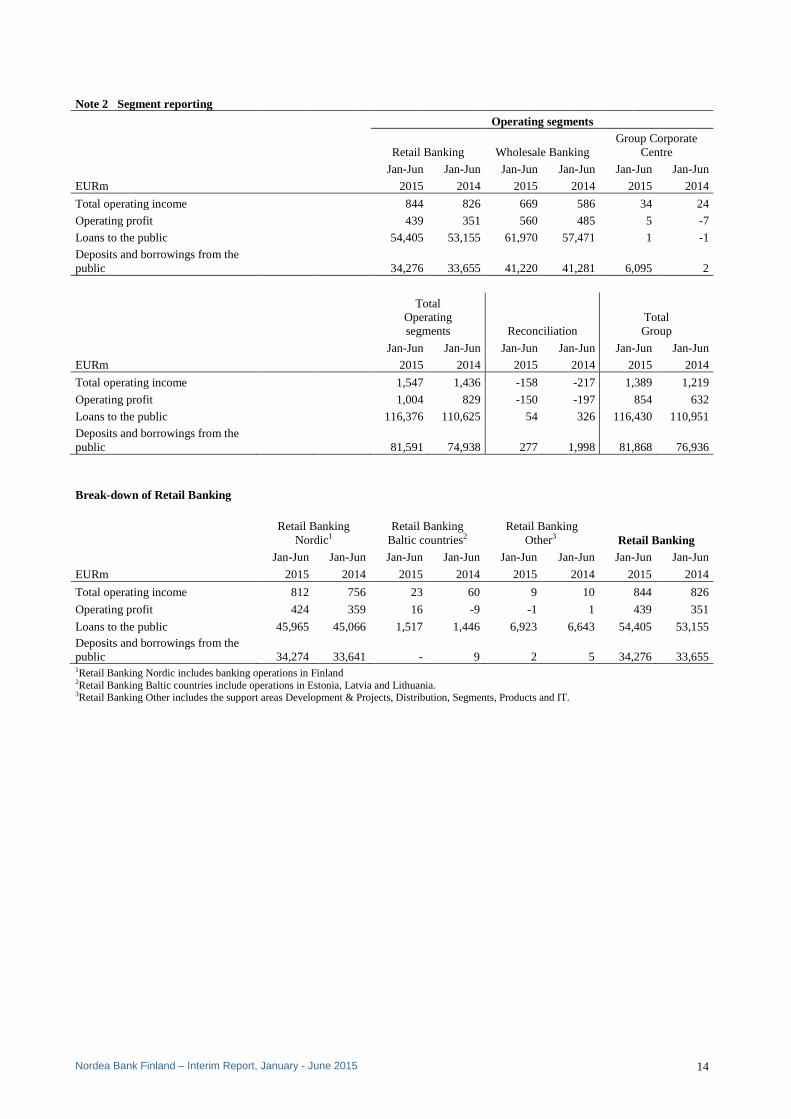
Note 2 Segment reporting Operating segments
Retail Banking Wholesale Banking Group Corporate
Centre Jan-Jun Jan-Jun Jan-Jun Jan-Jun Jan-Jun Jan-Jun
EURm 2015 2014 2015 2014 2015 2014
Total operating income 844 826 669 586 34 24
Operating profit 439 351 560 485 5 -7
Loans to the public 54,405 53,155 61,970 57,471 1 -1
Deposits and borrowings from the public 34,276 33,655 41,220 41,281 6,095 2
Total Operating segments Reconciliation
Total Group
Jan-Jun Jan-Jun Jan-Jun Jan-Jun Jan-Jun Jan-Jun
EURm 2015 2014 2015 2014 2015 2014
Total operating income 1,547 1,436 -158 -217 1,389 1,219
Operating profit 1,004 829 -150 -197 854 632
Loans to the public 116,376 110,625 54 326 116,430 110,951
Deposits and borrowings from the public 81,591 74,938 277 1,998 81,868 76,936
Break-down of Retail Banking
Retail Banking Nordic1
Retail Banking Baltic countries2
Retail Banking Other3 Retail Banking
Jan-Jun Jan-Jun Jan-Jun Jan-Jun Jan-Jun Jan-Jun Jan-Jun Jan-Jun
EURm 2015 2014 2015 2014 2015 2014 2015 2014
Total operating income 812 756 23 60 9 10 844 826
Operating profit 424 359 16 -9 -1 1 439 351
Loans to the public 45,965 45,066 1,517 1,446 6,923 6,643 54,405 53,155 Deposits and borrowings from the public 34,274 33,641 - 9 2 5 34,276 33,655 1Retail Banking Nordic includes banking operations in Finland 2Retail Banking Baltic countries include operations in Estonia, Latvia and Lithuania. 3Retail Banking Other includes the support areas Development & Projects, Distribution, Segments, Products and IT.
Nordea Bank Finland – Interim Report, January - June 2015 15
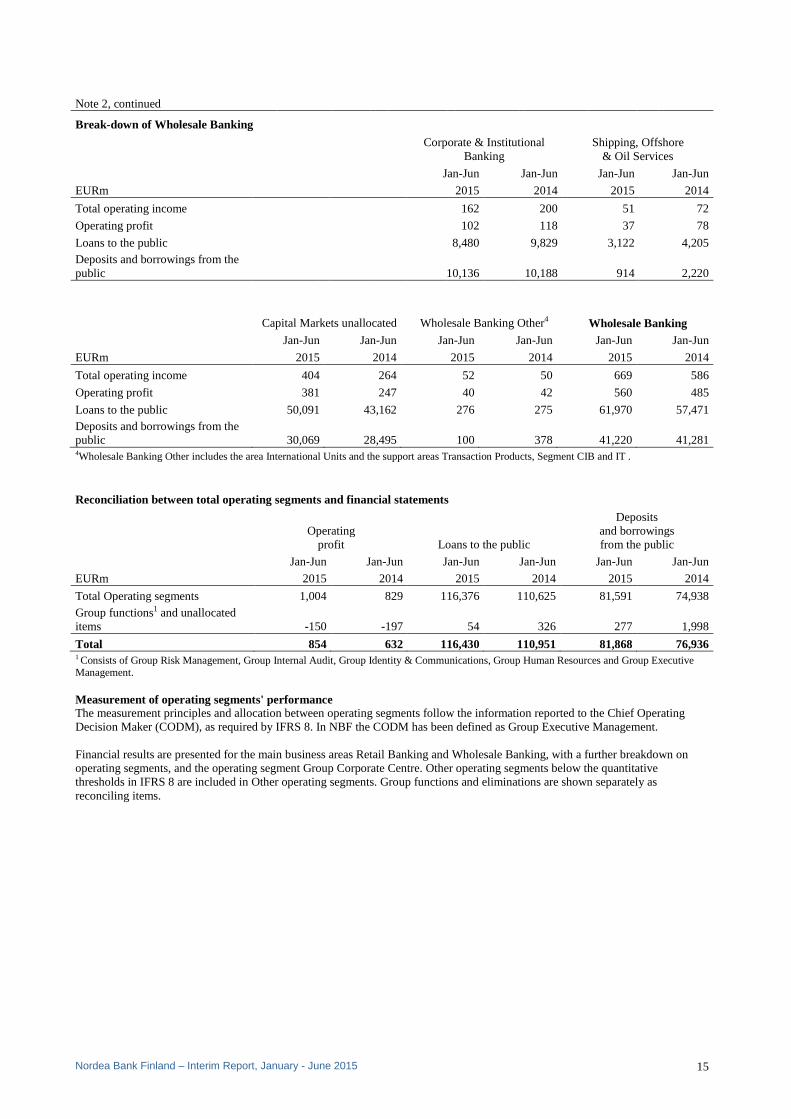
Note 2, continued
Break-down of Wholesale Banking
Corporate & Institutional Banking
Shipping, Offshore & Oil Services
Jan-Jun Jan-Jun Jan-Jun Jan-Jun
EURm 2015 2014 2015 2014
Total operating income 162 200 51 72
Operating profit 102 118 37 78
Loans to the public 8,480 9,829 3,122 4,205 Deposits and borrowings from the public 10,136 10,188 914 2,220
Capital Markets unallocated Wholesale Banking Other4 Wholesale Banking Jan-Jun Jan-Jun Jan-Jun Jan-Jun Jan-Jun Jan-Jun
EURm 2015 2014 2015 2014 2015 2014
Total operating income 404 264 52 50 669 586
Operating profit 381 247 40 42 560 485
Loans to the public 50,091 43,162 276 275 61,970 57,471 Deposits and borrowings from the public 30,069 28,495 100 378 41,220 41,281 4Wholesale Banking Other includes the area International Units and the support areas Transaction Products, Segment CIB and IT .
Reconciliation between total operating segments and financial statements
Operating
profit Loans to the public
Deposits and borrowings from the public
Jan-Jun Jan-Jun Jan-Jun Jan-Jun Jan-Jun Jan-Jun
EURm 2015 2014 2015 2014 2015 2014
Total Operating segments 1,004 829 116,376 110,625 81,591 74,938 Group functions1 and unallocated items -150 -197 54 326 277 1,998
Total 854 632 116,430 110,951 81,868 76,936 1 Consists of Group Risk Management, Group Internal Audit, Group Identity & Communications, Group Human Resources and Group Executive Management. Measurement of operating segments' performance The measurement principles and allocation between operating segments follow the information reported to the Chief Operating Decision Maker (CODM), as required by IFRS 8. In NBF the CODM has been defined as Group Executive Management. Financial results are presented for the main business areas Retail Banking and Wholesale Banking, with a further breakdown on operating segments, and the operating segment Group Corporate Centre. Other operating segments below the quantitative thresholds in IFRS 8 are included in Other operating segments. Group functions and eliminations are shown separately as reconciling items.

Nordea Bank Finland – Interim Report, January - June 2015 16
Note 3 Net fee and commission income Jan-Jun Jan-Jun Full year
EURm 2015 2014 2014
Asset management commissions 44 33 69
Life insurance 6 4 9
Brokerage, securities issues and corporate finance 41 34 75
Custody and issuer services 13 19 28
Deposits 1 2 5
Total savings and investments 105 92 186
Payments 98 101 198
Cards 64 63 128
Total payments and cards 162 164 326
Lending 45 66 129
Guarantees and documentary payments 53 61 120
Total lending related commissions 98 127 249
Other commission income 17 17 33
Fee and commission income 382 400 794
Savings and investments -208 -184 -360
Payments -4 -5 -11
Cards -29 -29 -58
Other commission expenses1 -114 -142 -290
Fee and commission expenses -355 -360 -719 Net fee and commission income 27 40 75 1 Mainly consists of the guarantee commission fee paid to Nordea Bank AB (publ) Note 4 Net result from items at fair value Jan-Jun Jan-Jun Full year
EURm 2015 2014 2014
Equity related instruments 70 -116 342
Interest related instruments and foreign exchange gains/losses 672 565 235
Other financial instruments (including credit and commodities) 45 118 406
Investment properties -1 -11 -13
Total 786 556 970

Nordea Bank Finland – Interim Report, January - June 2015 17
Note 5 Other expenses
Jan-Jun Jan-Jun Full year
EURm 2015 2014 2014
Information technology -91 -92 -196
Marketing and representation -8 -11 -22
Postage, transportation, telephone and office expenses -17 -20 -38
Rents, premises and real estate expenses -37 -48 -89
Other -49 -50 -88
Total -202 -221 -433 Note 6 Net loan losses Jan-Jun Jan-Jun Full year
EURm 2015 2014 2014
Loan losses divided by class
Realised loan losses - - -2
Allowances to cover realised loan losses - - 2
Recoveries on previous realised loan losses 0 - 0
Provisions - 0 0
Reversal of previous provisions - - 22
Loans to credit institutions 0 0 22
Realised loan losses -70 -73 -114
Allowances to cover realised loan losses 52 80 127
Recoveries on previous realised loan losses 7 13 28
Provisions -69 -120 -223
Reversal of previous provisions 27 59 101
Loans to the public -53 -41 -81
Realised loan losses - - -
Allowances to cover realised loan losses - - -
Recoveries on previous realised loan losses - - -
Provisions -2 -9 -14
Reversal of previous provisions 0 1 13
Off-balance sheet items -2 -8 -1
Total -55 -49 -60
Key ratios
Jan-Jun Jan-Jun Full year
2015 2014 2014
Loan loss ratio, basis points1 10 9 5
- of which individual 11 9 4
- of which collective -1 -1 2 1 Net loan losses (annualised) divided by closing balance of loans to the public (lending).

Nordea Bank Finland – Interim Report, January - June 2015 18
Note 7 Loans and impairment Total 30 Jun 31 Dec 30 Jun EURm 2015 2014 2014
Loans, not impaired 165,235 148,254 155,952
Impaired loans 1,060 1,480 1,427
- of which performing 436 823 783
- of which non-performing 624 657 644
Loans before allowances 166,295 149,734 157,379 Allowances for individually assessed impaired loans -501 -516 -551
- of which performing -253 -323 -342
- of which non-performing -248 -193 -209
Allowances for collectively assessed impaired loans -108 -119 -97
Allowances -609 -635 -648
Loans, carrying amount 165,686 149,099 156,731 Central banks and credit institutions The public
30 Jun 31 Dec 30 Jun 30 Jun 31 Dec 30 Jun
EURm 2015 2014 2014 2015 2014 2014
Loans, not impaired 49,256 35,351 45,781 115,979 112,903 110,171
Impaired loans 0 0 24 1,060 1,480 1,403
- of which performing - - - 436 823 783
- of which non-performing 0 0 24 624 657 620
Loans before allowances 49,256 35,351 45,805 117,039 114,383 111,574 Allowances for individually assessed impaired loans - - -25 -501 -516 -526
- of which performing - - - -253 -323 -342
- of which non-performing - - -25 -248 -193 -184
Allowances for collectively assessed impaired loans 0 0 - -108 -119 -97
Allowances 0 0 -25 -609 -635 -623
Loans, carrying amount 49,256 35,351 45,780 116,430 113,748 110,951
Allowances and provisions 30 Jun 31 Dec 30 Jun EURm 2015 2014 2014 Allowances for items on the balance sheet -609 -635 -648 Provisions for off balance sheet items -32 -31 -38
Total allowances and provisions -641 -666 -686
Key ratios 30 Jun 31 Dec 30 Jun 2015 2014 2014
Impairment rate, gross1, basis points 64 99 91
Impairment rate, net2, basis points 34 64 56
Total allowance rate3, basis points 37 42 41
Allowances in relation to impaired loans4, % 47 35 39
Total allowances in relation to impaired loans5, % 57 43 45
Non-performing, not impaired6, EURm 131 28 22 1 Individually assessed impaired loans before allowances divided by total loans before allowances. 2 Individually assessed impaired loans after allowances divided by total loans before allowances. 3 Total allowances divided by total loans before allowances. 4 Allowances for individually assessed impaired loans divided by individually assessed impaired loans before allowances. 5 Total allowances divided by total impaired loans before allowances. 6 Past due loans, not impaired due to future cash flows (included in Loans, not impaired).

Nordea Bank Finland – Interim Report, January - June 2015 19
Note 8 Classification of financial instruments
EURm
Loans and
receivables Held to
maturity Held for trading
Designated at fair value
through profit or
loss
Derivatives used for hedging
Available for sale Total
Financial assets
Cash and balances with central banks 39,511 39,511
Loans to central banks 4,300 4,300
Loans to credit institutions 38,593 6,363 44,956
Loans to the public 66,339 50,091 116,430
Interest-bearing securities 67 25,273 8,960 34,300
Financial instruments pledged as collateral 9,372 9,372
Shares 2,080 8 2,088
Derivatives 85,072 822 85,894
Fair value changes of the hedged items in portfolio hedge of interest rate risk 58 58
Other assets 4,707 13,016 17,723
Prepaid expenses and accrued income 91 91
Total 30 Jun 2015 149,299 67 182,551 13,024 822 8,960 354,723
Total 31 Dec 2014 128,934 66 190,598 12,984 942 11,805 345,329
Total 30 Jun 2014 132,446 562 165,358 7,027 839 10,292 316,524
EURm Held for trading
Designated at fair value
through profit or
loss
Derivatives used for hedging
Other financial liabilities Total
Financial liabilities
Deposits by credit institutions 33,799 80,180 113,979
Deposits and borrowings from the public 30,069 51,799 81,868
Debt securities in issue 7,778 29,478 37,256
Derivatives 87,823 297 88,120
Fair value changes of the hedged items in portfolio hedge of interest rate risk 490 490
Other liabilities 7,977 8,534 5,840 22,351
Accrued expenses and prepaid income 181 181
Subordinated liabilities 624 624
Total 30 Jun 2015 167,446 8,534 297 168,592 344,869 Total 31 Dec 2014 167,819 10,061 312 157,357 335,549
Total 30 Jun 2014 145,305 6,984 353 154,781 307,423
Nordea Bank Finland – Interim Report, January - June 2015 20
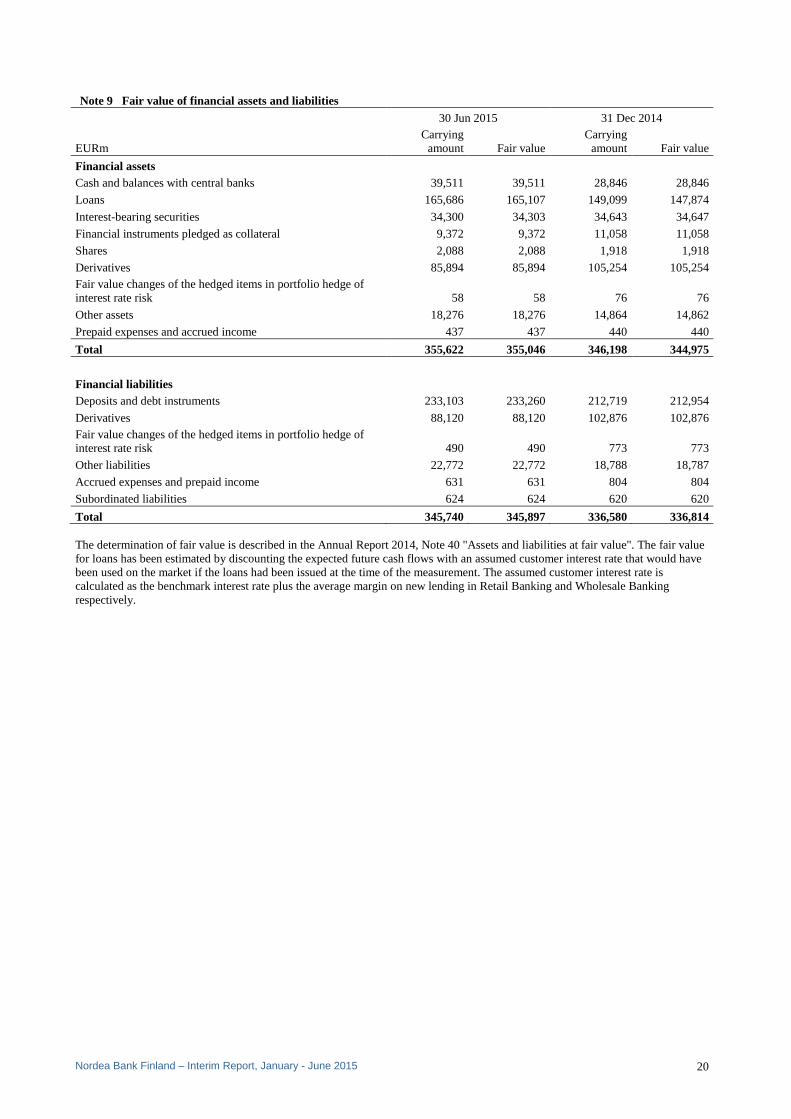
Note 9 Fair value of financial assets and liabilities
30 Jun 2015 31 Dec 2014
EURm Carrying
amount Fair value Carrying
amount Fair value
Financial assets
Cash and balances with central banks 39,511 39,511 28,846 28,846
Loans 165,686 165,107 149,099 147,874
Interest-bearing securities 34,300 34,303 34,643 34,647
Financial instruments pledged as collateral 9,372 9,372 11,058 11,058
Shares 2,088 2,088 1,918 1,918
Derivatives 85,894 85,894 105,254 105,254 Fair value changes of the hedged items in portfolio hedge of interest rate risk 58 58 76 76
Other assets 18,276 18,276 14,864 14,862
Prepaid expenses and accrued income 437 437 440 440
Total 355,622 355,046 346,198 344,975
Financial liabilities
Deposits and debt instruments 233,103 233,260 212,719 212,954
Derivatives 88,120 88,120 102,876 102,876 Fair value changes of the hedged items in portfolio hedge of interest rate risk 490 490 773 773
Other liabilities 22,772 22,772 18,788 18,787
Accrued expenses and prepaid income 631 631 804 804
Subordinated liabilities 624 624 620 620
Total 345,740 345,897 336,580 336,814
The determination of fair value is described in the Annual Report 2014, Note 40 "Assets and liabilities at fair value". The fair value for loans has been estimated by discounting the expected future cash flows with an assumed customer interest rate that would have been used on the market if the loans had been issued at the time of the measurement. The assumed customer interest rate is calculated as the benchmark interest rate plus the average margin on new lending in Retail Banking and Wholesale Banking respectively.
Nordea Bank Finland – Interim Report, January - June 2015 21
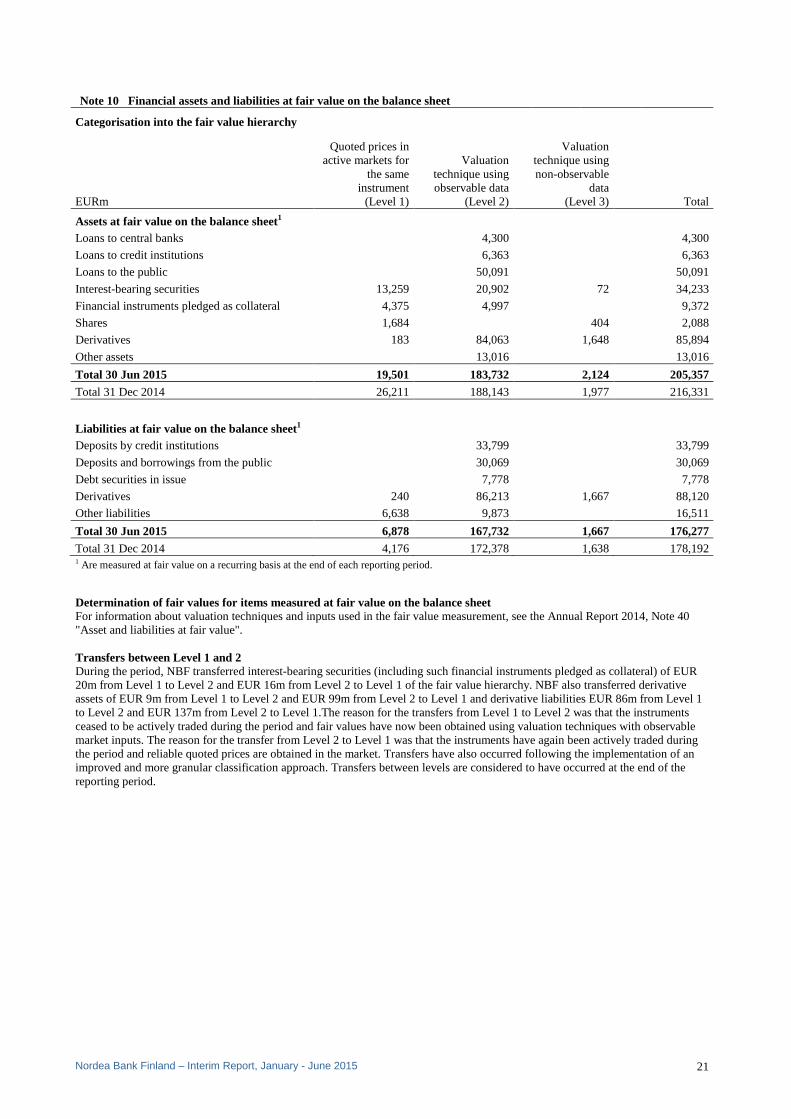
Note 10 Financial assets and liabilities at fair value on the balance sheet Categorisation into the fair value hierarchy
EURm
Quoted prices in active markets for
the same instrument
(Level 1)
Valuation technique using observable data
(Level 2)
Valuation technique using non-observable
data (Level 3) Total
Assets at fair value on the balance sheet1 Loans to central banks 4,300 4,300
Loans to credit institutions 6,363 6,363
Loans to the public 50,091 50,091
Interest-bearing securities 13,259 20,902 72 34,233
Financial instruments pledged as collateral 4,375 4,997 9,372
Shares 1,684 404 2,088
Derivatives 183 84,063 1,648 85,894
Other assets 13,016 13,016
Total 30 Jun 2015 19,501 183,732 2,124 205,357 Total 31 Dec 2014 26,211 188,143 1,977 216,331
Liabilities at fair value on the balance sheet1 Deposits by credit institutions 33,799 33,799
Deposits and borrowings from the public 30,069 30,069
Debt securities in issue 7,778 7,778
Derivatives 240 86,213 1,667 88,120
Other liabilities 6,638 9,873 16,511
Total 30 Jun 2015 6,878 167,732 1,667 176,277 Total 31 Dec 2014 4,176 172,378 1,638 178,192 1 Are measured at fair value on a recurring basis at the end of each reporting period. Determination of fair values for items measured at fair value on the balance sheet For information about valuation techniques and inputs used in the fair value measurement, see the Annual Report 2014, Note 40 "Asset and liabilities at fair value". Transfers between Level 1 and 2 During the period, NBF transferred interest-bearing securities (including such financial instruments pledged as collateral) of EUR 20m from Level 1 to Level 2 and EUR 16m from Level 2 to Level 1 of the fair value hierarchy. NBF also transferred derivative assets of EUR 9m from Level 1 to Level 2 and EUR 99m from Level 2 to Level 1 and derivative liabilities EUR 86m from Level 1 to Level 2 and EUR 137m from Level 2 to Level 1.The reason for the transfers from Level 1 to Level 2 was that the instruments ceased to be actively traded during the period and fair values have now been obtained using valuation techniques with observable market inputs. The reason for the transfer from Level 2 to Level 1 was that the instruments have again been actively traded during the period and reliable quoted prices are obtained in the market. Transfers have also occurred following the implementation of an improved and more granular classification approach. Transfers between levels are considered to have occurred at the end of the reporting period.
Nordea Bank Finland – Interim Report, January - June 2015 22
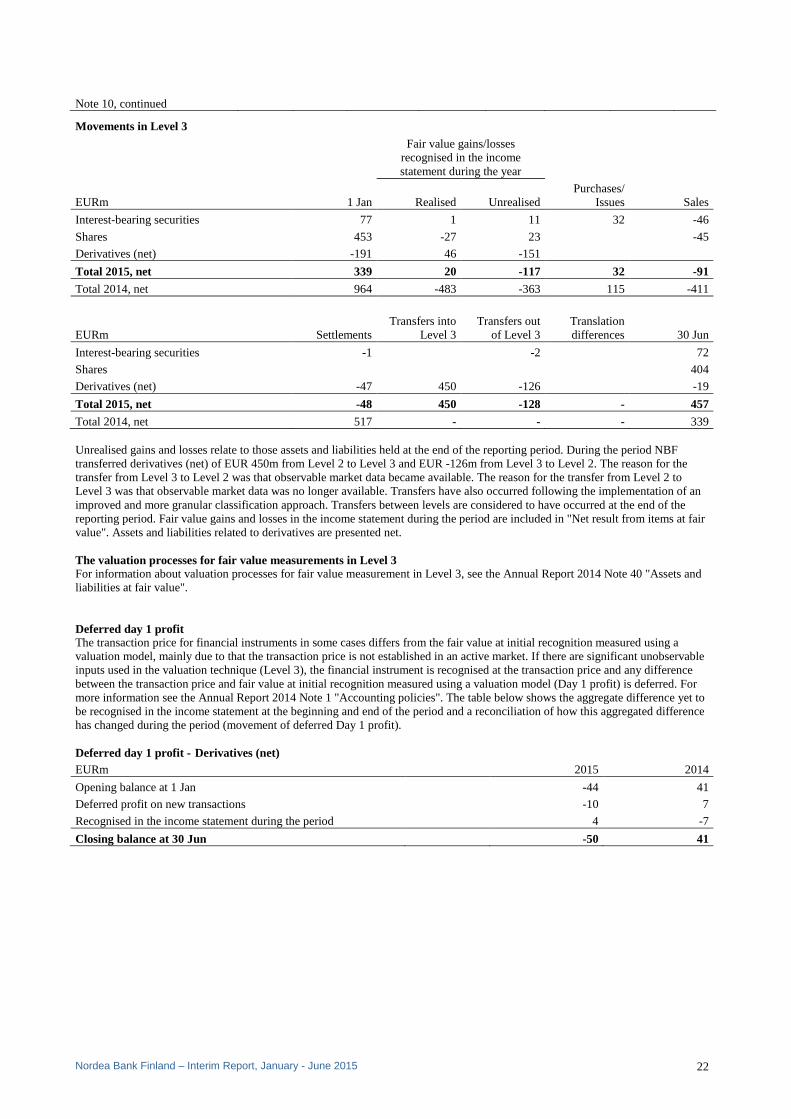
Note 10, continued
Movements in Level 3
Fair value gains/losses recognised in the income statement during the year
EURm 1 Jan Realised Unrealised Purchases/
Issues Sales
Interest-bearing securities 77 1 11 32 -46
Shares 453 -27 23 -45
Derivatives (net) -191 46 -151
Total 2015, net 339 20 -117 32 -91
Total 2014, net 964 -483 -363 115 -411
EURm Settlements Transfers into
Level 3 Transfers out
of Level 3 Translation differences 30 Jun
Interest-bearing securities -1 -2 72
Shares 404
Derivatives (net) -47 450 -126 -19
Total 2015, net -48 450 -128 - 457
Total 2014, net 517 - - - 339 Unrealised gains and losses relate to those assets and liabilities held at the end of the reporting period. During the period NBF transferred derivatives (net) of EUR 450m from Level 2 to Level 3 and EUR -126m from Level 3 to Level 2. The reason for the transfer from Level 3 to Level 2 was that observable market data became available. The reason for the transfer from Level 2 to Level 3 was that observable market data was no longer available. Transfers have also occurred following the implementation of an improved and more granular classification approach. Transfers between levels are considered to have occurred at the end of the reporting period. Fair value gains and losses in the income statement during the period are included in "Net result from items at fair value". Assets and liabilities related to derivatives are presented net. The valuation processes for fair value measurements in Level 3 For information about valuation processes for fair value measurement in Level 3, see the Annual Report 2014 Note 40 "Assets and liabilities at fair value". Deferred day 1 profit The transaction price for financial instruments in some cases differs from the fair value at initial recognition measured using a valuation model, mainly due to that the transaction price is not established in an active market. If there are significant unobservable inputs used in the valuation technique (Level 3), the financial instrument is recognised at the transaction price and any difference between the transaction price and fair value at initial recognition measured using a valuation model (Day 1 profit) is deferred. For more information see the Annual Report 2014 Note 1 "Accounting policies". The table below shows the aggregate difference yet to be recognised in the income statement at the beginning and end of the period and a reconciliation of how this aggregated difference has changed during the period (movement of deferred Day 1 profit). Deferred day 1 profit - Derivatives (net) EURm 2015 2014
Opening balance at 1 Jan -44 41
Deferred profit on new transactions -10 7
Recognised in the income statement during the period 4 -7
Closing balance at 30 Jun -50 41
Nordea Bank Finland – Interim Report, January - June 2015 23
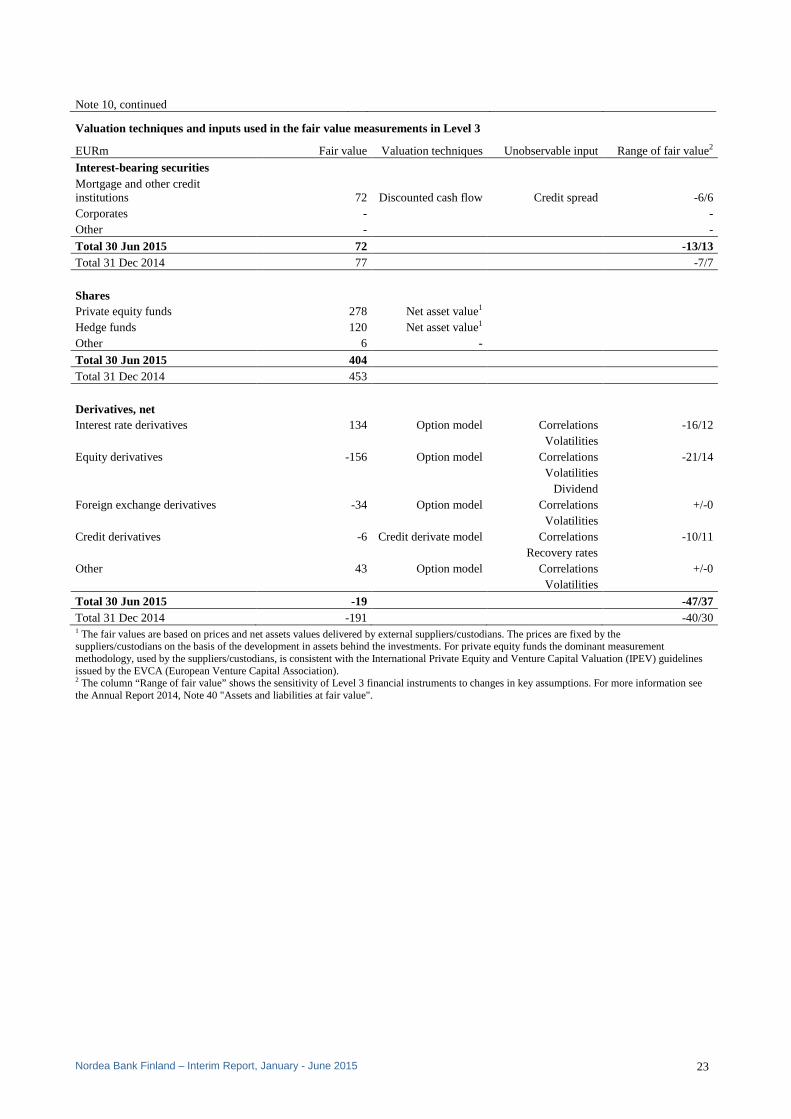
Note 10, continued
Valuation techniques and inputs used in the fair value measurements in Level 3
EURm Fair value Valuation techniques Unobservable input Range of fair value2
Interest-bearing securities
Mortgage and other credit institutions 72 Discounted cash flow Credit spread -6/6 Corporates - - Other - -
Total 30 Jun 2015 72 -13/13 Total 31 Dec 2014 77 -7/7
Shares
Private equity funds 278 Net asset value1
Hedge funds 120 Net asset value1
Other 6 -
Total 30 Jun 2015 404 Total 31 Dec 2014 453
Derivatives, net
Interest rate derivatives 134 Option model Correlations -16/12 Volatilities Equity derivatives -156 Option model Correlations -21/14 Volatilities Dividend Foreign exchange derivatives -34 Option model Correlations +/-0 Volatilities Credit derivatives -6 Credit derivate model Correlations -10/11 Recovery rates Other 43 Option model Correlations +/-0 Volatilities
Total 30 Jun 2015 -19 -47/37 Total 31 Dec 2014 -191 -40/30 1 The fair values are based on prices and net assets values delivered by external suppliers/custodians. The prices are fixed by the suppliers/custodians on the basis of the development in assets behind the investments. For private equity funds the dominant measurement methodology, used by the suppliers/custodians, is consistent with the International Private Equity and Venture Capital Valuation (IPEV) guidelines issued by the EVCA (European Venture Capital Association). 2 The column “Range of fair value” shows the sensitivity of Level 3 financial instruments to changes in key assumptions. For more information see the Annual Report 2014, Note 40 "Assets and liabilities at fair value".
Nordea Bank Finland – Interim Report, January - June 2015 24
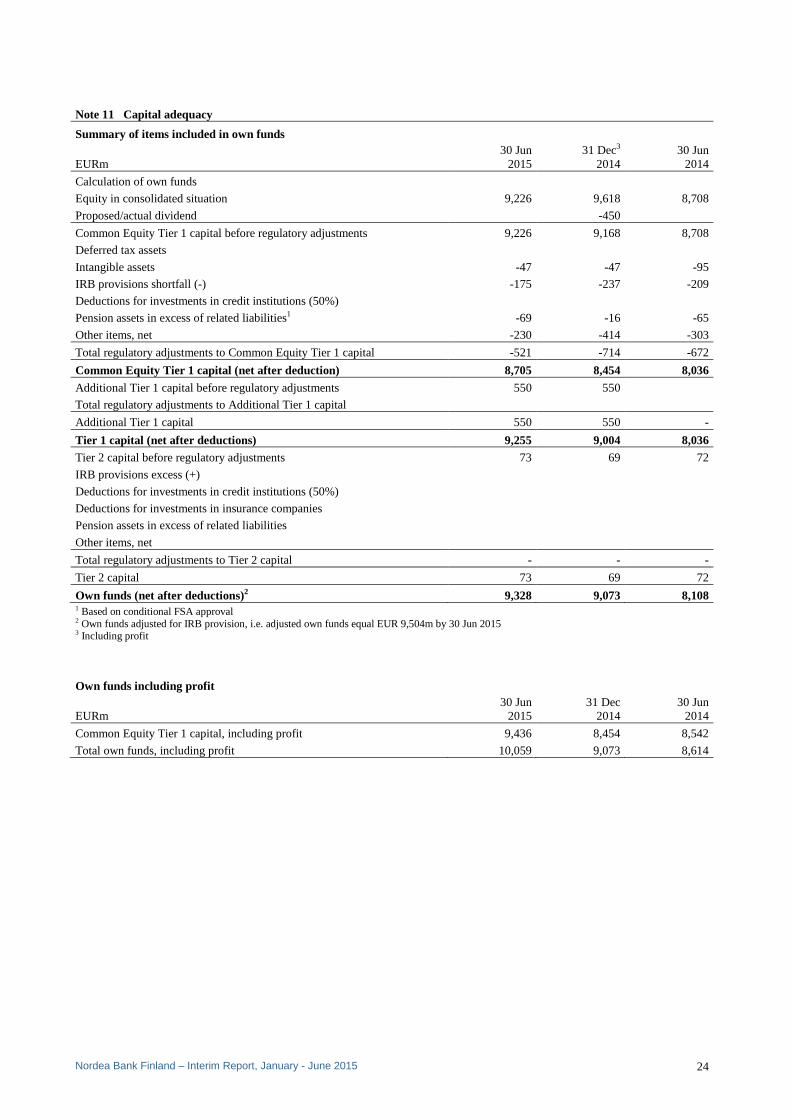
Note 11 Capital adequacy
Summary of items included in own funds
EURm 30 Jun
2015 31 Dec3
2014 30 Jun
2014
Calculation of own funds
Equity in consolidated situation 9,226 9,618 8,708
Proposed/actual dividend -450
Common Equity Tier 1 capital before regulatory adjustments 9,226 9,168 8,708
Deferred tax assets Intangible assets -47 -47 -95
IRB provisions shortfall (-) -175 -237 -209
Deductions for investments in credit institutions (50%)
Pension assets in excess of related liabilities1 -69 -16 -65
Other items, net -230 -414 -303
Total regulatory adjustments to Common Equity Tier 1 capital -521 -714 -672
Common Equity Tier 1 capital (net after deduction) 8,705 8,454 8,036
Additional Tier 1 capital before regulatory adjustments 550 550
Total regulatory adjustments to Additional Tier 1 capital
Additional Tier 1 capital 550 550 -
Tier 1 capital (net after deductions) 9,255 9,004 8,036 Tier 2 capital before regulatory adjustments 73 69 72
IRB provisions excess (+)
Deductions for investments in credit institutions (50%)
Deductions for investments in insurance companies
Pension assets in excess of related liabilities
Other items, net
Total regulatory adjustments to Tier 2 capital - - -
Tier 2 capital 73 69 72
Own funds (net after deductions)2 9,328 9,073 8,108 1 Based on conditional FSA approval 2 Own funds adjusted for IRB provision, i.e. adjusted own funds equal EUR 9,504m by 30 Jun 2015 3 Including profit Own funds including profit
EURm 30 Jun
2015 31 Dec
2014 30 Jun
2014
Common Equity Tier 1 capital, including profit 9,436 8,454 8,542
Total own funds, including profit 10,059 9,073 8,614
Nordea Bank Finland – Interim Report, January - June 2015 25
Note 11, continued
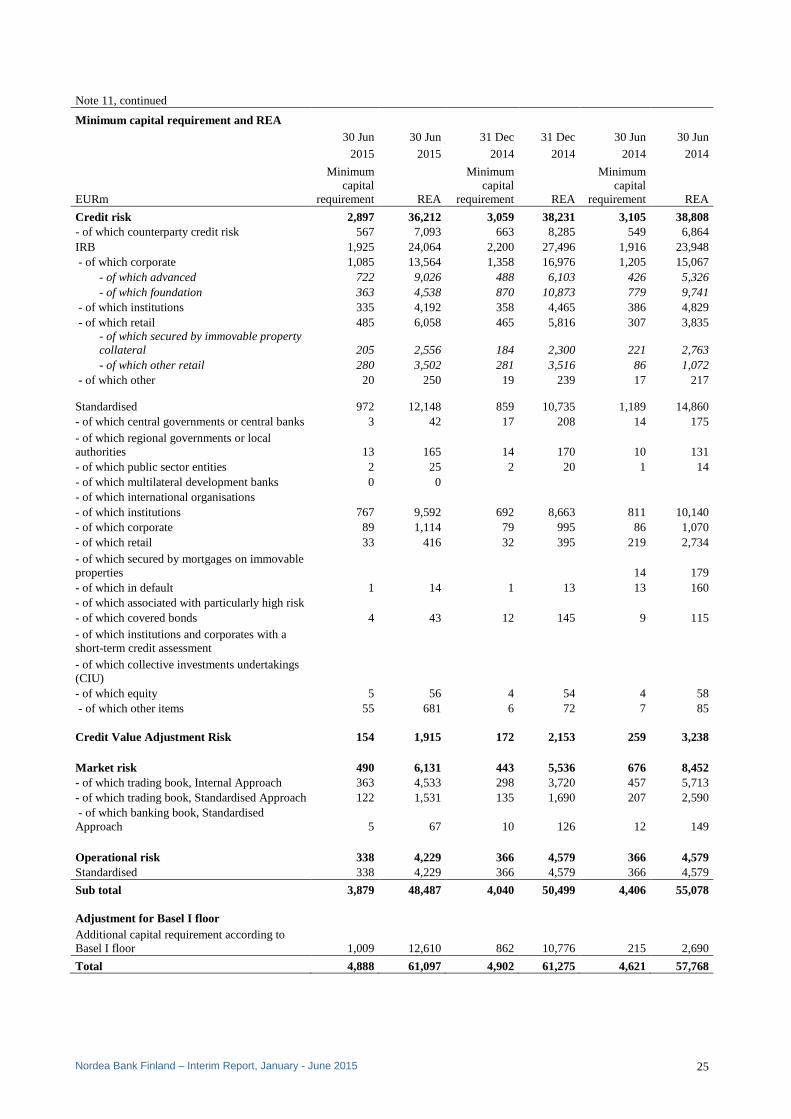
Minimum capital requirement and REA
30 Jun 30 Jun 31 Dec 31 Dec 30 Jun 30 Jun
2015 2015 2014 2014 2014 2014
EURm
Minimum capital
requirement REA
Minimum capital
requirement REA
Minimum capital
requirement REA
Credit risk 2,897 36,212 3,059 38,231 3,105 38,808 - of which counterparty credit risk 567 7,093 663 8,285 549 6,864 IRB 1,925 24,064 2,200 27,496 1,916 23,948 - of which corporate 1,085 13,564 1,358 16,976 1,205 15,067
- of which advanced 722 9,026 488 6,103 426 5,326 - of which foundation 363 4,538 870 10,873 779 9,741
- of which institutions 335 4,192 358 4,465 386 4,829 - of which retail 485 6,058 465 5,816 307 3,835
- of which secured by immovable property collateral 205 2,556 184 2,300 221 2,763 - of which other retail 280 3,502 281 3,516 86 1,072
- of which other 20 250 19 239 17 217 Standardised 972 12,148 859 10,735 1,189 14,860 - of which central governments or central banks 3 42 17 208 14 175 - of which regional governments or local authorities 13 165 14 170 10 131 - of which public sector entities 2 25 2 20 1 14 - of which multilateral development banks 0 0 - of which international organisations - of which institutions 767 9,592 692 8,663 811 10,140 - of which corporate 89 1,114 79 995 86 1,070 - of which retail 33 416 32 395 219 2,734 - of which secured by mortgages on immovable properties 14 179 - of which in default 1 14 1 13 13 160 - of which associated with particularly high risk - of which covered bonds 4 43 12 145 9 115 - of which institutions and corporates with a short-term credit assessment - of which collective investments undertakings (CIU) - of which equity 5 56 4 54 4 58 - of which other items 55 681 6 72 7 85 Credit Value Adjustment Risk 154 1,915 172 2,153 259 3,238 Market risk 490 6,131 443 5,536 676 8,452 - of which trading book, Internal Approach 363 4,533 298 3,720 457 5,713 - of which trading book, Standardised Approach 122 1,531 135 1,690 207 2,590 - of which banking book, Standardised Approach 5 67 10 126 12 149 Operational risk 338 4,229 366 4,579 366 4,579 Standardised 338 4,229 366 4,579 366 4,579
Sub total 3,879 48,487 4,040 50,499 4,406 55,078 Adjustment for Basel I floor Additional capital requirement according to Basel I floor 1,009 12,610 862 10,776 215 2,690
Total 4,888 61,097 4,902 61,275 4,621 57,768

Nordea Bank Finland – Interim Report, January - June 2015 26
Note 11, continued
Minimum capital requirement and Capital Buffers
Capital Buffers
Percentage
Minimum capital
requirement CCoB CCyB SII SRB
Capital Buffers
total Total Common Equity Tier 1 capital 4.5 2.5 0.1 2.6 7.1 Tier 1 capital 6 2.5 0.1 2.6 8.6 Own funds 8 2.5 0.1 2.6 10.6 EURm
Common Equity Tier 1 capital 2,182 1,212 28 1,240 3,422 Tier 1 capital 2,909 1,212 28 1,240 4,150 Own funds 3,879 1,212 28 1,240 5,119 Common Equity Tier 1 available to meet Capital Buffers
Percentage points of REA 30 Jun
2015 31 Dec1
2014 30 Jun
2014
Common Equity Tier 1 capital 11.2 10.0 N/A 1Including profit of the period Capital ratios
Percentage 30 Jun
2015 31 Dec
2014 30 Jun
2014
Common Equity Tier 1 capital ratio, including profit 19.5 16.7 15.5
Tier 1 ratio, including profit 20.6 17.8 15.5
Total capital ratio, including profit 20.7 18.0 15.6
Common Equity Tier 1 capital ratio, excluding profit 18.0 15.8 14.6
Tier 1 ratio, excluding profit 19.1 16.9 14.6
Total Capital ratio, excluding profit 19.2 17.0 14.7
Capital ratios including Basel I floor
Percentage 30 Jun
2015 31 Dec
2014 30 Jun
2014
Common Equity Tier 1 capital ratio, including profit 15.7 14.2 14.8
Tier 1 ratio, including profit 16.6 15.1 14.8
Total capital ratio, including profit 16.8 15.2 14.9
Common Equity Tier 1 capital ratio, excluding profit 14.5 13.4 13.9
Tier 1 ratio, excluding profit 15.4 14.3 13.9
Total Capital ratio, excluding profit 15.6 14.4 14.0
Leverage ratio
30 Jun
2015 31 Dec1
2014 30 Jun
2014
Tier 1 capital, transitional definition, EURm 9,255 9,004 8,036
Leverage ratio exposure, EURm 296,425 269,431 258,952
Leverage ratio, percentage 3.1 3.3 3.1 1Including profit of the period

Nordea Bank Finland – Interim Report, January - June 2015 27
Note 11, continued Credit risk exposures for which internal models are used, split by rating grade, 30 Jun 2015
On-balance exposure,
EURm
Off-balance exposure,
EURm
Exposure value (EAD), EURm1
Of which EAD for off-balance,
EURm
Exposure-weighted
average risk weight:
Corporate, foundation IRB: 2,584 1,419 11,404 0 39.8 - of which rating grades 6 151 58 3,339 15.9 - of which rating grades 5 443 228 3,197 28.8 - of which rating grades 4 811 468 3,264 0 56.3 - of which rating grades 3 562 332 947 0 83.3 - of which rating grades 2 71 56 118 133.9 - of which rating grades 1 24 15 26 159.7 - of which unrated 393 189 248 104.6 - of which defaulted 129 73 265 0.0 Corporate, advanced IRB: 24,083 22,733 25,015 5,600 36.1 - of which rating grades 6 4,715 2,110 5,036 907 9.3 - of which rating grades 5 3,117 7,891 4,776 1,940 22.5 - of which rating grades 4 10,763 9,356 10,546 2,013 39.4 - of which rating grades 3 3,530 2,238 3,008 476 58.9 - of which rating grades 2 631 621 445 177 99.1 - of which rating grades 1 147 23 115 6 101.0 - of which unrated 372 248 405 81 48.8 - of which defaulted 808 246 684 117.8 Institutions, foundation IRB: 9,676 1,791 16,729 642 25.1 - of which rating grades 6 3,127 419 4,760 321 18.4 - of which rating grades 5 6,433 452 10,698 119 23.1 - of which rating grades 4 40 493 1,017 94 51.1 - of which rating grades 3 42 263 206 76 115.0 - of which rating grades 2 28 143 31 25 189.4 - of which rating grades 1 0 13 3 3 244.6 - of which unrated 6 8 14 4 151.9 - of which defaulted Retail, of which secured by real estate: 28,070 408 28,324 254 9.0 - of which scoring grades A 12,785 171 12,895 110 3.2 - of which scoring grades B 9,269 95 9,329 60 6.4 - of which scoring grades C 3,963 88 4,015 52 13.2 - of which scoring grades D 1,377 45 1,404 27 24.0 - of which scoring grades E 0 5 3 3 67.0 - of which scoring grades F 214 1 215 1 68.9 - of which not scored 8 1 8 0 24.2 - of which defaulted 454 2 455 1 116.3 Retail, of which other retail: 10,036 4,757 11,411 2,415 30.7 - of which scoring grades A 1,146 2,441 2,197 1,228 7.4 - of which scoring grades B 1,954 1,087 2,236 534 14.3 - of which scoring grades C 1,716 499 1,723 275 24.4 - of which scoring grades D 1,904 333 1,903 191 30.5 - of which scoring grades E 1,582 157 1,603 91 32.0 - of which scoring grades F 1,371 80 1,332 43 46.1 - of which not scored 53 83 89 14 43.2 - of which defaulted 310 77 328 39 260.7 Other non credit-obligation assets: 260 78 252 32 99.1 1Includes EAD for on-balance, off-balance, derivatives and securities financing.
NBF does not have the following IRB exposure classes: equity exposures, items representing securitisation positions, central governments and central banks, qualifying revolving retail.
Nordea Bank Finland – Interim Report, January - June 2015 28
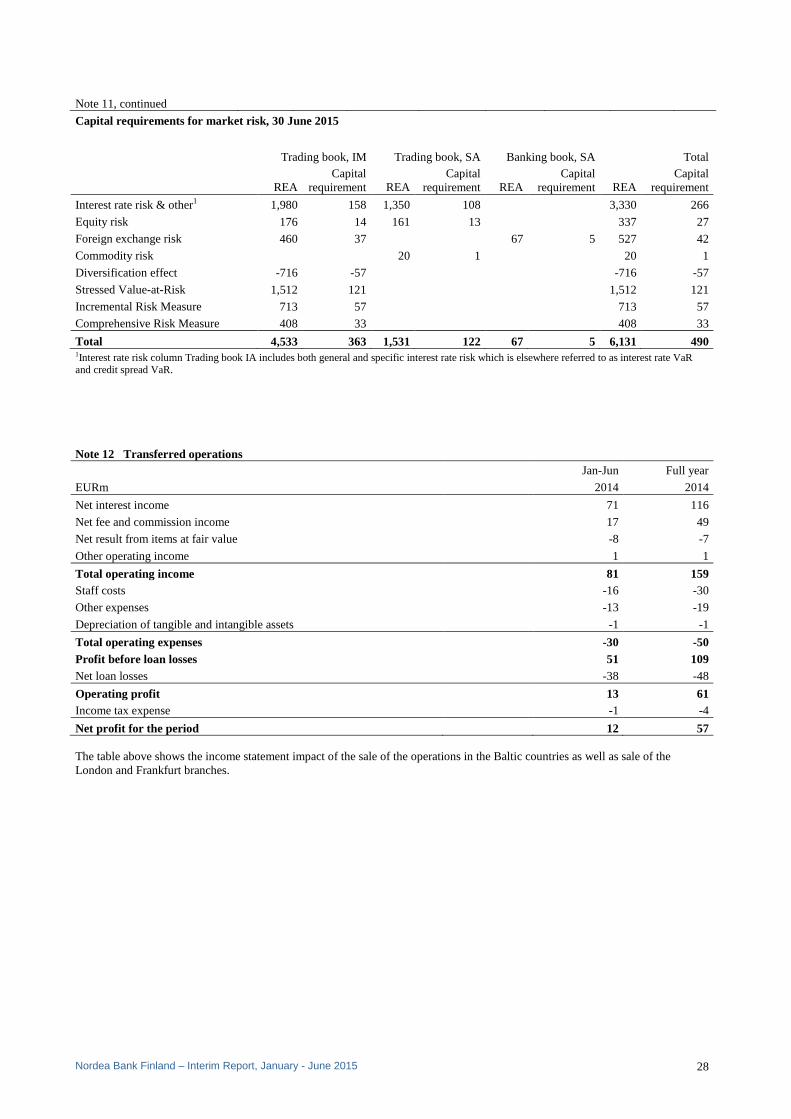
Note 11, continued Capital requirements for market risk, 30 June 2015
Trading book, IM Trading book, SA Banking book, SA Total
REA Capital
requirement REA Capital
requirement REA Capital
requirement REA Capital
requirement
Interest rate risk & other1 1,980 158 1,350 108 3,330 266
Equity risk 176 14 161 13 337 27
Foreign exchange risk 460 37 67 5 527 42
Commodity risk 20 1 20 1
Diversification effect -716 -57 -716 -57
Stressed Value-at-Risk 1,512 121 1,512 121
Incremental Risk Measure 713 57 713 57
Comprehensive Risk Measure 408 33 408 33
Total 4,533 363 1,531 122 67 5 6,131 490 1Interest rate risk column Trading book IA includes both general and specific interest rate risk which is elsewhere referred to as interest rate VaR and credit spread VaR. Note 12 Transferred operations
Jan-Jun Full year
EURm 2014 2014
Net interest income 71 116
Net fee and commission income 17 49
Net result from items at fair value -8 -7
Other operating income 1 1
Total operating income 81 159 Staff costs -16 -30
Other expenses -13 -19
Depreciation of tangible and intangible assets -1 -1
Total operating expenses -30 -50 Profit before loan losses 51 109 Net loan losses -38 -48
Operating profit 13 61 Income tax expense -1 -4
Net profit for the period 12 57 The table above shows the income statement impact of the sale of the operations in the Baltic countries as well as sale of the London and Frankfurt branches.