Embed Size (px)
Citation preview
NorCal OAUG 2010 Training Day
How to deploy Performance Reporting within Oracle EBS Projects successfully
Suhail MaqsoodChief Operating Officer, Rysigo Technologies Corp
Agenda
Oracle Projects Reporting Solutions The Business Need Project Performance Reporting – Overview Exceptions Management - Overview Architecture Project Status Inquiry vs Project Performance
Reporting Implementation tips and techniques Implementation gotcha’s Project Performance Reporting Enhancements
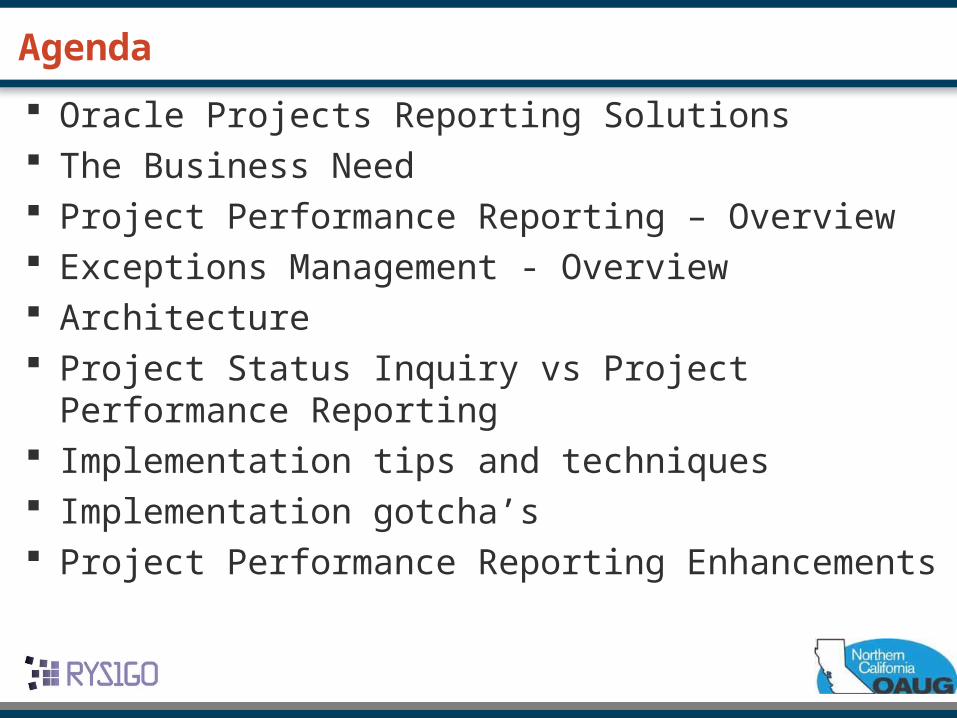
Oracle Projects Reporting Solutions
HTML
FORMS
Projects Intelligence
DiscovererWorkbooks Project Status
Inquiry
Project Performance Reporting
Status Reports
Project List
Concurrent Reports
Reporting Pack(BI Publisher)
Project Analytics
ORACLE PROJECTS
12+
12+
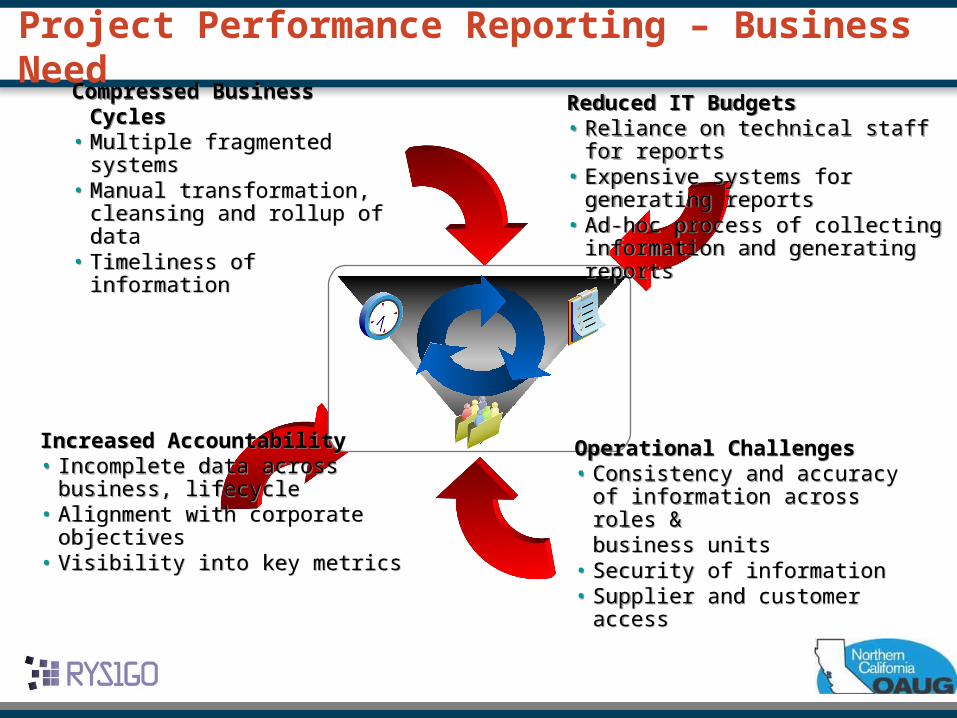
Project Performance Reporting – Business Need
Compressed Business Cycles• Multiple fragmented systems• Manual transformation,
cleansing and rollup of data• Timeliness of information
Compressed Business Cycles• Multiple fragmented systems• Manual transformation,
cleansing and rollup of data• Timeliness of information
Increased Accountability• Incomplete data across business,
lifecycle• Alignment with corporate objectives• Visibility into key metrics
Increased Accountability• Incomplete data across business,
lifecycle• Alignment with corporate objectives• Visibility into key metrics
Reduced IT Budgets• Reliance on technical staff for reports• Expensive systems for generating
reports• Ad-hoc process of collecting
information and generating reports
Reduced IT Budgets• Reliance on technical staff for reports• Expensive systems for generating
reports• Ad-hoc process of collecting
information and generating reports
Operational Challenges• Consistency and accuracy of
information across roles & business units
• Security of information• Supplier and customer access
Operational Challenges• Consistency and accuracy of
information across roles & business units
• Security of information• Supplier and customer access
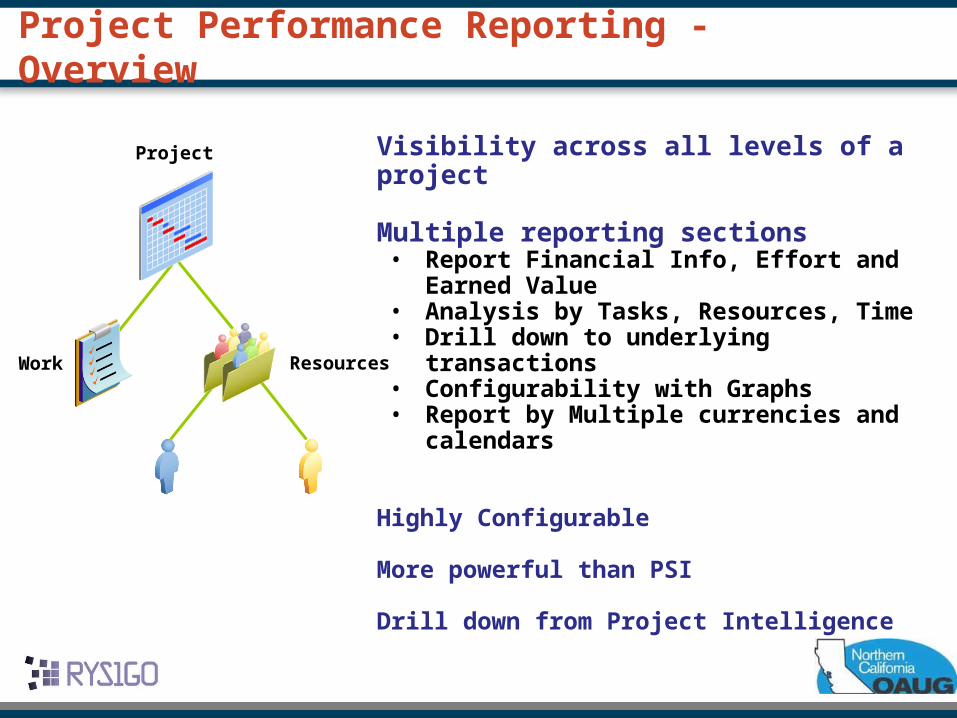
Project Performance Reporting - Overview
Visibility across all levels of a project
Multiple reporting sections• Report Financial Info, Effort and Earned
Value • Analysis by Tasks, Resources, Time• Drill down to underlying transactions• Configurability with Graphs• Report by Multiple currencies and calendars
Highly Configurable
More powerful than PSI
Drill down from Project Intelligence
ResourcesWork
Project
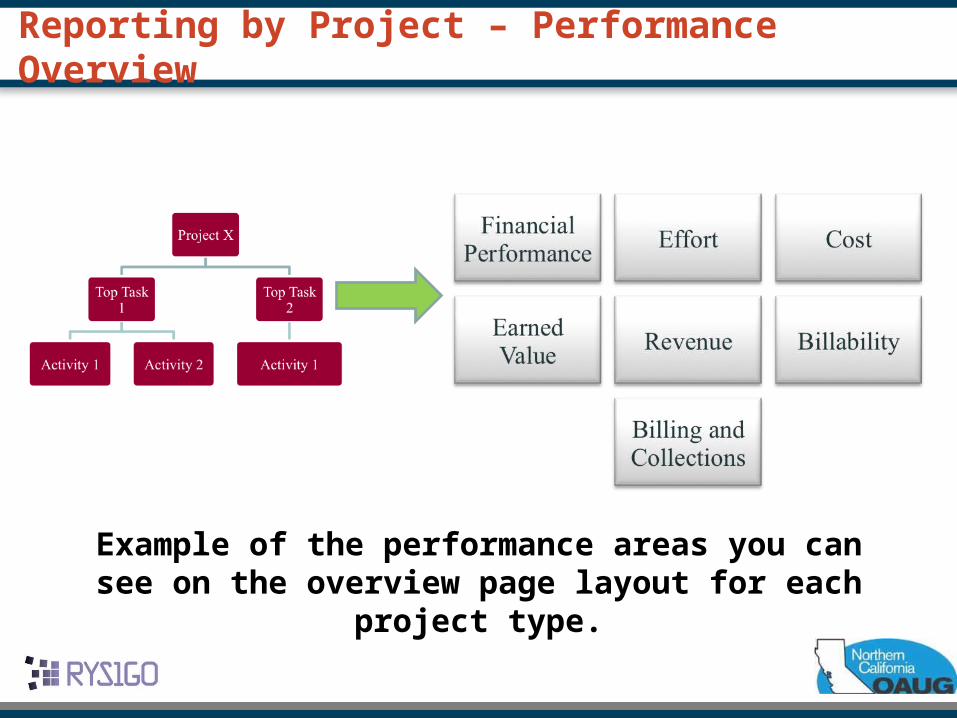
Reporting by Project – Performance Overview
Example of the performance areas you can see on the overview page layout for each project type.
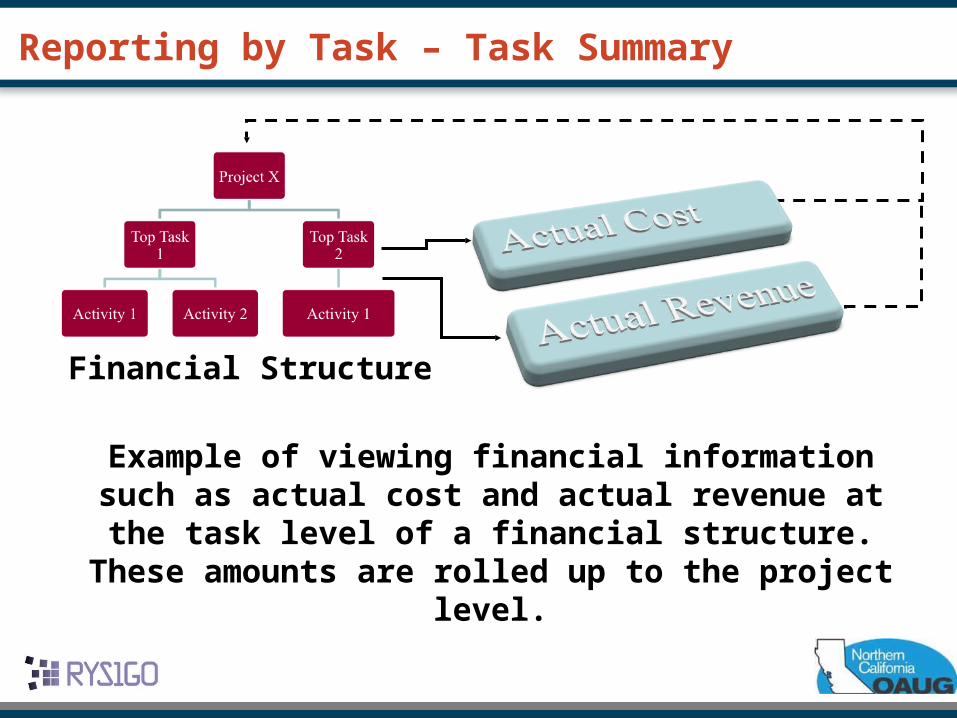
Reporting by Task – Task Summary
Example of viewing financial information such as actual cost and actual revenue at the task level of a financial structure. These amounts are rolled up to
the project level.
Financial Structure
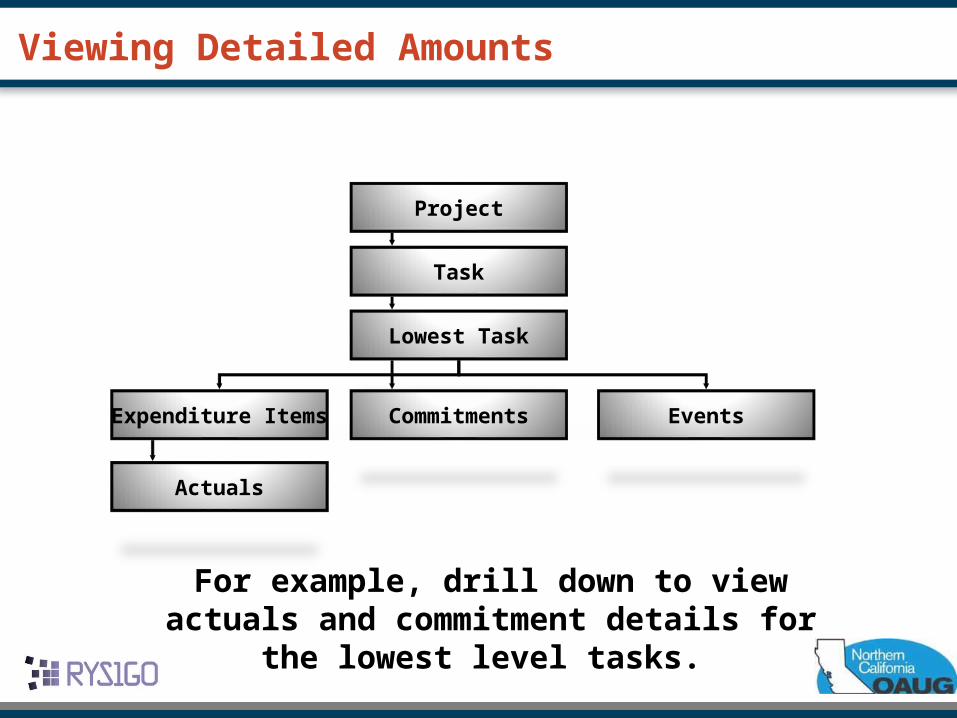
Viewing Detailed Amounts
Project
Task
Lowest Task
Expenditure Items Commitments Events
Actuals
For example, drill down to view actuals and commitment details for the lowest level tasks.
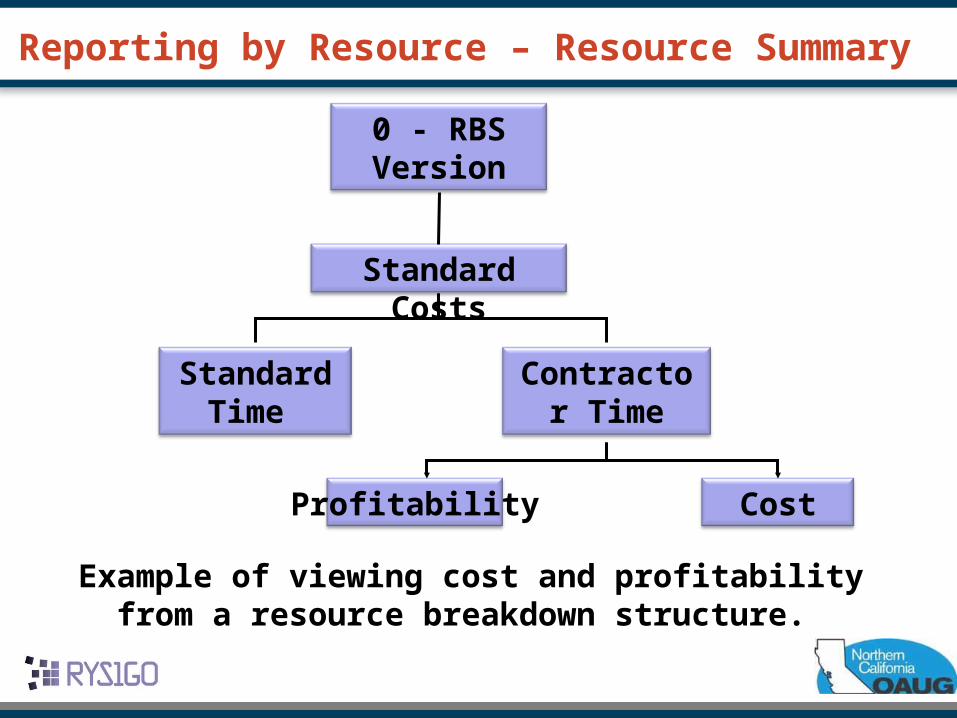
Reporting by Resource – Resource Summary
0 - RBS Version
Standard Costs
Contractor Time
Standard Time
CostProfitability
Example of viewing cost and profitability from a resource breakdown structure.
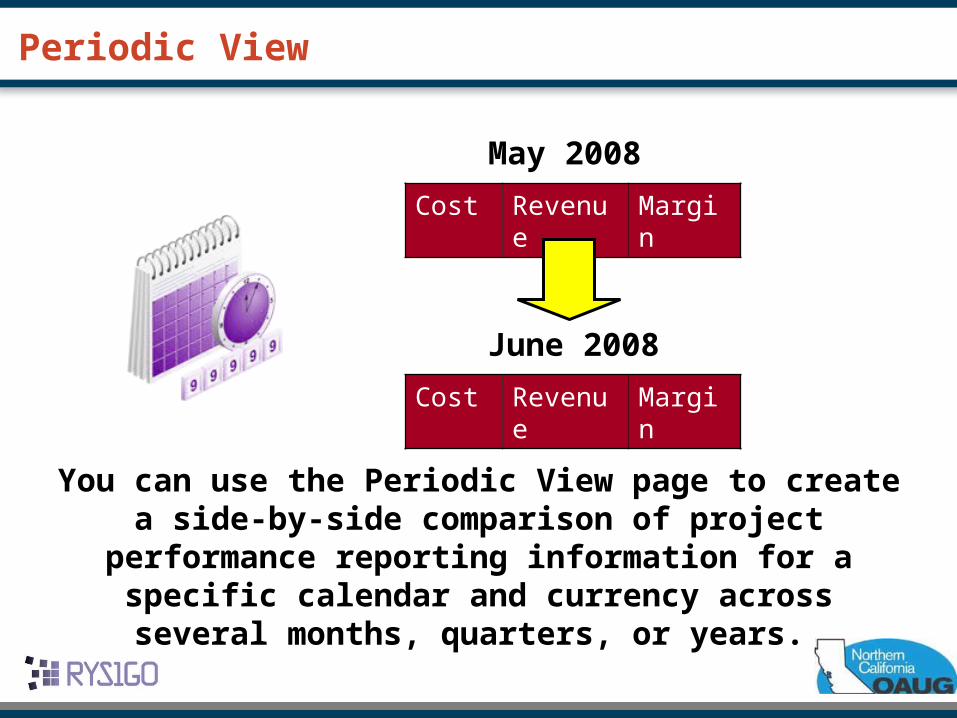
Periodic View
Cost Revenue Margin
May 2008
Cost Revenue Margin
June 2008
You can use the Periodic View page to create a side-by-side comparison of project performance reporting
information for a specific calendar and currency across several months, quarters, or years.
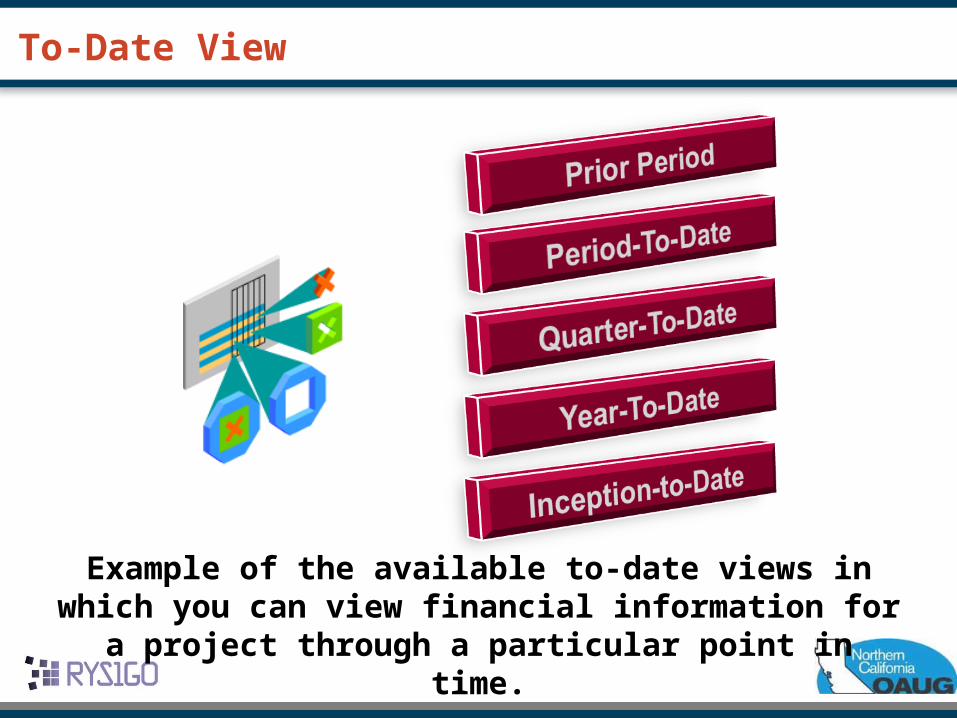
To-Date View
Example of the available to-date views in which you can view financial information for a project through a
particular point in time.
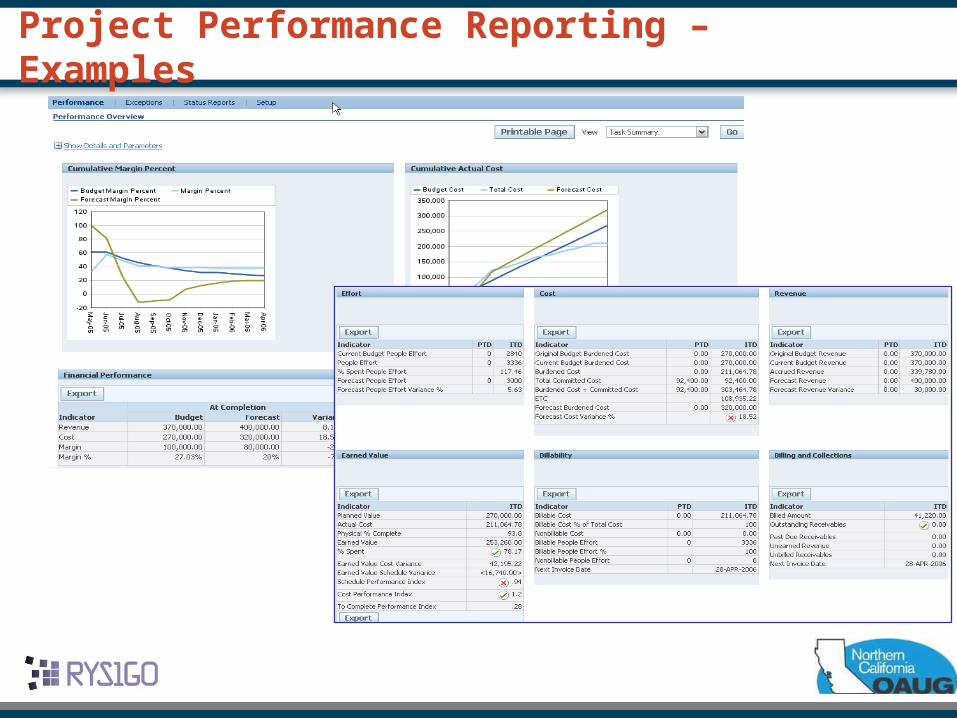
Project Performance Reporting – Examples
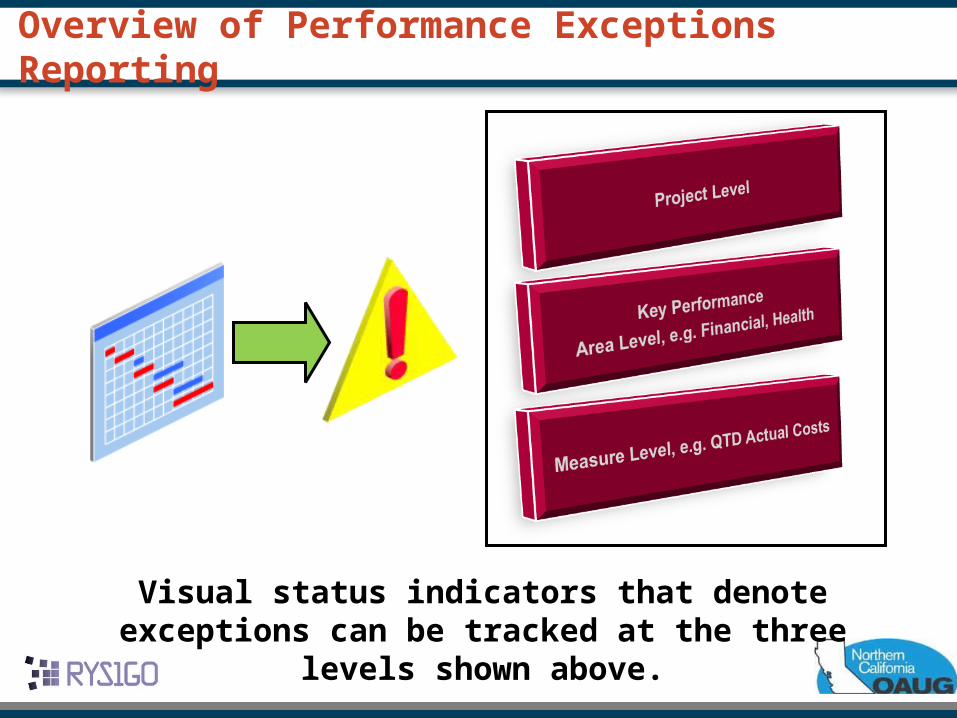
Overview of Performance Exceptions Reporting
Visual status indicators that denote exceptions can be tracked at the three levels shown above.
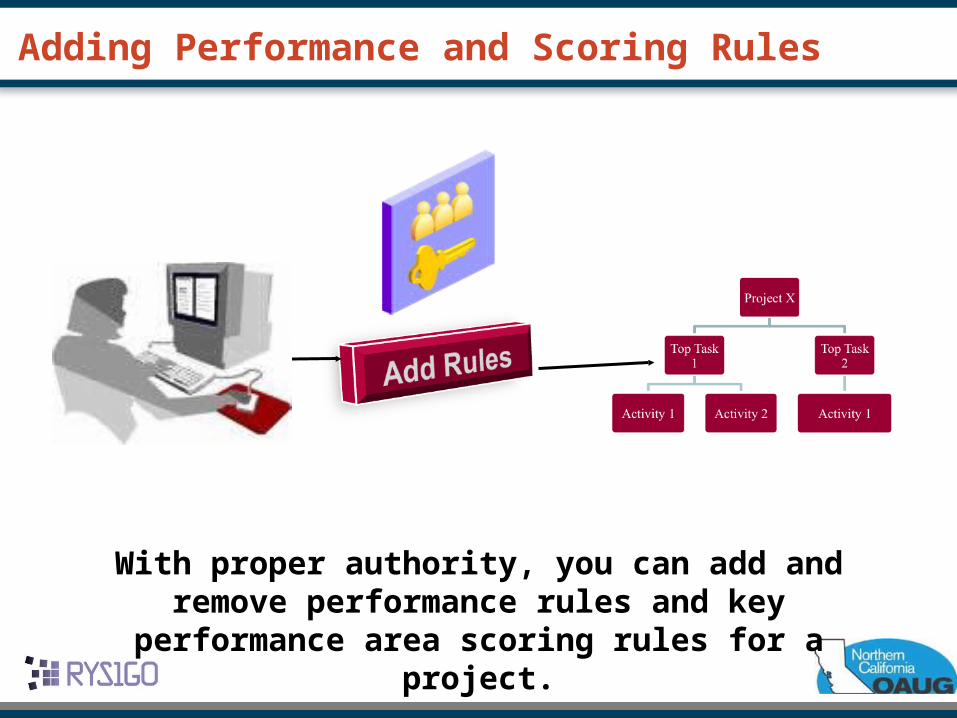
Adding Performance and Scoring Rules
With proper authority, you can add and remove performance rules and key performance area scoring
rules for a project.
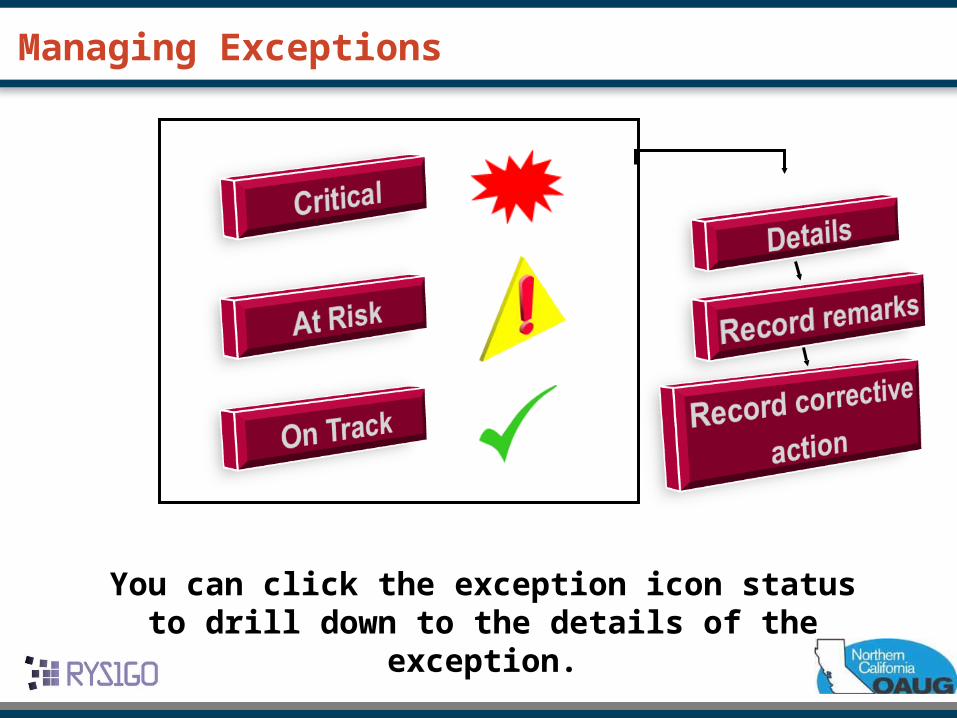
Managing Exceptions
You can click the exception icon status to drill down to the details of the exception.
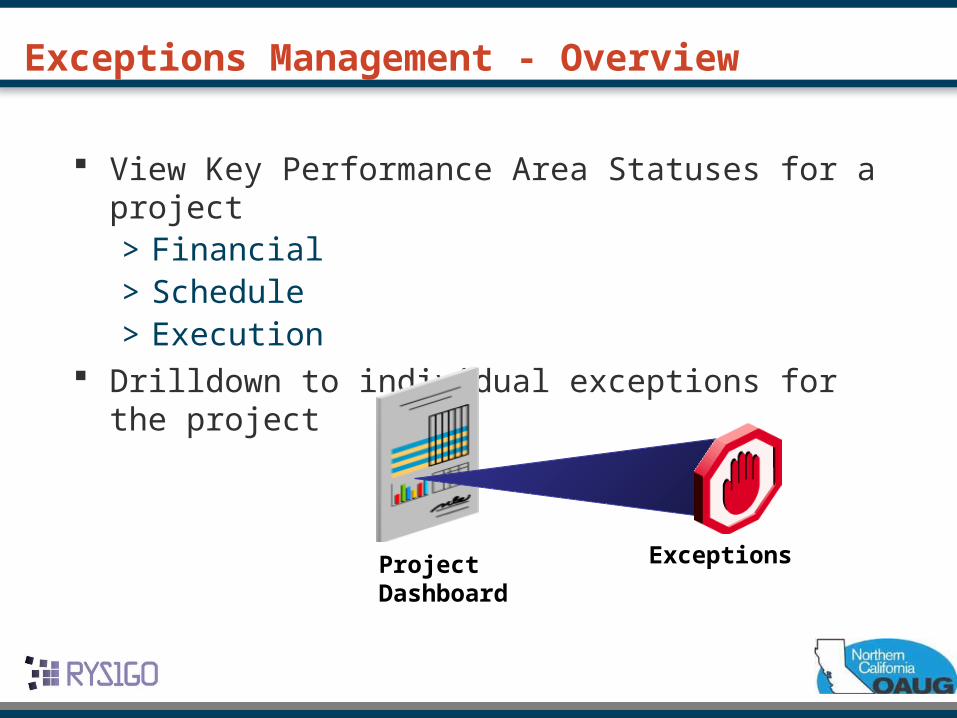
Exceptions Management - Overview
View Key Performance Area Statuses for a project> Financial> Schedule> Execution
Drilldown to individual exceptions for the project
ProjectDashboard
Exceptions
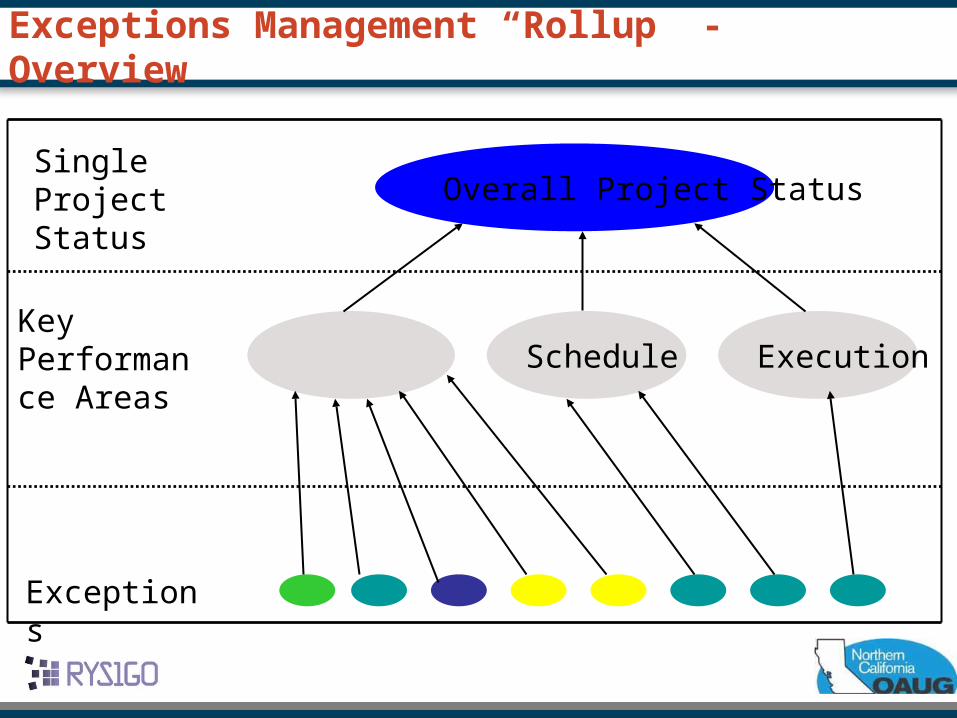
Exceptions Management “Rollup” - Overview
Exceptions
Key Performance Areas
Financial Schedule Execution
Overall Project StatusSingle Project Status
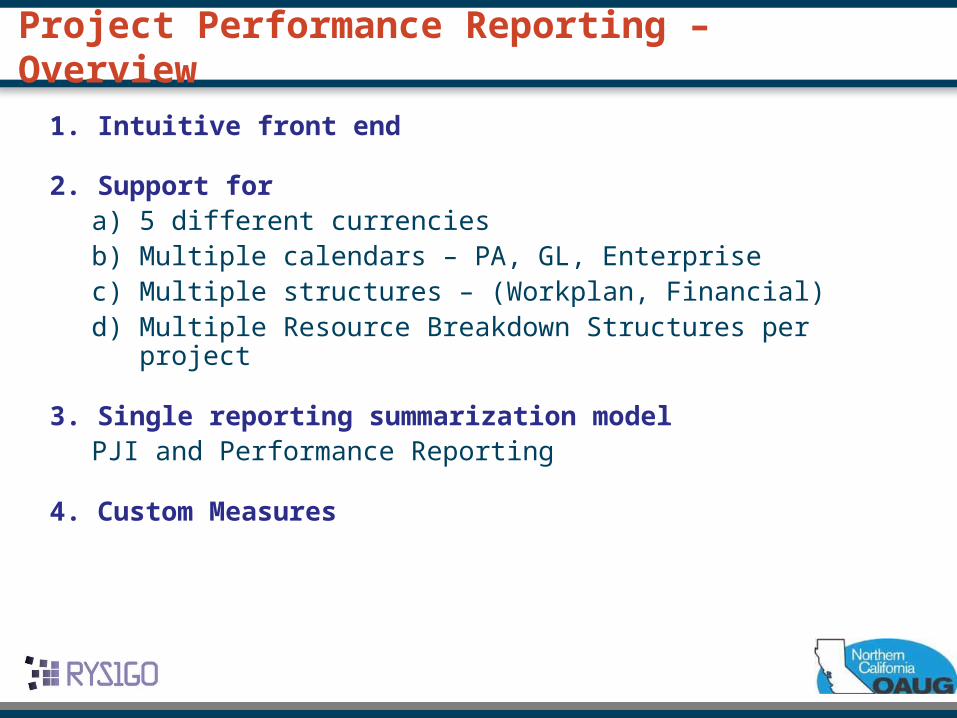
Project Performance Reporting – Overview
1. Intuitive front end
2. Support fora) 5 different currenciesb) Multiple calendars – PA, GL, Enterprisec) Multiple structures – (Workplan, Financial)d) Multiple Resource Breakdown Structures per project
3. Single reporting summarization modelPJI and Performance Reporting
4. Custom Measures
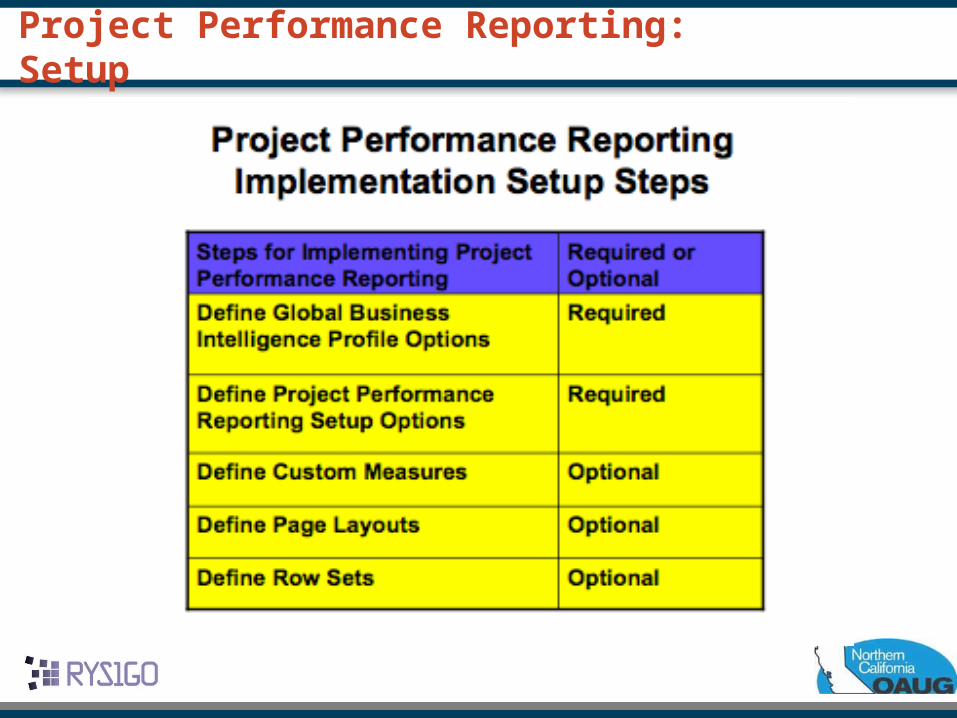
Project Performance Reporting: Setup
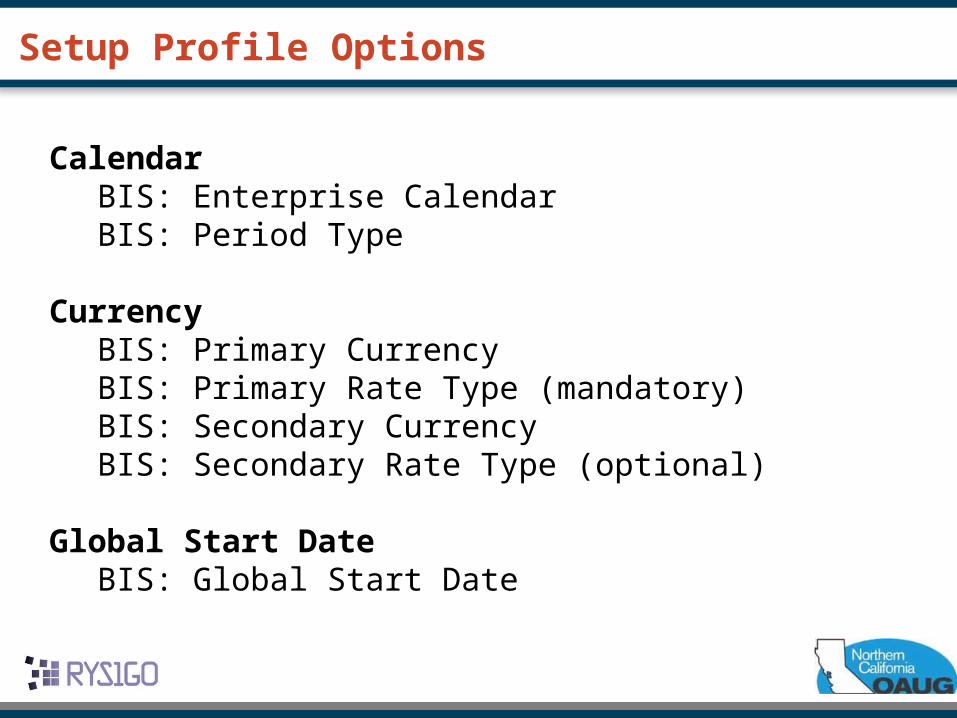
Setup Profile Options
CalendarBIS: Enterprise CalendarBIS: Period Type
CurrencyBIS: Primary Currency BIS: Primary Rate Type (mandatory) BIS: Secondary Currency BIS: Secondary Rate Type (optional)
Global Start DateBIS: Global Start Date
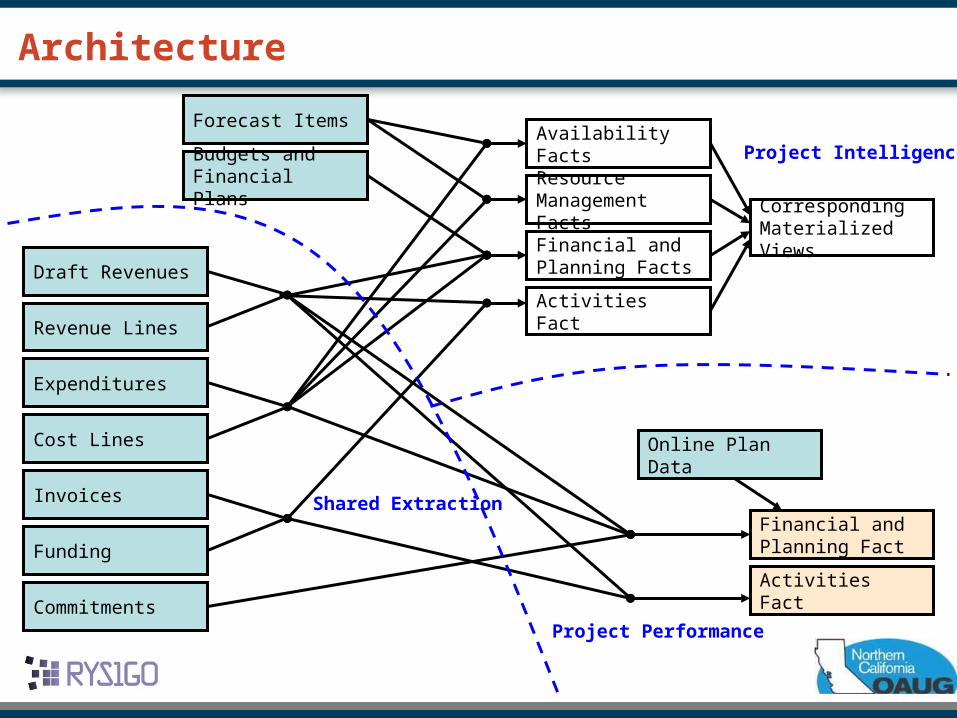
Architecture
Corresponding Materialized Views
Availability Facts
Resource Management Facts
Financial and Planning Facts
Activities Fact
Financial and Planning Fact
Activities Fact
Forecast Items
Budgets and Financial Plans
Online Plan Data
Commitments
Draft Revenues
Cost Lines
Revenue Lines
Invoices
Funding
Expenditures
Shared Extraction
Project Intelligence
Project Performance
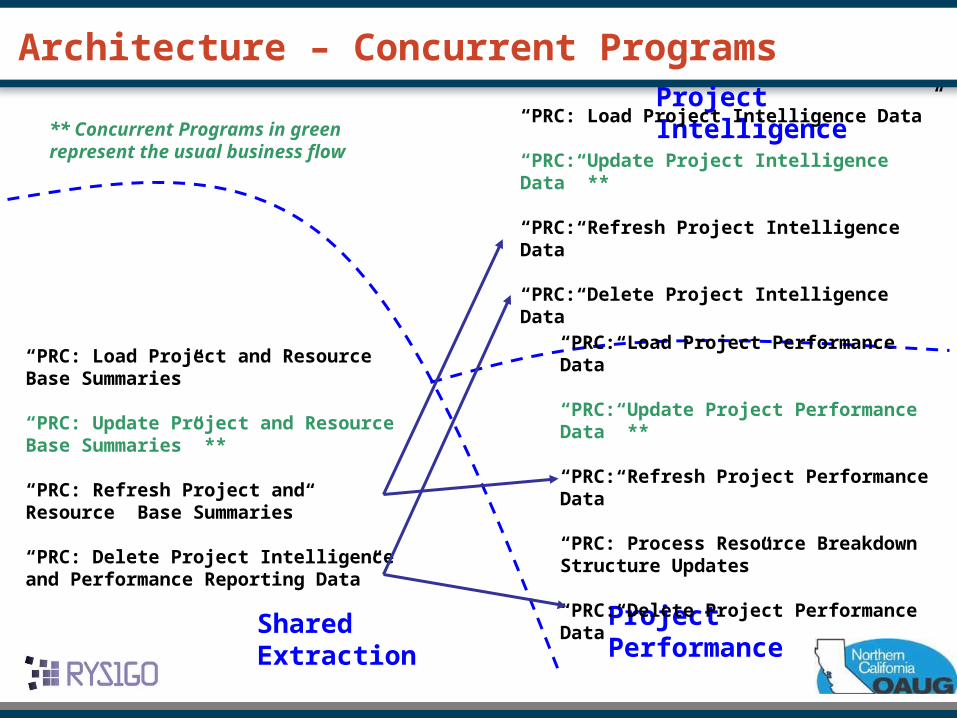
Architecture – Concurrent Programs
Shared Extraction
Project Intelligence
Project Performance
“PRC: Load Project and Resource Base Summaries”
“PRC: Update Project and Resource Base Summaries” **
“PRC: Refresh Project and Resource Base Summaries”
“PRC: Delete Project Intelligence and Performance Reporting Data”
“PRC: Load Project Intelligence Data”
“PRC: Update Project Intelligence Data” **
“PRC: Refresh Project Intelligence Data”
“PRC: Delete Project Intelligence Data”
“PRC: Load Project Performance Data”
“PRC: Update Project Performance Data” **
“PRC: Refresh Project Performance Data”
“PRC: Process Resource Breakdown Structure Updates”
“PRC: Delete Project Performance Data”
** Concurrent Programs in green represent the usual business flow
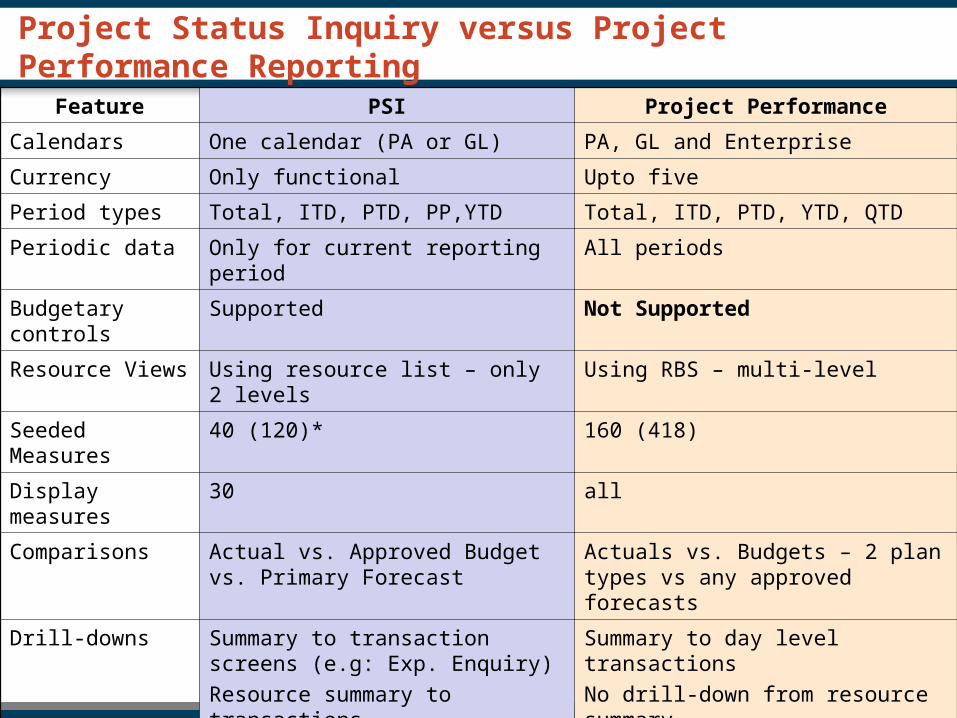
Project Status Inquiry versus Project Performance Reporting
Feature PSI Project Performance
Calendars One calendar (PA or GL) PA, GL and Enterprise
Currency Only functional Upto five
Period types Total, ITD, PTD, PP,YTD Total, ITD, PTD, YTD, QTD
Periodic data Only for current reporting period All periods
Budgetary controls Supported Not Supported
Resource Views Using resource list – only 2 levels Using RBS – multi-level
Seeded Measures 40 (120)* 160 (418)
Display measures 30 all
Comparisons Actual vs. Approved Budget vs. Primary Forecast
Actuals vs. Budgets – 2 plan types vs any approved forecasts
Drill-downs Summary to transaction screens (e.g: Exp. Enquiry)
Resource summary to transactions
Summary to day level transactions
No drill-down from resource summary
Custom measures Up to 30 numeric (includes ITD, YTD, PTD, PP, Total) and 3 text
SQL based formula– not flexible
Up to 60 numeric (excludes ITD, PTD, Total)
SQL and PL/SQL based formula – more flexible
Implementation Tips and Techniques
> Implementing PPR introduces additional technologies that a customer needs to be able to understand and support:
• Tech Stack – PMV (Performance Management Viewer)
> The initial load programs may take a significant time and system resources to complete (based on the data volume).
• Plan accordingly for this!• Refer to the PJI Project Performance Sizing spreadsheet to
obtain an accurate prediction of tablespace sizes
Implementation Tips and Techniques
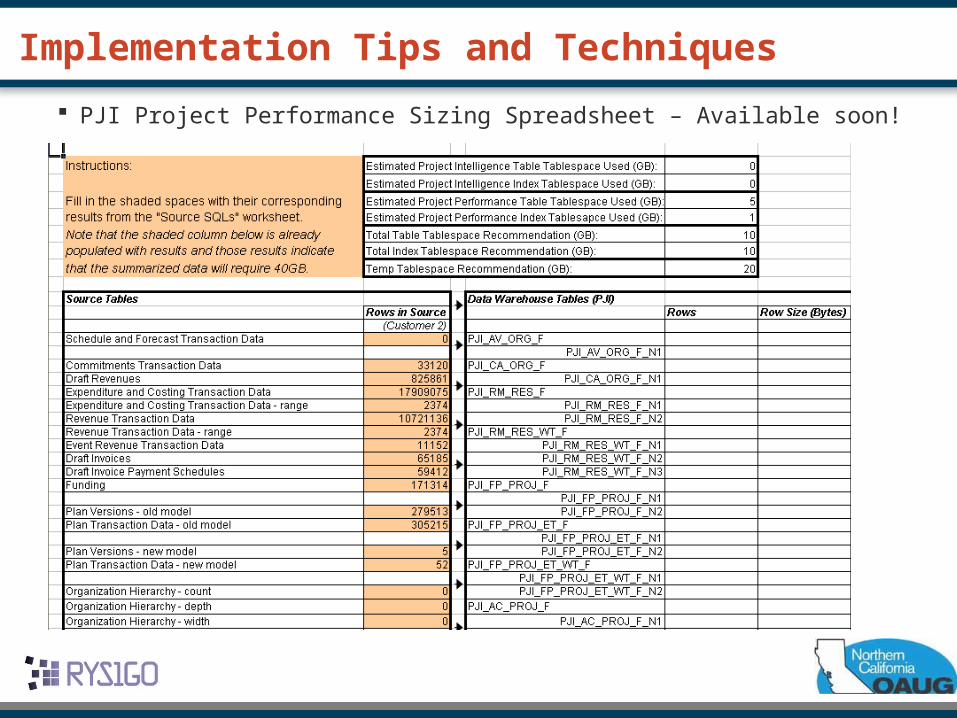
PJI Project Performance Sizing Spreadsheet – Available soon!
Implementation Tips and Techniques
> To reduce the time it takes to summarize the data and the size of the database, consider:
• Purging Projects data prior to running summarization processes using the Purge program
• Reducing the date data needs to be summarized from
• Clean up Projects data if possible (close projects etc)
DO NOT run the Delete or Truncate processes unless instructed to do so by development when experiencing an issue for which an SR is logged
• There are 2 methods to define custom measures
– Stored custom measures— Defined by updating the package (PJISC01B.pls)— Calculated and stored during summarization process.— For further details on how to modify the package to create
the stored custom measure, please read the header of the file.
– Computed custom measures— Defined using the user interface for custom measures— Calculated and displayed during the runtime.
Customization options
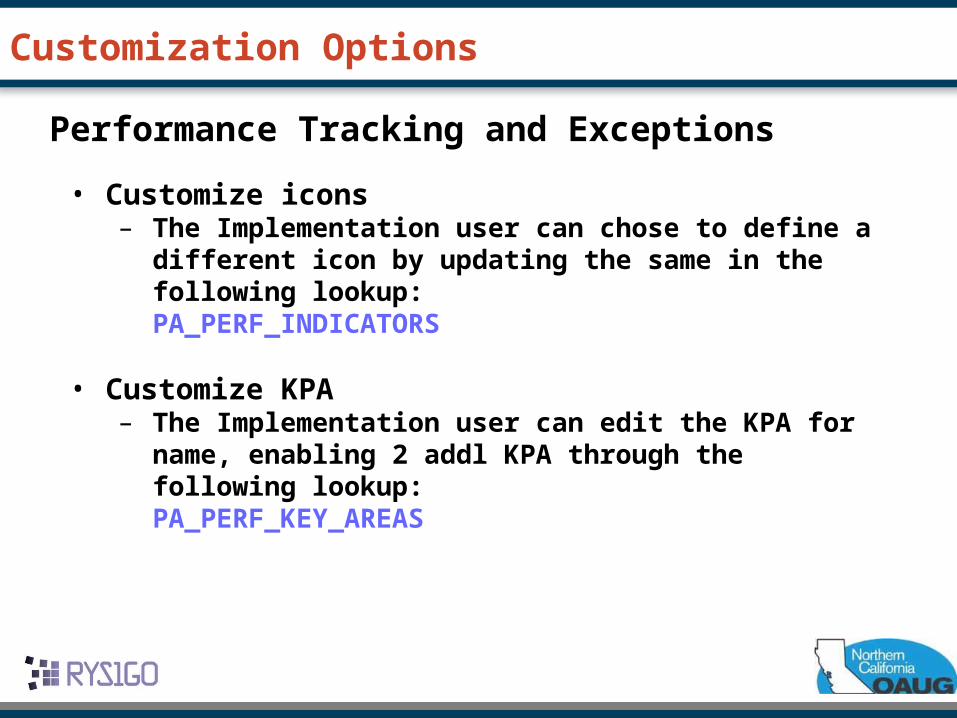
Performance Tracking and Exceptions
• Customize icons– The Implementation user can chose to define a different
icon by updating the same in the following lookup:PA_PERF_INDICATORS
• Customize KPA– The Implementation user can edit the KPA for name,
enabling 2 addl KPA through the following lookup:PA_PERF_KEY_AREAS
Customization Options
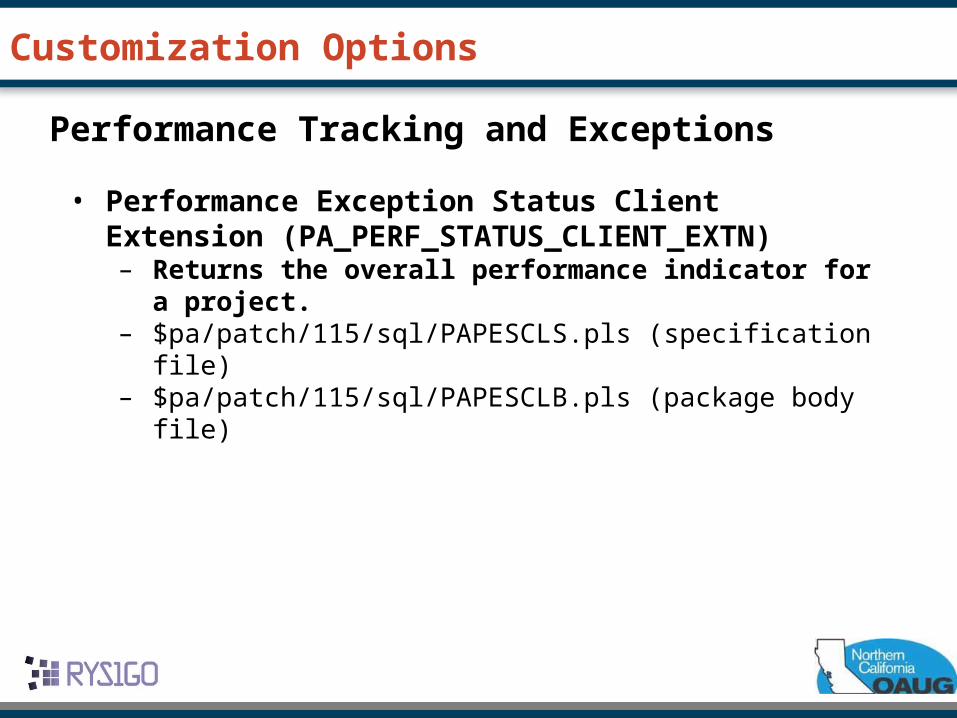
Performance Tracking and Exceptions
Customization Options
• Performance Exception Status Client Extension (PA_PERF_STATUS_CLIENT_EXTN)– Returns the overall performance indicator for a project.– $pa/patch/115/sql/PAPESCLS.pls (specification file)– $pa/patch/115/sql/PAPESCLB.pls (package body file)
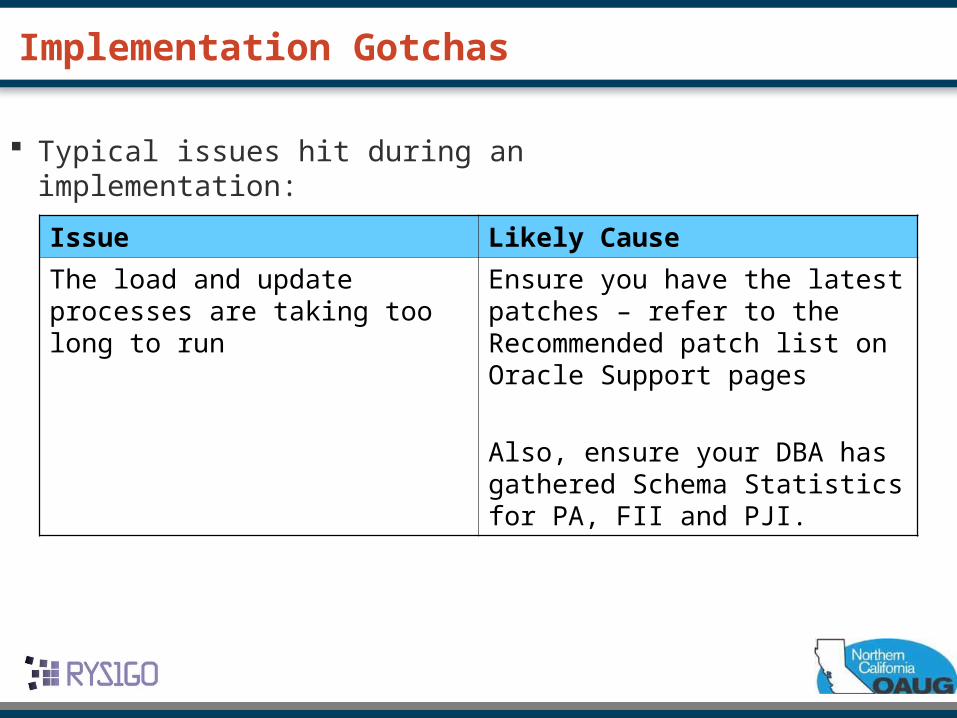
Implementation Gotchas
Typical issues hit during an implementation:
Issue Likely Cause
The load and update processes are taking too long to run
Ensure you have the latest patches – refer to the Recommended patch list on Oracle Support pages
Also, ensure your DBA has gathered Schema Statistics for PA, FII and PJI.
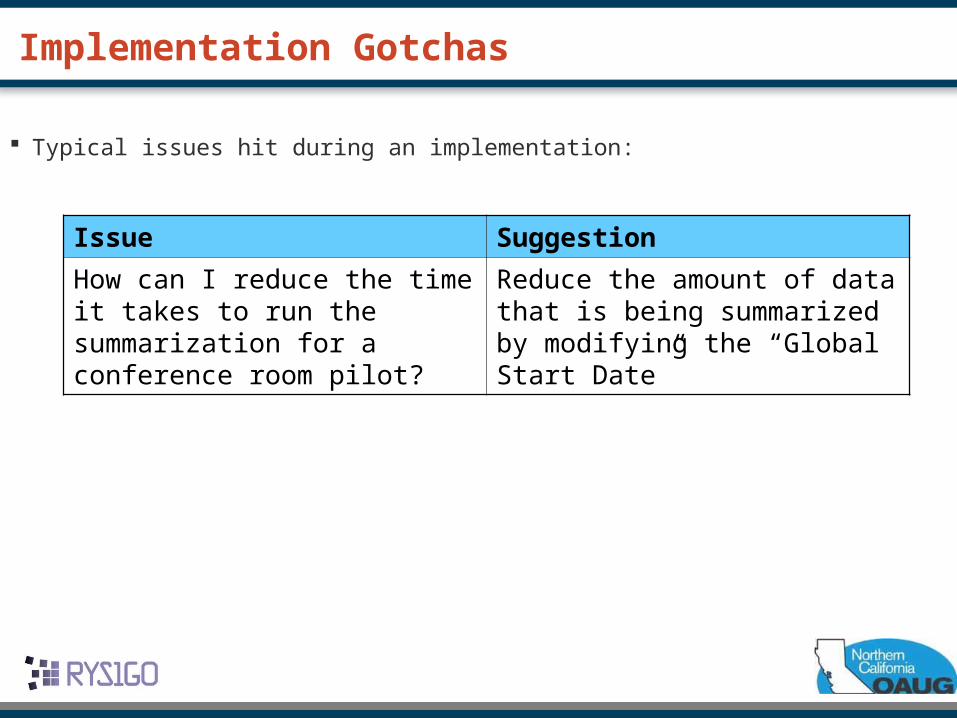
Implementation Gotchas
Typical issues hit during an implementation:
Issue Suggestion
How can I reduce the time it takes to run the summarization for a conference room pilot?
Reduce the amount of data that is being summarized by modifying the “Global Start Date”
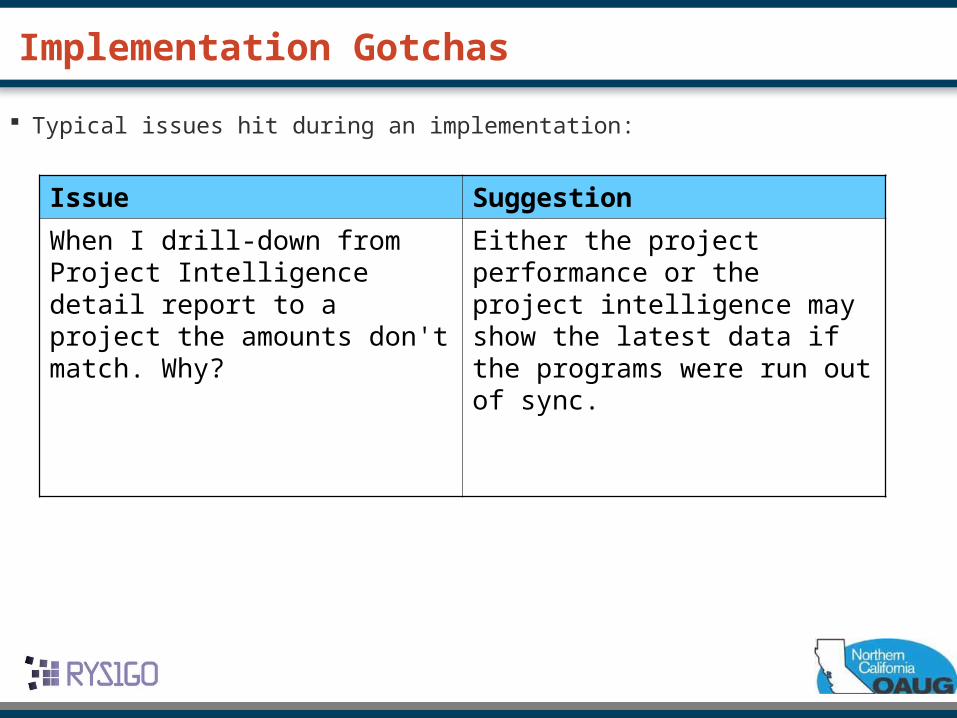
Implementation Gotchas
Typical issues hit during an implementation:
Issue Suggestion
When I drill-down from Project Intelligence detail report to a project the amounts don't match. Why?
Either the project performance or the project intelligence may show the latest data if the programs were run out of sync.
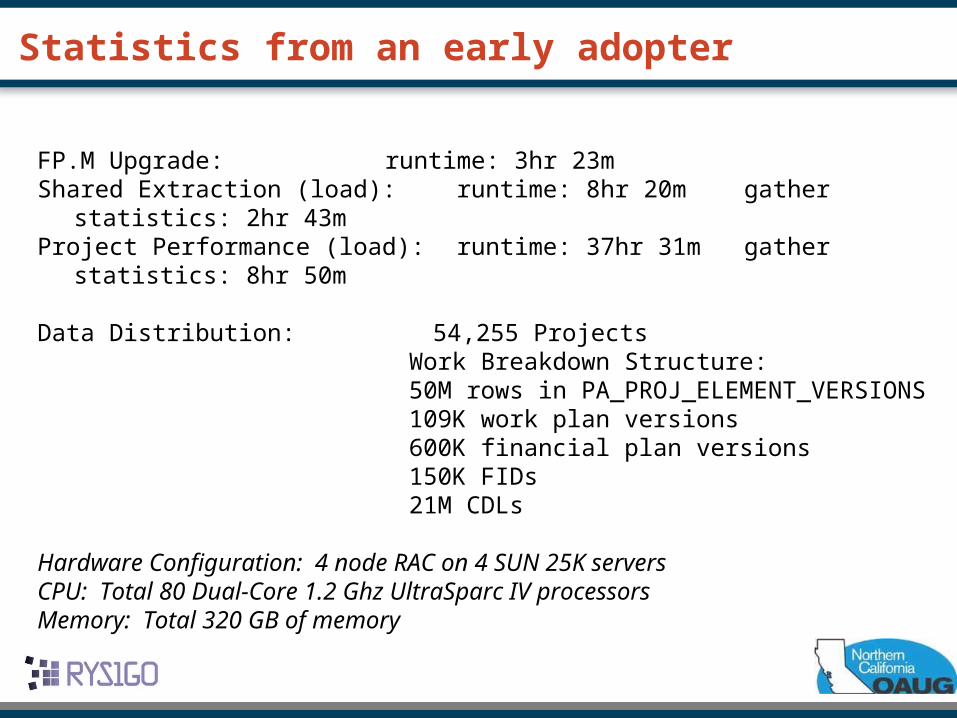
FP.M Upgrade: runtime: 3hr 23mShared Extraction (load): runtime: 8hr 20m gather statistics: 2hr 43mProject Performance (load): runtime: 37hr 31m gather statistics: 8hr 50m
Data Distribution: 54,255 ProjectsWork Breakdown Structure:50M rows in PA_PROJ_ELEMENT_VERSIONS109K work plan versions600K financial plan versions150K FIDs21M CDLs
Hardware Configuration: 4 node RAC on 4 SUN 25K serversCPU: Total 80 Dual-Core 1.2 Ghz UltraSparc IV processorsMemory: Total 320 GB of memory
Statistics from an early adopter
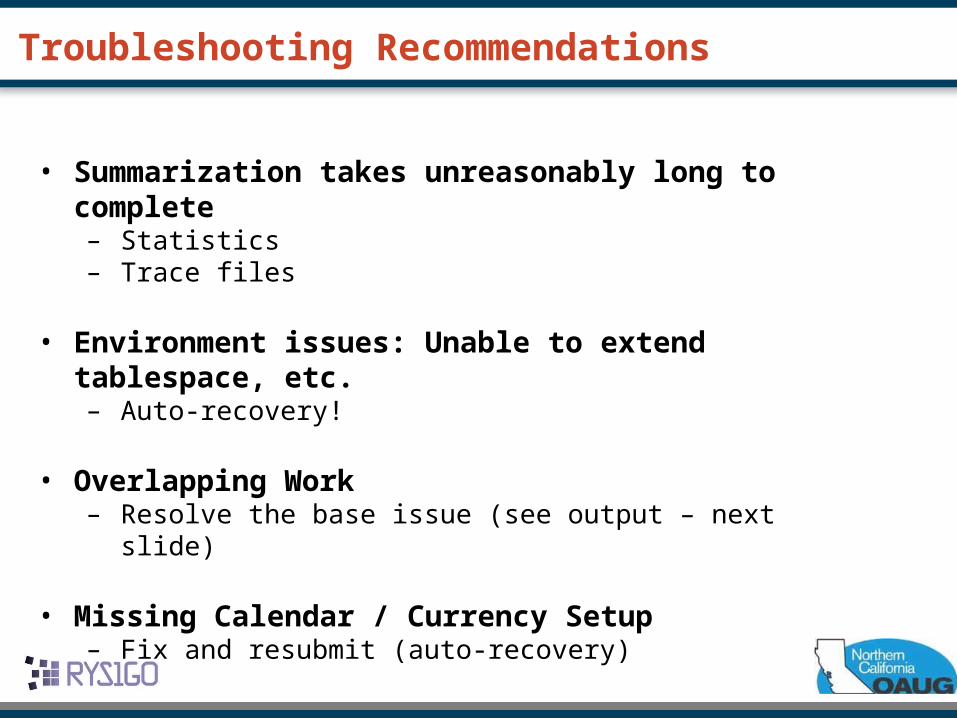
• Summarization takes unreasonably long to complete– Statistics– Trace files
• Environment issues: Unable to extend tablespace, etc.– Auto-recovery!
• Overlapping Work– Resolve the base issue (see output – next slide)
• Missing Calendar / Currency Setup– Fix and resubmit (auto-recovery)
Troubleshooting Recommendations
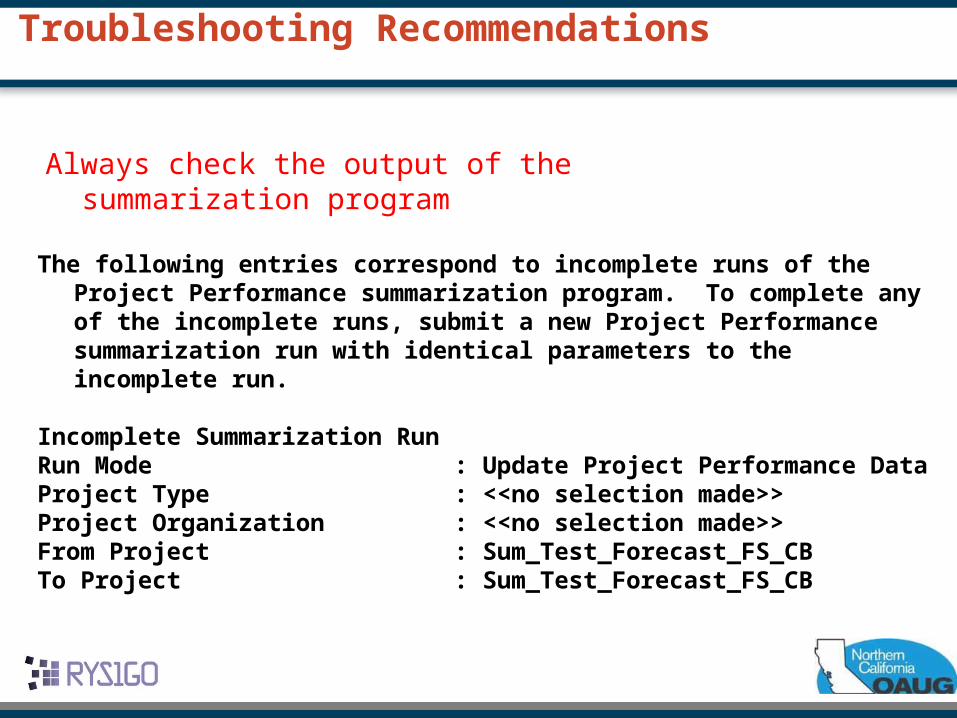
The following entries correspond to incomplete runs of the Project Performance summarization program. To complete any of the incomplete runs, submit a new Project Performance summarization run with identical parameters to the incomplete run.
Incomplete Summarization RunRun Mode : Update Project Performance DataProject Type : <<no selection made>>Project Organization : <<no selection made>>From Project : Sum_Test_Forecast_FS_CBTo Project : Sum_Test_Forecast_FS_CB
Always check the output of the summarization program
Troubleshooting Recommendations
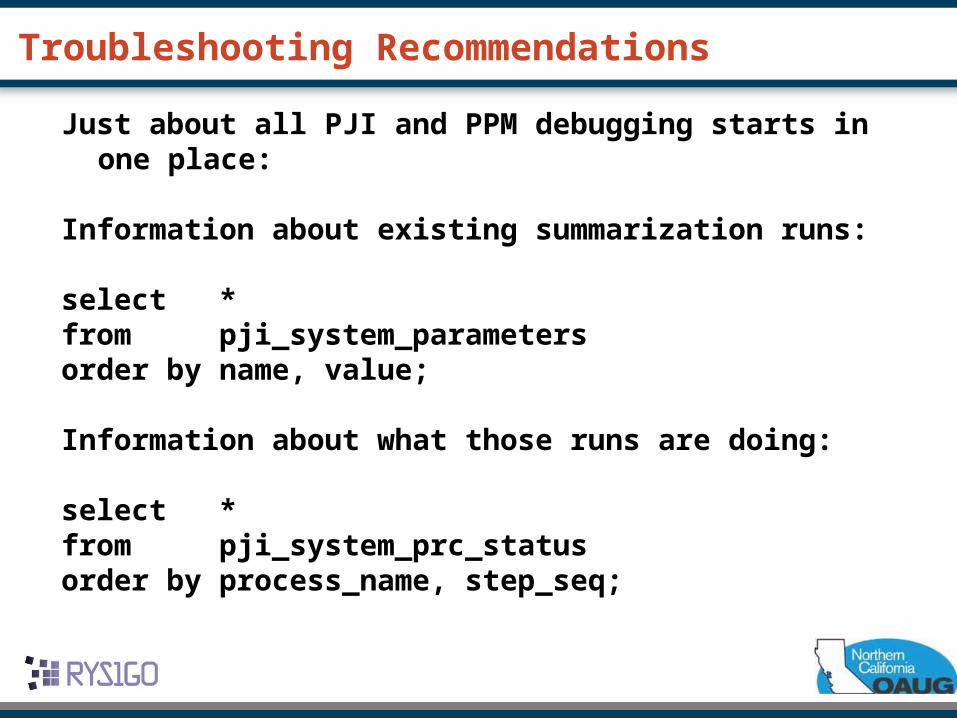
Just about all PJI and PPM debugging starts in one place:
Information about existing summarization runs:
select *from pji_system_parametersorder by name, value;
Information about what those runs are doing:
select *from pji_system_prc_statusorder by process_name, step_seq;
Troubleshooting Recommendations
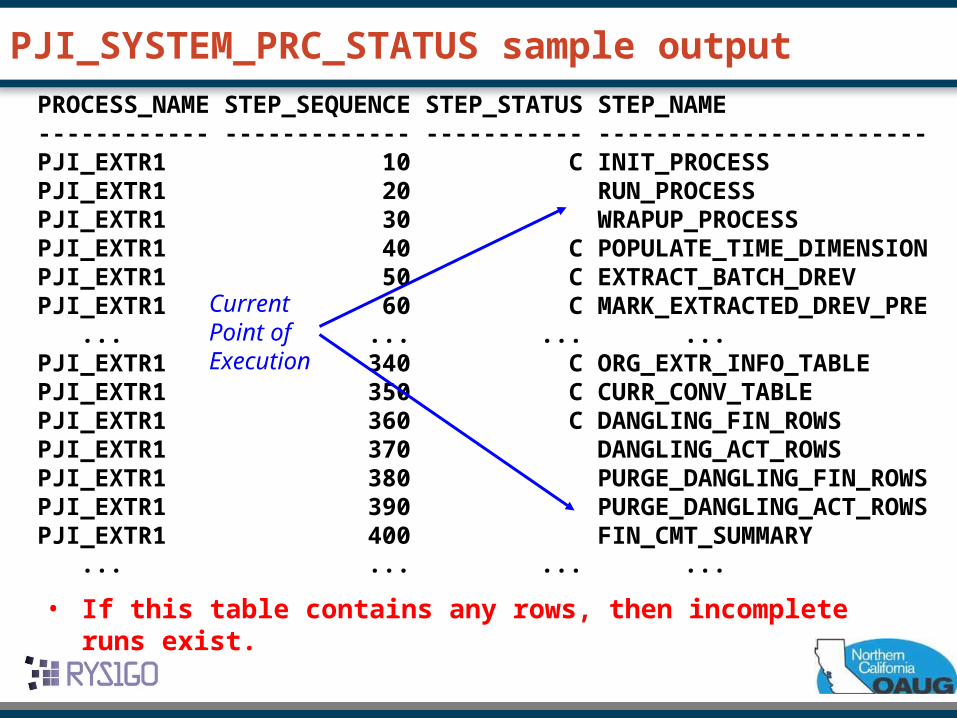
PROCESS_NAME STEP_SEQUENCE STEP_STATUS STEP_NAME------------ ------------- ----------- -----------------------PJI_EXTR1 10 C INIT_PROCESSPJI_EXTR1 20 RUN_PROCESSPJI_EXTR1 30 WRAPUP_PROCESSPJI_EXTR1 40 C POPULATE_TIME_DIMENSIONPJI_EXTR1 50 C EXTRACT_BATCH_DREVPJI_EXTR1 60 C MARK_EXTRACTED_DREV_PRE ... ... ... ...PJI_EXTR1 340 C ORG_EXTR_INFO_TABLEPJI_EXTR1 350 C CURR_CONV_TABLEPJI_EXTR1 360 C DANGLING_FIN_ROWSPJI_EXTR1 370 DANGLING_ACT_ROWSPJI_EXTR1 380 PURGE_DANGLING_FIN_ROWSPJI_EXTR1 390 PURGE_DANGLING_ACT_ROWSPJI_EXTR1 400 FIN_CMT_SUMMARY ... ... ... ...
Current Point of Execution
• If this table contains any rows, then incomplete runs exist.
PJI_SYSTEM_PRC_STATUS sample output
Project Performance Reporting Enhancements
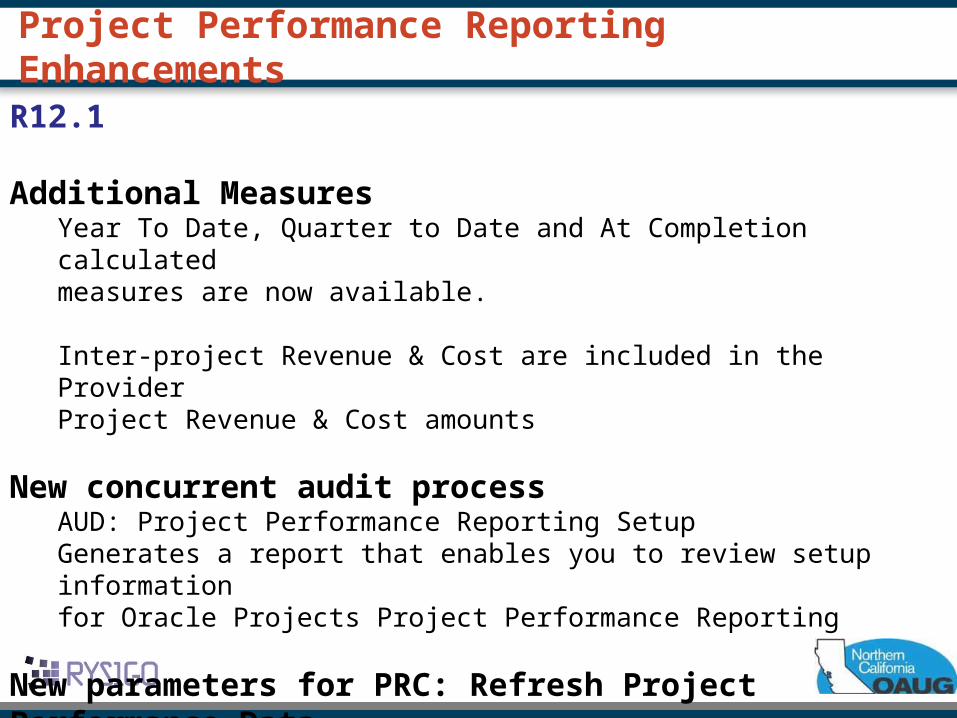
R12.1
Additional MeasuresYear To Date, Quarter to Date and At Completion calculated measures are now available.
Inter-project Revenue & Cost are included in the Provider Project Revenue & Cost amounts
New concurrent audit process AUD: Project Performance Reporting Setup Generates a report that enables you to review setup information for Oracle Projects Project Performance Reporting
New parameters for PRC: Refresh Project Performance Data
Project Performance Reporting Enhancements
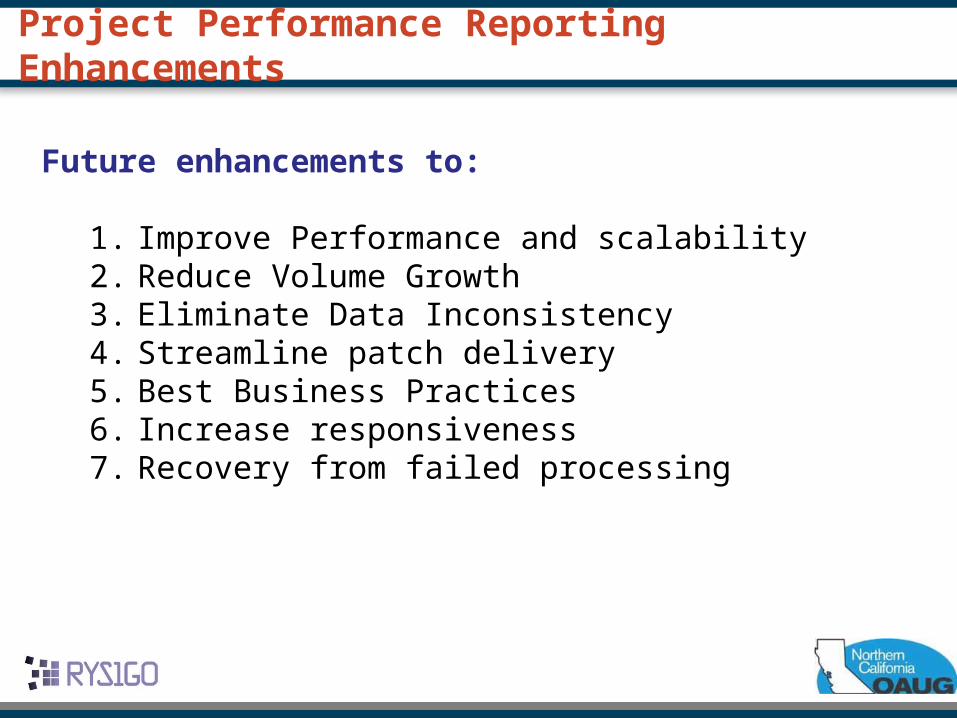
Future enhancements to:
1. Improve Performance and scalability2. Reduce Volume Growth3. Eliminate Data Inconsistency4. Streamline patch delivery 5. Best Business Practices6. Increase responsiveness7. Recovery from failed processing


![Al-Maqsood (Feb-2013) [Urdu]](https://img.pdfslide.us/doc/110x75/577cdd7c1a28ab9e78ad1ea5/al-maqsood-feb-2013-urdu.jpg)


![Al-Maqsood (Apr-2013) [Urdu]](https://img.pdfslide.us/doc/110x75/577cdd7c1a28ab9e78ad1ea4/al-maqsood-apr-2013-urdu.jpg)