Embed Size (px)
Citation preview
1
Nonresidential Construction and the Texas Business Cycle
Publication 2126
The Takeaway
The nonresidential construction cycle is different from the Texas economy’s peaks and troughs. This research is the first step in defining the turning points in nonresidential construction.
Luis B. Torres and Harold D. HuntMarch 24, 2016
Cycles of over- and undersupply in commercial real estate (CRE) have occurred on numerous occasions. In the 1980s, commercial construc-
tion boomed in Texas, fueled by oil prices and tax laws, resulting in a massive oversupply of commercial space. This created serious problems for financial institutions.
Construction of commercial buildings, particularly of-fice buildings, has always been cyclical in nature. The lags between conception and completion pose a criti-cal problem. Because buildings can take several years to complete, economic conditions when a commercial building is delivered may be quite different from those prevailing at the start. To gain perspective on current and future commercial real estate markets it is important to look at historical experience and analyze CRE alongside the business cycle.
Recently, concern has been rising about the health of the Texas commercial real estate market in the face of declining oil prices and their impact on the regional
economy. Approximately 77 percent of total nonresi-dential construction values are concentrated in the Texas Triangle, which comprises the state’s major metropolitan statistical areas (MSAs): Austin-Round Rock, Dallas-Fort Worth-Arlington (DFW), Houston-The Woodlands-Sugar Land, and San Antonio-New Braunfels. This article uses the term “commercial” to refer to total nonresidential construction, which includes a wide range of property types from office buildings to hotels, hos-pitals, and public sector development. The variations in regional industry mix can lead to different economic and commercial real estate market outcomes.
2
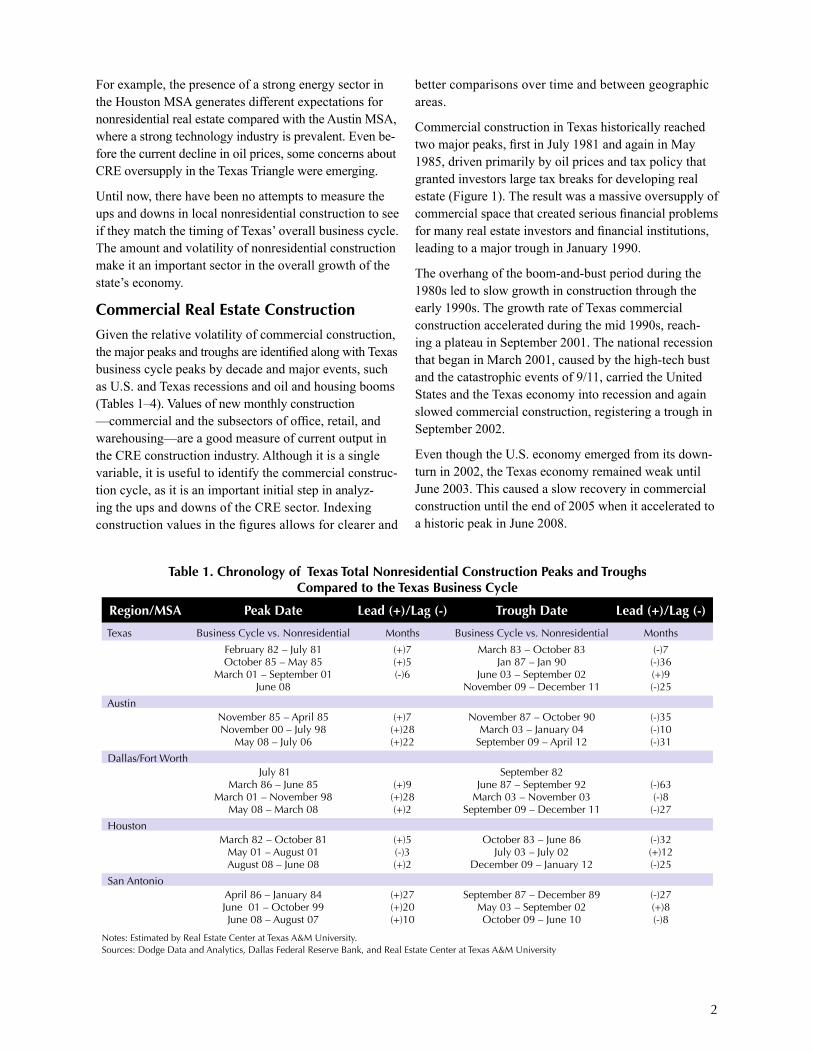
For example, the presence of a strong energy sector in the Houston MSA generates different expectations for nonresidential real estate compared with the Austin MSA, where a strong technology industry is prevalent. Even be-fore the current decline in oil prices, some concerns about CRE oversupply in the Texas Triangle were emerging.
Until now, there have been no attempts to measure the ups and downs in local nonresidential construction to see if they match the timing of Texas’ overall business cycle. The amount and volatility of nonresidential construction make it an important sector in the overall growth of the state’s economy.
Commercial Real Estate Construction
Given the relative volatility of commercial construction, the major peaks and troughs are identified along with Texas business cycle peaks by decade and major events, such as U.S. and Texas recessions and oil and housing booms (Tables 1–4). Values of new monthly construction —commercial and the subsectors of office, retail, and warehousing—are a good measure of current output in the CRE construction industry. Although it is a single variable, it is useful to identify the commercial construc-tion cycle, as it is an important initial step in analyz-ing the ups and downs of the CRE sector. Indexing construction values in the figures allows for clearer and
better comparisons over time and between geographic areas.
Commercial construction in Texas historically reached two major peaks, first in July 1981 and again in May 1985, driven primarily by oil prices and tax policy that granted investors large tax breaks for developing real estate (Figure 1). The result was a massive oversupply of commercial space that created serious financial problems for many real estate investors and financial institutions, leading to a major trough in January 1990.
The overhang of the boom-and-bust period during the 1980s led to slow growth in construction through the early 1990s. The growth rate of Texas commercial construction accelerated during the mid 1990s, reach-ing a plateau in September 2001. The national recession that began in March 2001, caused by the high-tech bust and the catastrophic events of 9/11, carried the United States and the Texas economy into recession and again slowed commercial construction, registering a trough in September 2002.
Even though the U.S. economy emerged from its down-turn in 2002, the Texas economy remained weak until June 2003. This caused a slow recovery in commercial construction until the end of 2005 when it accelerated to a historic peak in June 2008.
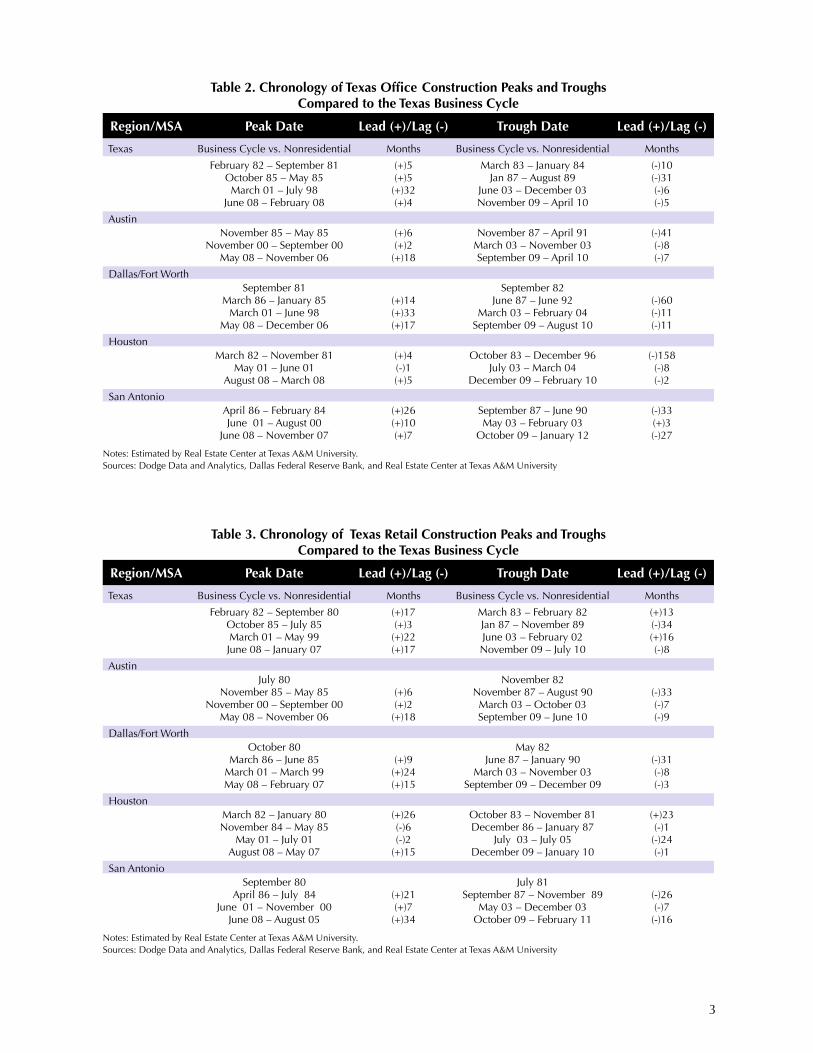
Table 1. Chronology of Texas Total Nonresidential Construction Peaks and Troughs Compared to the Texas Business Cycle
Region/MSA Peak Date Lead (+)/Lag (-) Trough Date Lead (+)/Lag (-)
Texas Business Cycle vs. Nonresidential Months Business Cycle vs. Nonresidential Months
February 82 – July 81 (+)7 March 83 – October 83 (-)7October 85 – May 85 (+)5 Jan 87 – Jan 90 (-)36
March 01 – September 01 (-)6 June 03 – September 02 (+)9June 08 November 09 – December 11 (-)25
AustinNovember 85 – April 85 (+)7 November 87 – October 90 (-)35November 00 – July 98 (+)28 March 03 – January 04 (-)10
May 08 – July 06 (+)22 September 09 – April 12 (-)31
Dallas/Fort Worth July 81 September 82
March 86 – June 85 (+)9 June 87 – September 92 (-)63March 01 – November 98 (+)28 March 03 – November 03 (-)8
May 08 – March 08 (+)2 September 09 – December 11 (-)27
Houston March 82 – October 81 (+)5 October 83 – June 86 (-)32
May 01 – August 01 (-)3 July 03 – July 02 (+)12August 08 – June 08 (+)2 December 09 – January 12 (-)25
San AntonioApril 86 – January 84 (+)27 September 87 – December 89 (-)27June 01 – October 99 (+)20 May 03 – September 02 (+)8
June 08 – August 07 (+)10 October 09 – June 10 (-)8
Notes: Estimated by Real Estate Center at Texas A&M University.Sources: Dodge Data and Analytics, Dallas Federal Reserve Bank, and Real Estate Center at Texas A&M University
3
Table 2. Chronology of Texas Office Construction Peaks and Troughs Compared to the Texas Business Cycle
Region/MSA Peak Date Lead (+)/Lag (-) Trough Date Lead (+)/Lag (-)
Texas Business Cycle vs. Nonresidential Months Business Cycle vs. Nonresidential Months
February 82 – September 81 (+)5 March 83 – January 84 (-)10October 85 – May 85 (+)5 Jan 87 – August 89 (-)31March 01 – July 98 (+)32 June 03 – December 03 (-)6
June 08 – February 08 (+)4 November 09 – April 10 (-)5
AustinNovember 85 – May 85 (+)6 November 87 – April 91 (-)41
November 00 – September 00 (+)2 March 03 – November 03 (-)8May 08 – November 06 (+)18 September 09 – April 10 (-)7
Dallas/Fort WorthSeptember 81 September 82
March 86 – January 85 (+)14 June 87 – June 92 (-)60March 01 – June 98 (+)33 March 03 – February 04 (-)11
May 08 – December 06 (+)17 September 09 – August 10 (-)11
Houston March 82 – November 81 (+)4 October 83 – December 96 (-)158
May 01 – June 01 (-)1 July 03 – March 04 (-)8August 08 – March 08 (+)5 December 09 – February 10 (-)2
San AntonioApril 86 – February 84 (+)26 September 87 – June 90 (-)33June 01 – August 00 (+)10 May 03 – February 03 (+)3
June 08 – November 07 (+)7 October 09 – January 12 (-)27
Notes: Estimated by Real Estate Center at Texas A&M University.Sources: Dodge Data and Analytics, Dallas Federal Reserve Bank, and Real Estate Center at Texas A&M University
Table 3. Chronology of Texas Retail Construction Peaks and Troughs Compared to the Texas Business Cycle
Region/MSA Peak Date Lead (+)/Lag (-) Trough Date Lead (+)/Lag (-)
Texas Business Cycle vs. Nonresidential Months Business Cycle vs. Nonresidential Months
February 82 – September 80 (+)17 March 83 – February 82 (+)13October 85 – July 85 (+)3 Jan 87 – November 89 (-)34March 01 – May 99 (+)22 June 03 – February 02 (+)16June 08 – January 07 (+)17 November 09 – July 10 (-)8
AustinJuly 80 November 82
November 85 – May 85 (+)6 November 87 – August 90 (-)33November 00 – September 00 (+)2 March 03 – October 03 (-)7
May 08 – November 06 (+)18 September 09 – June 10 (-)9
Dallas/Fort WorthOctober 80 May 82
March 86 – June 85 (+)9 June 87 – January 90 (-)31March 01 – March 99 (+)24 March 03 – November 03 (-)8May 08 – February 07 (+)15 September 09 – December 09 (-)3
Houston March 82 – January 80 (+)26 October 83 – November 81 (+)23November 84 – May 85 (-)6 December 86 – January 87 (-)1
May 01 – July 01 (-)2 July 03 – July 05 (-)24August 08 – May 07 (+)15 December 09 – January 10 (-)1
San AntonioSeptember 80 July 81
April 86 – July 84 (+)21 September 87 – November 89 (-)26June 01 – November 00 (+)7 May 03 – December 03 (-)7
June 08 – August 05 (+)34 October 09 – February 11 (-)16
Notes: Estimated by Real Estate Center at Texas A&M University.Sources: Dodge Data and Analytics, Dallas Federal Reserve Bank, and Real Estate Center at Texas A&M University

4
As the financial crisis cast a shadow over commercial real estate, the following three years saw demand for office, retail, and warehouse space wither, increasing vacancy rates and lowering rents. The lack of commer-cial real estate lending paralleled the residential market. As a result, commercial construction dropped sharply, reaching a trough in December 2011.
In the aftermath of the Great Recession, the Texas econ-omy outperformed the nation, primarily due to strong energy and technology sectors. This led to a recovery in commercial construction that peaked in December 2014, about the time oil prices began their sharp decline. The slowdown of the Texas economy caused the rate of com-mercial construction to decline during 2015.
Commercial construction volatility by major Texas MSA varies with the size and diversity of the local economy. This becomes obvious when comparing commercial construction at the state level to the major MSAs.
Significant volatility differences exist between the state and the major markets as well as among the major mar-kets themselves. Austin and San Antonio display more
volatility than Houston and DFW given the smaller size of their economies. Austin’s economy remains largely driven by technology and state government, while the Houston economy remains a global energy center.
In contrast, the DFW economy is more highly correlated to the U.S. economy. San Antonio depends heavily on tourism and federal government employment, mainly through local military bases and a wide variety of pri-vate and public entities that support them.
Ups and Downs in Nonresidential Commercial Construction
The differences in the composition of the four major Texas MSAs resulted in differences in local growth rates in total nonresidential construction. Austin registered the biggest average annual inflation-adjusted growth rate of 13.7 percent from January 1981 to November 2015, followed by San Antonio with 6.7 percent. Houston and DFW registered 4.6 percent and 4.0 percent annual growth, respectively. The state registered an average annual growth rate of 2.6 percent (Table 5). Together, the four MSAs produced, on average, 73.4 percent of all
Table 4. Chronology of Texas Warehouse Construction Peaks and Troughs Compared to the Texas Business Cycle
Region/MSA Peak Date Lead (+)/Lag (-) Trough Date Lead (+)/Lag (-)
Texas Business Cycle vs. Nonresidential Months Business Cycle vs. Nonresidential Months
February 82 – April 81 (+) 10 March 83 – May 83 (-)2October 85 – September 85 (+)1 Jan 87 – April 93 (-)75
December 96 September 97March 01 – January 01 (+)2 June 03 – July 04 (-)13
June 08 – June 07 (+)12 November 09 – October 10 (-)11
AustinJune 81 March 82
November 85 – October 85 (+)1 November 87 – May 92 (-)54May 95 April 96
November 00 – March 99 (+)20 March 03 – June 06 (-)39May 08 – June 08 (-)1 September 09 – May 09 (+)4
Dallas/Fort WorthJanuary 80 November 82
March 86 – October 85 (+)5 June 87 – October 92 (-)64December 96 October 97
March 01 – November 00 (+)4 March 03 – February 04 (-)11May 08 – April 07 (+)13 September 09 – October 10 (-)13
Houston March 82 – March 81 (+)12 October 83
November 84 – March 85 (-)4 December 86 – January 87 (-)1May 01 – June 01 (-)1 July 03 – July 05 (-)24
August 08 – June 08 (+)2 December 09 – January 10 (-)1
San AntonioApril 86 – December 85 (+)4 September 87 – October 90 (-)37
September 91 September 93June 01 – May 98 (+)37 May 03 – April 02 (+)13
June 08 – October 07 (+)8 October 09 – February 11 (-)16
Notes: Estimated by Real Estate Center at Texas A&M University.Sources: Dodge Data and Analytics, Dallas Federal Reserve Bank, and Real Estate Center at Texas A&M University
5
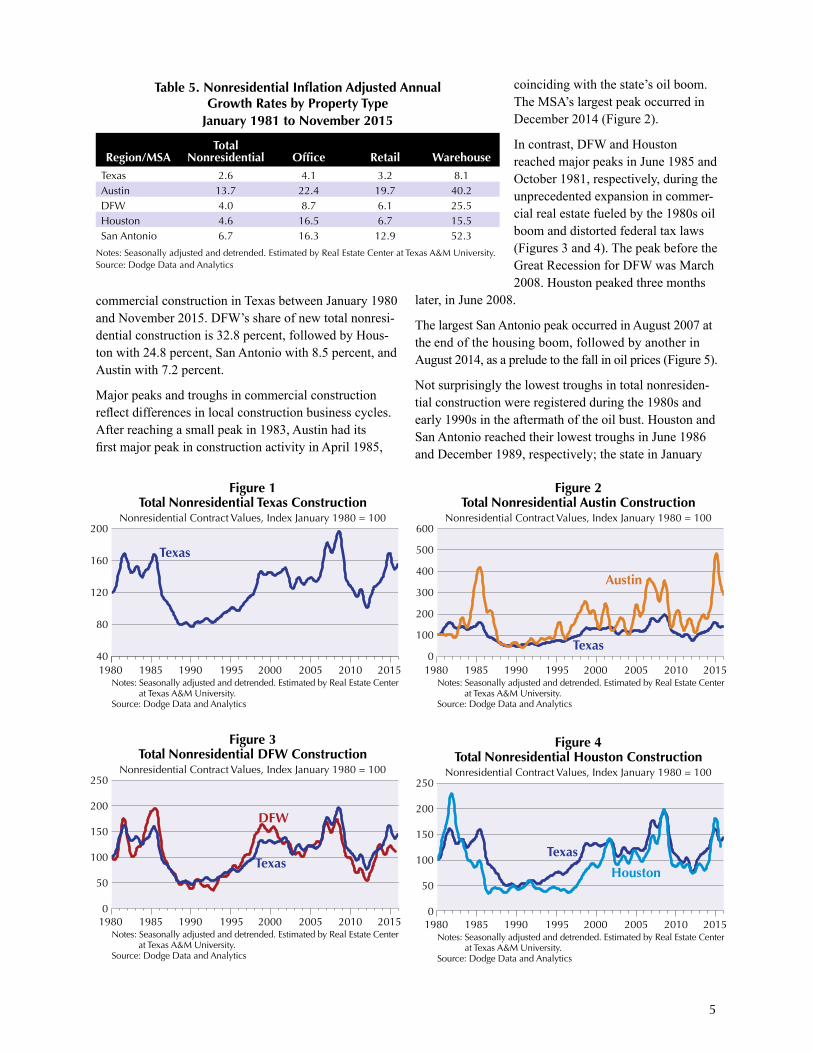
commercial construction in Texas between January 1980 and November 2015. DFW’s share of new total nonresi-dential construction is 32.8 percent, followed by Hous-ton with 24.8 percent, San Antonio with 8.5 percent, and Austin with 7.2 percent.
Major peaks and troughs in commercial construction reflect differences in local construction business cycles. After reaching a small peak in 1983, Austin had its first major peak in construction activity in April 1985,
coinciding with the state’s oil boom. The MSA’s largest peak occurred in December 2014 (Figure 2).
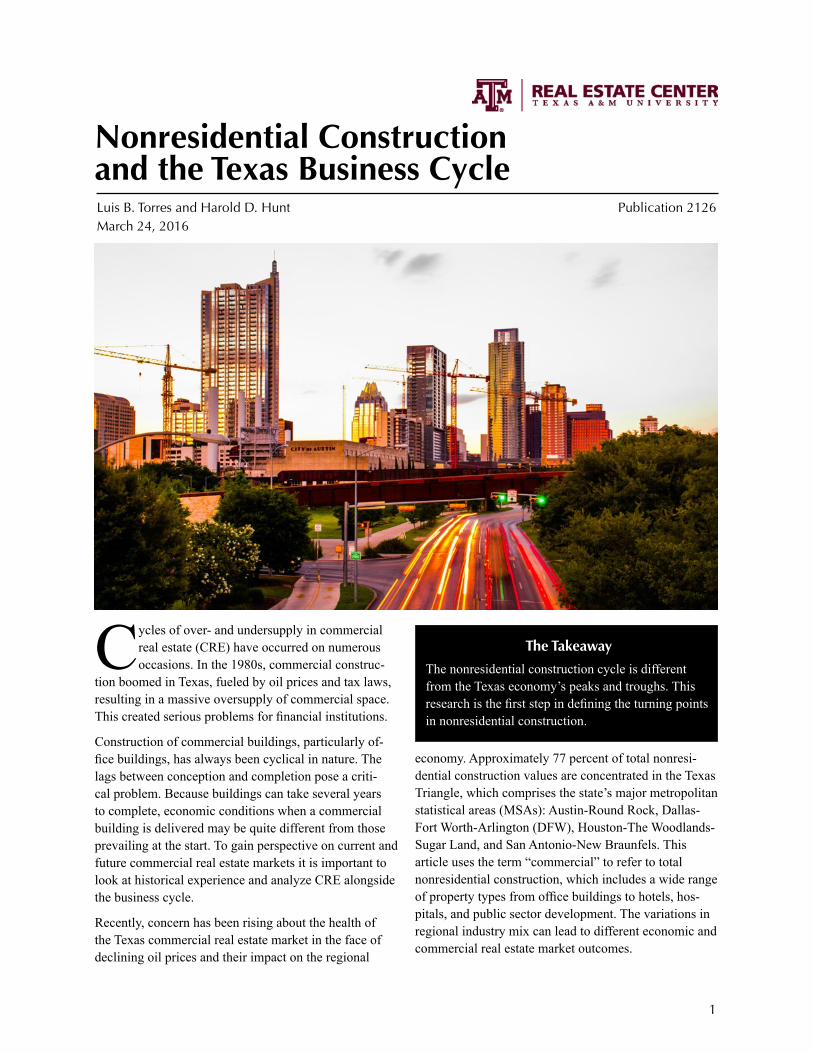
In contrast, DFW and Houston reached major peaks in June 1985 and October 1981, respectively, during the unprecedented expansion in commer-cial real estate fueled by the 1980s oil boom and distorted federal tax laws (Figures 3 and 4). The peak before the Great Recession for DFW was March 2008. Houston peaked three months
later, in June 2008.
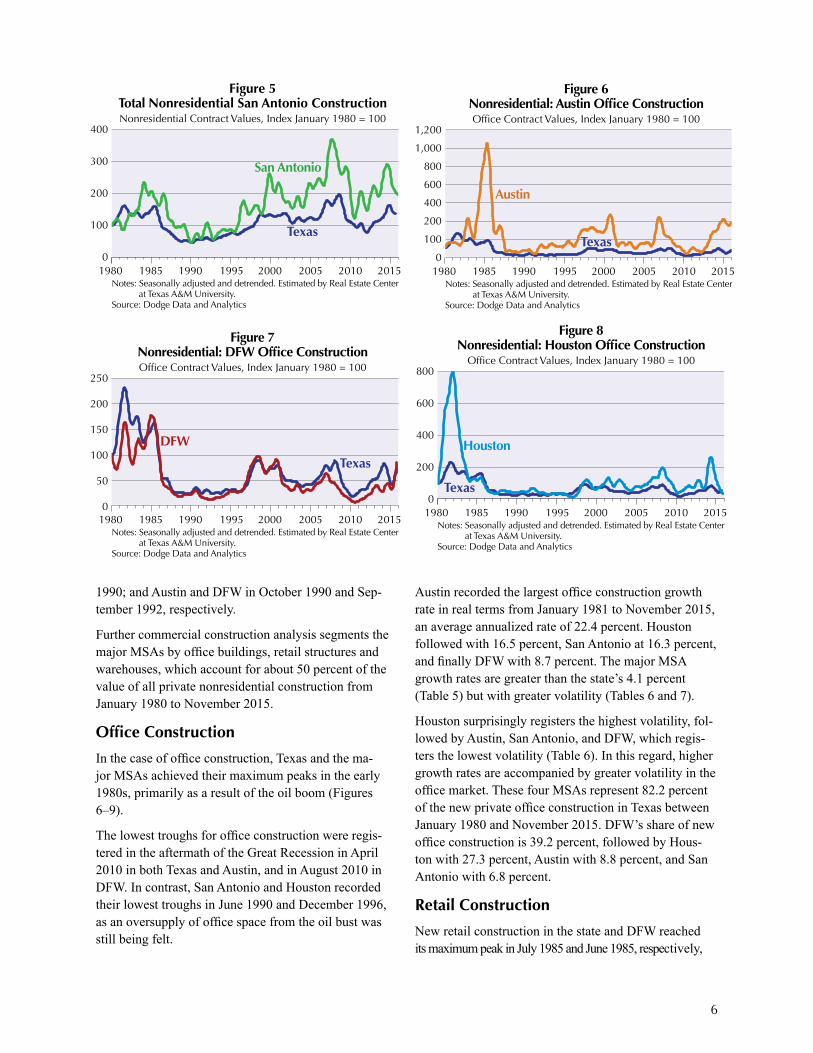
The largest San Antonio peak occurred in August 2007 at the end of the housing boom, followed by another in August 2014, as a prelude to the fall in oil prices (Figure 5).
Not surprisingly the lowest troughs in total nonresiden-tial construction were registered during the 1980s and early 1990s in the aftermath of the oil bust. Houston and San Antonio reached their lowest troughs in June 1986 and December 1989, respectively; the state in January
200
160
120
80
40
Figure 1Total Nonresidential Texas Construction
Nonresidential Contract Values, Index January 1980 = 100
Texas
Notes: Seasonally adjusted and detrended. Estimated by Real Estate Center at Texas A&M University.Source: Dodge Data and Analytics
1980 1985 1990 1995 2000 2005 2010 2015 1980 1985 1990 1995 2000 2005 2010 2015
600
500
400
300
200
100
0
Figure 2Total Nonresidential Austin Construction
Nonresidential Contract Values, Index January 1980 = 100
Texas
Austin
Notes: Seasonally adjusted and detrended. Estimated by Real Estate Center at Texas A&M University.Source: Dodge Data and Analytics
Table 5. Nonresidential Inflation Adjusted Annual Growth Rates by Property Type
January 1981 to November 2015
Region/MSA
Total Nonresidential
Office
Retail
Warehouse
Texas 2.6 4.1 3.2 8.1Austin 13.7 22.4 19.7 40.2DFW 4.0 8.7 6.1 25.5Houston 4.6 16.5 6.7 15.5San Antonio 6.7 16.3 12.9 52.3
Notes: Seasonally adjusted and detrended. Estimated by Real Estate Center at Texas A&M University.Source: Dodge Data and Analytics
1980 1985 1990 1995 2000 2005 2010 2015
250
200
150
100
50
0
Figure 3Total Nonresidential DFW Construction
Nonresidential Contract Values, Index January 1980 = 100
Texas
DFW
Notes: Seasonally adjusted and detrended. Estimated by Real Estate Center at Texas A&M University.Source: Dodge Data and Analytics
1980 1985 1990 1995 2000 2005 2010 2015
250
200
150
100
50
0
Figure 4Total Nonresidential Houston Construction
Nonresidential Contract Values, Index January 1980 = 100
Texas
Houston
Notes: Seasonally adjusted and detrended. Estimated by Real Estate Center at Texas A&M University.Source: Dodge Data and Analytics
6
1990; and Austin and DFW in October 1990 and Sep-tember 1992, respectively.
Further commercial construction analysis segments the major MSAs by office buildings, retail structures and warehouses, which account for about 50 percent of the value of all private nonresidential construction from January 1980 to November 2015.
Office Construction
In the case of office construction, Texas and the ma-jor MSAs achieved their maximum peaks in the early 1980s, primarily as a result of the oil boom (Figures 6–9).
The lowest troughs for office construction were regis-tered in the aftermath of the Great Recession in April 2010 in both Texas and Austin, and in August 2010 in DFW. In contrast, San Antonio and Houston recorded their lowest troughs in June 1990 and December 1996, as an oversupply of office space from the oil bust was still being felt.
1980 1985 1990 1995 2000 2005 2010 2015
400
300
200
100
0
Figure 5Total Nonresidential San Antonio ConstructionNonresidential Contract Values, Index January 1980 = 100
Texas
San Antonio
Notes: Seasonally adjusted and detrended. Estimated by Real Estate Center at Texas A&M University.Source: Dodge Data and Analytics
1980 1985 1990 1995 2000 2005 2010 2015
1,200
1,000
800
600
400
200
100
0
Figure 6Nonresidential: Austin Office ConstructionOffice Contract Values, Index January 1980 = 100
Texas
Austin
Notes: Seasonally adjusted and detrended. Estimated by Real Estate Center at Texas A&M University.Source: Dodge Data and Analytics
1980 1985 1990 1995 2000 2005 2010 2015
250
200
150
100
50
0
Figure 7Nonresidential: DFW Office ConstructionOffice Contract Values, Index January 1980 = 100
Texas
DFW
Notes: Seasonally adjusted and detrended. Estimated by Real Estate Center at Texas A&M University.Source: Dodge Data and Analytics
1980 1985 1990 1995 2000 2005 2010 2015
800
600
400
200
0
Figure 8Nonresidential: Houston Office Construction
Office Contract Values, Index January 1980 = 100
Texas
Houston
Notes: Seasonally adjusted and detrended. Estimated by Real Estate Center at Texas A&M University.Source: Dodge Data and Analytics
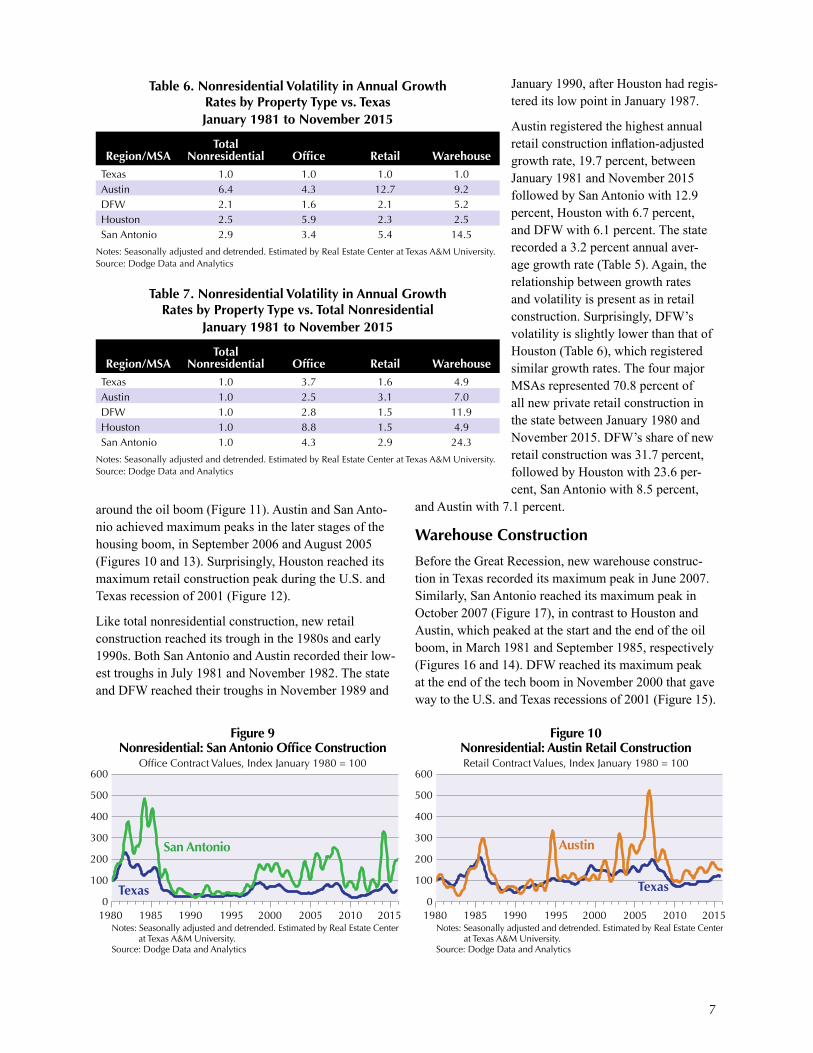
Austin recorded the largest office construction growth rate in real terms from January 1981 to November 2015, an average annualized rate of 22.4 percent. Houston followed with 16.5 percent, San Antonio at 16.3 percent, and finally DFW with 8.7 percent. The major MSA growth rates are greater than the state’s 4.1 percent (Table 5) but with greater volatility (Tables 6 and 7).
Houston surprisingly registers the highest volatility, fol-lowed by Austin, San Antonio, and DFW, which regis-ters the lowest volatility (Table 6). In this regard, higher growth rates are accompanied by greater volatility in the office market. These four MSAs represent 82.2 percent of the new private office construction in Texas between January 1980 and November 2015. DFW’s share of new office construction is 39.2 percent, followed by Hous-ton with 27.3 percent, Austin with 8.8 percent, and San Antonio with 6.8 percent.
Retail Construction
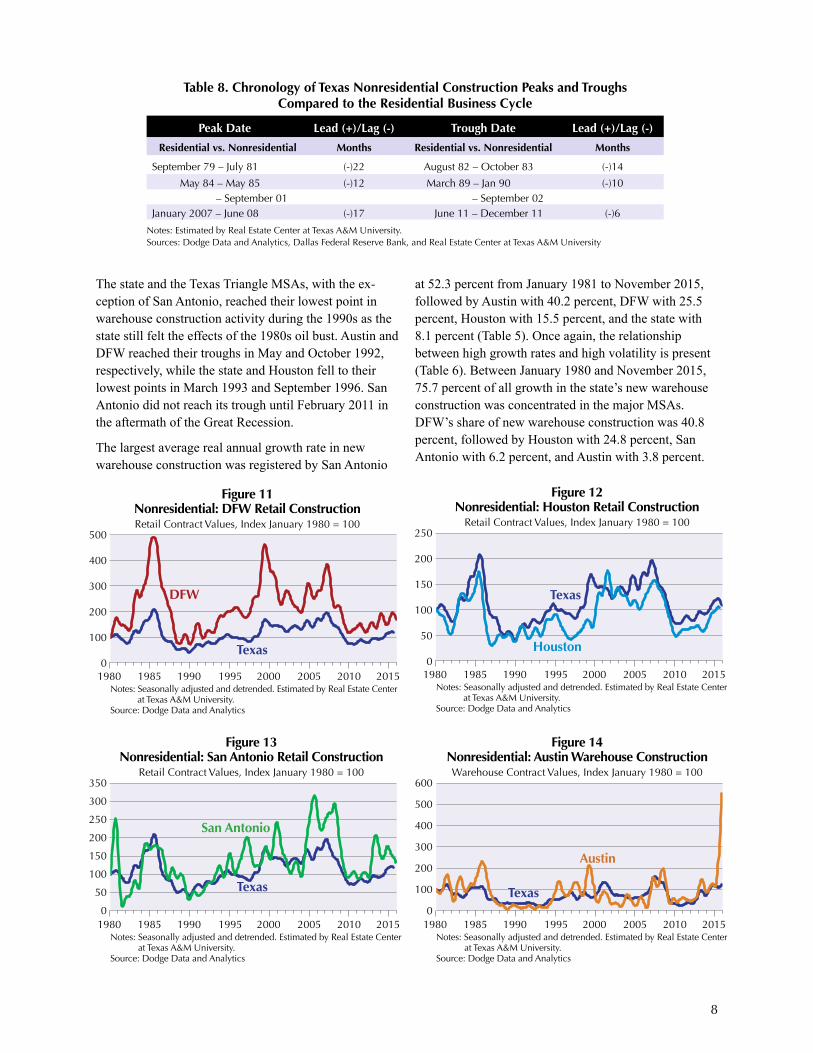
New retail construction in the state and DFW reached its maximum peak in July 1985 and June 1985, respectively,
7
around the oil boom (Figure 11). Austin and San Anto-nio achieved maximum peaks in the later stages of the housing boom, in September 2006 and August 2005 (Figures 10 and 13). Surprisingly, Houston reached its maximum retail construction peak during the U.S. and Texas recession of 2001 (Figure 12).
Like total nonresidential construction, new retail construction reached its trough in the 1980s and early 1990s. Both San Antonio and Austin recorded their low-est troughs in July 1981 and November 1982. The state and DFW reached their troughs in November 1989 and
Table 6. Nonresidential Volatility in Annual Growth Rates by Property Type vs. TexasJanuary 1981 to November 2015
Region/MSA
Total Nonresidential
Office
Retail
Warehouse
Texas 1.0 1.0 1.0 1.0Austin 6.4 4.3 12.7 9.2DFW 2.1 1.6 2.1 5.2Houston 2.5 5.9 2.3 2.5San Antonio 2.9 3.4 5.4 14.5
Notes: Seasonally adjusted and detrended. Estimated by Real Estate Center at Texas A&M University.Source: Dodge Data and Analytics
Table 7. Nonresidential Volatility in Annual Growth Rates by Property Type vs. Total Nonresidential
January 1981 to November 2015
Region/MSA
Total Nonresidential
Office
Retail
Warehouse
Texas 1.0 3.7 1.6 4.9Austin 1.0 2.5 3.1 7.0DFW 1.0 2.8 1.5 11.9Houston 1.0 8.8 1.5 4.9San Antonio 1.0 4.3 2.9 24.3
Notes: Seasonally adjusted and detrended. Estimated by Real Estate Center at Texas A&M University.Source: Dodge Data and Analytics
January 1990, after Houston had regis-tered its low point in January 1987.
Austin registered the highest annual retail construction inflation-adjusted growth rate, 19.7 percent, between January 1981 and November 2015 followed by San Antonio with 12.9 percent, Houston with 6.7 percent, and DFW with 6.1 percent. The state recorded a 3.2 percent annual aver-age growth rate (Table 5). Again, the relationship between growth rates and volatility is present as in retail construction. Surprisingly, DFW’s volatility is slightly lower than that of Houston (Table 6), which registered similar growth rates. The four major MSAs represented 70.8 percent of all new private retail construction in the state between January 1980 and November 2015. DFW’s share of new retail construction was 31.7 percent, followed by Houston with 23.6 per-cent, San Antonio with 8.5 percent,
and Austin with 7.1 percent.
Warehouse Construction
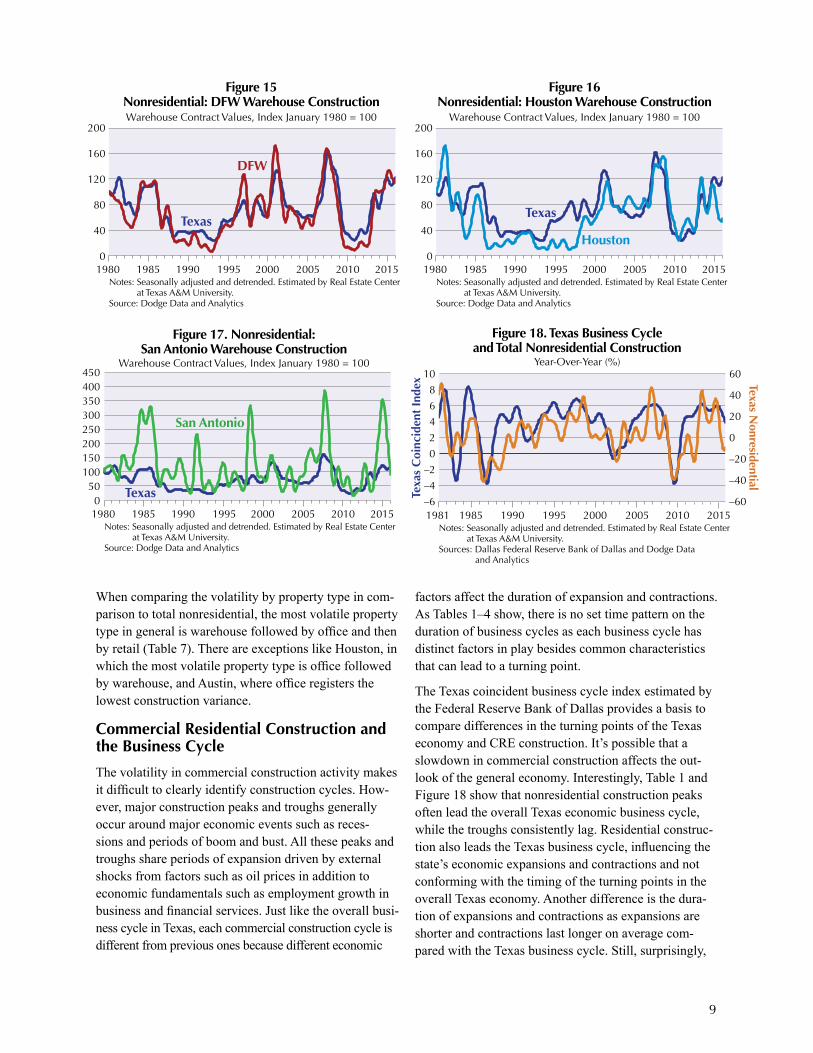
Before the Great Recession, new warehouse construc-tion in Texas recorded its maximum peak in June 2007. Similarly, San Antonio reached its maximum peak in October 2007 (Figure 17), in contrast to Houston and Austin, which peaked at the start and the end of the oil boom, in March 1981 and September 1985, respectively (Figures 16 and 14). DFW reached its maximum peak at the end of the tech boom in November 2000 that gave way to the U.S. and Texas recessions of 2001 (Figure 15).
1980 1985 1990 1995 2000 2005 2010 2015
600
500
400
300
200
100
0
Figure 9Nonresidential: San Antonio Office Construction
Office Contract Values, Index January 1980 = 100
Texas
San Antonio
Notes: Seasonally adjusted and detrended. Estimated by Real Estate Center at Texas A&M University.Source: Dodge Data and Analytics
1980 1985 1990 1995 2000 2005 2010 2015
600
500
400
300
200
100
0
Figure 10Nonresidential: Austin Retail ConstructionRetail Contract Values, Index January 1980 = 100
Texas
Austin
Notes: Seasonally adjusted and detrended. Estimated by Real Estate Center at Texas A&M University.Source: Dodge Data and Analytics
8
The state and the Texas Triangle MSAs, with the ex-ception of San Antonio, reached their lowest point in warehouse construction activity during the 1990s as the state still felt the effects of the 1980s oil bust. Austin and DFW reached their troughs in May and October 1992, respectively, while the state and Houston fell to their lowest points in March 1993 and September 1996. San Antonio did not reach its trough until February 2011 in the aftermath of the Great Recession.
The largest average real annual growth rate in new warehouse construction was registered by San Antonio
Table 8. Chronology of Texas Nonresidential Construction Peaks and Troughs Compared to the Residential Business Cycle
Peak Date Lead (+)/Lag (-) Trough Date Lead (+)/Lag (-)
Residential vs. Nonresidential Months Residential vs. Nonresidential Months
September 79 – July 81 (-)22 August 82 – October 83 (-)14
May 84 – May 85 (-)12 March 89 – Jan 90 (-)10 – September 01 – September 02
January 2007 – June 08 (-)17 June 11 – December 11 (-)6
Notes: Estimated by Real Estate Center at Texas A&M University. Sources: Dodge Data and Analytics, Dallas Federal Reserve Bank, and Real Estate Center at Texas A&M University
at 52.3 percent from January 1981 to November 2015, followed by Austin with 40.2 percent, DFW with 25.5 percent, Houston with 15.5 percent, and the state with 8.1 percent (Table 5). Once again, the relationship between high growth rates and high volatility is present (Table 6). Between January 1980 and November 2015, 75.7 percent of all growth in the state’s new warehouse construction was concentrated in the major MSAs. DFW’s share of new warehouse construction was 40.8 percent, followed by Houston with 24.8 percent, San Antonio with 6.2 percent, and Austin with 3.8 percent.
1980 1985 1990 1995 2000 2005 2010 2015
500
400
300
200
100
0
Figure 11Nonresidential: DFW Retail ConstructionRetail Contract Values, Index January 1980 = 100
Texas
DFW
Notes: Seasonally adjusted and detrended. Estimated by Real Estate Center at Texas A&M University.Source: Dodge Data and Analytics
1980 1985 1990 1995 2000 2005 2010 2015
250
200
150
100
50
0
Figure 12Nonresidential: Houston Retail Construction
Retail Contract Values, Index January 1980 = 100
Texas
Houston
Notes: Seasonally adjusted and detrended. Estimated by Real Estate Center at Texas A&M University.Source: Dodge Data and Analytics
1980 1985 1990 1995 2000 2005 2010 2015
350
300
250
200
150
100
50
0
Figure 13Nonresidential: San Antonio Retail Construction
Retail Contract Values, Index January 1980 = 100
Texas
San Antonio
Notes: Seasonally adjusted and detrended. Estimated by Real Estate Center at Texas A&M University.Source: Dodge Data and Analytics
1980 1985 1990 1995 2000 2005 2010 2015
600
500
400
300
200
100
0
Figure 14Nonresidential: Austin Warehouse ConstructionWarehouse Contract Values, Index January 1980 = 100
Texas
Austin
Notes: Seasonally adjusted and detrended. Estimated by Real Estate Center at Texas A&M University.Source: Dodge Data and Analytics
9
When comparing the volatility by property type in com-parison to total nonresidential, the most volatile property type in general is warehouse followed by office and then by retail (Table 7). There are exceptions like Houston, in which the most volatile property type is office followed by warehouse, and Austin, where office registers the lowest construction variance.
Commercial Residential Construction and the Business Cycle
The volatility in commercial construction activity makes it difficult to clearly identify construction cycles. How-ever, major construction peaks and troughs generally occur around major economic events such as reces-sions and periods of boom and bust. All these peaks and troughs share periods of expansion driven by external shocks from factors such as oil prices in addition to economic fundamentals such as employment growth in business and financial services. Just like the overall busi-ness cycle in Texas, each commercial construction cycle is different from previous ones because different economic
factors affect the duration of expansion and contractions. As Tables 1–4 show, there is no set time pattern on the duration of business cycles as each business cycle has distinct factors in play besides common characteristics that can lead to a turning point.
The Texas coincident business cycle index estimated by the Federal Reserve Bank of Dallas provides a basis to compare differences in the turning points of the Texas economy and CRE construction. It’s possible that a slowdown in commercial construction affects the out-look of the general economy. Interestingly, Table 1 and Figure 18 show that nonresidential construction peaks often lead the overall Texas economic business cycle, while the troughs consistently lag. Residential construc-tion also leads the Texas business cycle, influencing the state’s economic expansions and contractions and not conforming with the timing of the turning points in the overall Texas economy. Another difference is the dura-tion of expansions and contractions as expansions are shorter and contractions last longer on average com-pared with the Texas business cycle. Still, surprisingly,
1980 1985 1990 1995 2000 2005 2010 2015
200
160
120
80
40
0
Figure 15Nonresidential: DFW Warehouse ConstructionWarehouse Contract Values, Index January 1980 = 100
Texas
DFW
Notes: Seasonally adjusted and detrended. Estimated by Real Estate Center at Texas A&M University.Source: Dodge Data and Analytics
1980 1985 1990 1995 2000 2005 2010 2015
200
160
120
80
40
0
Figure 16Nonresidential: Houston Warehouse Construction
Warehouse Contract Values, Index January 1980 = 100
Texas
Houston
Notes: Seasonally adjusted and detrended. Estimated by Real Estate Center at Texas A&M University.Source: Dodge Data and Analytics
1980 1985 1990 1995 2000 2005 2010 2015
Figure 17. Nonresidential:San Antonio Warehouse Construction
Warehouse Contract Values, Index January 1980 = 100
Texas
San Antonio
Notes: Seasonally adjusted and detrended. Estimated by Real Estate Center at Texas A&M University.Source: Dodge Data and Analytics
450400350300250200150100
500
1981 1985 1990 1995 2000 2005 2010 2015
10
8
6
4
2
0
–2
–4
–6
60
40
20
0
–20
–40
–60
Figure 18. Texas Business Cycleand Total Nonresidential Construction
Year-Over-Year (%)
Texa
s C
oinc
iden
t In
dex Texas N
onresidential
Notes: Seasonally adjusted and detrended. Estimated by Real Estate Center at Texas A&M University.Sources: Dallas Federal Reserve Bank of Dallas and Dodge Data and Analytics
10
no causal statistical relationship was found between the business cycle and nonresidential construction due to the volatility in the construction data.
A further comparison was conducted using the resi-dential business cycle determined by the Real Estate Center at Texas A&M University and the residential
1981 1985 1990 1995 2000 2005 2010 2015
10
8
6
4
2
0
–2
–4
–6
140120100806040200–20–40–60
Figure 19Texas Business Cycle and Office Construction
Year-Over-Year Change (%)
Texa
s C
oinc
iden
t In
dex
Texas Offi
ce
Notes: Seasonally adjusted and detrended. Estimated by Real Estate Center at Texas A&M University.Sources: Dallas Federal Reserve Bank of Dallas and Dodge Data and Analytics
1981 1985 1990 1995 2000 2005 2010 2015
10
8
6
4
2
0
–2
–4
–6
100
80
60
40
20
0
–20
–40
–60
Figure 20Texas Business Cycle and Retail Construction
Year-Over-Year Change (%)
Texa
s C
oinc
iden
t In
dex
Texas Retail
Notes: Seasonally adjusted and detrended. Estimated by Real Estate Center at Texas A&M University.Sources: Dallas Federal Reserve Bank of Dallas and Dodge Data and Analytics
1981 1985 1990 1995 2000 2005 2010 2015
10
8
6
4
2
0
–2
–4
–6
200
150
100
50
0
–50
–100
Figure 21Texas Business Cycle and Warehousing Construction
Year-Over-Year Change (%)
Texa
s C
oinc
iden
t In
dex
Texas Warehouse
Notes: Seasonally adjusted and detrended. Estimated by Real Estate Center at Texas A&M University.Sources: Dallas Federal Reserve Bank of Dallas and Dodge Data and Analytics
construction index estimated by the Federal Reserve Bank of Dallas and the Center. The comparison revealed that nonresidential construction lags both the peaks and troughs in residential construction (Table 8). In addition, nonresidential construction follows more closely the overall Texas business cycle than residential construc-
tion. This highlights the differences between residential and nonresidential construction, the unevenness and volatility of CRE compared with residential construction and how housing leads the overall business cycle in the economy.
Concluding Remarks
Nonresidential construction in Texas and all four major MSAs declined during 2015 in conjunction with the general slowdown of the Texas economy. This is not surprising because every downturn in state nonresidential construc-tion has been accompanied by a recession or the end of a boom and bust period that has gener-ally lagged the construction cycle. In addition, all nonresidential construction cycles were dissimilar from previous ones due to differing economic conditions. It is too early to tell if the business cycle decline as an overall trend will continue in 2016, but early evidence confirms the Texas economy is slowing.
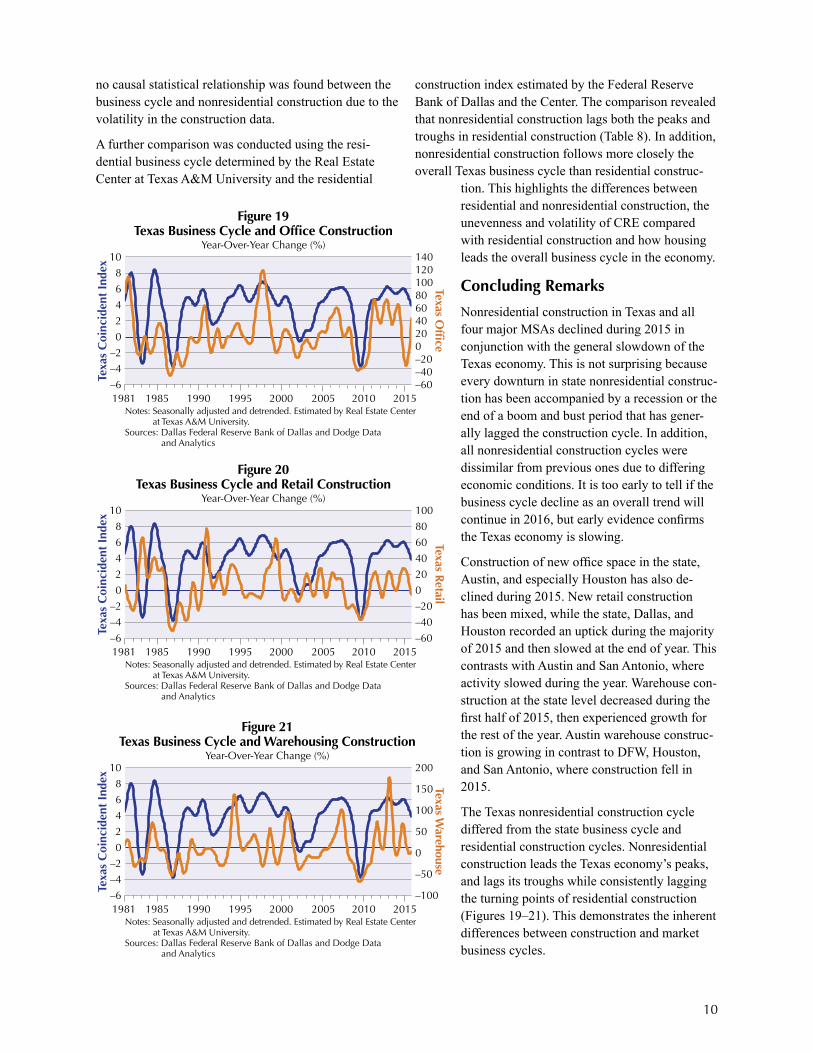
Construction of new office space in the state, Austin, and especially Houston has also de-clined during 2015. New retail construction has been mixed, while the state, Dallas, and Houston recorded an uptick during the majority of 2015 and then slowed at the end of year. This contrasts with Austin and San Antonio, where activity slowed during the year. Warehouse con-struction at the state level decreased during the first half of 2015, then experienced growth for the rest of the year. Austin warehouse construc-tion is growing in contrast to DFW, Houston, and San Antonio, where construction fell in 2015.
The Texas nonresidential construction cycle differed from the state business cycle and residential construction cycles. Nonresidential construction leads the Texas economy’s peaks, and lags its troughs while consistently lagging the turning points of residential construction (Figures 19–21). This demonstrates the inherent differences between construction and market business cycles.
11
© 2016. Real Estate Center. All rights reserved.
The next step will be to look at other variables that may help indicate the turning points in the nonresidential construction business cycle. Once those are identified, researchers can construct a coincident indicator for nonresidential construction to mark precise peaks and troughs in the cycle and thus the timing and length of expansions and recessions. Such an indicator would
resemble the residential construction business cycle estimated by the Federal Reserve Bank of Dallas and the Real Estate Center.____________________
Dr. Torres ([email protected]) and Dr. Hunt ([email protected]) are research economists with the Real Estate Center at Texas A&M University.
Browne, Lynn; Case, Karl. “How the Commercial Real Estate Boom Undid the Banks,” Federal Re-serve Bank of Boston, Conference Series, 1992.
Case, Karl. “The Real Estate Cycle and the Economy: Consequences of the Massachusetts Boom of 1984–87,” Federal Reserve Bank of Boston, New England Economic Review, September/October 1991.
Gaines, Jim; Torres, Luis. “The Dating Game: Texas Housing Construction Cycles,” Real Estate Center at Texas A&M University, Tierra Grande, January 2015.
Garner, Alan. “Is Commercial Real Estate Reliving the 1980s and Early 1990s,” Federal Reserve Bank of Kansas City, Economic Review, Third Quarter 2008.
References