Embed Size (px)
DESCRIPTION
Pushover analysis of a RC Building
Citation preview
San Jose State UniversitySJSU ScholarWorks
Master's Theses Master's Theses and Graduate Research
2010
NONLINEAR PUSHOVER ANALYSIS OF AONE-STORY PRECAST CONCRETECLADDING SYSTEMKai Sum CheungSan Jose State University, [email protected]
This Thesis is brought to you for free and open access by the Master's Theses and Graduate Research at SJSU ScholarWorks. It has been accepted forinclusion in Master's Theses by an authorized administrator of SJSU ScholarWorks. For more information, please contact [email protected].
Recommended CitationCheung, Kai Sum, "NONLINEAR PUSHOVER ANALYSIS OF A ONE-STORY PRECAST CONCRETE CLADDING SYSTEM"(2010). Master's Theses. Paper 3754.http://scholarworks.sjsu.edu/etd_theses/3754

NONLINEAR PUSHOVER ANALYSIS OF A ONE-STORY
PRECAST CONCRETE CLADDING SYSTEM
A Thesis
Presented to
The Faculty of the Department of Civil and Environmental Engineering
San José State University
In Partial Fulfillment
of the Requirements for the Degree
Master of Science
by
Kai Sum Cheung
May 2010

© 2010
Kai Sum Cheung
ALL RIGHTS RESERVED

The Designated Thesis Committee Approves the Thesis Titled
NONLINEAR PUSHOVER ANALYSIS OF A ONE-STORY
PRECAST CONCRETE CLADDING SYSTEM
by Kai Sum Cheung
APPROVED FOR THE DEPARTMENT OF CIVIL AND ENVIRONMENTAL ENGINEERING
SAN JOSÉ STATE UNIVERSITY
May 2010
Dr. Kurt McMullin, Department of Civil and Environmental Engineering Dr. Steven Vukazich Department of Civil and Environmental Engineering Dr. Thalia Anagnos Department of General Engineering
ABSTRACT
NONLINEAR PUSHOVER ANALYSIS OF A ONE-STORY PRECAST CONCRETE CLADDING SYSTEM
by Kai Sum Cheung
A nonlinear pushover analytical study of a precast concrete cladding system was
completed. The analytical software used was SAP2000 (version 11.0.0). The
specimen modeled is the three-dimensional corner of the first floor of a nine-story
building. Thirty-one linear and nonlinear link elements were used to simulate the
cladding connections. The results showed that inelastic behavior of these connections
controls the behavior of the overall cladding system. At drift ratios of 0.0104, closure of
the sliding connections at the top of the column cover panels occurs and resisting forces
climb significantly with small additional lateral displacement. Forces quickly rise to
levels indicating failure of the connections between the column covers and the foundation.
At drift ratios of 0.0111, failure of the foundation connections is expected to occur, likely
leading to instability of the panels.
ACKNOWLEDGEMENTS
The completion of this master thesis is a result of the endless support and guidance
of Dr. Kurt M McMullin. Kurt’s assistances in reviewing my analytical results and
paper, as well as his efforts in encouraging students participate in graduate research, are
deeply appreciated. Appreciation is also due to Dr. Steven Vukazich and Thalia
Anagnos, my thesis committee members, whose comments on my thesis greatly
improved the overall quality of my work. Additional thanks are due to Maggie Ortiz,
whose assistance in understanding the specimen design greatly contributed to this
research.
This material is based upon work supported by the National Science Foundation
under Grant No. 0619157. Any opinions, findings, and conclusions or
recommendations expressed in this material are those of the author and do not necessarily
reflect the views of the National Science Foundation.
v
Table of Contents
List of Tables ix
List of Figures x
List of Symbols xiii
Chapter 1 Introduction
1.1 Damage of Cladding Systems in Past Earthquakes 1
1.2 Research Need 1
1.3 The Pathways Project 2
1.4 Research Goals and Objectives 2
1.5 Background 3
Chapter 2 Literature Review 5
Chapter 3 SAP2000 Model Development
3.1 Computer Model Input Parameters
3.1.1 General Model Description 7
3.1.2 Coordinate Systems 9
3.1.3 Concrete Panels 11
3.1.4 Steel Frame 13
vi
3.1.5 Nonlinear Link Elements 16
3.1.5.1 Push-Pull Connection Elements 21
3.1.5.2 Slotted Connection Elements 25
3.1.5.3 Joint Elements 28
3.1.6 Linear Connections 30
3.1.7 External Reactions 33
3.2 Analysis Protocol
3.2.1 Loading Criteria 35
3.2.2 Analysis Combination 36
3.3 Conducting the Analysis
3.3.1 Model Verification 37
3.3.2 Data Reduction 38
Chapter 4 Analytical Results
4.1 Pushover Curve—First Five Preliminary Analyses 39
4.2 Pushover Curve—Final Analysis 41
4.3 Sequence of Events 43
4.4 Global Torsion of the Specimen 44
4.5 Other Potential Sources of Nonlinear Behavior 45
4.5.1 Panel-to-Foundation Connection (CD1) 46
4.5.2 Slotted Connection (CD6) 48
vii
4.6 Sequence of Events Including Foundation and
Slotted Connection Behavior 49
4.7 Peak Link Force and Displacement 50
Chapter 5 Conclusions and Recommendations 59
5.1 Research Findings 60
5.2 Recommendations for Future Work 61
References 62
viii
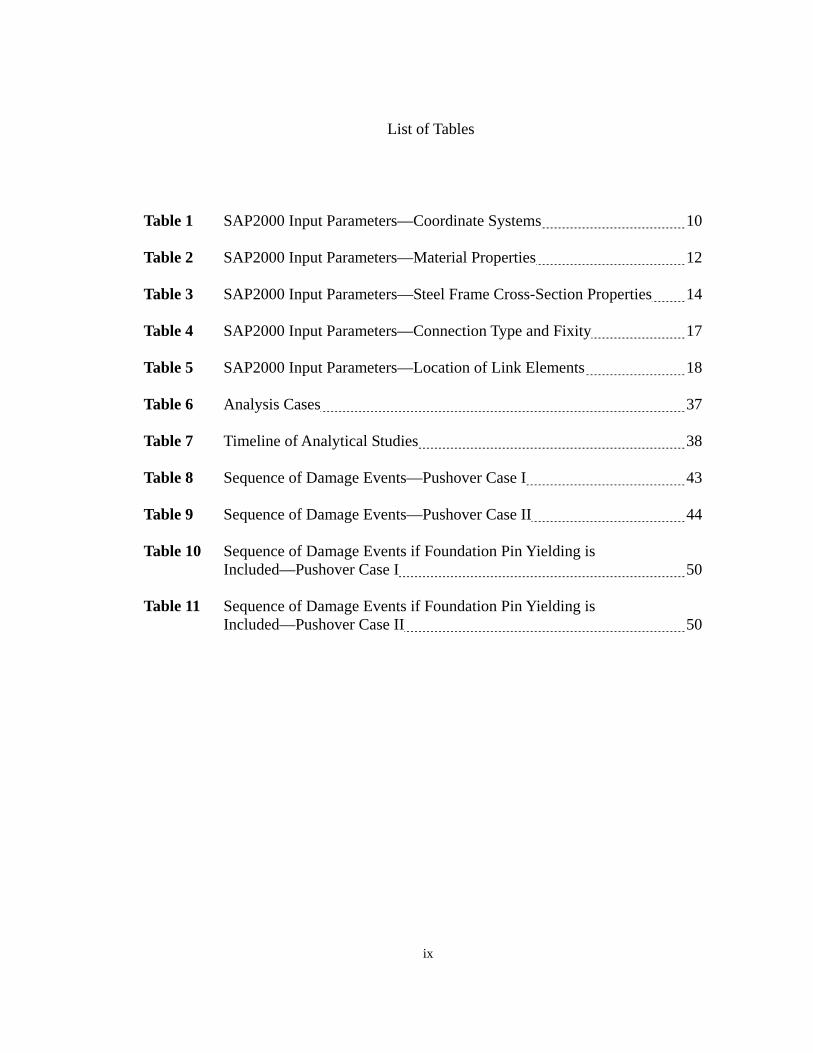
List of Tables Table 1 SAP2000 Input Parameters—Coordinate Systems 10 Table 2 SAP2000 Input Parameters—Material Properties 12 Table 3 SAP2000 Input Parameters—Steel Frame Cross-Section Properties 14 Table 4 SAP2000 Input Parameters—Connection Type and Fixity 17 Table 5 SAP2000 Input Parameters—Location of Link Elements 18 Table 6 Analysis Cases 37 Table 7 Timeline of Analytical Studies 38 Table 8 Sequence of Damage Events—Pushover Case I 43 Table 9 Sequence of Damage Events—Pushover Case II 44 Table 10 Sequence of Damage Events if Foundation Pin Yielding is
Included—Pushover Case I 50 Table 11 Sequence of Damage Events if Foundation Pin Yielding is
Included—Pushover Case II 50
ix

List of Figures Figure 1. 3-D View of the Model 8 Figure 2. The Layout of Cladding Panels in the South and the West Elevations 8 Figure 3. Definition of the Local Coordinate System 11 Figure 4. Dimensions of Column Cover Panels C1, C2, and C5 12 Figure 5. Dimension of Spandrel Panels A2 and A3 13 Figure 6. 3-D View of the Steel Frame 14 Figure 7. Dimension of the Steel Frame—South and West Elevations 15 Figure 8. Dimension of the Steel Frame—Plan View 15 Figure 9. Labels and Locations of the Link Elements 19 Figure 10. Labels and Locations of Panel-to-Panel Nonlinear Connections— Detailed View of Upper Portion of Column Panels C2 and C5 19 Figure 11. Labels and Locations of Panel-to-Panel Nonlinear Connections— Detailed View of Upper Portion of Column Panel C1 20 Figure 12. Labels and Locations of Panel-to-Panel Nonlinear Connections and Linear Foundation Joints—Detailed View of Lower Portion of Column Panels C2 and C5 20 Figure 13. Original Design Detail of Push-Pull Connection CD3.1 22 Figure 14. Original Design Detail of Push-Pull Connection CD4 23 Figure 15. Force-Displacement Relationship of CD3.1 in the U1 Direction (McMullin 2008) 24 Figure 16. Force-Displacement Relationship of CD3.1 and CD4 in the U2 and U3
Directions (McMullin 2008) 24
x

Figure 17. Force-Displacement Relationship of CD4 in the U1 Direction (McMullin 2008) 25 Figure 18. Original Design Detail of Four-Inch Slotted Connection CD6 27 Figure 19. Force-Displacement Relationship of CD6 in the U3 Direction (McMullin 2008) 28 Figure 20. Force-Displacement Relationship of ¾" Gap in the U2 Direction (McMullin 2008) 29 Figure 21. Force-Displacement Relationship of 2" Gap in the U3 Direction (McMullin 2008) 30 Figure 22. Original Design Detail of Bearing Connection CD2 31 Figure 23. Original Design Detail of Lateral Seismic Connection CD7 32 Figure 24. Original Design Detail of Panel-to-Foundation Connection CD1 34 Figure 25. Direction and Target Displacement of the Displacement Load at Node 10 36 Figure 26. Pushover Curves for Model Verification (Case I) 39 Figure 27. Pushover Curves for Model Verification (Case II) 40 Figure 28. Pushover Curve for the Final Analysis (Case I) 42 Figure 29. Pushover Curve for the Final Analysis (Case II) 42 Figure 30. Displacement at the Top of the Three Steel Columns in the Global X and Y Directions 45 Figure 31. Force-Displacement Relationship of the Panel-to-Foundation Pin Element J31 for Case I 47 Figure 32. Force-Displacement Relationship of the Panel-to-Foundation Pin Element J17 for Case II 47 Figure 33. Force-Displacement Relationship of the Slotted Connection 38 for Case I 48
xi

Figure 34. Force-Displacement Relationship of the Slotted Connection 38 for Case II 49 Figure 35. Peak Force and Displacement of ¾" Joints in the U2 Direction for Case I 51 Figure 36. Peak Force and Displacement of 2" Joints in the U2 Direction for Case I 52 Figure 37. Peak Force and Displacement of Slotted Connections in the U3 Direction for Case I 52 Figure 38. Peak Force and Displacement of Push-Pull Connections CD3.1 in the U1 Direction for Case I 53 Figure 39. Peak Force and Displacement of Push-Pull Connections CD4 in the U1 Direction for Case I 53 Figure 40. Peak Force and Displacement of Push-Pull Connections CD3.1 and CD4 in the U2 Direction for Case I 54 Figure 41. Peak Force and Displacement of Push-Pull Connections CD3.1 and CD4 in the U3 Direction for Case I 54 Figure 42. Peak Force and Displacement of ¾" Joints in the U2 Direction for Case II 55 Figure 43. Peak Force and Displacement of 2" Joints in the U2 Direction for Case II 56 Figure 44. Peak Force and Displacement of Slotted Connections in the U3 Direction for Case II 56 Figure 45. Peak Force and Displacement of Push-Pull Connections CD3.1 in the U1 Direction for Case II 57 Figure 46. Peak Force and Displacement of Push-Pull Connections CD4 in the U1 Direction for Case II 57 Figure 47. Peak Force and Displacement of Push-Pull Connections CD3.1 and CD4 in the U2 Direction for Case II 58 Figure 48. Peak Force and Displacement of Push-Pull Connections CD3.1 and CD4 in the U3 Direction for Case II 58
xii

xiii
List of Symbols d local displacement of a link element F local reaction force of a link element k tangent stiffness of the model P global force applied in the nonlinear pushover analysis δ drift ratio of the specimen Δ10 lateral displacement of Node 10

Chapter 1
Introduction
1.1 Damage of Cladding Systems in Past Earthquakes
Cladding damage due to lateral drift of a building during an earthquake is common.
Significant damage has been reported from many earthquakes, including the 1964
Anchorage, 1971 San Fernando, 1976 Friuli, Italy, 1978 Miyagiken-Oki, 1987 Whittier
Narrows, and 1995 Hyogoken-Nambu earthquakes (NIST, 1995). For example, in the
earthquake of Friuli, Italy in 1976, cladding damages were seen in many buildings
(Stratta and Wyllie, 1979). The Gemini Hospital’s tile veneer finish spalled off. For
the Solari Plant and Fanzutto Building, their precast concrete cladding panels fell away
from the buildings.
1.2 Research Need
The cladding damage in past seismic events has resulted in both economic and
safety concerns. The damage was a significant portion of the economic loss. Falling
cladding panels and concrete were threats to people outside of a building. These
concerns have led to many research studies. After the 1985 Mexico City earthquake, for
example, Goodno et al (1989) surveyed 25 buildings with heavy cladding systems. And
after the 1994 Northridge earthquake, National Institute of Standard and Technology
(NIST, 1995) reported that loose and nearly falling concrete cladding panels resulted in a
life-safety risk.
1

1.3 The Pathways Project
The Pathways Project is funded by National Science Foundation (NSF) and the
project goal is to verify if current industry practice related to three common nonstructural
components of commercial buildings in the United States are consistent with the seismic
performance goals of the buildings’ primary structural systems (McMullin et al, 2009).
The three nonstructural components studied are cladding, window wall, and plumbing
systems. As a part of the Pathways Project, the work completed for this thesis was to
analyze a cladding system under a monotonic pushover load using computer analytical
software.
1.4 Research Goals and Objectives
The goal of this thesis work research project was to evaluate the seismic
performance of a precast concrete cladding system. Specific project objectives were:
1. Develop a nonlinear analytical model of the proposed experimental test specimen.
2. Determine the pushover curve of the cladding system for monotonic loading in both
the positive and the negative directions.
3. Identify force-deformation relationships for each of the link connections to define
upper bounds of force and displacement demands for use in determining
experimental test design protocols.
4. List damage events and relate them to the drift of the specimen.
5. Identify potential revisions of the model to allow for more accurate analysis to
quantify additional levels of lateral displacement.
2

1.5 Background
A prototype structure to represent typical commercial real estate building design was
needed to allow the Pathways Project to accurately represent the geometric and structural
requirements of modern architectural design. After the 1994 Northridge earthquake,
three different groups, the Structural Engineers Association of California (SEAOC),
Applied Technology Council (ATC), and California Universities for Research in
Earthquake Engineering (CUREE), initiated the so-called SAC Joint Venture research
program to investigate modern steel frame design issues (Song and Ellingwood, 1999).
One of the products of that initiative was the design of nine different commercial building
configurations for researchers to use as benchmark models. The Pathways Project chose
the SAC LA 9-story configuration to be representative of a significant portion of
commercial office buildings in California. Architectural and structural design
parameters for the building are available in published literature (Bachman et al. 2000).
A complete sub-cladding system was designed for the SAC LA 9-story building (Le,
2006). Preliminary analysis for various story levels of the cladding system in the
nine-story frame was conducted.
In June 2008, the test protocol was revised with the result that the experimental
program would focus on the first floor assembly. This change required a new analytical
model due to the larger interstory height of the first floor. This analytical study is a
companion to the design and detailing of an experimental test specimen described by
McMullin, Ortiz, and Cheung (2009). The test specimen represents the corner assembly
of the façade system for the first floor of the SAC LA nine-story prototype building.
3

The test specimen contains one-story of beam spandrel panels and the column cover
panels from the foundation to the first floor. The earlier research work illustrated the
overall cladding panel system behavior, thus benefiting the current study. However, all
input for the current model was developed as part of this new phase of analysis.
4
Chapter 2
Literature Review
Past analytical studies of cladding systems have been reviewed. Smith and Gaiotti
(1989) performed analytical studies of the interaction of claddings and frames in clad and
unclad building frames. They found that the detailing and construction according to PCI
and CPCI prescriptions did result in interaction occurring between the cladding and frame.
The connections they considered were cantilever steel tube bearing bottom connections
and vertically slotted bolted angle top connections. They showed that the clad frame
could have racking stiffness as high as 35 times the unclad frame with a resulting
reduction in the elastic deflection from 126 mm to 3.6 mm. This increase was the result
of the forward rotation of the panel due to bending of the beam that resulted in a
reversing moment being applied to the beam. They reported beams were placed in
quadruple-curvature bending deformation.
Charney and Harris (1989) report that the traditional method of detailing the sliding
connections for precast cladding is to have the connection resist only vertical and
out-of-plane loads, usually by the use of a horizontal slot in the steel angle used for the
connection. However they report that Palsson et al (1984) found that cladding did
participate in the building behavior, regardless of the original intent of the detailing
engineer. Palsson et al. reported that when cladding was considered in the structural
analysis, the first mode frequency of a 25-story building increased 25% in the
braced-frame direction, 43% in the moment-frame direction, and 83% in the torsional
mode.
5
Goodno and Craig (1989) report that a lack of data on cladding connection behavior
has limited the ability of engineers to develop realistic models for cladding systems. In
addition, they identify that the large variety of cladding and connection configurations
also limits the ability to collect and document such data. The primary objective of their
work was to understand the role of nonstructural cladding and the potential contribution
to the building’s lateral stiffness and damping. They report that assessment of the
cladding stiffness is highly dependent upon the connection performance.
6

Chapter 3
SAP2000 Model Development
3.1 Computer Model Input Parameters
3.1.1 General Model Description
The specimen is the three-dimensional corner of the first floor of the SAC LA
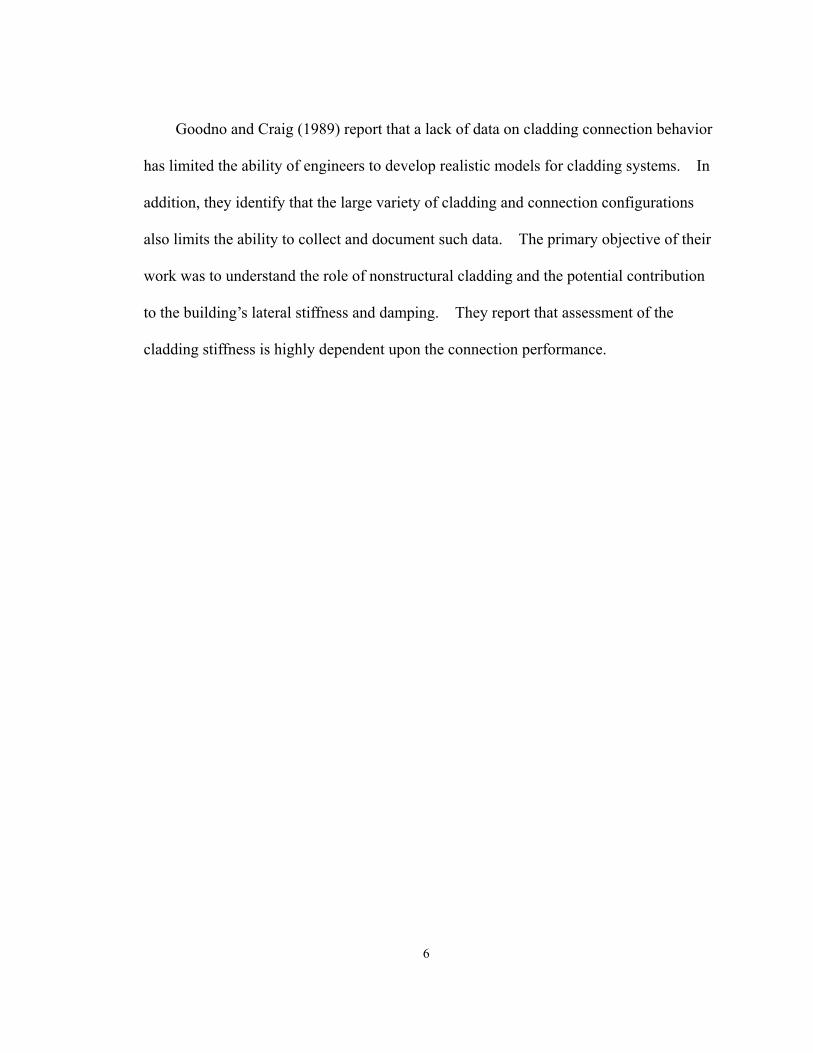
building and is modeled using SAP2000 Version 11.0.0 software. A three-dimensional
view of the model is shown in Figure 1. The specimen includes a steel support frame,
concrete cladding panels, panel-to-panel connections, panel-to-steel connections,
panel-to-foundation connections, and panel-to-panel joints. To simulate the complex
connection detail, supporting cantilever assemblies that connect the panel-to-steel
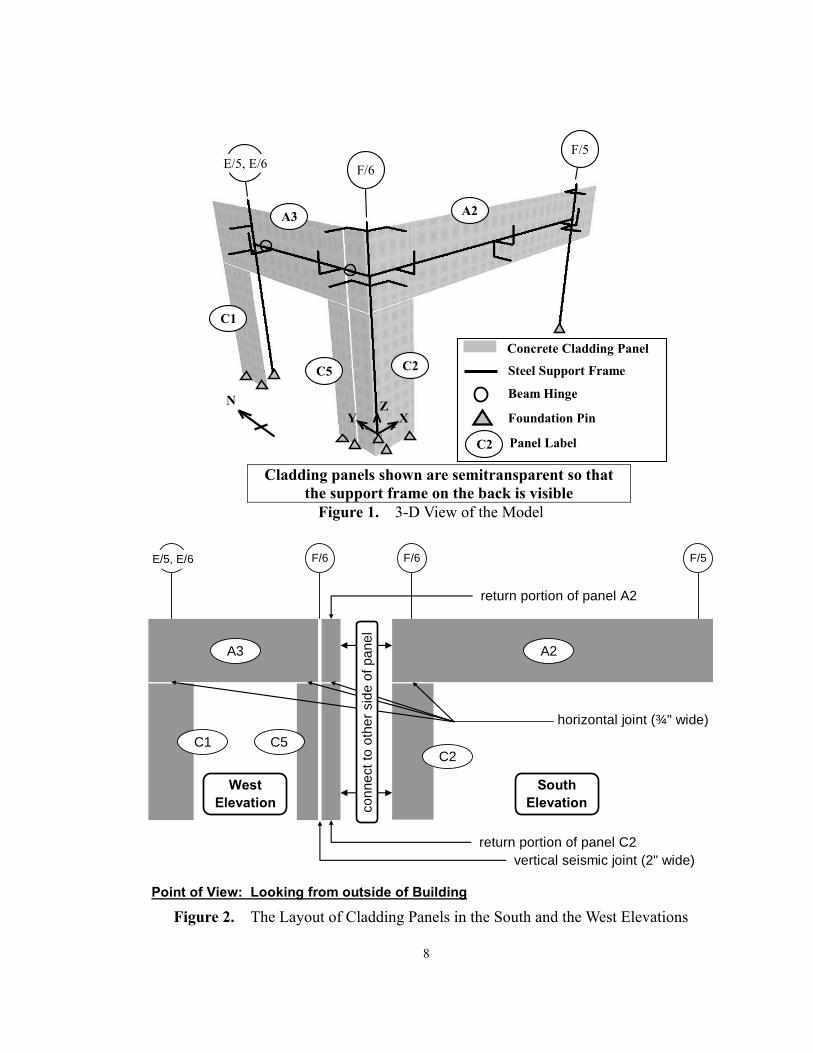
connections to the support frame are included in the analytical model. Figure 2 shows
the layout of the concrete panels in the south and the west elevations. The south
elevation of the model includes the column cover panel C2 and the long spandrel panel
A2; the west elevation of the model includes the return portions of panels A2 and C2,
column cover panels C1, C5, and the short spandrel panel A3.
7
Concrete Cladding Panel
Steel Support Frame
NFoundation Pin
C1
C5 C2
A2A3
Panel Label
F/6
F/5
ZXY
C2
Beam Hinge
E/5, E/6
Cladding panels shown are semitransparent so that
the support frame on the back is visible Figure 1. 3-D View of the Model
SouthElevation
WestElevation
A3 A2
C1
return portion of panel C2
return portion of panel A2
vertical seismic joint (2" wide)
C2C5
con
ne
ct to
oth
er
sid
e o
f pa
ne
l
horizontal joint (¾" wide)
F/6 F/6E/5, E/6 F/5
Point of View: Looking from outside of Building
Figure 2. The Layout of Cladding Panels in the South and the West Elevations
8
Construction joints separate these panels (Figure 2). There are two types of panel
joints—vertical and horizontal joints. Because this subassembly of the cladding
represents the corner of the building, the vertical joint between the return panel and the
adjoining panel, also called the seismic joint, is two inches (2") wide similar to current
industry seismic design requirements. In typical cladding systems, vertical joints not
adjacent to return panels are not required to accomodate seismic deformation and are
only ¾" wide. Similar to commercial building design, vertical joints are centered on the
column grid line. The horizontal joint is three quarters of an inch (¾") wide. The base
of the column cover panel is also ¾" above the foundation to allow for vertical clearance.
The self-weight of the spandrel panels (A2 and A3) is supported by the steel support
frame; the self-weight of the column cover panels (C1, C2, and C5) is supported by
foundation connections modeled as pins, which are free to rotate about all axes.
3.1.2 Coordinate Systems
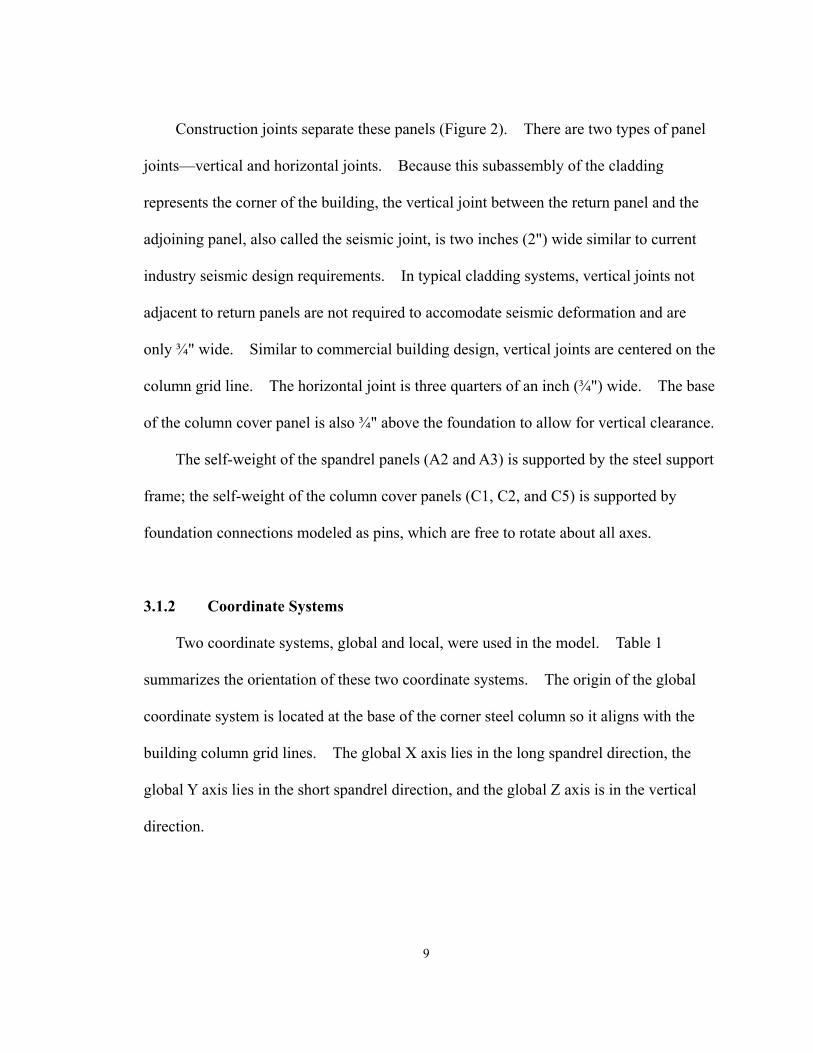
Two coordinate systems, global and local, were used in the model. Table 1
summarizes the orientation of these two coordinate systems. The origin of the global
coordinate system is located at the base of the corner steel column so it aligns with the
building column grid lines. The global X axis lies in the long spandrel direction, the
global Y axis lies in the short spandrel direction, and the global Z axis is in the vertical
direction.
9
Table 1 SAP2000 Input Parameters—Coordinate Systems
Positive Direction
System Origin Location Axis
For Links on Long Spandrel Portion
For Links on Short Spandrel Portion
Global Base of Corner Column
X Y Z
Long Spandrel Direction Short Spandrel Direction Vertical
N/A N/A
Local 1st Joint of Each Link Element
U1 U2 U3
Out-of-Plane Horizontal Vertical In-Plane Horizontal
- Y + Z - X
- X + Z + Y
A local coordinate system is defined for each link element (a panel joint or a steel
connection). Figure 3 shows a typical link element in the model and illustrates the
definition of the local coordinate system. Each link’s local coordinate system origin is
located at the first joint of the link. The local U1 axis is in the horizontal, out-of-plane
direction which lies along the link element and is perpendicular to the face of the
concrete panel. The positive direction of U1 points toward the outside of the building.
So for link elements in the short spandrel portion of the model, the positive direction of
U1 is in the negative X direction; for link elements in the long spandrel portion of the
model, the positive direction of U1 is in the negative Y direction.
The local U2 axis is in the vertical direction, and the upward direction is positive
(same as the global Z axis). The local U3 axis is in the horizontal, in-plane direction
which is parallel to the support steel beam. The positive direction of U3 is determined
by the cross-product of U1 and U2. So for link elements in the short spandrel portion of
10
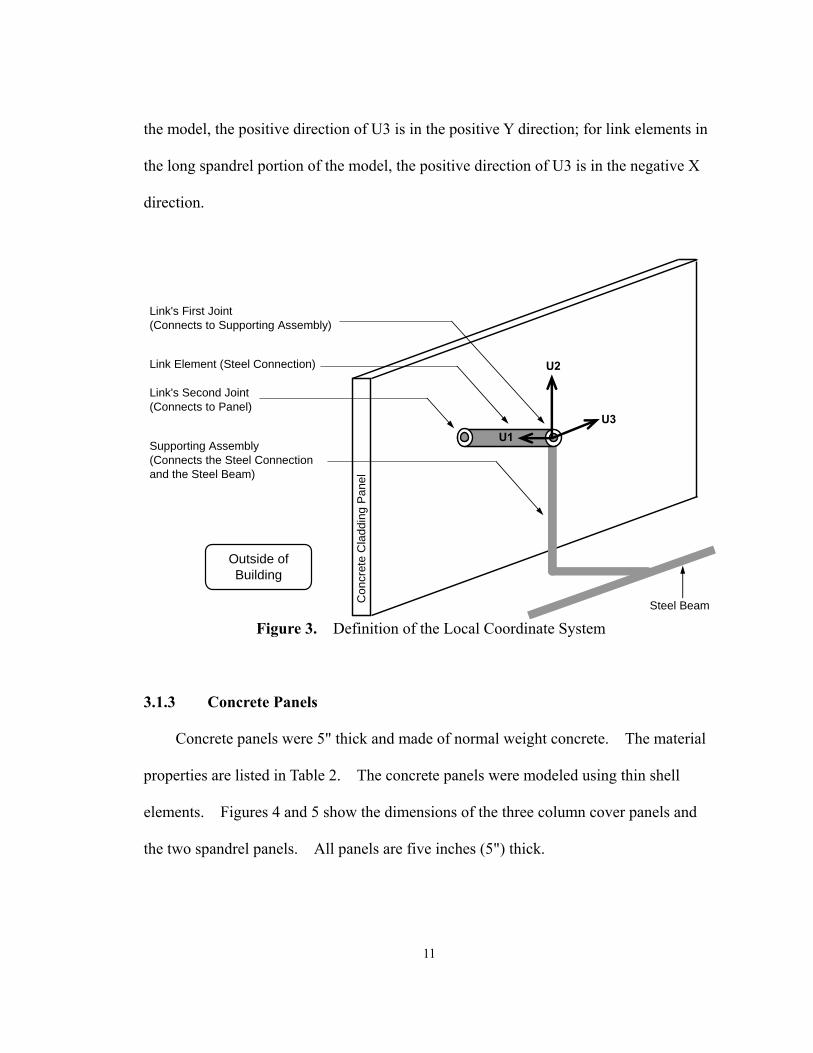
the model, the positive direction of U3 is in the positive Y direction; for link elements in
the long spandrel portion of the model, the positive direction of U3 is in the negative X
direction.
Co
ncre
te C
ladd
ing
Pa
nel
Outside ofBuilding
Link's Second Joint(Connects to Panel)
Supporting Assembly(Connects the Steel Connectionand the Steel Beam)
Link's First Joint(Connects to Supporting Assembly)
Link Element (Steel Connection)
U1
U2
U3
Steel Beam
Figure 3. Definition of the Local Coordinate System
3.1.3 Concrete Panels
Concrete panels were 5" thick and made of normal weight concrete. The material
properties are listed in Table 2. The concrete panels were modeled using thin shell
elements. Figures 4 and 5 show the dimensions of the three column cover panels and
the two spandrel panels. All panels are five inches (5") thick.
11
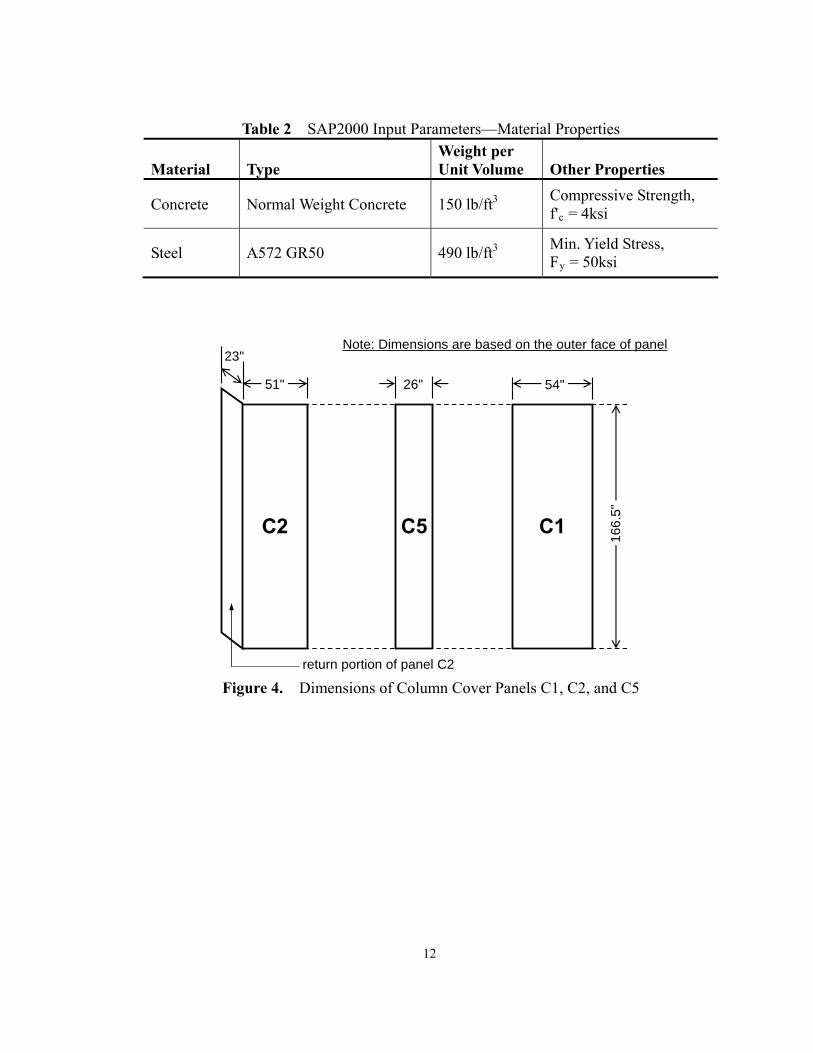
Table 2 SAP2000 Input Parameters—Material Properties
Material Type Weight per Unit Volume Other Properties
Concrete Normal Weight Concrete 150 lb/ft3 Compressive Strength, f'c = 4ksi
Steel A572 GR50 490 lb/ft3 Min. Yield Stress, Fy = 50ksi
C2 C5
26"
23"
51"
Note: Dimensions are based on the outer face of panel
C1
16
6.5
"
54"
return portion of panel C2
Figure 4. Dimensions of Column Cover Panels C1, C2, and C5
12

A2
23"
390"
78"
A3
206"
78"
Note: Dimensions are based on the outer face of panel
return portion of panel A2
Figure 5. Dimension of Spandrel Panels A2 and A3
3.1.4 Steel Frame
The steel frame is not expected to undergo inelastic behavior. To represent
common construction, A572 GR50 steel was used in the model and its material properties
are listed in Table 2. Linear frame elements were used to model the steel frame and
connection support assemblies. For both the experimental specimen and the analytical
model, the steel frame is HSS steel tube. For the experimental specimen, steel
assemblies will be designed to connect the panel-to-steel connections to the steel frame
since no concrete floor slab will exist in the experimental specimen. For modeling
purposes, these assemblies were simplified and modeled as steel tube configurations
cantilevered from the steel frame. The cross-sectional geometry of all steel elements is
summarized in Table 3. A three dimensional view of the frame is shown in Figure 6.
13
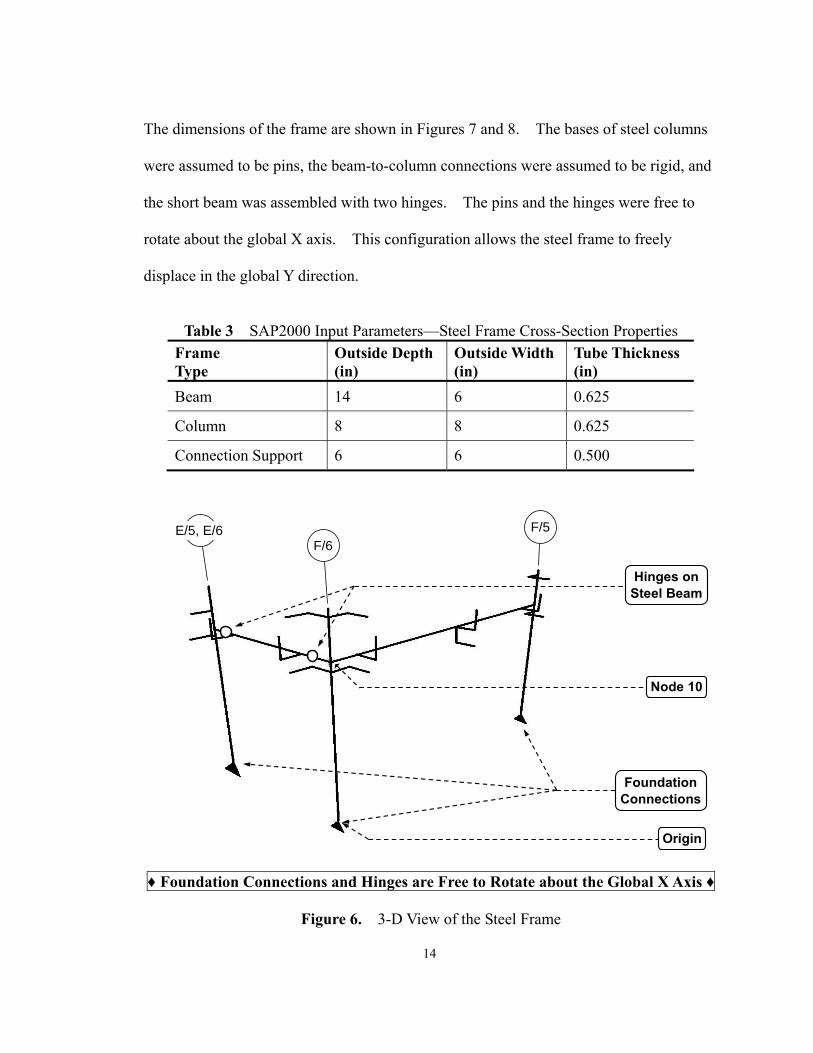
The dimensions of the frame are shown in Figures 7 and 8. The bases of steel columns
were assumed to be pins, the beam-to-column connections were assumed to be rigid, and
the short beam was assembled with two hinges. The pins and the hinges were free to
rotate about the global X axis. This configuration allows the steel frame to freely
displace in the global Y direction.
Table 3 SAP2000 Input Parameters—Steel Frame Cross-Section Properties
Frame Type
Outside Depth (in)
Outside Width (in)
Tube Thickness (in)
Beam 14 6 0.625
Column 8 8 0.625
Connection Support 6 6 0.500
Hinges onSteel Beam
F/6
F/5E/5, E/6
FoundationConnections
Node 10
Origin
♦ Foundation Connections and Hinges are Free to Rotate about the Global X Axis ♦
Figure 6. 3-D View of the Steel Frame
14

180"24
6"5
4"1
92"
132"24"
24"
Hinges
Connects to thesouth elevation ofthe steel support
frame
360"
Connects to thewest elevation ofthe steel support
frame
West Elevation South Elevation
Figure 7. Dimension of the Steel Frame—South and West Elevations
360"
180"
132"
24"
24"
Top of Column
Hinges
Figure 8. Dimension of the Steel Frame—Plan View
15
3.1.5 Nonlinear Link Elements
A wide variety of different cladding connection details are included in this test
specimen. Specific engineering detailing of the connections was completed in an earlier
study (Le, 2006). One type of panel-to-foundation connection (CD1), four types of
panel-to-steel connections (CD2, CD3.1, CD4, and CD7), one type of panel-to-panel
connection (CD6), and two types of panel-to-panel joints (¾" horizontal and 2" vertical
seismic joints) were used in the model. Six linear link elements were used to model
CD2 and CD7. And twenty five nonlinear link elements were used to model CD3.1,
CD4, CD6, ¾" joint, and 2" joint. Each type of connection is used multiple times in the
building but always with the same materials and connectors. Thus the nonlinear
behavior is expected to be the same at each location of a connection detail in the building.
Table 4 summarizes the type and fixity of these connection types. Note that none of the
connections resist rotation in any direction. Table 5 lists the label and the corresponding
type and global coordinate location of each link element. Figures 9 through 12 show the
labels, locations, and orientations of the link elements in the SAP model. The
connections’ force-displacement relationships shown in Figures 15 through 17 and
Figures 19 through 21 were from a connection database compiled by McMullin from
previous experimental data, and was last updated in September 2008.
16

Table 4 SAP2000 Input Parameters—Connection Type and Fixity
Connection Type
Connection Name Direction
Fixity Type or Database File Name
Force- DeformationRelationship
CD1 Panel Foundation Connection on Ground Floor Slab
U1 U2 U3
F F F
CD2 Bearing Connection at Floor Slab Edge
U1 U2 U3
R F R
CD3.1 Push-Pull Connection at Corner Steel Column
U1 U2 U3
ColumnPushPullU1 PushPullU2U3 PushPullU2U3
Figure 15 Figure 16 Figure 16
CD4 Push-Pull Connection at Bottom of Steel Beam
U1 U2 U3
PushPullU1 PushPullU2U3 PushPullU2U3
Figure 17 Figure 16 Figure 16
CD6 4-Inch Slotted Connection
U1 U2 U3
F F 4InchSlot
Figure 19
CD7 Lateral Seismic Connection
U1 U2 U3
F R F
¾" GAP Horizontal Joint U1 U2 U3
R 0.75InchGap R
Figure 20
2" GAP Vertical Seismic Joint U1 U2 U3
R R 2InchGap
Figure 21
Notes: U1 = Out-of-Plane Direction U2 = Vertical direction U3 = In-Plane Horizontal Direction F = Fixed—no translation is allowed, but rotation is allowed R = Roller—both translation and rotation are allowed All connections have no rotational resistance in any directions.
17
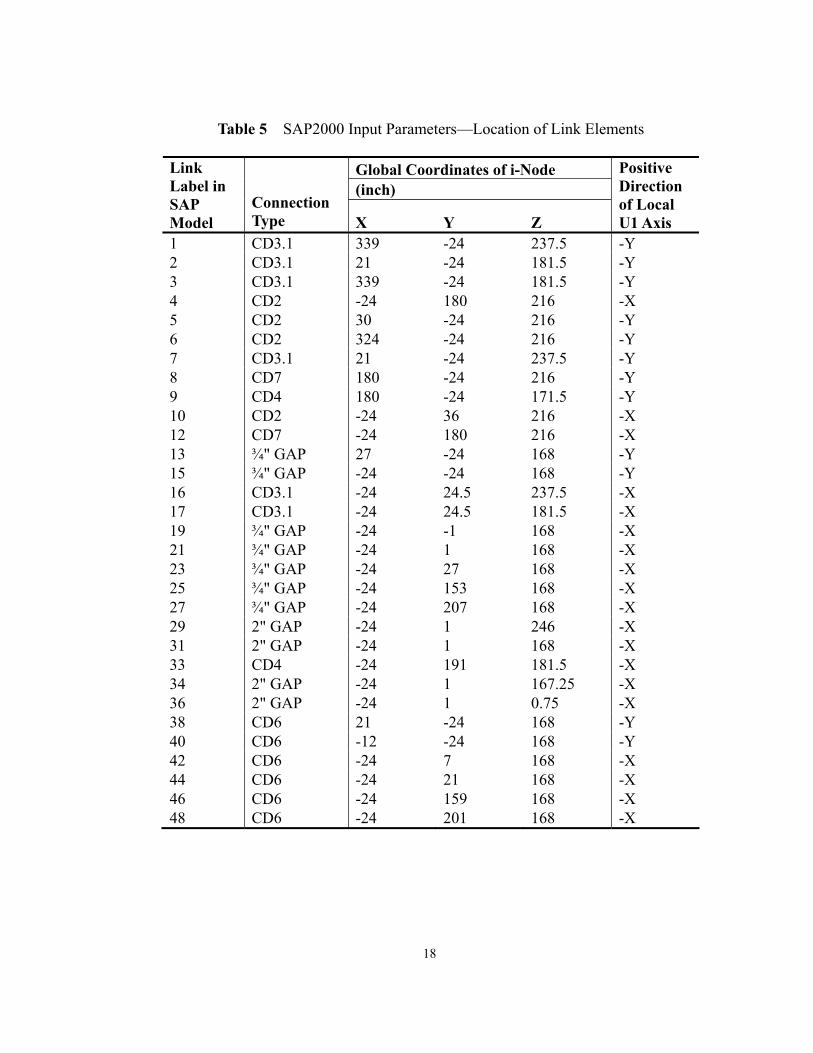
Table 5 SAP2000 Input Parameters—Location of Link Elements
Global Coordinates of i-Node (inch)
Link Label in SAP Model
Connection Type X Y Z
Positive Direction of Local U1 Axis
1 CD3.1 339 -24 237.5 -Y 2 CD3.1 21 -24 181.5 -Y 3 CD3.1 339 -24 181.5 -Y 4 CD2 -24 180 216 -X 5 CD2 30 -24 216 -Y 6 CD2 324 -24 216 -Y 7 CD3.1 21 -24 237.5 -Y 8 CD7 180 -24 216 -Y 9 CD4 180 -24 171.5 -Y 10 CD2 -24 36 216 -X 12 CD7 -24 180 216 -X 13 ¾" GAP 27 -24 168 -Y 15 ¾" GAP -24 -24 168 -Y 16 CD3.1 -24 24.5 237.5 -X 17 CD3.1 -24 24.5 181.5 -X 19 ¾" GAP -24 -1 168 -X 21 ¾" GAP -24 1 168 -X 23 ¾" GAP -24 27 168 -X 25 ¾" GAP -24 153 168 -X 27 ¾" GAP -24 207 168 -X 29 2" GAP -24 1 246 -X 31 2" GAP -24 1 168 -X 33 CD4 -24 191 181.5 -X 34 2" GAP -24 1 167.25 -X 36 2" GAP -24 1 0.75 -X 38 CD6 21 -24 168 -Y 40 CD6 -12 -24 168 -Y 42 CD6 -24 7 168 -X 44 CD6 -24 21 168 -X 46 CD6 -24 159 168 -X 48 CD6 -24 201 168 -X
18

1
6
38
9
7
5
2
10
16
17
412
33
J213J204J127
J132
J17J31
Panel Foundation Connection (CD1): J17, J31, J127, J132, J204, J213Bearing Connection (CD2): 4, 5, 6, 10Push-Pull Connection (CD3.1): 1, 2, 3, 7, 16, 17Push-Pull Connection (CD4): 9, 33Lateral Seismic Connection (CD7): 8, 12
See Figure 12
See Figure 10
Se
e F
igu
re 1
1
Figure 9. Labels and Locations of the Link Elements
29
31
1934
23
21
13
15
44
42
38
40
Slotted Connection (CD6): 38, 40, 42, 44Horizontal Joint (¾" Gap): 13, 15, 19, 21, 23Vertical Joint (2" Gap): 29, 31, 34
Figure 10. Labels and Locations of Panel-to-Panel Nonlinear Connections—Detailed
View of Upper Portion of Column Panels C2 and C5
19
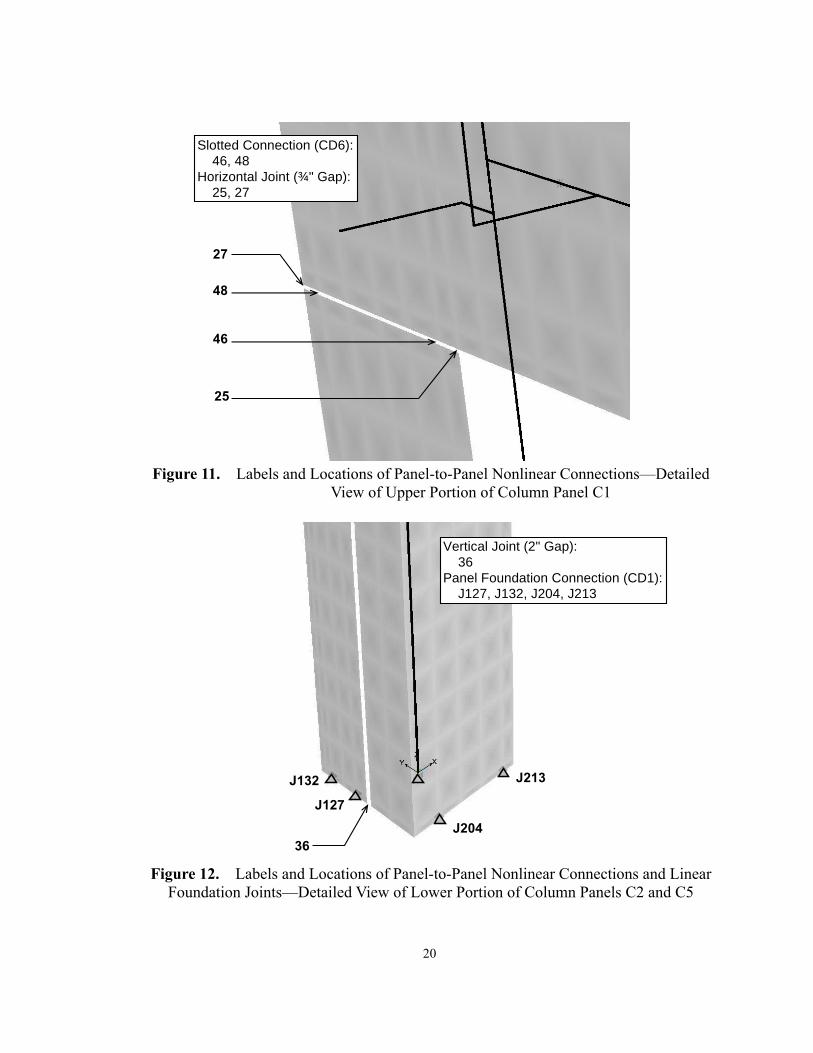
27
48
46
Slotted Connection (CD6): 46, 48Horizontal Joint (¾" Gap): 25, 27
25
Figure 11. Labels and Locations of Panel-to-Panel Nonlinear Connections—Detailed
View of Upper Portion of Column Panel C1
36
Vertical Joint (2" Gap): 36Panel Foundation Connection (CD1): J127, J132, J204, J213
J213
J204
J127
J132
Figure 12. Labels and Locations of Panel-to-Panel Nonlinear Connections and Linear
Foundation Joints—Detailed View of Lower Portion of Column Panels C2 and C5
20
3.1.5.1 Push-Pull Connection Elements
The push-pull connections are steel rods which were designed to resist force only in
the U1 direction. Figures 13 and 14 illustrate the original design details of the two
push-pull connections (CD3.1 and CD4) included in the test specimen. The push-pull
connection at the corner steel column, CD3.1, was intended to resist the out-of-plane (U1)
push-pull force from the panel. The force-displacement relationship of CD3.1 in the U1
direction is shown in Figure 15. The connection has a maximum axial displacement of
±2.60 inches in the U1 direction. Although not intended during design, CD3.1 can also
resist a small amount of force in the U2 and U3 directions as shown in Figure 16.
21

Figure 13. Original Design Detail of Push-Pull Connection CD3.1
22

Figure 14. Original Design Detail of Push-Pull Connection CD4
23

ColumnPushPullU1
-40
-20
0
20
40
-3 -2 -1 0 1 2 3
Displacement, d (inch)
Fo
rce
, F
(k
ips
)
Figure 15. Force-Displacement Relationship of CD3.1 in the U1
Direction (McMullin, 2008)
PushPullU2U3
-3
-2
-1
0
1
2
3
-8 -6 -4 -2 0 2 4 6 8
Displacement, d (inch)
Fo
rce
, F (
kip
s)
Figure 16. Force-Displacement Relationship of CD3.1 and CD4 in the
U2 and U3 Directions (McMullin, 2008)
24
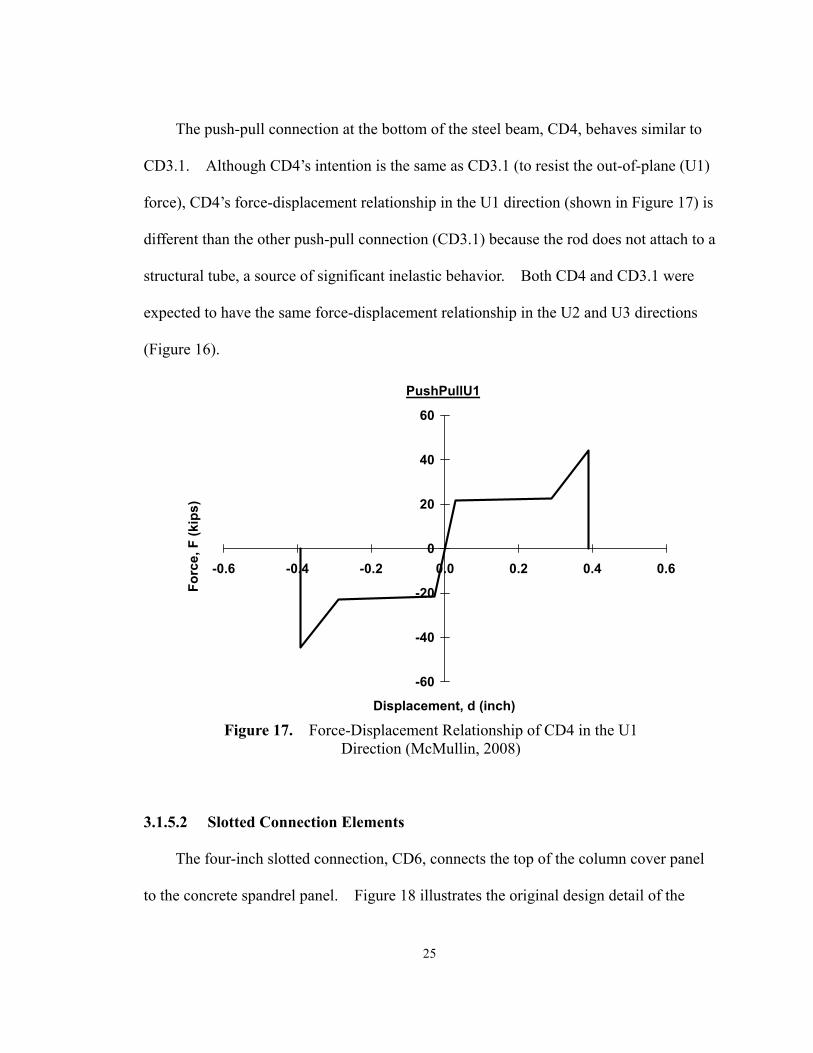
The push-pull connection at the bottom of the steel beam, CD4, behaves similar to
CD3.1. Although CD4’s intention is the same as CD3.1 (to resist the out-of-plane (U1)
force), CD4’s force-displacement relationship in the U1 direction (shown in Figure 17) is
different than the other push-pull connection (CD3.1) because the rod does not attach to a
structural tube, a source of significant inelastic behavior. Both CD4 and CD3.1 were
expected to have the same force-displacement relationship in the U2 and U3 directions
(Figure 16).
PushPullU1
-60
-40
-20
0
20
40
60
-0.6 -0.4 -0.2 0.0 0.2 0.4 0.6
Displacement, d (inch)
Fo
rce
, F
(k
ips
)
Figure 17. Force-Displacement Relationship of CD4 in the U1
Direction (McMullin, 2008)
3.1.5.2 Slotted Connection Elements
The four-inch slotted connection, CD6, connects the top of the column cover panel
to the concrete spandrel panel. Figure 18 illustrates the original design detail of the
25
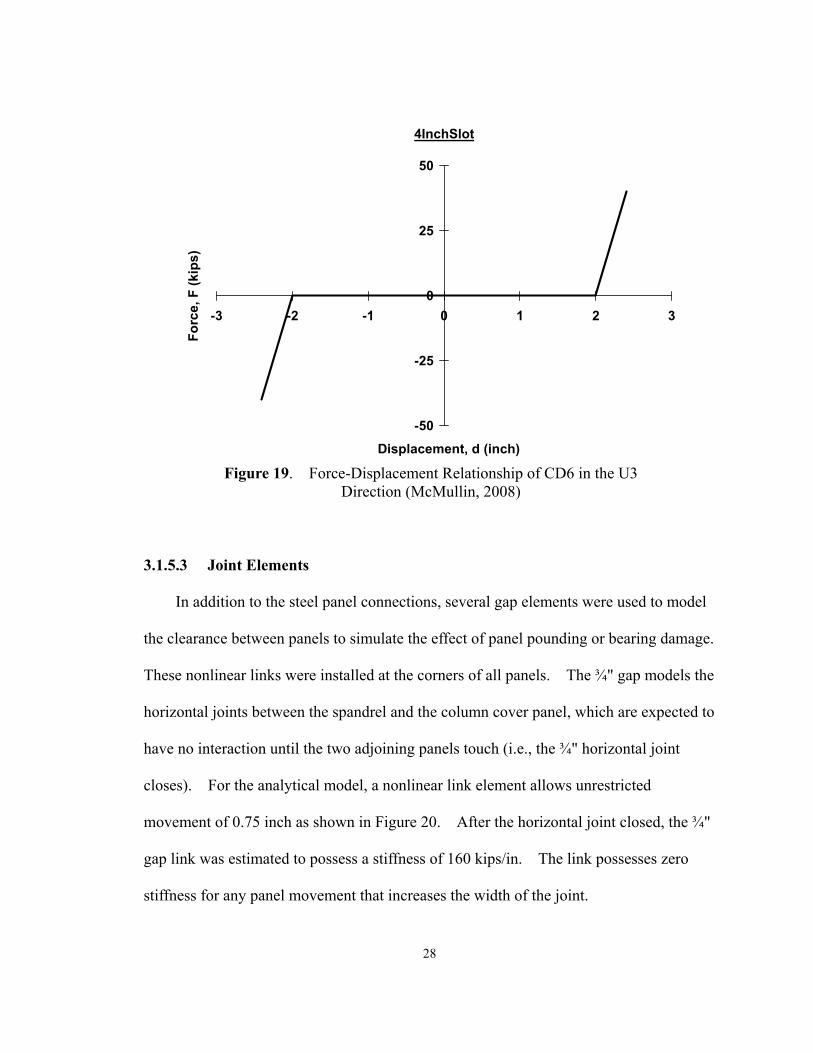
four-inch slotted connection CD6 included in the test specimen. The orientation of the
slot allows CD6 to move freely in the U3 direction by up to two inches locally from the
initial position. Once this translation exceeds two inches, the fabricated clearance of
CD6 closes, and every extra inch of displacement was assumed to require 100 kips of
force as shown in Figure 19. The translations of CD6 in the U1 and U2 directions were
expected to be small and assumed to be fixed, implying no displacement in the model.
26

Figure 18. Original Design Detail of Four-Inch Slotted Connection CD6
27
4InchSlot
-50
-25
0
25
50
-3 -2 -1 0 1 2 3
Displacement, d (inch)
Fo
rce
, F
(k
ips
)
Figure 19. Force-Displacement Relationship of CD6 in the U3
Direction (McMullin, 2008)
3.1.5.3 Joint Elements
In addition to the steel panel connections, several gap elements were used to model
the clearance between panels to simulate the effect of panel pounding or bearing damage.
These nonlinear links were installed at the corners of all panels. The ¾" gap models the
horizontal joints between the spandrel and the column cover panel, which are expected to
have no interaction until the two adjoining panels touch (i.e., the ¾" horizontal joint
closes). For the analytical model, a nonlinear link element allows unrestricted
movement of 0.75 inch as shown in Figure 20. After the horizontal joint closed, the ¾"
gap link was estimated to possess a stiffness of 160 kips/in. The link possesses zero
stiffness for any panel movement that increases the width of the joint.
28

0.75InchGap
-50
-25
0
25
50
-3 -2 -1 0 1 2 3
Displacement, d (inch)
Fo
rce
, F
(k
ips
)
Figure 20. Force-Displacement Relationship of ¾" Gap in the U2
Direction (McMullin, 2008)
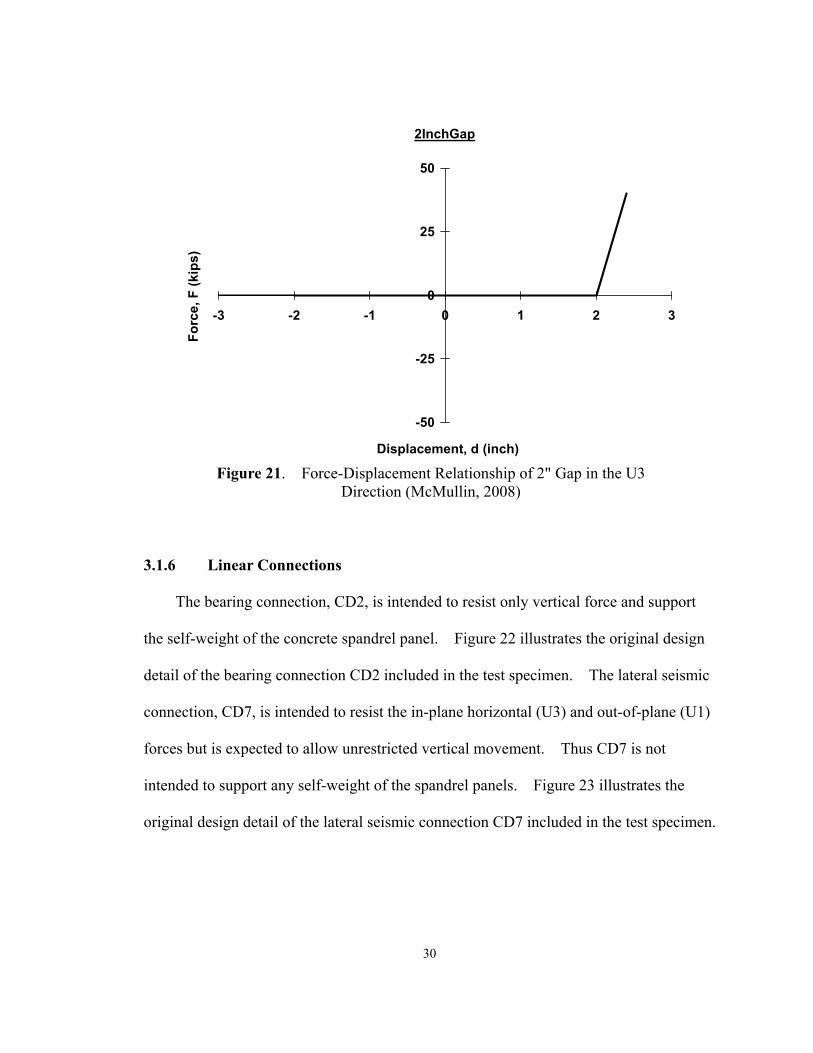
The two-inch vertical seismic joint is similar to the ¾" horizontal joint. A 2" gap
element was used to simulate the vertical seismic joint behavior. No interaction was
assumed between adjoining spandrel panels or column cover panels until the two
adjoining panels touch (i.e., the vertical seismic joint closes). The vertical seismic joint
closes when the 2" gap element has relative displacement in the positive in-plane
horizontal (U3) direction of two inches as shown in Figure 21. After the vertical
seismic joint closes, the 2" gap link stiffness is 100 kips/in.
29
2InchGap
-50
-25
0
25
50
-3 -2 -1 0 1 2 3
Displacement, d (inch)
Fo
rce
, F (
kip
s)
Figure 21. Force-Displacement Relationship of 2" Gap in the U3
Direction (McMullin, 2008)
3.1.6 Linear Connections
The bearing connection, CD2, is intended to resist only vertical force and support
the self-weight of the concrete spandrel panel. Figure 22 illustrates the original design
detail of the bearing connection CD2 included in the test specimen. The lateral seismic
connection, CD7, is intended to resist the in-plane horizontal (U3) and out-of-plane (U1)
forces but is expected to allow unrestricted vertical movement. Thus CD7 is not
intended to support any self-weight of the spandrel panels. Figure 23 illustrates the
original design detail of the lateral seismic connection CD7 included in the test specimen.
30
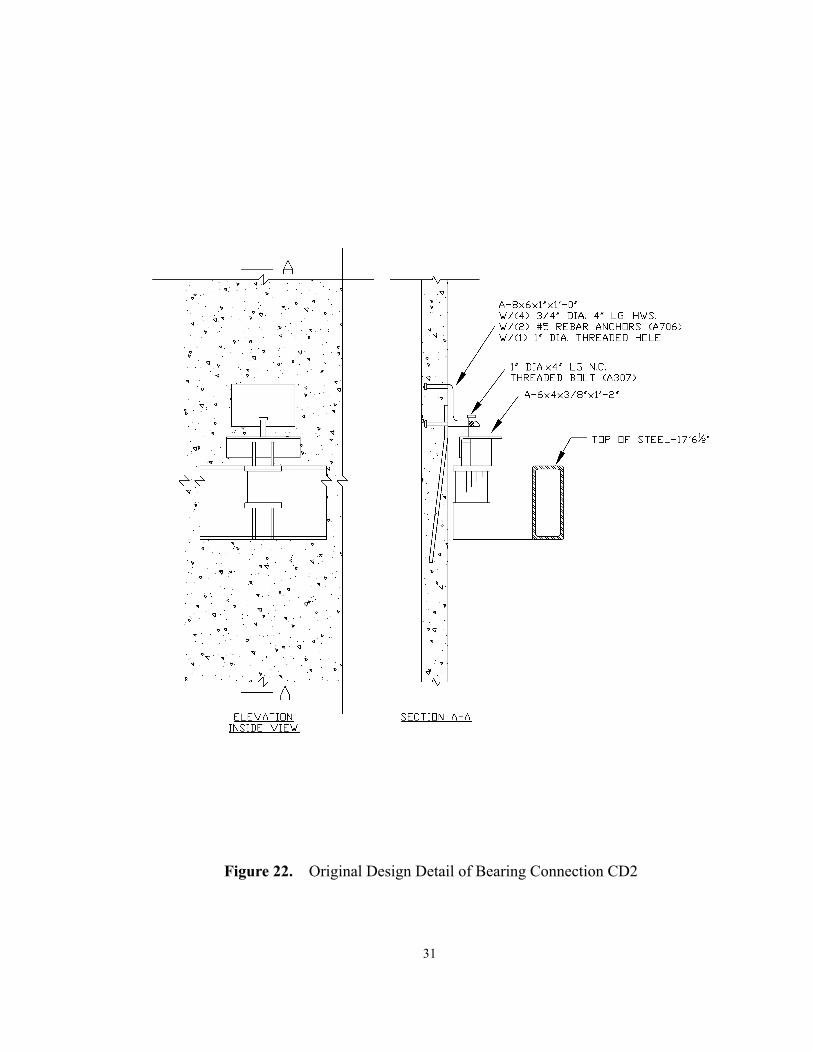
Figure 22. Original Design Detail of Bearing Connection CD2
31

Figure 23. Original Design Detail of Lateral Seismic Connection CD7
32

3.1.7 External Reactions
The panel-to-foundation connection to the ground floor slab, CD1, was modeled as a
pin that was intended to support the self-weight of the column cover panel and to resist
horizontal and vertical forces generated during the pushover analysis. Figure 24
illustrates the original design detail of the panel-to-foundation connection CD1 included
in the test specimen.
33

Figure 24. Original Design Detail of Panel-to-Foundation Connection CD1
34
3.2 Analysis Protocol
3.2.1 Loading Criteria
Two sources of loading were evaluated using the model: the specimen’s self weight
and a monotonic pushover load parallel to the global Y axis. The self weight was
considered as dead load and includes the weight of all steel frame and concrete panel
elements. The dead load was automatically calculated by the computer program based
upon the member geometry and the material density. Note that deflection of the support
frame due to construction of the building slab usually occurs before cladding is mounted
on a building.
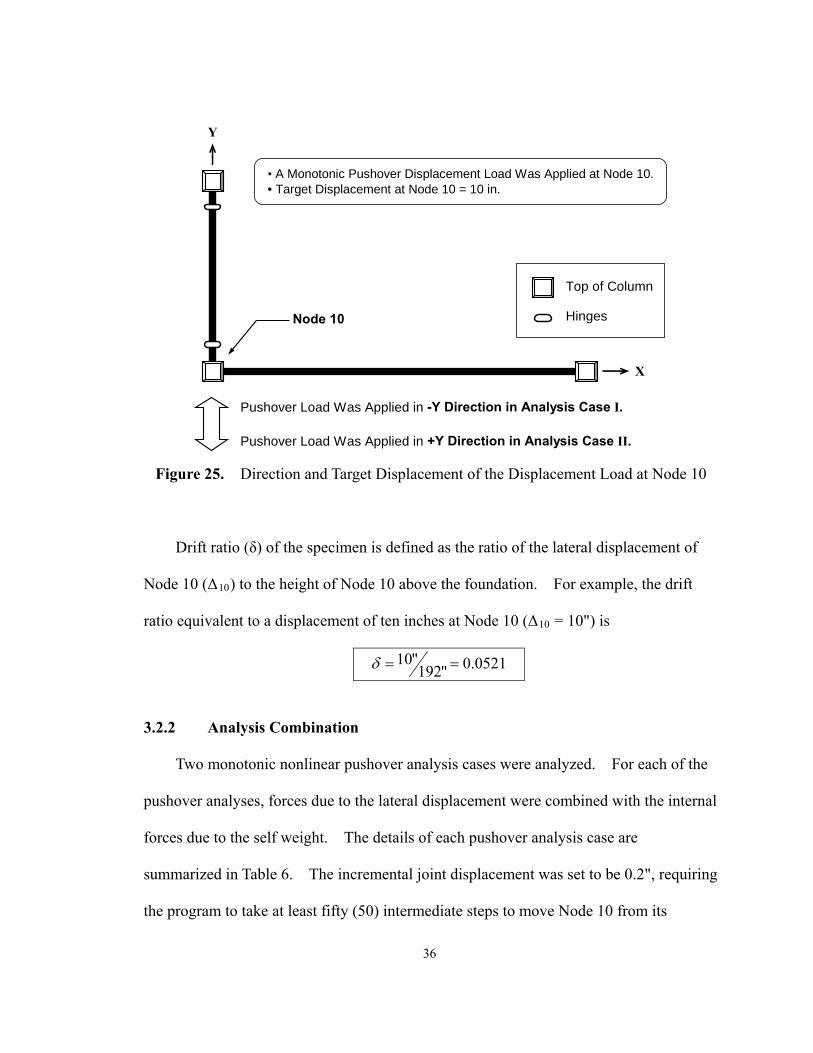
The pushover load was a ten-inch (10-in) monotonic lateral displacement applied in
the global Y directions at Node 10. Node 10 is located at the intersection of the corner
column and the two support beams. Figure 25 indicates the location of Node 10 and the
direction and target displacement of the displacement load applied at Node 10. Due to
the asymmetrical behavior of the specimen, the pushover analysis was conducted in both
the positive and negative directions. To complete the pushover analysis, the analysis
protocol applied an incremental lateral displacement of 0.2" to move Node 10 to the
target displacement of ten inches. Only the external pushover load applied to the model
results in lateral displacement.
35
Top of Column
Hinges
X
Y
Pushover Load Was Applied in -Y Direction in Analysis Case I.
Node 10
• A Monotonic Pushover Displacement Load Was Applied at Node 10.• Target Displacement at Node 10 = 10 in.
Pushover Load Was Applied in +Y Direction in Analysis Case II.
Figure 25. Direction and Target Displacement of the Displacement Load at Node 10
Drift ratio (δ) of the specimen is defined as the ratio of the lateral displacement of
Node 10 (Δ10) to the height of Node 10 above the foundation. For example, the drift
ratio equivalent to a displacement of ten inches at Node 10 (Δ10 = 10") is
0521.0"192"10
3.2.2 Analysis Combination
Two monotonic nonlinear pushover analysis cases were analyzed. For each of the
pushover analyses, forces due to the lateral displacement were combined with the internal
forces due to the self weight. The details of each pushover analysis case are
summarized in Table 6. The incremental joint displacement was set to be 0.2", requiring
the program to take at least fifty (50) intermediate steps to move Node 10 from its
36
original position to the target displacement of ten inches. The program automatically
includes extra steps between any two original steps when needed, based upon a critical
event (e.g., closing of a panel joint or slotted connection) having occurred in an interval.
During the analysis, the force and displacement at each intermediate step were monitored.
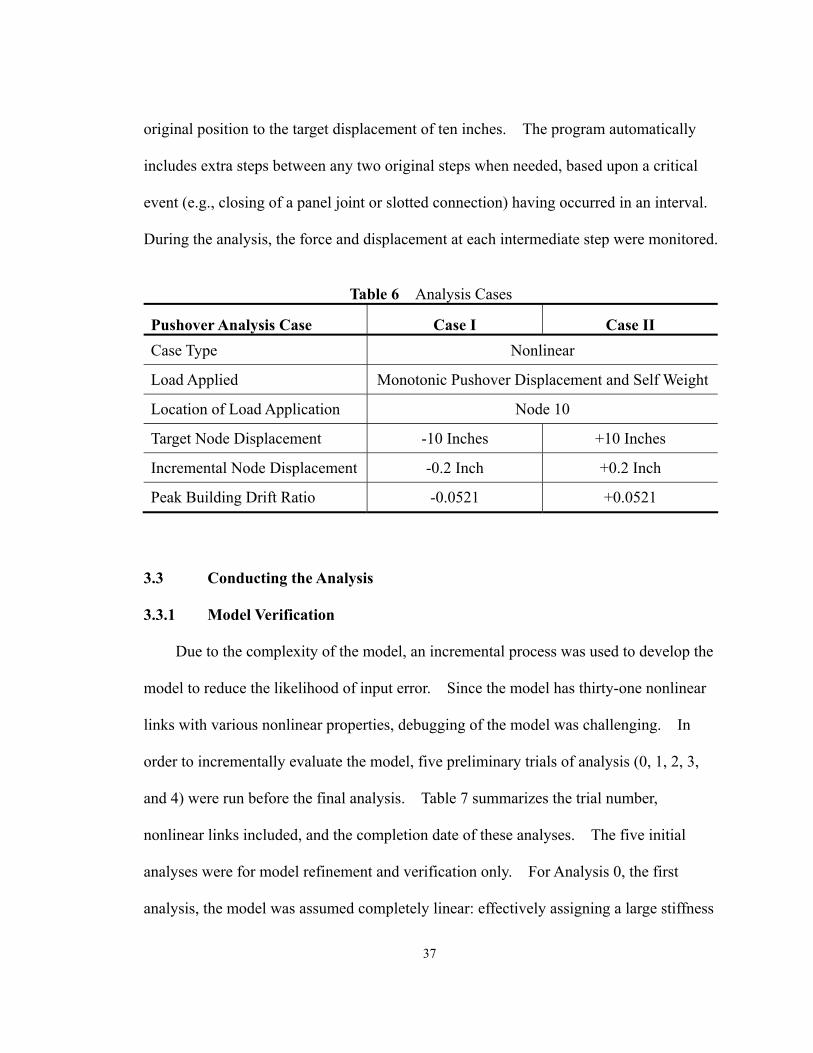
Table 6 Analysis Cases
Pushover Analysis Case Case I Case II
Case Type Nonlinear
Load Applied Monotonic Pushover Displacement and Self Weight
Location of Load Application Node 10
Target Node Displacement -10 Inches +10 Inches
Incremental Node Displacement -0.2 Inch +0.2 Inch
Peak Building Drift Ratio -0.0521 +0.0521
3.3 Conducting the Analysis
3.3.1 Model Verification
Due to the complexity of the model, an incremental process was used to develop the
model to reduce the likelihood of input error. Since the model has thirty-one nonlinear
links with various nonlinear properties, debugging of the model was challenging. In
order to incrementally evaluate the model, five preliminary trials of analysis (0, 1, 2, 3,
and 4) were run before the final analysis. Table 7 summarizes the trial number,
nonlinear links included, and the completion date of these analyses. The five initial
analyses were for model refinement and verification only. For Analysis 0, the first
analysis, the model was assumed completely linear: effectively assigning a large stiffness
37
to all gap and link elements. Panel joints behaved like door hinges: panels were
interconnected (i.e., no panel translation relative to other adjoining panels) but only
unrestricted rotation about the joint was allowed. The nonlinear properties of the 2"
vertical seismic joint, ¾" horizontal joint, CD6, CD3.1, and CD4 were added to the
model in subsequent analyses (Table 7). After proper verification of the model, the final
analysis, including all nonlinear properties, was conducted.
Table 7 Timeline of Analytical Studies
Analysis No. Date Nonlinear Connections in Model
0 10/18/08 NONE
1 10/19/08 2" GAP
2 10/22/08 2" GAP ¾" GAP
3 11/15/08 2" GAP ¾" GAP CD6
4 11/16/08 2" GAP ¾" GAP CD6 CD3.1
Final 12/11/08 2" GAP ¾" GAP CD6 CD3.1 CD4
3.3.2 Data Reduction
Each trial of pushover analysis was run with the ten-inch pushover load first in the
negative global Y direction (Case I) and then repeated in the positive direction (Case II).
During each analysis, the force and displacement of every nonlinear gap and link element
at each intermediate step were recorded. The force-displacement data from Node 10
was used to plot the pushover curve of the system. The force-displacement data from
the links were used to determine the sequence of events, such as closing of joints and
yielding of connections, as they happened during each analysis.
38

Chapter 4
Analytical Results
4.1 Pushover Curve—First Five Preliminary Analyses
The five verification pushover analyses (0 to 4) were completed and the pushover
curves indicated that the analytical result was as expected. The pushover curves with
the pushover load in the positive and negative directions are shown in Figures 26 and 27.
Note that all graphs are plotted in the first quadrant to allow for easier comparison of
results. The model in Analysis 0 was expected to behave linearly regardless of the
direction of the loading, and this matched with the result: a straight pushover curve.
The high stiffness of the model was due to the interconnected panels and stiff
connections.
-100
-80
-60
-40
-20
0
-10-9-8-7-6-5-4-3-2-10Lateral Displacement of Node 10, Δ10 (in)
Glo
bal
For
ce, P
(k
ips)
Analysis 2
Analysis 0
Analysis 1
Analysis 3, Analysis 4, and Final Analysis
Figure 26. Pushover Curves for Model Verification (Case I)
39
0
20
40
60
80
100
0 1 2 3 4 5 6 7 8 9 1
Lateral Displacement of Node 10, Δ10 (in)
Glo
bal
For
ce, P
(k
ips)
0
Analysis 0
Analysis 1
Analysis 3, Analysis 4, and Final Analysis
Analysis 2
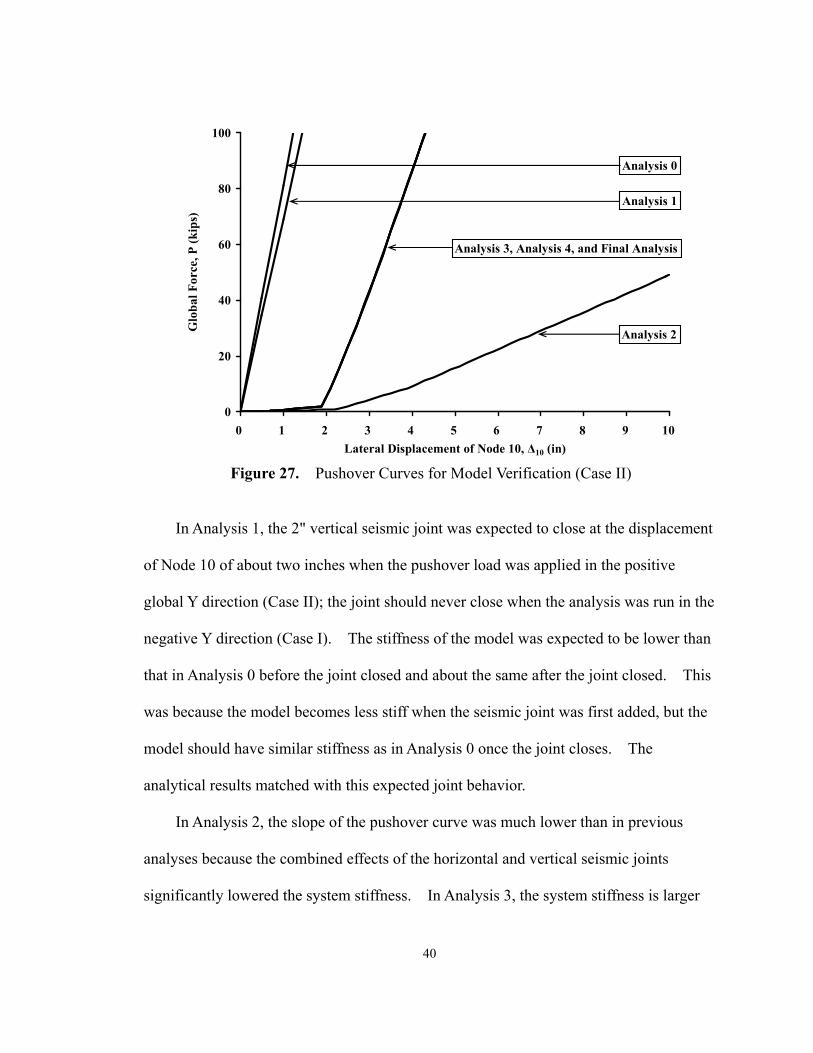
Figure 27. Pushover Curves for Model Verification (Case II)
In Analysis 1, the 2" vertical seismic joint was expected to close at the displacement
of Node 10 of about two inches when the pushover load was applied in the positive
global Y direction (Case II); the joint should never close when the analysis was run in the
negative Y direction (Case I). The stiffness of the model was expected to be lower than
that in Analysis 0 before the joint closed and about the same after the joint closed. This
was because the model becomes less stiff when the seismic joint was first added, but the
model should have similar stiffness as in Analysis 0 once the joint closes. The
analytical results matched with this expected joint behavior.
In Analysis 2, the slope of the pushover curve was much lower than in previous
analyses because the combined effects of the horizontal and vertical seismic joints
significantly lowered the system stiffness. In Analysis 3, the system stiffness is larger
40
than the initial stiffness after the slotted connection (CD6) closes at Node 10
displacement of -1.99" and +2.00" because the slotted connections restrict the lateral
movement of the system after they close. Finally, in Analysis 4, the pushover curve was
essentially the same as that in Analysis 3, indicating that the push-pull connections CD3.1
have minor influence on the behavior of the model.
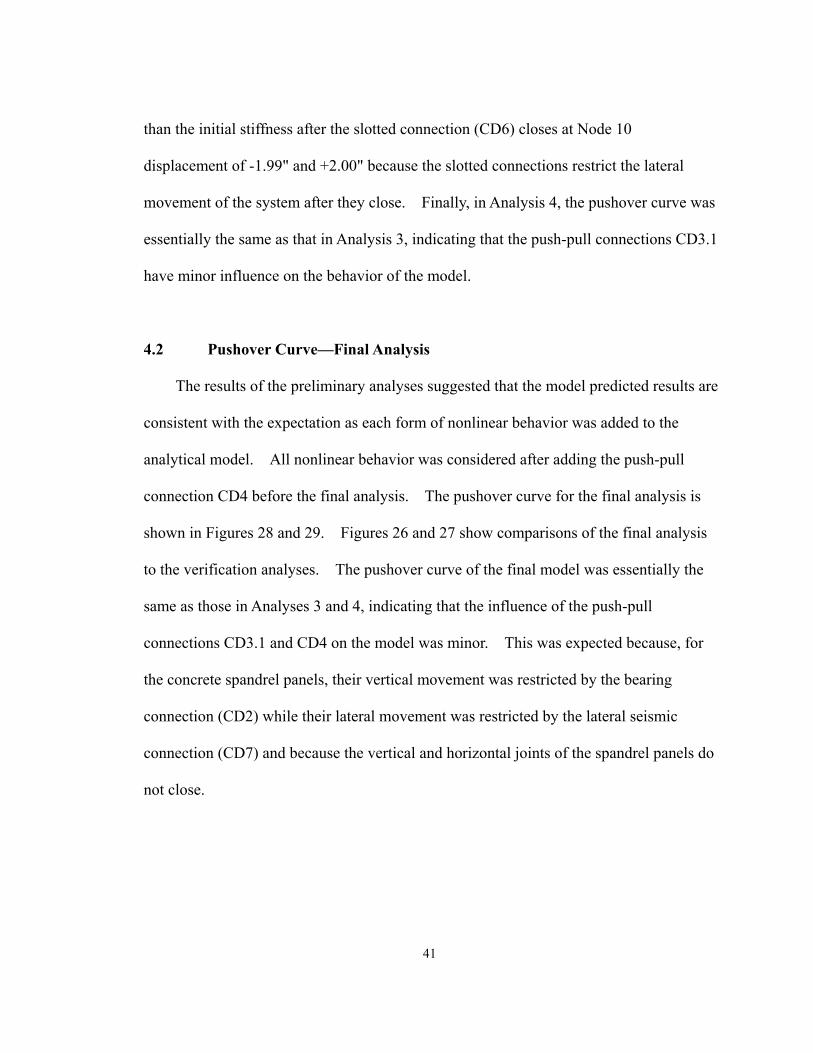
4.2 Pushover Curve—Final Analysis
The results of the preliminary analyses suggested that the model predicted results are
consistent with the expectation as each form of nonlinear behavior was added to the
analytical model. All nonlinear behavior was considered after adding the push-pull
connection CD4 before the final analysis. The pushover curve for the final analysis is
shown in Figures 28 and 29. Figures 26 and 27 show comparisons of the final analysis
to the verification analyses. The pushover curve of the final model was essentially the
same as those in Analyses 3 and 4, indicating that the influence of the push-pull
connections CD3.1 and CD4 on the model was minor. This was expected because, for
the concrete spandrel panels, their vertical movement was restricted by the bearing
connection (CD2) while their lateral movement was restricted by the lateral seismic
connection (CD7) and because the vertical and horizontal joints of the spandrel panels do
not close.
41
-50
-40
-30
-20
-10
0
-3.0-2.5-2.0-1.5-1.0-0.50.0
Lateral Displacement of Node 10, Δ10 (in)
Glo
bal
For
ce, P
(k
ips)
Figure 28. Pushover Curve for the Final Analysis (Case I)
0
10
20
30
40
50
0.0 0.5 1.0 1.5 2.0 2.5 3.0
Lateral Displacement of Node 10, Δ10 (in)
Glo
bal
For
ce, P
(k
ips)
Figure 29. Pushover Curve for the Final Analysis (Case II)
42

4.3 Sequence of Events
The sequences of events that occurred during the final analysis are listed in Table 8
for Case I and Table 9 for Case II. The sequences of events are determined by
investigating the local force-displacement relationship of each of the nonlinear gap and
link elements. For the pushover analysis in the negative Y direction (Case I), the peak
forces of all 2" vertical seismic joints (Links 29, 31, 34, and 36) were zero kips,
indicating that the 2" vertical seismic joint did not close throughout the ten-inch pushover
displacement. The ¾" horizontal joint, Link 19, closed when displacement of Node 10
reached -7.35" (δ = -0.0383). Other ¾" joints did not close. Slotted connections
(Links 42, 44, 46, and 48) closed simultaneously when displacement of Node 10 reached
-1.99" (δ = -0.0104). The peak force and displacement of all push-pull connections
(CD3.1 and CD4) were small and these connections did not yield throughout the analysis.
Table 8 Sequence of Damage Events—Pushover Case I
Event No.
Node10 Displ. Δ10 (in)
Drift Ratio δ
Damage Event
Link Label
1 -1.99 -0.0104 Slotted Connection Closed 42, 44, 46, 48
2 -7.35 -0.0383 ¾" Joint Closed 19
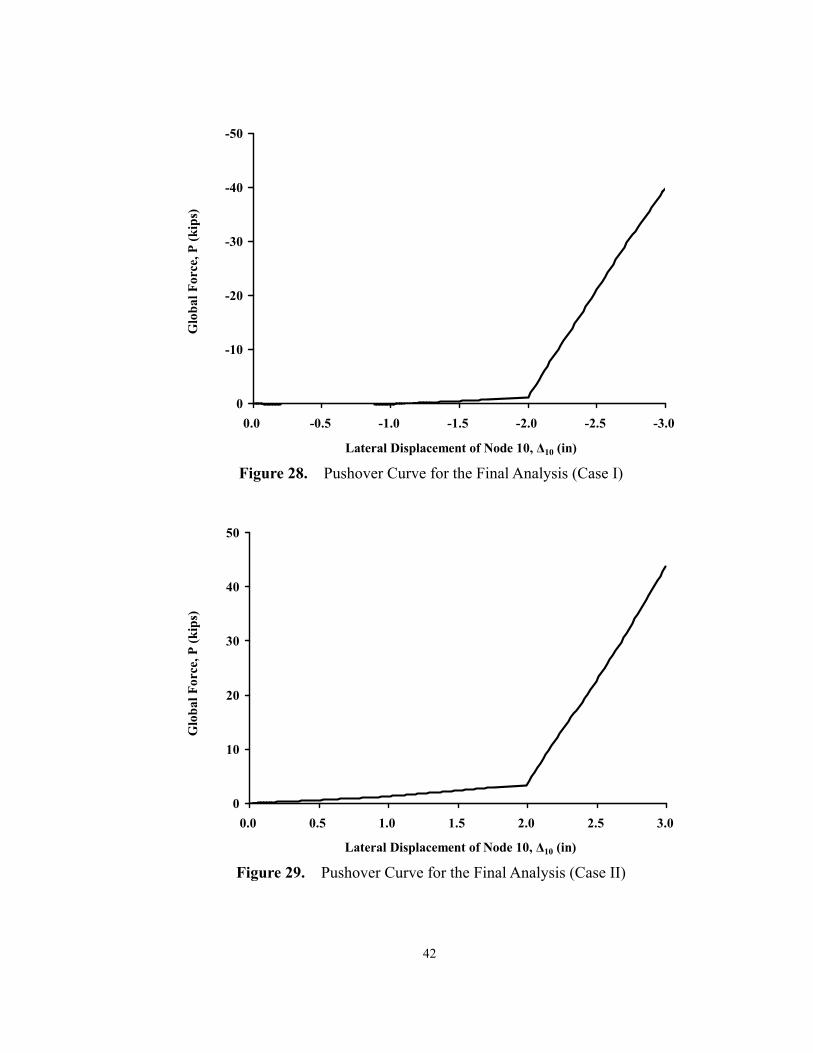
Table 9 lists the sequence of events for the pushover analysis in the positive Y
direction (Case II). The 2" vertical seismic joint, Link 34, closed when displacement of
Node 10 reached +2.21" (δ = +0.0115) and Link 29 closed when displacement of Node
10 reached +4.70" (δ = +0.0245). The ¾" horizontal joint, Link 25, closed when
43
displacement of Node 10 reached +6.70" (δ = +0.0349). Similar to Analysis Case I,
slotted connections (Links 42, 44, 46, and 48) closed when displacement of Node 10
reached +2.00" (δ = +0.0104). None of the push-pull connections yielded throughout
the analysis.
Table 9 Sequence of Damage Events—Pushover Case II
Event No.
Node10 Displ. Δ10 (in)
Drift Ratio δ
Damage Event
Link Label
1 2.00 0.0104 Slotted Connection Closed 42, 44, 46, 48
2 2.21 0.0115 2" Vertical Joint Closed 34
3 4.70 0.0245 2" Vertical Joint Closed 29
4 6.70 0.0349 ¾" Joint Closed 25
4.4 Global Torsion of the Specimen
One question addressed by the analysis was potential coupling between the lateral
displacement and global torsion of the test specimen. Figure 30 shows a comparison of
the displacements at the top of the three steel columns in the global X and Y directions at
Δ10 = ±10.00". The entire specimen moved in the global Y direction with only minor
rotation in the plan view (torsion about the global Z direction) even though the geometry
of the system was asymmetrical.
44

X
Y
( -0.27, -7.23 )< 0.30, 7.48 >
( -0.29, -11.4 )< 0.22, 10.7 >
( -0.33, -11.5 )< -0.07, 11.3 >
Indicates the Translation of the Nodeat Lateral Displacement of Node 10 = -10 in
( x.xx, y.yy )
< x.xx, y.yy > Indicates the Translation of the Nodeat Lateral Displacement of Node 10 = +10 in
Figure 30. Displacement at the Top of the Three Steel Columns in the Global
X and Y Directions
4.5 Other Potential Sources of Nonlinear Behavior
After further review of the output, it was determined that the model can accurately
predict the behavior of the actual test specimen only up to a certain displacement limit.
Once the displacement goes beyond this limit, it is expected that nonlinear behavior of
additional elements will occur. Depending upon the behavior of these elements, the
system may become unstable and the experimental testing may need to be terminated.
In the model, the translation of the panel-to-foundation connections CD1 in all directions
and the slotted connections CD6 in the U1 direction were assumed to be fixed. But in
actual constructed systems, these connections would not have infinite stiffness or strength
and at some point they would yield.
45

Although beyond the scope of work originally intended, it was decided that a review
of the final analysis considering the ultimate strength of elements not modeled as
nonlinear links was needed. The maximum strength of the six panel-to-foundation
joints (J17, J31, J127, J132, J204, and J213) and two slotted connections (Links 38 and
40) were investigated to see which particular element yields first and to terminate the
analysis as a result.
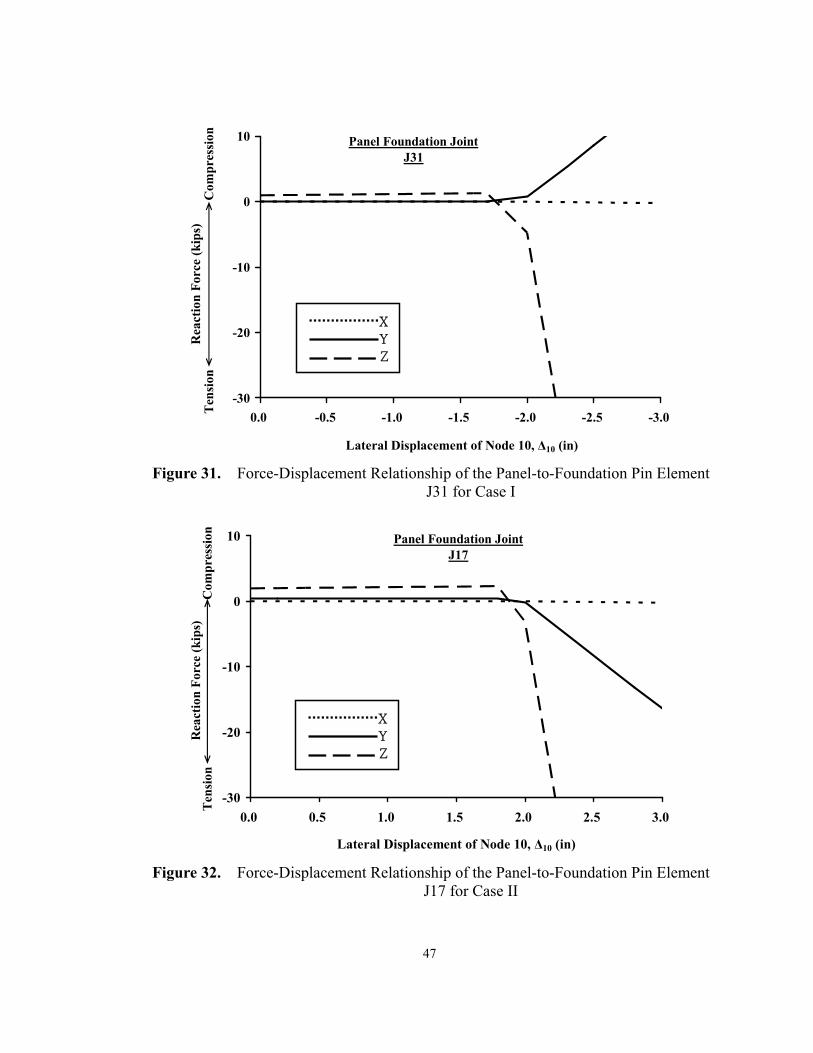
4.5.1 Panel-to-Foundation Connection (CD1)
The panel-to-foundation connection CD1 can likely resist high compression due to
the bearing nature of the design, but is unlikely to resist more than the vector sum of the
vertical tensile force and horizontal shear of 19.9 kips. For the pushover load applied in
the negative Y direction (Pushover Case I), the panel-to-foundation joint J31 (shown in
Figure 31) first reached the 19.9-kip tension limit at Δ10 = -2.13" (δ = -0.0111). For the
pushover load applied in the positive Y direction (Pushover Case II), the
panel-to-foundation joint J17 (shown in Figure 32) first reached the 19.9-kip tension limit
at Δ10 = +2.14" (δ = +0.0111).
46
-30
-20
-10
0
10
-3.0-2.5-2.0-1.5-1.0-0.50.0
Lateral Displacement of Node 10, Δ10 (in)
Rea
ctio
n F
orce
(k
ips)
X
Y
Z
Panel Foundation JointJ31
Ten
sion
Com
pre
ssio
n
X
Y
Z
Figure 31. Force-Displacement Relationship of the Panel-to-Foundation Pin Element
J31 for Case I
-30
-20
-10
0
10
0.0 0.5 1.0 1.5 2.0 2.5 3.0
Lateral Displacement of Node 10, Δ10 (in)
Rea
ctio
n F
orce
(k
ips)
X
Y
Z
Panel Foundation JointJ17
Ten
sion
Com
pre
ssio
n
X
Y
Z
Figure 32. Force-Displacement Relationship of the Panel-to-Foundation Pin Element
J17 for Case II
47
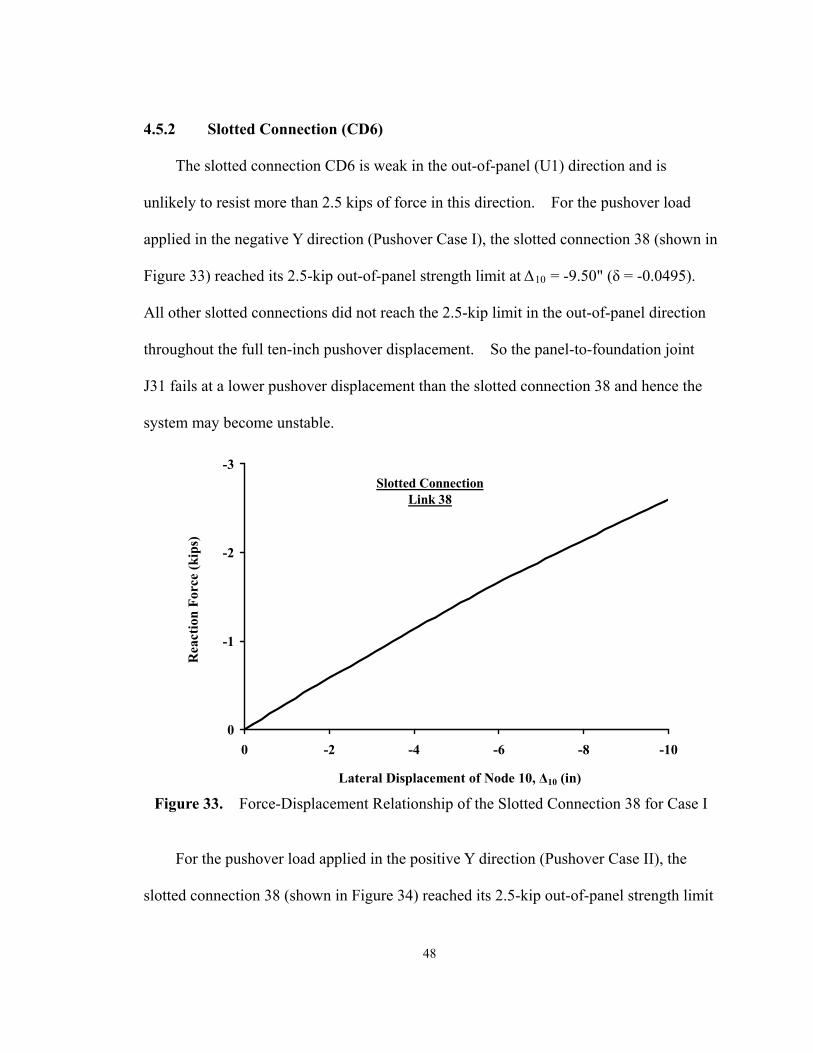
4.5.2 Slotted Connection (CD6)
The slotted connection CD6 is weak in the out-of-panel (U1) direction and is
unlikely to resist more than 2.5 kips of force in this direction. For the pushover load
applied in the negative Y direction (Pushover Case I), the slotted connection 38 (shown in
Figure 33) reached its 2.5-kip out-of-panel strength limit at Δ10 = -9.50" (δ = -0.0495).
All other slotted connections did not reach the 2.5-kip limit in the out-of-panel direction
throughout the full ten-inch pushover displacement. So the panel-to-foundation joint
J31 fails at a lower pushover displacement than the slotted connection 38 and hence the
system may become unstable.
-3
-2
-1
0
-10-8-6-4-20
Lateral Displacement of Node 10, Δ10 (in)
Rea
ctio
n F
orce
(ki
ps)
Slotted ConnectionLink 38
Figure 33. Force-Displacement Relationship of the Slotted Connection 38 for Case I
For the pushover load applied in the positive Y direction (Pushover Case II), the
slotted connection 38 (shown in Figure 34) reached its 2.5-kip out-of-panel strength limit
48

at Δ10 = +2.61" (δ = +0.0136). Similar to Pushover Case I, all other slotted connections
did not reach the 2.5-kip limit in the out-of-panel direction throughout the full ten-inch
pushover displacement. For this direction of loading, the panel-to-foundation joint J17
fails at a lower pushover displacement than the slotted connection 38 and hence the
system may become unstable.
0
1
2
3
0 2 4 6 8
Lateral Displacement of Node 10, Δ10 (in)
Rea
ctio
n F
orce
(k
ips)
Slotted Connection
10
Link 38
Figure 34. Force-Displacement Relationship of the Slotted Connection 38 for Case II
4.6 Sequence of Events Including Foundation and
Slotted Connection Behavior
Since the nonlinear effects of the panel-to-foundation joints were not included in the
analytical model, the model was unable to determine the effect of yielding these elements
on the overall behavior of the experimental specimen. However, it is suitable to include
the yielding of the panel-to-foundation joint in the sequence of nonlinear events. The
49
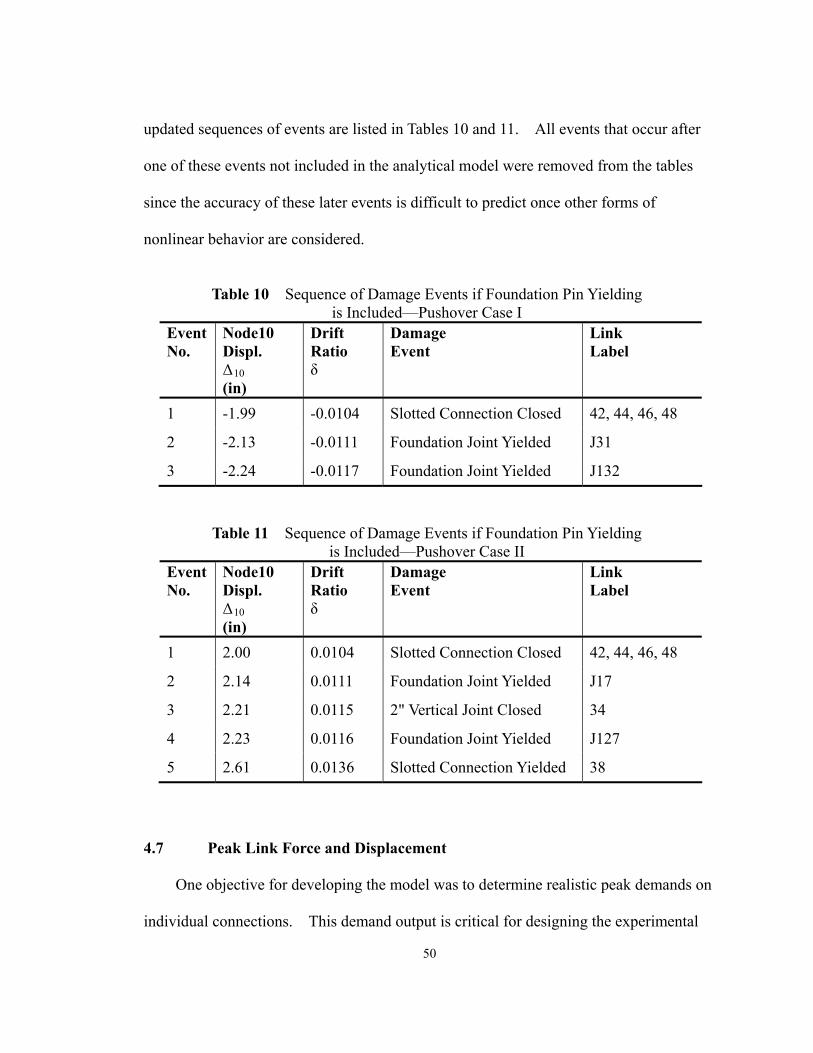
updated sequences of events are listed in Tables 10 and 11. All events that occur after
one of these events not included in the analytical model were removed from the tables
since the accuracy of these later events is difficult to predict once other forms of
nonlinear behavior are considered.
Table 10 Sequence of Damage Events if Foundation Pin Yielding
is Included—Pushover Case I Event No.
Node10 Displ. Δ10 (in)
Drift Ratio δ
Damage Event
Link Label
1 -1.99 -0.0104 Slotted Connection Closed 42, 44, 46, 48
2 -2.13 -0.0111 Foundation Joint Yielded J31
3 -2.24 -0.0117 Foundation Joint Yielded J132
Table 11 Sequence of Damage Events if Foundation Pin Yielding is Included—Pushover Case II
Event No.
Node10 Displ. Δ10 (in)
Drift Ratio δ
Damage Event
Link Label
1 2.00 0.0104 Slotted Connection Closed 42, 44, 46, 48
2 2.14 0.0111 Foundation Joint Yielded J17
3 2.21 0.0115 2" Vertical Joint Closed 34
4 2.23 0.0116 Foundation Joint Yielded J127
5 2.61 0.0136 Slotted Connection Yielded 38
4.7 Peak Link Force and Displacement
One objective for developing the model was to determine realistic peak demands on
individual connections. This demand output is critical for designing the experimental
50

testing protocol. Since the system may be unstable after the panel-to-foundation joints
yield at Δ10 of -2.13" and +2.14", the demands determined for Δ10 = ±10" were
considered unrealistic. For a more realistic upper bound of connection demands, the
peak forces and displacements of the thirty-one nonlinear links were plotted on their
corresponding force-displacement relationships at Δ10 = ±3.00".
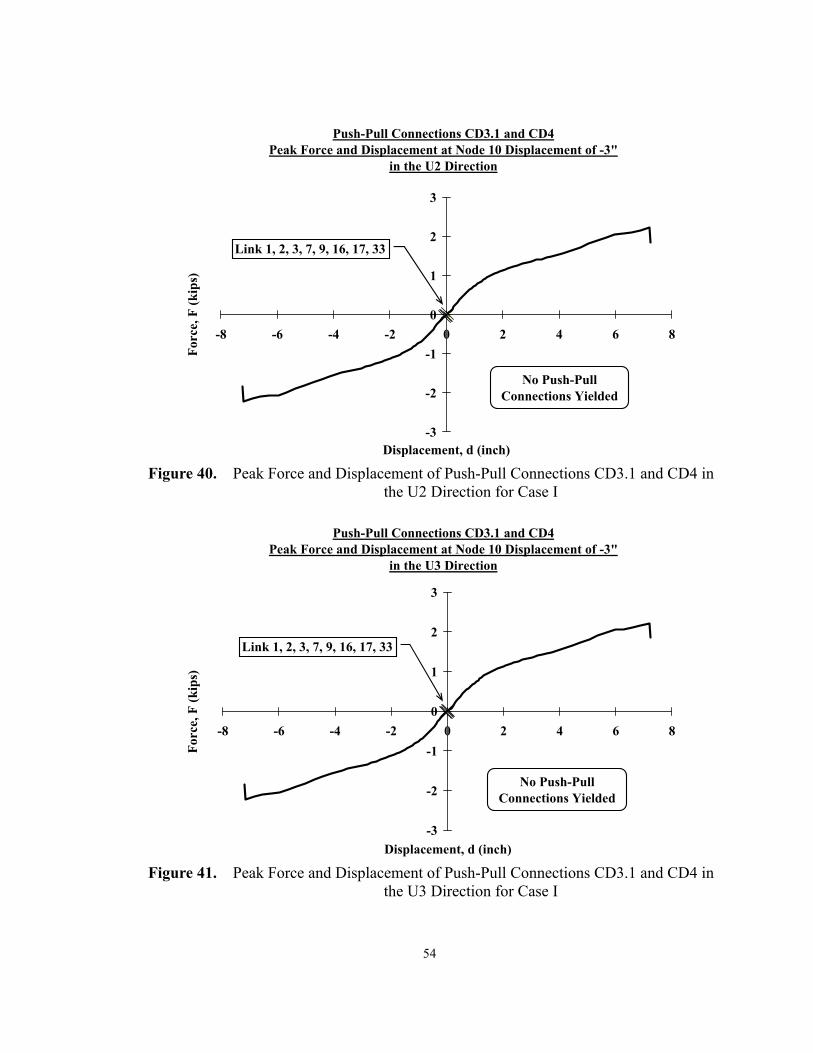
For the pushover load applied in the negative Y direction, the peak link forces and
displacements are shown in Figures 35 through 41. Figure 37 shows that slotted
connections 42, 44, 46, and 48 have closed when the Δ10 reaches -3.00". Other figures
(Figure 35, 36, 38, 39, 40, and 41) show that other links, including all gap links, CD3.1,
CD4, and CD6 (Links 38 and 40), neither closed nor yielded.
¾" Gap ElementsPeak Force and Displacement at Node 10 Displacement of -3"
0
10
20
30
40
50
-3 -2 -1 0 1 2 3
Displacement, d (inch)
For
ce, F
(ki
ps)
Link 13, 15, 19, 21, 23, 25, 27
No ¾" GapElements Closed
Figure 35. Peak Force and Displacement of ¾" Joints in the U2 Direction for Case I
51
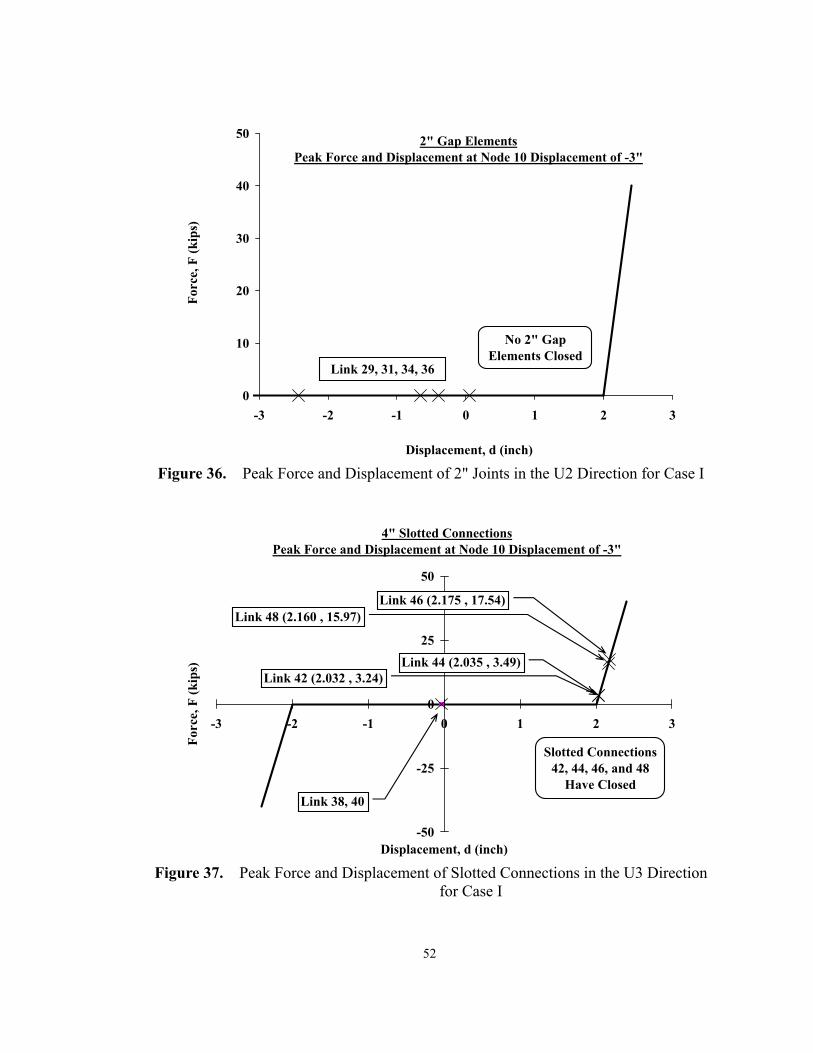
2" Gap ElementsPeak Force and Displacement at Node 10 Displacement of -3"
0
10
20
30
40
50
-3 -2 -1 0 1 2 3
Displacement, d (inch)
For
ce, F
(ki
ps)
Link 29, 31, 34, 36
No 2" GapElements Closed
Figure 36. Peak Force and Displacement of 2" Joints in the U2 Direction for Case I
4" Slotted ConnectionsPeak Force and Displacement at Node 10 Displacement of -3"
-50
-25
0
25
50
-3 -2 -1 0 1 2 3
Displacement, d (inch)
For
ce, F
(k
ips)
Link 46 (2.175 , 17.54)
Link 38, 40
Link 48 (2.160 , 15.97)
Link 44 (2.035 , 3.49)Link 42 (2.032 , 3.24)
Slotted Connections42, 44, 46, and 48
Have Closed
Figure 37. Peak Force and Displacement of Slotted Connections in the U3 Direction
for Case I
52
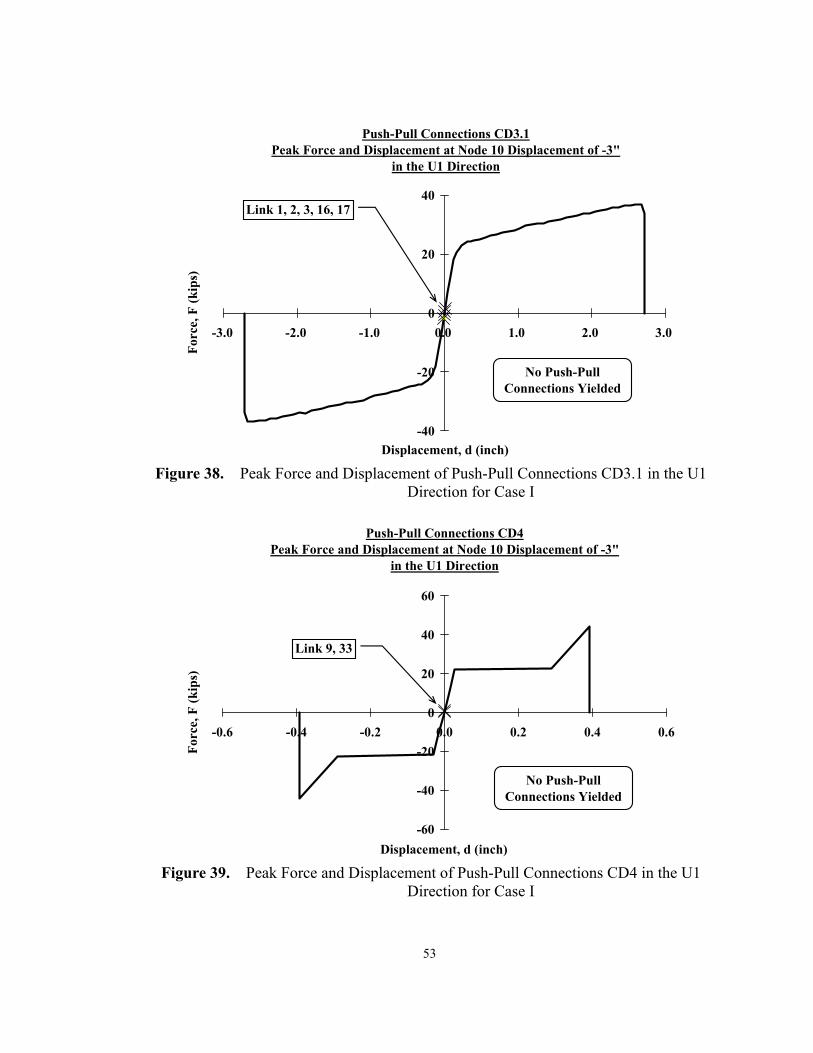
Push-Pull Connections CD3.1Peak Force and Displacement at Node 10 Displacement of -3"
in the U1 Direction
-40
-20
0
20
40
-3.0 -2.0 -1.0 0.0 1.0 2.0 3.0
Displacement, d (inch)
For
ce, F
(ki
ps)
Link 1, 2, 3, 16, 17
No Push-PullConnections Yielded
Figure 38. Peak Force and Displacement of Push-Pull Connections CD3.1 in the U1
Direction for Case I
Push-Pull Connections CD4Peak Force and Displacement at Node 10 Displacement of -3"
in the U1 Direction
-60
-40
-20
0
20
40
60
-0.6 -0.4 -0.2 0.0 0.2 0.4 0.6
Displacement, d (inch)
For
ce, F
(k
ips)
Link 9, 33
No Push-PullConnections Yielded
Figure 39. Peak Force and Displacement of Push-Pull Connections CD4 in the U1
Direction for Case I
53
Push-Pull Connections CD3.1 and CD4Peak Force and Displacement at Node 10 Displacement of -3"
in the U2 Direction
-3
-2
-1
0
1
2
3
-8 -6 -4 -2 0 2 4 6 8
Displacement, d (inch)
For
ce, F
(k
ips)
Link 1, 2, 3, 7, 9, 16, 17, 33
No Push-PullConnections Yielded
Figure 40. Peak Force and Displacement of Push-Pull Connections CD3.1 and CD4 in
the U2 Direction for Case I
Push-Pull Connections CD3.1 and CD4Peak Force and Displacement at Node 10 Displacement of -3"
in the U3 Direction
-3
-2
-1
0
1
2
3
-8 -6 -4 -2 0 2 4 6 8
Displacement, d (inch)
For
ce, F
(ki
ps)
Link 1, 2, 3, 7, 9, 16, 17, 33
No Push-PullConnections Yielded
Figure 41. Peak Force and Displacement of Push-Pull Connections CD3.1 and CD4 in
the U3 Direction for Case I
54
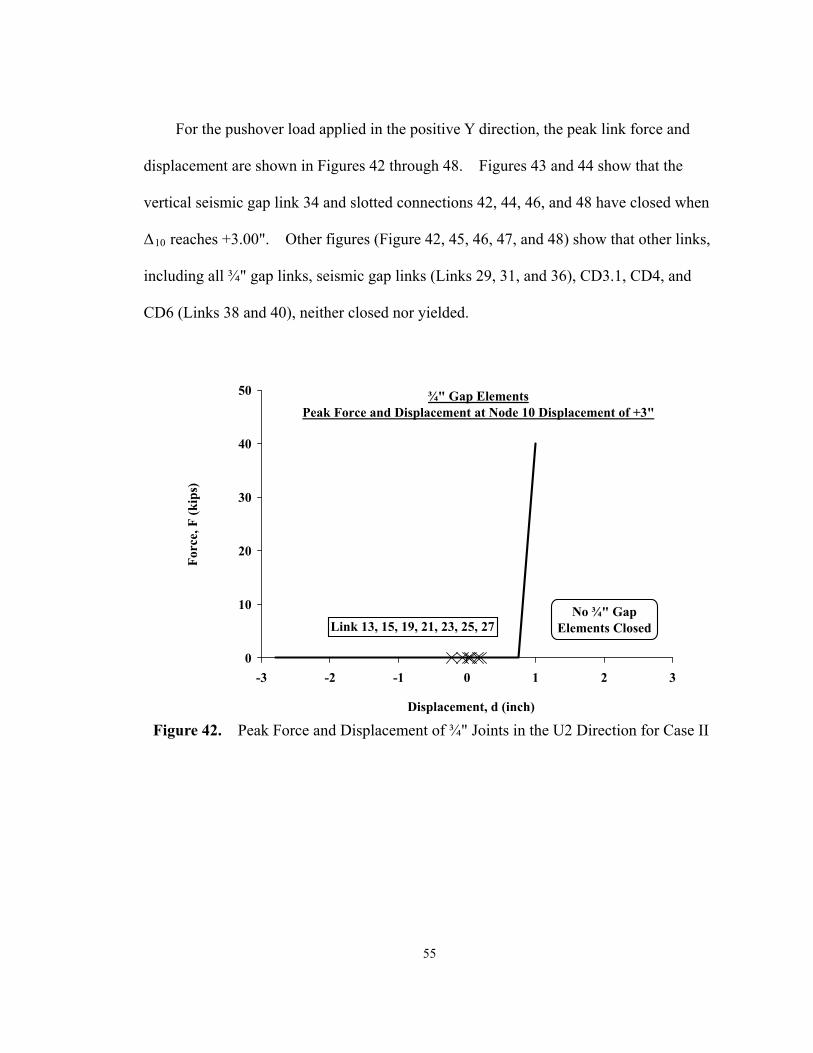
For the pushover load applied in the positive Y direction, the peak link force and
displacement are shown in Figures 42 through 48. Figures 43 and 44 show that the
vertical seismic gap link 34 and slotted connections 42, 44, 46, and 48 have closed when
Δ10 reaches +3.00". Other figures (Figure 42, 45, 46, 47, and 48) show that other links,
including all ¾" gap links, seismic gap links (Links 29, 31, and 36), CD3.1, CD4, and
CD6 (Links 38 and 40), neither closed nor yielded.
¾" Gap ElementsPeak Force and Displacement at Node 10 Displacement of +3"
0
10
20
30
40
50
-3 -2 -1 0 1 2 3
Displacement, d (inch)
For
ce, F
(ki
ps)
Link 13, 15, 19, 21, 23, 25, 27No ¾" Gap
Elements Closed
Figure 42. Peak Force and Displacement of ¾" Joints in the U2 Direction for Case II
55

2" Gap ElementsPeak Force and Displacement at Node 10 Displacement of +3"
0
10
20
30
40
50
-3 -2 -1 0 1 2 3
Displacement, d (inch)
For
ce, F
(ki
ps)
Link 34(2.049 , 4.94)
Link 29, 31, 36
Only Link 34 Closed
Figure 43. Peak Force and Displacement of 2" Joints in the U2 Direction for Case II
4" Slotted ConnectionsPeak Force and Displacement at Node 10 Displacement of +3"
-50
-25
0
25
50
-3 -2 -1 0 1 2 3
Displacement, d (inch)
For
ce, F
(ki
ps)
Link 42 (-2.013 , -1.32)Link 44 (-2.015 , -1.48)
Link 48 (-2.168 , -16.81)
Link 46 (-2.184 , -18.44)
Link 38, 40
Slotted Connections42, 44, 46, and 48
Have Closed
Figure 44. Peak Force and Displacement of Slotted Connections in the U3 Direction for Case II
56

Push-Pull Connections CD3.1Peak Force and Displacement at Node 10 Displacement of +3"
in the U1 Direction
-40
-20
0
20
40
-3 -2 -1 0 1 2 3
Displacement, d (inch)
For
ce, F
(k
ips)
Link 1, 3, 16, 17
Link 2
No Push-PullConnections Yielded
Figure 45. Peak Force and Displacement of Push-Pull Connections CD3.1 in the U1
Direction for Case II
Push-Pull Connections CD4Peak Force and Displacement at Node 10 Displacement of +3"
in the U1 Direction
-60
-40
-20
0
20
40
60
-0.6 -0.4 -0.2 0.0 0.2 0.4 0.6
Displacement, d (inch)
For
ce, F
(k
ips)
Link 9, 33
No Push-PullConnections Yielded
Figure 46. Peak Force and Displacement of Push-Pull Connections CD4 in the U1
Direction for Case II
57

Push-Pull Connections CD3.1 and CD4Peak Force and Displacement at Node 10 Displacement of +3"
in the U2 Direction
-3
-2
-1
0
1
2
3
-8 -6 -4 -2 0 2 4 6 8
Displacement, d (inch)
For
ce, F
(ki
ps)
Link 1, 2, 3, 7, 9, 16, 17, 33
No Push-PullConnections Yielded
Figure 47. Peak Force and Displacement of Push-Pull Connections CD3.1 and CD4 in
the U2 Direction for Case II
Push-Pull Connections CD3.1 and CD4Peak Force and Displacement at Node 10 Displacement of +3"
in the U3 Direction
-3
-2
-1
0
1
2
3
-8 -6 -4 -2 0 2 4 6 8
Displacement, d (inch)
For
ce, F
(ki
ps)
Link 1, 2, 3, 7, 9, 16, 17, 33
No Push-PullConnections Yielded
Figure 48. Peak Force and Displacement of Push-Pull Connections CD3.1 and CD4 in
the U3 Direction for Case II
58

Chapter 5
Conclusions and Recommendations
The inelastic behavior of the one-story, three-dimensional precast concrete cladding
system was successfully evaluated in this project. Many critical engineering parameters
were quantified and the overall behavior of the specimen was defined both qualitatively
and quantitatively. The result of each of the original research objectives were:
1. A nonlinear analytical model of the experimental test specimen was developed using
SAP2000. Systematic development of the model through incremental
implementation of the nonlinear behavior increased the confidence in model
accuracy.
2. The pushover curves for monotonic loading of the system in both the positive and
negative directions were quantified and graphed. Closing of the slotted
panel-to-panel connection (CD6) exhibited the most critical influence on the
pushover curves.
3. Force-deformation relationships and peak experimental demands for each of the link
connections were defined.
4. Damage events related to drift ratio of the specimen were sequenced and tabulated.
5. Potential revisions of the model to allow for more accurate analysis to quantify
additional levels of lateral displacement were identified.
A nonlinear analytical model was developed and used to evaluate the inelastic
behavior of the cladding system. The pushover curves (Figures 28 and 29) and the
links’ force-displacement relationships (Figures 35 through 48) for the monotonic loading
59
of the system for lateral displacement in both the positive and negative directions were
obtained in the final analysis. Based on these analytical results, the sequence of damage
events (Tables 8 through 11) and the potential torsional displacement of the experimental
specimen (Figure 30) were determined.
5.1 Research Findings
1. The inelastic behavior of the system is dominated by the slotted panel-to-panel
connection (CD6).
2. The behavior of the model in the positive and negative analyses was similar except
that the vertical seismic gap did not close throughout the negative analysis.
3. The push-pull connections (CD3.1 and CD4) did not yield throughout the analysis.
4. Global torsion of the system is minimal even though the system is asymmetrical.
5. The limited effect of the push-pull connection and the lack of 3-D torsional effects
suggest that the long spandrel portion of the experimental test specimen can be
reduced and possibly eliminated to save money. The remaining short spandrel
portion of the model may be sufficient to investigate the inelastic behavior of the
cladding system.
6. The potential failures of the foundation connection due to weld fracture and the
slotted connection under force in the out-of-panel direction were not considered in
the original model due to a lack of suitable analytical modeling data. These issues
were investigated through an additional study of the results from the final analysis.
The sequences of events including the yielding of the foundation connection were
60
determined and listed in Tables 11 and 12.
7. For the pushover load applied in the positive Y direction, the foundation joint J17 is
expected to yield at Δ10 = +2.14" (δ = +0.0111) while the slotted connection 38
would yield in the out-of-panel direction at Δ10 = +2.61" (δ = +0.0136). These two
events occurred nearly simultaneously. The actual sequence of these two events
may depend greatly upon the workmanship of the fabrication of the test specimen.
5.2 Recommendations for Future Work
Upon reflection of the work conducted and the results obtained, the author makes
the following suggestions to further progress toward achieving the overall research goal:
1. The nonlinear properties of the panel-to-foundation and slotted panel-to-panel
connections should be quantified and the model should be updated to increase the
accuracy of the analysis.
2. The original design of the experimental test specimen may be simplified to a
two-dimensional test configuration due to the limited effect of the push-pull
connections and the lack of three-dimensional torsional effect. Simultaneously the
analytical model may be simplified to match this reduced test specimen.
61
References Bachman, Robert E., Hamburger, Ronald O., Comartin, Craig D., Rojahn, Christopher, and Whittaker, Andrew S. (2000). “ATC-58 framework for performance-based design of nonstructural components.” Proceedings of Seminar on Seismic Design, Performance, and Retrofit of Nonstructural Components in Critical Facilities. Applied Technology Council, ATC-29-2. Los Angeles, CA. Charney, Finley A. and Harris, James R. (1989). “The effect of architecural precast concrete cladding on the lateral response of multistory buildings.” Proceedings: Architectural Precast Concrete Cladding – It’s Contribution to Lateral Resistance of Buildings. PCI, November 8-9, Chicago. Goodno, Barry J. and Craig, James I. (1989). “Historical overview of studies on the contribution of cladding to lateral resistance of buildings.” Proceedings: Architectural Precast Concrete Cladding – It’s Contribution to Lateral Resistance of Buildings. PCI, November 8-9, Chicago. Le, Phoung (2006). Design of a Precast Concrete Cladding System for the 9-Story SAC LA Building. Independent Study Report - CE298. Department of Civil and Environmental Engineering, San Jose State University. McMullin, Kurt, “Nonlinear Connection Database,” September 2008 McMullin, Kurt, Ortiz, Maggie, and Cheung, Kai Sum, “Seismic Performance of Cladding, Window Wall and Plumbing Systems.” San José State University Research Foundation. National Institute of Standard and Technology (NIST). (1995). Literature review on seismic performance of building cladding systems. Report No. NIST-GCR 95-681. Building and Fire Research Laboratory, NIST, Gaithersburg, MD. Palsson, H., Goodno, B., Craig, J. I. and Will, K. M. (1984). “Cladding influence on dynamic response of tall buildings.” Earthquake Engineering and Structural Dynamics. Volume 12 Smith, Bryan S., and Gaiotti, Regina (1989). “Architectural Precast Concrete Cladding – It’s Contribution to Lateral Resistance of Buildings.” PCI, November 8-9, Chicago.
62

63
Song, Jianlin; and Bruce R. Ellingwood, M.ASCE, ‘Seismic Reliability of Special Moment Steel Frames with Welded Connections: I,’ Journal of Structural Engineering, April, 1999. Stratta, James L. and Wyllie, Loring A. (1979). “Reconnaissance Report: Fruilli, Italy Earthquakes of 1976.” Earthquake Engineering Research Institute, Oakland, CA.


![A COMPARITATIVE STUDY ON NONLINEAR BEHAVIOUR OF … · the two important guidelines availa ble for pushover analysis[13]. The pushover analysis can be done in two methods, they are](https://img.pdfslide.us/doc/110x75/608531a94b137e7cc540f396/a-comparitative-study-on-nonlinear-behaviour-of-the-two-important-guidelines-availa.jpg)