Embed Size (px)
Citation preview

-:7:
U.S. DEPARTMENT OF COMMERCENational Technical Information Service
AD-A027 645
NONLINEAR LIFTING LINE THEORY FOR PREDICTING STALLINGI INSTABILITIES ON WINGS OF MODERATE ASPECT RATIO
GENERAL DYNAMICS/CONVAIR
PREPARED FOR
NAVAL AIR AND DEVELOPMENT CENTER
15 JUNE 1976
4 w. wnm • m w m w NMw

Unclassified[ SECURITY CLASSIFICATION OF THIS PAGE (*?#en Data Entered)
REPORT DOCUMENTATION PAGE READ INSTRUCTIONSBEFORE COMPLETING FORM
1. REPORT NUMBER 2 GOVT ACCESSION No. 3. RECIPIENT'S CATALOG NUMBER
CASD-NSC-76-0014. TITLE (and Subtitle) 5. TYPE OF REPORT & PERIOD COVEnED
Nonlinear Lifting Line Theory for Predicting Final Technology Report
Stalling Instabilities on Wings of Moderate Aspect 6/30/75 - 6/15/76Ratto 6. PERFORMING ORG. RFPORT NUMBER
7. AUTHOR(s) S. CONTRACT OR GRANT NUMBER(s)
S. T. Piszkin N62269-75-C-0356V, E, S. Levinsky
9. PERrORMING ORGANIZATION NAME AND ADI)RESS 10. PROGRAM ELEMENT. PROJECT. TASK
AREA & WORK UNIT NUMBERS
General Dynamics Convair Division A 0,0/5001 Kearny Villa Road, San Diego, Calif. 92138
I,. CONTROLLING OFFICE NAME AND ADDRESS 12. REPORT DATE
Naval Air And Development Center, Code 3015 June 15, 1976P13. NUMBER OF PAGESWarminster, PA 18974•~ q7
14 MONITORING AGENC.f NAME 8 ADDRESS(II different from Controlilng Office) 15. SECURITY CLASS (of this tepcrt)
S• Unclassified
IS* DECLASSIFICATION /DOWNGRADINGSCHEDULE
r' •,16. DISTRIBUTION STAI EMENT (of this Report)
Approved for Public Release; Distribution Unlimited
17. DISTRIBUTION STAT'MENT (.3f the abstrAct entered In Block 20, It different from Report)
18 SUPPt EMENTARY NOTES
19. KEY WORDS (Continue on reverse idi, If necessary ad Identify b'y block number)
Departure Spin EntryHysteresis StallLifting Line Theory Unsteady AerodynamicsNonlinear Aerodynamics Zero Beta Moments
20. ABSTRACT (Continue on reverse side If necessary and identify by block number)
A computational procedure has been developed for predicting the time dependentlongitudinal and lateral aerodynamic characteristics of wing-body configurations at
angles of attack up to and beyond stall. The purpose of the proceduis is to providethe aircraft designer with a tool for simulating and alleviating such adverse wing
stalling characteristics as wing rock, wing drop, loss of roll control or roll controlreversal, etc. and thereby lead to the design of aircraft with improved stall,
DD IFJAo7 1473 COITION OF I NOV65 IS OBSOLETE Unclassified"SECURITY CLASSIFICATION OF THIS PAGE (When Date Entered)
UnclassifiedSECURITY CLASSIFICATION OF THIS PAGE(Pha Det.3, Entered)
departure and spin resi3tance characteristics.
The procedure is based on nonlinear lifting line theory which has been modified toinclude unsteady wake effects. A discrete vortex latzice representation is used for thetime dependent wake, whereas a finite element ro-presentation is used to describe thetime dependent wing load distribution, wbich is assuned concentrated along a singleline at the 25% chord position. In axordanccv with lifting line theory, each chordwisesection is assumed to behave like a two-dimnensional airfoil at an effective angle ofattack defined by geometry and induced flcoe angularity. The usual assumptions of lift-ing line theory apply to the method, viz. moderate to high wing aspect ratio, moderatesweep angle and incompressible flow. Additional assumptions are also implicit regard-ing effects of the unsteady now or aection chordwise load distributions and stall.
Arbitrary nonlinear section lft curves may be introduced, and time histories of theoverall wing longitudinal and l.ateral aerodynamic characteristics and spanwise loaddistribution may be examined as the wing is pitched (up or down) through the stall rangeLateral asymmetries (e. g. aileron deflection) may also be introduced and removedduring the pitching motion to simulate effects of control actuation.
Calculatious are presented which compare the method with existing theory and testdata and which show effects of various planform modifications and airfoil sectionvariations on wing stalling characteristics. For airf fols which have a negative liftcurve slope (subsequent to stall), the solutions sometimes exhibit abrupt losses in lift,lift hysteresis, and asymmetric stall (even with zero lateral asymmetry). Theseresults are due to the existence of multiple solations to the lifting line equations, whichhave been known to occur with negative section lift curves (e. g. References 1 - 3). Thetransient flow nature of the present formulation may provide a means of choosingbetween the various possible loadings at a given angle of attack.
The theory predicts that lift hysteresis during stall is strongly influenced by wing plan-form shape and by the steepness of the negative lift curve slope beyond stall. Increasingaspect ratio and decreasing the section negative lift curve slope tend to reduce stallhysteresis. Laterally asymmetrical span load distributions are produced, even at zeroyaw, by introducing and then removing an aileron deflection. This gives rise to a 'zerobeta" rolling and yawing moment not unlike those observed in tests at post stall anglesof attack. The zero beta asymmetries are shown to be alleviated by the same factorswhich reduced stall hysteresis. Definitive wind tunnel tests involving dynamicmeasurements of aerodynamic force and moment coefficients and of. span loaddistribution are required to evaluate the accuracy of the method.
UnclassifiedSECURITY CLAS$IFICATION OF THIS PAGE(Wten P8al Entatud)
FOREWORD AND DEDICATION
This research was undertaken by the Convair Division of General Dynarics Corporation,San Diego, California, under Naval Air and Development Center Contract N62269-75-C-
L 0356. The NADC Scientific Officer was Mr. A. P~rantan, Code 3015A. The programwas administered by Professor L. Schmidt, U.S. Navy Pr itgraduate School, who wasacting as Navy Technology Administrator for Aerodynamics, Code 320D.
The Principal Investigator was Mr. Stanley T. Piszkin, who passed away suddenly andwithout warning shortly after completing thN formulatior, and computer check-out phasesof the contract. Mr. Piszkin also performed the majority of the computer calculationsand wab able to demonstrate the occurance nf zero beta rolling -'1id yawing moments.The second author was privfledged to have worked closely with Mr. Piszkin during theformulative stages of the program, and hopes that he has been able to convey the ideasand results of Mr. Piszkin in a clear and precise manner.
Mr. Piszkin, as an aerodynamicist and as a private pilot with experience in aerobatics,
not only dealt with the theory of stalling instabilities from a theoretical standpoint,i but also from a very practical flight safety point of view. It was his hope that these
efforts would someday lead to a better understarding of the nature and cause of theadverse departure and spin entry characteristics of high performance aircraft andthereby result In improved flight safety. It is to this goal and to Mr. "2IszkIn'smemory that the present report haa been dedicated.
The authors wish to thank Mr. Herbeit Sinnen for his efficient progranammng of thecomputational procedure, and for his cooperation in acquainting the second authorwith its use when the need arose.
[ills W,,.' S1.314,
-:. 143 SE9u 0 D D CS~~~........................ ... ... _
.... .. .........
SI

ABSTRACT
A computational procedure has been developed for predicting the time dependentlongitudinal and lateral aerodyPamic characteristics of wing-body configurations atangles of attack up to and beyond stall. The purpose of the procedure is to providethe aircraft designer with a tool for simulating and alleviating such adverse wingstalling characteristics as wing rock, wing drop, loss of roll control or roll controlreversal, etc., and thereby should lead to the design of air-,raft with improved stall,departure and spin resistap-ee chazacteristics.
The procedure is based on no linear lifting line theory which has been modified to"P include unsteady wake effects. A discrete vortex lattice representation is used for
the time dependent wake, whereas a finite element represente.tion is used to describethe time dependent wing load distribution, which is assumed conrentrated along asingle line at the 25% chord position. In accordance with lifting line theory, eachchordwise section is assumed to behave like a two-dimensiozal airfoil at aneffective angle of attack defined by geometry and induced flow angularity. The usualassumptions of lifting line theory apply to the method, viz. moderate to high wingaspect ratio, moderate sweep angle and incompressible flow. Additional
R assumptions are also implicit regarding effects of the unsteady flow on section chord-wise load dlstributions ind stall.
Arbitrary nonlinear section lift curves may be introduced. ard time histories of theoverall wing longitudinal and lateral aerodynamic characteristics and spanwise loaddistribution may be examined as the wing Is pitched (up or down) through the stallrange. Lateral asymmetries (e.g. aileron deflection) may also be introduced andremoved during the pitching motion to simulate effects of control actuation.
Calculations are presented which compare the method with existing theory and testdata and which show effects of various planform modifications and airfoil sectionvariations on wing stalling characteristics. For airfoils which have a negative liftcurve slope (subsequent to stall), the zoiutions sometimes exhibit abrupt losses inlift, lIMt hysteresis, and asymmetric stall (even with zero lateral asymmetry).These 7esults are due to the existence of multiple solutions to the lifting line equations,which I ave been known to -ccur with negative section lift curves (e.g. References1-3). The transient flow nature of the present formulation may provide a means of
5 choosing between the various possible loadings at a given angle of :&iack.
The theory predicts that lift hysteresis during stall is strongly 1 fluenced by wingplanform shape and by the steepness of the negative lift curve zlope beyond stall.Increasing aspect ratio and drc-reesing the section negative lift curve slope tend toreduce stall hysteresis. Laterally asymmetrical span load distributions are produced,
v
even at zero yaw, by irtroducing and then removtog an aleron deftection Thisgives rise to a "zero beta" rolling and yawing moment nut unlike thone observedin 'Csts at post stall angles of attack. The &ero beta asymmetries are shown to bealieviated by the same factors which reduced stall hysteresis. Definitive wind tunneltests involving dynamic measurements of aerodynamic force and moment coefficientsand of span load distribution are required te evaluate the accuracy of the method.
I
&
ivi
TABLE OF CONTENT
PageLIST OF FIGURES ix
SYMBOLS xiii
1 INTRODUCTION 1
2 THEORY AND ASSUMPTIONS 5
2.1 VORTEX SYSTEM 52, 2 LIFTING LINE EQUATIONS 6L. 3 SIMPLIFICATIONS FOR A LINEAR LIFT CURVE 92.3.1 Linear Lift Curve 102.3.2 Equivalence With Weissinger Theory 102.4 SIMPLIFIED SOLUTIONS FOR A NONLINEAR 14
LIFT CURVE2. c GENERALIZED FORM OF THE KUTTA- 19
JOUKOWSKI LAW FOR UNSTEADY FLOW
3 METHOD OF SOLUTION AND ITERATION PROCEDI) TRE 23
3.1 ITERATION PROCEDURE 233.1.1 Initial Solution 233.1.2 Solution at Subsequent Time Steps 243.1.3 Stability of Iteration Procedure 253.2 COMPUTATION OF FORCE AND MOMENT 27
COE FFIC IENT'S
4 SAMPLE CALCULATIONS 29
4.1 COMPARISON WITH AVAILABLE THEORY 294.2 COMPARISON WITH TEST DATA 304.3 PARAMETRIC STUDIES 314.3.1 Effect of Negative Lift Curve Slope and Aspect 31
Ratio
4.3.2 Effects of Taper Ratio, Sweep Angle and Twist 324.3.3 Zero Beta Rolling (and Yawing) Moments 33
4.3.4 Effects of Number cf Elements 334.4 HYSTERESIS CORRELATION 34
CONCLUSIONS AND RECOMMENDATIONS 35
5.1 CO,' CLUSIONS 355.2 RECOMMENDATIONS 36
REFERENCES 39
vit

LIST OF FIGURES
Figure Page
1 Nonlinear Two-Dimensional Section Lift Curves Which 41Yield Multiple Solutions of the Lifting Line Equations
2 Wing Planform Geometry and Vortex Element Placement 42
3 Vortex Elements for Unsteady Wake Formulation 43
4 Image System Trailing Element Geometry 44
5 Two-Dimensional Representations of Unsteady Wake 45
6 Comparison of Discrete Vortex Wake Model with Wagner 46Function (Continuous Vortex Wake) for Two-DimensionalFMow
7 Possible Symmetrical and Asymmetrical Loadings with 47Tri-Linear Lift Curve when yp> (y2"
8 Asymmetric Loadirgs with One Panel Unstalled (dCL/dc=a) 48and the Other Panel Partially Stalled (dCL/da = -b).
9 Asymmetric Loadings for Wings with One Panel Unstalled 49(dC.u/da=a) and theOther Fully Stalled (dCL/da = 0)
10 Example of the Occurance of Six Possible Loadings with 50a Tri-Linear Lift Curve
11 Predicted Stability and Convergence Limits for Iteration 51Procedure with a Single Vortex Element
12 Effect of a Step Change in Angfe of Attack on Lift, AIR = 6 52
13 Effect of a Step Change in Angle of Attack on Span Load 53Distribution, AR = 6.
14 Effect of Aspect Ratio on Lift Following a Step Change In 54
Angle of Attack
15 Comparison of Present Method with Steady State Theories 55for Rectangular Wing
16 Planform Geometry and Paneling Used for T-2C 56
Computations (N = 14)
Lx
LIST OF FIGURES (M. NT'D)
Figure Page
17 Sec'on Characteristics of NAC.;, 64 A212 and T-2C 57Airfoil s
18 Nonlinear Airfoil Section Characferistics Used for Para- 59
metric Calculations
is Comparison of Present Method with T-2C Wind Tunnel Data 61
for Lift
20 Comparison of Present Method with T-2C Wind Tunnel Data 62for Rolling Moment at Zero Yaw Angle
21 Effect of Negative Lift Curve Slope on Lift Hysteresis 63Aspecl. Ratio 5. 07
22 Effect of Negative Lift Curve Slope on Lift Hysteresis, 65Aspect Ratio 8. 0
23 Effect of Negative Lift Curve Slope on Lift Hysteresis. 67
Aspect Ratio 12.0
24 Effect of Negative Lift Curve Slope on Rolling Moment 69HIysteresis at 10° Sideslip Angle, Aspect Ratio 5.07
25 Effect of Negative Lift Curve Slope on Rolling Moment 70Hysteresis at 100 Sideslip Angle, Aspect Ratio 8.0
26 Effect of Negative Lift Curve Slope on Rolling Moment 71Hysteresis at 100 Sideslip Angle, Aspjct Ratio 12.0
27 Effect of Taper Ratio on Lift Hysteresis, Aspect Ratio 72
8.0, Lift Curve #4 from Fig. 18
28 Effect of Taper Ratio on Lift Hysteresis, Aspect Ratio 738.0, Lift Curve #6 from Fig. 18
29 Effect of Taper Ratio on Lift Hysteresis, Aspect Ratio 748.0, Lift Curve #7 from Fig. 18
30 Effect of Negative Lift Curve Slope on Lift Hysteresis, 75
Aspect Ratio 8.0, Sweepback Angle 20°
x
LIST OF FIGURES (CONT'D)
Figure Page
31 Effewt of Twist on Lift Hysteresis, Aspect Ratio 8. 0, 2D 76Lift Curve #4 from Figure 18
32 Effeci of Twist on Lift Hysteresis, Aspect Ratio 8.0, 21) 77Lift Curve #6 from Figure 18
33 Effect of Twist on Lift Hysteresis, Aspect Ratio 8. 0, 21) 78Lift Curve #7 from Figure 18
34 Effect of Roll Perturbation at a = 14.4 Degrees on 79Lift Hysteresis, Aspect Ratio ?07
35 Effect on Roll Perturbation at a p = 14.4 Degrees on Zero 80Beta Rolling Moment, Aspect Ratio 5.07
36 Effect of Roll Perturbation at ap = 12.4 Degrees on 81Lift Hysteresis, Aspect Ratio 8. 0
37 Effect of Roll Perturbation at ap = 12.4 Degrees on Zero 82Beta Rolling Moment, Aspect Ratio 8. 0
38 Effect on Number of Spanwise Vortex Elements N 83on Lift Hysteresis, Aspect Ratio 5.7
39 Lift Hysteresis Correlation 84
xi
SYMBOLS
a section lift curve slope
Asl aspect ratio
b absolute value of maximmn negative lift curve slope, also wing span
C weighting factor in iteration procedure
c local wing chord
CD drag coefficient
CDp profile drag coefficient
CL lift coefficient
Ck rolling moment coefficient
CLo value of CL at c 0
CMI1 pitching moment coefficient
CN yawing mnment coefficient
Cy side fcrce coefficient
11 width of vortex elements in y direction
iw' incidence angle of wing root with respect to fuselage centerline
L lift
M maximum number of spanwise rows of vortex elements (see Figure 3)
N number of vortex element across exposed span of wing
n number of chord lengths traveled by wake vortex elements per time step
RB fuselage radius
RI radial distance of image vortex from center of fuselage in y-z plane
Rp radial distance of wing trailing vortex element from fuselage centerlinein y-z plane
S wing reference area
t time
V freestream velocity
W downwash matrix
xiii
w downwash velocity (positive in negative z direction)
x, y, z body axis coordinate system with x and y axes in chordwise and spanwisedirections, respectively, (see Figure 2)
Xcp distance of control point from leading e"re
a' D downwash angle, Equation (6)
a EFF effective section angle of attack
geometric angle of attack at wing root
ST wir.Z twist angle with respect to wing root
1 maximum angle of attack for linear region of tri-linear section lift curve
c02 minimum angle of attack for fully stalled region of tri-linear sectionlift curve.
0 2D downwash ar:l- - .e to two-dimensional bound vortex element, Equation
(9)
c'3D downwash angle due to three-dimensional bound vortex element,
Equation (7)
side sli*p angle
circulation of vortex element
y wing dihedral angle
downwash influence coefficient used with tri-linear lift curve slope
incremental
angle defined by Equation (11) and shown in Figure 4, also KroneckerDelta symbol with subscripts ij
L(YR differential lateral control deflection
E distance of first shed vortex behind wing trailing edge
A local quarter chord sweep angle
p density
X taper ratio
Subscripts
A aft shed vortex element
B bound or shed vortex elen.:nt, also body upwash angle
F forward bound or shed vortex element
"I image vortex elementxtv
i index of spa,. ".-rxtrol station
j , k indicies locatng ¢,Yex elements along the span (j) and in the wake (k)
"L left trailing vortex
A right trallng vot.e., a-lso roll asymmetry angle
T trailing vortex element, also twist angle
Superscripts
- mean value
S( ) iteration number
normalized circulation, r = 2 c/V
xv
j I.4 1
INTRODUCTION
As is well known, there are a large number of aerodynamic effects which may limitthe maneuverability of a fighter, especially as thrust to weight ratios, structuralplacards and physiological limits on the pilot are raised. These include such phenom-ena as shock induced buffet, wing rock and wing drop (probably due to asymmetricalseparation with a subsequent rolling-yawing motion), nose slicing (possibly due to theestablishment of asymmetrical flow and yawing moments in the nose region), pitch-up(loss of longitudinal stability due to flow separation at the tips), loss of lateral stabil-ity at high angles of attack, loss of roll control and roll control reversal at high anglesof attack, and large drag increases (whic.h lower the maxim.um sustained load factor).It is generally believed that some type of flow separation is responsible for each ofthese phenomena. The present report deals with the development of a simpl ifiled aero-dynamic tool for estimating the aerodynamic characteristics of wings and wing-bodyconfigurations of moderate to high aspect ratio undergoing transient pitching motionwith flow separation. Hence, the method developed in this study should prove usefulfor the prediction, simulation and possible inhibition of those adverse stallingphenomena included within the framework of the theory.
As noted above, the present formulation is for wings of moderate to high aspect ratio
to which lifting line theory may be applied. In this regard there has appeared someinteresting analytical work (1-3), based on Prandtl lifting line theory, which in'dicatesthat multiple solutions of the lifting line equations are possible under certain conditions.The multiple solutions are predicted only if the two-dimensional lift curves have either
discontinuities or regions of high negative slope, beyond stall, as illustrated in Figure1. One interesting feature of the multiple solutions is that they can yield span loaddistributions which are either symmetrical or asymmetrical about the wing centerlineeven at zero sidelsip angle. According to Sears (1), the asymmetrical solutionssuggested to von Karman that large rolling moments could be produced near the stallwithout postulating any initial rolling velocity (or other asymmetries such as slight
sideslip or wing panel misalignment). Sears states that the usual "textbook" explana-tion for the large rolling moments near stall, which is based on an initial rollingvelocity which stalls one panel and destalls the other, fails to account for the violence
of the rolling moments experienced in a wind tunnel with a model held fixed to the sting.The establishment of any one particular load distribution (either symnmetrical or
asymmetrical) probably depends on the relative stability of the corresponding circulationdistribution to small disturbances.
The present report attempts to apply nonlinear lifting line theory to the modeling and
prediction of aerodynamic effects during stall penetration at high angles of attack.* Previous discussions of stall aerodynamics have noted the occurrence of asymmetrical
flow separation at zero yaw angle as a possible forcing mechanism for wing rock and
and other types of pre and post-stall motions (e.g. References 4-7). It is postuated
herein that the time dependent zero beta yawing and rolling moments predicted by the
nonlinear lifting line theory are contributory to the limit cycle type of motions apt to
occur during stall. This, of course, will require careful experimental verification.
The lifting line formulation utilized herein Is a finite element, unsteady wake, incom-pressible flow theory and is somewhat more general than the General Dynamics/Convair
nonlinear lifting line procedure reported in References 8 - 10. Besides excluding time
dependent wake effects, the later procedure was limited to laterally symmetric loaddistributions at zero yaw angle, did not include effects of yaw, and could not handle
body interference effects. Nevertheless, the procedure was found to correlate
reasonably well with wind tunnel data through the stall (Ref. 9).
The procedure as formulated herein may be applied at either zero or non zero yaw
angle (yaw is handled by skewing the wing panels). Both symmetrical and asymmetrical
load distributions may be obtained, even at zero yaw angle. Three dimensional unsteady
aerodynamic effects are included by allowing shed vortices in the wake to vary instrength with distance and time. The strengths of the shed vortices are related to
those of the corresponding bound elements at an earlier time, based on the convectivetime dalay at free stream velocity between the bcund vortex and the particular wake
station. Although the theory is unsteady from the point of view of wake induced effects,
it is assumed that the two-dimensional airfoil chordwise loadings and sectional
characteristics in stall are steady state. Thus, the assumption is implicit that such
two dimensional phenomena as associated with the dynamic stall of helicopter blades
are of a shorter time scale than the unsteady wake effects (see also Section 2. 2).
The present approach makes use of the key assumption in lifting line theory, viz.
that each chordwise section acts like a two-dimensional airfoil at an effective angleof attack equal to the local geometric angle of attac•k less the induced angle of attack.In order for this assumption to remain valid, (i. e. for the chordwise load distribution
to remain two-dimensional) the aspect ratio must be sufficiently large to limit span-
wise flow effects , and vortex effects associated with high leading edge sweep
angles must not be dominant in the stall. Besides the assumptions noted above the
method requires the selection of (or switching between) the various multiple span loadsolutions which may exist at a given angle of attack. Some of these solutions may be
indicative of unstalled load distributions, some of partly stalled distributions and some
of nearly fully stalled distributions. The criterion used for selecting among the various
matematically possible solutions is empirical, and it is recognized that this aspect ofthe formulation requires further analysis. Because of this empiricism, and as aresult of the assumptions noted previously, the need for wind tunnel tests involving
dynamic measurements of aerodynamic forces, moments and span load distributioncan not be over-emphasized.
The mathematical basis for the present theory is formulated in Section II. Results ofsome simplified analyses and properties of the solutions are also presented L'i Section If.
2
The method of solution and a dicussion of the stability and convergence of the iterationprocedure are presented in Section III. More extensive wimerical results involvingcomparison with existing test data and linear theory, are found in Section IV. Alsopresented in Section IV are parametric studies showing effects of planform shape"and of two-dimensional lift curve characteristics on stalling properties. Matheniati-cal details of the formulation and a listing of the computer program, along withdetailed instructions for its use, may be found in Reference 12.
* The reader is also referred to Reference 25, which came to the attention of theauthor just prior to completion of the present report, and which also applies non-linear lifting line theory to the design of wings which minimize aircraft departureand spin entry tendencies.
:.1
2
THEORY AND ASSUMPTIONS
The present section presents the mathematical basis and assumptions for the nonlinearlifting line theory with a time dependent wake as utilized heroin. The theory may beused to obtain the time dependent span load distribution and corresponding timedependent wing force and moment coefficients for wings and wing-bodies of arbitraryplanform experiencing a predetermined schedule of pitching motion and/or of lateralcontrol deflections,
The present lifting line theory is similar to that used by Weissinger in his L-methodbut has been modified to include nonlinear section aerodynamics, body interferenceeffects and time dependent wake effects. Effects of sideslip, or yaw, are representedas differential right and left sweep angles (like a skewed wing). No fuselage crossflow terms are included in this sideslip representation. The theory as presentedbelow allows for the arbitrary chordwise positioning of the wing control points, althoughthe bound vortex location is always retained at the 25% chord location.
2.1 VORTEX SYSTEM
The vortex system used in the analysis is pictured in Figures 2 and 3, and is assumedplanar except for the vertical displacement of the image vortices in the fuselage. Theexposed wing, as shown in Figure 2, is segmented into N equal-span elements (up to20) of width h in the spanwise y direction. Each element is a parallelogram in shapeand consists of a bound vortex segment along the 1/4 chord line (which may be swept),two streamwise trailing segments and a closing shed vortex element at a downstreamdistance L x : V, Lt, where Vo is the free stream velocity and At is the time step.In the time dependent solution the strength r. I(t) of this vortex element rep.eson;sthe circulation carried by the wing at the j Itspanwise element (j = 1, 2 ... N) at thecurrent time t. The downstream trailing vortex elements are of identical shape,but are of varying strength as
r., M t = r.',k- ( t - A t) (1)
where k is an index describing the vortex element number in the wake (see Figure 3).If the maximum number of downstream parallelogram elements to be included is M-],then
1 :k5 M
where k = 1 corresponds to the wing element at the current time t, and k = M refers
Preceding page blank
to the final wake element, which is assumed urnlosed. If M = 1, the solution reducesto that for a steady state wake.
Representation of the fuselage (aasumed an infinite circular cylinder) by Image vorte::elements, as depicted In Figures 3 and 4, has found exteecdve use in the literature,e. g. References 13-16. The body images are located a.t identical axial positions asthe primary (wing and wake) vortices. Since only the trailing vortex segments areproperly imaged (cancellation of primary vortex induced velocities normal to thefuselage) the lateral and vertical locations of the image vortices Is based on locationof the primary trailing vortices. As shown in Figure 4, the images are located altnga straight lIne in the y-z plane between the primary trailing vortex and the fusel]agecenter at a radial distance RI from ýhe centerline
2RI = RB 2/R (2)
where RB is the body radius and R.- is the radius to the primary vortex.
The velocities induced by the cou,,ecting bound elements between the image vorticesare also included, based on Ref. 13, even though the bound image vortices do notsatisfy the no flow condition through the fuselage. However, these velocities werenot turther augmented by the factor suggested in Reference 14, since it was believedthat the justification for this correz~tion was insufficient. The bound image vorticeswere included in the evaluation of the overall force on the wing-body cn'ý.bination, inaccordance with the Trefftz-plane relationships given in Reference 16.
2.2 LIFTING LINE EQUATIONS
The lifting line assumption states that each spanwise station i of a wlag acts like atwo-dimensional airfoil at an effective angle of attack aEF equal to the localgeometric pitch angle of attack ap (includes effects of wing incidence, twist, controldeflection, and body cross flow) less the downwash angle of attack UD* induced bythe trailing vortex systems, viz.
0' = • - • (3)EFFi / I D(
t
Thus, for an airfoil with lift, pitching moment, ,i.- profile drag curves of functionalform
CL = CL (tp), CM CM (ap), and CD = D (cp (4)P P*
lifting line theory assumes that
6
CL (t) C"[ " (t)]L CLL EFF,
C (t) MCIEF (t)l (5)M. M,[E FF,C t) C 1 (F
CD (t) CD EFF
PL P1L
Equations (5) Indicate also that the unsteady effects to be included in the theory enteronly through the time dependence of a'EFF , viz. through changes with time inUp. and/or aD,. As noted in the Introduction, the basic section characteristics asdetfned functionally by Equations (4) are assumed independent of time. This requiresthat various linear and nonlinear two-dimensional unsteady flow effects, such asdynamic stall (e. g. Reference 17), be of an appreciably shorter time scale than thewake and geometric effects Included herein. This assumption is equivalent to assumingthat the chordwise pressure distribution, which affects the nature of flow separationon the airfoil, rapidly approach the steady state distrTibution for the current angle
of attack. Combining unsteady two-dimensional effects with the nonlinear liftingUine theory was assumed beyond the scope of the present effort.
The control point for evaluating 0 'EFF Is taken at an axial distance Xcpi from theleading edge. In dhe usual Prandtl lifttng line formulation xcu. = ci/4. Hence,there would be no induced velocity contribution from the wing bound vortex segments.In order to generalize the formulation for arbitrary Xcpi, the downwash angleaD has been defined as the difference between the total three-dimensional downwasha•gta u3D- at the control point and an equivalent two-dimensional downwash angle
a2D1 from an infinite span bound vortex along the c/4 line and equal in strength toFi, (t). Thus
. =3D - 2D (6)i I
In terms of downwash velocity components Aw induced by the parallelogram latticeelements of unit circulation strength
w j =K, k=M
3D. V jNk=. .. . (t) (7)i VOO VW j;l = j,k ' j
where for each J, k lattlce, elemen: and at each control point i
Aw =Aw_, +AW T W+ AwB +A+ B +" 5TR+F6%wv_ + +Awl + AwI (8)L R F A TL TR BF BA
The subscripts in Equation (8) are T trailing element, B ooand or shed element, Iimage, L left, R right, F forward and A aft. Mathematical expressions for each ofthe elements In Equation (8), based on the law of Biot and Savart, are given inReference 12.
The equivalent two-dimensional downwach angle is
1 r It)6.W (t- 1,1(9)
L2) V) D Fi, 1 V, 21r (x -x ) cos (A-8)I Go, ID ep c/4 I I-
where A1 is the quarter chord sweep angle (assumed negative for the left wingpanel. 1 - i s N/2, and positive for the right wing panel, N/2 + 1 "- I < N), and BIs the side slip angle. The usual sign convention takirg the downwash as positivehas been employed in the above express ions.
The pitch angle of attack is composed of the elements
01 (t) = a(t)+cT +AaR_ (t)+AaB (t) (10)
where a (t) is the angle of attack of the root section, aT. is the built ingeometric twist, \a RI (t) is the effective roll asymmetry angle of attack due todeflection of ailerons, and Aa (t) is the additional angle of attack due to thebody upwash. i
RB2
LaB (t) [a (t) - iw Cos 2 c 6 t (11)
where y
cos 6.V I" zB -l1Yi1 -YB)tany] 2 +y2 1/2
Here iw is the wing rvot inc derce angle, and the remaining quantities are definedin Figure 4.
The unknowns are the current time values of tnc circulation on the wing 7t 1(t), and
may be found by solving Equation (3) and the first of Equations (5). Thus, insertingEqunatns (6),(7),(9) and (10) into Equation (3) gives
8
1EFF (t) = Cp (t) - a3D (t) 4 a2D (t)
I Li
=M "T L 1 (t) + +r Aa1 (t)
j=N, k=M"• k~Aw1 j,k (t)
E I ilkj,k
M112+- w F' (t) (12)V. W2D1. i,I
Expressing CL. (t) iLi Equation (5) in terms of the bound circulation gives
2 T- 1, l ( t )
S- CL . [,' FF i (t) M (13)W Ci L
Equation (13) implies that the Kutta- Joukowski law Li (t) = pVo.r' (t) holds in theunsteady as well as in the steady state case. This assumption is discussed furtherin Section 2.5.
Equations (12) and (13) constitute the set of lifting line equations to be solved for
uEFFi (t) and i'i I(t). The F.. (t), k> 1, are known from solutions at previoustimes through Equation (1). odre describing the general method of solutionseveral simplified solutions of these equations, which do not require arny computercalculations, are discussed below.
2.3 SIMPLIFICATIONS FOR A LIN'3AR LI,"..2 CURVE
In general, Equations (12) and (13) must be solved by an iterative method, becauseof the nonlinear nature of the lift curve as expressed in Equation (13). It is
I: precisely these nonlinearities which lead to the occurance of multiple span loadings,lift hysteresis, and zero beta rolling and yawing moments. However, it Is beneficialto examine several simplifications which occur when the lift curve is linear, inorder to compare the theory with existing methods and to better understand thenature of the corm~plicatlons due to the nonlinear effects.
9
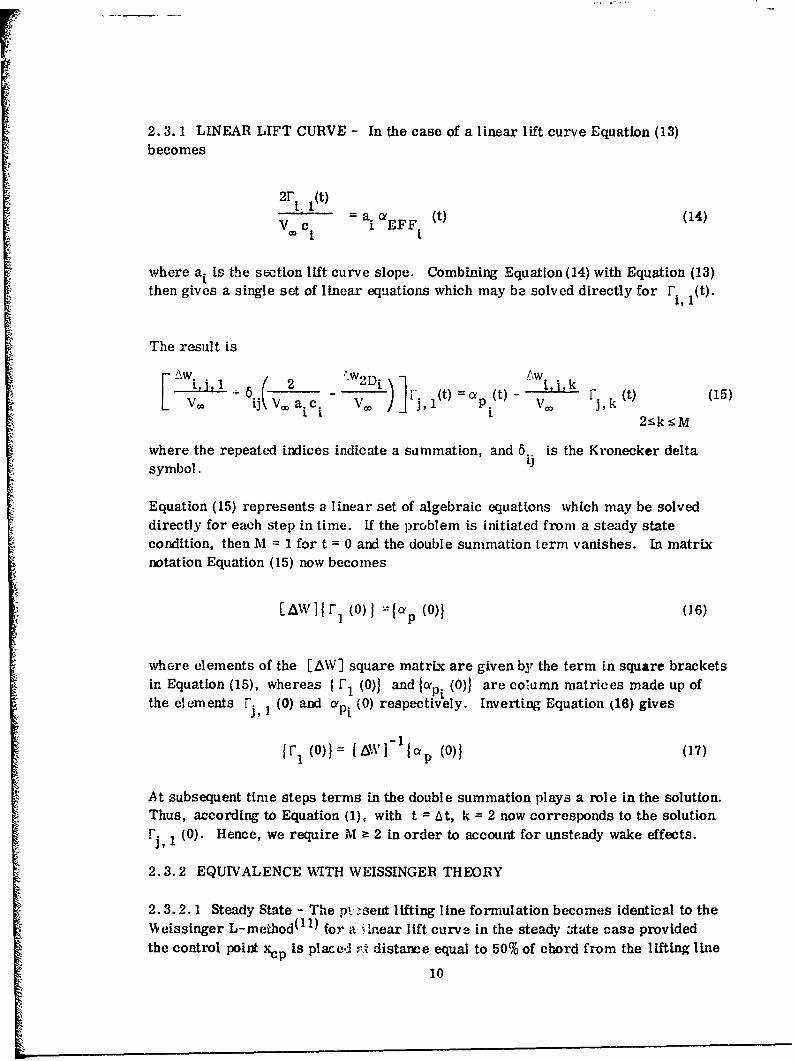
2.3. 1 LINEAR LIFT CURVE - In the case of a linear lift curve Equation (13)
becomes
2rt .(t)=a a EFFLM(4V = c .(t) (14)
V.c jEFF
where ai is the section lift curve slope. Combining Equation(14) with Equation (13)then gives a single set of linear equations which may be solved directly for F (t).i,1
The result is
$ L)] l(t) - ' i'((t)15V I+ Vi(2 w 2VoDM -.( w Vi j, k t (15)
where the repeated indices indicate a summation, and 6.. is the Kronecker deltasymbol. L
Equation (15) represents a linear set of algebraic equations which may be solved
directly for each step in time. If the problem is initiated fromn a steady statecondition, then M = 1 for t = 0 and the double summation term vanishes. In matrixnotation Equation (15) now becomes
[AWIIr 1 (0)j 1 ap (0)) (16)
where elements of the [AW] square matrix are given by the term in square bracketsin Equation (15), whereas I 1 (0)) and lap. (0)) are couamn matrices made up ofthe elements ., 1 (0) and api (0) respectively. Inverting Equation (16) gives
{I r1(0)1: = IA,vl 1 1t p (0)1 (17)
At subsequent time steps terms in the double summation plays a role in the solution.
Thus, according to Equation (1), with t = At, k = 2 now corresponds to the solution
r,, 1 (0). Hence, we require M z 2 in order to account for unsteady wake effects.
2.3.2 EQUIVALENCE WITH WEISSINGER THEORY
2.3.2.1 Steady State - The ptvsent lifting line formulation becomes identical to theWeissinger L-method(11) for a Inear lift curve in the steady :state case providedthe control point xcp is placed • distance equal to 50% of chord from the lifting line
10

(75%'o chord for zero sweep angle). This may be shown by considering a single horseshoevortex elpment (k I only), with a bound segment and two trailing segments. ByEquation (6)
D. 3D. 2D.I L I
and from Equation (9) with (xcp - Xc/4)i cos (A, - $) = (1/2) c1
012D. iV. c
According to Equation (3)P,, 1OaFF =~ Ol-CD + Vc(18)
EFF P. 3D. n V C
For thin airfoil aerddynamiLs, ai 2 77; therefore by the steady state form of Equation(14)
1T V ci = EFF.L
and substitution in Equation (18) yields
a• D = a p (19)3D. (YP.
I L
which is the flow tangency boundary condition at the 75% chord control point used in theWeissinger approach. The nonlinear lifting line formulation, with the control point
location such that
(xcp- xc/4) cos (A, - )c/2 (20)
may therefore be taken equivalent to a nonlinear Weissinger formulation.
2.3.2.2 Unsteady Theory (Two-Dimensional). It should be noted that the theoryalso reduces to an unsteady form of the Welssinger theory, both for two-dimensionaland three-dimensional flows. Thus, for a two-dimensional unsteady flow Equations (6)and (7) becom e 1I(t)
aEFF(t) V1 wk k 2itV (x -x A2I • c/4
11

where Awk is the downwash at xcp due only to forward and aft spanwise segments of
the k'th element. Thus, from Equation (8)
6wk =LwB +Aw (21)k Fk A k
a M=(t) a(t) - 1 w F (t) + T-EFF P V . k k 27TV0 (Xcp - x/4)
Using the linearized form of the unsteady Kutta-Joukowski law, Equation (14),assuming the lift curve slope a = 2 1T, and taking xcp- xc/ 4 c/2 then gives
1- wk Fk (t) = CY (t) (22)V k k ) 1,k2,...
Equation 22 states that the instantaneous downwash argle at the 75%,/ chord positionfrom all bound and shed spanwise vortex segments is equal to the instantaneousangle of attack.
Equation (22) may be expressed in ternis of the differential vortex strengths.Referring to Figure 5
L,'k (t) = 4k (t) - rk-1 (t)
Thus, from Equation (21)
L wk k(t)( + )Fk(t)Fk Ak
and since LwB= -LwBAk Fk+1
substitution in Equation (22) yields
w A Fk (t) = 0, (t) (23)
whe:. as seen from Figure 5,
12
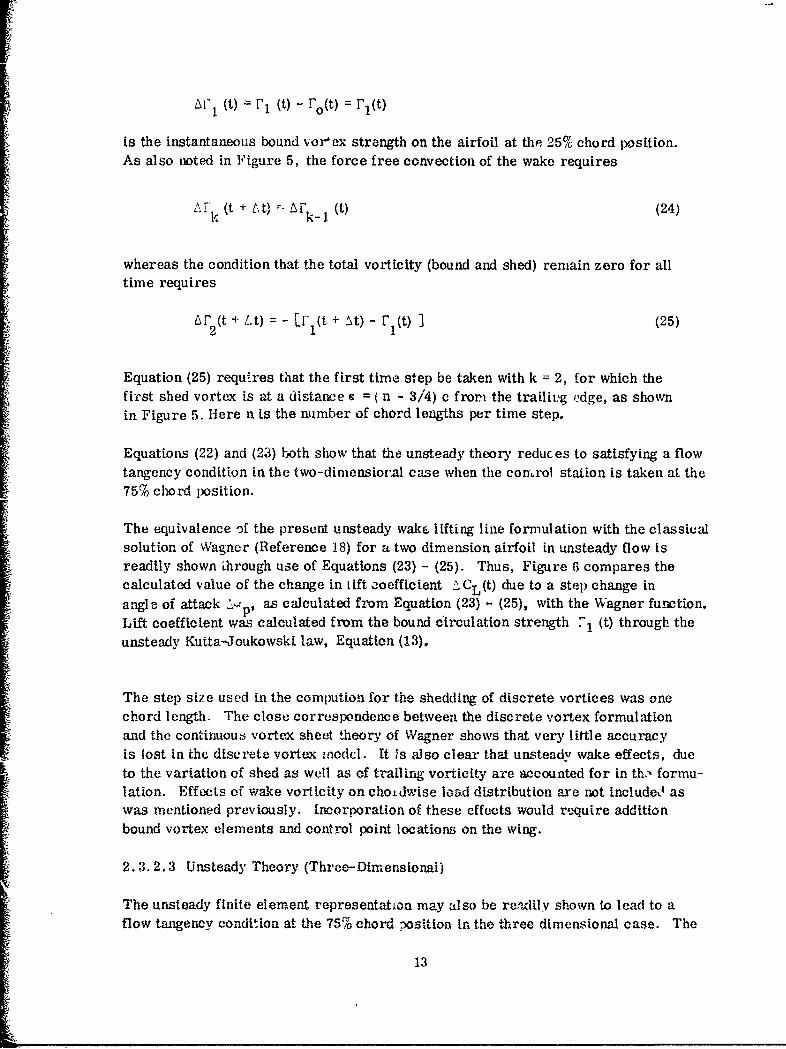
Al1 (t) '1 (t) - Fo(t) r•(t)
is the instantaneous bound vor'ex strength on the airfoil at the 25% chord position.As also noted in Figure 5, the force free convection of the wake requires
Zr (t + tt) r--AFk-1 (t) (24)
whereas the condition that the total vorticity (bound and shed) remain zero for alltime requires
A r (t + L.t) = - [i' (t + At) - 7 (t) ] (25)2 1 1
Equation (25) requires that the first time step be taken with k = 2, for which thefirst shed vortex is at a distance e (n - 3/4) c from the trailivg edge, as shownin Figure 5. Here n is the number of chord lengths per time step.
Equations (22) and (23) both show that the unsteady theory reduces to satisfying a flowtangency condition in the two-dimensioral case when the conLrol station is taken at the
M,51 chord position.
The equivalence of the present unsteady wake lifting line formulation with the classicalsolution of Wagner (Reference 18) for a two dimension airfoil in unsteady flow isreadily shown Zhrough use of Equations (23) - (25). Thus, Figure 6 compares thecalculated value of the change in Lift coefficient A CL(t) due to a step change in
angle of attack -'p. as calculated from Equation (23) - (25), with the Wagner function.Lift coefficient was calculated from the bound ctrculation strength I 1 (t) through theunsteady Kutta-Joukowski law, Equation (13).
The step size used in the compution for the shedding of discrete vortices was onechord length. The close correspondence between the discrete vortex formulationand the continuou6 vortex sheet theory of Wagner shows that very little accuracyis lost in the discrete vortex model. It is also clear that unsteady wake effects, dueto the variation of shed as well as of trailing vorticity are accounted for in th., formu-lation. Effects of wake vorticity on cho-dwise load distribution are not includec, aswas mentioned previously. Incorporation of these effects would require additionbound vortex elements and control point locations on the wing.
2.3.2.3 Unsteady Theory (Three-Dimensional)
The unsteady finite element representation may also be reAily shown to lead to aflow tangency condilton at the 75% chord positlon in the three dimensional case. The
13
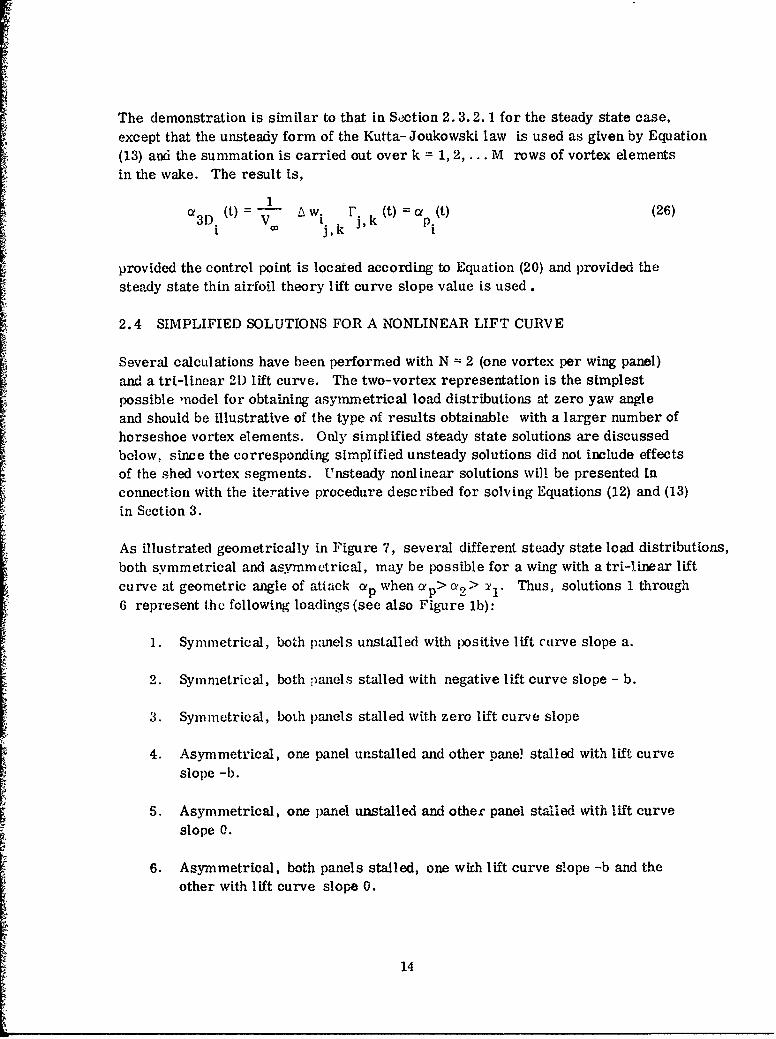
The demonstration is similar to that in Section 2.3.2. 1 for the steady state case,except that the unsteady form of the Kutta- Joukowski law is used as given by Equation(13) and the summation is carried out over k = 1, 2,... M rows of vortex elementsin the wake. The result is,
1
U3D (t) t) (26)
provided the control point is located according to Equation (20) and provided thesteady state thin airfoil theory lift curve slope value is used.
2.4 SIMPLIFIED SOLUTIONS FOR A NONLINEAR LIFT CURVE
Several calculations have been performed with N = 2 (one vortex per wing panel)and a tri-linear 21) lift curve. The two-vortex representation is the simplestpossible mnodel for obtaining asymmetrical load distributions at zero yaw angleand should be illustrative of the type of results obtainable with a larger number ofhorseshoe vortex elements. Only simplified steady state solutions are discussedbelow, since the corresponding simplified unsteady solutions did not include effectsof the shed vortex segments. Unsteady nonlinear solutions will be presented In
connection with the iterative procedure described for solving Equations (12) and (13)in Section 3.
As illustrated geometrically in Figure 7, several different steady state load distributions,
both symmetrical and asymmetrical, may be possible for a wing with a tri-linear liftcurve at geometric angle of attack ap when cip> C2> Y1. Thus, solutions 1 through6 represent the following loadings (see also Figure lb):
1. Symmetrical, both panels unstalled with positive lift curve slope a.
2. Symmetrical, both panels stalled with negative lift curve slope - b.
3. Symmetrical, both panels stalled with zero lift curve slope
4. Asymmetrical, one panel unstalled and other pane! stalled with lift curveslope -b.
5. Asymmetrical, one panel unstalled and other panel stalled with lift curveslope 0.
6. Asymmetrical, both panels stalled, one wich lift curve slope -b and theother with lift curve slope 0.
14
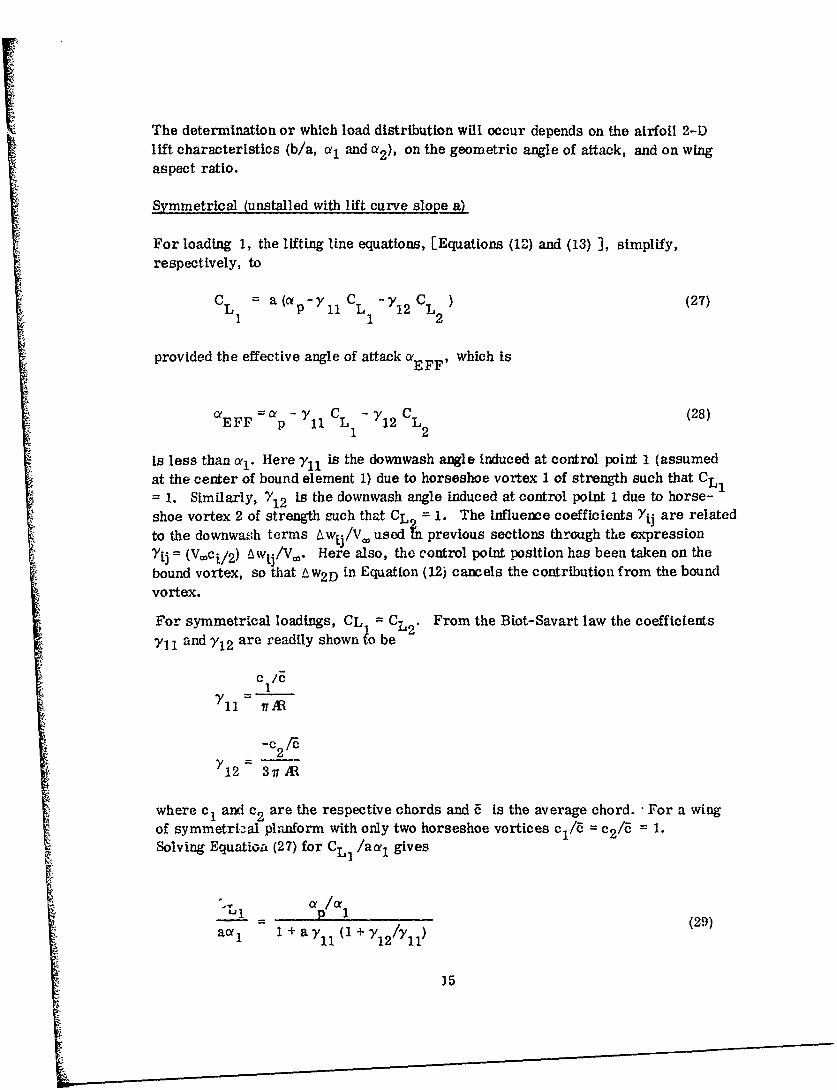
The determination or which load distribution will occur depends on the airfoil 2-D
lift characteristics (b/a, a, and a 2 ), on the geometric angle of attack, and on wingaspect ratio.
Symmetrical (unstalled with lift curve slope a)
For loading 1, the lifting line equations, [Equations (12) and (13) ], simplify,respectively, to
a LI1 = a (ap- 11 CL -12CL2 (27)112
provided the effective angle of attack a EFF' which is
aEFF = ap - Y 11 C L - >12 CL2 (28)
Is less than c1. Here yll is the downwash angle induced at control point 1 (assumedat the center of bound element 1) due to horseshoe vortex 1 of strength such that CL 1
= 1. Similarly, 11 2 Is the downwash angle induced at control point 1 due to horse-shoe vortex 2 of strength such that CL2= 1. The Influence coefficients VYi are relatedto the downwash terms Aw-1/17 used Ln previous sections through the expression
'ij = (Vci/2) Aw1j/V 0)- Here also, the control point position has been taken on thebound vortex, so that AW2D in Equation (12) cancels the contribution from the bound
vortex.
For symmetrical loadings, CL = CL2. From the Biot-Savart law the coefficients
V I1 and ,12 are readily shown lo be
c1 /YIl 7T AR
* -c2/c-C2
Y12 -3 /37T
where c1 and c2 are the respective chords and 6 is the average chord. For a wingof symmetrizal planform with only two horseshoe vortices cl/a = c 2/= 1.Solving Equation (27) for CL /aa1 gives
•11
R+a 1ly y (29)act1 -1 + a Y110 + Y12/Y11)
35
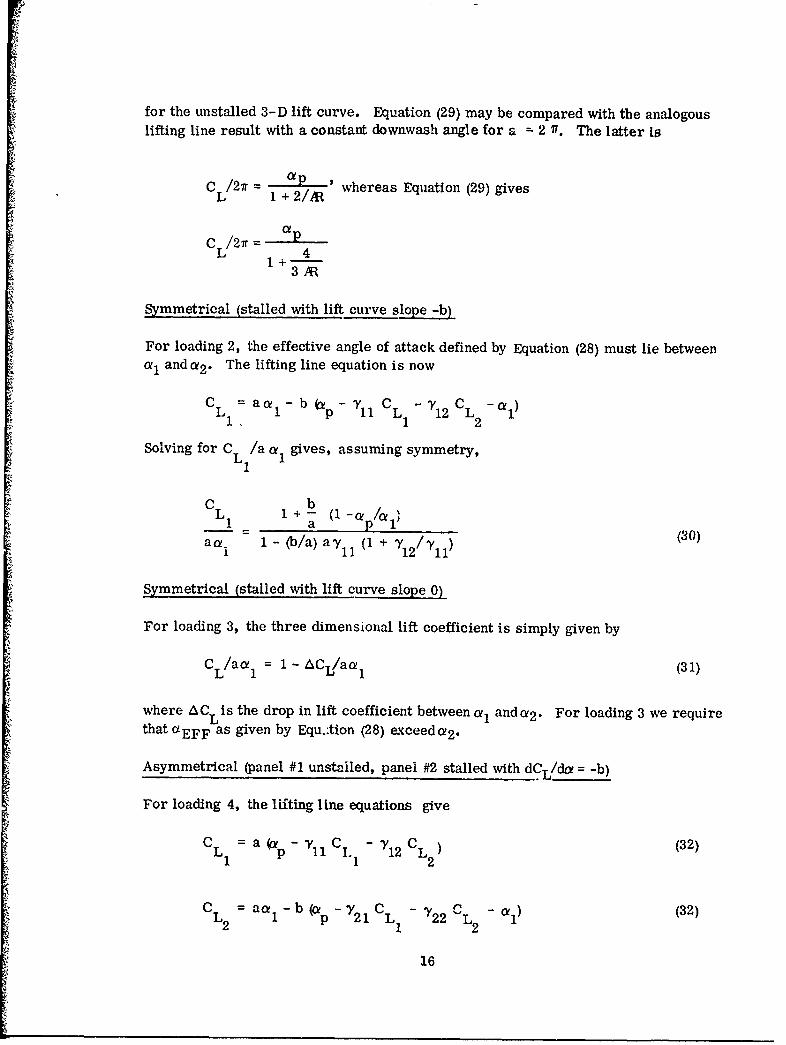
for the unstalled 3-D lift curve. Equation (29) may be compared with the analogouslifting line result with a constant downwash angle for a = 2 'T. The latter is
SC /27r = ' whereas Equation (29) givesL 1 +2/AR
CL/27r = P4
L 1+43 M
Symmetrical (stalled with lift curve slope -b)
For loading 2, the effective angle of attack defined by Equation (28) must lie betweena• anda 2 . The lifting line equation is now
L 1- b (a P 11 L- 12 -L 1)1 -1 2
Solving for CL /a a 1 gives, assuming symmetry,
C bL 1 +-- (i- /1_a ia1
aas. 1-(b/a) a-y11 (1 + /12/,) (30)
Symmetrical (stalled with lift curve slope 0)
For loading 3, the three dimensional lift coefficient is simply given by
CL/aa1 = 1 - ACL/aa1 (31)
where ACL is the drop in lift coefficient between a 1 and a 2 . For loading 3 we requirethat c'EFF as given by Equ..tion (28) exceed a 2 .
Asymmetrical (panel #1 unstailed, panel #2 stalled with dCL/da = -b)
For loading 4, the lifting line equations give
aL1 = - 11 C - '12L (32)
CL2 aa1 - b (pp -y 21 CL1 - '22 L2 -a 1 ) (32)
16
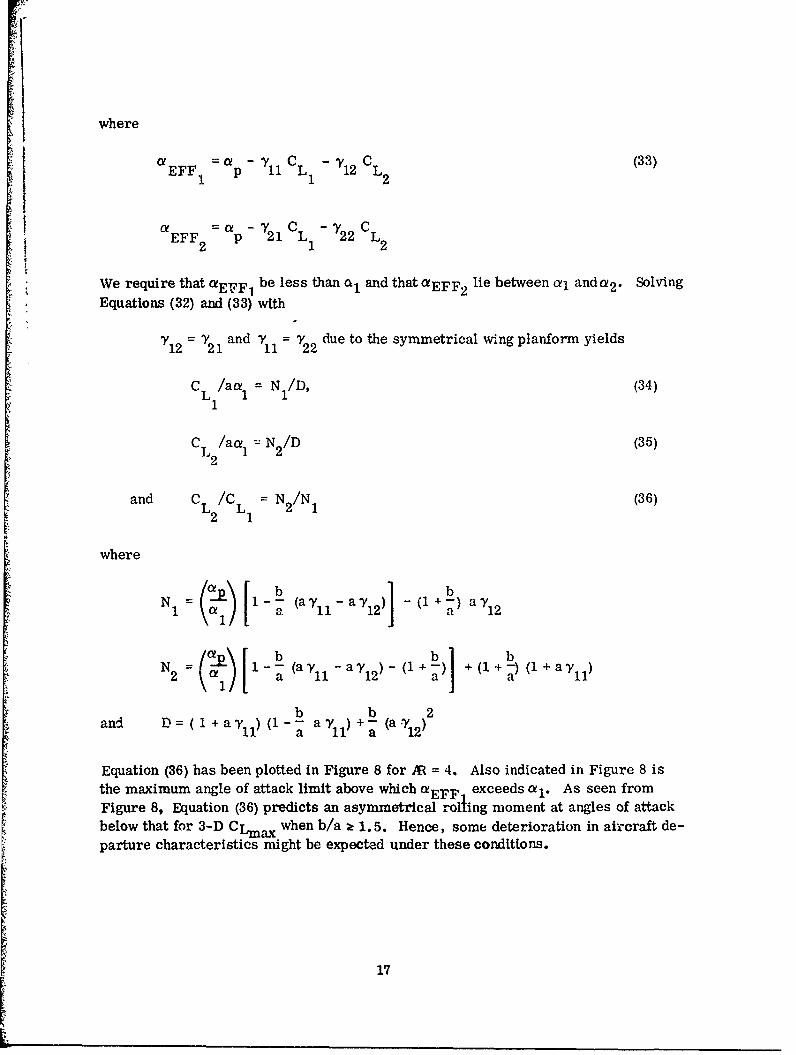
where
aEFF1 aP 11 C L1 '1 2 CL 2 (33)
aa -Y' CL- CEFF 2 p 21 L 1 22L2
We require that aEFF 1 be less than a, and that aEFF 2 lie between al anda 2. SolvingEquations (32) and (33) with
"Y 12 = T21 and Y1 = vý22 due to the symmetrical wing planform yields
C L1/aat, =N1/D, (34)
C L2/ace a N2/D (35)
and C / = N2/N (36)L 2L 1 2 1
where
1 V1 1 -- (a. 11-"12) - -a a'Y12
N(a ya7)1 ) +(1+ a) (1+ ay
b b 2and D= (1 + ay 1 1) (1-- a- 1 1) +- (a b 12 )
Equation (36) has been plotted in Figure 8 for AR = 4. Also indicated in Figure 8 is
the maximum angle of attack limit above which aEFF exceeds ca1 . As seen fromFigure 8, Equation (36) predicts an asymmetrical rolling moment at angles of attackbelow that for 3-D CLmax when b/a 2 1.5. Hence, some deterioration in aircraft de-parture characteristics might be expected under these conditions.
17
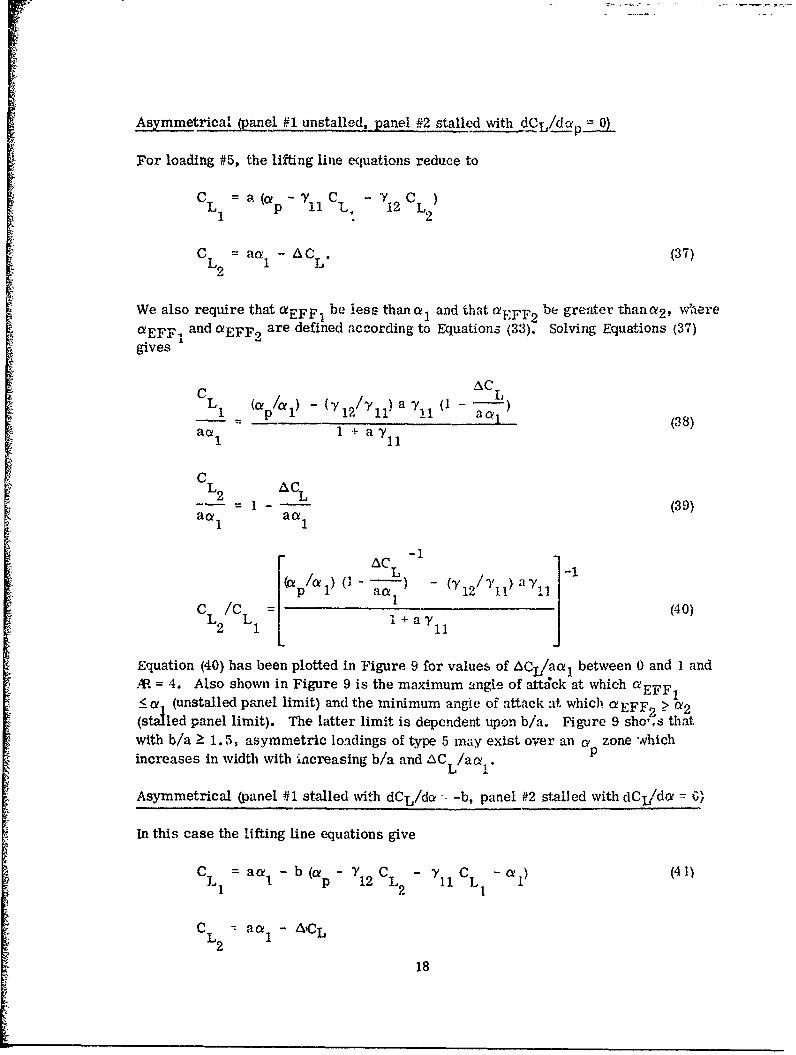
Asymmetrical (anel #1 unstalled, panel #2 stalled with dCL/d~p_ _
For loading #5, the lifting line equations reduce to
S=L a(a p- ^Y CL, - Y1 2 C L)L1 L2
C = aa1 - AC . (37)
We also require that aEFF1 be less than a 1 and that aFFF2 be greater than a 2 , whereaEFF1 and aEFF 2 are defined according to Equations (33). Solving Equations (37)gives
ACLCL1. (a p/al -, (12 /3ii a Y,11 (i - -al) (8
aa 1 1 + a y1 1
CL2 ACL
2 1 - L (39)
aa1 aa11 11
L) a - (Ie 12 /yI)[ /CLI (40)
L 2 " 1 + a -y 1
Equation (40) has been plotted in Figure 9 for values of ACI/aa 1 between 0 and I and. = 4. Also shown in Figure 9 is the maximum angle of attack at which aEFF1
<a (unstalled panel limit) and the minimum angle of attack at which aEFF2, _ a 2(stalled panel limit). The latter limit is dependent upon b/a. Figure 9 shos that
with b/a > 1.5, asymmetric loadings of type 5 may exist over an a zone whichincreases in width with "increasing b/a and AC L/aua.
Asymmetrical (panel #1 stalled with dCL/da- -b, panel #2 stalled with dCI/da = C,)
In this case the lifting line equations give
C aa - b (a - T C - C a1 ) (41)L1 I p 12 L2 11 L
C L aaa1 - ACL
18

with the requirement that cyEFF 1 lie between al and c2, and that aEFF2 be greaterthan a 2 . Equations (41) were solved for CL2/CL1 giving
SCT 1 + - 1 + (ý,-'-) aVYl (1 -
I I 11 (42)
C L ` !1- (h ) a~ya a I a
Ln summary, we have demonstrated the possibility of six different steady state load-ings near stall for wings with a tri-linear section lift curve. Taking a wing withAR=4, b/a=4 and ACL/aa1 = 0. 6, it is readily shown that all six loadings will satis-
fy the lifting line equations at an angle of attack p = 1.3 al, which is just below thevalue a = 4/3 a, for the niahximum 3-D lift coefficient. The values Of CL1 and CL2for these six loadings are listed in the table on Figure 10. The corresponding valuesof ýEFp 1 and are shown it the plot.Sof •,•F1 EFF2
The question naturally arises; which of the six possible loadings will occur physically?This question was posed by Sears(1) who stated "The choice between the various sol-utions must involve the question of the relative stabilities of the flows." The questionwill be readdressed in connection wilth the iterative method of solving the time depen-dent nonlinear lifting line equations.
2.5 GENERAL!ZED FORM OF THE KUTTA-JOUKOWSKI LAW FOR UNSTEADYFLOW
A generalized form of the two-dimensional Kutta-.Joukowski law, viz.
L (t)i =P% (t) (43)
has been used throughout the formulation in Sections 2.2 and 2. 3 and is the basis forEquation (13). In the present section we derive Equation (43) from the condition thatthe negative rate of change of total momentum associated with the spanwise vortexsegments gives the iiagnitude of the lift. The total momentura perpendicular to xfor a two-dimensional vortex system composed of discrete elements Ark (t) spacedalong the x axis at distances xk from the leading edge, as shown in Figure 5b, is
PArk (t)x
where the double index implies a summation. Hence, the unsteady two-dimensional
lift becomes
19
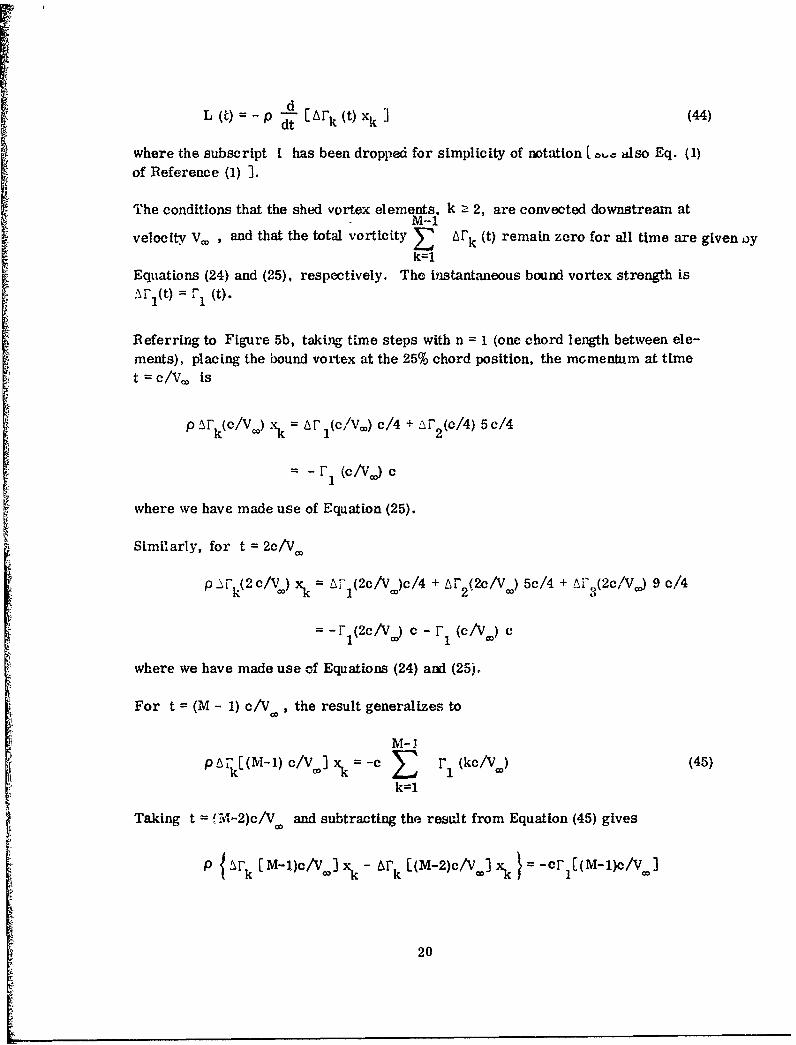
L(t) =-p d- [LFrt x (44)
where the subscript 1 has been dropped for simplicity of notation [ Z.also Eq. (1)of Reference (1) 3.
The conditions that the shed vortex elements, k Ž 2, are convected downstream atM-1
velocity Vz , and that the total vorticity A~k (t) remain zero for all time are given oyk=1
Equtations (24) and (25), respectively. The instantaneous bound vortex strength is
Referring to Figure 5b, taking time steps with n = 1 (one chord length between ele-ments), placing the bound vortex at the 25% chord position, the momentum at time
t = c/V"' is
P 1rk(c/V.) xk = AfI(c/V ) c/4 + M' 2 (c/4) 5c/4
- -FI (c/Vj) c
where we have made use of Equation (25).
Similarly, for t = 2c/Va,
p.1"Fk(2c/V) xk = A'1(2c/Vj)c/4 + AF2(2c/V ) 5c/4 + AM'3(2c/V,) 9 c/4
= -FI(2c/V.) c - 71 (c/V=) c
where we have made use of Equations (24) and (25).
For t = (M - 1) c/V. the result generalizes to
M-1"pAiV[(M-l) c/V] xk =-c r r1 (kc/V.) (45)
k=1
Taking t = fM-2)c/V, and subtracting the result from Equation (45) gives
P { stk [M-I)c/V3] xk- Ark [(M-2)c/V] xk -cr 1 I(M-1)c/Vý]
20
Dividing by At = c/V, we obtain
p A {~r k [(M.-1) c/V-] xkJ (M1cV= -v. r [(M-1%C/v ]At
and Equation (44) in difference form becomes
L [(M-I)c/V.] = pV r 1[.(M-l)c/VJ] (46)
which is identical to Equation (43). The same result may be obtained for arbitrarystep sizes n, and in the limit n - 0 the generalized Kutta-Joukowski law is tound.
21
3
METHOD OF SOLUTION AND ITERUATION PROCEDURE
The set of nonlinear lifting line expressions as given by Equations (12) and (13)constitute a sjstem of 2N algebraic equations in the 2N unknowns F1(t) and ctEFF- (t),I = 1,2,.,., N, which must be solved for each step In time. The equations are nonlinear;becaus2 the functional relation between F1(t) and 'YEFFi it), expressing the two-dimensional lift curve at station I, Is generally nonlinear in the stall region andbeyond. Hence an iteration procedure is required for their solution.
The nonlinear liftibg line equations and corresponding wing and fuselage geometricrelations were programmed for solution on the CDC Cyber 70 computer. Details ofthe computer program and of the method of solution have been presented in Reference12, as was noted previously. However, the method of solution will also be reviewedbelow, because of the limited distribution of Reference 12 and because several of theassumptions in the iteration procedure may reqaire further discussion.
3.1 ITEr-ATION PROCEDURE
The iteration procedure assumes the aircraft wing and fuselage geometry, sideslipangle, etc., are given, and that the schedule of pitch angle cp(t) and lateral controlCe.ectlon AaR(t) r~ave been specified. Two iteration loops will be described, one fort = and the second for t > 0.
3.1.1 INITIAL SOLUTION. The method is started by determining the steady statesolution for t = 0. The root solving procedure consists of a simple iteration loop onthe induced angle of attack aD (0). A guess Is first made for the spanwise variation
of induced ang~le of attack YDI1 &)(0). This, together with the known ap1 (0),
establishes aE .(1)(0) through Equation (3). The wing bound vortex strengthsr, (1) (0) are then found by table look-up from the input aerodynamic lift curve.expressed by Equation (13). For t = 0 we may take M = 1, or equivalently takerlFk (0) = r, 1 (0), hence no wake vortices need be considered. The induced &...yesare' then rec'alculated, based on the downwash velocity .omponents A wI. k and
AW21D), a.J on the initial iterate for the vortex strengths r, 1 (1)(0), Ad compar,1with the assumed values of aD (0). The differences may(be designated Lct 0).The values to be used in the next iteration are
((1)01 (0) =. ( (0) + C A• (0) (47)D D' D
II
where C Is a weighting factor. The value of C affects the stability and convergence
of the iteration procedure. Increasing C speeds up convergence (reduces the number
23
Preceding page blank

of required iterations), but may destablize the iteration procedure. In general,the maximum value for C depends on wing aspect ratio, the number N of spanwiseelements, and on lift curve slope. Some further discussion of effects of C on stabilityare contained in Section 3.1.3.
With a(2) (0) given by Equation (47) the procedure is repeated, viz.I
I IIuntil either vonvergence is obtained, or until a maximum number of iterations hasoccurred. Convergence is assumed when Ao (m) (0) < 0. 1 degree for all i.
S~L
3.1.2 SOLUTfGN AT SUBSEQUENT TIME STEPS - The iteration procedure atsucceeding time steps t> 0 is similar to that at t = 0 with the following exceptions:
(i) The vortex strengths ri, k (t) in the wake are no longer identival to thoseon the wing (k = 1), but are found by indexing from the previous timestep according to Equation (1).
(1)(ii) A special logic is used to specify the initial guess a (t).
The later requirement was found necessary, especially near stall, because of thepossibility of multiple solutions, and because the iteration procedure app.-eal1ytends to dlsallow roots on the steep negative slope regions of the section lift curv6s.Thereforý, the wing elements appear in the solutions as either unstalled or fullystalled (regnon where the post stall lift curve is near zero). A dominant form for thesolution in the stall region appears to be a spanwise alternating pattern of unstalledanc.' ily stalled elements. The significance of this saw-tooth type of solution wasnot entirely clear. For example, if a very large number of spanwise elements weremodeled, then such a pattern over a given spanw•.se portion of the wing may ,lvell
correctly represent partial stall or heavy buffetiug in that region. However, sincethe present computer program is limited to 10 elements per wing panel (Nmax 20),this type of saw-tooth stall pattern does not appear to be physically realistic. Itwas found that the saw-tooth stall pattern could be avoided In most cases by choosingthe initial guess for a D.(t) according to the following special logic.
a) When no wing sections are stalled at the prior time step (i. e. all convergedvalues of aEFF. (t - At) are less than am__, corresponding to the sectionangle of attack for maximum CL), then the aODi (t) are taken equal tothe converged values from the previous time step a D- (t - At). This will
produce solut'ns with all spanwise elements unstalled, if such solutionsexist.
24
b) Wh "i tie iteration procedure at the end rf the previous time step, or durirgthe c,,rrent Iteration, gives a solution with one or more stalled sections ona wing panel (e.g. aEFF, (t - At) erceeds amax), then ti e iteration procedureis started (or restarted) with the assumpt(on that the induced angles are zeroon that particular wing panel. This procedure tends to force solutions withas many stalled elements on that panel as the lifting line equations willallow.
The special logic represented by a) forces the spanwise wing elements to remainunstalled until such time that one or more elements must be stalled to satisfy thegoverning equations. Partially stalled solutions with either saw-tooth stall patternsor uniform stall patterns, are avoided during this time, even though they satisfy thelifting line equations. The special logic given by b) assumes that once any spanwiseelement has stalled, it tends to induce all adjacent elements of the same panel tostall within the limits of the lifting line equations. Shielding of stall progressionfrom one side of the airplane to the other is assumed provided by the presence ofthe fuselage (at least for low and mid-wing configurations). Unstalled solutions,or solutions with saw-tooth stall patterns, are avoided during this time even thoughthey are mathematically acceptable.
It should be noted that the above logic will tend to maximize the extent of any stallhysteresis loop which occurs for a wing undergoing a pitching motion through the stall.Thus, stall will be delayed to the maximum possible angle of attack while a'p(t)is increasing, and destall will be delayed to the minimum possible angle of attackwhile cp (t) is decreasing.
Thus the sample computations presented in Section 4 may well tend to exaggeratethe stall hysteresis loops (and the angle of attack range for the occurrance of zerobeta rolling and yawing moments). The user is cautioned that the physical validityof these assumptions has yet to be established, since there are at present insufficientwind tunnel test data with dynamic type measurements. An alternative type ofmathematical formulation, wherein the selection between the various multiplesolutions is based on their physical stability, rather tha;.- on a special logic forthe initial iterate, is clearly desirable.
3.1.3 STABILITY OF ITERATION PROCEDURE
The stability of the iteration procedure may be readily shown to be dependent uponthe spanwise extent of the wing vortex elements, upon lift curve slope a and uponthe weighting factor C. We consider for example the highly idealized case of awing with a single vortex element and no unsteady wake effects (M = N = 1).Neglecting the subscripts I,j,k the first iterate at time t is
Aw ,aD() (t) = V F r (t - A t)
25
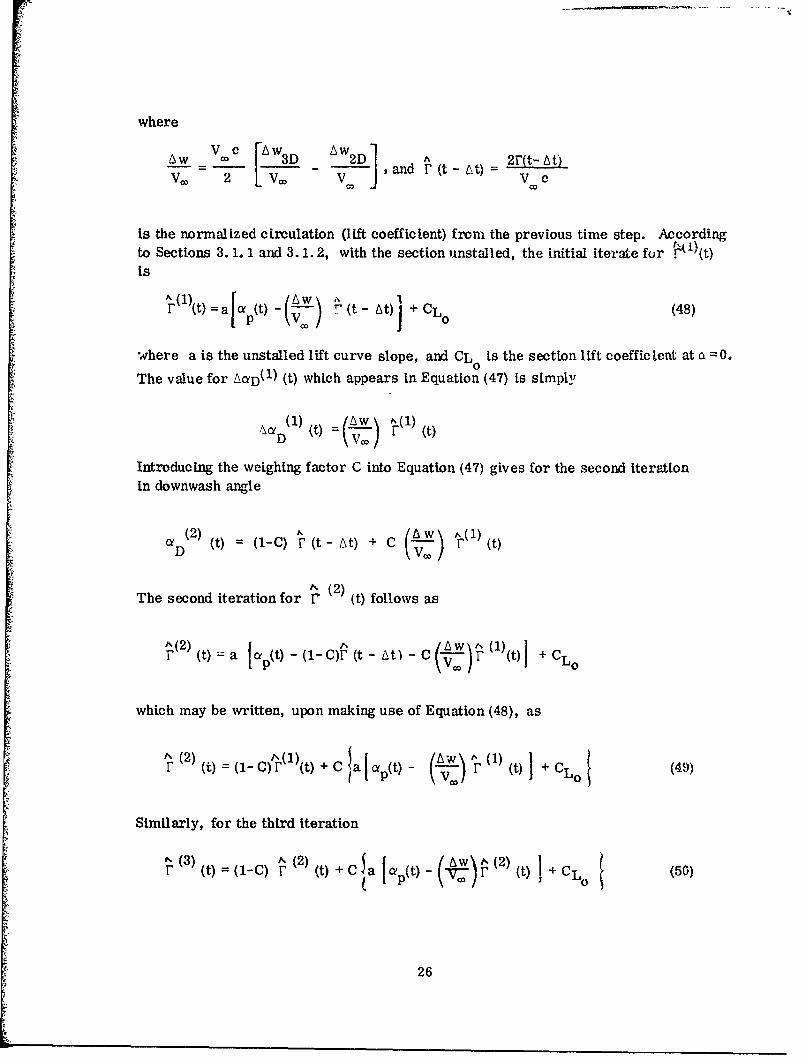
where
6w 1 W3 w2D 2F(t- Lt)SL 3D , and (t- 't)=
is the normalized circulation (lift coefficient) from the previous time step. Accordingto Sections 3. 1. 1 and 3. 1.2, with the section unstalled, the initial iterate for (t)is
A(1 Mt = aa (t - At) + CLO (48)
where a is the unstalled lift curve slope, and CLo is the section lift coefficient at 0 =0.
The value for alD(1) (t) which appears in Equation (47) is simply
/ýUD(I M = - r it)
Introducing the weighing factor C into Equation (47) gives for the second iterationin downwash angle
a D(2) it)= (1-C) r(t- Lt) + C (A-w)^(1)it)
N (2)The second iteration for F (t) follows as
T2(t) =a MpLt- (1 - C,• -At) -C vw)F1(t) L
which may be written, upon making use of Equation (48), as
r (2) = (1-C) r)M + C a up~t) - (1) I + CL (49)
Similarly, for the third iteration
N (3) '% (2) A( 2S(t) = (l-C) r (t) + C a a Mt - (
26
Subtracting Equations (49) and (50) gives
N. (3) N(2ir (3)t) -. r ((t) -- I - C - a C (6w•
A (2(5 ())"S(2(t) _ r 1 (t)
The iteration procedure should be stable when the absolute value of this ratio is
below one, but convergence becomes very slow as the ratio approaches zero.Since a> 0, the ratio is generally negative, and convergence and stability require
1 2 (20< 1< C < 2 - 5. (52)
Convergence Limit Stability Limit
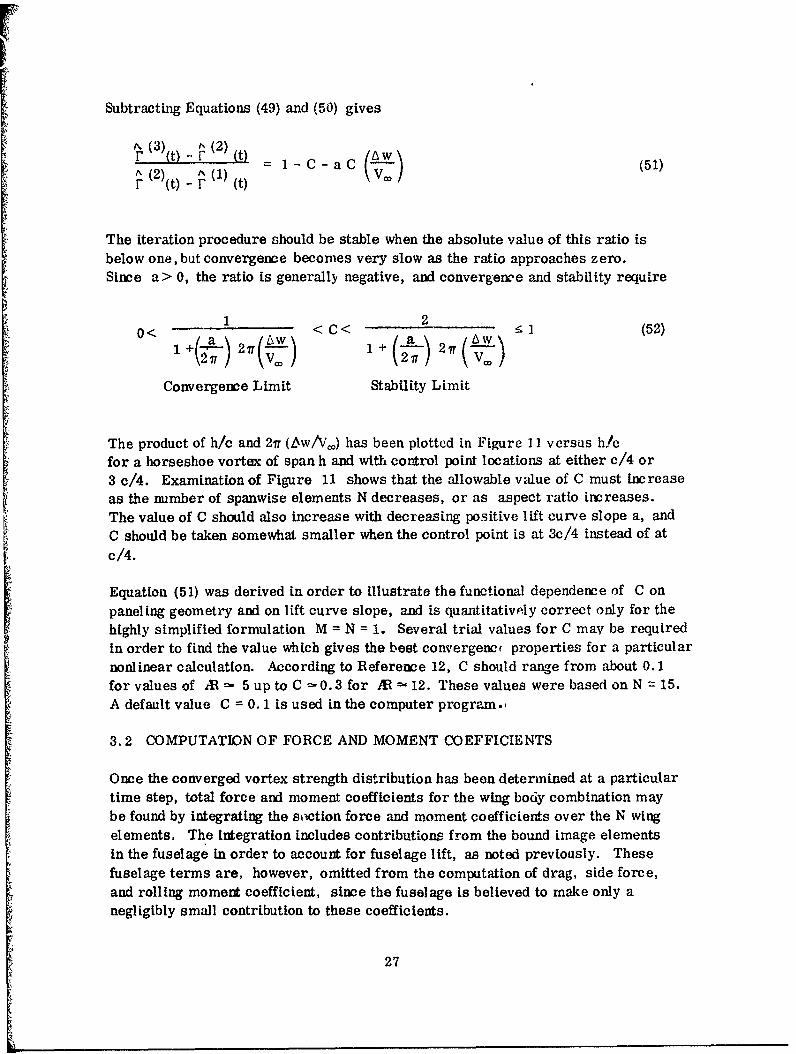
The product of h/c and 21T (bw/V,,O) has been plotted in Figure I I versus h/cfor a horseshoe vortex of span h and with control point locations at either c/4 or3 c/4. Examination of Figure 11 shows that the allowable value of C must increaseas the number of spanwise elements N decreases, or as aspect ratio increases.The value of C should also increase with decreasing positive lift curve slope a, andC should be taken somewhat smaller when the control point is at 3c/4 instead of at
c/4.
Equation (51) was derived in order to Illustrate the functional dependence of C on
paneling geometry and on lift curve slope, and is quantitativply correct only for thehighly simplified formulation M = N = 1. Several trial values for C may be requiredin order to find the value which gives the best convergenci properties for a particularnonlinear calculation. According to Reference 12, C should range from about 0.1for values of AR - 5 up to C - 0.3 for AR •- 12. These values were based on N = 15.A default value C = 0. 1 is used in the computer program.t
3.2 COMPUTATION OF FORCE AND MOMENT COEFFICIENTS
Once the converged vortex strength distribution has been determined at a particulartime step, total force and moment coefficients for the wing body combination maybe found by integrating the svction force and moment coefficients over the N wing
elements. The integration includes contributions from the bound image elementsin the fuselage In order to account for fuselage lift, as noted previously. Thesefuselage terms are, however, omitted from the computation of drag, side force,and rolling moment coefficient, since the fuselage Is believed to make only anegligibly small contribution to these coefficients.
27
4
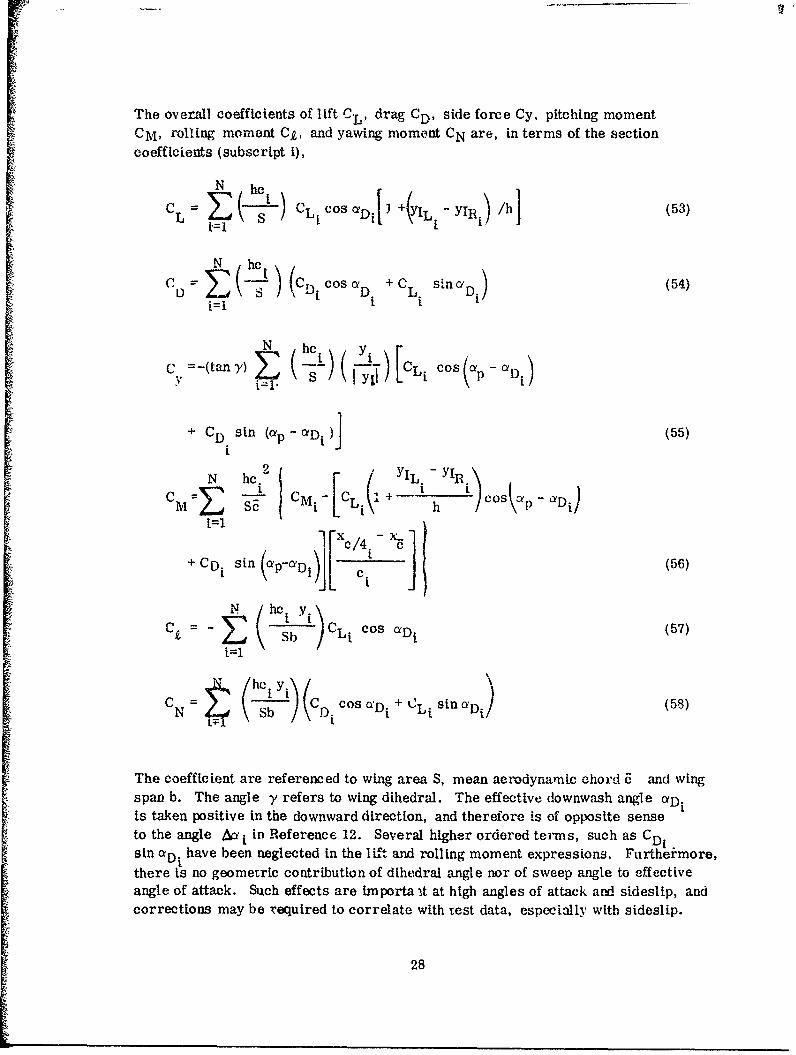
The overall coefficients of lift CL, drag CD, side force Cy, pitching momentCM, rolling moment C£, and yawing moment CN are, in terms of the sectioncoefficients (subscript I),
N h-C L C(L CosaDj h +(YIL YIR) A (53)
(CD Cos a D + C L. sin cyD) (54)
N hc.\,Y r
C -(tany') E -!) ( '_) [CL. COS GeDi
+ CD sin (p - aDi )J (55)i
N he. 2 [i YIL, - IR.\CM=i *_- CMiLCLi + costap -YDi)SE l -! (l-x/i h
+ C% sin 1YP-~ (56)
C = - e Sb )CLi cos cD, (57)i=1
Sb D. =o aS. + i LL. (58)cNýý = -• -! Dj cos O:Di + Li
The coefficient are referenced to wing area S, mean aerodynamic chord 6 and wingspan b. The angle y refers to wing dihedral. The effective downwash angle aDiIs taken positive In the downward direction, and therefore is of opposite senseto the angle Aa i in Reference 12. Several higher ordered terms, such as CDisin aD, have been neglected in the lift and rolling moment expressions. Furthermore,
there is no geometric contribution of dihedral angle nor of sweep angle to effectiveangle of attack. Such effects are Importa it at high angles of attack and sideslip, andcorrections may be required to correlate with test data, especially with sideslip.
28
4
SAMPLE CALCULATIONS
An extensive seiles of computations were made with the nonlinear lifting line computer
program described in Sections 2 and 3. The computations were made to compare with
test data, with previous theories and to assess effects of wing planform geometry and
section lift curve shape on stalling characteristics.
4.1 COMPARISON WITH AVAILABLE THEORY
Several computations were made in ordei to compare the current method with existing
theories in order to evaluate the accuracy and generality of the procedure. A
comparison of the accuracy of the finite element representation with the essentially
exact potential theory results of Wagner (Ref erence 18) has been given previously
in Figure 6 for the case of a two-dimensional airfoil with a linear lift curve subject
to a step change in angle of attack. Because of the simplifications introduced by
two-dimemnional flow, results by the present method in Figure 6 were hand computed
instead of being run on the digital computer. The similarity of the present finite
element method with the exact results is appareut in Figure 6. Both methods give
an initial lift increment equal to 1/2 of the steady state value.
The present method is compared with calcalations by W. P. Jones (Reference 19)
and Djojodlhardjo and Widnall (Reference 20) in Figure 12, for the response to a
step change in angle of attack for a rectangular wing of aspect ratio 6. The lift curve
was again linear, and as can be seen from the figure good correlation with the more
exact theories was found. Both the present and more exact methods show that the
initial lift increment I3 greater than 1/2 of the steady state value when the aspect ratio
is finite. The computations in Figure 12 were carried out on the digital computer with
values M = 20 and N = 14.
Figure 13 depicts the variation in span 9and distrlb" .ion with time from the current
method for the same sample computation. Also shown in Figure 13 are the section
Iift coefficients at the 12 1/2% and 87 1/2 % semi span stations as obtained by the
method of Reference 20. Once again, good correlation Is shown with the more exact
computations.
The present method was also used to determine the development of lift following a
step change in angle of attack for roctangular wings of various aspect ratios, agaL,
with linear lift curves. The results are plotted in Figure 14 and compare well with
similar variations obtained by Jones (Ref. 19) for wings of elliptic planform. Once
again we note that the starting circulatory lift increment exceeds one-half the
29
steady state value for the finite aspect ratio cases, with the excess increasing for thelower aspect ratios. The computations in Figure 14 are with M = 20 and N = 14.
Normalized steady state lift Increments are plotted versus aspect ratio in Figure 15,to examine the aspect ratio range over which the current formulation may be expectedto hold. The current method appears to provide an accurate representation for liftdown to aspect ratios below 2, for an unswept wing of rectangular planform, whencompared with References 21 and 22 and with slender body theory. However, agree-ment to such low aspect ratios is much less likely for planforms of moderate to highsweep angle and for more sensitive coefficients such as induced drag, section CL,etc..
4.2 COMPARISON WITH TEST DATA
The wing planform of the T-2C Navy trainer aircraft served as the basic geometryfor the remaining computations (with various modifications and adjustments). Liftand rolling moment data from Reference 23 will be compared with the T-2C compu-tations using a steady state wake (M=I), since the testing was done with the modelheld fixed at a given angle of attack (pitch and pause).
The basic T-2C configuration has a wing of aspect ratio MB = 5.07, taper ratio . =
0.495, a quarter chord sweep angle A = 2.27 degrees, a wing root incidence 1',,glei = 1.7 degrees with 2.5 degrees of washout at the tips, and a dihedral angle V = 3'.The airfoil is a NACA 64 1A212 section with an a = 0.8 (mod) camber line (flaps andailerons rigged 3 degrees up), and is constant across the span. The wing wasmounted at mid-height to a fuselage whose shape was approximated in the computationsby a circular cylinder of radius RB=O. 119 (b/2). The wing paneling used for thecomputations is shown in Figure 16 in the case of N -= 14. The number of spanwiseelements was varied for different computations. Nonlinear aerodynamic section dataused for the T-2C computations (and for the parametric computations) are plottedin Figures 17 and 18, respectively. Curves labeled #1, #2 and #3 in Figure 17 arefor a NACA 64 1A212 section at Reynolds number 3 x 1 06, 6 x 1 06 and> 6 x 10⁶.Curves labeled #11, #12 and #13 in Figure 37 were adjusted for the -30 trailing edgerigging of the T-2C model, and are to be used in comparing with the wind tunnul data.Curves labeled #4 and #5 in Figure 18 are for a NACA 64-209 section at Reynolds numbers3 x 106 and 6 x 10⁶, respectively, and were used In the parametric calculations togetherwlth curves 16-#8 to examine effects of the steepness of the negative lift curve slope-b In the post stall region. The airfoil section characteristics in Figures 17 and 18 wereextrapolated from published NACA data (e. g. Reference 24).
A comparison between the calculated and measured lift values for the T-2C at zeroand ten degrees yaw angle Is shown In Figure 19. The tests were conducted tall on,and corrections were made for the estimated tail lift contribution as shown in Figure19b. The test data are static measurements and average out any fluctuating values
of CL. The model was not pitched in a manner to produce lift hysteresis (by taking
30
transient measurements with ap Increasing and then decreasing with time), whereas
the calculations were made with a pitch rate of 8 degrees/second (first increasing andthen decreasing). Even though it is difficult to evaluate the accuracy of the unsteadymethod on the basis of the comparison with the static test data, the calculations appearto indicate a hysteresis loop which extends over a somewhat broader angle of attack band
(110°s a -_< 180) than might, be expected. This would be in accordance with the specialcomputational logic employed in the method, which as discussed in Section 3. 1.2 maywell tend to l ead to the maximum allowable hysteresis.
On the other hand, Reference 23 shows the sudden occurence of a rolling moment atzero yaw angle at angles of attack beyond 12 degrees. This may be taken as an indi-
cation of the stall (or partial stall) of one wing panel, and may correspond to the lower"limit of any zone of lift hysteresis. The T-2C zero beta rolling moment data hasbeen plotted in Figure 20. Also shown in Figure 20 are computations made with the
current method, wherein a roll asymmetry Is introduced for a very short periodand then removed, in order to perturb the asymmetrical loadings. As seen fromFigure 20, the resulting rolling moment coefficients (with the roll asymmetryremoved) correlate well with the test data.
The present nonlinear lifting line method predicts the occurance of lift hysteresis
and zero beta rolling and yawing moments for a symmetrical model with wingsection characteristics similar to the T-2C aircraft. Its proper evaluation requiresdynam;,,v wind tunnel testing wherein the model may be pitched (up or down) at a givenrate, and for which instantaneous (as well as time averaged) data are recorded. It isrecommended that any such test be made with a wing whose two-dimensional section
characteristics are known. In addition, a program of this type should includemeasurements of span load distribution, in order to afford a more explicit evaluation
of the theory.
4.3 PARAMET9T C STUDIES
A series of parametric calculations have been made, using the current method, to
detemnine efficts of wing planform (aspect ratio, taper ratio, cweep back angle, and
twist) and of airfoil section characteristics (steepness of negative lift slope beyond
stall) on the occurence of lift hysteresis and zero-beta rolling moment. The purpose
or thfw calculations was to obtain trends and guidelines which might lead to the designof safer alrcraft which are less mubject to adverse departure and spin entry charac-
teristics during high performance maneuvers.
4.3.1 EFFECT OF NEGATIVE LIFT CURVE SLOPE AND ASPECT RATIO.
Effects of the abruptness of the negative lift curve slope beyond stall and of aspect
ratio for zero yaw angle are shown in Figures 21-23. Each plot represents a pitch
hysteresis computation through the stall with the angle of attack first increasing and
then decreasing at a rate of 8 degrees/second. Points with increaising angle of attack
are de•n•ted by circles, whereas triangles are used for points with decreasing angle
31
of attack. Where no triangles appear, the points are coincident with the increasingap points. This notation has been used throughout the present section.
!P
Figure 21 is for/A = 5.07, and shows that the zone over which lift hystereE~is occursgradually decreases as the steepness of the negative lift curve slope dimi.ishes. Thesame trend is shown in Figure 22 (Al = 8) and Figure 23 (Al = 12). The figures alsoshow that increasing aspect ratio reduces the zone of hysteresis for a given negative
lift curve slope.
A similar set of pitch sweeps were made for a yaw angle 5 = 10'. Lift hysteresischaracteristics similar to those in Figures 21-23 were obtained. The correspondingvariations of rolling moment coefficient versus angle of attack have been plottedin Figures 24-26 for Al = 5.07, 8 and 12, respectively. The figures show a hysteresisloop for rolling moment coefficient, which behaves with respect to lift curve slopeand aspect ratio in a manner very similar to lift coefficient.
4.3.2 EFFECTS OF TAPER RATIO, SWEEP ANGLE AND TWIST. Effects oftaper ratio, sweepback angle and twist on lift hysteresis were obtained for the Al = 8case with section lift curves 114,6 and 7. Thus figures 27-29 show effects of varyingT from 0.2 to 1.0 on lift hysteresis. The calculations for the intermediate value
= 0.495 are the same as those presented previously in Figure 22, and exhibit a.lightly greater tendency for lift hysteresis for all negative lift curve slopes thando either of the other two T cases. This may be true, because the T = 0.495 taperratio provides a more uniform spanwise distribution of section C L , and hence causesthe initial stall to be delayed to higher values of overall lift coefficient when the pitchrate is positive.
Lift hysteresis curves with a sweepback angle A = 20* have been plotted in Figure 30for section I ift curves f 4, 6 and 7. Figure 30 may be compared with Figure 22 (a-c)to evaluate effects of the increased sweep angle. Although these figures show onlya minor sweep effect, it should be noted that the present lifting line approach maywell apply only for low sweep angles, because of the assumption in the present analysisthat the section stalling characteristics remain two-dimension. The introduction ofeven a moderate degree of wing sweep is known to modify the chordwise pressuredistribution and to promote spanwise velocity components, thereby compromising theassumption of locally two-dimensional stall.
Effects of wing twist angle are shown in Figures 31-33. Each figure is for a differentnegative lift curve slope and presents results for the cases of -3' linear wash out(0 n cT < -3"), an untwisted wing (aT=0), and a wing with positive linear twist(0•aT 5 +3*). The calculations for the untwisted case are the same as presentedpreviously in Figure 22(a-c). As is apparent from Figures 31-33, twist has only aminor influence on the extent of life hysteresis for lift curves #6 and #7. However,for lift curve #4, going from wash Out (aT = 0 - -30) to wash 0 T= 0 - +30) is seen
32
to increase the extent of stall hysteresis. This may be due to the more uniformspanwise distribution of section CL produced by wash in at the tip, as was the case
with the effect of taper ratio.
It is recognized that the effects of twist, taper ratio, aspect ratio, and sweep backon stall hysteresis are interrelated. The particular combination of wing geometricparameters which provides the most uniform spanwise distribution of section CLshould also exhibit a greater degree of stall hysteresis. Because of the correspondancebetween the occurrence of stall hysteresis and zero beta rolling and yawing moments(see Section 4.3.3), it is expected that similar conclusions may be made with regardto the effects of wing planforra parameters on the zero-beta moments.
4.3.3 ZERO BETA ROLLING (AND YAWING) MOMENTS. A set of computationswas made to illustrate thie occurence of zero-beta rolling and yawing moments duringthe pitch sequence. Thlq is shown in Figures 34 and 35 for the T-2C planform,(Af = 5.07). In this case the pitching motion was initiated at up = 120 with the wingsymmetrical. The pitching motion was halted at up = 14.40 and an asymmetry6uR = ±1° was applied to each wing plane and then subsequently removed, in orderto simulate an aileron perturbation. The pitching motion was then resumed, eitherpositive or negative, with the wing again symmetrical. Figure 34 shows the liftvariation during this process for various lift curves. The corresponding rollingmoment variations are shown in Figure 35. The theory predicts the occurence ofzero-beta rolling and yawing moments (not plotted) over nearly the same ap zoneas that for which lift hysteresis occurs. Reducing the abruptness of the stall(steepness of the negative lift curve slope) is seen to ameliorate the effect.
A similar set of computations is shown in Figures 36 and 37 for an M 8 wing.Here the roll asymmetry was introduced and removed at cp = 12.40, since thewing was already completely stalled at up = 14.40. The results show that increasingaspect ratio from 5.07 to 8.0 considerably reduces the zone of angle of attack overwhich zero-:)eta lateral moments occur, especially with the less abrupt section lift
characteristics.
4.3.4 EFFECTS OF NUMBER OF ELEMENTS. All of the parametric calculationspresented so far were made with 14 vortex elements across the span, in order toconserve computer time. It is recognized that requirements for improvedcomputational accuracy could well dictate the use of an increased number N of span-wise elements (the existing computer program is limited to N = 20). Figure 38 shows
the effect of varying N from 10 to 20 on lift hysteresis, for the section characteristicswith the most abrupt stall (curve #4) and with the most gradual stall (curve #8).Although changing N appears to effect the instantaneous CL value somewhat, especially
for the case with the most gradual stall, the overall stalling characteristics appearvirtually uneffected by N. It is recognized that further studies of the effect of N,
covering a wider range well beyond N = 2v, and for various values of aspect ratio
33

and taper ratio, are needed to determine an optimum value for the computations.In lieu of any comprehensive study of this type, the value N=14 used in the majorityof the computations appears reasonable.
Most of the parametric computations have been made with only four rows of vortexelements In the wake (M =4), the last row being horseshoe in shape. Calculationswere made with values of M as high as 40 (and as low as 1). The value M = 4 wasset as a compromise for including the major contribution from the unsteady wake(up to distances of 3c behind the airfoil), while reducing computer time to a minimum
4.4 HYSTERESIS CORRELATION
An attempt was made to correlate the results of the various computations of lifthysteresis with the abruptness of the wing stall and with planform geometry. Onesuch correlation is shown in Figure 39, wherein the product ACLH,- AaH has beenplotted versus 57.3b/iTrAR. Here ACLH is the maximum CL difference in thehysteresis zone, and AsH is the width of the zone. The product ACL . AaHis a measure of the area of the lift hysteresis loop. The value b is the maximumnegative lift curve slope (per degree), and the ratio 57.3 b/irAR represents the ratioof this slope to the slope dCL/daD for a wing with constant downwash angle aDacross the span.
It is readily seen from Figure 1 that multiple solutions (symmetric case) will notoccur unless b/(dCL,/daD) > 1, corresponding to 57.3 b/Ir AR > 1 in the constantdownwash angle case. For a wing with AR -= 4 and a trilinear lift curve, as usedin the examples of Section 2.4, multiple asymmetric solutions occur when b/a(57. ,1 b)/(2V- AR/4) > 1. 5, (or equivalently 57. 3 b/ff AR z 0. 75), as seen from Figures7-9. Thus, the parameter 57.3 b/ITAR appears reasonable for predicting the'-ccurence of multiple asymmetric as well as of symmetric solutions.
The correlations in Figure 39 predict the occurrence of lift hysteresis wherever57.3 b/ir IAR>0. 18, although the area of the hysteresis loop is seen to be dependenton other planform characteristics as well, such as sweep back angle, twist andtaper ratio. Thus, the method predicts the occurrence of lift hysteresis for wingswith negative lift curve slopes only approximately 1/5 as abrupt as thought necessarybased on the idealized constant downwash angle criterion. This may be due to theratio d 1/da being much less than it AR/57.3 over local regions of the wing withstalled or parially stalled flow. Additional analysis of the parametric computationsand dynamic wind tunnel testing are required to further substantiate the correlationin Figure 39.
34

5
CONCLUSIONS AND RECOMMENDATIONS
A nonlinear lifting line theory, with an unsteady wake, has been developed and hasbeen applied to the prediction of forces and moments on aircraft undergoing apitching motion through the stall region. The procedure is an outgrowth of the steadystate, nonlinear lifting line approaches in Reference 1-3, which predicted the occur-rence of multiple solutions to the lifting line equations under certain conditions. Thepresent theory predicts the occurrence of lift hysteresis and of rolling and yawingmoments, even at zero yaw angle, for wings where section characteristics exhibita negative lift curve slope of sufficient steepness subsequent to stall. It is anticipatedthat the theory (and parametric computations presented herein) may serve as a guidein predicting the susceptibility of various aircraft des!gns of moderate to high aspectratio and low sweep angle to adverse stall and departure characteristics.
5.1 CONCLUSIONS
Conclusions relating to the namerical computations and to the assumptions in thetheory are summarized below.
(i) The method has been programmed for solution on the CDC Cyber 70computer. Computer solutions are simple to execute and reasonablyeconomical, requiring about one-minute of micro-proccssor time for acomplete pitch sweep and hysteresis loop.
(ii) Computations by the present method agree reasonably well with previousmore exact, unsteady, linear, two-dimensional and three-dimensionaltheories down to aspect ratios of 3 and less for wings of zero sweep.
(iii) The present method compares well with steady state T-2C test data (aspectratio 5.07), both for lift and rolling moment. No lift hysteresis effectappeared in the test data, but both test data and theory showed the occurrenceof zero-beta rolling and yawing moments in the stall region.
(iv) The present theory predicts the occurence of lift hysteresis (and ofzero beta rolling and yawing moments) when the parameter 57.3b/TAl > 0.18(-b is the maximum negative lift curve slope of the two-dimensional airfoilsections comprising the wing). The angle of attack range over which theseeffects occur, and their severity is found to increase with increasing band with decreasing aspect ratio. Other planform parameters, such as sweep-back angle,twLst and taper ratio have also been shown to affect the extentof these adverse stalling characteristics to a lesser degree.
35
(v) The converged solutions obtained at angles of attack for which multipleroots exist are non unique and depend upon the starting solutions used Inthe integration procedure.
(vi) The iteration procedure used in the present method employed a speciallogic, which used either the converged solution from the previous timestep as the initial iterate (unstalled) case, or set the initial iterate fordownwash angle equal to zero over a wing panel (stalled case). Thisspecial logic was somewhat empirical, and led to the elimination of solu-tions with saw-tooth stalling patterns. However, the special logicdelayed stall during pitch-up motions, and postponed destall during pitch-down motions, thereby maximizing the zone over which lift hysteresis(and zero beta rolling and yawing moments) occur.
(vii) The formulation does not include geometric effects of sweep angle anddihedral angle on the effective section angle of attack. These effectsshould be included to produce satisfactory correlation with test data,particularly for the s ideslip case.
5 2 RECOMMENDATIONS
Recommendations for Improving the present method, by removing several of therestrictive assumptions noted above, by conducting additional comparisons with testdata, and by generalizing the procedure for a wider class of aircraft configurations(e.g. lower aspect ratio fighters) are given below.
(i) A less empirical approach is required for selecting a particular loadingwhen multiple solutions exist. This would lead to an improved predictionof the angle of attack zone over which lift hysteresis and attendant zero-betalateral moments may exist. One approach may be the Introduction of ratedependent equations for the vortlcity on the wing. Such a formulation mayrequire chordwise relocation of the control poiLit and/or modification of thetime stepping procedure (see also iv below).
(Ui) A more definative evaluation of the method should be carried out by conducting
wind tunnel tests with a model which may be pitched and yawed continuouslywhile obtaining instantaneous readings of forces and moments. It isrecommended that the model consist of a circular fuselage with replaceablestraight wings of various aspect ratio and of known two-dimensional sectioncharacteristics, In order to determine limits of applicability of the method.Pressure data should be obtained over the wing, so that transient span andchordwise load distributions may be obtained and compared with those
predicted by the theory.
36
(Lii) The formulation should be extended to treat yaw and dihedral effects directly,rather than by simulating a yawed wing by a skewed wing. In addition, acapability for time dependeat yawing motions should be incorporated into theprogram In order to provid ý for coupling the lifting line formulation with theequations of motion for an aircraft.
(iv) In order to extend the method to lower aspect ratio fighter type wings, it Isrecommended that the lifting line formulation be expanded into an unsteady,nonlinear, lifting surface theory. The new formulation would employ atleast two spanwise lifting lines, and control points for satisfying flow tangencywould be placed at two or more chordwise positions. The expanded theorywould also include unsteady effects on chordwise load distribution, andmight provide insight into the mechanism of dynamic stall. The later effectsare excluded from the current lifting line formulation, which assumes thatchordwise load distributions are always steadystate.
37
6
REFERENCES
1. Sears, W.R., "Some Recent Developments In Airfoil Theory," Journ. Aero-
space Sciences, Vol. 23. No. 5, May 1956, pp 490-439.
2. Schairer, R. S., "Unsymmetrical Lift Distributions on a Stalled MonoplaneWing," California Institute of Technology, Thesis, 1939.
3. Sears, W.R., "A New Treatment of Lifting Line Theory with Applications toRigid and Elastic Wings," Quat. Appl. Math., Vol. VI, No. 3, Oct. 1948,pp..?39-255.
4. Cord, T.J., "Hysteresis Induced Wing Rock:'Air Force Ilight 1)ynamtcsLab. Rcpt., AFFDL-TM-75-76-FGC, June 1975.
5. Anderson, C.A., 'Stall/Post-Stall Characteristics of the F-111 Aircraft,"AGARD Proceedings #102, Fluid Dynamics of Aircraft Stallins, 1972, pp. 18-1 to18-9.
6. Jones, J.G., "The Dynamic Analysis of Buffeting and Related Phenomena,"
AGARD Proceedings #102, Fluid Dynamics of Aircraft Stalling, 1972,pp. 23-1 to 23-10.
7. Shaw, D. E., "Pre-Stall Behavior of Combat Aircraft," AGARD LectureSeries #74, Aircraft Stalling and Buffeting, 1975, pp. 6-1 to 6-18.
8. Marks, K. E., "Method for Calculating Wing High Lift Characteristics UsingNon-Linear Section Data," General Dynamics Convair Report GDC-ERR-1560,December 1970.
9. Levinsky, E.S., and Ramsey, J. C., "Methodology for Estimating STOLAircraft High Lift Systems Characteristics," AIAA Paper 72-779, August 1972.
10. Herbert, J., Levinsky, E.S., Ramsey, J.C., Laudeman, E.C., Altman, H.G.,and Barbee, L. G., "STOL Tactical Aircraft Investigation", Vol. UI, DesignCompendium, General Dynamics Convair, AFFDL TR73-21, Vol. II, May 1973.
11. J. Weissinger, "The Lift Distribution of Swept-Back Wings," TM 1120 NationalAdvisory Committee for Aeronautics, March 1947.
12. Piszkin, S. T., "Dynamic Nonlinear Span Load Program," General Dynamics/Convair Aerodynamics, TN-75-CRAD-03, Nov. 1975.
39
Preceding page blank
13. J. Lennertz, Beltrag Zur theoretischen Behandlung des genenseitigen Einflusses
von Tragflkhe und Rumpf," Z. f.a.M.M., Bd, August 1927, pp. 249-276.
14. Zlotnick M. and Robinson, S. W., Jr., "A Simplified Mathematical Model for
Calculating Aerodynamic Loading and Downwash for Midwing Wing-Fuselage
Combinations with Wings of Arbitrary Planform," NACA RM L52J27a,
16 January 1953.
15. Gray, W.L. and Schenk, K. M., "A Method for Calculating the Subsonic Steady-
State Loading on an Airplane with a Wing of Arbitrary Plan Form and Stiffness,"
NACA TN 3030, Boeing Airplane Company, December 1953.
16. Lawrence, H.R. and Flax, A.H. , "Wing Body Interference at Subsonic and
Supersonic Speeds - Survey and New Developments," Journ. of the Aeronautical
Sciences, Vol. 24, No. 5, May, 1954, pp, 289-324.
17. Ham, N. D. and Johnson, W., "On the Mcchanism of Dynamic Stall, " Journal
of the American Helicopter Society, Vol. 17, No. 4, Oct. 1972.
18. Wagner, H., "Dynamischer Auftreib von Tragflligeln," Zeitschrift fdr Angew.
Math. v. Mech., Bd. 5, 1925, 11. 17-35.
19. Jones, W.P., "Aerodynamic Forces on Wings in Non-tUniform Motion,"British, A.R.C., R&M 2117, 1945.
20. Djojodihardjo, R. H. and Widnall, S. E., "A Numerical Method for the Calculation
of Nonlinear Unsteady Lifting Potential Flow Problems," AIAA Journal, Vol.
7, No. 10, Oct. 1969, pp. 2001-2009.
21. Margason, R. F. and Lamar, L. E., "Vortex Lattice Fortran Program for
Estimating Subsonic Aerodynamic Characteristics of Complex Planforms,"
NASA TN D-6142, Feb., 1971.
22. Glauert, H., The Elements of Aerofoil and Alrscrew Theory, University
Press,, Cambridge, 1947.
23. Schuetz, A.J., and Bailey, D. B., "Low Speed Wind Tunnel Investigation of a
0.09 Scale, Navy Model T-2C Subsonic Jet Trainer Aircraft from -8 to +83
Degrees Angle of Attack," Naval Ale• Dev. Center Rcport NAI)C 73259-30, Dec '73.
24. Abbott, I. H. and Von Doenhoff, A. E., Theory of Wing Sections, Dover
Publications, N.Y.,N.Y. ,1959.
25. Kroeger, R. A., and Feistel, T. W., "Reduction of Stall-Spin Entry Tendencies
Through Wing Aerodynamic Design," SAE Paper 760481, April 6-9, 1976.
40
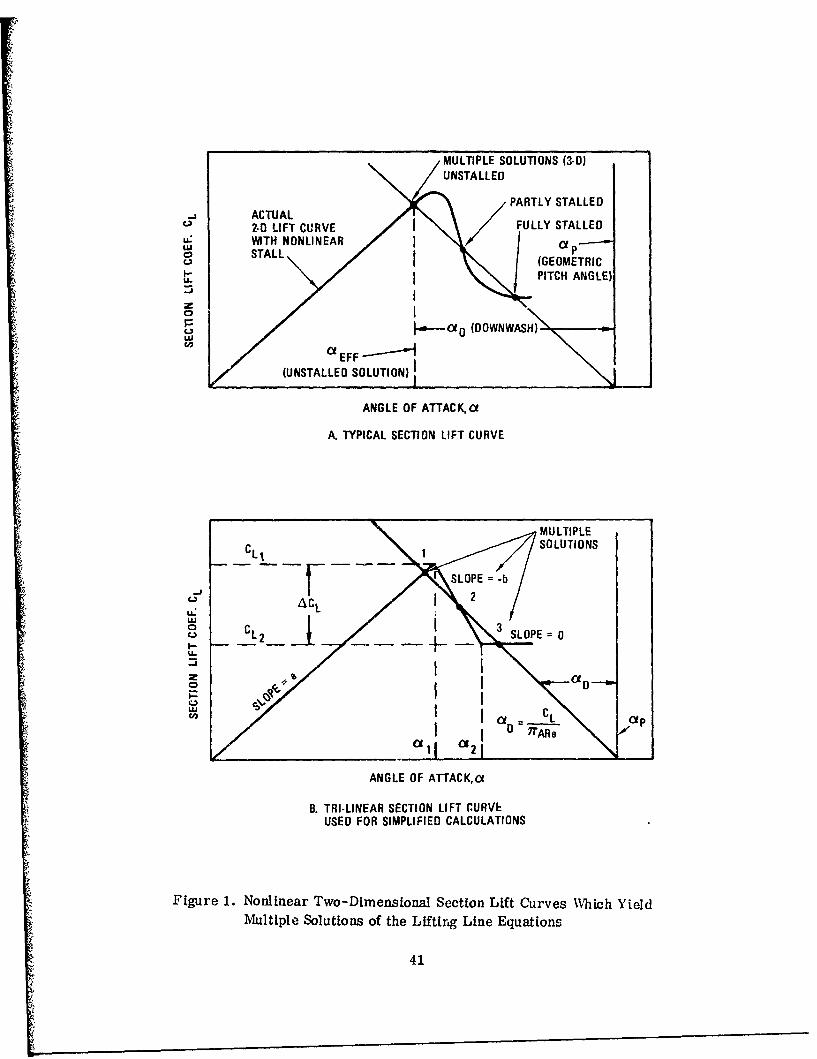
MULTIPLE SOLUTIONS (3-D)UNSTALLED
PARTLY STALLED-I ACTUAL
2-0 LIFT CURVEI FULLY STALLEDLL" WITH NONLINEAR p--U4oS L (GEOMETRIC
U- I PITCH ANGLE)
z
PU ,- ct0 (DOWNWASH)c o C t E F F
(UNSTALLED SOLUTION)
ANGLE OF ATTACK,d
A. TYPICAL SECTION LIFT CURVE
MULTIPLE
CLI 1 SOLUTIONS
r SLOPE = -b
ACL 2
oLC. CL 2 _ SLOPE 0
U-
lb CL
07rARS•11 21
ANGLE OF ATTACK, o
B. TRI-LINEAR SECTION LIFT CURVEUSED FOR SIMPLIFIED CALCULATIONS
Figure 1. Nonlinear Two-Dimensional Section Lift Curves Which YieldMultiple Solutions of the Lifting Line Equations
41
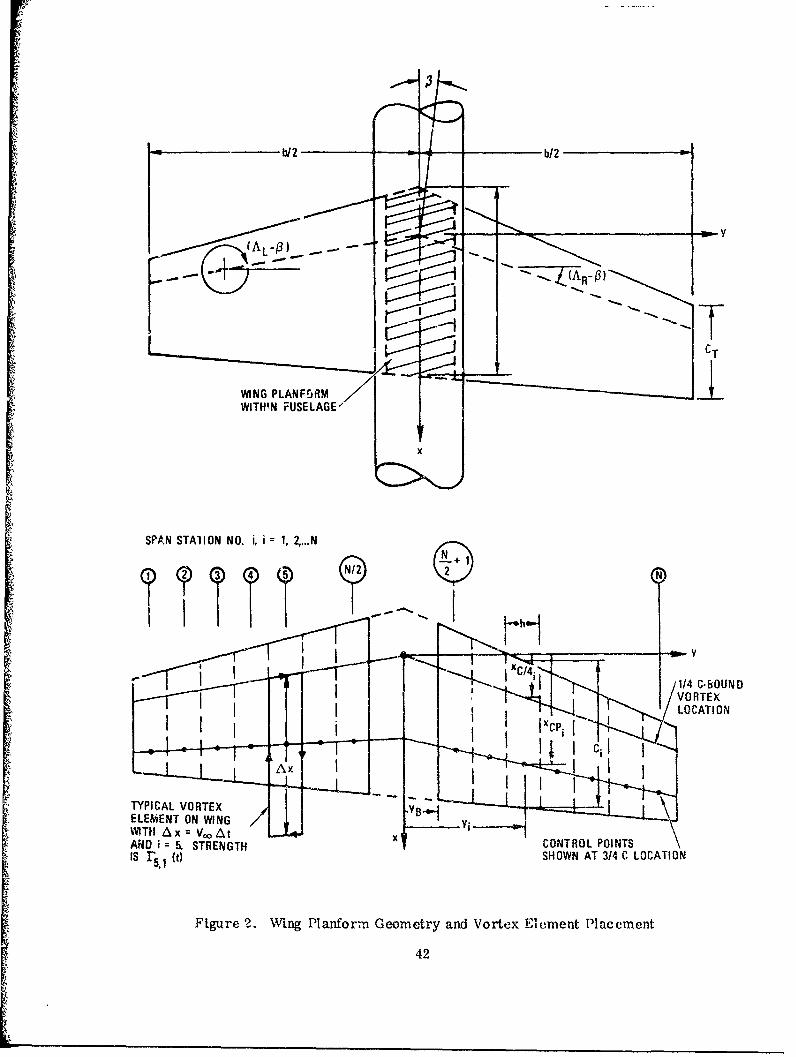
-b/2b/
CT
WING PLANFORMIWITH'N FUSELAGE-'
SPAN STA1ION NO. i, i 1, Z...N
5N
XC/4i1/4 C-hOUND
LOCATION
TYPICAL VORTEXELEMENT ON WING /iyWITH A x = V,.At COTO PITAI D ri 5. ST RE GT SHOWN AT 3/4 C LOCATION
Figure 24. Wing Planform Geometry and Vortex Element Placement
42
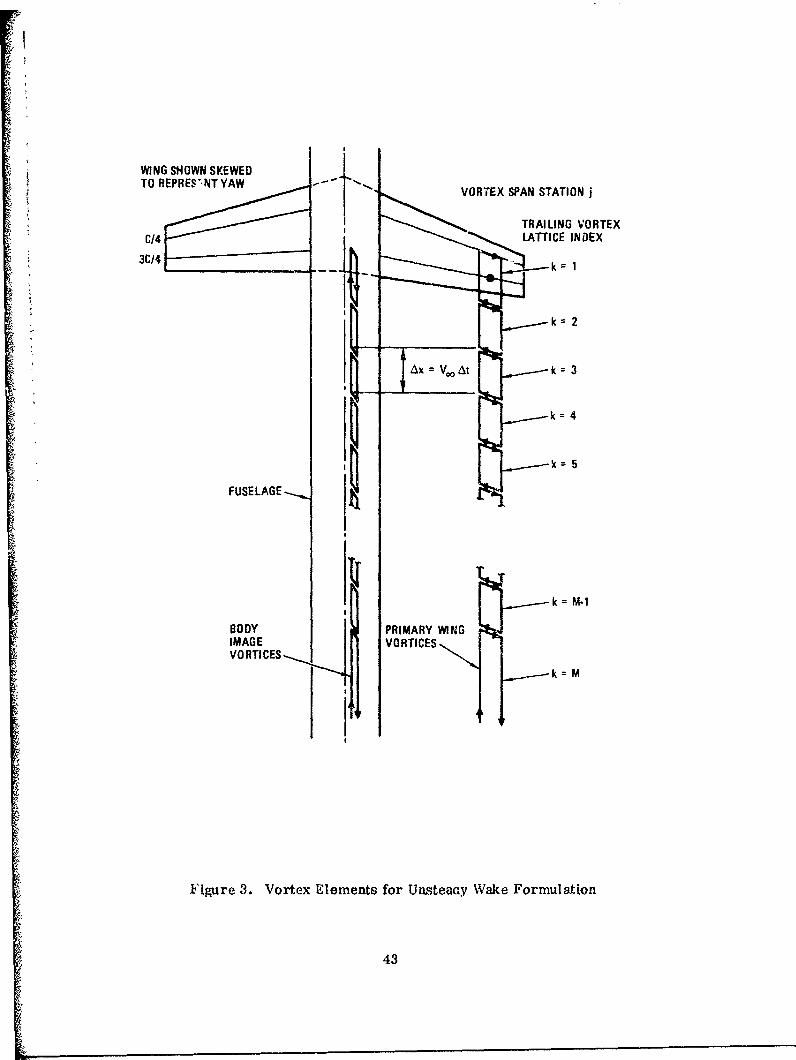
WING SHOWN SKEWEDTO REPRES'NTYAW
VORTEX SPAN STATION i
SI TRAILING VORTEX
3C/4 k=l
ik 2
Ax V."oAt k 3
.,... -k = 4
FUSELAGE
11 TBODY PRIMARY WING 'I
IMAGE VORTICESVORTICES
k= M
Figure 3. Vortex Elements for Unsteacy Wake Formulation
43
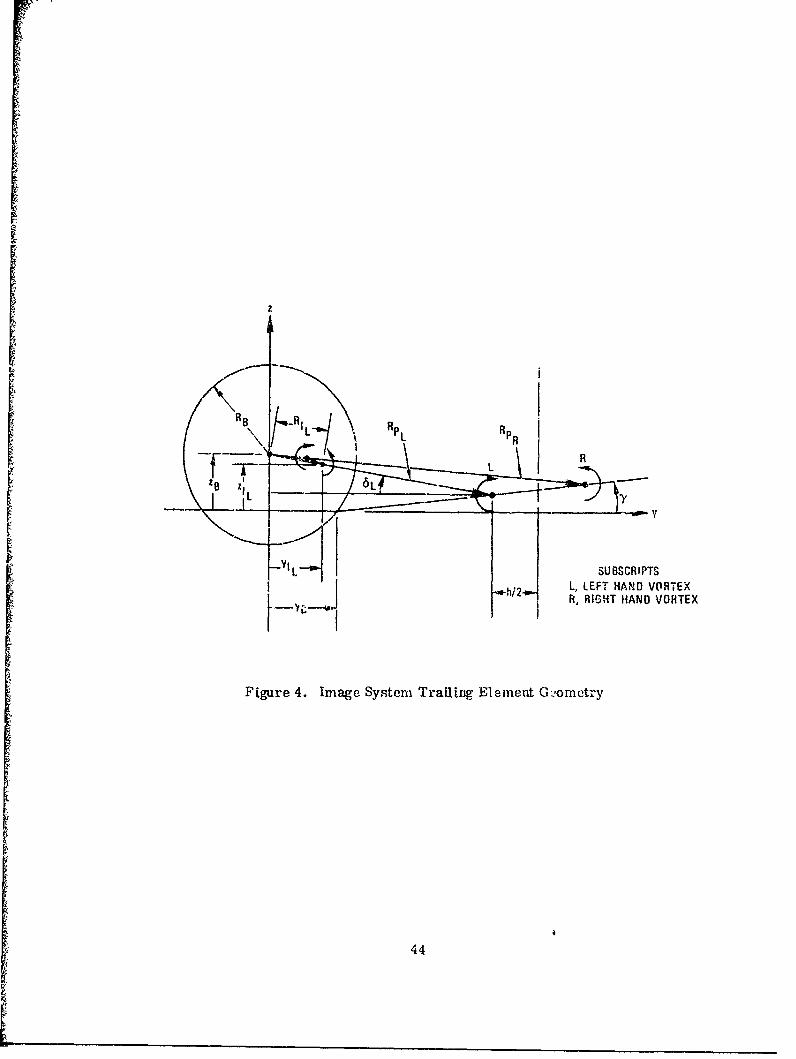
z
- L-
SUBSCRIPTSL, LEFT HAND VORTEX
h/-,ihj2 R, RIGHT HAND VORTEX
Figure 4. Image System Trailing Element G=,ometry
44
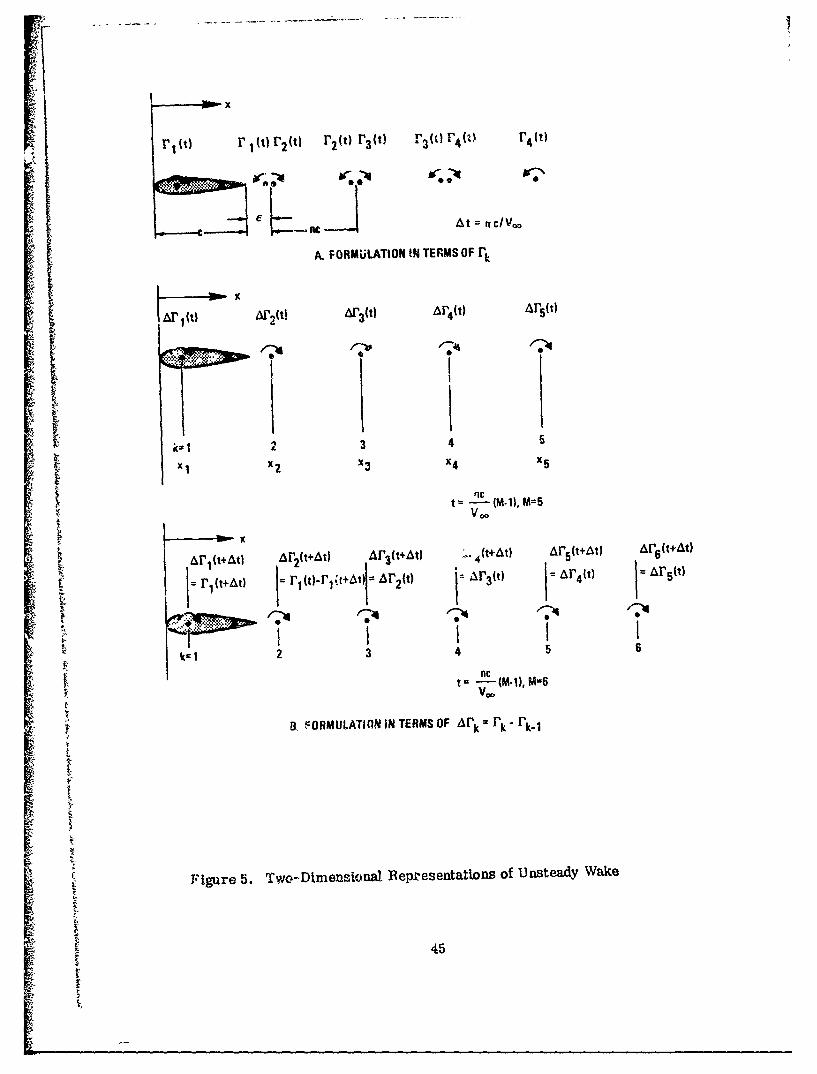
x
A. FORMULATION IN TERMS OF r
Arp) ArP) A17P() A,
X3
XX23 4 x5
t= (M-1), M=5V'.
Figue 5. t+t Tw-Dmels(fllAl ) : Rei(et +At)ol &r(t+Ate)d W Aket+
455
Itc
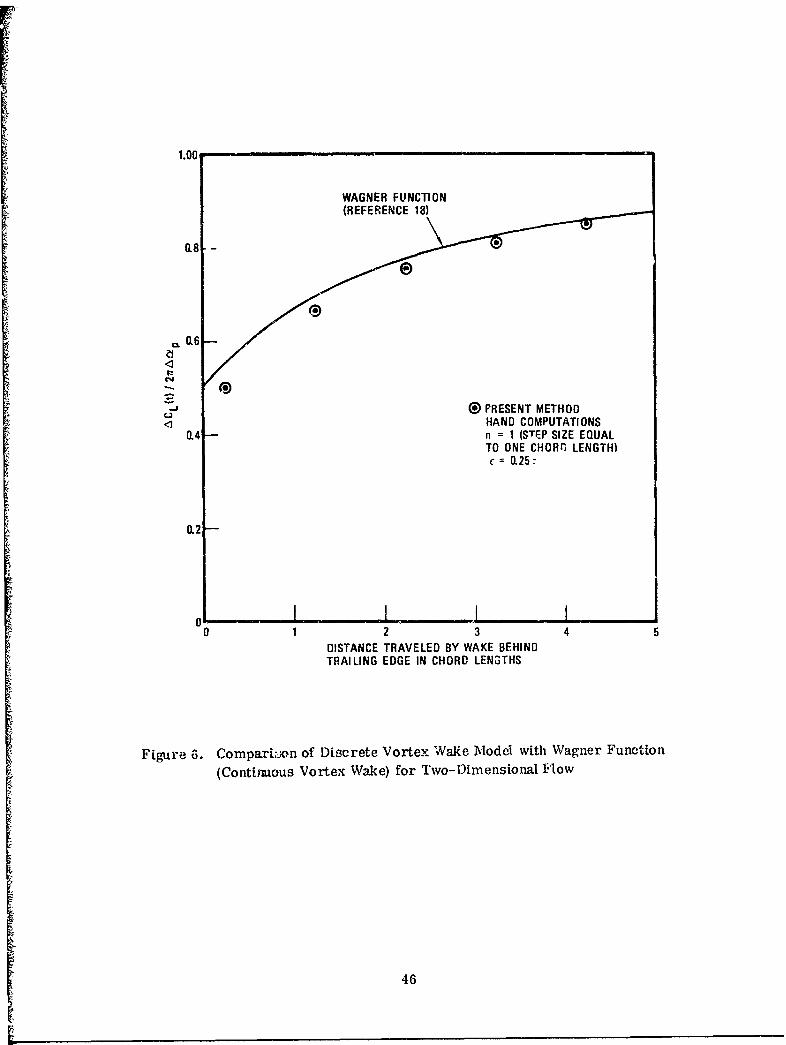
1.00
WAGNER FUNCTION
0.8 -
6®
_ •)PRESENT METHOD<1 HAND COMPUTATIONS
0.4n = 1 (STEP SIZE EQUAL
TO ONE CHORn LENGTH)c = 0.257
0.2•
0 1 2 3 4 5
DISTANCE TRAVELED BY WAKE BEHINDTRAILING EDGE IN CHORD LENGTHS
Figure G. ComparLon of Discrete Vortex Wake Model with Wagner Function
(Continuous Vortex Wake) for Two-Dimensional Flow
46
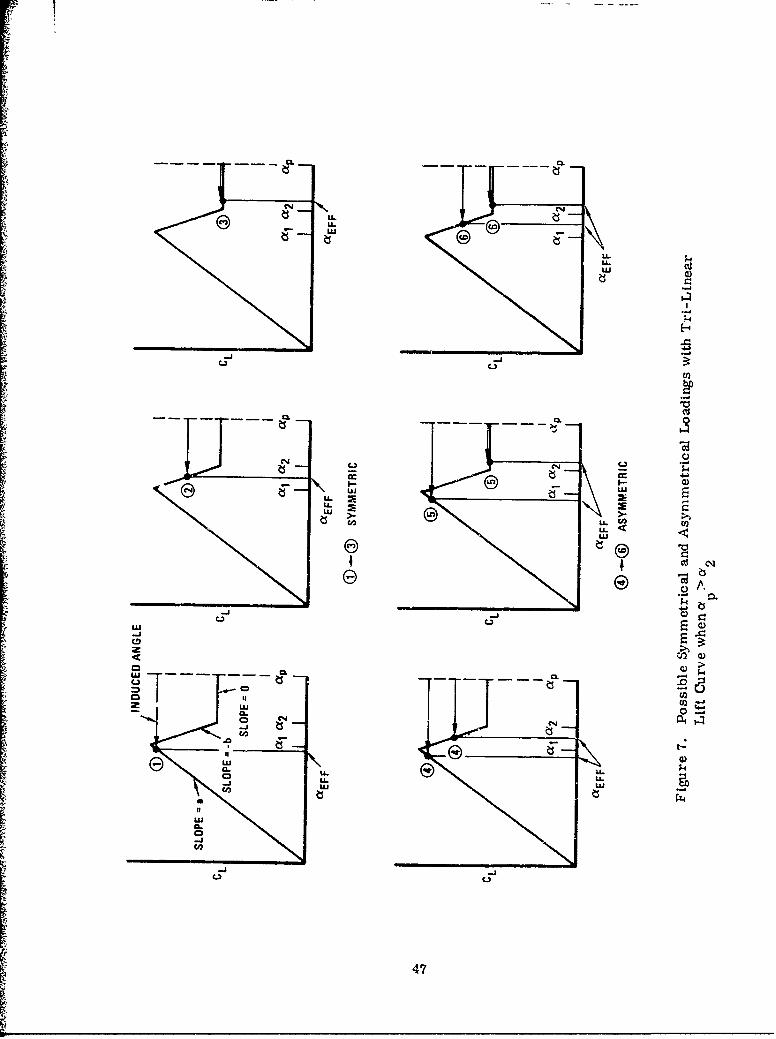
CC
U..
U)[ C-44;ccc
wwc-J-
0.
CcL
Iup
CL
C.4
00
-JCd,
IDdU-i LL47

-a-
tuu
-JT-1
-JLu u
.g~ f - L z
0.0
or
Cd-
4-8
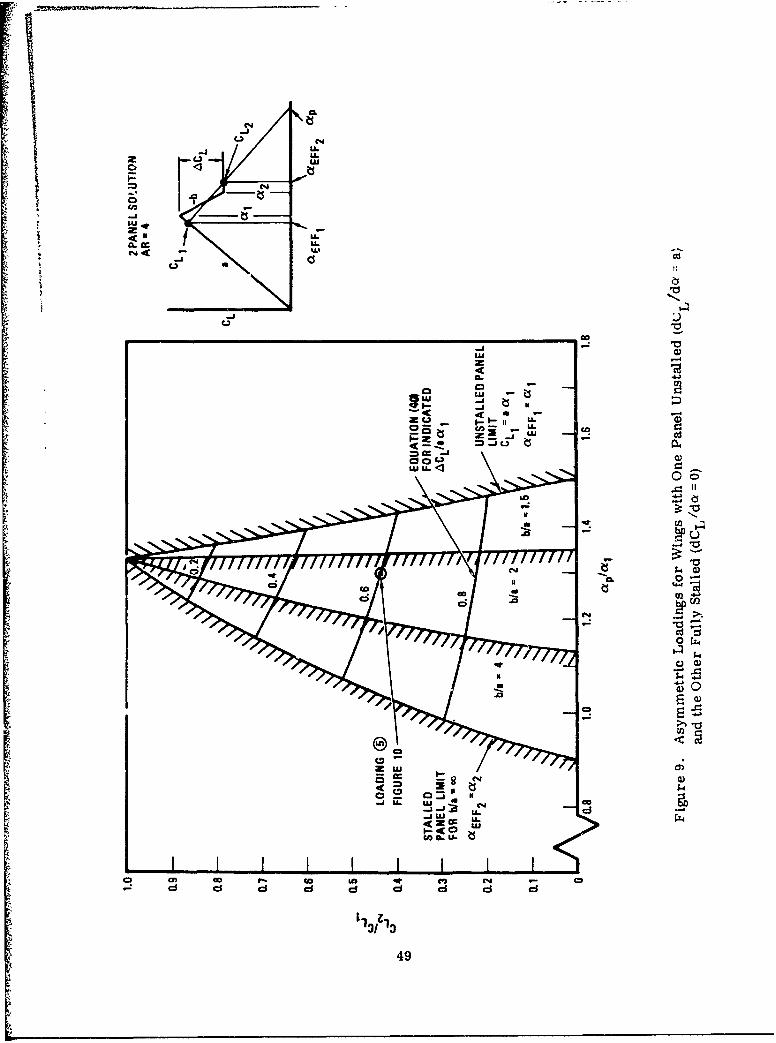
-JL
-j U.
2 w
LL.
CLI-4 w
UL-J *
0 -
c~i
J= -J
Co
lotI
p..
110-'
00
0 0
~~( 0
i-M0
o ID C~ (4 -D- d d d d
Li21
49 ; t$

TABULATION OF SYMMETRICAL AND ASYMMETRICAL LOADINGS FOR2 PANEL SOLUTI ON, AR=4 WING WITH b/a=4, ACLCLMAX 0.7,AND'p/Q 1=1.3.
LOADING LOADINGNO. SYMBOL TYPE I CLI/CLMAX CL2/CLMAX CL2/CL1
() SYMMETRIC 0.98 0.98 1.00
A SYMMETRIC 0.65 0.65 1.00
Q SYMMETRIC 0.40 0.40 1.00
A•ASYMMETRIC 0.96 0.84 0.87
ASYMMETRIC 0.91 0.40 0.44
0 ASYMMETRIC 0.46 0.40 0.87
1.4
cap
1.2 I
1.0 -- [
0.8 - 2D LIFT I
-J CURVE ACLIC.,MAX
0.6- dCL.da dCL=
0.4 - - d ot
(1.2 /da•l
0 .02 114 0.6 0.8 1.0 1.2 1.4 1.6 1.8 z0a EFF/6!1
Figure 10. Example of the Occurance of Six Possible Loadings with a Tri-Linear
Lift Curve
50
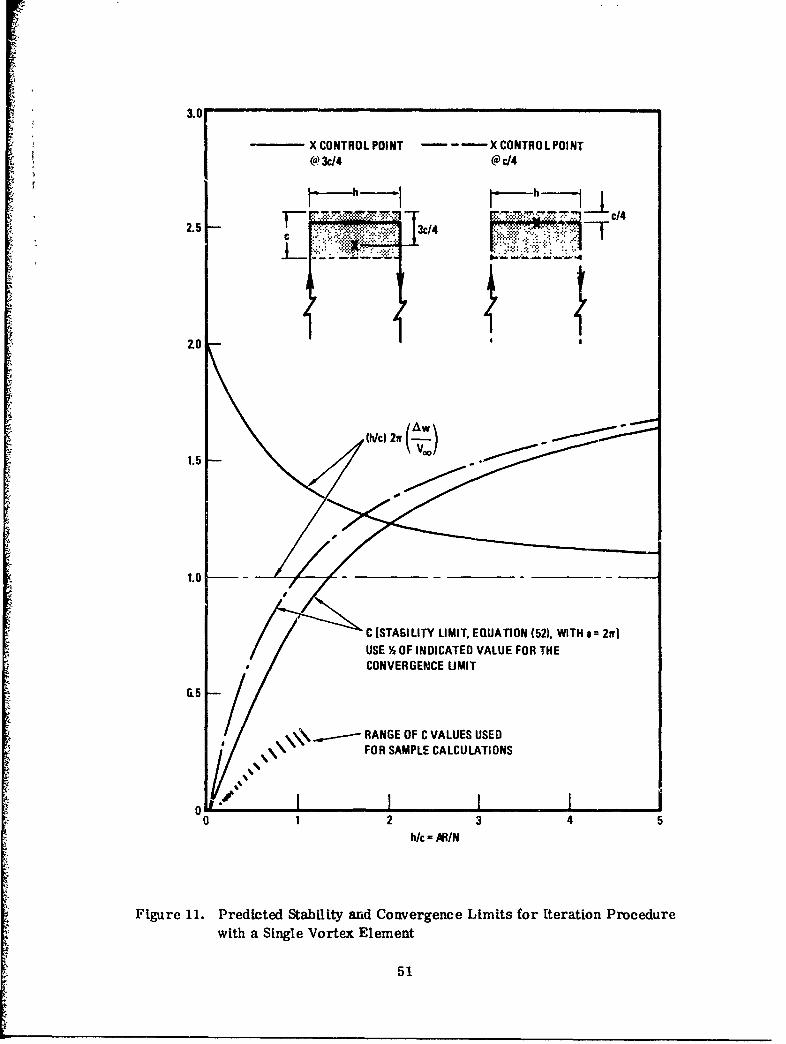
3.0
X CONTROL POINT -- X CONTROL POINT0) 3c/4 @ c/4
-E~~~~ .-• .:. - . • .- .• c/4
2.5 3/44
20 -' -
1.5
C [STABILITY LIMIT. EQUATION (52), WITH a= 2xr]
USE % OF INDICATED VALUE FOR THECONVERGENCE LIMIT
RANGE OF C VALUES USEDFOR SAMPLE CALCULATIONS
00 1 2 3 4 5
h/c = A9/N
Figure 11. Predicted Stability and Convergence Limits for Iteration Procedurewith a Single Vortex Element
51

1.0 - .. ..
RECTANGULAR WINGASPECT RATIO 6SECTION LIFT CURVE SLOPE a= 2w'
0.8 STEADY
STATE
JONES, REFERENCE 19
0.6
0OPRESENT METHODN =14,M =20, n 1
A DJOJODIHARDJO AND WIDNALL,REFERENCE 20
0.2
0 I I I1 2 3 4 5
DISTANCE TRAVELED, Axi/
Figure 12. Effect of a Step Change in Angle of Attack on 1,ift, X• - 6.
52
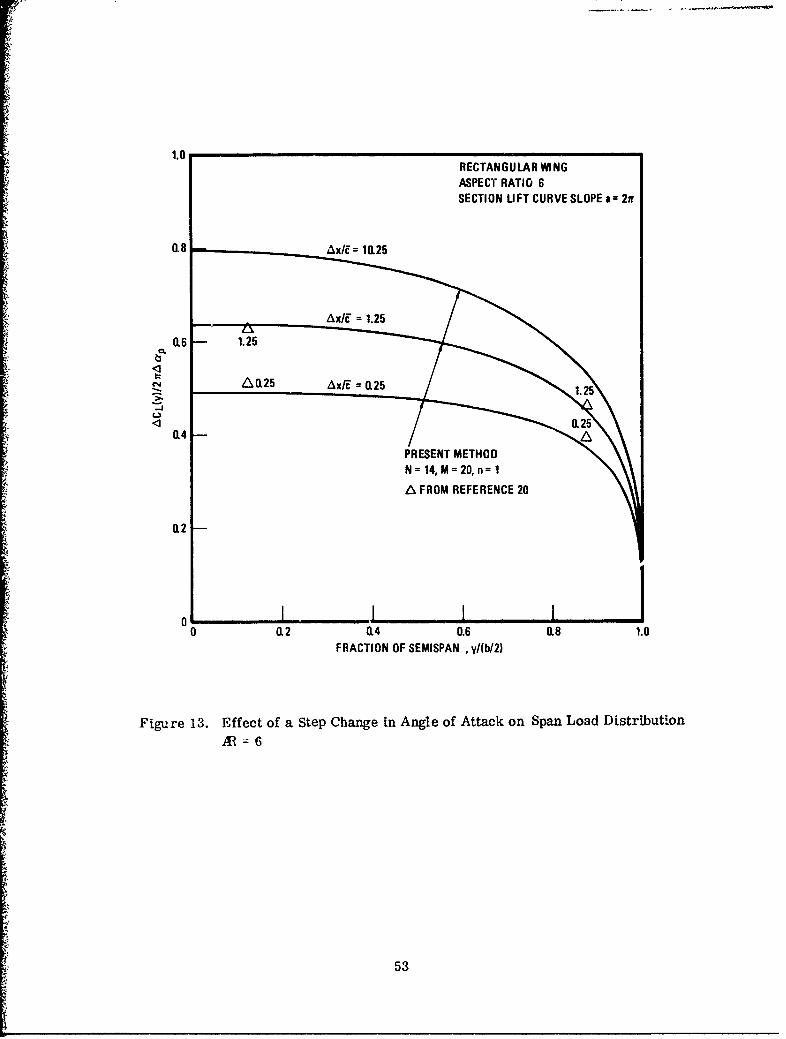
1.0
RECTANGULAR WINGASPECT RATIO 6
SECTION UFT CURVE SLOPE a 2fr
0.8 AxlE= 10.25
AxlE" 1.25
0.6 1.25
A0.25 Ax/E'R25
-,,J
0.4PRESENT METHODN = 14, M = 20, n= I
A FROM REFERENCE 20
0.2
o I i I I6 0.2 114 0.6 0.8 1.0
FRACTION OF SEMISPAN , y/(b/2)
Figure 13. Effect of a Step Change In Angle of Attack on Span Load Distribution
At =6
4,.: 53

1.0
.-.. (WAG NE R FUNCTION)
AR =15
0.8 12
000, 9
6
0.6 4
1 3
14 2
0.2 SOLID LINES BY CURRENT METHODRECTANGULAR WINGN= 14, M= 20, n= 1SECTION LIFT CURVE SLOPE a= 21r
0 I , I I0 2 4 6 8 10
DISTANCE TRAVELED, Ax/I
Figure 14. Effect of Aspect Ratio on Lift Following a Step Change in Angle of
Attack
54
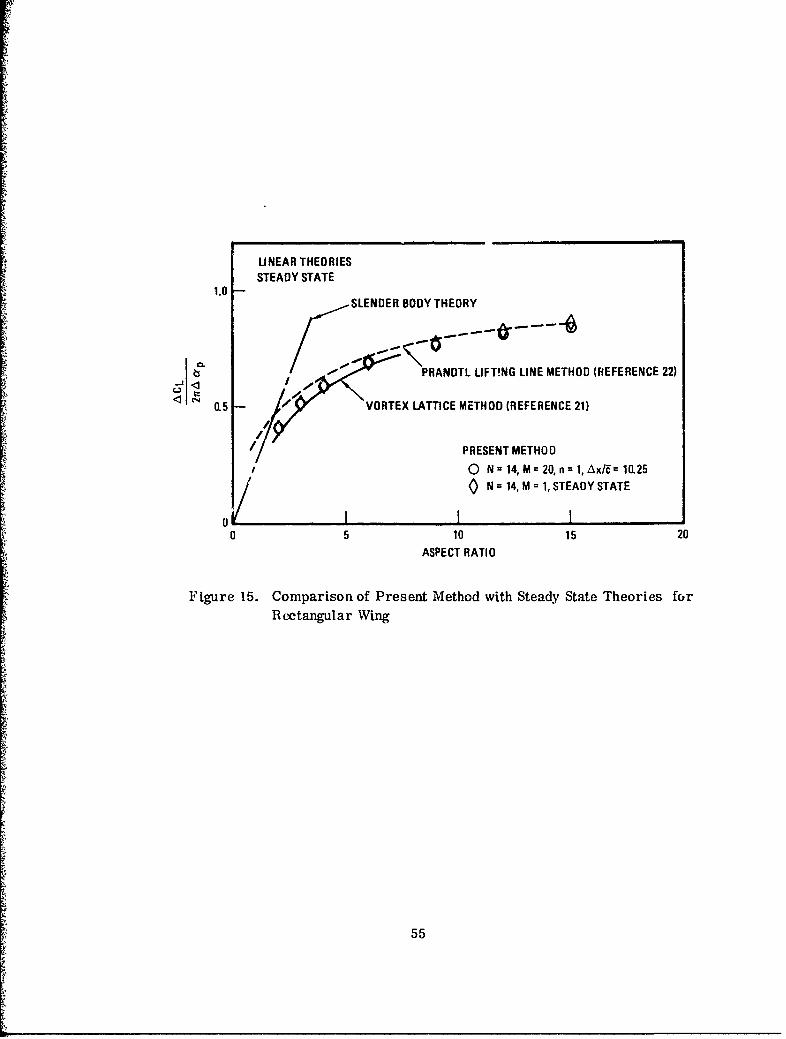
LINEAR THEORIES
STEADY STATE1.0- SLENDER BODY THEORY
-" ' -PRANDTL LIFTING LINE METHOD (FREFERENCE 22)
C<• 0.5 VORTEX LATTICE METHOD (REFERENCE 21)
PRESENT METHOD0 N= 14, M= 20, n= 1, Ax/E= 10.25
N = 14, M = 1, STEADY STATE
,, II I
0 5 10 15 20ASPECT RATIO
Figure 15. Comparison of Present Method with Steady State Theories for
Rectangular Wing
55
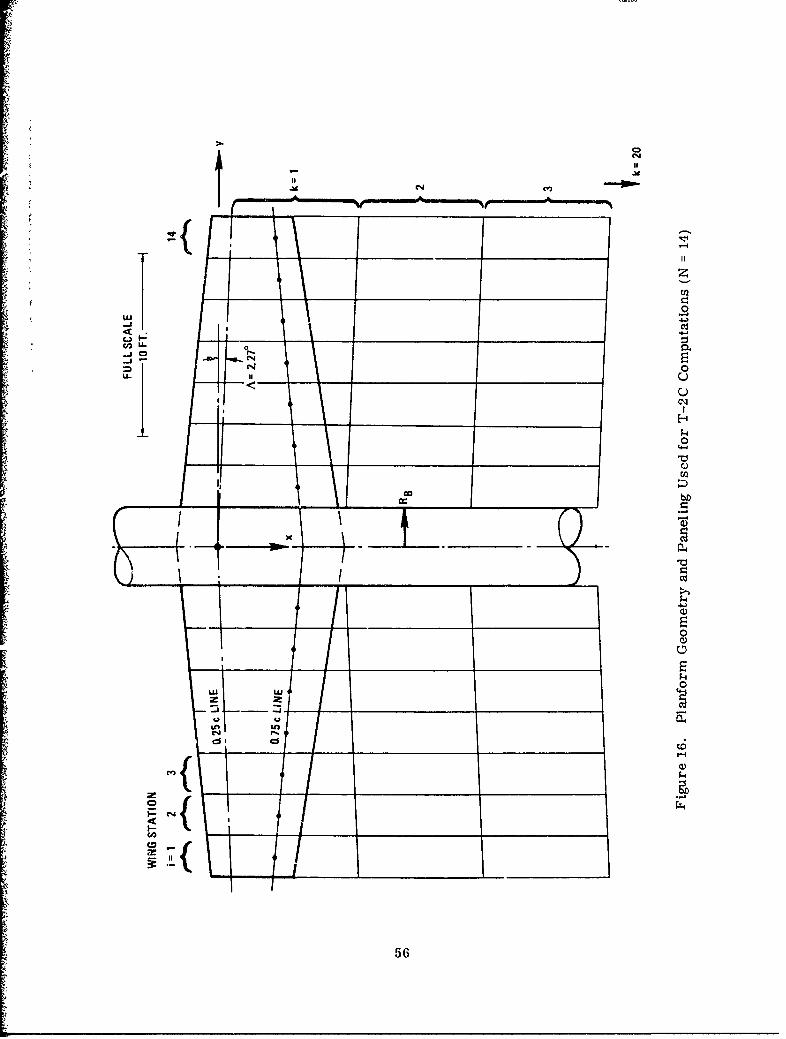
Cl
III
0
iii
LU LUZ
L$of
C'-4
56
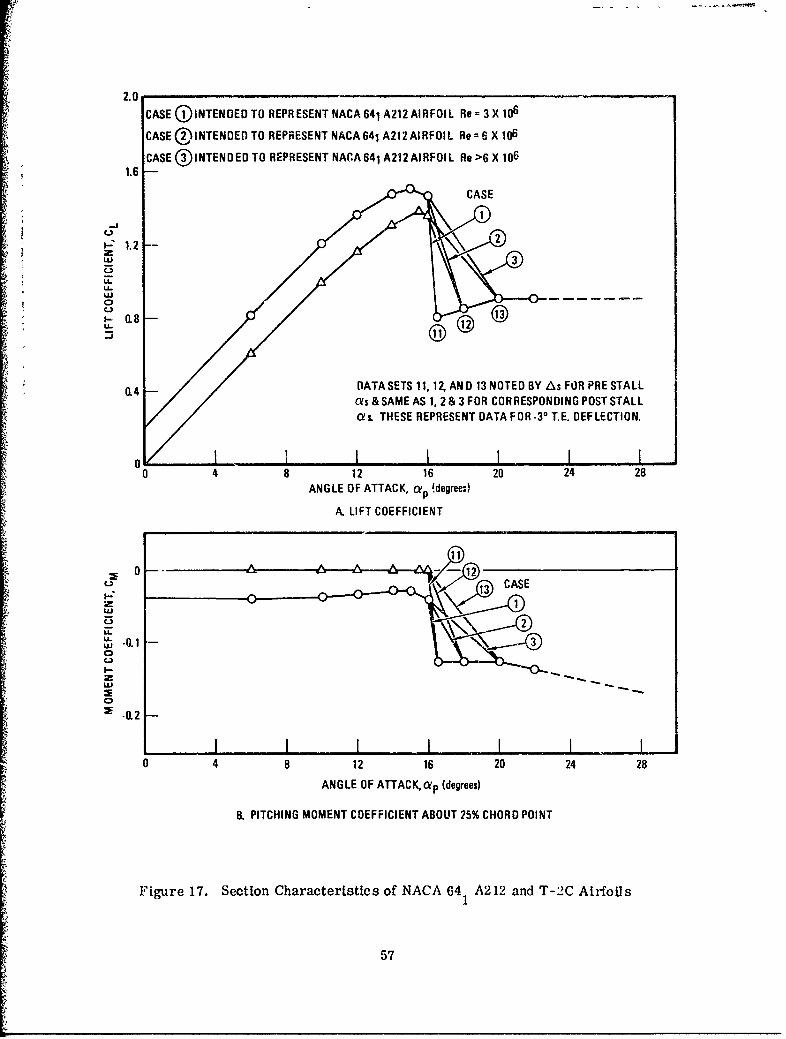
2.0CASE (DINTENDED TO REPRESENT NACA 641 A212 AIRFOIL Re = 3 X 1O6
CASE (JINTENOE[ TO REPRESENT NACA 641 A212 AIRFOIL Re= 6 X 06
CASE INTENDED TO REPRESENT NACA 641 A212 AIRFOIL Re >6 X 1061.6
.CASE
S1.2 -zLU3
L&.U-LU0
S0.8 @U-
0.4 - [IATASETS 11, 12 AND 13 NOTED BY As FOR PRE STALLas & SAME AS 1, 2 & 3 FOR CORRESPONDING POST STALLas. THESE REPRESENT DATA FOR -30 T.E. DEFLECTION.
0 •II I I0 4812 16 20 24 28
ANGLE OF ATTACK, a p 'degree:)
A LIFT COEFFICIENT
CCAS
u2
LUU .0.1 30
z4 U-
0.2
• .11.2.-
I I I I I I0 4 8 12 16 20 24 28
ANGLE OF ATTACK,ap (degrees)
B. PITCHING MOMENT COEFFICIENT ABOUT 25% CHORD POINT
Figure 17. Section Characteristics of NACA 64 A212 and T-2C Airfoils571
57
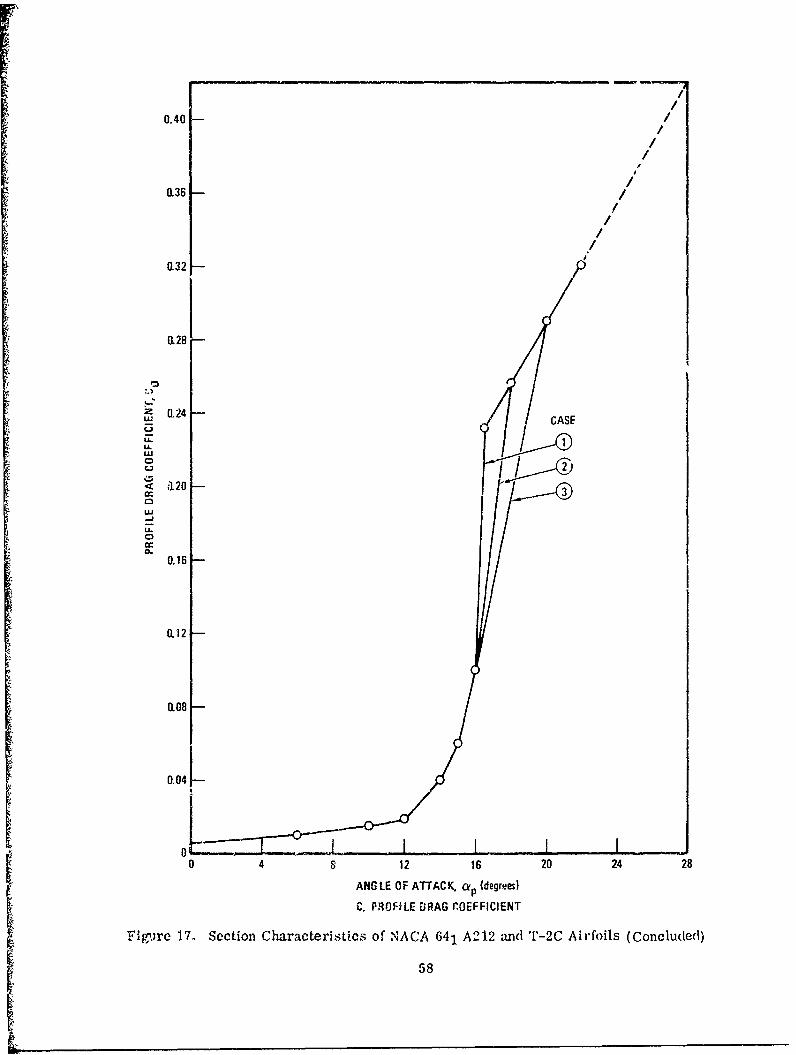
/
0.40/
0.36/
//
0.32 1
0.28
0.2428 CASE
U-LL.
0.10. 1
U-2
<10
0.16
0.12
0.08
0.04
=•I I I
0 4 8 12 16 20 24 28
ANGLE OF ATTACK. a p (degrees)
C. FPlFHLE DRAG N, OEFFICIENT
Figfjre 17. Section Characteristics of NACA 641 A212 n d T-2C Airfoils (Concluded)
58

1.6 f
Il
1"6
LL
L.4 CAS0L 4 REPRESENTS Re = 3 X 10' NACA 64-209CASE 5 REPRESENTS Re = 6 X 10⁶, NACA 64-209
CASES 3-8 REPRESENT LESS ABRUPT STALLS
4 8 12 16 20 24
ANG LE OF ATTACK, ap (degrees)
A. LIFT COEFFICIENT
CASE)0 7
-0.2
0 4 8 12 16 20 1 28
ANGLE OF ATTACK, a p (degrees)
B. PITCHING MOMENT COEFFICIENT ABOU T 25% CHORD POINT
-Figure 18. Noflinear Airfoil Section Characteristics Used for Parametric
Calculations
59
I'
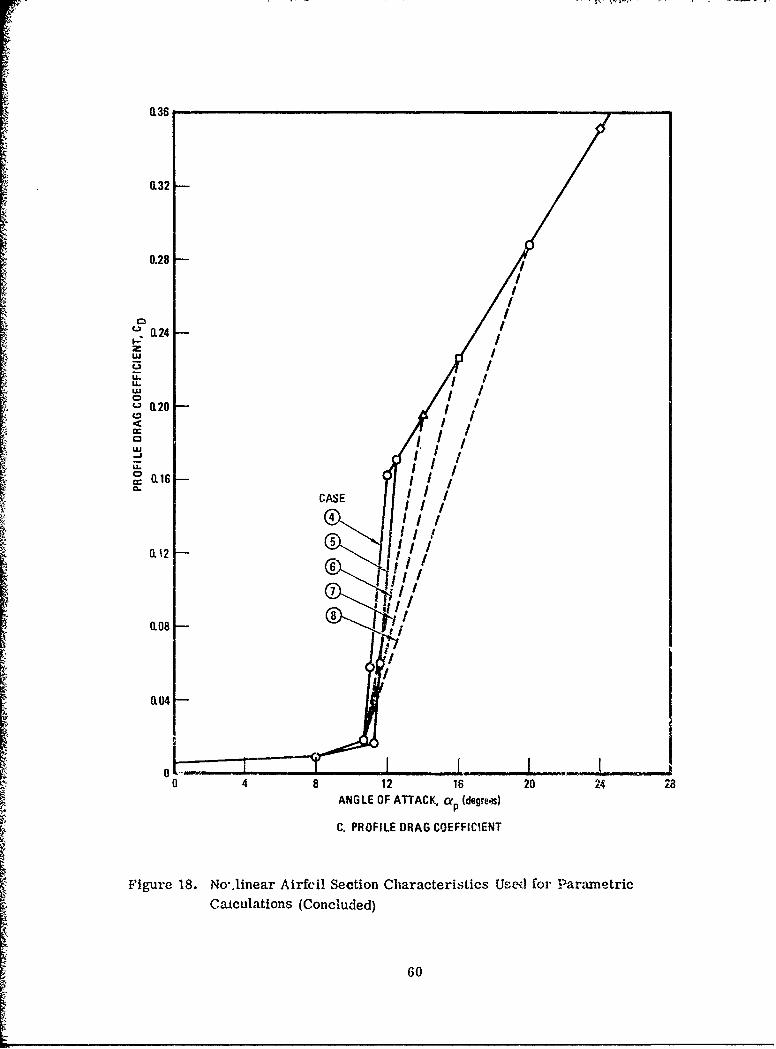
0,36
0.32
0.28
c, •0.24I--z
LU
uI
_.
CASEI
o'11
"Il/I
CASE ] I
• I,4
0L.12 I6 i
0.08 t
0.04
0 4 8 12 16 20 24 28
ANGLE OF ATTACK, ap (degrem)
C. PROFILE DRAG COEFFICIENT
Figure 18. No'jinear Airfoil Section Characteristics Used for Parametric
Calculations (Concluded)
60
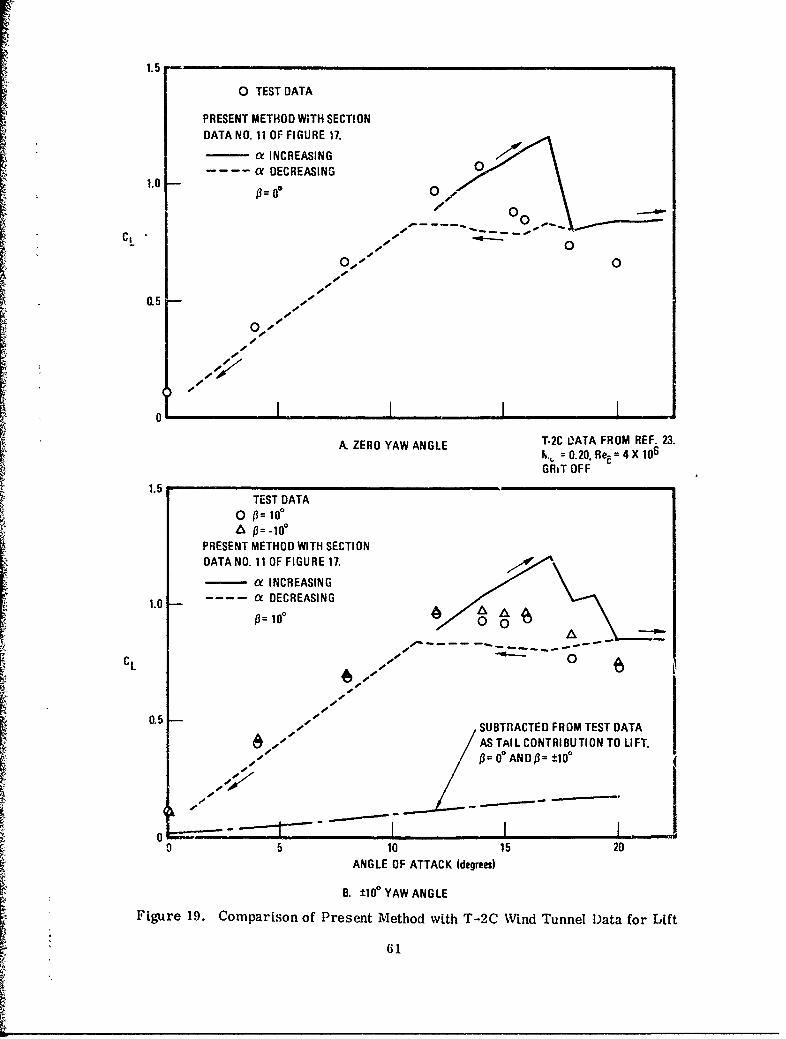
0 TEST DATA
PRESENT METHOD WITH SECTIONDATA NO. 11 OF FIGURE 17.
a INCREASINGa DECREASING 0
00
00,ee 0
01.:
A. ZERO YAW ANGLE T-2C L'ATA FROM REF. 23.N. =0.20. Re=4X 10⁶GRiT OFF
TEST DATA0 3100
A PRESENT METHOD WITH SECTIONDATA NO. 11 OF FIGURE 17.
a INCREASING
1.0 a DECREASING
0~~ - 1
8e ±100= ±10NG
Fiue19. Comparison of Present Method with T-2C Wind Tunnel Data for Lift
61
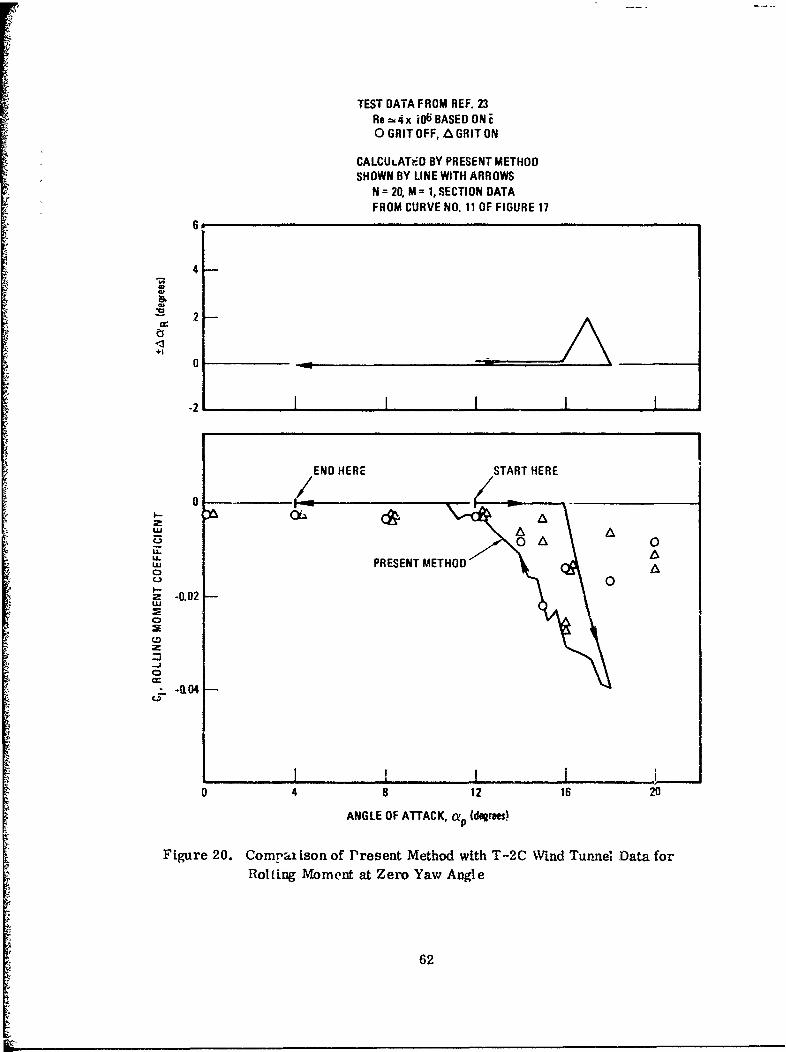
TEST DATA FROM REF. 23Re =-,,4x i06 BASED ON E0 GRIT OFF, A GRIT ON
CALCULATED BY PRESENT METHODSHOWN BY LINE WITH ARROWS
N = 20, M = 1, SECTION DATAFROM CURVE NO. 11 OF FIGURE 17
4
=,,
2
+10
-
-2 I I ! I I
END HERE START HERE
0
20
LL4.U,,, PRESENT METHOD
00,,-z -0.02 -
--J
L I , 10 4 8 12 16 20
ANGLE OF ATTACK, a p (d•rees)
Figure 20. Commai ison of Present Method with T-2C Wind Tumnel Data forRolting Moment at Zero Yaw Angle
62
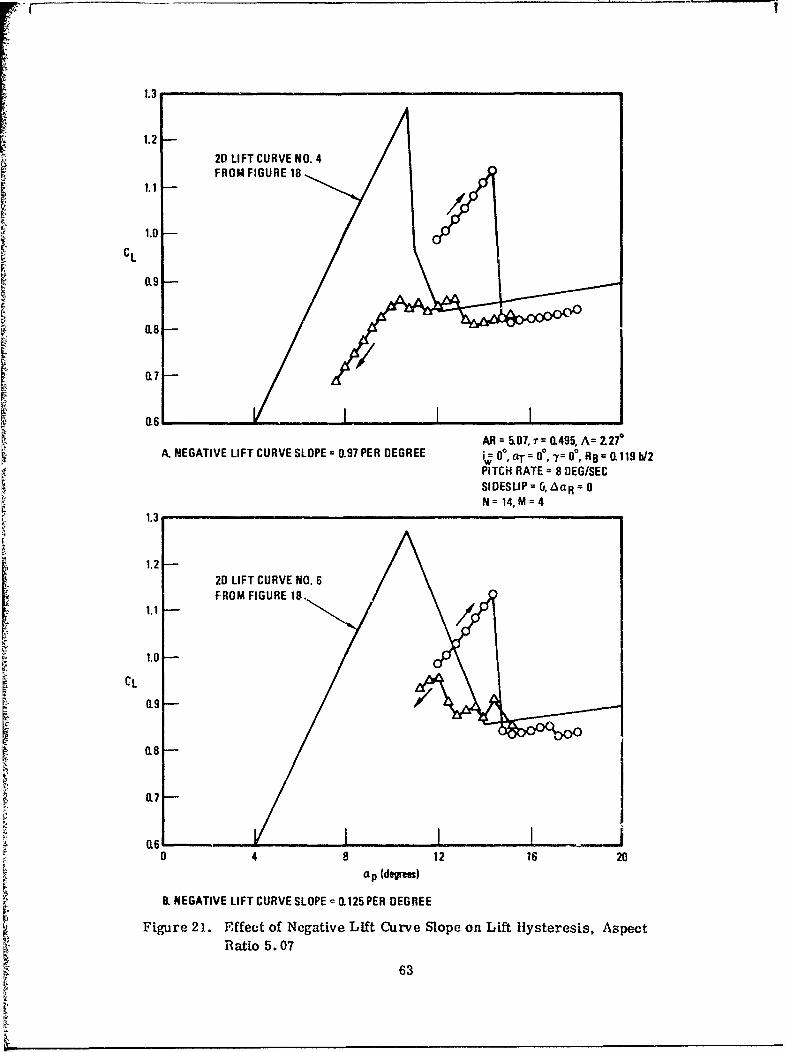
1.3
1.2
2D LIFT CURVE NO. 4FROM FIGURE 18
1.1 /I1.0
CL
O.9
118
117[
11.6AR =5,07, r 0.(495, A= Z270
A. NEGATIVE LIFT CURVE SLOPE 0(97 PER DEGREE i; 00, aT = 00, y= 00, RB= 0.11.9 b/2PITCH RATE = 8 DEG/SECSIDESLIP = 6, AaR =0N= 14, M=4
1.3
1.2 -
20 LIFT CURVE NO. 6FROM FIGURE 18.
1.1 -
CL11.9 -
0.8
0.7
0 4 8 12 16 20
ap (degrees)
B. NEGATIVE LIFT CURVE SLOPE =0.125 PER DEGREE
Figure 21. Effect of Negative Lift Curve Slope on Lift Hysteresis, Aspect
13atio 5.07
63
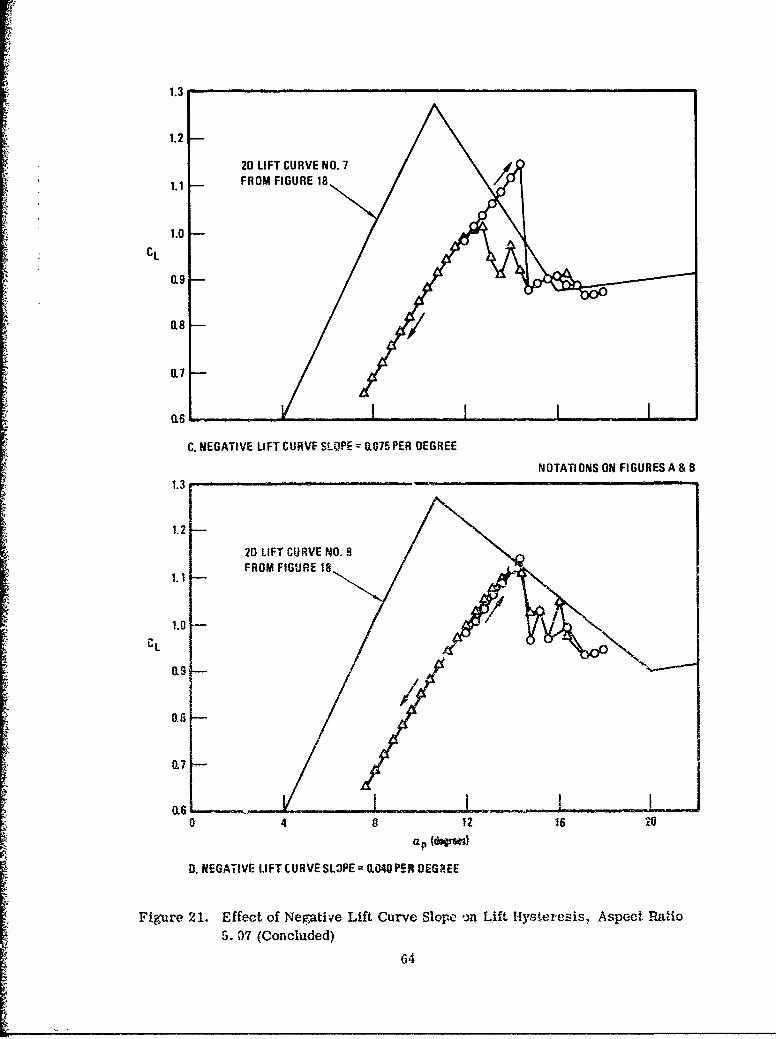
1.3
1.2
2D LIFT CURVE NO. 71.1 FROM FIGURE 18
S1.0
CL
0.9
0.8
0.7
0.6
C. NEGATIVE UFT CURVE SLOPE= 0.075 PER OEGREE
NOTATIONS ON FIGURES A & B
1.3
1.2
20 LIFT CURVE NO. 8FROM FIGURE 18
1.0,
CL 'Ci'8 / // / "
0.8
0.7 _ _ _ _ _ _ _ _ _ _ _ _ _ __ _ _ _ _ _ _ _ _ _
0.6 L__-__ _L_0 4 8 12 16 20
a, (6*m.)
0. NEGATIVE LIFT CURVE SLWPE = 0.040 PER DEGSEE
Figure 21. Effect of Negative Lift Curve Slope on Lift Hyst-eresis, Aspect Ratio
5. 07 (Concluded)
64
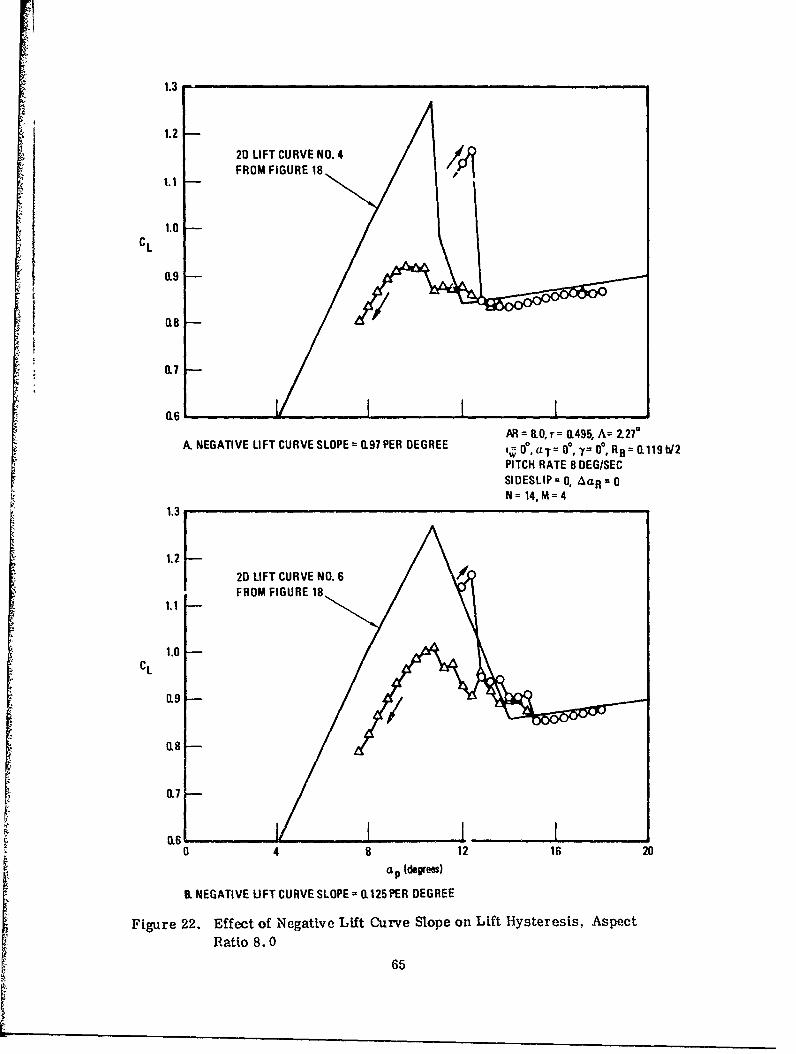
1.3
1.2
20 LIFT CURVE NO. 4FROM FIGURE 18
1.0 -CL 10-
S,
0.9-
0.7
(16AR =8.0, =0.495, A 2-270
A. NEGATIVE LIFT CURVE SLOPE= 0.97 PER DEGREE i 0., aT = 00, 7y D, RB= 0119 W2PITCH RATE 8 DEG/SECSIDESLIP= 0, AaR= 0
N= 14, M= 4
1.3
1.220 LIFT CURVE NO. 6FROM FIGURE 18
1.1
1.0CL
0.9
0.8
1.7
0.60 4 8 12 16 20
ap (drees)
&. NEGATIVE LIFT CURVE SLOPE= 0.125 PER DEGREE
Figure 22. Effect of Negative Lift Curve Slope on Lift Hysteresis, Aspect
Ratio 8.0
65

1.3
1.2
2D LIFT CURVE NO. 7
1.1 - FROM FIGURE 18
S~1.0 -
CLA 0.9 -
Q18
0.7
0.6,
C. NEGATIVE LIFT CURVE SLOPE = 0.075 PER DEGREE
NOTATIONS ON FIGURES A & B
1.3
1.2
2D LIFT CURVE NO. 81.1 FROM FIGURE 18
CL
0.9
0.8
0.7(16 - t
0.6I I0 4 8 12 16 20 24
ap (degrees)
0. NEGATIVE LIFT CURVE SLOPE = 0.040 PER DEGREE
Figure 22. Effect of Negative Lift Curve Slope on Lift Hysteresis, Aspect Ratio 8. 0
(Concluded)66
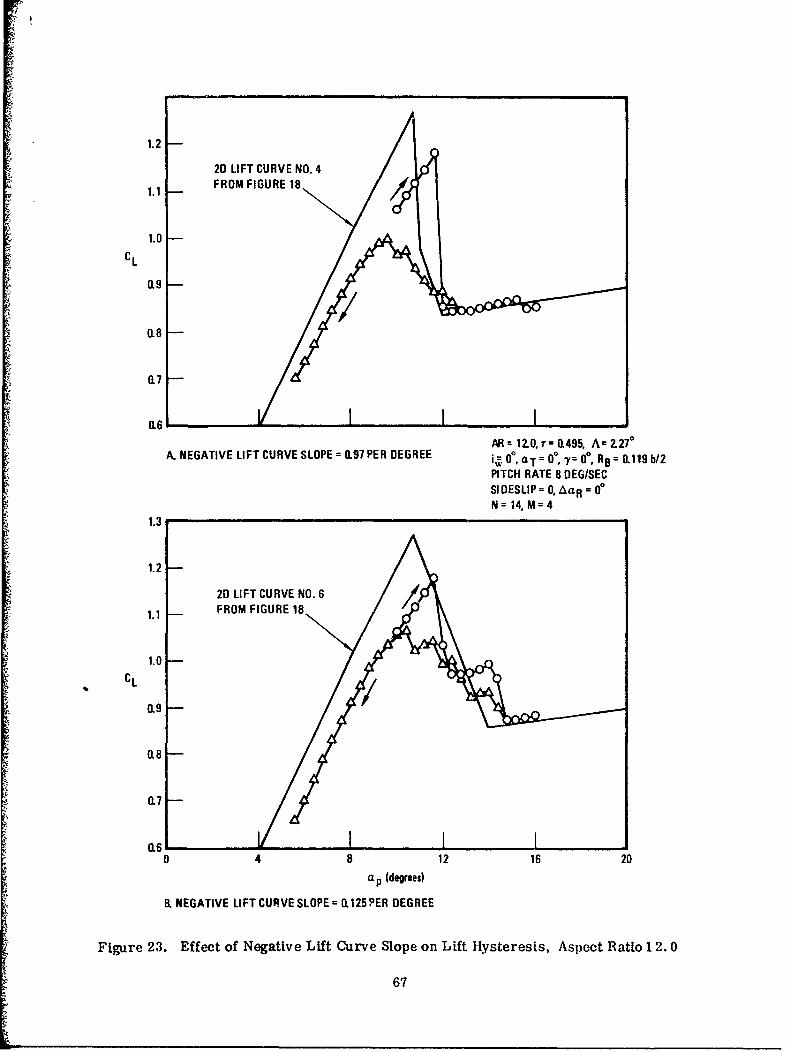
1.2
2D LIFT CURVE NO. 4
1.1 FROM FIGURE 18 /
1.0
CL
0.8
117-
0.6
AR= 12.0,1"=O.495, A=2270
A. NEGATIVE LIFT CURVE SLOPE 0L97 PER DEGREE R 0 °,aT 0r = 0, RBA= 0.119b2
PITCH RATE 8 DEG/SECSIDESLIP = O, AaR= 00N= 14, M=4
1.3
1.2-
20 LIFT CURVE NO. 6
1.1 FROM FIGURE 18
1.0-
CL0.9 -- • "
119 -
0.8
0.7
0.6 I0 4 8 12 16 20
a P (degrees)
B. NEGATIVE LIFT CURVE SLOPE= 0.125 PER DEGREE
Figure 23. Effect of Negative Lift Curve Slope on Lift Hysteresis, Aspect Ratio 1 2. 0
67
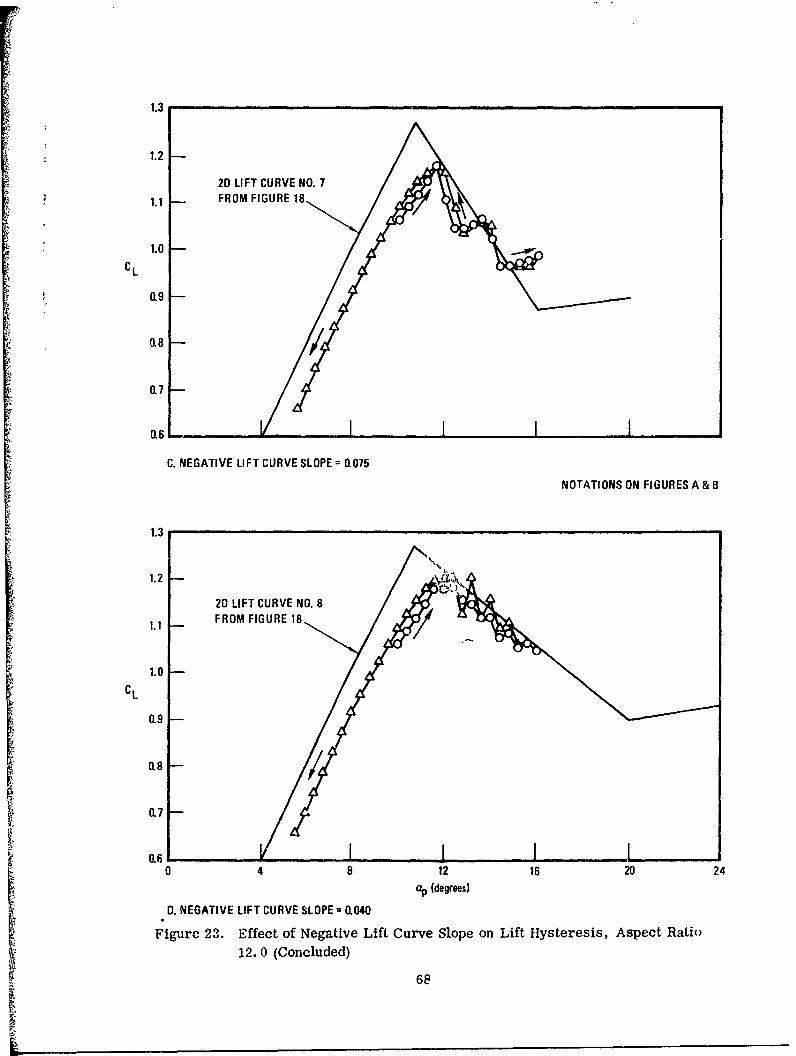
1.3
1.2
2D LIFT CURVE NO. 71.1 • FROM FIGURE 18
1.0
CL
0.9
R8
0.7
0.6~
C. NEGATIVE LIFT CURVE SLOPE= 0.075
NOTATIONS ON FIGURES A & B
1.3
1.2
2D LIFT CURVE NO. 8
1.1 FROM FIGURE 18/
1.0
CL
0.9
0.8/
0.7
0.60 4 8 12 16 20 24
ap, (degrees)
*0. NEGATIVE LIFT CURVE SLOPE =040
Figurc 23. Effect of Negative Lift Curve Slope on Lift Hysteresis, Aspect Ratio
12. 0 (Concluded)
68
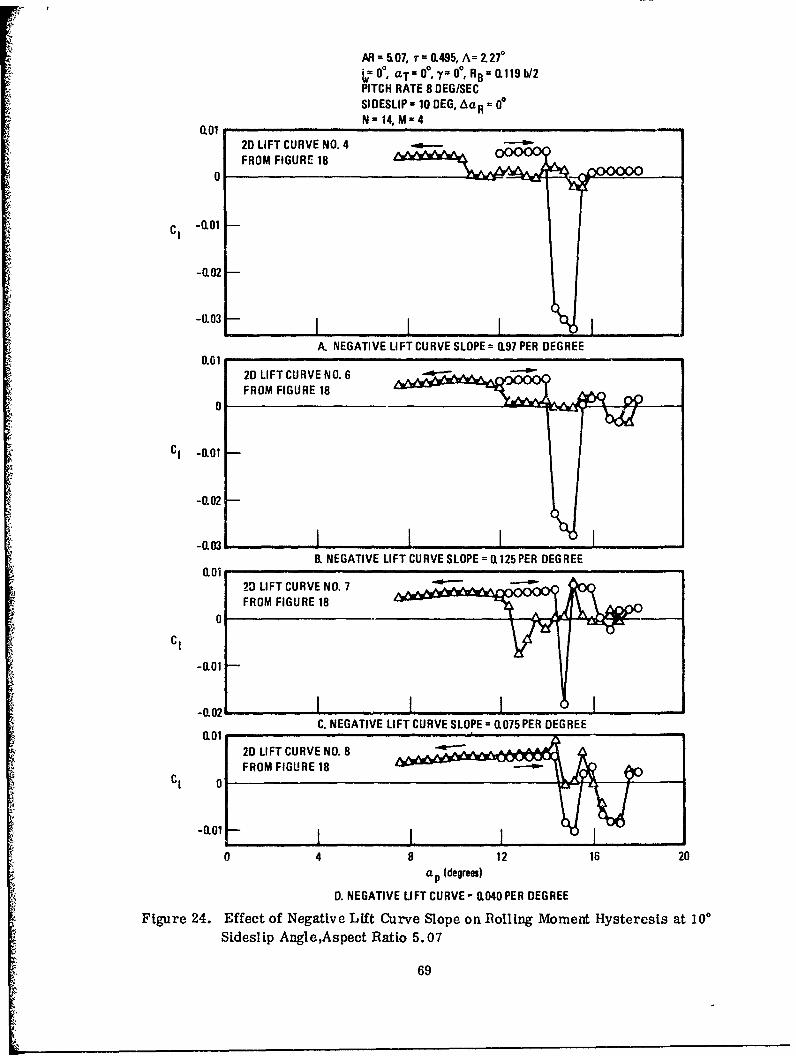
R = 507, r= 0.485, A= 2270
V If, aT= e, If 00, RB = 0.119 b/2PITCH RATE 8 DEG/SEC
SIDESLIP- 10 DEG, AaR= 0N=- 14, M- 4
0.0120 LIFT CURVE NO. 4FROM FIGURE 18
0
-0.01 -
-0.03
A. NEGATIVE LIFT CURVE SLOPE 0.97 PER DEGREE0.01
20 LIFT CURVE NO. 6FROM FIGURE 18
0
CI -Rol01
-0.02
-0.0: I IB. NEGATIVE LI FT CURVE SLOPE- 0.125 PER DEG REE
0.01 20 LIFT CURVE NO. 7FROM FIGURE 18
0
CI
-0.01
-0.02,! I IC. NEGATIVE LIFT CURVE SLOPE= 0.075PER DEGREE
0.01
20 LIFT CURVE NO. 8FROM FIGURE 18
CI 0
-0.01 1 I
0 4 8 12 16 20
a (degrees)
D. NEGATIVE LIFT CURVE - 0.040 PER DEGREE
Figure 24. Effect of Negative Lift Curve Slope on Bolling Moment Hysteresis at 100
Sideslip Angle,Aspect Ratio 5.07
69
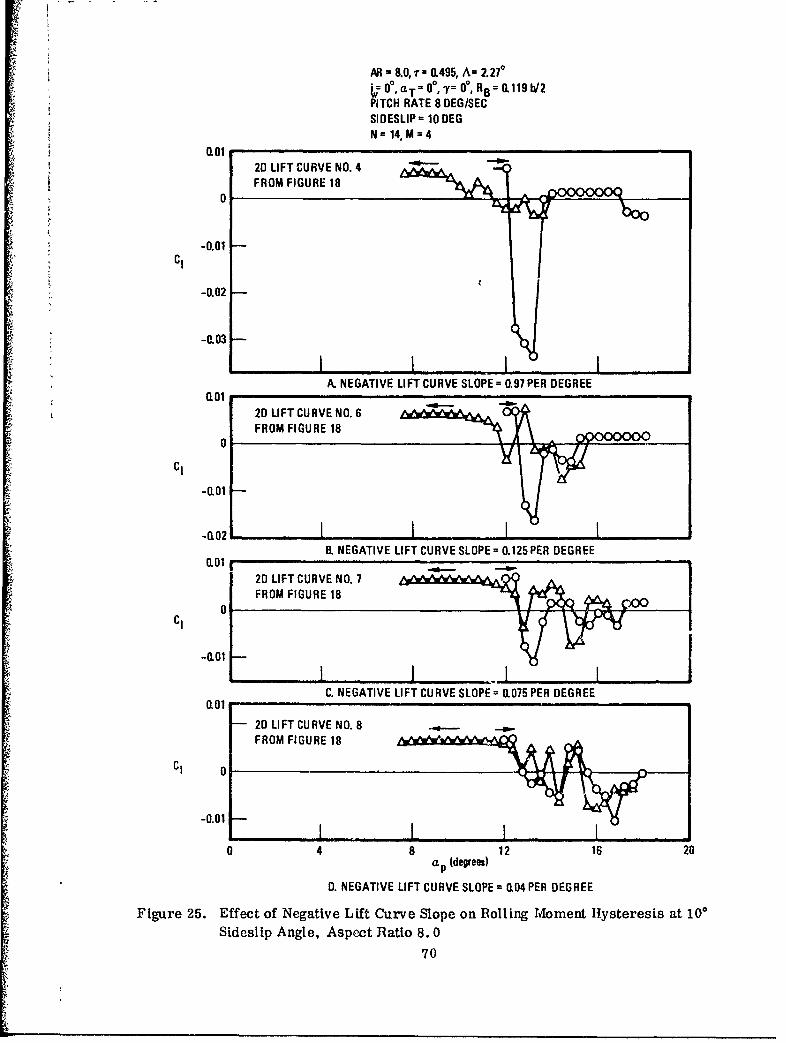
AR = 8.0, "r = 0.495, A- 2.27000•,aT=0 0 ,7= 0V, RB= 1.119b/2
PITCH RATE 8 DEG/SECSIDESLIP = 10 DEGN= 14, M = 4
S~0.0120 LIFT CURVE NO. 4
0
-0.01CI
-0.02
"-0.03
L IA. NEGATIVE LIFT CURVE SLOPE= 0.97 PER DEGREE
0.01S20 LIFT CURVE NO. 6 6
0 FROM FIGURE 18
CI
-0.01
-0,02 I ,B. NEGATIVE LIFT CURVE SLOPE= 0.125 PER DEGREE
-0.011•,
0.01
20 LIFT CURVE NO. 7• ,
0• FROM FIGURE 18
CI
-0.01
I ,
C. NEGATIVE LIFT CURVE SLOPE = 0.75 PER DEGREE
Sd 2s LIFT CURVE NO. 8Ratio_8. 0FROM FIGURE 18 , j
C 0,
• -0.01
"•4 8 12 16 20a Pa (degrees)
' D0. NEGATIVE LIFT CURVE SLOPE = R.04 PER DEGREE
S~Figure 25. Effect of Negative Lift Curve Slope on Bolling Moment Htysteresis at 100-• Sideslip Angle, Aspect Ratio 8. 0
• 70
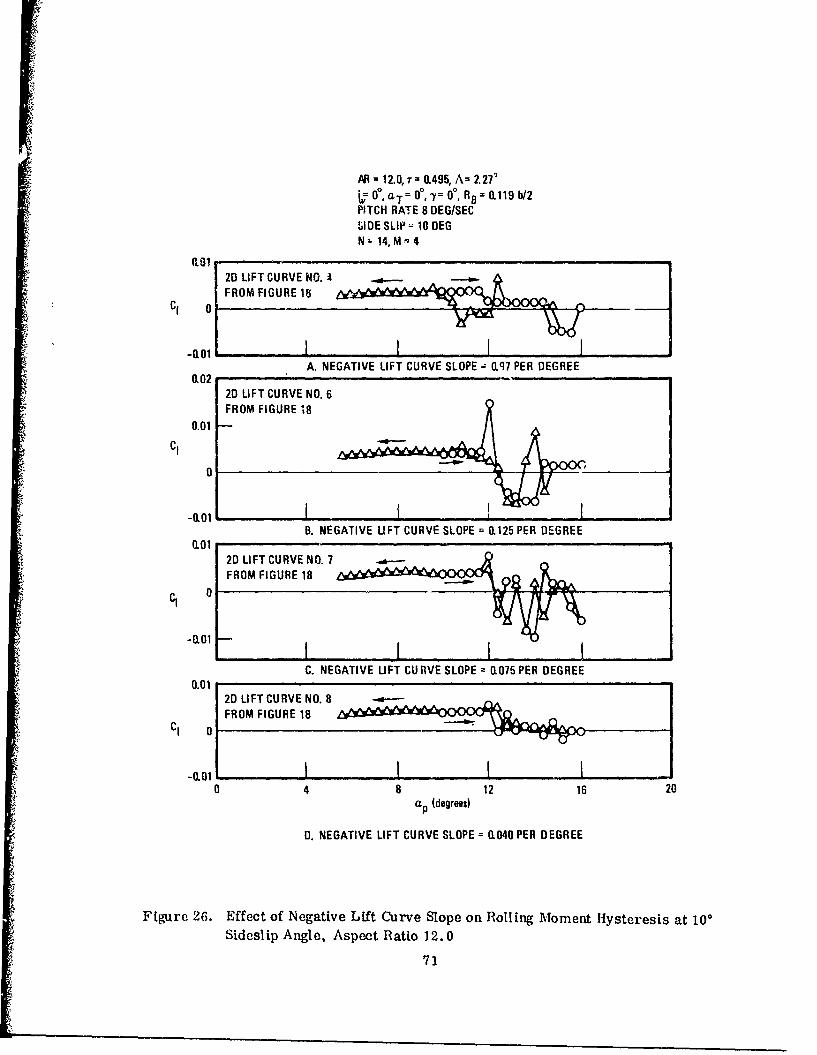
AR = 12.0,7 = 0.495, A= 2.27"OV 0,aT= 0°, = 00, RB= 0.119 b/2
PITCH RATE 8 DEG/SEC51DE SLIP= 10 DEG
N. 14, M - 4
Rai,20 LIFT CURVE NO. A
CI 0 FROM FIGURE 18 r%
• CI 0
4001
A. NEGATIVE LIFT CURVE SLOPE - 0q7 PER DEGREE0.02
2D LIFT CURVE NO. 6FROM FIGURE 18
0.01
CI
-0.01 1
B. NEGATIVE LIFT CURVE SLOPE = 0.125 PER DEGREE0.01
2D LIFT CURVE NO. 7CI, 0FROM FIGURE 18CI
Q1 0-0.01
C. NEGATIVE LIFT CURVE SLOPE (0075 PER DEGREE0.01
"2D LIFT CURVE NO. 8FROM FIGURE 18
CI
0 4 8 12 16 20ap (degrees)
D. NEGATIVE LIFT CURVE SLOPE = 0(040 PER DEGREE
Figure 26. Effect of Negative Lift Curve Slope on Rolling Moment Hysteresis at 100
Sidcslip Angle, Aspect Ratio 12.0
71

AR = 8&0, A= Z27"i-= 0OaT= 0, Y= 00, F!B= 0.11, b/2ITCH RATE 8 DEG/SEL b= 0.91 ?'ER DEG
SIDE SLIP =0I, N= 14, M =
1.1
1.0
CL 15
0.7 I__jA. TAPER RATIO 0.20
1.2 -
z ~1.1/
1.0--CI
0.9
0.8 1-L I I IB. TAPER RATIO 0.495
1.1
1.0-
0.8
S~~0.7 -'0 4 8 12 16 20a p (degrees)
S~C. TAPER RATIO 1.0
Figure 27. Effect of Taper Ratio on LIfU Hysteresis, Aspect Ryatio 8. , Lift Curve
#4 from Figure 1S
72
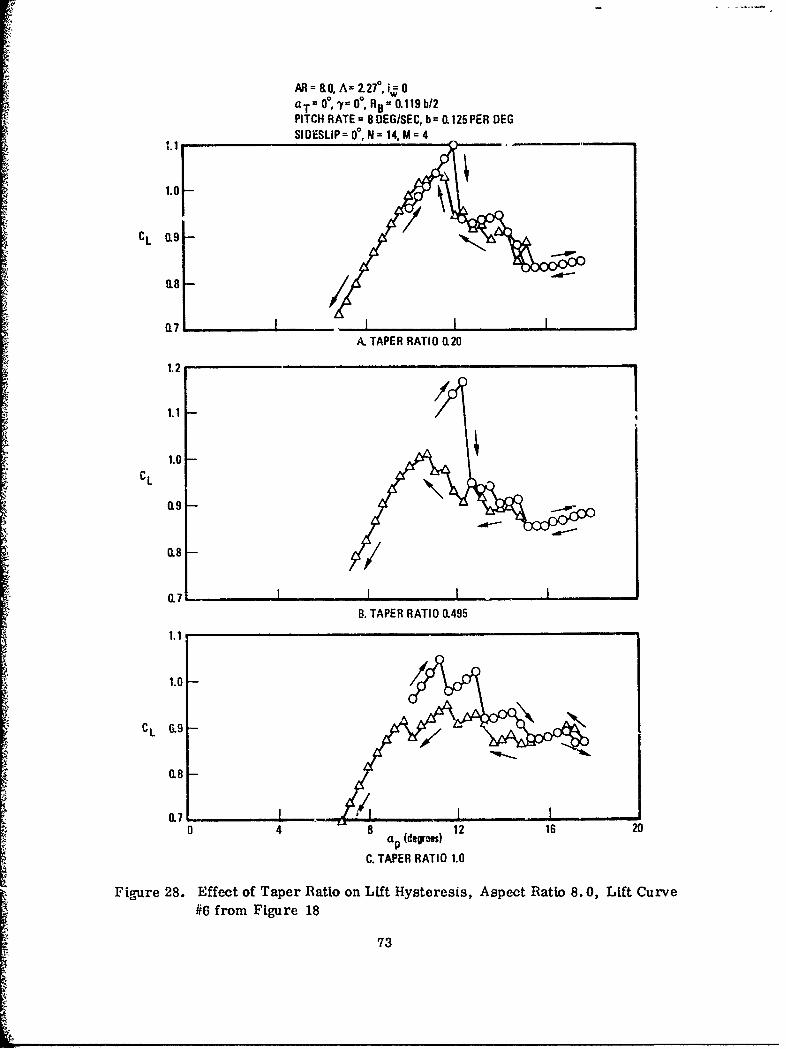
AR = 8.0, A= Z270, i= 0
a.T= 0, "f= 00, RB 0.119 b/2PITCH RATE= 8 DEG/SEC, b= 0.125 PER DEGSIDESLIP= 0, N= 14, M =4
'1.0
CL 0.9
(L8 /0.7 I I
A. TAPER RATIO 0.20
1.2
1.1
1.0CL
0.9
0.8
0.7B. TAPER RATIO 0.495
1.1
4 1.0
S~~~CL 9j
• 0.8
10.70 4 8 (dtm) 12 16 20
C. TAPER RATIO 1.0
Figure 28. Effect of Taper Ratio on Lift Hysteresis, Aspect Ratio 8.0, Lift Curve
#6 from Figure 18
73
L,
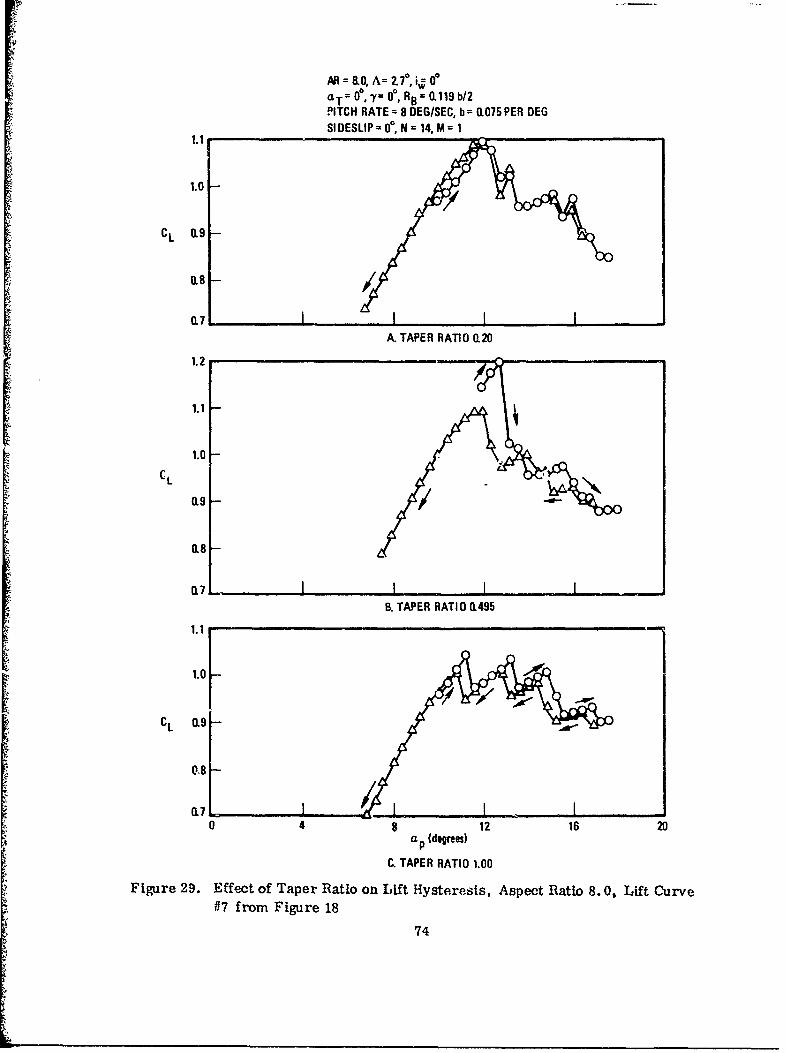
AR = .0, A= 2.70, iaT--,= 0o, R8 ' 0.119 b12PITCH RATE = 8 DEG/SEC, b = 0.075 PER BEGSIDESLIP= 0I, N = 14, M = I
"1.1
1.0 /1
CL 0.9 -
0.8 --
0.7.I IA. TAPER RATIO 0.20
1.2
AL 1.1
1.0CL
0.8
0.7 I I II
B. TAPER RATIO 0.495
1.1 11.0t
CL .9-
0.8-
0.7 •L._._____._•___.._____0 4 8 12 16 20
a p (degrees)
C. TAPER RATIO 1.00
Figure 29. Effect of Taper Ratio on Lift Hysteresis, Aspect Ratio 8.0, Lift Curve
#7 from Figure 18
74
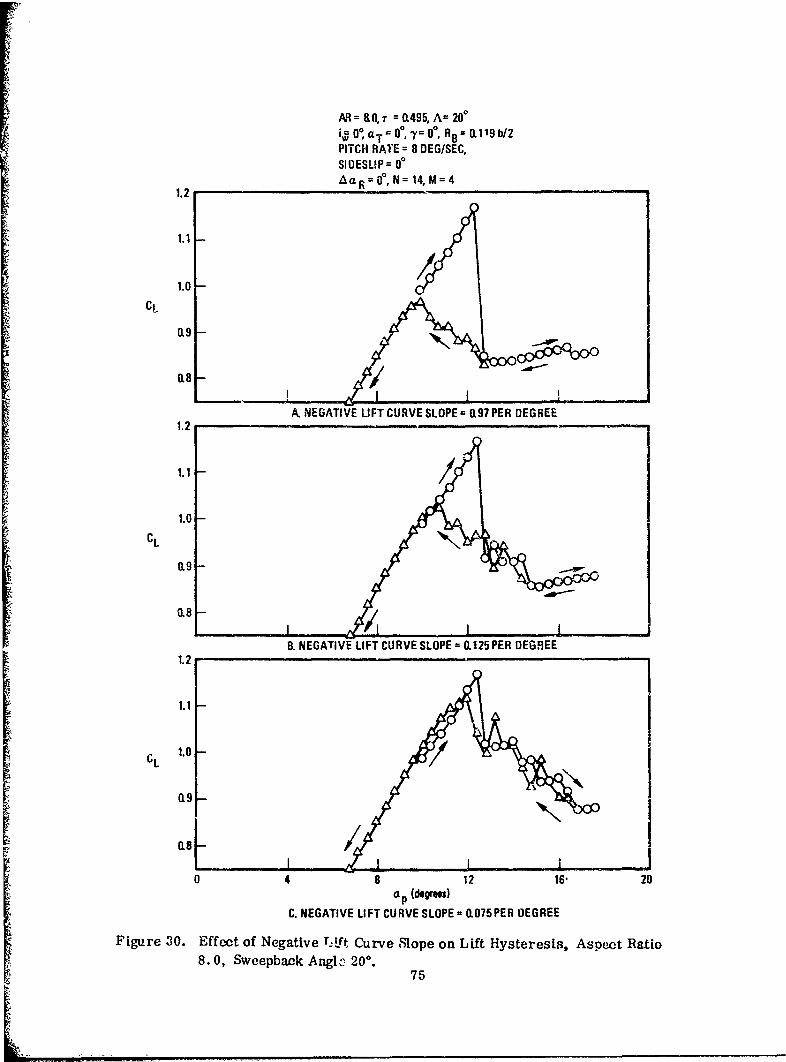
AR =0, = 0.495, A= 200i= 0*, aT-= 00, = 00, RB R01I9b/2PITCH RATE = 8 DEG/SEC,SIDESLIP= 00
1.2 AaR o, N= 14, M= 4
1.1
1.0
CL
0,9
0,8
I I IM, NEGATIVE LIFT CURVE SLOPE = 0(97 PER DEGREE
1.2
1.1
1.0
CL
0.9
0.8 -
B. NEGATIVE LIFT CURVE SLOPE= 0.125 PER DEGREE1.2
1.1
CL 1.0 /
0,8-
Fu4 8 12 165 20C Np (deOrPe0)C. NEGATIVE LIFT CURVE SLOPE = OL075 PER DEGREE
Figure 30. Effect of Negative r~ft, Curve ,Slope on Lift Hysteresis, Aspect Ratio
8. 0, Swcepback Angle) 20°.75
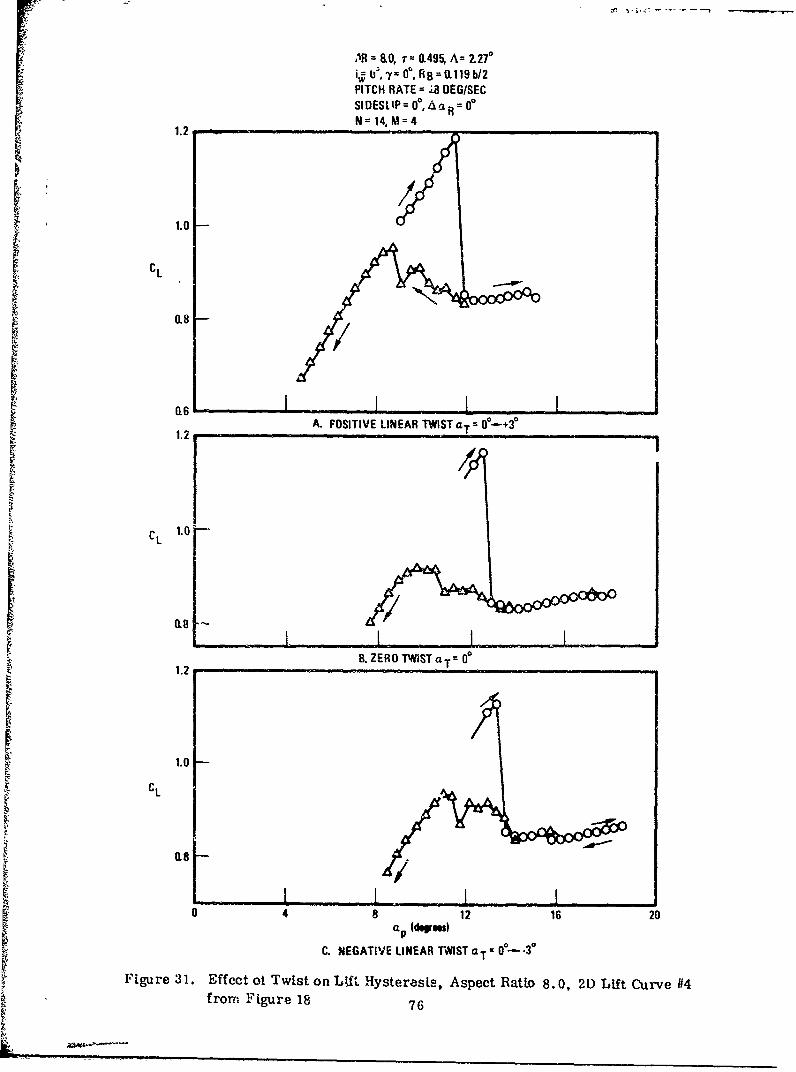
MR 110, T 0.495, A= 2.270,• f &,y= 0 , RB = 0.119 b/2
PITCH RATE -= J DEG/SECSIDESLIP 0 ,iAa R 00
1.2 - -- N - 14, M =4
1.2
CL n-i
1.0 A. I
0.6A. FOSITIVE LINEAR TWIST aT 0--+3e
1.2 /
C L
0.8/
1. ZERO TWISTaT= 0°1.2 .. - . .. .
1.0
CL
0 4 8 12 16 20ap (dOwen)
C. NEGATIVE LINEAR TIST aT= e0---3
Figure 31. Effect ot Twist on LfW. Hysteresis, Aspect Ratio 8.0, 2D Lift Curve #4from Figure 18 76

AR = 8. 0, r = 0 495, A= 2.270 SIDESLIP= 00, AaR =0
i= 0I, 7= 0I, RB = 0.119b/2 N= 14,M=4PITCH RATE = ±8 DEG/SEC
1.2
1.0
CL
0.6
1.2 A. POSITIVE LINEAR TWIST aT = 00-.+30
1.0CL
-: ~ 0.8 -
1.21 . ZERO TWIST a ,T= 0
1.0-
CL
I 0.8 -
8 4 12 16 20a p (degn, )
C. NEGATIVE LINEAR TWIST aT f0 -3O
Figure 32. Effect of Twist on Lift Hysteresis, Aspect Ratio 8.0, 2D Lift Curve #6from Figure 18;'
77
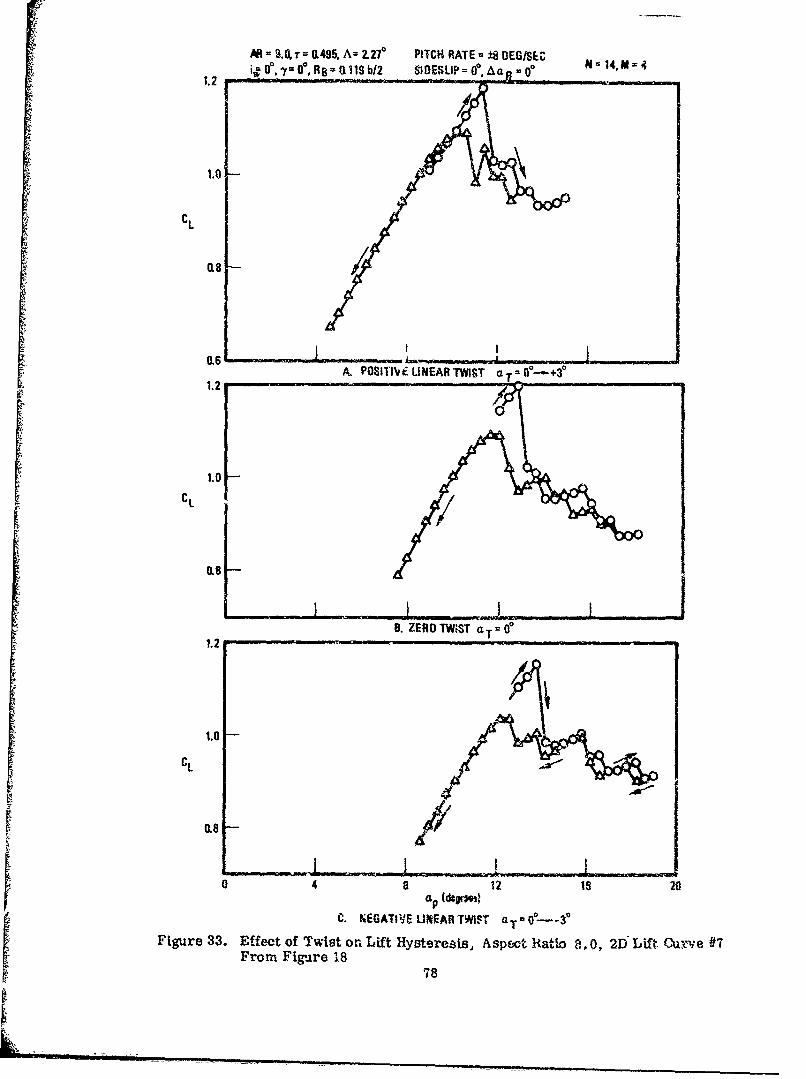
IAl -= 3.%7= 0Q495, A -2.270 PITCH RATE - DEG/SN =Ci ,do. =0 ,RBQ. 11Sb/2 SIDESLIPO 0 Aa =0o NA14,M4
• ~1.2,
i ~1.0;-
t CL
A- POSITIVE UNEAR TWIST aT= 00-+3I 1.2
- 1.0
CL
B. ZERO TWtST aT e
1.2
1.d0
S0.8 --
pa (dcgr.i 2 8 1S~~~C. rKEGATIqE LUNtARTWiST a.ZT-•-,,-30 '
I-wI Figure 33. Effect of Twiat oni Lift Hystereis1s Aspect Ratio 8,0, 2D)Lift Curve 07
SFrom Figure 18S~78
z
?C
\,i
F . . . . . . | 1°

AR = 5.01, -r m 0.495, A= 2.270 SIDESLIP = 00 SOLI OSYMBOLS WITH"i= 00, aT= OG,/= e, RB= 1119b/2 - - R= 0 (OPEN SYMBOLS) AaR= ±1- ON ..R WINGPITCH RATE = t8 OEG/SEC N= 14, M 4 PANELS AT ap 14.40
CL
20 LIFT CURVE NO. 4FROM FIGURE 18
A. NEGATIVE LIFT CURVE SLOPE 11097 PER DEGREE
2D LIFT CURVE NO. 6FROM FIGURE 18
1.0
CL
0.3
. B. NEGATIVE LIFT CURVE SLOPE= 0.125 PER DEGREE
20 LIFT CURVE NO. 7
FROM FIGURE 18 -
1.0-
CL
0.8-
S. .NEGATIVE LIFT CURVE SLOPE . 05 PER DEGREE
20 LIFT CURVE NO. 8
~ ~ ~~F O FI d R a18l '• ) 1 1 61
D. NEGATIVE LIFT CURVE SLOPE - 0.040 PER DEGREE
Figure 34, Effect of Roll Perturbation at a -14.4 Degrees or. Lift Hysteresis,
Aspect Ratio 5. 07S~79
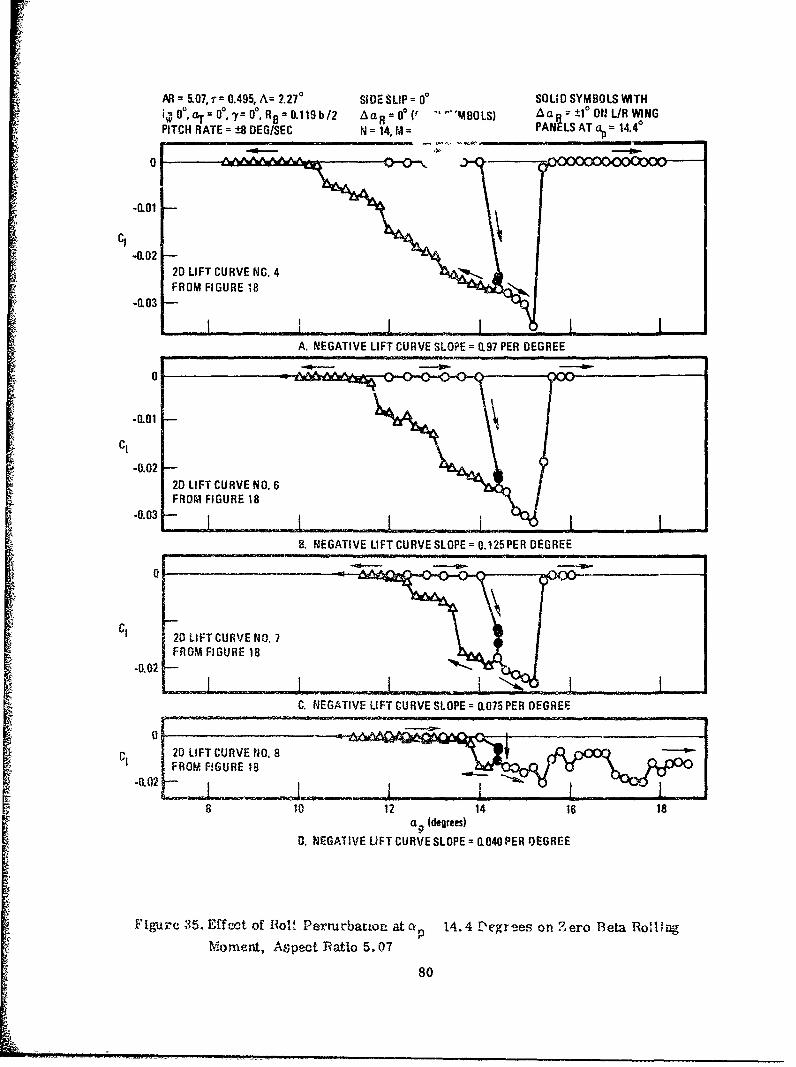
AR = 5.07, " 0.495, A= 2.270 SiDE SLIP = 00 SOLID SYMBOLS WITHi= 0, aT = 0I, '= 00, RB = 0.119 b/2 AaR= 0e( "MBOLS) Aa(" -1OL/RWINGPITCH RATE = ±8 DEG/SEC N = 14, = PAN4LS AT p= 14.40
0
ci-0.01-0.02
2D LIFT CURVE NC. 4FROM FIGURE 18
-0.03
A. NEGATIVE LIFT CURVE SLOPE = .197 PER DEGREE
o0 ------
-0.01
CI
.0.0220 LIFT CURVE NO. 6
003FROM FIGURE 18
B. NEGATIVE LIFT CURVE SLOPE = 0.125 PER DEGREE
0 -_ _ _ _GI 20 LIFT CURVE NO. 7
.0.02 _ l _ ..C. NEGATIVE LIFT CURVE SLOPE = 0.0W5 PER DEGREE
C 20 LIFT CURVE NO. 8I FROM FIGURE 18
-0.02
8 10 12 14 16 18a 1 (degrees)
0. NEGATIVE LIFT CURVE SLOPE =0.040 PER OEGREE
Figure 35. Eff wt of RolU Pertu rbatton at ap 14.4 .'egrses on Zero leta Ro'llng
V Moment, Aspect Ratio 5.07
80
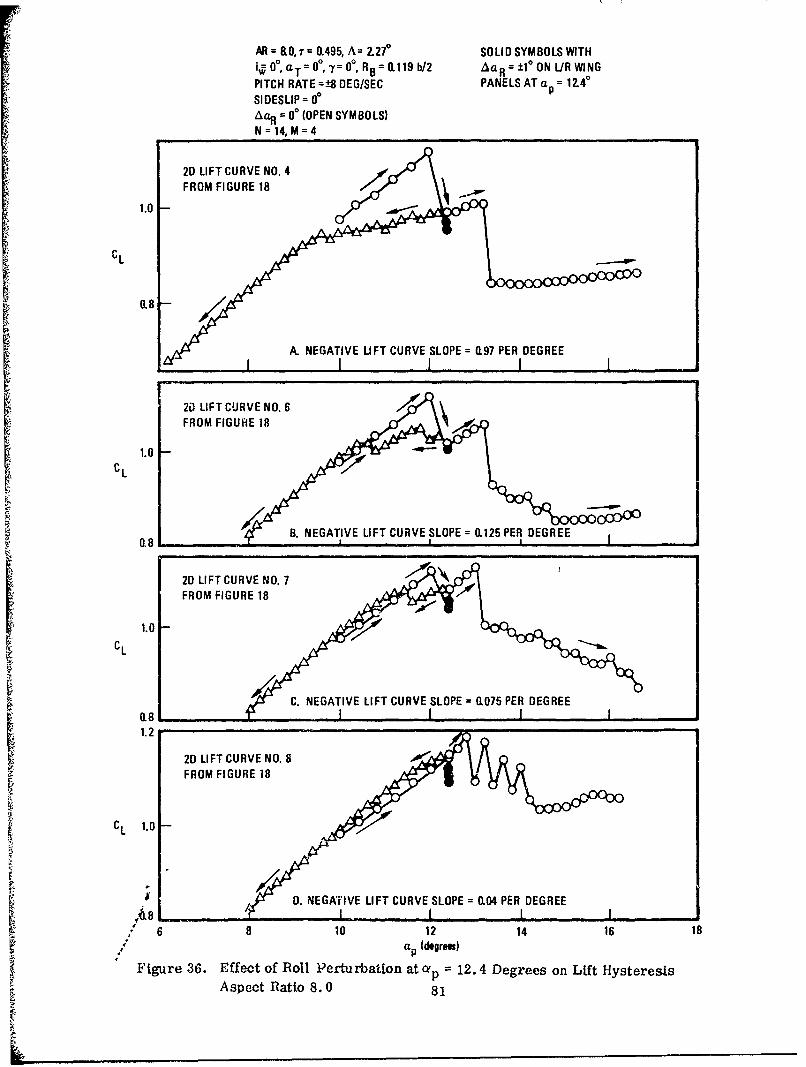
AR &O,=8 0.495, A= Z270 SOLID SYMBOLS WITHi= 00, a R- 110.119 b/2 AaR =+1 ON L/R WINGPITCH RATE =±8 DEG/SEC PANELS ATa = 1240
SIDESLIP = 0IAaR = 0* (OPEN SYMBOLS)N=14, M=4
2D LIFT CURVE NO. 4FROM FIGURE 18
1.0
CL
A. NEGATIVE UFT CURVE SLOPE = 0.97 PER DEGREEII I ,, 1
2D LIFT CURVE NO. 6v FROM FIGURE 18
CL1.0
0. NEGATIVE LIFT CURVE SLOPE = 0.125 PER DEGREE
20 LIFT CURVE NO. 7FROM FIGURE 18
CL /
C. NEGATIVE LIFT CURVE SLOPE = 0.075 PER DEGREE
08 10 12 14 161
1.2
20 LIFT CURVE NO. 8FROM FIGU RE 18
C L 1.0
0. NEGAiFIVE LIFT CURVE SLOPE =0.04 PER DEGREE
f 6f 1 12 14 16 18ap (d, reg )
Figure 36. Effect of Roll Perturbation at a p = 12.4 Degrees on Lift Hysteresis
Aspect Ratio 8.0 81
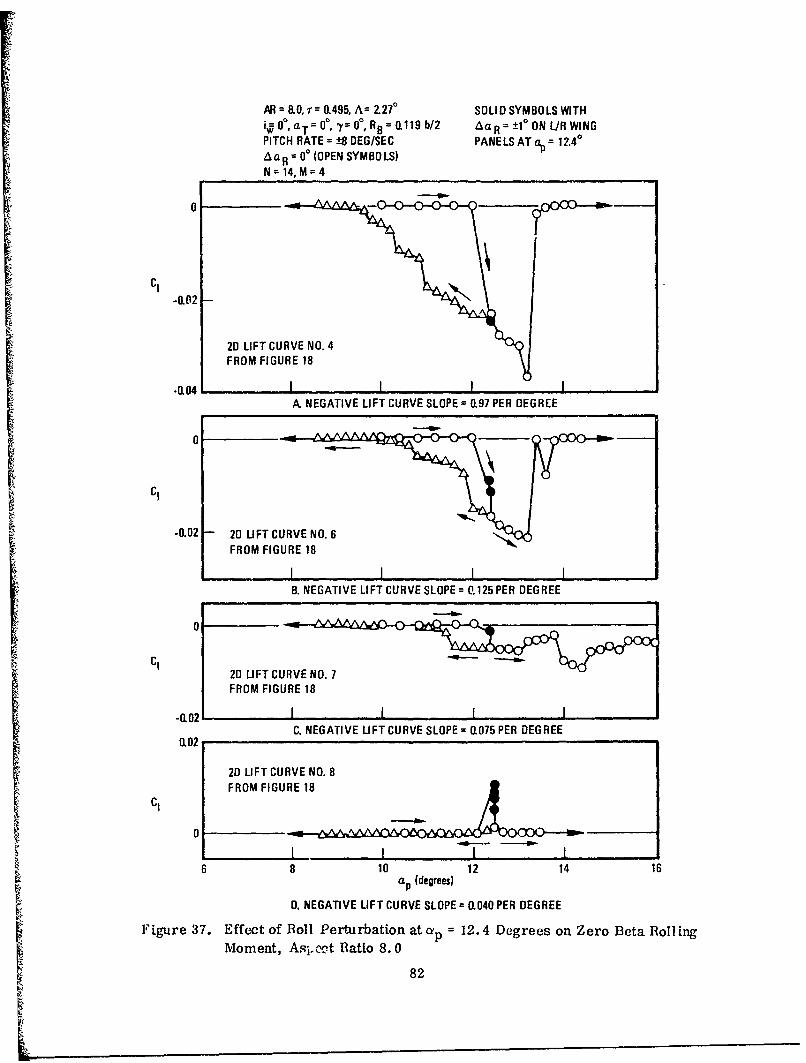
AR = &80,-= 0.495, A= Z270 SOLID SYMBOLS WITH
i= 60,aT= 0I, y= f0 , RB= 0.119 b/2 AaR = ±10 ON L/R WINGPITCH RATE= ±8 DEG/SEC PANELS AT ap= 12,40
AaR = 00 (OPEN SYMBOLS)N 14, M=4
-0.02
2D LIFT CURVE NO.4
FROM FIGURE 18A. NEGATIVE LIFT CURVE SLOPE =0.97 PER DEGREE
F0C1
-0.02 - 20 LIFT CURVE NO. 6FROM FIGURE 18
SI IB. NEGATIVE LIFT CURVE SLOPE= 0.125 PER DEGREE
01 -000-CI
2D LIFT CURVE NO. 7FROM FIGURE 18
-0.02 I I I I
C. NEGATIVE LIFTCURVE SLOPE= 0.075 PER DEGREE
2D LIFT CURVE NO. 8FROM FIGURE 18
CI
0 I I I
6 8 10 12 14 16ap (degrees)
0. NEGATIVE LIFT CURVE SLOPE = 0.040 PER DEGREE
Figure 37. Effect of Roll Perturbation at cyp = 12.4 Degrees on Zero Beta Rolling
Moment, Asio.et Ratio 8.0
82
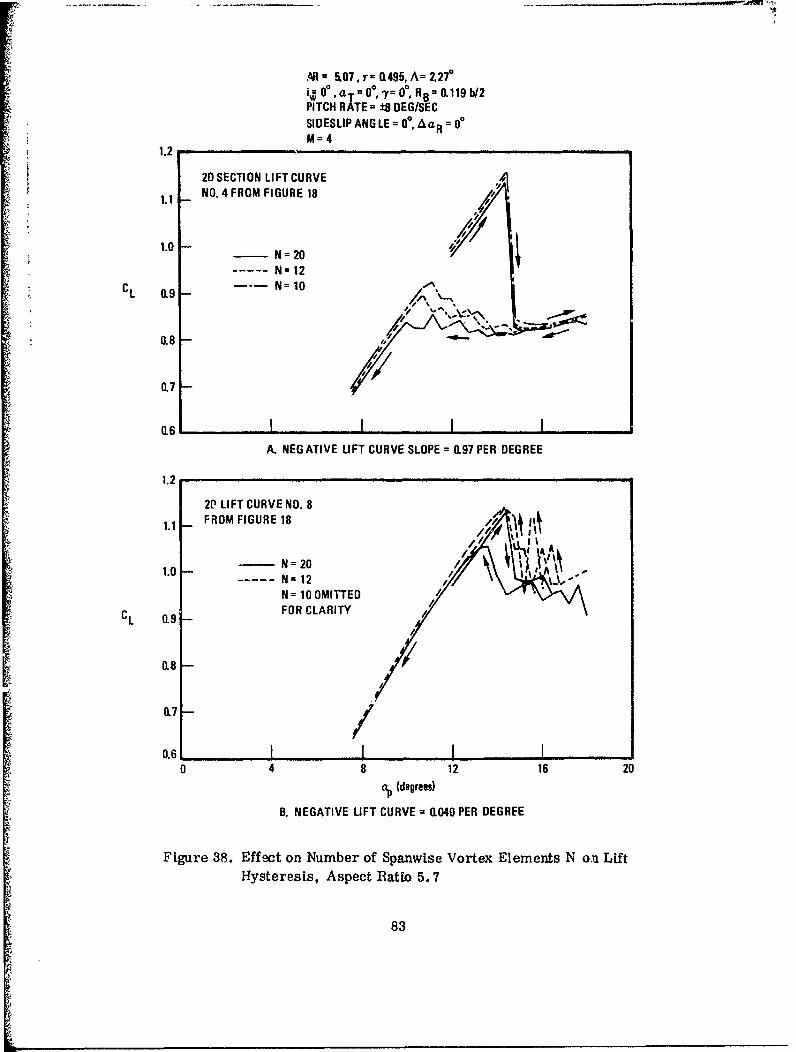
AR = 5,07, r= 0.495, A= 2.270= 00 a = 0 ,7= 0, R0.119 b/2
PITCH RATE ='±8 DEG/SECSIDESLIP ANG LE= 0I, AaR 0
M=41.2
1.1 2D SECTION LIFT CURVE INO. 4 FROM FIGURE 18
1.0 - N=20
N=12
CL 0.9 N= 10
0.8 -
0.7-
0.6 I I IA. NEGATIVE LIFT CURVE SLOPE = 0.97 PER DEGREE
1.2
2P LIFT CURVE NO. 8
1.1 FROM FIGURE 18
1.0 N = 201.0- ..... N= 12 A
CL 0.9 FOR CLARITY
0.8
0.7-
0.6 I0 4 8 12 16 20
p (degrees)
B. NEGATIVE UFT CURVE = (1040 PER DEGREE
Figure 38. Effect on Number of Spanwise Vortex Elements N o.w LiftHysteresis, Aspect Ratio 5.7
83
L,
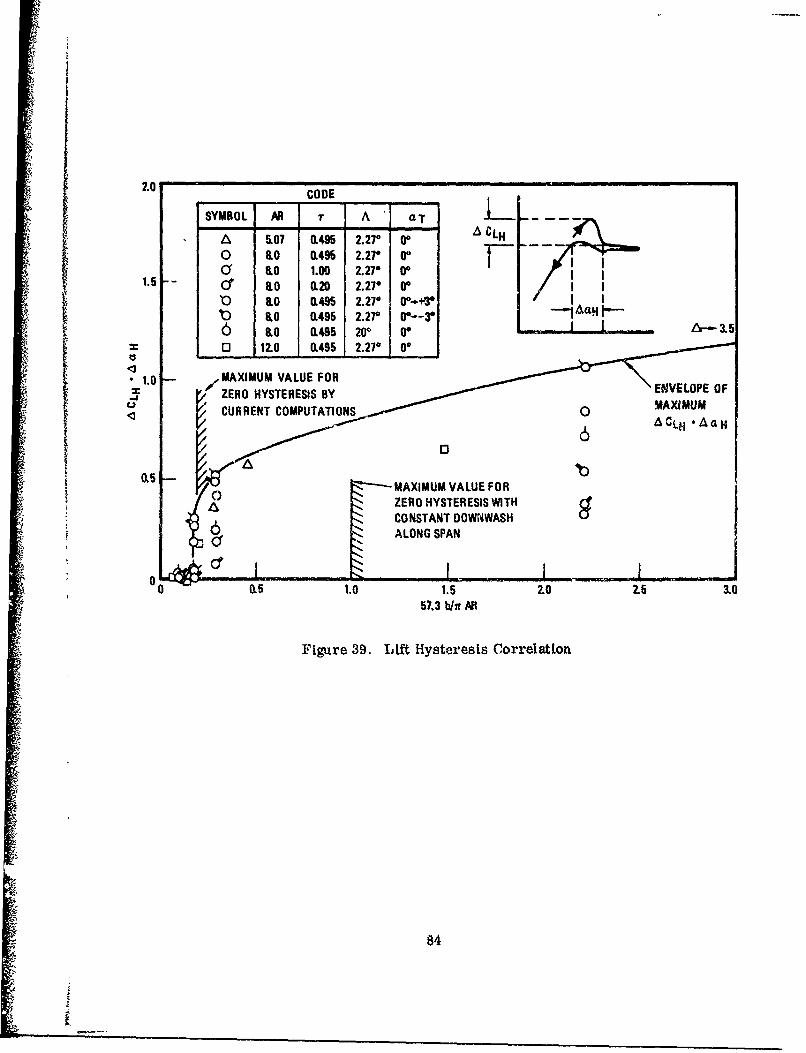
2.0 CODE
SYMBOL AR ir A ,T L.A 5.07 0L495 2.271 00 ACLH
0 8.0 0.495 2.270 00aO 8.0 1.00 2.270 00
1.5 r 8.0 0.20 2.270 00"0 8.0 0L495 2.270 00-+30t0 8.0 0.495 2.27r 00--3 A -
6 B.0 0.495 200 0: t .- ' 3.5
"0 12.0 0.495 2.270 00
1.0 MAXIMUM VALUE FORiv' EN4VELOPE OF"ZERO HYSTERESIS BY
CURRENT COMPUTATIONS 0 MAXIMUM<] 6 ACLH "AaH
0
2- MAXIMUM VALUE FOR0' ZERO HYSTERESIS WITH
6 'ALONG SPAN
000.5 1.0 1.5 . 2.5 3.0
57.3 bdff AR
Figure 39. Lift Hysteresis Correlation
84


![Linear Hensel Lifting for Z x;y] and Z ] with Cubic Costmmonagan/papers/issac19.pdf · Linear Hensel Lifting for Z p[x;y] and Z[x] with Cubic Cost Michael Monagan Department of Mathematics,](https://img.pdfslide.us/doc/110x75/604a1cf06e151e3a262feecd/linear-hensel-lifting-for-z-xy-and-z-with-cubic-mmonaganpapersissac19pdf.jpg)