Embed Size (px)
Citation preview
CLINICAL SCIENCES
DIAGNOSTIC NUCLEAR MEDICINE
Noninvasive Measurement of Cardiopulmonary Blood Volume. Evaluation of the
Centroid Method
Fetnat M. Fouad, William J. Maclntyre, and Robert C. Tarazi
Cleveland Clinic Foundation, Cleveland, Ohio
Cardiopulmonary blood volume (CPV) and mean pulmonary transit time (MTT)determined by radionuclide measurements (Tc-99m HSA) were compared withvalues obtained from simultaneous dye-dilution (DD) studies (indocyanine green).The mean transit time was obtained from radionuclide curves by two methods: the"peak-to-peak" time and the interval between the two centroids determined from
the right and left-ventricular time-concentration curves. Correlation of dye-dilutionMTT and "peak-to-peak" time was significant (r = 0.79, p < 0.001), but its correlation with centroid-derived values was better (r = 0.86, p < 0.001). CPV values
(using the centroid method for radionuclide technique) correlated significantlywith values derived from dye-dilution curves (r = 0.74, p < 0.001). Discrepanciesbetween the two were greater the more rapid the circulation (r = 0.61, p < 0.01),suggesting that minor inaccuracies of dye-dilution methods, due to positioning ordelay of the system, can become magnified in hyperkinetic conditions. The radionuclide method is simple, repeatable, and noninvasive, and it provides simultaneous evaluation of pulmonary and systemic hemodynamics. Further, calculationof the ratio of Cardiopulmonary to total blood volume can be used as an index ofoverall venous distensibility and relocation of intravascular blood volume.
J NucÃMed 22: 205-211, 1981
Systemic veins play an important role in the regulation of cardiovascular dynamics (I-10). Almost 80% ofthe circulating blood volume is contained in these capacitance vessels (4); its distribution between the centraland peripheral circulations depends to a large extent onalterations in venous tone (4,6), and in turn influencescardiac output (6). Various methods have been used toevaluate the degree of distensibility of the venous system.Indices of venous tone have been derived from plethys-mography (5,9,11) but, useful as such measures are, theyonly reflect changes in a particular circulation. Probablymore relevant to systemic hemodynamics would be anindex of net effects of venous tone on relocation of in-
Received June 23, 1980; revision accepted Oct. 31, 1980.For reprints contact: Fetnat M. Fouad, MD, Research Division,
Cleveland Clinic Foundation, 9500 Euclid Ave., Cleveland. OH44106.
travascular volume. To that end, the ratio of Cardiopulmonary to total blood volume (CPV/TBV) was usedinitially by Ulrych et al. (4) and subsequently by Taraziet al. (6) for studies of cardiac and peripheral factors inhypertension. However, the method proposed was invasive and required both arterial and venous catheter-ization.
In this paper, we describe a noninvasive (centroid)method to determine pulmonary blood volume usingradionuclides, and its validation by comparison with awell-recognized invasive dye-dilution technique. To ourknowledge, determination of pulmonary mean transittime and Cardiopulmonary blood volume by radiotracerswas presented on strong theoretical basis but no suchvalidation by direct comparison with more classicaltechniques has been performed in man. The recentlystressed importance of these indices for follow-up ofleft-ventricular function (12-15) indicates the need for
Volume 22, Number 3 205
by on May 18, 2020. For personal use only. jnm.snmjournals.org Downloaded from
FOUAD, MACINTYRE, AND TARAZI
re-evaluation of the accuracy and limitations of radio-nuclide methods.
MATERIALS AND METHODS
Patients. Twenty patientsagreed to participate in thisstudy. All were hypertensives with varying degrees ofblood-pressure control and formed part of the cohortfollowed in the Research Division of the ClevelandClinic. They were therefore familiar with research aimsand protocols. There were ten women and ten men, ages18 to 68 yr. The details of the study, the hazards of arterial puncture, and the radiation dose involved wereexplained, and a written informed consent was obtainedfrom all the patients.
Blood volume and indocyanine-green hemodynamicstudy. All studies were performed in the morning afteran overnight fast. Techniques used were described indetail in previous publications (6,16). After a period ofsupine rest for at least 30 min, catheters were introducedpercutaneously using the Seldinger technique and werepositioned under fluoroscopic control, the venous catheter in the right atrium, and the arterial catheter in theroot of the ascending aorta just above the plane of theaortic valve. Plasma volume was determined by intravenous injection of 2.5 /LtCiI-125 HSA using a 10-minequilibration time; blood volume was calculated fromthat volume and the simultaneously determined he-matocrit (6). Cardiac output was determined in triplicateusing indocyanine green (5 mg), introduced carefullyinto the right-atrial catheter and then flushed with 5 mlof saline by manual injection into the circulation in lessthan a half second. Arterial blood was withdrawnthrough a Gilford densitometer with a constant-ratepump at a speed set between 0.3 and 0.5 ml/sec. Curveswere inscribed on a fast-response recorder and blood wasreinfused immediately after each curve inscription,thereby ensuring no blood loss during investigation (4).A fourth dye-dilution curve was then obtained by thesame method simultaneously with the radionuclide-dilution study—the dye being injected into the rightatrium through the appropriate catheter while the ra-dionuclide was delivered as a rapid bolus through a peripheral vein in the other arm (16). Proper calibrationof the dye system was done at the end of each study usingknown dye concentrations at the same pump speed usedduring output determinations. Corrections for samplingdelay were delivered from direct measurements as previously described (17), using the same catheters andrecorder.
Radionuclidedilutioncurves.Instruments. A portablescintillation camera with a medium sensitivity, low-energy collimator was used for precordial recording ofthe radioactivity passage. The camera head was tiltedto a left oblique position, 30-45°parallel to the longitudinal body axis and 0-5°upward in the coronal plane,
to help visualization of the subclavian veins in order tomonitor adequacy of the bolus input (16). The cameraoutput was transferred to storage with individual framesbeing stored on magnetic tape. Recording, storing, andplaying-back functions were effected by an off-linecomputer.
Regions of interest of various size were defined in theareas of the superior vena cava (v), right (RV), and leftventricle (LV), delineated on the original computerprintout as previously described (16). The counts fromeach area were then played back diagrammatically astime-activity curves. The areas under the curves werecalculated by computer integration and least-squaresfitting of the trailing edge ( 18).
Radiotracer. Technetium-99m-labeled human serumalbumin (Tc-HSA), prepared by a unit-dose reagent kitwas used, with 0.7 mg HSA mixed with 5-20 mCi Tc-99m by manual shaking for 10 sec. The preparation wasthen ready for use after 20 min. The stability of the bondbetween the technetium and vector was previously foundto be satisfactory at the 10-min equilibration period andup to 30 min after mixing (16).
Procedure. For single output determination, 8 mCiTc-HSA were injected, but if two output determinationswere required in the same sitting, 4 mCi were used forthe first study and 8 mCi for the second. Before thesecond injection, a background frame of 60 secondsduration was obtained for background correction of thecounts from the previous study. Whole-body radiationdose was estimated at 0.018 rad/mCi (19), whichamounted to 0.22 rad for a 12-mCi total dose.
The radioactive bolus was introduced in a suitabletubing and then flushed manually into the circulationwith 20 ml normal saline in 3 sec (16). During the following 30 sec, 60 frames were collected for 0.5-sec periods and stored sequentially on magnetic tape. An additional 20 frames were then collected for 30 sec each(total of 10 min) and stored on tape for calculation offinal dilution. The figures pertaining to each period ofcount collection during the dilution curve were printedout by the computer, and the descending limb of thecurve was replotted semilogarithmically to complete thecomputation of its area.
Calculations. Calculation of cardiac output from either dye-dilution curves or the radionuclide method wasperformed by the classical Stewart-Hamilton formula(20):
F = IJo cdt
Modification of the formula to fit the calculations forradionuclide method was previously described (16):
TBV X FD¡ Jo cdt
where TBV = total blood volume (I HSA) (6) obtained
206 THE JOURNAL OF NUCLEAR MEDICINE
by on May 18, 2020. For personal use only. jnm.snmjournals.org Downloaded from
CLINICAL SCIENCESDIAGNOSTIC NUCLEAR MEDICINE
in the same sitting just before cardiac output determination; FD = final dilution (counts per minute at the endof 10-min equilibration phase); and Jöcdt = area underthe curve. Cardiac output was calculated separately forthe right and left ventricles (RVCO and LVCO, respectively); average of both values (RVCO + LVCO)/2was also used for comparison with dye-dilution cardiacoutput.
Cardiopulmonarybloodvolume.The cardiopulmonaryblood-volume (CPV) measurement is based on theStewart-Hamilton principle (21,22) that the volume ofa flowchannel is the product of the flowand mean transittime (MTT). Under the conditions of our radionuclidccalculations, therefore, the mean time of transit betweenthe right and left ventricles, multiplied by the rate offlow, gave the average blood volume in one-half of theright ventricle, all of the pulmonary circulation, andone-half of the left-heart chambers. The pulmonary"mean" transit time is used to allow inclusion of various
speeds of circulation in different areas of the lungs. Anyerror due to a difference in chronological phase shiftduring observation of the blood in the two halves of theheart was shown to be very small and practically inconsequential (23). Cardiopulmonary blood volume (CPV)was therefore calculated as follows:
cry - co x60
where CPV = cardiopulmonary blood volume (ml), CO= cardiac output (ml/min), MTTRv—LV= mean transittime from right ventricle to left ventricle (sec), and 60= 60 sec/min. MTT is obtained as follows: (a) For thedye-dilution technique, from the equation:
MTT = ZCn X Atn X tn
2Cn X X Atn
where MTT = mean transit time between right atriumand root of aorta, Cn = concentration of the indicator atthe nth 1-secinterval, Atn = time interval (conventionallytaken as 1 sec), tn = time from injection at which theindicator concentration Cn is recorded, in sec, and n =1,2,3,4
(b) For radionuclide studies, the pulmonary MTT wascalculated from dilution curves at the input and outputof conveniently chosen vascular sections in two ways:
(1) Peak-to-peak method: The interval between RVand LV curves represents the pulmonary mean transittime; this was calculated as the difference between thepeaks of the RV and LV dilution curves and calculatedin seconds, based on the time of data acquisition (24).
(2) Centroid method: Although the peak-to-peakmethod is simple, it has been the subject of many criticisms because of difficulties in determining onset andendpoints on the radiocardiogram (25). We thereforedecided to use the "centroid method" for determination
of this time. Again both RV and LV curves were neces
sary. In the past, these curves were plotted on stiff paper,cut out, and balanced on a knife edge to determine themoment or center of gravity relative to the time axis ofeach curve, this being the location of the mean time ofeach curve (23). Hamilton (20) suggested an approximate arithmetic integration; a more analytical mathematical model was later developed (23) to determine thecenter of gravity, or centroid, of each curve.
In the present calculation, the mean transit time between left and right ventricles was found by taking thedifference between the moments (ordinal centroids) ofthe dilution curves recorded from those regions. Theexpression for the ordinal position, t, of a ventricle, isgiven by the equation:
Jctdtt =Jcdt
where the expression J'cdt represents the dilution curve
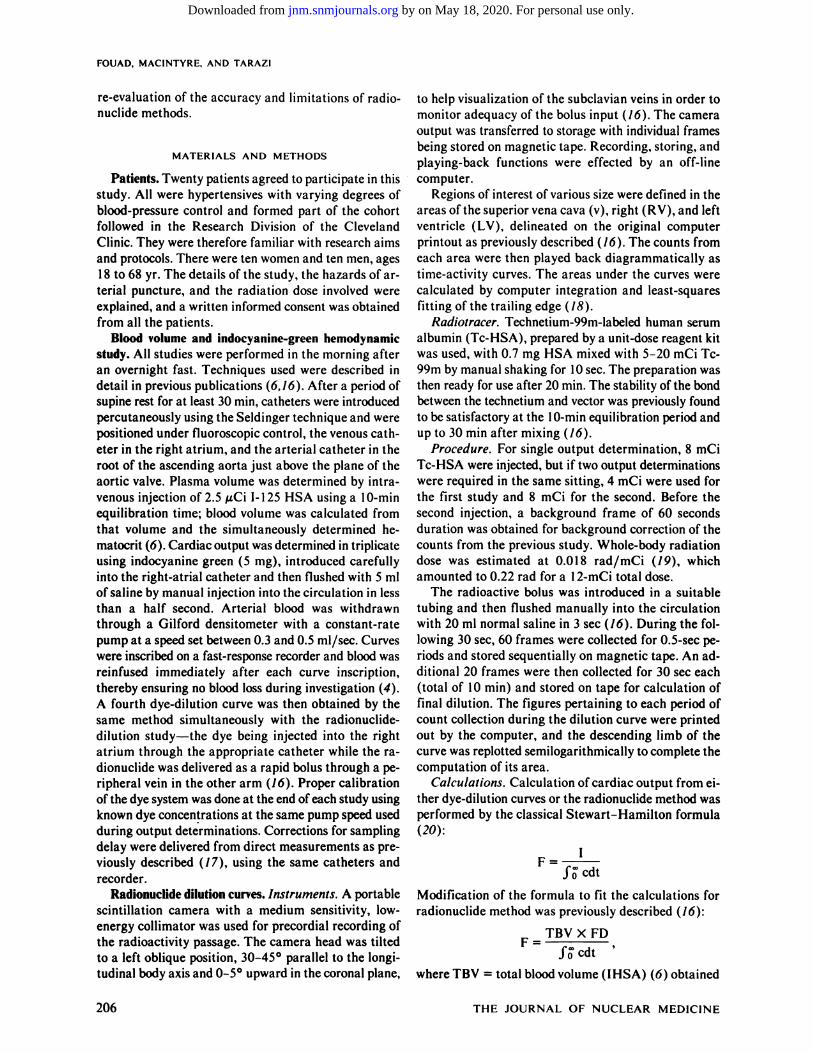
over a specific chamber. The dilution curves were recorded from specific areas of the right and left ventricles,with the trailing edge extrapolated by fitting the logarithm of the count rate by a least-squares linear fit, asshown in Fig. 1 (23). It is recognized that in the in vivomethod there is almost always contamination of thecount rate recorded from one primary chamber by contributions from other chambers. This contamination hasbeen temporarily corrected in the case of the right ventricle by extrapolation of the first exponential function(line 1, Fig. 1), which eliminated the contribution of thesubsequent chambers. Similarly, back-extrapolation ofthe ascending curve of the left ventricle (line 3, Fig. 1)can eliminate the contribution of the right ventricle tothe left-ventricle recording when needed, but this wasnot required in any of the patients involved.
In this context, note the difference between calculationof mean transit time from radionuclide-dilution curvesand its calculation from traditional dye-dilution methods.In the latter, the mean transit is calculated as the difference between the input (injection or zero time) andthe centroid of the output curve, that curve usually beingobtained from some points in the aorta (6). The volumecomputed from this mean transit time is therefore outlined by all temporally equidistant points within thattime frame. In contrast, the mean transit time derivedfrom radionuclide studies is calculated as the differencebetween the centroids of two curves (Fig. 1), in this casetime-activity curves derived from the right and leftventricles. This minimizes problems of input and sampling delays; the difference between the two curvesequals the mean transit time of blood from the rightheart through the lungs and into the left heart. To ourknowledge, the method has not yet been validated bydirect comparisons with classical dye-dilution techniques.
RESULTS
Cardiac output values determined by radionuclide
Volume 22, Number 3 207
by on May 18, 2020. For personal use only. jnm.snmjournals.org Downloaded from
FOUAD. MACINTYRE, AND TARA/I
7.0
65
60
o:ujQ.
V)
50
45
40
3.5
•AREA Io AREA 2
IO 20 30 40FRAME NO
50 60 70
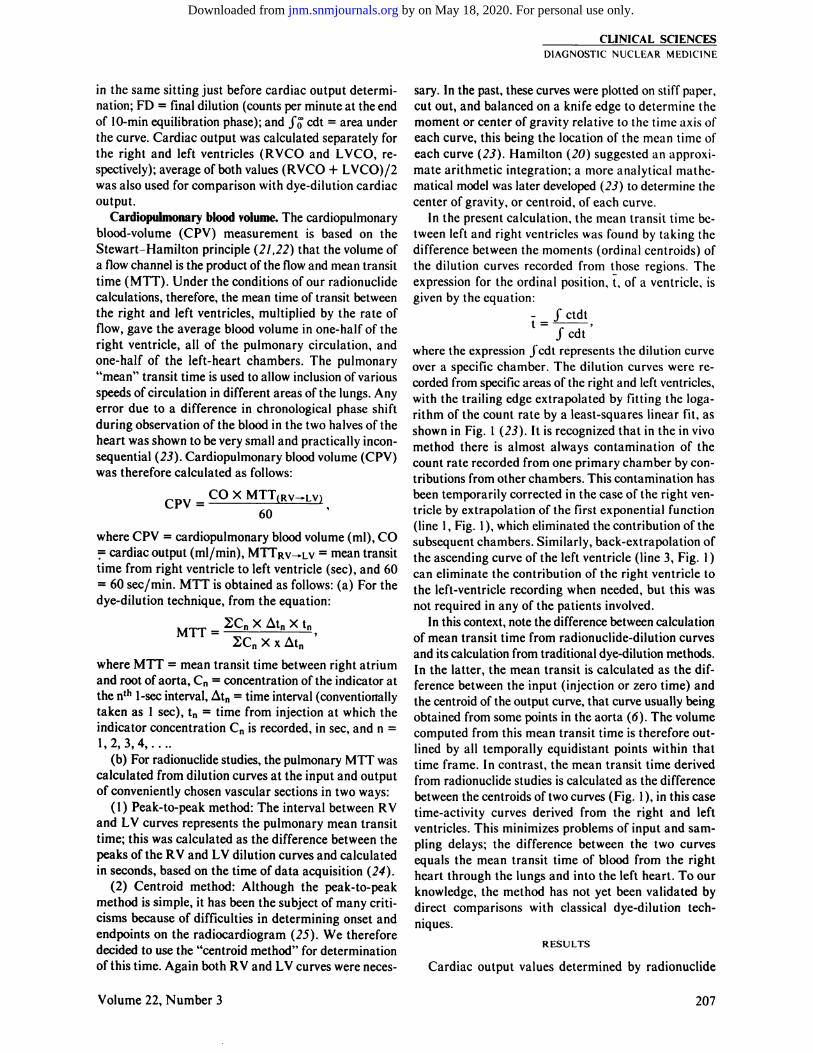
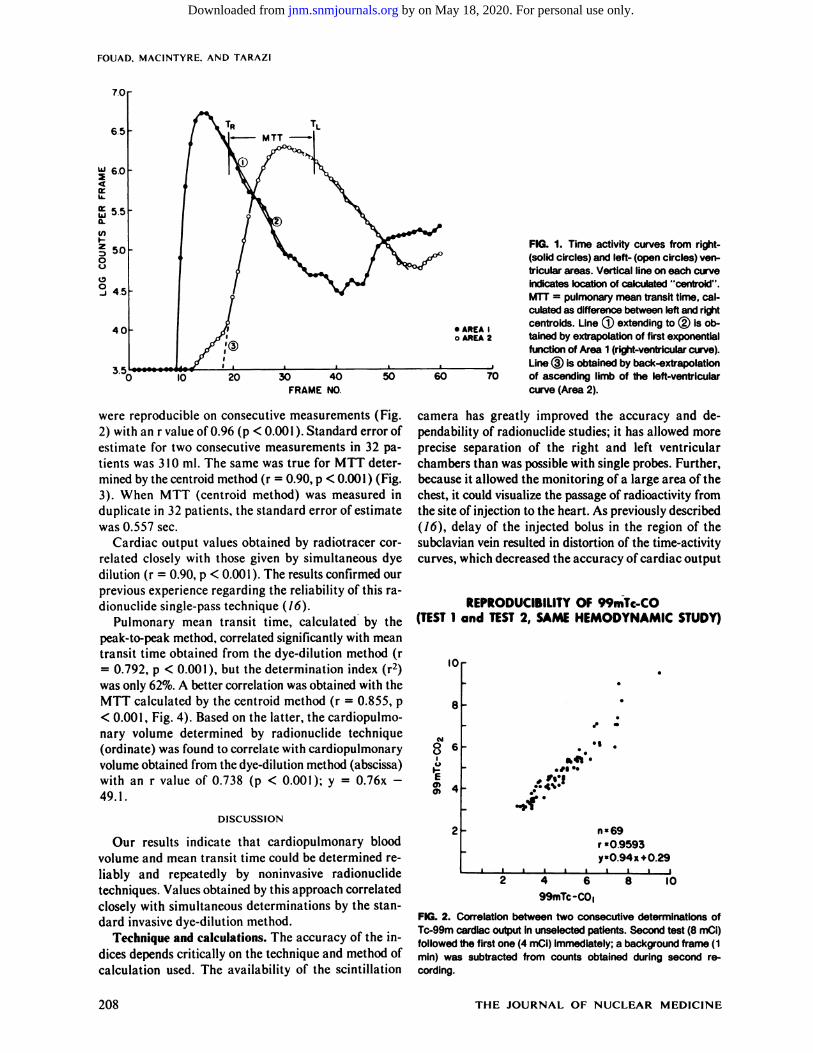
were reproducible on consecutive measurements (Fig.2) with an r value of 0.96 (p < 0.001 ). Standard error ofestimate for two consecutive measurements in 32 patients was 310 ml. The same was true for MTT determined by the centroid method (r = 0.90, p < 0.001) (Fig.3). When MTT (centroid method) was measured induplicate in 32 patients, the standard error of estimatewas 0.557 sec.
Cardiac output values obtained by radiotracer correlated closely with those given by simultaneous dyedilution (r = 0.90, p < 0.001). The results confirmed ourprevious experience regarding the reliability of this ra-dionuclidc single-pass technique (Ì6).
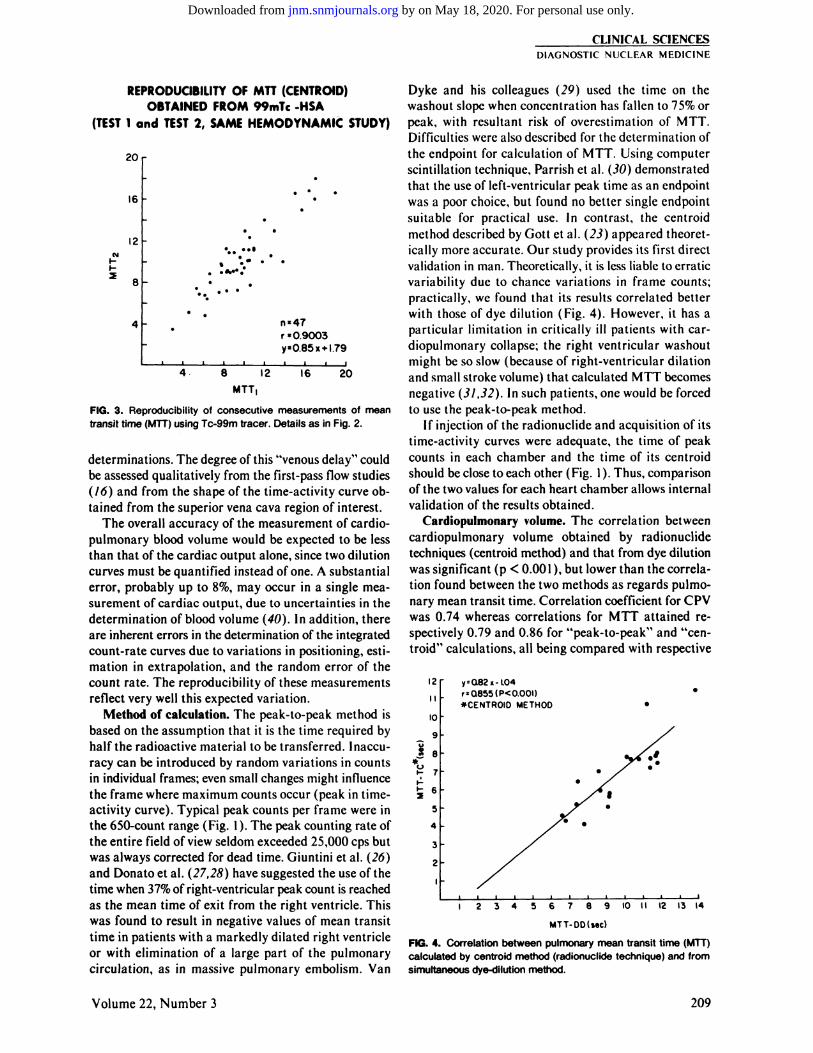
Pulmonary mean transit time, calculated by thepeak-to-peak method, correlated significantly with meantransit time obtained from the dye-dilution method (r= 0.792, p < 0.001 ), but the determination index (r2)
was only 62%. A better correlation was obtained with theMTT calculated by the centroid method (r = 0.855, p< 0.001, Fig. 4). Based on the latter, the cardiopulmo-nary volume determined by radionuclide technique(ordinate) was found to correlate with cardiopulmonaryvolume obtained from the dye-dilution method (abscissa)with an r value of 0.738 (p < 0.001); y = 0.76x -
49.1.
DISCUSSION
Our results indicate that cardiopulmonary bloodvolume and mean transit time could be determined reliably and repeatedly by noninvasive radionuclidetechniques. Values obtained by this approach correlatedclosely with simultaneous determinations by the standard invasive dye-dilution method.
Technique and calculations. The accuracy of the indices depends critically on the technique and method ofcalculation used. The availability of the scintillation
FIG. 1. Time activity curves from right-(solid circles) and left- (open circles) ven
tricular areas. Vertical line on each curveindicates location of calculated "centroid".
MTT = pulmonary mean transit time, cal
culated as difference between left and rightcentroids. Line ® extending to @ is obtained by extrapolation of first exponentialfunction of Area 1 (right-ventricular curve).Line (3) is obtained by back-extrapolationof ascending limb of the left-ventricular
curve (Area 2).
camera has greatly improved the accuracy and dependability of radionuclide studies; it has allowed moreprecise separation of the right and left ventricularchambers than was possible with single probes. Further,because it allowed the monitoring of a large area of thechest, it could visualize the passage of radioactivity fromthe site of injection to the heart. As previously described(16), delay of the injected bolus in the region of thesubclavian vein resulted in distortion of the time-activitycurves, which decreased the accuracy of cardiac output
REPRODUCIBILITY OF 99mTc-CO(TEST 1 and TEST 2, SAME HEMODYNAMIC STUDY)
I0r
AlR 6
I 4
ft* •
*•'!••
n*69r= 0.9593y«0.94x+0.29
4 699mTc-CO|
8 10
FIG. 2. Correlation between two consecutive determinations ofTc-99m cardiac output in unselected patients. Second test (8 mCi)
followed the first one (4 mCi) immediately; a background frame (1min) was subtracted from counts obtained during second recording.
208 THE JOURNAL OF NUCLEAR MEDICINE
by on May 18, 2020. For personal use only. jnm.snmjournals.org Downloaded from
CLINICAL SCIENCESDIAGNOSTIC NUCLEAR MEDICINE
REPRODUCIBILITY OF MTT (CENTROID)OBTAINED FROM 99mTc -HSA
(TEST 1 and TEST 2, SAME HEMODYNAMIC STUDY)
20 r
16
12
r =09003y=0.85x + l.
8 12 16
MÃŽT,
20
FIG. 3. Reproducibility of consecutive measurements of meantransit time (MTT) using Tc-99m tracer. Details as in Fig. 2.
determinations. The degree of this "venous delay" could
be assessed qualitatively from the first-pass flow studies(16) and from the shape of the time-activity curve obtained from the superior vena cava region of interest.
The overall accuracy of the measurement ofcardio-pulmonary blood volume would be expected to be lessthan that of the cardiac output alone, since two dilutioncurves must be quantified instead of one. A substantialerror, probably up to 8%, may occur in a single measurement of cardiac output, due to uncertainties in thedetermination of blood volume (40). In addition, thereare inherent errors in the determination of the integratedcount-rate curves due to variations in positioning, estimation in extrapolation, and the random error of thecount rate. The reproducibility of these measurementsreflect very well this expected variation.
Method of calculation. The peak-to-peak method isbased on the assumption that it is the time required byhalf the radioactive material to be transferred. Inaccuracy can be introduced by random variations in countsin individual frames; even small changes might influencethe frame where maximum counts occur (peak in time-activity curve). Typical peak counts per frame were inthe 650-count range (Fig. 1). The peak counting rate ofthe entire field of view seldom exceeded 25,000 cps butwas always corrected for dead time. Giuntini et al. (26)and Donato et al. (27,28) have suggested the use of thetime when 37%of right-ventricular peak count is reachedas the mean time of exit from the right ventricle. Thiswas found to result in negative values of mean transittime in patients with a markedly dilated right ventricleor with elimination of a large part of the pulmonarycirculation, as in massive pulmonary embolism. Van
Dyke and his colleagues (29) used the time on thewashout slope when concentration has fallen to 75% orpeak, with resultant risk of overestimation of MTT.Difficulties were also described for the determination ofthe cndpoint for calculation of MTT. Using computerscintillation technique, Parrish et al. (30) demonstratedthat the use of left-ventricular peak time as an cndpointwas a poor choice, but found no better single cndpointsuitable for practical use. In contrast, the ccntroidmethod described by Gott et al. (23) appeared theoretically more accurate. Our study provides its first directvalidation in man. Theoretically, it is less liable to erraticvariability due to chance variations in frame counts;practically, we found that its results correlated betterwith those of dye dilution (Fig. 4). However, it has aparticular limitation in critically ill patients with car-diopulmonary collapse; the right ventricular washoutmight be so slow (because of right-ventricular dilationand small stroke volume) that calculated MTT becomesnegative (31,32). In such patients, one would be forcedto use the peak-to-peak method.
If injection of the radionuclide and acquisition of itstime-activity curves were adequate, the time of peakcounts in each chamber and the time of its centroidshould be close to each other (Fig. 1). Thus, comparisonof the two values for each heart chamber allows internalvalidation of the results obtained.
Cardiopulmonaryvolume. The correlation betweencardiopulmonary volume obtained by radionuclidetechniques (centroid method) and that from dye dilutionwas significant (p < 0.001 ), but lower than the correlation found between the two methods as regards pulmonary mean transit time. Correlation coefficient for CPVwas 0.74 whereas correlations for MTT attained respectively 0.79 and 0.86 for "peak-to-pcak" and "centroid" calculations, all being compared with respective
12
II
IO
9"o
S oJC *
y=Q82x-l.04r =0.855 (P< 0.001)»CENTROID METHOD
_l_ _i_ _i_23456789 IO
MTT-DD(sec)
12 13 14
FIG. 4. Correlation between pulmonary mean transit time (MTT)calculated by centroid method (radionuclide technique) and fromsimultaneous dye-dilution method.
Volume 22, Number 3 209
by on May 18, 2020. For personal use only. jnm.snmjournals.org Downloaded from

FOUAD. MACINTYRE. AND TARA7.I
indices obtained by dye dilution. These differences canbe explained by at least two factors. One is the numberof variables used for the calculation of cardiopulmonaryvolume (CPV = CO/60 X MTT), each of which has asmall but measurable error of its own. The second factorderives from the many possible inaccuracies in the dye-dilution method. First are the difficulties in accurateplacement of catheters, whose exact positioning in theright atrium and the root of the aorta is a necessaryprerequisite for accurate determinations. Minor differences can occur during positioning; the venous cathetermight be at the junction of superior vena cava and rightatrium, or in the lower part of the right atrium. The arterial catheter might not be exactly at the plane of aorticvalve but higher in the ascending aorta. To achieve anexact placement of the arterial catheter, one shouldideally introduce it into the left ventricle, then monitorits withdrawal to just above the aortic valve. This, however, is unduly risky and possibly unethical in patientsfor whom left-ventricular catheterization is not requiredfor other reasons. Since MTT determination by the ra-dionuclide method does not involve such factors ascatheter placement and correction for delay in sampling(17), calculation of cardiopulmonary volume by thismethod should have fewer chances of error than thatdepending on dye dilution. If this were true, minorvariations in positioning—and therefore in mean transittime—should have a greater influence on calculationsof cardiopulmonary volume in conditions with a highflow rate. This was indeed the case, since we found asignificant correlation (r = —0.606,p < 0.01) between
the difference in CPV calculated by dye dilution and byradionuclide methods on the one hand, and the meantransit time on the other.
The positive intercept, observed in correlations ofradionuclide determinations of CPV with results ofdye-dilution CPV, can be explained by the relative position of the input and final cardiovascular chambersfrom which measurements are derived. With dye dilution, measurement is from the right atrium to the rootof aorta, whereas the radionuclide measurements in ourpatients were derived from right ventricle and left ventricle.
Pathophysiological and clinical importance. The radionuclide approach thus offers a reliable, repeatable,and noninvasive method to determine CPV and helpscalculate an index of venous distensibility and translocation of blood volume. The method is simple and accurate when proper measures are taken to ensure arrivalof the tracer at the heart as a bolus. Proper choice ofareas of interest and correct extrapolation of the descending limb of the time-activity curves are also necessary requirements for accurate determinations.
Compared with methods used to measure local venousdistensibility, this technique not only allows an estimateof the overall effects of changes in venous tone (CPV/
TBV) but it also provides information about both systemic and pulmonary circulations and cardiac performance (ejection fraction) (33). It is atraumatic andtherefore easily repeatable. The importance of the ratioof cardiopulmonary to total blood volume for analysisof hemodynamic findings was underlined by Ulrych etal. (4); high output in hypertensives could be related insome to relocation of blood centrally and in others toenhanced cardiac performance (6,34). Vasodilator drugscan have different effects on arterial and venous vessels,which lead to marked differences in their hemodynamiceffects. These are best evaluated by measuring cardiopulmonary volume in addition to cardiac output (35,36).Chen et al. (37) reported differences in the hemodynamic changes induced by hemodialysis and hemofil-tration, and related these changes to differences in bloodpH and its resultant effect on venous tone. Patients withdiminished sympathetic tone (with idiopathic orthostatichypotension or from therapy with sympatholytics) werefound to have reduced venous tone (38) resulting in increased gravitational venous pooling of blood on standing. The interest in cardiopulmonary volume was extended to reflex control of renin secretion (39). Alterations in renin secretion were described in concert withchanges in cardiac output produced by thigh cuff inflation and deflation while arterial pressure was unchanged.Simon et al. (10) used the ratio CPV/TBV as an indexof sympathetic venous tone; the ratio was found to correlate positively with the diastolic blood pressure (DBP)in normotensives but not in hypertensive patients.
ACKNOWLEDGMENTS
This study was supported in part by the Cleveland Clinic ResearchProjects Committee (CRP), the American Heart Association,Northeast Ohio Affiliate, and the John Hartford Foundation. Dr.Fouad was the recipient of a Senior Research FellowshipAward fromthe American Heart Association during this period.
REFERENCES
/. WOOD JE: Peripheral venous and arteriolar responses toinfusions of angiotensin in normal and hypertensive subjects.Circ Res 9:768-772, 1961
2. CALIVA FS, NAPODANO RJ, LYONS RH: Digital hemo-dynamics in normotensive and hypertensive states. II. Veno-motor tone. Circulation 28:421-426, 1963
3. CALIVA FS, NAPODANO RJ, STAFFORD RM, et al: Digitalhemodynamics in the normotensive and hypertensive states.1. Digital mean arterial and venous pressures, blood flow, andvascular resistance. Circulation 28:415-420, 1963
4. ULRYCH M, FRÖHLICHED, TARAZI RC, et al: Cardiacoutput and distribution of blood volume in central and peripheral circulations in hypertensive and normotensive man.Br Heart J 31:570-574, 1969
5. WALSH JA, HYMAN C, MARONDE RF: Venous distensibility in essential hypertension. Cardiovasc Res 3:338-349,1969
6. TARAZI RC, IBRAHIM MM, DUSTAN HP, et al: Cardiacfactors in hypertension. Circ. Res 34 (Suppl I):I-213-I-221,
210 THE JOURNAL OF NUCLEAR MEDICINE
by on May 18, 2020. For personal use only. jnm.snmjournals.org Downloaded from
CLINICAL SCIENCESDIAGNOSTIC NUCLEAR MEDICINE
19747. MILLER RR, VISMARA LA, WILLAMS DO, et al: Phar
macological mechanisms for left ventricular unloading inclinical congestive heart failure. Differential effects of ni-troprusside, phentolamine, and nitroglycerin on cardiacfunction and peripheral circulation. Circ Res 39:127-133,1976
8. TARAZI RC, DUSTAN HP, BRAVO EL, et al: Vasodilatingdrugs: contrasting haemodynamic effects. Clin Sci Motee Med51:575s-578s, 1976
9. LONDONGM, SAFAR ME, SIMON AC, et al: Total effectivecompliance, cardiac output and fluid volumes in essentialhypertension. Circulation 57:995-1000, 1978
10. SIMON AC, SAFAR ME, WEISS YA, et al: Baroreflex sensitivity and cardiopulmonary blood volume in normotensiveand hypertensive patients. Br Heart J 39:799-805, 1977
//. WOOD JE, ECKSTEIN JW: A tandem forearm plethysmo-graph for study of acute responses of the peripheral veins ofman: the effect of environmental and local temperaturechange, and the effect of pooling blood in the extremities. JClin Incest 37:41-40, 1958
12. GIUNTINI C, MARIANI M, MASERI A, et al: Pulmonarymean circulation time (PMCT) and functional heart capacity(FHC). Clin Res 17:242, 1969 (abst)
13. DONATO L, GIUNTINI C, MASERI A, et al: Externalcounting method for the evaluation of cardiopulmonaryhaemodynamics. Proceedings of the Vth European Congressof Cardiology, Athens, September, 1968, pp 175-184
14. TARAZI RC, FOUAD FM, CEIMO MK, et al: Renin, aldo-sterone and cardiac decompensation: studies with an oralconverting enzyme inhibitor in heart failure. Am J Cardiol44:1013-1018, 1979
/5. OKADA RD, POHOSTGM, KIRSHENBAUM HD, et al: Ra-dionuclide-determined change in pulmonary blood volumewith exercise. Improved sensitivity of multigated blood-poolscanning in detecting coronary-artery disease. N Eng! J Med301:569-576, 1979
16. FOUAD FM, TARAZI RC, MAC!NTYRE WJ, et al: Venousdelay, a major source of error in isotropie cardiac output determination. Am Heart J 97:477-484, 1979
17. MlLNOR WR, JOSE AD: Distortion of indicator-dilutioncurves by sampling systems. J Appi Physiol 15:177-180,1960
18. PRITCHARD WJ, MAC!NTYRE WJ, MOIR TW: The determination of cardiac output by the dilution method withoutarterial sampling. II. Validation of precordial recording.Circulation 18:1147-1154, 1958
19. SMITH EM: Internal dose calculation for 99mTc.J NucÃMed6:231-251, 1965
20. HAMILTON WF, RILEY RL, ATTYAH AM, et al: Comparison of the Pick and dye injection methods of measuring thecardiac output in man. Am J Physiol 153:309-321, 1948
21. STEWART ON: The pulmonary circulation time, the quantityof blood in the lungs and the output of the heart. Am J Physiol58:20-44, 1921
22. HAMILTON WF, MOORE JW, KINSMAN JM, et al: Simultaneous determination of the greater and lesser circulationtimes, of the mean velocity of blood flow through the heart andlungs of the cardiac output and an approximation of theamount of blood actively circulating in the heart and lungs.Am J Physiol 85:377-378, 1928
23. GOTT FS, MOIR TW, MAClNTYRE WJ, et al. A mathematical model of dilution curves for flow study. Circ Res 9:607-613, 1961
24. EICH RH, CHAFFEE WR, CHODOS RB: Measurement ofcentral blood volume by external monitoring. Circ Res 9:626-630,1961
25. PlERSON RN, JR: Analysis of left ventricular function. InQuantitative Nuclear Cardiology. Pierson RN, Jr, Kriss JP,Jones RH, Maclntyre WJ, Eds. New York, John Wiley &Sons, 1975, pp 123-154
26. GIUNTINI C, LEWIS ML, Luis AS, et al: A study of thepulmonary blood volume in many by quantitative radiocar-diography. J din Invest 42:1589-1605, 1963
27. DONATO L, GIUNTINI C, LEWIS ML, et al: Quantitativeradiocardiography. I. Theoretical considerations. Circulalion26:174-182, 1962
28. DONATO L, GIUNTINI C, BIANCHI R, et al: Quantitativeradiocardiography for the measurement of pulmonary bloodvolume. Dynamic clinical studies with radioisotopes, KneseleyRM.TauxeWN, Eds. 1964, p 267
29. VAN DYKE D, ANGER HO, SULLIVAN RW, et al: Cardiacevaluation from radioisotope dynamics. J NucÃMed 13:585-592,1972
30. PARRISH D, HAYDEN DT, GARRETT W, et al: Analogcomputer analysis of flow characteristics and volume of thepulmonary vascular bed. Circ Res 7:746-752, 1959
31. STEELE PP, VAN DYKE D, TROW RS, et al: Simple and safebedside method for serial measurement of left ventricularejection fraction, cardiac output and pulmonary blood volume.Br Heart Jìf,:\22-\ì\, 1974
32. PARKER H, VAN DYKE D, WEBER P, et al: Evaluation ofcentral circulatory dynamics with the radionuclide angiocardiogram. In Diagnostic Nuclear Cardiology. Wagner H,Ed, St. Louis, C.V. Mosby Co, 1974 p
33. SCHELBERT HR, VERBA JW, JOHNSON AD, et al: Non-traumatic determination of left ventricular ejection fractionby radionuclide angiocardiography. Circulation 51:902-909,1975
34. JULIUS S, RANDALL OS, ESLER MD, et al: Altered cardiacresponsiveness and regulation in the normal cardiac outputtype of borderline hypertension. Circ Res 36 (Suppl I):l-199-1-207, 1975
35. SCHLANT RC, TSAGARIS TS, ROBERTSON RJ: Studies onthe acute cardiovascular effects of intravenous sodium ni-troprusside. Am J Cardiol 9:51-59, 1962
36. DUSTAN HP, TARAZI RC, BRAVO EL: Hemodynamic adjustments during long-term antihypertensive therapy. InRecent Advances in Hypertension. Millie P, Safar M, Eds.Laboratoires Boehringer Ingelheim, France, 1975, pp247-258
37. CHEN WT, CHAIGNON M, TARAZI RC, et al: Hemody-namics of post-dialysis hypotension. Kidney Internat 12:493,1977 (abst)
38. IBRAHIM MM, TARAZI RC, DUSTAN HP, et al: Idiopathicorthostatic hypotension: circulatory dynamics in chronic autonomie insufficiency. Am J Cardiol 34:288-294, 1974
39. KlOWSKI W, JULIUS S: Renin response to stimulation ofcardiopulmonary mechanoreceptors in man. J Clin Invest62:656-663, 1978
40. WILLIAMS JA, FINE J: Measurement of blood volume witha new apparatus. N Engl J Med 264:842-848, 1961
Volume 22, Number 3 211
by on May 18, 2020. For personal use only. jnm.snmjournals.org Downloaded from

1981;22:205-211.J Nucl Med. Fetnat M. Fouad, William J. MacIntyre and Robert C. Tarazi Centroid MethodNoninvasive Measurement of Cardiopulmonary Blood Volume. Evaluation of the
http://jnm.snmjournals.org/content/22/3/205This article and updated information are available at:
http://jnm.snmjournals.org/site/subscriptions/online.xhtml
Information about subscriptions to JNM can be found at:
http://jnm.snmjournals.org/site/misc/permission.xhtmlInformation about reproducing figures, tables, or other portions of this article can be found online at:
(Print ISSN: 0161-5505, Online ISSN: 2159-662X)1850 Samuel Morse Drive, Reston, VA 20190.SNMMI | Society of Nuclear Medicine and Molecular Imaging
is published monthly.The Journal of Nuclear Medicine
© Copyright 1981 SNMMI; all rights reserved.
by on May 18, 2020. For personal use only. jnm.snmjournals.org Downloaded from