Embed Size (px)
Citation preview
Electrocardiographic ImagingNoninvasive Characterization of Intramural Myocardial Activation From
Inverse-Reconstructed Epicardial Potentials and Electrograms
Howard S. Oster, MD, PhD; Bruno Taccardi, MD, PhD; Robert L. Lux, PhD;Philip R. Ershler, PhD; Yoram Rudy, PhD
Background—A recent study demonstrated the ability of electrocardiographic imaging (ECGI) to reconstruct, noninva-sively, epicardial potentials, electrograms, and activation sequences (isochrones) generated by epicardial activation. Thecurrent study expands the earlier work to the three-dimensional myocardium and investigates the ability of ECGI tocharacterize intramural myocardial activation noninvasively and to relate it to the underlying fiber structure of themyocardium. This objective is motivated by the fact that cardiac excitation and arrhythmogenesis involve thethree-dimensional ventricular wall and its anisotropic structure.
Methods and Results—Intramural activation was initiated by pacing a dog heart in a human torso tank. Body surfacepotentials (384 electrodes) were used to compute epicardial potentials noninvasively. Accuracy of reconstructedepicardial potentials was evaluated by direct comparison to measured ones (134 electrodes). Protocols included pacingfrom five intramural depths. Epicardial potentials showed characteristic patterns (1) early in activation, central negativeregion with two flanking maxima aligned with the orientation of fibers at the depth of pacing; (2) counterclockwiserotation of positive potentials with time for epicardial pacing, clockwise rotation for subendocardial pacing, and dualrotation for midmyocardial pacing; and (3) central positive region for endocardial pacing. Noninvasively reconstructedpotentials closely approximated these patterns. Reconstructed epicardial electrograms and epicardial breakthrough timesclosely resembled measured ones, demonstrating progressively later epicardial activation with deeper pacing.
Conclusions—ECGI can noninvasively estimate the depth of intramyocardial electrophysiological events and providesinformation on the spread of excitation in the three-dimensional anisotropic myocardium on a beat-by-beat basis.(Circulation. 1998;97:1496-1507.)
Key Words: electrocardiographyn imagingn pacingn epicardiumn potentialsn anisotropy
The goal of electrocardiographic imaging (ECGI) is toobtain, noninvasively, a detailed description of the spa-
tio-temporal pattern of cardiac electrical activity. Traditionalnoninvasive ECG techniques are limited in their ability todetermine the location of electrical events in the heart withacceptable resolution.1 In contrast, epicardial potentials re-flect details of cardiac electrical activity with high resolu-tion.2–5 Earlier work6–11 has demonstrated the ability to com-pute, noninvasively, epicardial potential distributions andepicardial activation sequences (isochrones) from measuredbody surface potentials.
In a recent study,12 we demonstrated the ability of ECGI toreconstruct, noninvasively, epicardial potentials, electro-grams, and isochrones during ventricular pacing. Importantly,it was shown that single and multiple pacing sites, simulatingsites of ectopic initial activation, could be localized with goodaccuracy (error#10 mm) and high resolution with thisnoninvasive method. Reconstructed epicardial electrograms
closely correlated with measured electrograms over the entireepicardial surface. Reconstructed isochrones provided a faith-ful depiction of the epicardial activation sequence, includingspatial nonuniformities of activation spread (eg, regions ofsparse or crowded isochrones). The earlier study was limitedto epicardial pacing and epicardial activation. However,important electrical events occur within the three-dimen-sional volume of the ventricular wall. In normal sinus rhythm,propagation of activation is mostly transmural, from endocar-dium to epicardium.13 In general, arrhythmogenic activityalso involves intramural excitation, including three-dimen-sional reentry14 or ectopic focal activation.15 In addition,ventricular repolarization involves the intramural myocardi-um. Recently, attention was directed to the presence ofheterogeneous subpopulations of cells16 (eg, midmyocardialM cells) that introduce transmural heterogeneity of actionpotential duration and of repolarization. Such heterogeneitieswere implicated in arrhythmogenesis (eg, torsade de pointes
Received June 10, 1997; revision received October 23, 1997; accepted November 13, 1997.From the Cardiac Bioelectricity Research and Training Center, Department of Biomedical Engineering, Case Western Reserve University, Cleveland,
Ohio (H.S.O., Y.R.); and the Cardiovascular Research and Training Institute, University of Utah, Salt Lake City (B.T., R.L.L., P.R.E.).Correspondence to Yoram Rudy, Director, Cardiac Bioelectricity Research and Training Center, Case Western Reserve University, Wickenden Bldg,
Room 505, Cleveland, OH 44106-7207.E-mail [email protected]© 1998 American Heart Association, Inc.
1496
by guest on May 14, 2018
http://circ.ahajournals.org/D
ownloaded from
or other arrhythmias associated with the long QT syn-drome).17 It is important, therefore, to develop noninvasivemethods for obtaining information on activity inside thevolume of the ventricular wall. The objective of the currentstudy was to extend the use of ECGI and to evaluate its abilityto detect and locate, noninvasively, electrical events invarious depths inside the myocardium. Specifically, intramu-ral pacing sites at several depths and at various locations areused to simulate intramural foci of activation. In addition, theability of ECGI to provide information on the spatio-temporalpropagation of intramural activation as the activation-fronttraverses the myocardium is examined.
MethodsComputational MethodsDetails of the computational methodology have been documentedpreviously.9,10,18–20Briefly, ECGI requires solving the inverse prob-lem of electrocardiography, a procedure that involves two majorsteps. The first entails discretization of the relation between poten-tials on the epicardium and those on the body surface. This relationis provided by Laplace’s equation and the boundary element method.The second step is the inversion of this relation to obtain anexpression for computing epicardial potentials from the measuredbody surface potentials. Because the inverse problem in electrocar-diography is ill posed (ie, unstable in the presence of noise), solvingfor the epicardial potentials requires regularization. In this study, asin our previous studies,8,12,18 Tikhonov zero order regularization isused to stabilize the solution, and the regularization parameter isfound using the CRESO (Composite Residual and SmoothingOperator) method.7 Computing the epicardial potentials in this wayis completely noninvasive and requires only knowledge of thegeometry and of the electric potential distribution on the torso.
Electrograms, measured and reconstructed, are examined forpurposes of identifying the time of epicardial activation (“break-through”) near the intramural pacing sites. Noninvasive reconstruc-tion of the electrograms is accomplished in the following way: First,potential maps are reconstructed for each time frame, then the timeseries of maps is organized by lead to provide temporal electrograms.The time of activation for a given electrode is taken as the maximum2dV/dt. Details of the reconstruction method can be found in ourprevious work.12
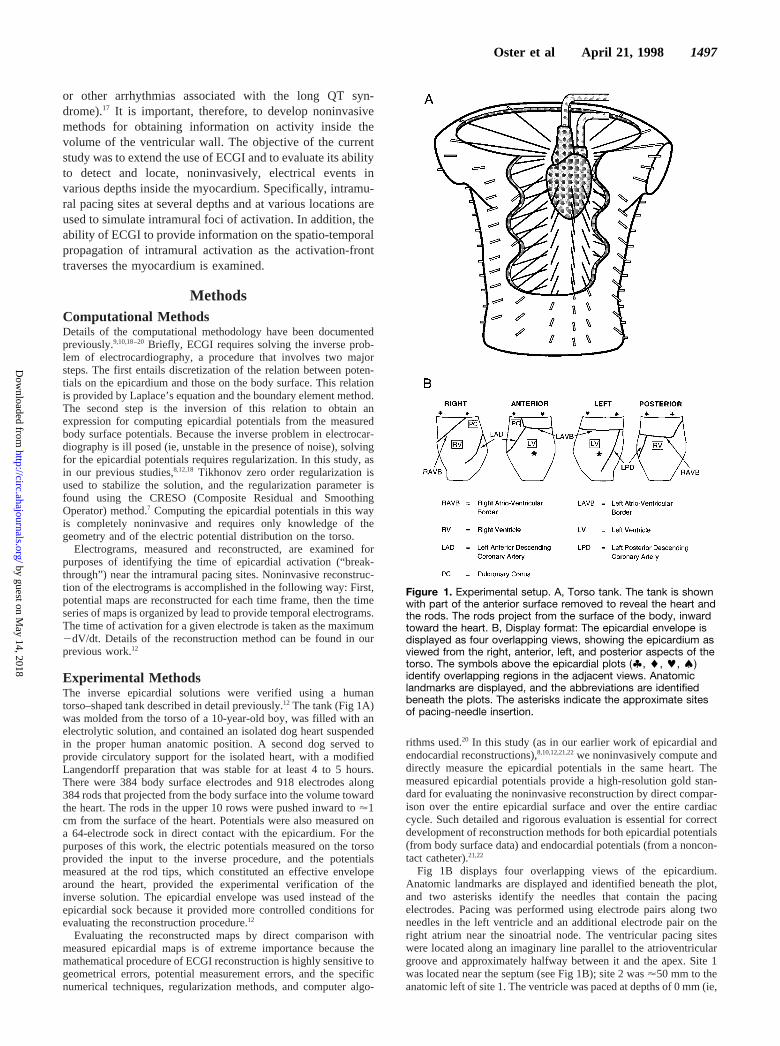
Experimental MethodsThe inverse epicardial solutions were verified using a humantorso–shaped tank described in detail previously.12 The tank (Fig 1A)was molded from the torso of a 10-year-old boy, was filled with anelectrolytic solution, and contained an isolated dog heart suspendedin the proper human anatomic position. A second dog served toprovide circulatory support for the isolated heart, with a modifiedLangendorff preparation that was stable for at least 4 to 5 hours.There were 384 body surface electrodes and 918 electrodes along384 rods that projected from the body surface into the volume towardthe heart. The rods in the upper 10 rows were pushed inward to'1cm from the surface of the heart. Potentials were also measured ona 64-electrode sock in direct contact with the epicardium. For thepurposes of this work, the electric potentials measured on the torsoprovided the input to the inverse procedure, and the potentialsmeasured at the rod tips, which constituted an effective envelopearound the heart, provided the experimental verification of theinverse solution. The epicardial envelope was used instead of theepicardial sock because it provided more controlled conditions forevaluating the reconstruction procedure.12
Evaluating the reconstructed maps by direct comparison withmeasured epicardial maps is of extreme importance because themathematical procedure of ECGI reconstruction is highly sensitive togeometrical errors, potential measurement errors, and the specificnumerical techniques, regularization methods, and computer algo-
rithms used.20 In this study (as in our earlier work of epicardial andendocardial reconstructions),8,10,12,21,22we noninvasively compute anddirectly measure the epicardial potentials in the same heart. Themeasured epicardial potentials provide a high-resolution gold stan-dard for evaluating the noninvasive reconstruction by direct compar-ison over the entire epicardial surface and over the entire cardiaccycle. Such detailed and rigorous evaluation is essential for correctdevelopment of reconstruction methods for both epicardial potentials(from body surface data) and endocardial potentials (from a noncon-tact catheter).21,22
Fig 1B displays four overlapping views of the epicardium.Anatomic landmarks are displayed and identified beneath the plot,and two asterisks identify the needles that contain the pacingelectrodes. Pacing was performed using electrode pairs along twoneedles in the left ventricle and an additional electrode pair on theright atrium near the sinoatrial node. The ventricular pacing siteswere located along an imaginary line parallel to the atrioventriculargroove and approximately halfway between it and the apex. Site 1was located near the septum (see Fig 1B); site 2 was'50 mm to theanatomic left of site 1. The ventricle was paced at depths of 0 mm (ie,
Figure 1. Experimental setup. A, Torso tank. The tank is shownwith part of the anterior surface removed to reveal the heart andthe rods. The rods project from the surface of the body, inwardtoward the heart. B, Display format: The epicardial envelope isdisplayed as four overlapping views, showing the epicardium asviewed from the right, anterior, left, and posterior aspects of thetorso. The symbols above the epicardial plots (', l, k, ;)identify overlapping regions in the adjacent views. Anatomiclandmarks are displayed, and the abbreviations are identifiedbeneath the plots. The asterisks indicate the approximate sitesof pacing-needle insertion.
Oster et al April 21, 1998 1497
by guest on May 14, 2018
http://circ.ahajournals.org/D
ownloaded from
at the epicardium), 3.2 mm, 6.4 mm, 9.6 mm, and 12.8 mm relativeto the epicardial surface. Ventricular pacing was accomplished withcurrent pulses of 2 ms duration and intensity just above threshold(generally 0.2 to 0.5 mA). Stimuli were delivered simultaneously tothe ventricular pacing leads and to the right atrial pacing leads toprevent sinus beats from capturing the ventricles. Cycle length ofpacing (the longest to capture the heart and exceed the sinus rate)was 380 ms.
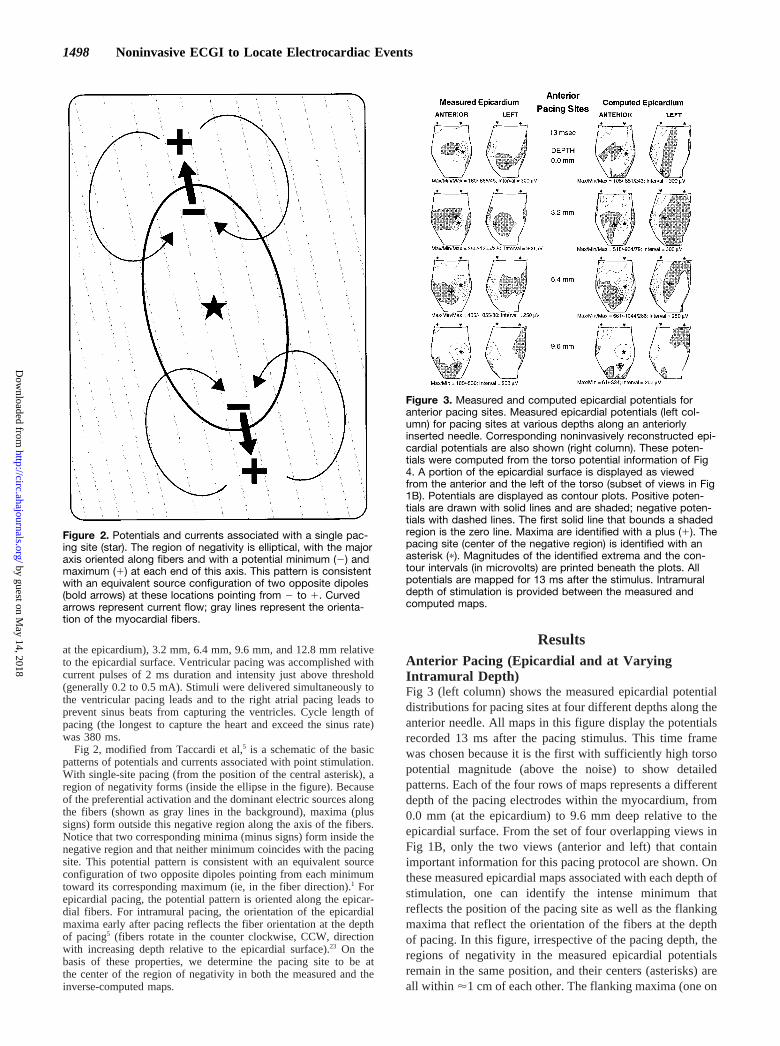
Fig 2, modified from Taccardi et al,5 is a schematic of the basicpatterns of potentials and currents associated with point stimulation.With single-site pacing (from the position of the central asterisk), aregion of negativity forms (inside the ellipse in the figure). Becauseof the preferential activation and the dominant electric sources alongthe fibers (shown as gray lines in the background), maxima (plussigns) form outside this negative region along the axis of the fibers.Notice that two corresponding minima (minus signs) form inside thenegative region and that neither minimum coincides with the pacingsite. This potential pattern is consistent with an equivalent sourceconfiguration of two opposite dipoles pointing from each minimumtoward its corresponding maximum (ie, in the fiber direction).1 Forepicardial pacing, the potential pattern is oriented along the epicar-dial fibers. For intramural pacing, the orientation of the epicardialmaxima early after pacing reflects the fiber orientation at the depthof pacing5 (fibers rotate in the counter clockwise, CCW, directionwith increasing depth relative to the epicardial surface).23 On thebasis of these properties, we determine the pacing site to be atthe center of the region of negativity in both the measured and theinverse-computed maps.
ResultsAnterior Pacing (Epicardial and at VaryingIntramural Depth)Fig 3 (left column) shows the measured epicardial potentialdistributions for pacing sites at four different depths along theanterior needle. All maps in this figure display the potentialsrecorded 13 ms after the pacing stimulus. This time framewas chosen because it is the first with sufficiently high torsopotential magnitude (above the noise) to show detailedpatterns. Each of the four rows of maps represents a differentdepth of the pacing electrodes within the myocardium, from0.0 mm (at the epicardium) to 9.6 mm deep relative to theepicardial surface. From the set of four overlapping views inFig 1B, only the two views (anterior and left) that containimportant information for this pacing protocol are shown. Onthese measured epicardial maps associated with each depth ofstimulation, one can identify the intense minimum thatreflects the position of the pacing site as well as the flankingmaxima that reflect the orientation of the fibers at the depthof pacing. In this figure, irrespective of the pacing depth, theregions of negativity in the measured epicardial potentialsremain in the same position, and their centers (asterisks) areall within '1 cm of each other. The flanking maxima (one on
Figure 2. Potentials and currents associated with a single pac-ing site (star). The region of negativity is elliptical, with the majoraxis oriented along fibers and with a potential minimum (2) andmaximum (1) at each end of this axis. This pattern is consistentwith an equivalent source configuration of two opposite dipoles(bold arrows) at these locations pointing from 2 to 1. Curvedarrows represent current flow; gray lines represent the orienta-tion of the myocardial fibers.
Figure 3. Measured and computed epicardial potentials foranterior pacing sites. Measured epicardial potentials (left col-umn) for pacing sites at various depths along an anteriorlyinserted needle. Corresponding noninvasively reconstructed epi-cardial potentials are also shown (right column). These poten-tials were computed from the torso potential information of Fig4. A portion of the epicardial surface is displayed as viewedfrom the anterior and the left of the torso (subset of views in Fig1B). Potentials are displayed as contour plots. Positive poten-tials are drawn with solid lines and are shaded; negative poten-tials with dashed lines. The first solid line that bounds a shadedregion is the zero line. Maxima are identified with a plus (1). Thepacing site (center of the negative region) is identified with anasterisk (p). Magnitudes of the identified extrema and the con-tour intervals (in microvolts) are printed beneath the plots. Allpotentials are mapped for 13 ms after the stimulus. Intramuraldepth of stimulation is provided between the measured andcomputed maps.
1498 Noninvasive ECGI to Locate Electrocardiac Events
by guest on May 14, 2018
http://circ.ahajournals.org/D
ownloaded from
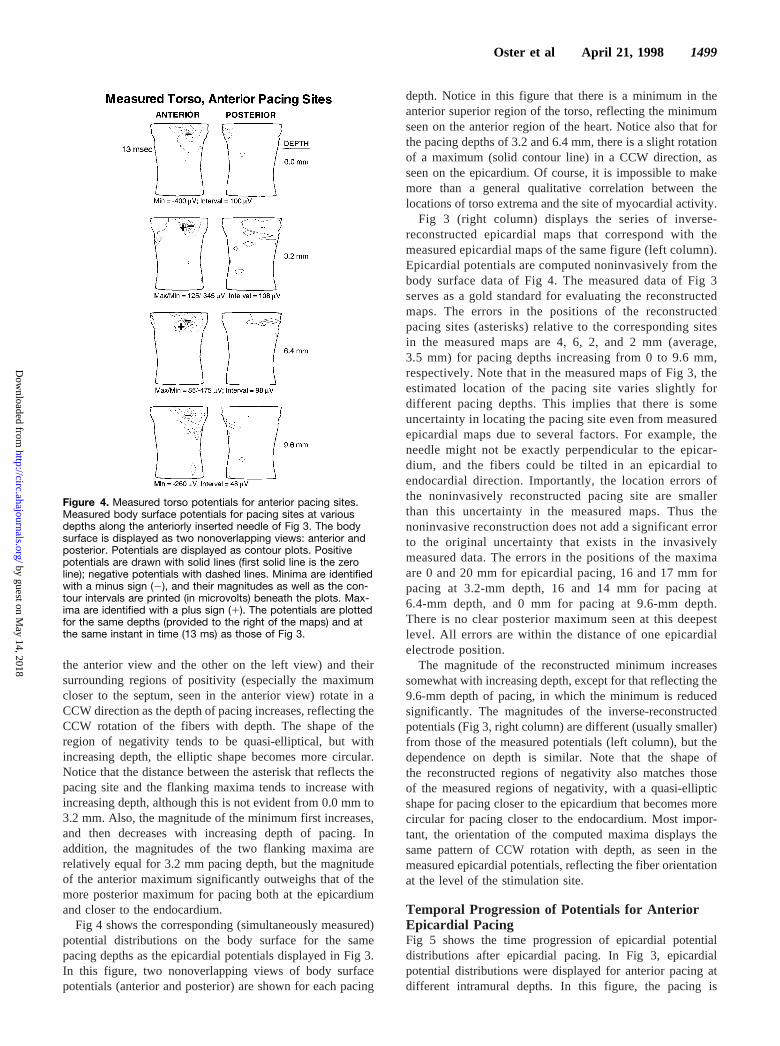
the anterior view and the other on the left view) and theirsurrounding regions of positivity (especially the maximumcloser to the septum, seen in the anterior view) rotate in aCCW direction as the depth of pacing increases, reflecting theCCW rotation of the fibers with depth. The shape of theregion of negativity tends to be quasi-elliptical, but withincreasing depth, the elliptic shape becomes more circular.Notice that the distance between the asterisk that reflects thepacing site and the flanking maxima tends to increase withincreasing depth, although this is not evident from 0.0 mm to3.2 mm. Also, the magnitude of the minimum first increases,and then decreases with increasing depth of pacing. Inaddition, the magnitudes of the two flanking maxima arerelatively equal for 3.2 mm pacing depth, but the magnitudeof the anterior maximum significantly outweighs that of themore posterior maximum for pacing both at the epicardiumand closer to the endocardium.
Fig 4 shows the corresponding (simultaneously measured)potential distributions on the body surface for the samepacing depths as the epicardial potentials displayed in Fig 3.In this figure, two nonoverlapping views of body surfacepotentials (anterior and posterior) are shown for each pacing
depth. Notice in this figure that there is a minimum in theanterior superior region of the torso, reflecting the minimumseen on the anterior region of the heart. Notice also that forthe pacing depths of 3.2 and 6.4 mm, there is a slight rotationof a maximum (solid contour line) in a CCW direction, asseen on the epicardium. Of course, it is impossible to makemore than a general qualitative correlation between thelocations of torso extrema and the site of myocardial activity.
Fig 3 (right column) displays the series of inverse-reconstructed epicardial maps that correspond with themeasured epicardial maps of the same figure (left column).Epicardial potentials are computed noninvasively from thebody surface data of Fig 4. The measured data of Fig 3serves as a gold standard for evaluating the reconstructedmaps. The errors in the positions of the reconstructedpacing sites (asterisks) relative to the corresponding sitesin the measured maps are 4, 6, 2, and 2 mm (average,3.5 mm) for pacing depths increasing from 0 to 9.6 mm,respectively. Note that in the measured maps of Fig 3, theestimated location of the pacing site varies slightly fordifferent pacing depths. This implies that there is someuncertainty in locating the pacing site even from measuredepicardial maps due to several factors. For example, theneedle might not be exactly perpendicular to the epicar-dium, and the fibers could be tilted in an epicardial toendocardial direction. Importantly, the location errors ofthe noninvasively reconstructed pacing site are smallerthan this uncertainty in the measured maps. Thus thenoninvasive reconstruction does not add a significant errorto the original uncertainty that exists in the invasivelymeasured data. The errors in the positions of the maximaare 0 and 20 mm for epicardial pacing, 16 and 17 mm forpacing at 3.2-mm depth, 16 and 14 mm for pacing at6.4-mm depth, and 0 mm for pacing at 9.6-mm depth.There is no clear posterior maximum seen at this deepestlevel. All errors are within the distance of one epicardialelectrode position.
The magnitude of the reconstructed minimum increasessomewhat with increasing depth, except for that reflecting the9.6-mm depth of pacing, in which the minimum is reducedsignificantly. The magnitudes of the inverse-reconstructedpotentials (Fig 3, right column) are different (usually smaller)from those of the measured potentials (left column), but thedependence on depth is similar. Note that the shape ofthe reconstructed regions of negativity also matches thoseof the measured regions of negativity, with a quasi-ellipticshape for pacing closer to the epicardium that becomes morecircular for pacing closer to the endocardium. Most impor-tant, the orientation of the computed maxima displays thesame pattern of CCW rotation with depth, as seen in themeasured epicardial potentials, reflecting the fiber orientationat the level of the stimulation site.
Temporal Progression of Potentials for AnteriorEpicardial PacingFig 5 shows the time progression of epicardial potentialdistributions after epicardial pacing. In Fig 3, epicardialpotential distributions were displayed for anterior pacing atdifferent intramural depths. In this figure, the pacing is
Figure 4. Measured torso potentials for anterior pacing sites.Measured body surface potentials for pacing sites at variousdepths along the anteriorly inserted needle of Fig 3. The bodysurface is displayed as two nonoverlapping views: anterior andposterior. Potentials are displayed as contour plots. Positivepotentials are drawn with solid lines (first solid line is the zeroline); negative potentials with dashed lines. Minima are identifiedwith a minus sign (2), and their magnitudes as well as the con-tour intervals are printed (in microvolts) beneath the plots. Max-ima are identified with a plus sign (1). The potentials are plottedfor the same depths (provided to the right of the maps) and atthe same instant in time (13 ms) as those of Fig 3.
Oster et al April 21, 1998 1499
by guest on May 14, 2018
http://circ.ahajournals.org/D
ownloaded from
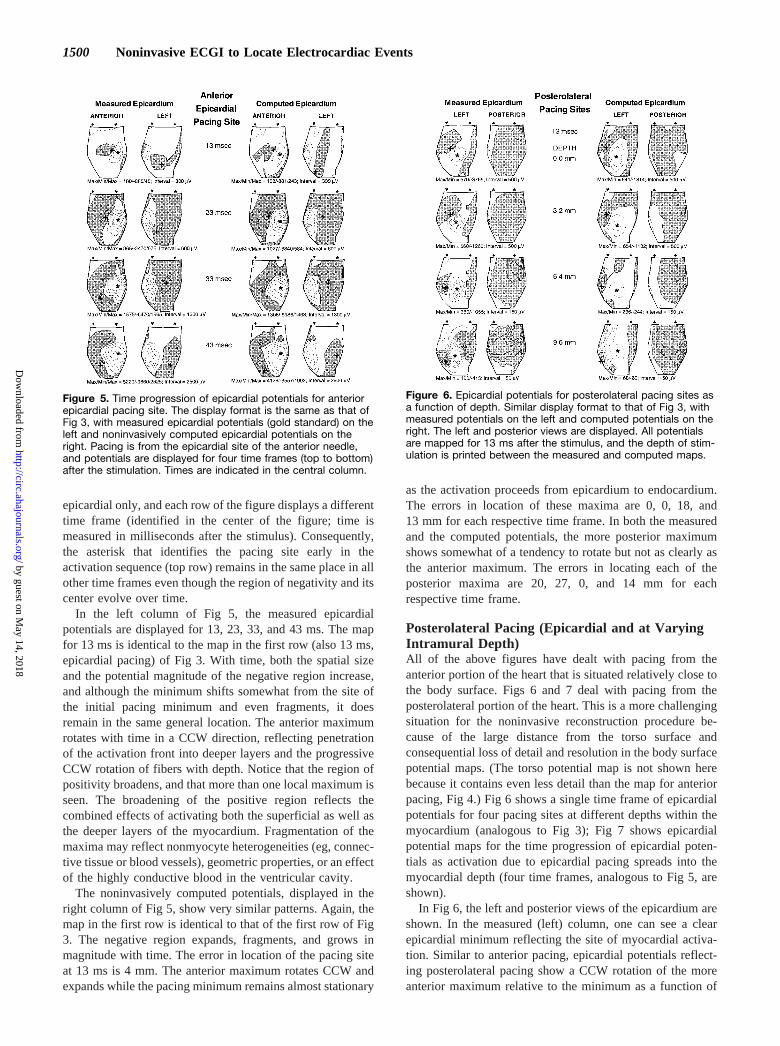
epicardial only, and each row of the figure displays a differenttime frame (identified in the center of the figure; time ismeasured in milliseconds after the stimulus). Consequently,the asterisk that identifies the pacing site early in theactivation sequence (top row) remains in the same place in allother time frames even though the region of negativity and itscenter evolve over time.
In the left column of Fig 5, the measured epicardialpotentials are displayed for 13, 23, 33, and 43 ms. The mapfor 13 ms is identical to the map in the first row (also 13 ms,epicardial pacing) of Fig 3. With time, both the spatial sizeand the potential magnitude of the negative region increase,and although the minimum shifts somewhat from the site ofthe initial pacing minimum and even fragments, it doesremain in the same general location. The anterior maximumrotates with time in a CCW direction, reflecting penetrationof the activation front into deeper layers and the progressiveCCW rotation of fibers with depth. Notice that the region ofpositivity broadens, and that more than one local maximum isseen. The broadening of the positive region reflects thecombined effects of activating both the superficial as well asthe deeper layers of the myocardium. Fragmentation of themaxima may reflect nonmyocyte heterogeneities (eg, connec-tive tissue or blood vessels), geometric properties, or an effectof the highly conductive blood in the ventricular cavity.
The noninvasively computed potentials, displayed in theright column of Fig 5, show very similar patterns. Again, themap in the first row is identical to that of the first row of Fig3. The negative region expands, fragments, and grows inmagnitude with time. The error in location of the pacing siteat 13 ms is 4 mm. The anterior maximum rotates CCW andexpands while the pacing minimum remains almost stationary
as the activation proceeds from epicardium to endocardium.The errors in location of these maxima are 0, 0, 18, and13 mm for each respective time frame. In both the measuredand the computed potentials, the more posterior maximumshows somewhat of a tendency to rotate but not as clearly asthe anterior maximum. The errors in locating each of theposterior maxima are 20, 27, 0, and 14 mm for eachrespective time frame.
Posterolateral Pacing (Epicardial and at VaryingIntramural Depth)All of the above figures have dealt with pacing from theanterior portion of the heart that is situated relatively close tothe body surface. Figs 6 and 7 deal with pacing from theposterolateral portion of the heart. This is a more challengingsituation for the noninvasive reconstruction procedure be-cause of the large distance from the torso surface andconsequential loss of detail and resolution in the body surfacepotential maps. (The torso potential map is not shown herebecause it contains even less detail than the map for anteriorpacing, Fig 4.) Fig 6 shows a single time frame of epicardialpotentials for four pacing sites at different depths within themyocardium (analogous to Fig 3); Fig 7 shows epicardialpotential maps for the time progression of epicardial poten-tials as activation due to epicardial pacing spreads into themyocardial depth (four time frames, analogous to Fig 5, areshown).
In Fig 6, the left and posterior views of the epicardium areshown. In the measured (left) column, one can see a clearepicardial minimum reflecting the site of myocardial activa-tion. Similar to anterior pacing, epicardial potentials reflect-ing posterolateral pacing show a CCW rotation of the moreanterior maximum relative to the minimum as a function of
Figure 5. Time progression of epicardial potentials for anteriorepicardial pacing site. The display format is the same as that ofFig 3, with measured epicardial potentials (gold standard) on theleft and noninvasively computed epicardial potentials on theright. Pacing is from the epicardial site of the anterior needle,and potentials are displayed for four time frames (top to bottom)after the stimulation. Times are indicated in the central column.
Figure 6. Epicardial potentials for posterolateral pacing sites asa function of depth. Similar display format to that of Fig 3, withmeasured potentials on the left and computed potentials on theright. The left and posterior views are displayed. All potentialsare mapped for 13 ms after the stimulus, and the depth of stim-ulation is printed between the measured and computed maps.
1500 Noninvasive ECGI to Locate Electrocardiac Events
by guest on May 14, 2018
http://circ.ahajournals.org/D
ownloaded from
pacing depth. The magnitudes of the extrema decreasemonotonically with depth of pacing. In the computed poten-tials, the center of the quasi-elliptical negative region (aster-isk) is identified for each pacing depth with an error of 6, 6,4, and 9 mm (average, 6.25 mm) for pacing depths of 0, 3.2,6.4, and 9.6 mm, respectively. The more anterior maximum isreconstructed with errors of 12, 12, 16, and 25 mm for eachrespective pacing depth. The more posterior maximum isdifficult to characterize in both the measured and the com-puted epicardial potential maps (except for the maximum inthe measured potentials seen for 9.6-mm depth pacing)because its region of positivity becomes fused with thepositive region associated with right atrial activation.
The magnitudes of the minimum and the anterior maxi-mum decrease monotonically as the pacing site nears theendocardium. This behavior is observed in both the measuredand inverse-computed epicardial potentials.
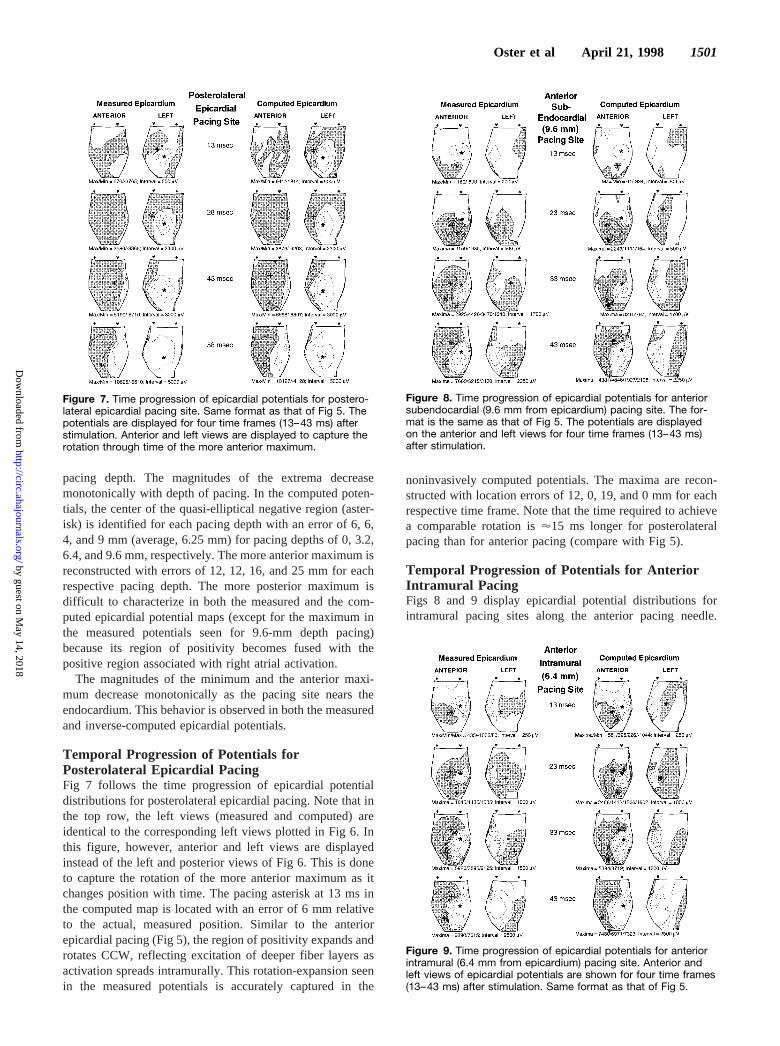
Temporal Progression of Potentials forPosterolateral Epicardial PacingFig 7 follows the time progression of epicardial potentialdistributions for posterolateral epicardial pacing. Note that inthe top row, the left views (measured and computed) areidentical to the corresponding left views plotted in Fig 6. Inthis figure, however, anterior and left views are displayedinstead of the left and posterior views of Fig 6. This is doneto capture the rotation of the more anterior maximum as itchanges position with time. The pacing asterisk at 13 ms inthe computed map is located with an error of 6 mm relativeto the actual, measured position. Similar to the anteriorepicardial pacing (Fig 5), the region of positivity expands androtates CCW, reflecting excitation of deeper fiber layers asactivation spreads intramurally. This rotation-expansion seenin the measured potentials is accurately captured in the
noninvasively computed potentials. The maxima are recon-structed with location errors of 12, 0, 19, and 0 mm for eachrespective time frame. Note that the time required to achievea comparable rotation is'15 ms longer for posterolateralpacing than for anterior pacing (compare with Fig 5).
Temporal Progression of Potentials for AnteriorIntramural PacingFigs 8 and 9 display epicardial potential distributions forintramural pacing sites along the anterior pacing needle.
Figure 7. Time progression of epicardial potentials for postero-lateral epicardial pacing site. Same format as that of Fig 5. Thepotentials are displayed for four time frames (13–43 ms) afterstimulation. Anterior and left views are displayed to capture therotation through time of the more anterior maximum.
Figure 8. Time progression of epicardial potentials for anteriorsubendocardial (9.6 mm from epicardium) pacing site. The for-mat is the same as that of Fig 5. The potentials are displayedon the anterior and left views for four time frames (13–43 ms)after stimulation.
Figure 9. Time progression of epicardial potentials for anteriorintramural (6.4 mm from epicardium) pacing site. Anterior andleft views of epicardial potentials are shown for four time frames(13–43 ms) after stimulation. Same format as that of Fig 5.
Oster et al April 21, 1998 1501
by guest on May 14, 2018
http://circ.ahajournals.org/D
ownloaded from
Pacing in Fig 8 is accomplished from electrodes at a depth of9.6 mm, close to (3.2 mm from) the endocardium. Note thatthe top row of this figure is identical to the bottom row of Fig3. At 13 ms from the pacing stimulus, the maximum is in amostly inferior position. With time, the anterior maximumexpands and fragments as it does in Fig 5 (epicardialactivation), but rotation occurs in a clockwise (CW) ratherthan in a CCW direction, reflecting the CW rotation of fibersas activation spreads mostly from subendocardium to epicar-dium. The pacing site (asterisk) is reconstructed to 2 mmfrom its measured location; the initial anterior maximum isreconstructed in its exact measured location. Note that in thebottom row (43 ms), the most superior maximum, whichreflects the fiber rotation, is also reconstructed in its exactmeasured location. The more posterior region of positivityalso undergoes a CW expansion and rotation, but this is muchless prominent than the expansion/rotation of the anteriorpositive region in both the measured and the reconstructedpotentials. At 23 ms, the anterior maxima are reconstructed26 and 13 mm from their measured locations. Note, however,that the reconstructed inferior maximum (error of 26 mm) isassociated with a secondary maximum located in the exactlocation of the corresponding measured maximum. At 33 ms,although the entire expanded region of positivity is recon-structed, only one individual maximum is seen. It is recon-structed 13 mm from its measured location.
Fig 9 shows the potentials for midwall pacing(6.4 mm2approximately equidistant from both epicardiumand endocardium). The top row of this figure is the same asthe third row of Fig 3. Again, in both the measured andreconstructed epicardial potentials, the maxima expand androtate as they do in Figs 5 and 8, but the rotation here is bothCCW and CW, reflecting fiber rotation in both directionsrelative to the midwall site of pacing. The pacing site isreconstructed to 2 mm of its measured position. At 13 ms, thereconstructed dominant anterior maximum is 16 mm from themeasured dominant anterior maximum; it is in the exactlocation of the secondary maximum seen in the map ofmeasured potentials. Careful inspection of the anterior posi-tive region reveals that both maxima are actually present inboth the measured and computed epicardial maps, suggestingthat at 13 ms, two levels of fibers with sufficiently differentorientations are already activated. At 23 ms, the two mea-sured anterior maxima are reconstructed in their exact loca-tions. An additional maximum is reconstructed as well (justabove the pacing asterisk). At 33 ms, the two anterior maximaare reconstructed at 13 (inferior) and 11 mm from theirmeasured locations and at 43 ms, 11 (inferior) and 0 mm fromtheir measured locations. The 43-ms frame also contains anadditional reconstructed anterior maximum (most inferior)not seen in the measured map.
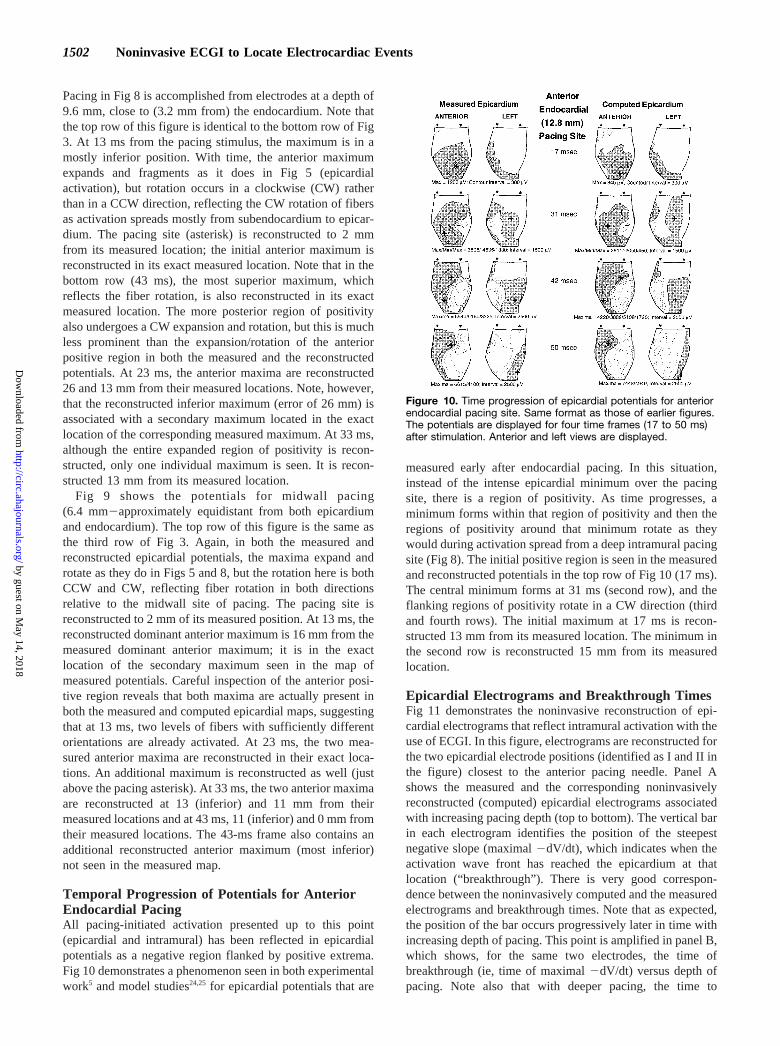
Temporal Progression of Potentials for AnteriorEndocardial PacingAll pacing-initiated activation presented up to this point(epicardial and intramural) has been reflected in epicardialpotentials as a negative region flanked by positive extrema.Fig 10 demonstrates a phenomenon seen in both experimentalwork5 and model studies24,25 for epicardial potentials that are
measured early after endocardial pacing. In this situation,instead of the intense epicardial minimum over the pacingsite, there is a region of positivity. As time progresses, aminimum forms within that region of positivity and then theregions of positivity around that minimum rotate as theywould during activation spread from a deep intramural pacingsite (Fig 8). The initial positive region is seen in the measuredand reconstructed potentials in the top row of Fig 10 (17 ms).The central minimum forms at 31 ms (second row), and theflanking regions of positivity rotate in a CW direction (thirdand fourth rows). The initial maximum at 17 ms is recon-structed 13 mm from its measured location. The minimum inthe second row is reconstructed 15 mm from its measuredlocation.
Epicardial Electrograms and Breakthrough TimesFig 11 demonstrates the noninvasive reconstruction of epi-cardial electrograms that reflect intramural activation with theuse of ECGI. In this figure, electrograms are reconstructed forthe two epicardial electrode positions (identified as I and II inthe figure) closest to the anterior pacing needle. Panel Ashows the measured and the corresponding noninvasivelyreconstructed (computed) epicardial electrograms associatedwith increasing pacing depth (top to bottom). The vertical barin each electrogram identifies the position of the steepestnegative slope (maximal2dV/dt), which indicates when theactivation wave front has reached the epicardium at thatlocation (“breakthrough”). There is very good correspon-dence between the noninvasively computed and the measuredelectrograms and breakthrough times. Note that as expected,the position of the bar occurs progressively later in time withincreasing depth of pacing. This point is amplified in panel B,which shows, for the same two electrodes, the time ofbreakthrough (ie, time of maximal2dV/dt) versus depth ofpacing. Note also that with deeper pacing, the time to
Figure 10. Time progression of epicardial potentials for anteriorendocardial pacing site. Same format as those of earlier figures.The potentials are displayed for four time frames (17 to 50 ms)after stimulation. Anterior and left views are displayed.
1502 Noninvasive ECGI to Locate Electrocardiac Events
by guest on May 14, 2018
http://circ.ahajournals.org/D
ownloaded from
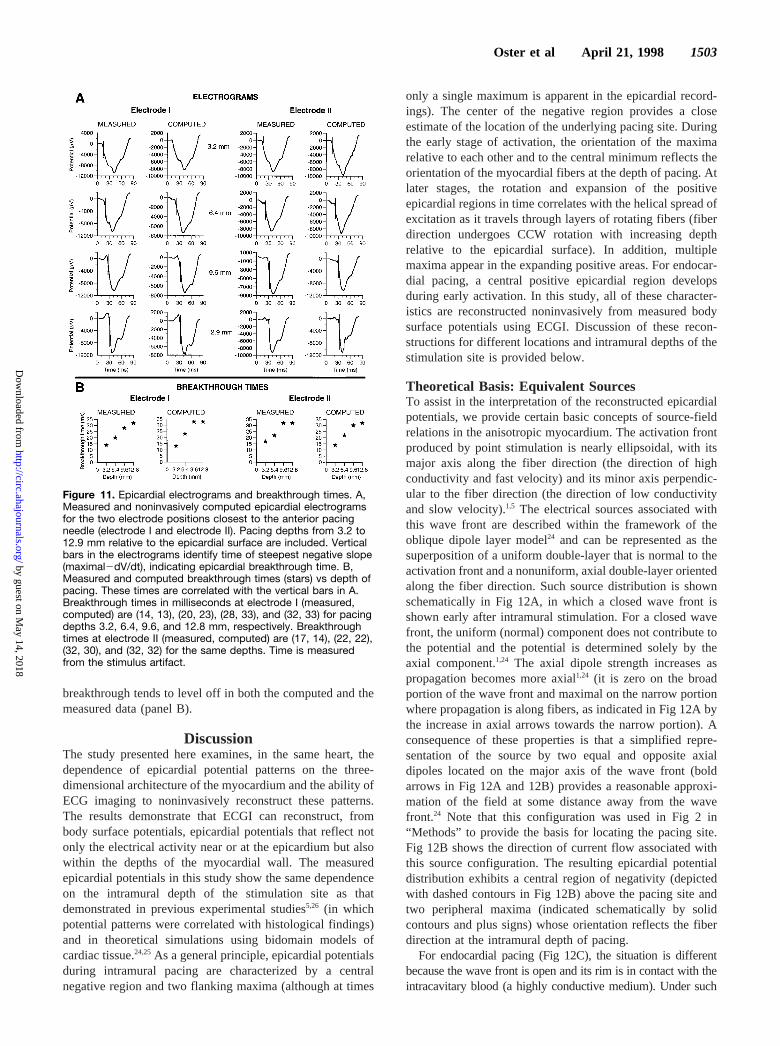
breakthrough tends to level off in both the computed and themeasured data (panel B).
DiscussionThe study presented here examines, in the same heart, thedependence of epicardial potential patterns on the three-dimensional architecture of the myocardium and the ability ofECG imaging to noninvasively reconstruct these patterns.The results demonstrate that ECGI can reconstruct, frombody surface potentials, epicardial potentials that reflect notonly the electrical activity near or at the epicardium but alsowithin the depths of the myocardial wall. The measuredepicardial potentials in this study show the same dependenceon the intramural depth of the stimulation site as thatdemonstrated in previous experimental studies5,26 (in whichpotential patterns were correlated with histological findings)and in theoretical simulations using bidomain models ofcardiac tissue.24,25As a general principle, epicardial potentialsduring intramural pacing are characterized by a centralnegative region and two flanking maxima (although at times
only a single maximum is apparent in the epicardial record-ings). The center of the negative region provides a closeestimate of the location of the underlying pacing site. Duringthe early stage of activation, the orientation of the maximarelative to each other and to the central minimum reflects theorientation of the myocardial fibers at the depth of pacing. Atlater stages, the rotation and expansion of the positiveepicardial regions in time correlates with the helical spread ofexcitation as it travels through layers of rotating fibers (fiberdirection undergoes CCW rotation with increasing depthrelative to the epicardial surface). In addition, multiplemaxima appear in the expanding positive areas. For endocar-dial pacing, a central positive epicardial region developsduring early activation. In this study, all of these character-istics are reconstructed noninvasively from measured bodysurface potentials using ECGI. Discussion of these recon-structions for different locations and intramural depths of thestimulation site is provided below.
Theoretical Basis: Equivalent SourcesTo assist in the interpretation of the reconstructed epicardialpotentials, we provide certain basic concepts of source-fieldrelations in the anisotropic myocardium. The activation frontproduced by point stimulation is nearly ellipsoidal, with itsmajor axis along the fiber direction (the direction of highconductivity and fast velocity) and its minor axis perpendic-ular to the fiber direction (the direction of low conductivityand slow velocity).1,5 The electrical sources associated withthis wave front are described within the framework of theoblique dipole layer model24 and can be represented as thesuperposition of a uniform double-layer that is normal to theactivation front and a nonuniform, axial double-layer orientedalong the fiber direction. Such source distribution is shownschematically in Fig 12A, in which a closed wave front isshown early after intramural stimulation. For a closed wavefront, the uniform (normal) component does not contribute tothe potential and the potential is determined solely by theaxial component.1,24 The axial dipole strength increases aspropagation becomes more axial1,24 (it is zero on the broadportion of the wave front and maximal on the narrow portionwhere propagation is along fibers, as indicated in Fig 12A bythe increase in axial arrows towards the narrow portion). Aconsequence of these properties is that a simplified repre-sentation of the source by two equal and opposite axialdipoles located on the major axis of the wave front (boldarrows in Fig 12A and 12B) provides a reasonable approxi-mation of the field at some distance away from the wavefront.24 Note that this configuration was used in Fig 2 in“Methods” to provide the basis for locating the pacing site.Fig 12B shows the direction of current flow associated withthis source configuration. The resulting epicardial potentialdistribution exhibits a central region of negativity (depictedwith dashed contours in Fig 12B) above the pacing site andtwo peripheral maxima (indicated schematically by solidcontours and plus signs) whose orientation reflects the fiberdirection at the intramural depth of pacing.
For endocardial pacing (Fig 12C), the situation is differentbecause the wave front is open and its rim is in contact with theintracavitary blood (a highly conductive medium). Under such
Figure 11. Epicardial electrograms and breakthrough times. A,Measured and noninvasively computed epicardial electrogramsfor the two electrode positions closest to the anterior pacingneedle (electrode I and electrode II). Pacing depths from 3.2 to12.9 mm relative to the epicardial surface are included. Verticalbars in the electrograms identify time of steepest negative slope(maximal2dV/dt), indicating epicardial breakthrough time. B,Measured and computed breakthrough times (stars) vs depth ofpacing. These times are correlated with the vertical bars in A.Breakthrough times in milliseconds at electrode I (measured,computed) are (14, 13), (20, 23), (28, 33), and (32, 33) for pacingdepths 3.2, 6.4, 9.6, and 12.8 mm, respectively. Breakthroughtimes at electrode II (measured, computed) are (17, 14), (22, 22),(32, 30), and (32, 32) for the same depths. Time is measuredfrom the stimulus artifact.
Oster et al April 21, 1998 1503
by guest on May 14, 2018
http://circ.ahajournals.org/D
ownloaded from
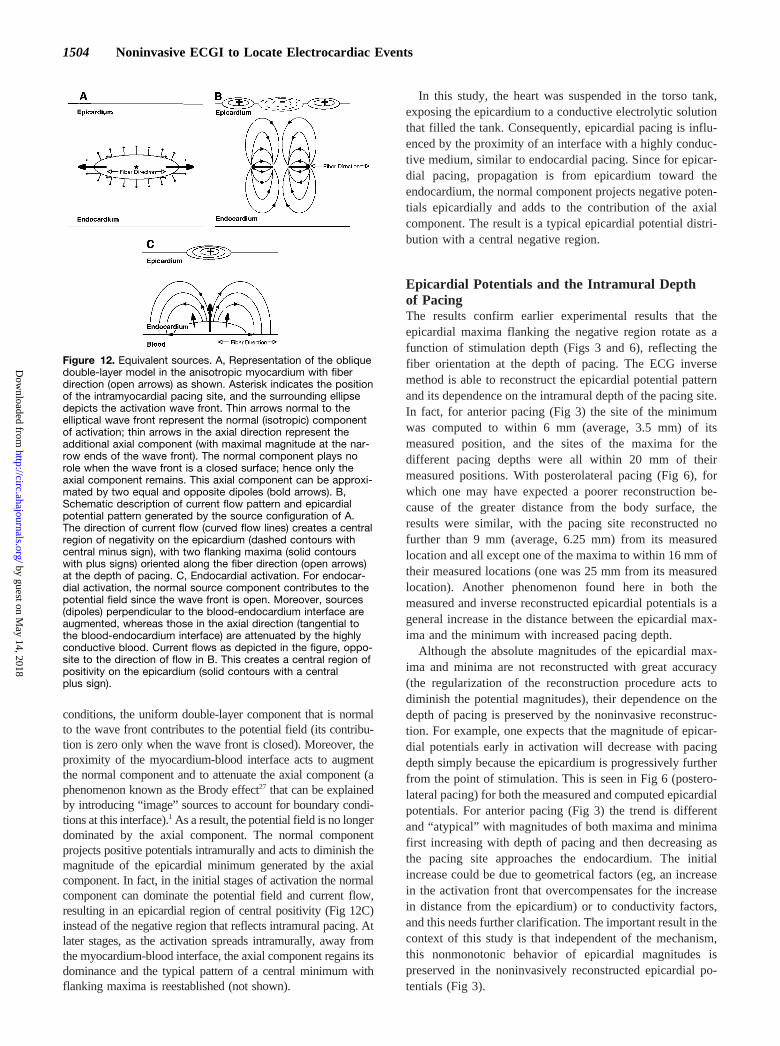
conditions, the uniform double-layer component that is normalto the wave front contributes to the potential field (its contribu-tion is zero only when the wave front is closed). Moreover, theproximity of the myocardium-blood interface acts to augmentthe normal component and to attenuate the axial component (aphenomenon known as the Brody effect27 that can be explainedby introducing “image” sources to account for boundary condi-tions at this interface).1 As a result, the potential field is no longerdominated by the axial component. The normal componentprojects positive potentials intramurally and acts to diminish themagnitude of the epicardial minimum generated by the axialcomponent. In fact, in the initial stages of activation the normalcomponent can dominate the potential field and current flow,resulting in an epicardial region of central positivity (Fig 12C)instead of the negative region that reflects intramural pacing. Atlater stages, as the activation spreads intramurally, away fromthe myocardium-blood interface, the axial component regains itsdominance and the typical pattern of a central minimum withflanking maxima is reestablished (not shown).
In this study, the heart was suspended in the torso tank,exposing the epicardium to a conductive electrolytic solutionthat filled the tank. Consequently, epicardial pacing is influ-enced by the proximity of an interface with a highly conduc-tive medium, similar to endocardial pacing. Since for epicar-dial pacing, propagation is from epicardium toward theendocardium, the normal component projects negative poten-tials epicardially and adds to the contribution of the axialcomponent. The result is a typical epicardial potential distri-bution with a central negative region.
Epicardial Potentials and the Intramural Depthof PacingThe results confirm earlier experimental results that theepicardial maxima flanking the negative region rotate as afunction of stimulation depth (Figs 3 and 6), reflecting thefiber orientation at the depth of pacing. The ECG inversemethod is able to reconstruct the epicardial potential patternand its dependence on the intramural depth of the pacing site.In fact, for anterior pacing (Fig 3) the site of the minimumwas computed to within 6 mm (average, 3.5 mm) of itsmeasured position, and the sites of the maxima for thedifferent pacing depths were all within 20 mm of theirmeasured positions. With posterolateral pacing (Fig 6), forwhich one may have expected a poorer reconstruction be-cause of the greater distance from the body surface, theresults were similar, with the pacing site reconstructed nofurther than 9 mm (average, 6.25 mm) from its measuredlocation and all except one of the maxima to within 16 mm oftheir measured locations (one was 25 mm from its measuredlocation). Another phenomenon found here in both themeasured and inverse reconstructed epicardial potentials is ageneral increase in the distance between the epicardial max-ima and the minimum with increased pacing depth.
Although the absolute magnitudes of the epicardial max-ima and minima are not reconstructed with great accuracy(the regularization of the reconstruction procedure acts todiminish the potential magnitudes), their dependence on thedepth of pacing is preserved by the noninvasive reconstruc-tion. For example, one expects that the magnitude of epicar-dial potentials early in activation will decrease with pacingdepth simply because the epicardium is progressively furtherfrom the point of stimulation. This is seen in Fig 6 (postero-lateral pacing) for both the measured and computed epicardialpotentials. For anterior pacing (Fig 3) the trend is differentand “atypical” with magnitudes of both maxima and minimafirst increasing with depth of pacing and then decreasing asthe pacing site approaches the endocardium. The initialincrease could be due to geometrical factors (eg, an increasein the activation front that overcompensates for the increasein distance from the epicardium) or to conductivity factors,and this needs further clarification. The important result in thecontext of this study is that independent of the mechanism,this nonmonotonic behavior of epicardial magnitudes ispreserved in the noninvasively reconstructed epicardial po-tentials (Fig 3).
Figure 12. Equivalent sources. A, Representation of the obliquedouble-layer model in the anisotropic myocardium with fiberdirection (open arrows) as shown. Asterisk indicates the positionof the intramyocardial pacing site, and the surrounding ellipsedepicts the activation wave front. Thin arrows normal to theelliptical wave front represent the normal (isotropic) componentof activation; thin arrows in the axial direction represent theadditional axial component (with maximal magnitude at the nar-row ends of the wave front). The normal component plays norole when the wave front is a closed surface; hence only theaxial component remains. This axial component can be approxi-mated by two equal and opposite dipoles (bold arrows). B,Schematic description of current flow pattern and epicardialpotential pattern generated by the source configuration of A.The direction of current flow (curved flow lines) creates a centralregion of negativity on the epicardium (dashed contours withcentral minus sign), with two flanking maxima (solid contourswith plus signs) oriented along the fiber direction (open arrows)at the depth of pacing. C, Endocardial activation. For endocar-dial activation, the normal source component contributes to thepotential field since the wave front is open. Moreover, sources(dipoles) perpendicular to the blood-endocardium interface areaugmented, whereas those in the axial direction (tangential tothe blood-endocardium interface) are attenuated by the highlyconductive blood. Current flows as depicted in the figure, oppo-site to the direction of flow in B. This creates a central region ofpositivity on the epicardium (solid contours with a centralplus sign).
1504 Noninvasive ECGI to Locate Electrocardiac Events
by guest on May 14, 2018
http://circ.ahajournals.org/D
ownloaded from
Temporal Evolution of Epicardial PotentialsReflects Intramural Spread of theActivation FrontThe rotation of the epicardial potential maxima with time(Figs 5 and 7 to 10) is clearly observed in the measuredepicardial potentials and is correctly reproduced in the non-invasively computed epicardial potentials. For the case ofepicardial pacing (Figs 5 and 7), the regions of epicardialpositivity grow and the maxima rotate in the CCW directionas the activation front penetrates into deeper myocardiallayers, reflecting the CCW rotation of fibers with depth.5 Foranterior epicardial pacing (Fig 5), the anterior maximumspreads out and actually fragments by 43 ms. This fragmen-tation is captured in the noninvasively computed potentials aswell and is consistent with earlier experimental findings.5 Thereason for maxima fragmentation needs further clarification.It is possible that the main anterior maximum, identified by aplus sign, reflects activation of deeper layers, whereas theother maximum reflects continued activation of layers closerto the epicardium. However, this hypothesis is not supportedby theoretical simulations that reproduce the expansion ofpositive epicardial regions in time but not the maximafragmentation.24 More recent theoretical simulations, per-formed in our laboratory, reproduce the fragmentation ofepicardial maxima as activation spreads intramurally.25 Themodel used in these simulations is a bidomain model ofventricular activation in a whole heart that contains theintracavitary blood and represents the variable thickness ofthe ventricular wall (ie, tapering from base to apex). Withoutthe blood and tapering, the regions of positivity expandsmoothly, without fragmentation. This suggests a role for theintracavitary blood and for the myocardial tapering in themaxima fragmentation. Other anatomic factors can play a rolein the fragmentation of the epicardial maxima, includingdiscontinuities introduced by connective tissue septa or by thepresence of blood vessels in the wall. As stated above,determination of the contribution of these various factors tothe appearance of multiple epicardial maxima awaits furtherexperimental and theoretical investigation. For subendocar-dial pacing (Fig 8), the epicardial maxima rotate in a CWdirection, reflecting the CW rotation of the fibers as theactivation front propagates from endocardium toward theepicardium. For midwall pacing (Fig 9), the wave frontpropagates both toward the epicardium and toward theendocardium. This results in a “double rotation” of theepicardial maxima in both CW and CCW directions, reflect-ing CW rotation of the fibers from midwall to epicardium andCCW rotation of the fibers from midwall to endocardium.Importantly, these dynamic patterns are well reconstructednoninvasively from the torso potential data, and the temporalprogression of the computed and measured epicardial poten-tials is very similar. Endocardial pacing (Fig 10) generates asomewhat different epicardial potential distribution than mid-wall or epicardial pacing. Instead of the typical minimumover the pacing site, an early potential maximum develops.As discussed in the beginning of this section (Fig 12 andrelated text), this is a consequence of the intracavitary bloodand its effect on the pattern of current flow generated by thenearby activation front. As the activation front propagates
away from the endocardium, an intense minimum developswithin this positive epicardial region (Fig 10, 31 ms) and thenewly formed flanking maxima rotate in a CW direction asexpected. Again, this temporal progression is faithfully re-constructed in the noninvasively computed epicardial poten-tials. Temporal epicardial electrograms (Fig 11) are alsofaithfully reconstructed from the body surface data. Onenotices not only the progressively later time of breakthroughfor increasing depth of pacing (vertical bars in panel A andstars in panel B) but also that this progression is not linear andlevels off as the pacing site nears the endocardium. Thisphenomenon is apparent in both the computed and themeasured breakthrough times and has been seen in otherstudies of measured epicardial electrograms for various pac-ing depths.28 It seems to indicate that there is faster transmuralwave front propagation closer to the endocardium than in themore superficial layers. The reason for this behavior is notentirely clear and requires future investigation; however, itmight reflect greater obliqueness of myocardial fibers inlayers close to the endocardium.23
Significance of the StudyIn a previous study, we demonstrated the ability of ECGIto reconstruct epicardial potentials, electrograms, andisochrones noninvasively from measured body surfacepotential data.12 The earlier study was limited to epicardialpacing and epicardial activation. The present study extendsthe approach to electrical events in the depth of theventricular wall. As discussed above, epicardial potentialsduring ectopic focal excitation reflect the direction ofmyocardial fibers through which excitation is spreading.Taking advantage of this relation, the noninvasively recon-structed epicardial potentials can be used to characterizeactivity in the depth of the myocardium. As demonstratedin this study, the center of the epicardial region ofnegativity in the early stages of activation provides thelocation of the focal activation site, whereas the orientationof the potential maxima reflects the fiber orientation at theintramural depth of this site. Consequently, from the recon-structed epicardial potential pattern together with knowledge ofthe fiber orientation pattern across the ventricular wall it ispossible to estimate, noninvasively, the location and depth of asite (or sites) of ectopic activity and of initial myocardialactivation. The results also demonstrate that noninvasive ECGIcan provide information on the transmural spread of excitationby reconstructing the rotation of epicardial maxima that reflectspropagation across the wall. CCW rotation reflects epicardial-endocardial spread, CW rotation reflects endocardial-epicardialspread, and the presence of both CCW and CW rotationindicates helical spread in both transmural directions. Thistemporal evolution of the reconstructed epicardial potentialsprovides another clue to the depth of initial activation: PureCCW rotation implies that the initiation site is close to theepicardium; CW rotation only (or an initial epicardial maximumfollowed by the development of a minimum with flankingmaxima that then rotate CW) implies that the site is close to theendocardium; and double rotation in both CCW and CWdirections indicates that the site is intramural. In addition, thetime of epicardial activation (breakthrough) as detected in the
Oster et al April 21, 1998 1505
by guest on May 14, 2018
http://circ.ahajournals.org/D
ownloaded from
temporal electrograms (Fig 11) also provides an indication of thepacing depth.
The ability to estimate the locations and depths of sites ofinitial activation suggests a potential use of noninvasiveECGI in guiding interventional procedures (eg, ablation). Itsability to obtain information on the transmural spread ofactivation in a noninvasive fashion is also of potential clinicalimportance because in general arrhythmogenic reentrant ac-tivity can involve three-dimensional transmural propaga-tion,14 and the reentry pathway is not confined to theepicardial or endocardial surfaces of the ventricular wall. Theresults reported in this study were obtained with the use ofnormal hearts in the absence of structural heart disease. In thenext stage of development, ECGI will be evaluated in termsof its ability to reconstruct potentials, electrograms, andisochrones in the presence of infarction and during reentrantventricular tachyarrhythmias.
The inverse procedure requires knowledge of the heart-torso geometry. In the experimental torso tank setup, the heartis accessible so that the geometry of the epicardium and of thetorso surface (including body surface electrode positions) canbe measured directly. In the clinical setting, this informationmust be obtained noninvasively. In preparation for the clini-cal implementation of ECGI, we have begun development ofa computed tomographic –based method that noninvasivelydetermines both the body surface electrode positions and anepicardial envelope that closely encloses the heart.29 Simplerimaging modalities (eg, radiography in combination withechocardiography) will be investigated as well. The samenoninvasive imaging methods could provide information onthe geometry of internal torso structures (inhomogeneities,eg, lungs) that affect the electric field. This will permit us toincorporate such effects into the ECGI reconstruction proce-dure.30 It should be noted, however, that previous studies2,31
have indicated that torso inhomogeneities affect only epicar-dial potential magnitudes and not the potential patterns or thesequences of epicardial activation (isochrones). In addition tononinvasive determination of geometry, clinical applicationof ECGI will benefit from computational efficiency thatreconstructs epicardial potentials in close to real time. Wehave optimized our computational scheme to the point whereit now runs on a local workstation (instead of a CRAYsupercomputer). After initial general computation that re-quires'1 minute, each epicardial map (single time frame)can be computed in'60 ms.
The principle that noninvasive ECGI can provide informa-tion on intramural electrical processes is not limited tomyocardial activation. Intramural repolarization processes arealso reflected in epicardial potentials that can be recon-structed noninvasively from body surface potential data. Thisis an important property because nonuniformities of repolar-ization are associated with the development of cardiac ar-rhythmias. Intramural nonuniformity of repolarization canresult from various physiological and pathophysiologicalconditions. One example is the recently discovered presenceof transmural heterogeneity of cellular electrical proper-ties.16,17 Importantly, a unique population of midmyocardialcells (M-cells) has been described and is characterized by alonger action potential duration (APD) than epicardial or
endocardial cells. M-cell APD prolongs much more uponreduction in rate (eg, bradycardia or after a pause), inresponse to class III antiarrhythmic drug application, andpossibly due to ion-channel mutations associated with thelong QT syndrome.17,32,33 Because epicardial potentials aredetermined by the intramural spatial gradients of the trans-membrane potential,1 such APD heterogeneities are reflectedin the epicardial potential distribution. By reconstructing theepicardial potentials using ECGI, such heterogeneities couldbe evaluated noninvasively. It is well established that hetero-geneity of APD (or “dispersion of repolarization”) createsconditions for the development of unidirectional block andreentry and that the risk of arrhythmogenesis is related to thedegree of intramural heterogeneity. The ability to obtain,noninvasively, information on intramural heterogeneity couldprovide a basis for identifying patients at risk and forevaluating the effects of interventions (eg, antiarrhythmicdrug treatment) on the degree of heterogeneity and theconsequential vulnerability to arrhythmogenesis.
Similar to the potential clinical usefulness of noninvasiveECGI in the context of intramural activity, one can envisionits potential as an experimental tool for the study of cardiacexcitation and arrhythmias that involve deep myocardiallayers. This could include studies of intramural focal arrhyth-mias or transmural reentry in the nonanesthetized, intactanimal under physiological conditions. It could also be usedfor noninvasive studies of arrhythmogenic activity that in-volve intramural excitation in patients, in whom mechanismsand characteristics of arrhythmias might be very differentfrom those in animal models, or where adequate animalmodels do not exist.
AcknowledgmentsThis study was supported by NIH-NHLBI grants HL-33343 andHL-49054 (Dr Rudy) and HL-43276 (Dr Taccardi). Additionalsupport was provided by awards from the Nora Eccles TreadwellFoundation and the Richard A. and Nora Eccles Harrison Fund forCardiovascular Research. We thank Yonild Vyhmeister, BS, for herassistance with the experiments.
References1. Rudy Y. The electrocardiogram and its relationship to excitation of the
heart. In: Sperelakis N, ed.Physiology and Pathophysiology of the Heart.Boston, Mass: Kluwer Academic Publishers; 1995:210–239.
2. Rudy Y, Plonsey R. A comparison of volume conductor and sourcegeometry effects on body surface and epicardial potentials.Circ Res.1980;46:283–291.
3. Arisi G, Macchi E, Baruffi S, Spaggiari S, Taccardi B. Potential fields onthe ventricular surface of the exposed dog heart during normal excitation.Circ Res. 1983;52:706–715.
4. Spach MS, Barr RC. Analysis of ventricular activation and repolarizationfrom intramural and epicardial potential distributions for ectopic beats inthe intact dog.Circ Res. 1975;37:830–843.
5. Taccardi B, Macchi E, Lux RL, Ershler PR, Spaggiari S, Baruffi S,Vyhmeister Y. Effect of myocardial fiber direction on epicardialpotentials.Circulation. 1994;90:3076–3090.
6. Barr RC, Spach MS. Inverse calculation of QRS-T epicardial potentialsfrom body surface potential distributions for normal and ectopic beats inthe intact dog.Circ Res. 1978;42:661–675.
7. Colli Franzone P, Guerri L, Tentoni S, Viganotti C, Baruffi S, SpaggiariS, Taccardi B. Mathematical procedure for solving the inverse problem ofelectrocardiography.Math Biosci. 1985;77:353–396.
8. Messinger Rapport BJ, Rudy Y. Noninvasive recovery of epicardialpotentials in a realistic heart-torso geometry: normal sinus rhythm.CircRes. 1990;66:1023–1039.
1506 Noninvasive ECGI to Locate Electrocardiac Events
by guest on May 14, 2018
http://circ.ahajournals.org/D
ownloaded from
9. Rudy Y, Messinger Rapport BJ. The inverse problem in electrocardiog-raphy: solutions in terms of epicardial potentials.Crit Rev Biomed Eng.1988;16:215–268.
10. Oster HS, Rudy Y. The use of temporal information in the regularizationof the inverse problem of electrocardiography.IEEE Trans Biomed Eng.1992;39:65–75.
11. Huiskamp G, van Oosterom A. The depolarization sequence of the humanheart surface computed from measured body surface potentials.IEEETrans Biomed Eng. 1988;35:1047–1058.
12. Oster HS, Taccardi B, Lux RL, Ershler PR, Rudy Y. Noninvasive elec-trocardiographic imaging: reconstruction of epicardial potentials, elec-trograms, and isochrones and localization of single and multiple electro-cardiac events.Circulation. 1997;96:1012–1024.
13. Durrer D, Van Dam RT, Freud GE, Janse MJ, Meijler FL, ArzbaecherRC. Total excitation of the isolated human heart.Circulation. 1970;41:899–912.
14. Pogwizd SM, Hoyt RH, Saffitz JE, Corr PB, Cox JL, Cain ME. Reentrantand focal mechanisms underlying ventricular tachycardia in the humanheart.Circulation. 1992;86:1872–1887.
15. El Sherif N, Caref EB, Yin H, Restivo M. The electrophysiologicalmechanism of ventricular arrhythmias in the long QT syndrome: tridi-mensional mapping of activation and recovery patterns.Circ Res. 1996;79:474–492.
16. Antzelevitch C, Sicouri S, Litovsky SH, Lukas A, Krishnan SC, Di DiegoJM, Gintant GA, Liu DW. Heterogeneity within the ventricular wall:electrophysiology and pharmacology of epicardial, endocardial, and Mcells.Circ Res. 1991;69:1427–1449.
17. Antzelevitch C, Sicouri S, Lukas A, Nesterenko VV, Liu DW, Di DiegoJM. Regional differences in the electrophysiology of ventricular cells:physiological and clinical implications. In: Zipes DP, Jalife J, eds.Cardiac Electrophysiology: From Cell to Bedside.Philadelphia, Pa: WBSaunders Co; 1995:228–245.
18. Messinger Rapport BJ, Rudy Y. Computational issues of importance tothe inverse recovery of epicardial potentials in a realistic heart-torsogeometry [published erratum appears inMath Biosci1990;99:141].MathBiosci. 1989;97:85–120.
19. Messinger Rapport BJ, Rudy Y. Regularization of the inverse problem inelectrocardiography: a model study.Math Biosci. 1988;89:79–118.
20. Rudy Y, Oster HS. The electrocardiographic inverse problem.Crit RevBiomed Eng. 1992;20:25–45.
21. Khoury DS, Taccardi B, Lux RL, Ershler PR, Rudy Y. Reconstruction ofendocardial potentials and activation sequences from intracavitary probe
measurements: localization of pacing sites and effects of myocardialstructure.Circulation. 1995;91:845–863.
22. Liu ZW, Jia P, Ershler PR, Taccardi B, Lux RL, Khoury DS, Rudy Y.Noncontact endocardial mapping: reconstruction of electrograms andisochrones from intracavitary probe potentials.J Cardiovasc Electro-physiol. 1997;8:415–431.
23. Streeter DD, Sputnitz HM, Patel DP, Ross J, Sonnenblick EH. Fiberorientation in the canine left ventricle during diastole and systole.CircRes. 1969;26:339–347.
24. Colli Franzone P, Guerri L, Taccardi B. Potential distributions generatedby point stimulation in a myocardial volume: simulation studies in amodel of anisotropic ventricular muscle.J Cardiovasc Electrophysiol.1993;4:438–458.
25. Kavuru MS.The Forward Problem of Electrocardiography: VentricularModel With Rotational Anisotropy.Cleveland, Ohio: Department of Bio-medical Engineering, Case Western Reserve University. 1995.
26. Watabe S, Taccardi B, Lux RL, Ershler PR. Effect of nontransmuralnecrosis on epicardial potential fields: correlation with fiber direction.Circulation. 1990;82:2115–2127.
27. Brody DA. A theoretical analysis of intracavitary blood mass influence onthe heart lead relationship.Circ Res. 1956;4:731.
28. Burgess MJ, Lux RL, Ershler PR, Menlove R. Determination oftransmural location of onset of activation from cardiac surface elec-trograms.Circulation. 1990;82:1335–1342.
29. Kaelber D, Haaga J, Rudy Y. Noninvasive in vivo determination of bodysurface and epicardial geometries for electrocardiographic imaging.IEEE/EMBS 16th annual international conference 1994;16:153–154.
30. Messinger Rapport BJ, Rudy Y. The inverse problem in electrocardiog-raphy: a model study of the effects of geometry and conductivity param-eters on the reconstruction of epicardial potentials.IEEE Trans BiomedEng. 1986;33:667–676.
31. Green LS, Taccardi B, Ershler PR, Lux RL. Epicardial potential mapping:effects of conducting media on isopotential and isochrone distributions.Circulation. 1991;84:2513–2521.
32. Viswanathan PC, Shaw RM, Rudy Y. Transmural heterogeneity of ven-tricular action potentials: mechanism and rate dependence. AmericanHeart Association 69th Scientific Sessions.Circulation. 1996;94:I-712.
33. Viswanathan PC, Rudy Y. Differential sensitivity of ventricular cell typesto class III antiarrhythmic agents. Biophysical Society 41st AnnualMeeting.Biophys J.1997;72:A48.
Oster et al April 21, 1998 1507
by guest on May 14, 2018
http://circ.ahajournals.org/D
ownloaded from
Howard S. Oster, Bruno Taccardi, Robert L. Lux, Philip R. Ershler and Yoram RudyActivation From Inverse-Reconstructed Epicardial Potentials and Electrograms
Electrocardiographic Imaging: Noninvasive Characterization of Intramural Myocardial
Print ISSN: 0009-7322. Online ISSN: 1524-4539 Copyright © 1998 American Heart Association, Inc. All rights reserved.
is published by the American Heart Association, 7272 Greenville Avenue, Dallas, TX 75231Circulation doi: 10.1161/01.CIR.97.15.1496
1998;97:1496-1507Circulation.
http://circ.ahajournals.org/content/97/15/1496World Wide Web at:
The online version of this article, along with updated information and services, is located on the
http://circ.ahajournals.org//subscriptions/
is online at: Circulation Information about subscribing to Subscriptions:
http://www.lww.com/reprints Information about reprints can be found online at: Reprints:
document. Permissions and Rights Question and Answer this process is available in the
click Request Permissions in the middle column of the Web page under Services. Further information aboutOffice. Once the online version of the published article for which permission is being requested is located,
can be obtained via RightsLink, a service of the Copyright Clearance Center, not the EditorialCirculationin Requests for permissions to reproduce figures, tables, or portions of articles originally publishedPermissions:
by guest on May 14, 2018
http://circ.ahajournals.org/D
ownloaded from