Embed Size (px)
Citation preview

Nondestructive testing of open microscopic cracksin plasma-sprayed-coatings using ultrasound excited
vibrothermography
JEAN-MARC PIAU†*, ABDELHAKIM BENDADA†, XAVIER MALDAGUE† and
JEAN-GABRIEL LEGOUX‡
†Computer Vision and Systems Laboratory, Laval University, Quebec City, Quebec, Canada, G1K 7P4‡Research Officer, Surface Technologies, NRC Industrial Materials Institute (IMI), National Research
Council of Canada (NRC), 75 de Mortagne Boulevard, Boucherville, Quebec, Canada, J4B 6Y4
(Received 6 June 2007; in final form 7 November 2007)
While other nondestructive testing methods hardly reveal microscopic open cracks, vibrothermographystimulated by ultrasound provides very promising results by converting mechanical waves into local heatby friction. This phenomenon enhances thermal gradients in temperature maps as compared toconventional techniques. To detect temperature gradients caused by hidden cracks, high thermal andspatial resolution infrared cameras are usually used. The aim of this work is to investigate the ability ofthe vibrothermography stimulated by ultrasound to detect such cracks and measure the gap betweenadjacent cracks. To do so, we investigated tungsten carbide coatings where cracks were artificiallygenerated using a controlled bending test. Several samples were investigated during this study but onlytypical results from one sample are presented and discussed.
Keywords: Nondestructive evaluation; Ultrasound excited vibrothermography; Microscopic open cracks
1. Introduction
Recently, it has been shown that the high velocity oxy fuel (HVOF) spraying of tungsten
carbide or cobalt coatings onto steel substrates seems to be a suitable alternative to the non-
environmentally friendly chromium coating material. However one major issue with these
plasma-sprayed-coatings is the possibility of the appearance of open microscopic cracks
when they are submitted to excessive bending loads. For clarity reasons, it should be pointed
out here that an open crack is a surface breaking crack. If the open cracks spread through the
whole coating thickness, crack propagation to the coating–substrate interface might cause
the coating to delaminate in between adjacent open cracks. The latter disbonding
phenomenon is therefore strongly dependent on the distance between adjacent open cracks.
Therefore, a nondestructive technique enabling the detection of cracks and the evolution of
their density is critical to preserve the components integrity.
Nondestructive Testing and Evaluation
ISSN 1058-9759 print/ISSN 1477-2671 online q 2008 Taylor & Francis
http://www.tandf.co.uk/journals
DOI: 10.1080/10589750701775817
*Corresponding author. Email: [email protected]
Nondestructive Testing and Evaluation,Vol. 23, No. 2, June 2008, 109–120
Downloaded By: [Bendada, Abdelhakim][Canadian Research Knowledge Network] At: 16:10 19 November 2010

In this paper, we present an application to detect microscopic open cracks using an
ultrasound vibrothermography (UVT) detection technique. UVT is also known as
thermosonics, or ultrasound thermography, and relies on the conversion of mechanical
elastic waves into heat. Ultrasonic waves travel freely through homogeneous materials,
whereas inhomogeneities produce complex combinations of absorptions, scatterings, beam
spreading and dispersions of the waves, whose principal manifestation will be in the form of
a heat source. More physically, the main mechanisms involved are due to thermoelasticity,
viscoelasticity and friction (Meyendorf et al. 2002). So, inhomogeneities are mainly
considered as defects in a structure. They thus convert elastic waves into a heat source,
yielding a precise heat localisation. Heat locally released propagates by conduction toward
the surface where it can be mapped spatially and time wise with an infrared camera. Figure 1
presents the standard UVT setup used. Ultrasound frequency range allows the stress level to
be reduced with sufficient detectable thermal energy as compared to the stress pattern
analysis by thermal emission (SPATE) technique (Harwood and Cummings 1991).
Ultrasounds are not audible to humans, however lower frequencies appear due to the non
linear effect at the ultrasound injection point (Solodov 1998; Han et al. 2002). Microscopic
open cracks, created by bending tests to accelerate the aging process, corrupt the coating
integrity by forming discontinuities. These discontinuities can be described as a fracture of
two edges starting from the surface; some might propagate down to the steel interface. At rest,
when the bending load is removed, cracks tend to close up thus rubbing or clapping of
fracture edges is likely to happen under ultrasonic stimulation.
2. Experimentation setup
The ultrasound source used for the experimentation is derived from an industrial plastic
welder unit modified to generate elastic waves from 15 to 25 kHz. As shown in figure 2, an
electrical signal generated from the controller feeds the piezo. A booster is screwed onto the
piezo’s end to concentrate the ultrasound wave to a surface of 30 mm in diameter. Home-
made software has been developed to generate customised electrical waveforms.
Figure 1. Ultrasound vibrothermography setup.
J.-M. Piau et al.110
Downloaded By: [Bendada, Abdelhakim][Canadian Research Knowledge Network] At: 16:10 19 November 2010

The sample is pressed between the titanium ultrasound booster and a hard insulation post
made of aluminum ended by a Teflonw tip. The holding pressure has a strong influence on
the thermal response (Perez and Davis 2003). In this experiment, the pressure was set to 50
PSI, just strong enough to hold the sample and avoiding any displacement of the sample
during the ultrasound stimulation. The pressure applied by the pneumatic pistons is digitally
monitored for experimental reproducibility. Sample dimensions and weight allow having a
single insulation contact at one end while leaving the other end in free motion. A cork slice
was inserted between the insulation post and the sample. The size of the cork slice in contact
with the sample was thoroughly determined by empirical trials until optimum defect
detectability was achieved. A coupling material can be inserted between the titanium booster
and the sample to improve ultrasound transfer into the sample, the impedance matching is
described in detail by Zwescheper et al. (2003). A wet tissue was used; this soft material also
compensates for surface misalignment and protects the sample surface from fretting.
Ultrasounds are injected on the back side of the sample and the infrared camera is facing the
tungsten carbide coating. If only one side is accessible, ultrasound injection on the coating
side is also possible. The latter configuration gives the same results but the setup is more
complex. This additional complexity is caused by the issue of physically arranging the
camera to point directly toward the area of interest of the sample. The large sizes of the
booster and the piezo, and the small size of the sample are the reasons of this additional
complexity. To overcome the latter issue, we installed an infrared mirror in order to reflect
out the infrared images of the coating toward the camera. It should be mentioned here that in
real-life the parts to inspect are much larger than the academic samples described during
the current study. Indeed, for such parts ultrasounds can be injected farther away from the
inspected area since the parts material is a good ultrasound propagating medium.
The experimental arrangement used in our experiments is schematically represented in
figure 3; in order to allow all the components to be clearly seen, it is represented when the
pressure is not applied. The infrared camera is an InSb Phoenixw Indigo, 14 bits, operating in
the 3–5mm wavelength range, with a spatial resolution of 512 £ 640 pixels, and a
temperature resolution of 20 mK. During our experiments, the integration time was set to
0.8 ms. The 1 £ macro-lens attached to the camera allows the visualisation of a maximum
area of 16 £ 12.8 mm (pixel size of 25mm). Tests have also been done with a wide angle
lens that has a focal point of a few centimeters, the whole sample was visualised but the poor
Ultrasoundcontrol unit
Booster Mechanicalwaves
Piezo
Figure 2. Ultrasound source.
Nondestructive testing 111
Downloaded By: [Bendada, Abdelhakim][Canadian Research Knowledge Network] At: 16:10 19 November 2010

resolution did not reveal the open cracks. However, it was useful to see the undesired heat
around the ultrasound injection point.
By changing the coupling configuration from one experiment to another, we noticed that
crack detectability decreased drastically, i.e. worse contrasts, when the undesired heat
produced by the exciter tip was high (typically a 2–38C temperature rise was monitored with
a thermocouple). An explanation for such a phenomenon could be that when the coupling is
bad, ultrasound energy is not well transferred into the bulk of the sample, i.e. toward the
cracks, but rather dissipated into heat in the vicinity of the injection point.
After preliminary tests, the best detectability was observed with the ultrasound frequency
source set to 20 kHz. No frequency modulation stimulation was necessary since the sample
did not suffer from standing wave patterns. Standing waves are generally undesired because
they might hide flaws with their regular patterns, but if flaws are geometrically important, the
regularity of the standing wave patterns are disturbed which can lead to a kind of detection.
3. Sample description
HVOF is a supersonic process spraying molten droplets of coating material at extremely high
velocities. The coating is formed by a mixture of Tungsten–Carbide and Cobalt powder
accelerated and heated into a plasma jet and sprayed onto a 1-mm-thick steel substrate. Fuel
and oxygen are fed into a chamber; combustion produces a hot high pressure circular flame
which is forced down a nozzle increasing its velocity (typically 600–700 m/s). Popular fuel
gases include Hydrogen, Propylene, Acetylene, and Kerosene. The resulting coating is very
dense, very well bonded, and free of the oxides and tensile stresses typically found in
coatings provided by other thermal spray processes. HVOF wear resistant surfaces typically
provide more than four times the wear resistance of chrome plating, through hardening and
other hard facing techniques. Their use is increasing worldwide for environmental reasons
and due to their superiority over chromium coating. The thickness of the coating layer is
typically ranging from 100 to 200mm. Thermally sprayed coatings are formed by stacking of
individual lamellae whose interfacial thermal contact is limited by the presence of pores or
secondary phases (Moreau et al. 1993).
Six Almen strips were supplied by the National Research Council of Canada, but only
results from one sample are presented hereafter. Figure 4 shows the latter sample whose
dimensions are 76.2 mm £ 19.2 mm. The sample was maintained by four holding clips
Tissue
BoosterPiezo
Cork
Teflon Aluminum
Sample
Pneumatic piston
Figure 3. Experimentation approach.
J.-M. Piau et al.112
Downloaded By: [Bendada, Abdelhakim][Canadian Research Knowledge Network] At: 16:10 19 November 2010
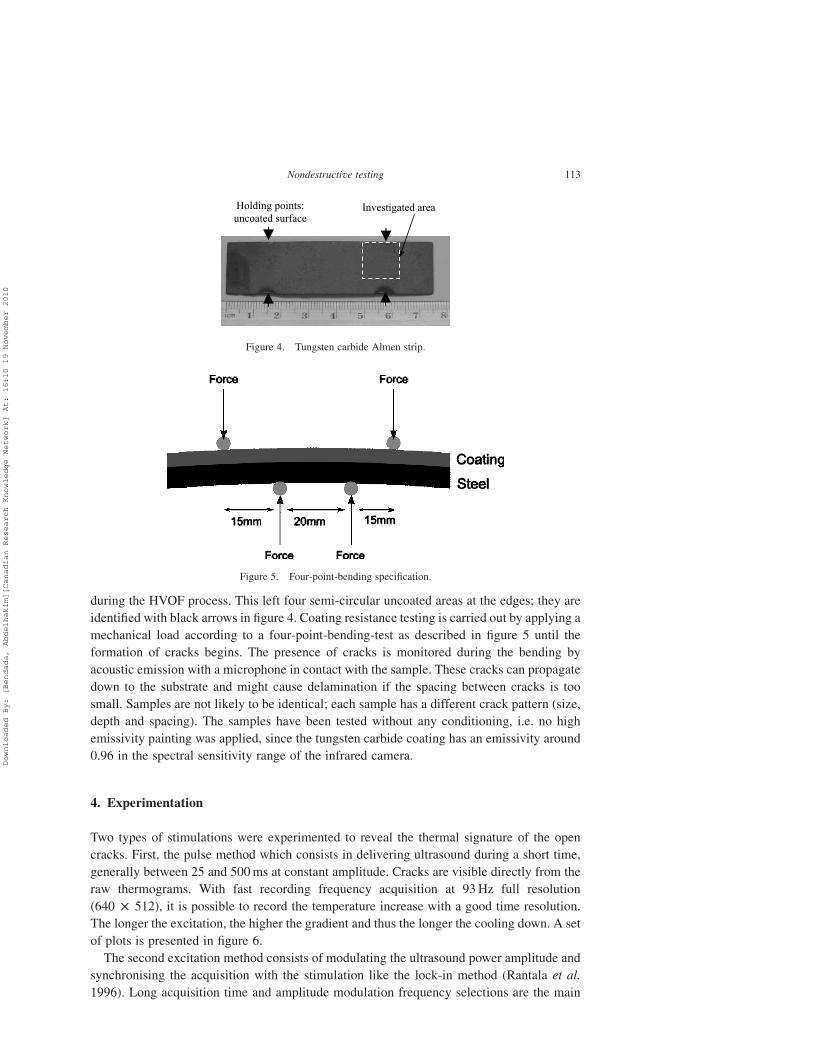
during the HVOF process. This left four semi-circular uncoated areas at the edges; they are
identified with black arrows in figure 4. Coating resistance testing is carried out by applying a
mechanical load according to a four-point-bending-test as described in figure 5 until the
formation of cracks begins. The presence of cracks is monitored during the bending by
acoustic emission with a microphone in contact with the sample. These cracks can propagate
down to the substrate and might cause delamination if the spacing between cracks is too
small. Samples are not likely to be identical; each sample has a different crack pattern (size,
depth and spacing). The samples have been tested without any conditioning, i.e. no high
emissivity painting was applied, since the tungsten carbide coating has an emissivity around
0.96 in the spectral sensitivity range of the infrared camera.
4. Experimentation
Two types of stimulations were experimented to reveal the thermal signature of the open
cracks. First, the pulse method which consists in delivering ultrasound during a short time,
generally between 25 and 500 ms at constant amplitude. Cracks are visible directly from the
raw thermograms. With fast recording frequency acquisition at 93 Hz full resolution
(640 £ 512), it is possible to record the temperature increase with a good time resolution.
The longer the excitation, the higher the gradient and thus the longer the cooling down. A set
of plots is presented in figure 6.
The second excitation method consists of modulating the ultrasound power amplitude and
synchronising the acquisition with the stimulation like the lock-in method (Rantala et al.
1996). Long acquisition time and amplitude modulation frequency selections are the main
Figure 4. Tungsten carbide Almen strip.
Figure 5. Four-point-bending specification.
Nondestructive testing 113
Downloaded By: [Bendada, Abdelhakim][Canadian Research Knowledge Network] At: 16:10 19 November 2010

drawbacks. The experiments performed differ from the conventional lock-in, the acquisition
is done during the transient regime and the stimulation only lasts three periods. The amplitude
modulation frequency was set to 2 Hz. Figure 7 presents two typical crack surface gradient
profiles (a,b) and the bottom curve (c) is a sound region gradient profile taken between
cracks. One can see the transient regime with the three pseudo sinusoidal periods ramping up
followed by the cooling down which has not been recorded entirely.
Figure 6. Gradient profile (Temperature versus time). Pulse duration: 25, 50, 100, 200, 300, 400, and 500 ms.
Figure 7. Temperature versus time transients (modulation at 2 Hz). (a,b) Temperature versus time transients on twodifferent cracks. (c) Temperature versus time transient in between two cracks.
J.-M. Piau et al.114
Downloaded By: [Bendada, Abdelhakim][Canadian Research Knowledge Network] At: 16:10 19 November 2010
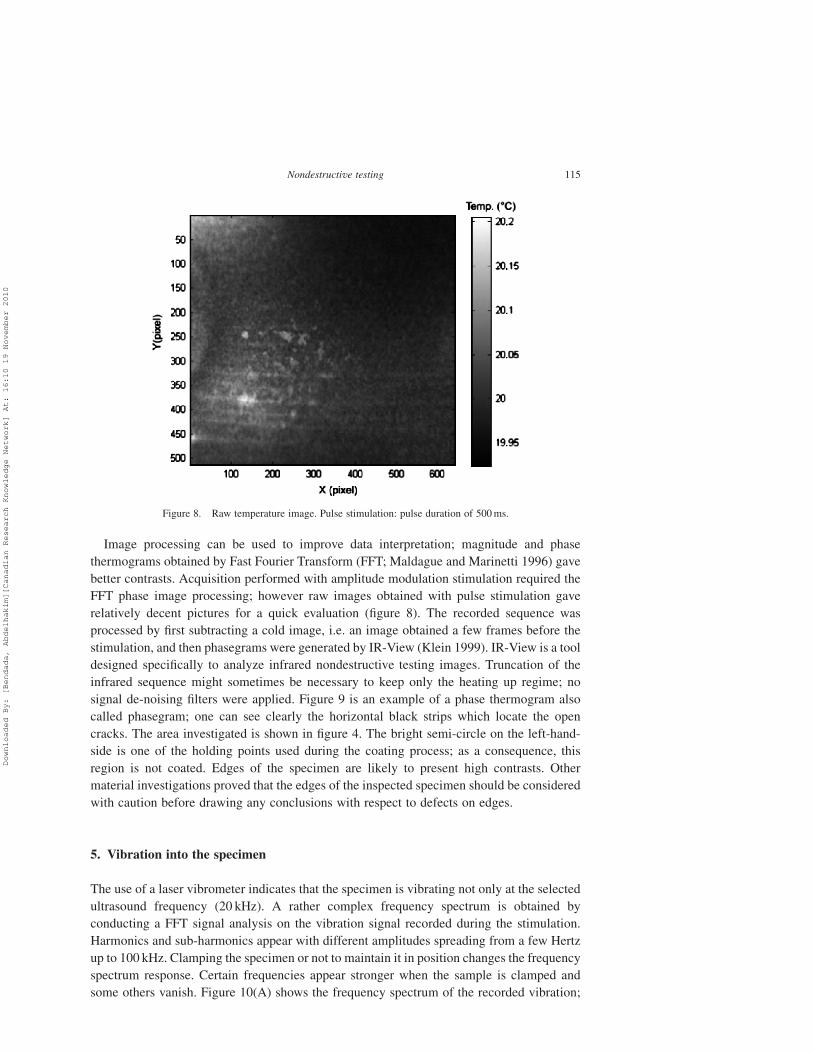
Image processing can be used to improve data interpretation; magnitude and phase
thermograms obtained by Fast Fourier Transform (FFT; Maldague and Marinetti 1996) gave
better contrasts. Acquisition performed with amplitude modulation stimulation required the
FFT phase image processing; however raw images obtained with pulse stimulation gave
relatively decent pictures for a quick evaluation (figure 8). The recorded sequence was
processed by first subtracting a cold image, i.e. an image obtained a few frames before the
stimulation, and then phasegrams were generated by IR-View (Klein 1999). IR-View is a tool
designed specifically to analyze infrared nondestructive testing images. Truncation of the
infrared sequence might sometimes be necessary to keep only the heating up regime; no
signal de-noising filters were applied. Figure 9 is an example of a phase thermogram also
called phasegram; one can see clearly the horizontal black strips which locate the open
cracks. The area investigated is shown in figure 4. The bright semi-circle on the left-hand-
side is one of the holding points used during the coating process; as a consequence, this
region is not coated. Edges of the specimen are likely to present high contrasts. Other
material investigations proved that the edges of the inspected specimen should be considered
with caution before drawing any conclusions with respect to defects on edges.
5. Vibration into the specimen
The use of a laser vibrometer indicates that the specimen is vibrating not only at the selected
ultrasound frequency (20 kHz). A rather complex frequency spectrum is obtained by
conducting a FFT signal analysis on the vibration signal recorded during the stimulation.
Harmonics and sub-harmonics appear with different amplitudes spreading from a few Hertz
up to 100 kHz. Clamping the specimen or not to maintain it in position changes the frequency
spectrum response. Certain frequencies appear stronger when the sample is clamped and
some others vanish. Figure 10(A) shows the frequency spectrum of the recorded vibration;
Figure 8. Raw temperature image. Pulse stimulation: pulse duration of 500 ms.
Nondestructive testing 115
Downloaded By: [Bendada, Abdelhakim][Canadian Research Knowledge Network] At: 16:10 19 November 2010

the ultrasound stimulation was a 100 ms pulse. The laser was pointed in the same region
investigated by thermography. When the sample is mechanically clamped at its top end, one
can notice on the frequency spectrum in figure 10(B) that the energy is distributed differently,
and a strong peak appears at 10 kHz. Frequency spectrum analysis is beyond the scope of this
article; for more detailed information we refer the reader to Han et al. 2002. Furthermore, it is
worth noticing from figure 10 that frequencies under the human hearing limit are present.
So for safety reasons, hearing protection is strongly recommended.
Cracks do not respond specially at the stimulation frequency and it is difficult to predict
which vibration frequency is best suited for the conversion of acoustic energy into heat.
When the frequency spectrum is spread over several frequencies, the chances of a good
detection increase.
Figure 9. Phasegram image. Modulated stimulation: amplitude modulated at 2 Hz.
Figure 10. (A) Frequency spectrum with sample not clamped. (B) Frequency spectrum with the sample clamped atthe top.
J.-M. Piau et al.116
Downloaded By: [Bendada, Abdelhakim][Canadian Research Knowledge Network] At: 16:10 19 November 2010

6. Results
The area investigated presents open cracks; they are all oriented in the same direction
(figure 11). Cracks show different contrast levels. To perform the crack spacing
measurements, two phase profiles (column A and column B) have been extracted
(figure 12) from the phasegram image of figure 11. A peak detection procedure allows cracks
to be accurately located on the Y-axis. Lines have been drawn passing through paired peaks
to show the direction of the cracks. Finally, circles and crosses in figure 11 have been
displayed according to the Y coordinate found by the peak detection; this verifies, visually,
the exactitude of the detection. With the lens specification and camera pixel size, crack
spacings have been accurately converted into millimeters. In order to validate the location
and type of cracks, a sample was irreversibly cut to perform electronic microscope
photography depth wise. The investigated cracks have been numbered from 1 to 10 as shown
in figure 11. Figures 13 and 14 report the error difference distance between neighboring
Figure 12. Phase profiles (Columns A and B). (A) Column 150 (B) Column 400.
Figure 11. FFT, Phasegram, 2 Hz. (A) Column 150. (B) Column 400.
Nondestructive testing 117
Downloaded By: [Bendada, Abdelhakim][Canadian Research Knowledge Network] At: 16:10 19 November 2010

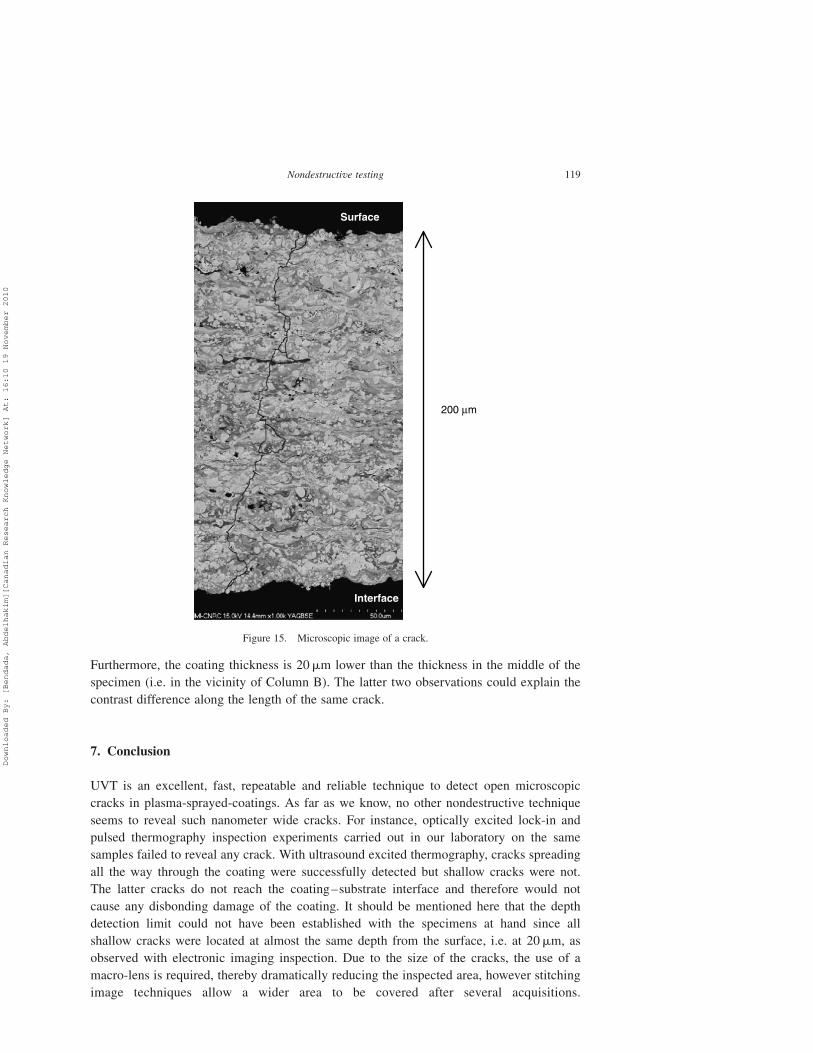
cracks observed by both techniques. One of the investigated cracks with microscopic
photography is shown in figure 15. The gap between the crack edges is in the nanometer
order. This electronic microscope image covers the region from the surface down to the steel
interface (approximately 200-mm-height, 125-mm-width). The crack might not look straight
from the top to the bottom but considering the scale it does not matter much for the
measurement purposes and the surface heat is taken at its peaks for each crack. Smaller
cracks, a few tenths of a micrometer deep from the surface, were observed between deep
cracks with electronic microscope inspection. Those smaller cracks were however not
detected with ultrasound excited thermography. But it should be mentioned here that the
latter cracks do not affect the coating wear resistance that much since the risk of coating
delamination is not that big compared to deep cracks reaching the substrate.
Calibration of the infrared acquisition system with a black body and determination of the
tungsten carbide emissivity allows the surface temperature to be calculated. A temperature
difference of 200 mK between adjacent cracks was measured. For this particular investigated
area, the electronic microscopic imaging inspection has revealed that cracks close to the edge
(left-hand-side in figure 11, vicinity of Column A) present more ramified patterns.
Figure 13. Crack spacing comparison of column A. X Thermography B Microscope.
Figure 14. Crack spacing comparison of column B. X Thermography B Microscope.
J.-M. Piau et al.118
Downloaded By: [Bendada, Abdelhakim][Canadian Research Knowledge Network] At: 16:10 19 November 2010
Furthermore, the coating thickness is 20mm lower than the thickness in the middle of the
specimen (i.e. in the vicinity of Column B). The latter two observations could explain the
contrast difference along the length of the same crack.
7. Conclusion
UVT is an excellent, fast, repeatable and reliable technique to detect open microscopic
cracks in plasma-sprayed-coatings. As far as we know, no other nondestructive technique
seems to reveal such nanometer wide cracks. For instance, optically excited lock-in and
pulsed thermography inspection experiments carried out in our laboratory on the same
samples failed to reveal any crack. With ultrasound excited thermography, cracks spreading
all the way through the coating were successfully detected but shallow cracks were not.
The latter cracks do not reach the coating–substrate interface and therefore would not
cause any disbonding damage of the coating. It should be mentioned here that the depth
detection limit could not have been established with the specimens at hand since all
shallow cracks were located at almost the same depth from the surface, i.e. at 20mm, as
observed with electronic imaging inspection. Due to the size of the cracks, the use of a
macro-lens is required, thereby dramatically reducing the inspected area, however stitching
image techniques allow a wider area to be covered after several acquisitions.
Figure 15. Microscopic image of a crack.
Nondestructive testing 119
Downloaded By: [Bendada, Abdelhakim][Canadian Research Knowledge Network] At: 16:10 19 November 2010

The repeatability of crack detection is highly guaranteed if the coupling, holding pressure
and insulation surface are meticulously adjusted. Modulated amplitude ultrasound
excitation gave better images than pulse amplitude ultrasound excitation. Raw images are
often sufficient to locate most of the cracks but detection is highly improved by image
processing methods such as FFT. No crack growth has been monitored even with intensive
testing. In the future, we intend to develop inverse algorithms based on heat transfer
models and infrared imaging to estimate crack propagation within the coating. We also
plan to develop a new four-point-bending-test setup which allows real-time-vision of crack
propagation during the test itself.
Acknowledgements
We gratefully acknowledge Dr Jean-Gabriel Legoux and the Surface Technology Group from
the National Research Council of Canada, who provided us with the Tungsten–Carbide and
Cobalt coated Almen samples and precious help with the microscopic images.
References
Han, X., Li, W., Zeng, Z., Favro, L.D. and Thomas, R.L., Acoustic chaos and sonic infrared imaging. Appl. Phys.Lett., October 2002, 81(17), 3188–3190.
Harwood, N. and Cummings, W.M., Thermoelastic Stress Analysis, 1991 (Adam Hilger: Bristol, Philadelphia, andNew York).
Klein, M., 1999, http://irview.m-klein.com, Laboratoire de vision et systemes numeriques, Dep. de genie electrique,Universite Laval, Quebec City, Quebec, Canada, G1K 7P4, Last Update: 03-2007.
Maldague, X.P. and Marinetti, S., Pulse phase infrared thermography. J. Appl. Phys., 1996, 79(5), 2694–2698.Meyendorf, N.G.H., Rosner, H., Kramb, V. and Sathish, S., Thermo-acoustic fatigue characterization. Ultrasonics,
May 2002, 40(1–8), 427.Moreau, C., Fargier-Richard, P., Saint-Jacques, R.G. and Cielo, P., Thermal diffusivity of plasma-sprayed tungsten
coatings, International conference on metallurgical coatings and thin films, No. 20, April 1993, San Diego CA,USA, 61(1–3), 67–71.
Perez, I. and Davis, W.R., Optimizing the thermosonics signal. Proceedings of the AIP Conference, Cambridge, MA,USA, November 2003, 657, 505–512.
Rantala, J., Wul, D. and Busse, G., Amplitude-modulated lock-in vibrothermography for NDE of polymers andcomposites. Res. Nondestruct. Eval., December 1996, 7(4), 215–228.
Solodov, I.Y., Ultrasonics of non-linear contacts: propagation, reflection and NDE-applications. Ultrasonics,February 1998, 6(1–5), 383–390.
Zwescheper, T., Dilenz, A., Riegert, G., Sherling, D. and Busse, G., Ultrasound excited thermography usingfrequency modulated elastic waves. Insight, March 2003, 45(3), 178–182.
J.-M. Piau et al.120
Downloaded By: [Bendada, Abdelhakim][Canadian Research Knowledge Network] At: 16:10 19 November 2010