Embed Size (px)
Citation preview
United States Department of Agriculture National Agricultural Statistics Service
Statistical Bulletin Number 1043
Noncitrus Fruits and Nuts Final Estimates 2007-2012
October 2014

Noncitrus Fruits and Nuts Final Estimates 2007-2012 (October 2014) 3 USDA, National Agricultural Statistics Service
Contents INTRODUCTION .................................................................................................................................................................. 8
Revision Summary .................................................................................................................................................................. 8
Noncitrus Fruits and Nuts Bearing Acreage, Yield, Production, Price, and Value by Crop -
United States: 2007-2009 ...................................................................................................................................................... 10
Noncitrus Fruits and Nuts Bearing Acreage, Yield, Production, Price, and Value by Crop –
United States: 2010-2012 ...................................................................................................................................................... 13
Fruits and Nuts Bearing Acreage by Type – United States: 2007-2012 ............................................................................... 16
Noncitrus Fruits Utilized Production by Type of Utilization – United States: 2007-2012 ................................................... 16
Commercial Apple Bearing Acreage, Yield, Production, Price, and Value – States and United States: 2007-2009 ........... 18
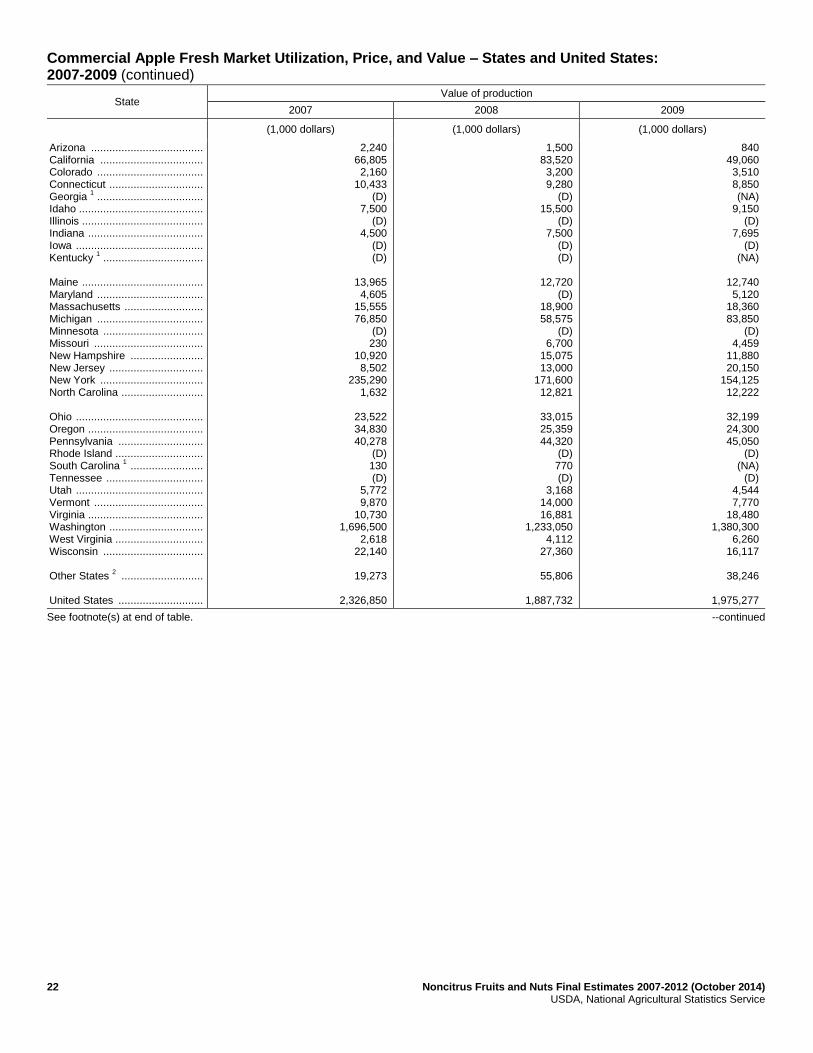
Commercial Apple Fresh Market Utilization, Price, and Value – States and United States: 2007-2009 ............................. 21
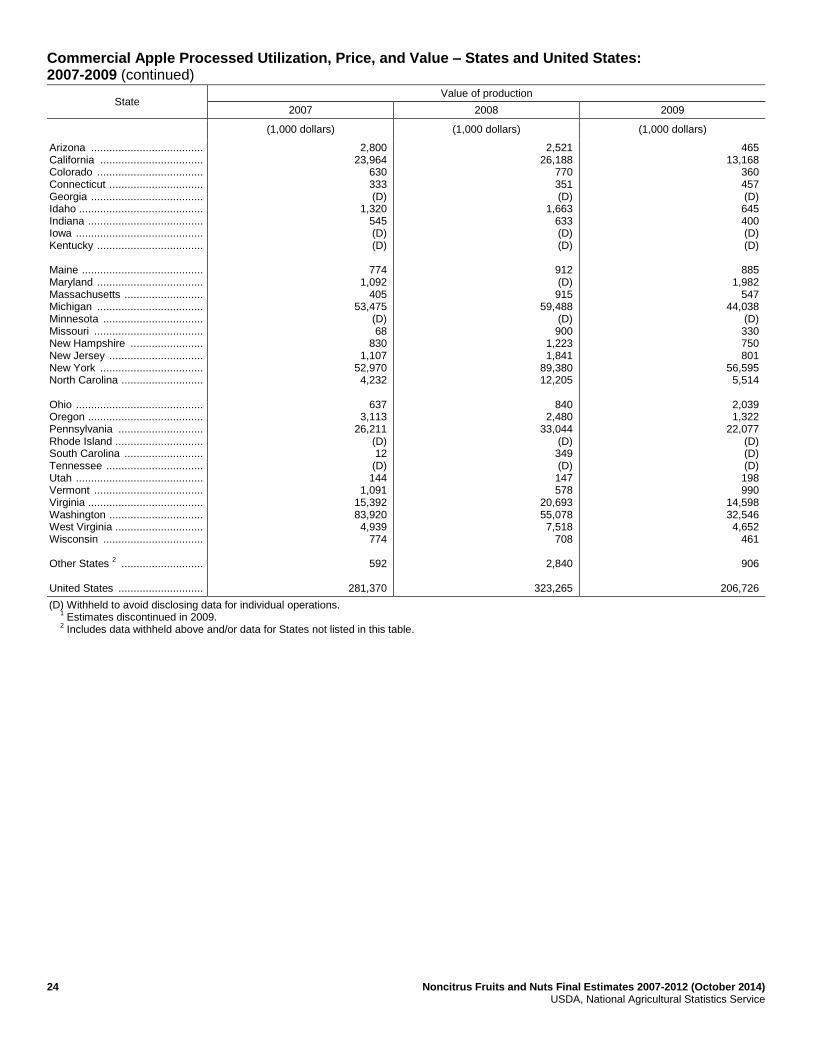
Commercial Apple Processed Utilization, Price, and Value – States and United States: 2007-2009 ................................... 23
Commercial Apple Processed Utilization and Price by Use – States and United States: 2007-2009 ................................... 25
Unutilized Apple Production – States and United States: 2007-2009 .................................................................................. 26
Commercial Apple Bearing Acreage, Yield, Production, Price, and Value – States and United States: 2010-2012 ........... 27
Commercial Apple Fresh Market Utilization, Price, and Value – States and United States: 2010-2012 ............................. 30
Commercial Apple Processed Utilization, Price, and Value – States and United States: 2010-2012 ................................... 32
Commercial Apple Processed Utilization and Price by Use – States and United States: 2010-2012 ................................... 34
Unutilized Apple Production – States and United States: 2010-2012 .................................................................................. 35
Commercial Apple Bearing Acreage – States and United States: 2007-2012 Chart ............................................................ 36
Commercial Apple Utilized Production – States and United States: 2007-2012 Chart ........................................................ 36
Other Fruit Bearing Acreage, Yield, Production, Utilization, Price, and Value by Crop – States and
United States: 2007-2009 ...................................................................................................................................................... 38
Other Unutilized Fruit Production by Crop – States and United States: 2007-2009 ............................................................ 44
Other Processed Fruit Utilization and Price by Crop and Use – States and United States: 2007-2009 ................................ 44
Olive Production by Variety – California: 2007-2009 .......................................................................................................... 45
Dry Fruit Production and Price by Use – California: 2007-2009 ......................................................................................... 45
Fresh Basis Equivalents for Selected Dry Fruits – California: 2007-2009 .......................................................................... 45
4 Noncitrus Fruits and Nuts Final Estimates 2007-2012 (October 2014) USDA, National Agricultural Statistics Service
Other Fruit Bearing Acreage, Yield, Production, Utilization, Price, and Value by Crop – States and
United States: 2010-2012 ...................................................................................................................................................... 46
Other Unutilized Fruit Production by Crop – States and United States: 2010-2012 ............................................................. 52
Other Processed Fruit Utilization and Price by Crop and Use – States and United States: 2010-2012 ................................ 52
Olive Production by Variety – California: 2010-2012 .......................................................................................................... 53
Dry Fruit Production and Price by Use – California: 2010-2012 .......................................................................................... 53
Fresh Basis Equivalents for Selected Dry Fruits – California: 2010-2012 .......................................................................... 53
Strawberry Area Planted, Harvested, Yield, Production, Price, and Value – States and United States: 2007-2009 ............ 54
Strawberry Utilization, Price, and Value by Utilization – States and United States: 2007-2009.......................................... 55
Strawberry Area Planted, Harvested, Yield, Production, Price, and Value – States and United States: 2010-2012 ............ 56
Strawberry Utilization, Price, and Value by Utilization – States and United States: 2010-2012.......................................... 57
Berry Area Harvested, Yield, Production, Utilization, Price, and Value by Crop – States and
United States: 2007-2009 ...................................................................................................................................................... 58
Unutilized Berry Production – States and United States: 2007-2009 ................................................................................... 62
Blackberry Area Harvested, Yield, Production, Utilization, Price, and Value by Variety – Oregon: 2007-2009 ................ 63
Blackberry Price and Value by Variety – Oregon: 2007-2009 ............................................................................................. 63
Unutilized Cultivated Blackberry Production by Variety – Oregon: 2007-2009 .................................................................. 63
Berry Area Harvested, Yield, Production, Utilization, Price, and Value by Crop - States and
United States: 2010-2012 ...................................................................................................................................................... 64
Unutilized Berry Production – States and United States: 2010-2012 ................................................................................... 68
Blackberry Area Harvested, Yield, Production, Utilization, Price, and Value by Variety – Oregon: 2010-2012 ................ 69
Blackberry Price and Value by Variety – Oregon: 2010-2012 ............................................................................................. 69
Unutilized Cultivated Blackberry Production by Variety – Oregon: 2010-2012 .................................................................. 69
Sweet Cherry Bearing Acreage, Yield, Production, Utilization, Price, and Value – States and
United States: 2007-2009 ...................................................................................................................................................... 70
Tart Cherry Bearing Acreage, Yield, Production, and Utilization, Price, and Value – States and
United States: 2007-2009 ...................................................................................................................................................... 72
Sweet and Tart Cherry Processed Utilization, Use, and Price by Use – States and United States: 2007-2009 .................... 74
Unutilized Cherry Production by Crop – States and United States: 2007-2009 ................................................................... 75
Noncitrus Fruits and Nuts Final Estimates 2007-2012 (October 2014) 5 USDA, National Agricultural Statistics Service
Sweet Cherry Bearing Acreage, Yield, Production, Utilization, Price, and Value – States and
United States: 2010-2012 ...................................................................................................................................................... 76
Tart Cherry Bearing Acreage, Yield, Production, Utilization, Price, and Value – States and
United States: 2010-2012 ...................................................................................................................................................... 78
Sweet and Tart Cherry Processed Utilization, and Price by Use – States and United States: 2010-2012 ............................ 80
Unutilized Cherry Production by Crop – States and United States: 2010-2012 ................................................................... 81
Cranberry Area Harvested, Yield, Production, Utilization, Price, and Value – States and
United States: 2007-2009 ...................................................................................................................................................... 82
Cranberry Area Harvested, Yield, Production, Utilization, Price, and Value – States and
United States: 2010-2012 ...................................................................................................................................................... 83
Grape Bearing Acreage, Yield, Production, Price, and Value – States and United States: 2007-2009 ................................ 84
Unutilized Grape Production – States and United States: 2007-2009 .................................................................................. 85
Grape Processed Utilization and Price by Use – States and United States: 2007-2009 ........................................................ 88
Grape Processed Utilization by Variety – States and United States: 2007-2009 .................................................................. 89
Concord Grapes for Processing Marketing Year Average Prices – New York and Pennsylvania: 2007-2009 .................... 89
Grape Bearing Acreage, Yield, Production, Price, and Value – States and United States: 2010-2012 ................................ 90
Unutilized Grape Production – States and United States: 2010-2012 .................................................................................. 91
Grape Fresh and Processed Utilization, Price, and Value – States and United States: 2010-2012 ....................................... 92
Grape Processed Utilization and Price by Use – States and United States: 2010-2012 ........................................................ 94
Grape Processed Utilization by Variety – States and United States: 2010-2012 .................................................................. 95
Concord Grapes for Processing Marketing Year Average Prices – New York and Pennsylvania: 2010-2012 .................... 95
Peach Bearing Acreage, Yield, Production, Price, and Value – States and United States: 2007-2009 ................................ 96
Peach Utilized Production, Price and Value by Utilization – States and United States: 2007-2009 .................................... 99
Peach Processed Utilization and Price by Use – States and United States: 2007-2009 ...................................................... 101
Unutilized Peach Production – States and United States: 2007-2009 ................................................................................. 101
Peach Bearing Acreage, Yield, Production, Price, and Value – States and United States: 2010-2012 .............................. 102
Peach Utilized Production, Price, and Value by Utilization – States and United States: 2010-2012 ................................. 105
Peach Processed Utilization and Price by Use – States and United States: 2010-2012 ...................................................... 107
Unutilized Peach Production – States and United States: 2010-2012 ................................................................................. 107
6 Noncitrus Fruits and Nuts Final Estimates 2007-2012 (October 2014) USDA, National Agricultural Statistics Service
All Pear Bearing Acreage, Yield, Production, Utilization, Price, and Value – States and United States: 2007-2009 ........ 108
Unutilized Pear Production – States and United States: 2007-2009 ................................................................................... 111
Pear Bearing Acreage, Yield, Production, Utilization, Price, and Value by Type – States and
United States: 2007-2009 .................................................................................................................................................... 110
All Pear Bearing Acreage, Yield, Production, Price, and Value – States and United States: 2010-2012 ........................... 112
Pear Bearing Acreage, Yield, Production, Utilization, Price, and Value by Type – States and
United States: 2010-2012 .................................................................................................................................................... 114
Unutilized Pear Production – States and United States: 2010-2012 ................................................................................... 115
Tropical Fruit Acreage Harvested, Yield, Utilization, Price, and Value by Crop – Hawaii: 2007-2009 ............................ 116
Tropical Fruit Acreage Harvested, Yield, Utilization, Price, and Value by Crop – Hawaii: 2010-2012 ............................ 117
Apples for Fresh Use Monthly Average Prices Received – States: July 2007 - June 2010 ................................................ 118
Apples for Fresh Use Monthly Average Prices Received – States: July 2010 - June 2013 ................................................ 119
Apples for Fresh Use Monthly Average Prices Received – United States: July 2007 - June 2012 .................................... 119
Grapes for Fresh Use Monthly Average Prices Received – United States: May 2007 - December 2012 ........................... 120
Peaches for Fresh Use Monthly Prices Received – United States: May 2007 - September 2012 ...................................... 120
Pears for Fresh Use Monthly Prices Received – United States: July 2007 - June 2012 ..................................................... 120
Tree Nut Bearing Acreage, Yield, Production, Price, and Value by Crop – States: 2007-2009 ......................................... 121
Tree Nut Utilization and Meat Production by Crop – States and United States: 2007-2009 .............................................. 122
Pecan Production, Price, and Value by Variety – States and United States: 2007-2009 .................................................... 123
Tree Nut Bearing Acreage, Yield, Production, Price, and Value by Crop – States: 2010-2012 ......................................... 124
Tree Nut Utilization and Meat Production by Crop – States and United States: 2010-2012 .............................................. 125
Pecan Production, Price, and Value by Variety – States and United States: 2010-2012 .................................................... 126
California Almonds Utilized Production – United States: 2007-2012 Chart ...................................................................... 127
California English Walnuts Utilized Production – United States: 2007-2012 Chart .......................................................... 127
Definition of Terms ............................................................................................................................................................. 128
Price and Value Definitions ................................................................................................................................................ 129
State MYA Price and Value Computations ......................................................................................................................... 129
United States MYA Price and Value Computations ........................................................................................................... 129

Noncitrus Fruits and Nuts Final Estimates 2007-2012 (October 2014) 7 USDA, National Agricultural Statistics Service
Marketing Seasons for Noncitrus Fruits ............................................................................................................................. 130
Marketing Seasons for Tree Nuts ........................................................................................................................................ 131
Information Contacts .......................................................................................................................................................... 132
Statistical Bulletin Publication Schedule and other ASB Services ..................................................................................... 133
8 Noncitrus Fruits and Nuts Final Estimates 2007-2012 (October 2014) USDA, National Agricultural Statistics Service
Introduction
Noncitrus Fruits and Nuts: Final Estimates by States, 2007-2012, U.S. Department of Agriculture, Agricultural
Statistics Board, National Agricultural Statistics Service, Statistical Bulletin No. 1043.
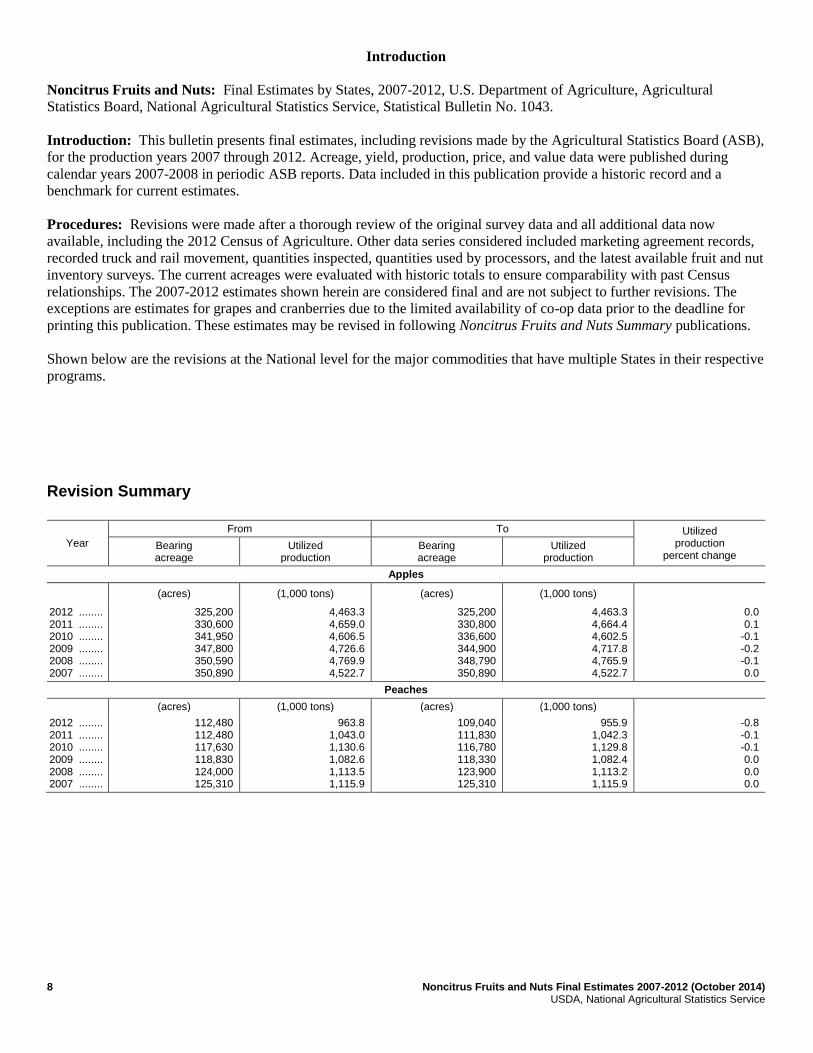
Introduction: This bulletin presents final estimates, including revisions made by the Agricultural Statistics Board (ASB),
for the production years 2007 through 2012. Acreage, yield, production, price, and value data were published during
calendar years 2007-2008 in periodic ASB reports. Data included in this publication provide a historic record and a
benchmark for current estimates.
Procedures: Revisions were made after a thorough review of the original survey data and all additional data now
available, including the 2012 Census of Agriculture. Other data series considered included marketing agreement records,
recorded truck and rail movement, quantities inspected, quantities used by processors, and the latest available fruit and nut
inventory surveys. The current acreages were evaluated with historic totals to ensure comparability with past Census
relationships. The 2007-2012 estimates shown herein are considered final and are not subject to further revisions. The
exceptions are estimates for grapes and cranberries due to the limited availability of co-op data prior to the deadline for
printing this publication. These estimates may be revised in following Noncitrus Fruits and Nuts Summary publications.
Shown below are the revisions at the National level for the major commodities that have multiple States in their respective
programs.
Revision Summary
Year
From To Utilized production
percent change Bearing acreage
Utilized production
Bearing acreage
Utilized production
Apples
(acres) (1,000 tons) (acres) (1,000 tons)
2012 ........ 2011 ........ 2010 ........ 2009 ........ 2008 ........ 2007 ........
325,200 330,600 341,950 347,800 350,590 350,890
4,463.3 4,659.0 4,606.5 4,726.6 4,769.9 4,522.7
325,200 330,800 336,600 344,900 348,790 350,890
4,463.3 4,664.4 4,602.5 4,717.8 4,765.9 4,522.7
0.0 0.1
-0.1 -0.2 -0.1 0.0
Peaches
(acres) (1,000 tons) (acres) (1,000 tons)
2012 ........ 2011 ........ 2010 ........ 2009 ........ 2008 ........ 2007 ........
112,480 112,480 117,630 118,830 124,000 125,310
963.8 1,043.0 1,130.6 1,082.6 1,113.5 1,115.9
109,040 111,830 116,780 118,330 123,900 125,310
955.9 1,042.3 1,129.8 1,082.4 1,113.2 1,115.9
-0.8 -0.1 -0.1 0.0 0.0 0.0
Noncitrus Fruits and Nuts Final Estimates 2007-2012 (October 2014) 9 USDA, National Agricultural Statistics Service
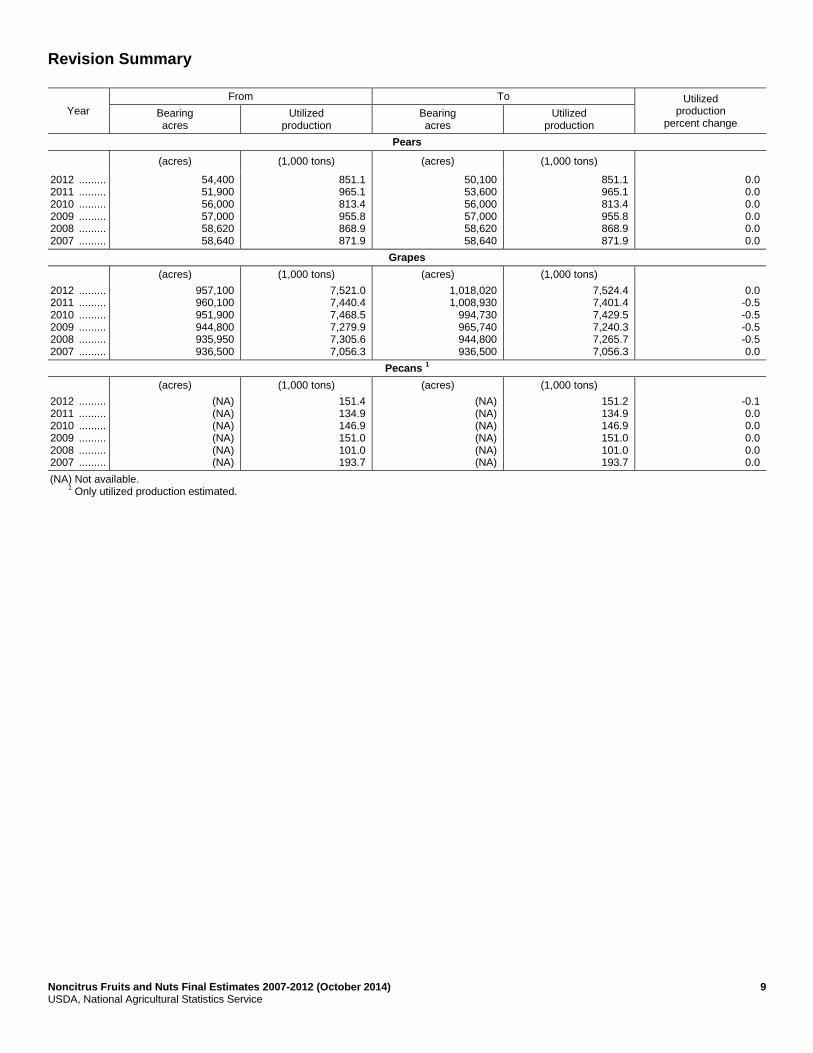
Revision Summary
Year
From To Utilized production
percent change Bearing acres
Utilized production
Bearing acres
Utilized production
Pears
(acres) (1,000 tons) (acres) (1,000 tons)
2012 ......... 2011 ......... 2010 ......... 2009 ......... 2008 ......... 2007 .........
54,400 51,900 56,000 57,000 58,620 58,640
851.1 965.1 813.4 955.8 868.9 871.9
50,100 53,600 56,000 57,000 58,620 58,640
851.1 965.1 813.4 955.8 868.9 871.9
0.0 0.0 0.0 0.0 0.0 0.0
Grapes
(acres) (1,000 tons) (acres) (1,000 tons)
2012 ......... 2011 ......... 2010 ......... 2009 ......... 2008 ......... 2007 .........
957,100 960,100 951,900 944,800 935,950 936,500
7,521.0 7,440.4 7,468.5 7,279.9 7,305.6 7,056.3
1,018,020 1,008,930
994,730 965,740 944,800 936,500
7,524.4 7,401.4 7,429.5 7,240.3 7,265.7 7,056.3
0.0 -0.5 -0.5 -0.5 -0.5 0.0
Pecans 1
(acres) (1,000 tons) (acres) (1,000 tons)
2012 ......... 2011 ......... 2010 ......... 2009 ......... 2008 ......... 2007 .........
(NA) (NA) (NA) (NA) (NA) (NA)
151.4 134.9 146.9 151.0 101.0 193.7
(NA) (NA) (NA) (NA) (NA) (NA)
151.2 134.9 146.9 151.0 101.0 193.7
-0.1 0.0 0.0 0.0 0.0 0.0
(NA) Not available. 1
Only utilized production estimated.
10 Noncitrus Fruits and Nuts Final Estimates 2007-2012 (October 2014) USDA, National Agricultural Statistics Service
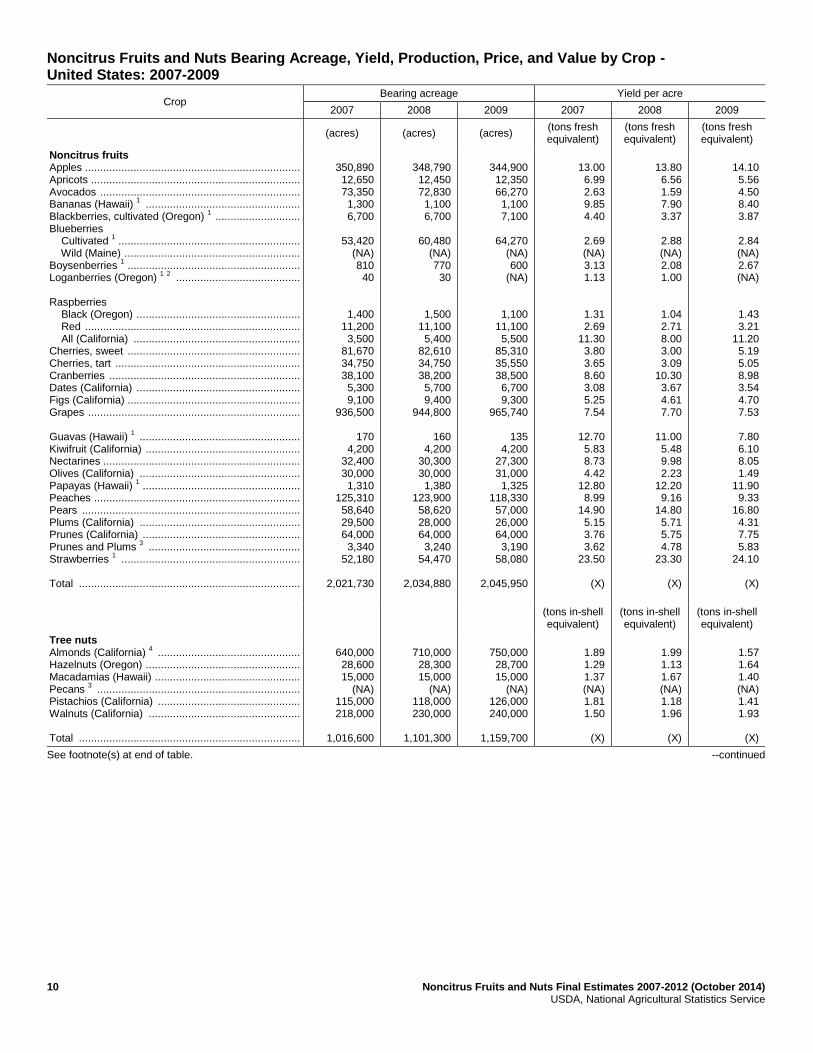
Noncitrus Fruits and Nuts Bearing Acreage, Yield, Production, Price, and Value by Crop - United States: 2007-2009
Crop Bearing acreage Yield per acre
2007 2008 2009 2007 2008 2009
(acres) (acres) (acres) (tons fresh equivalent)
(tons fresh equivalent)
(tons fresh equivalent)
Noncitrus fruits Apples ....................................................................... Apricots ..................................................................... Avocados .................................................................. Bananas (Hawaii)
1 ...................................................
Blackberries, cultivated (Oregon) 1 ............................
Blueberries Cultivated
1 ............................................................
Wild (Maine) .......................................................... Boysenberries
1 .........................................................
Loganberries (Oregon) 1 2 .........................................
Raspberries Black (Oregon) ...................................................... Red ....................................................................... All (California) ....................................................... Cherries, sweet ......................................................... Cherries, tart ............................................................. Cranberries ............................................................... Dates (California) ...................................................... Figs (California) ......................................................... Grapes ...................................................................... Guavas (Hawaii)
1 .....................................................
Kiwifruit (California) ................................................... Nectarines ................................................................. Olives (California) ..................................................... Papayas (Hawaii)
1 ....................................................
Peaches .................................................................... Pears ........................................................................ Plums (California) ..................................................... Prunes (California) .................................................... Prunes and Plums
3 ..................................................
Strawberries 1 ...........................................................
Total .........................................................................
350,890 12,650 73,350 1,300 6,700
53,420
(NA) 810 40
1,400 11,200 3,500
81,670 34,750 38,100 5,300 9,100
936,500
170 4,200
32,400 30,000 1,310
125,310 58,640 29,500 64,000 3,340
52,180
2,021,730
348,790 12,450 72,830 1,100 6,700
60,480
(NA) 770 30
1,500 11,100 5,400
82,610 34,750 38,200 5,700 9,400
944,800
160 4,200
30,300 30,000 1,380
123,900 58,620 28,000 64,000 3,240
54,470
2,034,880
344,900 12,350 66,270 1,100 7,100
64,270
(NA) 600
(NA)
1,100 11,100 5,500
85,310 35,550 38,500 6,700 9,300
965,740
135 4,200
27,300 31,000 1,325
118,330 57,000 26,000 64,000 3,190
58,080
2,045,950
13.00 6.99 2.63 9.85 4.40
2.69 (NA) 3.13 1.13
1.31 2.69
11.30 3.80 3.65 8.60 3.08 5.25 7.54
12.70 5.83 8.73 4.42
12.80 8.99
14.90 5.15 3.76 3.62
23.50
(X)
13.80 6.56 1.59 7.90 3.37
2.88 (NA) 2.08 1.00
1.04 2.71 8.00 3.00 3.09
10.30 3.67 4.61 7.70
11.00 5.48 9.98 2.23
12.20 9.16
14.80 5.71 5.75 4.78
23.30
(X)
14.10 5.56 4.50 8.40 3.87
2.84 (NA) 2.67 (NA)
1.43 3.21
11.20 5.19 5.05 8.98 3.54 4.70 7.53
7.80 6.10 8.05 1.49
11.90 9.33
16.80 4.31 7.75 5.83
24.10
(X)
(tons in-shell equivalent)
(tons in-shell equivalent)
(tons in-shell equivalent)
Tree nuts Almonds (California)
4 ...............................................
Hazelnuts (Oregon) ................................................... Macadamias (Hawaii) ................................................ Pecans
3 ...................................................................
Pistachios (California) ............................................... Walnuts (California) .................................................. Total .........................................................................
640,000 28,600 15,000
(NA) 115,000 218,000
1,016,600
710,000 28,300 15,000
(NA) 118,000 230,000
1,101,300
750,000 28,700 15,000
(NA) 126,000 240,000
1,159,700
1.89 1.29 1.37 (NA) 1.81 1.50
(X)
1.99 1.13 1.67 (NA) 1.18 1.96
(X)
1.57 1.64 1.40 (NA) 1.41 1.93
(X)
See footnote(s) at end of table. --continued
Noncitrus Fruits and Nuts Final Estimates 2007-2012 (October 2014) 11 USDA, National Agricultural Statistics Service
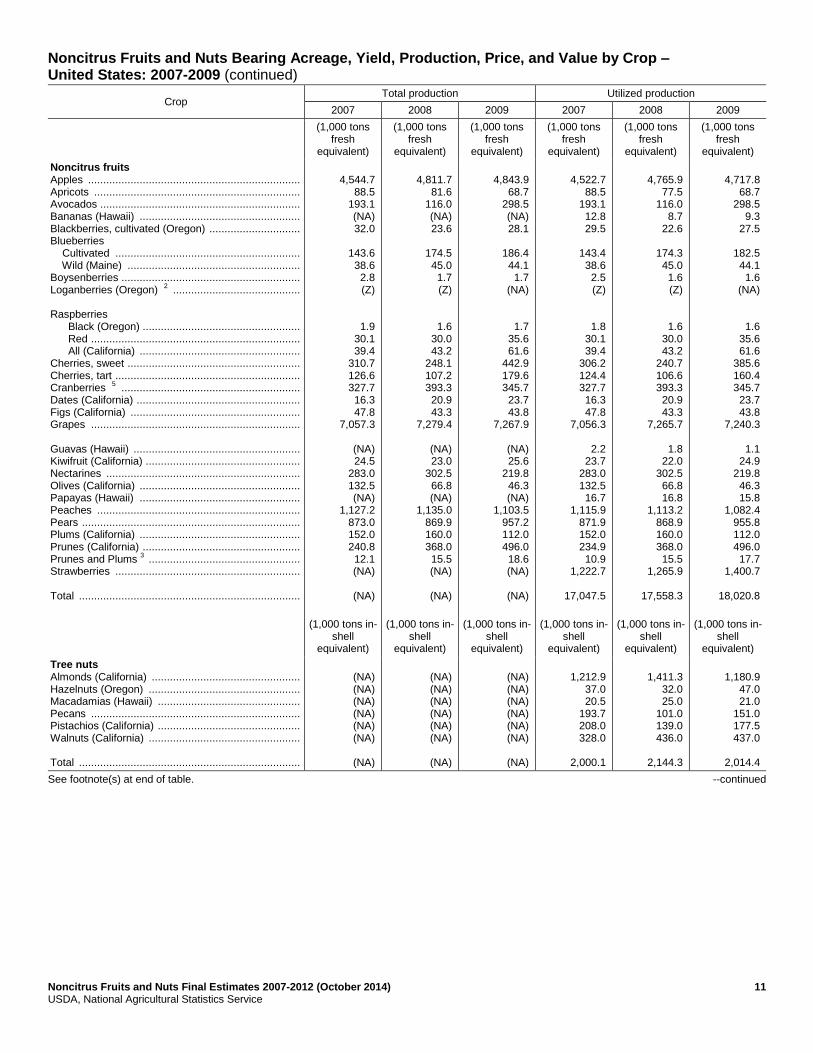
Noncitrus Fruits and Nuts Bearing Acreage, Yield, Production, Price, and Value by Crop – United States: 2007-2009 (continued)
Crop Total production Utilized production
2007 2008 2009 2007 2008 2009
(1,000 tons
fresh equivalent)
(1,000 tons fresh
equivalent)
(1,000 tons fresh
equivalent)
(1,000 tons fresh
equivalent)
(1,000 tons fresh
equivalent)
(1,000 tons fresh
equivalent)
Noncitrus fruits Apples ...................................................................... Apricots .................................................................... Avocados .................................................................. Bananas (Hawaii) ..................................................... Blackberries, cultivated (Oregon) .............................. Blueberries Cultivated ............................................................. Wild (Maine) ......................................................... Boysenberries ........................................................... Loganberries (Oregon)
2 ..........................................
Raspberries Black (Oregon) .................................................... Red ..................................................................... All (California) ..................................................... Cherries, sweet ......................................................... Cherries, tart ............................................................. Cranberries
5 ...........................................................
Dates (California) ...................................................... Figs (California) ........................................................ Grapes ..................................................................... Guavas (Hawaii) ....................................................... Kiwifruit (California) ................................................... Nectarines ................................................................ Olives (California) ..................................................... Papayas (Hawaii) ..................................................... Peaches ................................................................... Pears ........................................................................ Plums (California) ..................................................... Prunes (California) .................................................... Prunes and Plums
3 ..................................................
Strawberries ............................................................. Total .........................................................................
4,544.7
88.5 193.1 (NA) 32.0
143.6 38.6 2.8 (Z)
1.9 30.1 39.4
310.7 126.6 327.7 16.3 47.8
7,057.3
(NA) 24.5
283.0 132.5 (NA)
1,127.2 873.0 152.0 240.8 12.1 (NA)
(NA)
4,811.7
81.6 116.0 (NA) 23.6
174.5 45.0 1.7 (Z)
1.6 30.0 43.2
248.1 107.2 393.3 20.9 43.3
7,279.4
(NA) 23.0
302.5 66.8 (NA)
1,135.0 869.9 160.0 368.0 15.5 (NA)
(NA)
4,843.9
68.7 298.5 (NA) 28.1
186.4 44.1 1.7
(NA)
1.7 35.6 61.6
442.9 179.6 345.7 23.7 43.8
7,267.9
(NA) 25.6
219.8 46.3 (NA)
1,103.5 957.2 112.0 496.0 18.6 (NA)
(NA)
4,522.7
88.5 193.1 12.8 29.5
143.4 38.6 2.5 (Z)
1.8 30.1 39.4
306.2 124.4 327.7 16.3 47.8
7,056.3
2.2 23.7
283.0 132.5 16.7
1,115.9 871.9 152.0 234.9 10.9
1,222.7
17,047.5
4,765.9
77.5 116.0
8.7 22.6
174.3 45.0 1.6 (Z)
1.6 30.0 43.2
240.7 106.6 393.3 20.9 43.3
7,265.7
1.8 22.0
302.5 66.8 16.8
1,113.2 868.9 160.0 368.0 15.5
1,265.9
17,558.3
4,717.8
68.7 298.5
9.3 27.5
182.5 44.1 1.6
(NA)
1.6 35.6 61.6
385.6 160.4 345.7 23.7 43.8
7,240.3
1.1 24.9
219.8 46.3 15.8
1,082.4 955.8 112.0 496.0 17.7
1,400.7
18,020.8
(1,000 tons in-shell
equivalent)
(1,000 tons in-shell
equivalent)
(1,000 tons in-shell
equivalent)
(1,000 tons in-shell
equivalent)
(1,000 tons in-shell
equivalent)
(1,000 tons in-shell
equivalent)
Tree nuts Almonds (California) ................................................. Hazelnuts (Oregon) .................................................. Macadamias (Hawaii) ............................................... Pecans ..................................................................... Pistachios (California) ............................................... Walnuts (California) .................................................. Total .........................................................................
(NA) (NA) (NA) (NA) (NA) (NA)
(NA)
(NA) (NA) (NA) (NA) (NA) (NA)
(NA)
(NA) (NA) (NA) (NA) (NA) (NA)
(NA)
1,212.9
37.0 20.5
193.7 208.0 328.0
2,000.1
1,411.3
32.0 25.0
101.0 139.0 436.0
2,144.3
1,180.9
47.0 21.0
151.0 177.5 437.0
2,014.4
See footnote(s) at end of table. --continued
12 Noncitrus Fruits and Nuts Final Estimates 2007-2012 (October 2014) USDA, National Agricultural Statistics Service
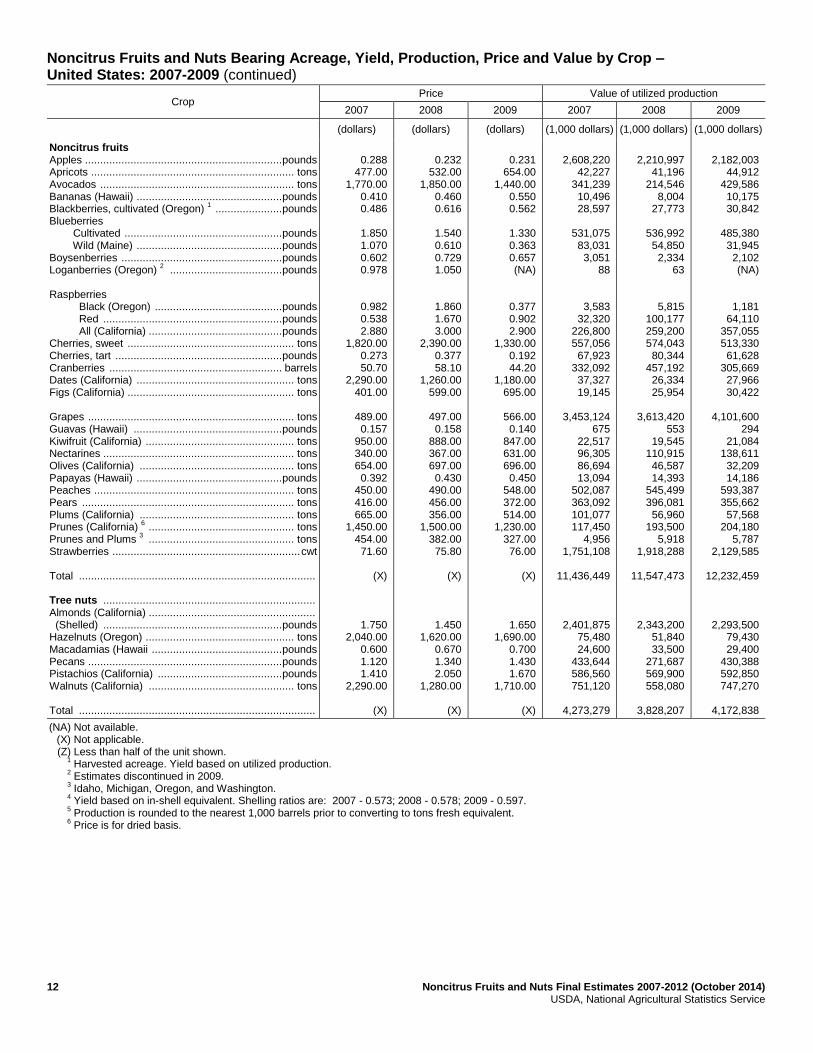
Noncitrus Fruits and Nuts Bearing Acreage, Yield, Production, Price and Value by Crop – United States: 2007-2009 (continued)
Crop Price Value of utilized production
2007 2008 2009 2007 2008 2009
(dollars) (dollars) (dollars) (1,000 dollars) (1,000 dollars) (1,000 dollars)
Noncitrus fruits Apples ................................................................. pounds Apricots ................................................................... tons Avocados ................................................................ tons Bananas (Hawaii) ................................................ pounds Blackberries, cultivated (Oregon)
1 ...................... pounds
Blueberries Cultivated .................................................... pounds Wild (Maine) ................................................ pounds Boysenberries ..................................................... pounds Loganberries (Oregon)
2 ..................................... pounds
Raspberries Black (Oregon) .......................................... pounds Red ........................................................... pounds All (California) ............................................ pounds Cherries, sweet ....................................................... tons Cherries, tart ....................................................... pounds Cranberries ......................................................... barrels Dates (California) .................................................... tons Figs (California) ....................................................... tons Grapes .................................................................... tons Guavas (Hawaii) ................................................. pounds Kiwifruit (California) ................................................. tons Nectarines ............................................................... tons Olives (California) ................................................... tons Papayas (Hawaii) ................................................ pounds Peaches .................................................................. tons Pears ...................................................................... tons Plums (California) ................................................... tons Prunes (California)
6 ................................................ tons
Prunes and Plums 3 ................................................ tons
Strawberries .............................................................. cwt Total .............................................................................. Tree nuts ...................................................................... Almonds (California) ....................................................... (Shelled) ........................................................... pounds Hazelnuts (Oregon) ................................................. tons Macadamias (Hawaii ........................................... pounds Pecans ................................................................ pounds Pistachios (California) ......................................... pounds Walnuts (California) ................................................ tons Total ..............................................................................
0.288
477.00 1,770.00
0.410 0.486
1.850 1.070 0.602 0.978
0.982 0.538 2.880
1,820.00 0.273 50.70
2,290.00 401.00
489.00 0.157
950.00 340.00 654.00 0.392
450.00 416.00 665.00
1,450.00 454.00 71.60
(X)
1.750 2,040.00
0.600 1.120 1.410
2,290.00
(X)
0.232
532.00 1,850.00
0.460 0.616
1.540 0.610 0.729 1.050
1.860 1.670 3.000
2,390.00 0.377 58.10
1,260.00 599.00
497.00 0.158
888.00 367.00 697.00 0.430
490.00 456.00 356.00
1,500.00 382.00 75.80
(X)
1.450 1,620.00
0.670 1.340 2.050
1,280.00
(X)
0.231
654.00 1,440.00
0.550 0.562
1.330 0.363 0.657 (NA)
0.377 0.902 2.900
1,330.00 0.192 44.20
1,180.00 695.00
566.00 0.140
847.00 631.00 696.00 0.450
548.00 372.00 514.00
1,230.00 327.00 76.00
(X)
1.650 1,690.00
0.700 1.430 1.670
1,710.00
(X)
2,608,220
42,227 341,239 10,496 28,597
531,075 83,031 3,051
88
3,583 32,320
226,800 557,056 67,923
332,092 37,327 19,145
3,453,124
675 22,517 96,305 86,694 13,094
502,087 363,092 101,077 117,450
4,956 1,751,108
11,436,449
2,401,875 75,480 24,600
433,644 586,560 751,120
4,273,279
2,210,997
41,196 214,546
8,004 27,773
536,992 54,850 2,334
63
5,815 100,177 259,200 574,043 80,344
457,192 26,334 25,954
3,613,420
553 19,545
110,915 46,587 14,393
545,499 396,081 56,960
193,500 5,918
1,918,288
11,547,473
2,343,200 51,840 33,500
271,687 569,900 558,080
3,828,207
2,182,003
44,912 429,586 10,175 30,842
485,380 31,945 2,102 (NA)
1,181 64,110
357,055 513,330 61,628
305,669 27,966 30,422
4,101,600
294 21,084
138,611 32,209 14,186
593,387 355,662 57,568
204,180 5,787
2,129,585
12,232,459
2,293,500 79,430 29,400
430,388 592,850 747,270
4,172,838
(NA) Not available. (X) Not applicable. (Z) Less than half of the unit shown. 1
Harvested acreage. Yield based on utilized production. 2
Estimates discontinued in 2009. 3
Idaho, Michigan, Oregon, and Washington. 4
Yield based on in-shell equivalent. Shelling ratios are: 2007 - 0.573; 2008 - 0.578; 2009 - 0.597. 5
Production is rounded to the nearest 1,000 barrels prior to converting to tons fresh equivalent. 6
Price is for dried basis.
Noncitrus Fruits and Nuts Final Estimates 2007-2012 (October 2014) 13 USDA, National Agricultural Statistics Service
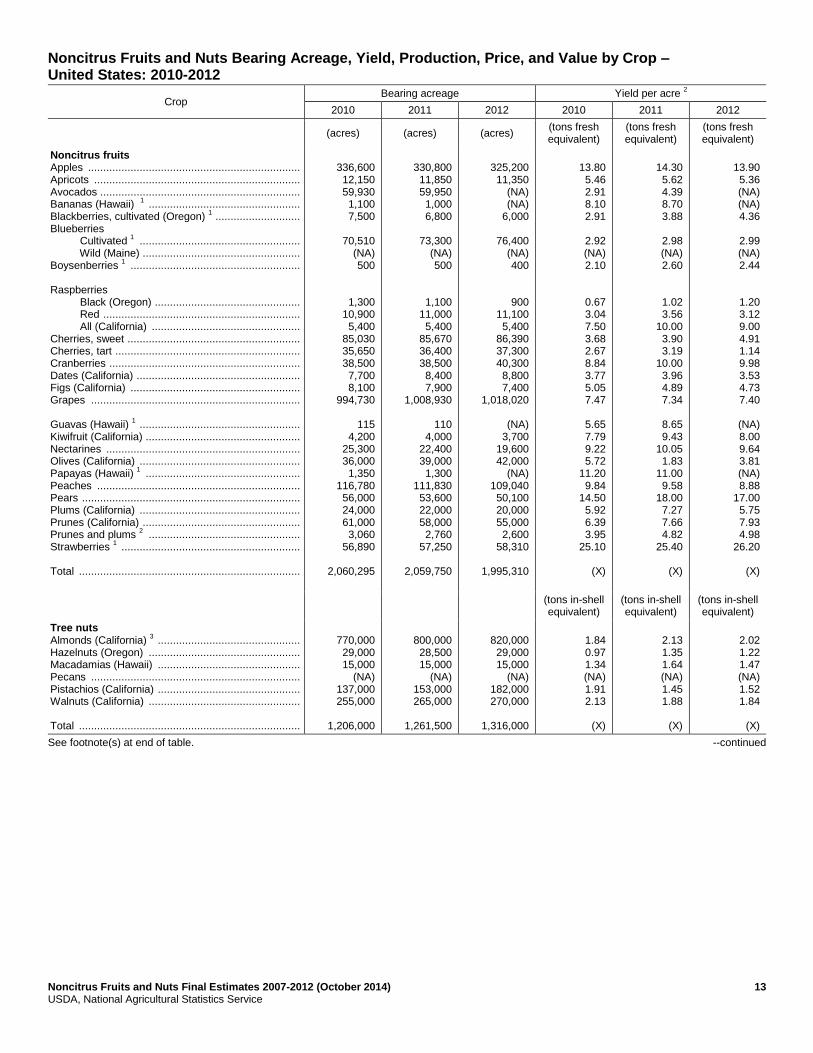
Noncitrus Fruits and Nuts Bearing Acreage, Yield, Production, Price, and Value by Crop – United States: 2010-2012
Crop Bearing acreage Yield per acre
2
2010 2011 2012 2010 2011 2012
(acres) (acres) (acres) (tons fresh equivalent)
(tons fresh equivalent)
(tons fresh equivalent)
Noncitrus fruits Apples ...................................................................... Apricots .................................................................... Avocados .................................................................. Bananas (Hawaii)
1 ..................................................
Blackberries, cultivated (Oregon) 1 ............................
Blueberries Cultivated
1 .....................................................
Wild (Maine) .................................................... Boysenberries
1 ........................................................
Raspberries Black (Oregon) ................................................ Red ................................................................. All (California) ................................................. Cherries, sweet ......................................................... Cherries, tart ............................................................. Cranberries ............................................................... Dates (California) ...................................................... Figs (California) ........................................................ Grapes ..................................................................... Guavas (Hawaii)
1 .....................................................
Kiwifruit (California) ................................................... Nectarines ................................................................ Olives (California) ..................................................... Papayas (Hawaii)
1 ...................................................
Peaches ................................................................... Pears ........................................................................ Plums (California) ..................................................... Prunes (California) .................................................... Prunes and plums
2 ..................................................
Strawberries 1 ...........................................................
Total .........................................................................
336,600 12,150 59,930 1,100 7,500
70,510
(NA) 500
1,300 10,900 5,400
85,030 35,650 38,500 7,700 8,100
994,730
115 4,200
25,300 36,000 1,350
116,780 56,000 24,000 61,000 3,060
56,890
2,060,295
330,800 11,850 59,950 1,000 6,800
73,300
(NA) 500
1,100 11,000 5,400
85,670 36,400 38,500 8,400 7,900
1,008,930
110 4,000
22,400 39,000 1,300
111,830 53,600 22,000 58,000 2,760
57,250
2,059,750
325,200 11,350
(NA) (NA)
6,000
76,400 (NA) 400
900 11,100 5,400
86,390 37,300 40,300 8,800 7,400
1,018,020
(NA) 3,700
19,600 42,000
(NA) 109,040 50,100 20,000 55,000 2,600
58,310
1,995,310
13.80 5.46 2.91 8.10 2.91
2.92 (NA) 2.10
0.67 3.04 7.50 3.68 2.67 8.84 3.77 5.05 7.47
5.65 7.79 9.22 5.72
11.20 9.84
14.50 5.92 6.39 3.95
25.10
(X)
14.30 5.62 4.39 8.70 3.88
2.98 (NA) 2.60
1.02 3.56
10.00 3.90 3.19
10.00 3.96 4.89 7.34
8.65 9.43
10.05 1.83
11.00 9.58
18.00 7.27 7.66 4.82
25.40
(X)
13.90 5.36 (NA) (NA) 4.36
2.99 (NA) 2.44
1.20 3.12 9.00 4.91 1.14 9.98 3.53 4.73 7.40
(NA) 8.00 9.64 3.81 (NA) 8.88
17.00 5.75 7.93 4.98
26.20
(X)
(tons in-shell equivalent)
(tons in-shell equivalent)
(tons in-shell equivalent)
Tree nuts Almonds (California)
3 ...............................................
Hazelnuts (Oregon) .................................................. Macadamias (Hawaii) ............................................... Pecans ..................................................................... Pistachios (California) ............................................... Walnuts (California) .................................................. Total .........................................................................
770,000 29,000 15,000
(NA) 137,000 255,000
1,206,000
800,000 28,500 15,000
(NA) 153,000 265,000
1,261,500
820,000 29,000 15,000
(NA) 182,000 270,000
1,316,000
1.84 0.97 1.34 (NA) 1.91 2.13
(X)
2.13 1.35 1.64 (NA) 1.45 1.88
(X)
2.02 1.22 1.47 (NA) 1.52 1.84
(X)
See footnote(s) at end of table. --continued
14 Noncitrus Fruits and Nuts Final Estimates 2007-2012 (October 2014) USDA, National Agricultural Statistics Service
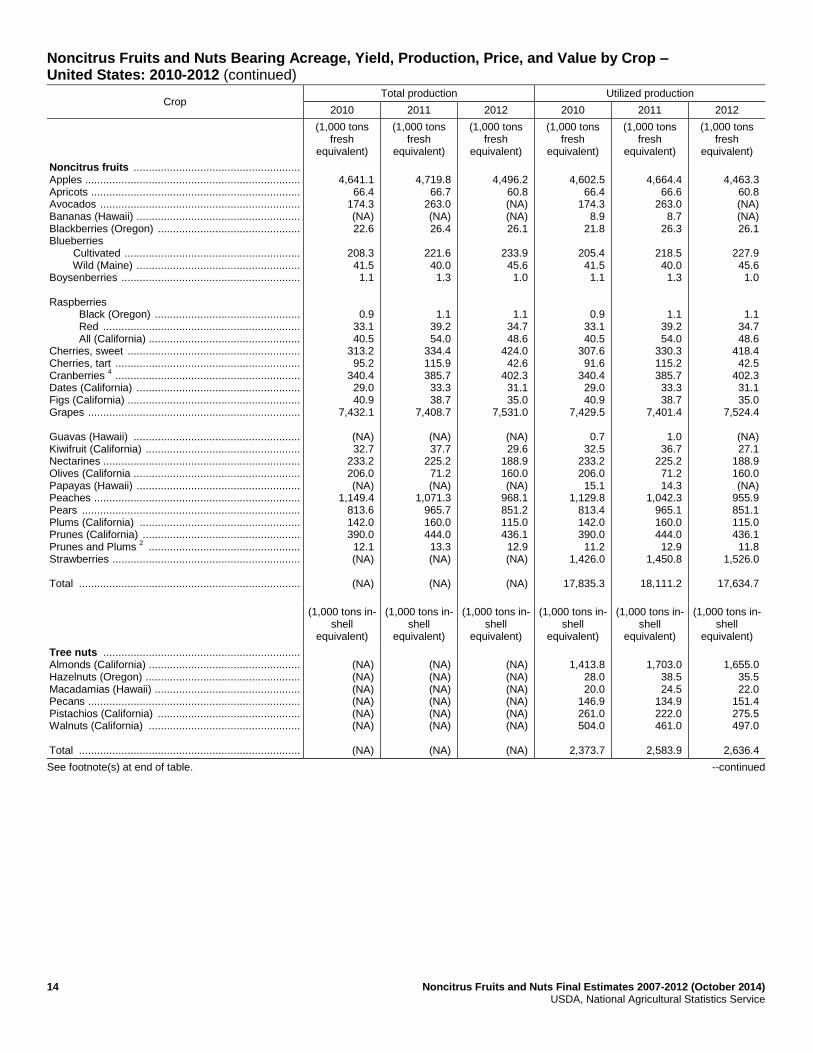
Noncitrus Fruits and Nuts Bearing Acreage, Yield, Production, Price, and Value by Crop – United States: 2010-2012 (continued)
Crop Total production Utilized production
2010 2011 2012 2010 2011 2012
(1,000 tons
fresh equivalent)
(1,000 tons fresh
equivalent)
(1,000 tons fresh
equivalent)
(1,000 tons fresh
equivalent)
(1,000 tons fresh
equivalent)
(1,000 tons fresh
equivalent)
Noncitrus fruits ....................................................... Apples ....................................................................... Apricots ..................................................................... Avocados .................................................................. Bananas (Hawaii) ...................................................... Blackberries (Oregon) ............................................... Blueberries Cultivated .......................................................... Wild (Maine) ...................................................... Boysenberries ........................................................... Raspberries Black (Oregon) ................................................ Red ................................................................. All (California) .................................................. Cherries, sweet ......................................................... Cherries, tart ............................................................. Cranberries
4 .............................................................
Dates (California) ...................................................... Figs (California) ......................................................... Grapes ...................................................................... Guavas (Hawaii) ....................................................... Kiwifruit (California) ................................................... Nectarines ................................................................. Olives (California ....................................................... Papayas (Hawaii) ...................................................... Peaches .................................................................... Pears ........................................................................ Plums (California) ..................................................... Prunes (California) .................................................... Prunes and Plums
2 ..................................................
Strawberries .............................................................. Total .........................................................................
4,641.1
66.4 174.3 (NA) 22.6
208.3 41.5 1.1
0.9 33.1 40.5
313.2 95.2
340.4 29.0 40.9
7,432.1
(NA) 32.7
233.2 206.0 (NA)
1,149.4 813.6 142.0 390.0 12.1 (NA)
(NA)
4,719.8
66.7 263.0 (NA) 26.4
221.6 40.0 1.3
1.1 39.2 54.0
334.4 115.9 385.7 33.3 38.7
7,408.7
(NA) 37.7
225.2 71.2 (NA)
1,071.3 965.7 160.0 444.0 13.3 (NA)
(NA)
4,496.2
60.8 (NA) (NA) 26.1
233.9 45.6 1.0
1.1 34.7 48.6
424.0 42.6
402.3 31.1 35.0
7,531.0
(NA) 29.6
188.9 160.0 (NA)
968.1 851.2 115.0 436.1 12.9 (NA)
(NA)
4,602.5
66.4 174.3
8.9 21.8
205.4 41.5 1.1
0.9 33.1 40.5
307.6 91.6
340.4 29.0 40.9
7,429.5
0.7 32.5
233.2 206.0 15.1
1,129.8 813.4 142.0 390.0 11.2
1,426.0
17,835.3
4,664.4
66.6 263.0
8.7 26.3
218.5 40.0 1.3
1.1 39.2 54.0
330.3 115.2 385.7 33.3 38.7
7,401.4
1.0 36.7
225.2 71.2 14.3
1,042.3 965.1 160.0 444.0 12.9
1,450.8
18,111.2
4,463.3
60.8 (NA) (NA) 26.1
227.9 45.6 1.0
1.1 34.7 48.6
418.4 42.5
402.3 31.1 35.0
7,524.4
(NA) 27.1
188.9 160.0 (NA)
955.9 851.1 115.0 436.1 11.8
1,526.0
17,634.7
(1,000 tons in-shell
equivalent)
(1,000 tons in-shell
equivalent)
(1,000 tons in-shell
equivalent)
(1,000 tons in-shell
equivalent)
(1,000 tons in-shell
equivalent)
(1,000 tons in-shell
equivalent)
Tree nuts ................................................................. Almonds (California) .................................................. Hazelnuts (Oregon) ................................................... Macadamias (Hawaii) ................................................ Pecans ...................................................................... Pistachios (California) ............................................... Walnuts (California) .................................................. Total .........................................................................
(NA) (NA) (NA) (NA) (NA) (NA)
(NA)
(NA) (NA) (NA) (NA) (NA) (NA)
(NA)
(NA) (NA) (NA) (NA) (NA) (NA)
(NA)
1,413.8
28.0 20.0
146.9 261.0 504.0
2,373.7
1,703.0
38.5 24.5
134.9 222.0 461.0
2,583.9
1,655.0
35.5 22.0
151.4 275.5 497.0
2,636.4
See footnote(s) at end of table. --continued
Noncitrus Fruits and Nuts Final Estimates 2007-2012 (October 2014) 15 USDA, National Agricultural Statistics Service
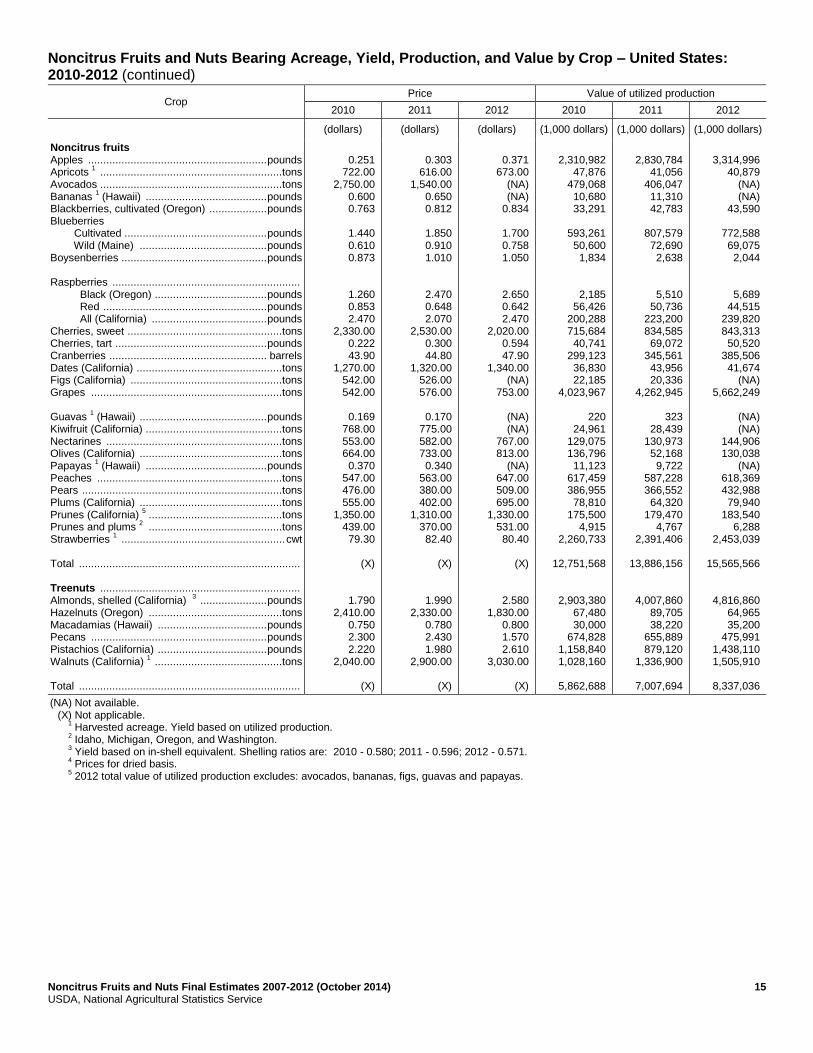
Noncitrus Fruits and Nuts Bearing Acreage, Yield, Production, and Value by Crop – United States: 2010-2012 (continued)
Crop Price Value of utilized production
2010 2011 2012 2010 2011 2012
(dollars) (dollars) (dollars) (1,000 dollars) (1,000 dollars) (1,000 dollars)
Noncitrus fruits Apples ........................................................... pounds Apricots
1 ............................................................tons
Avocados ............................................................tons Bananas
1 (Hawaii) ........................................ pounds
Blackberries, cultivated (Oregon) ................... pounds Blueberries Cultivated ............................................... pounds Wild (Maine) .......................................... pounds Boysenberries ................................................ pounds Raspberries .............................................................. Black (Oregon) ..................................... pounds Red ...................................................... pounds All (California) ...................................... pounds Cherries, sweet ...................................................tons Cherries, tart .................................................. pounds Cranberries .................................................... barrels Dates (California) ................................................tons Figs (California) ..................................................tons Grapes ...............................................................tons Guavas
1 (Hawaii) .......................................... pounds
Kiwifruit (California) .............................................tons Nectarines ..........................................................tons Olives (California) ...............................................tons Papayas
1 (Hawaii) ........................................ pounds
Peaches .............................................................tons Pears ..................................................................tons Plums (California) ...............................................tons Prunes (California)
5 ............................................tons
Prunes and plums 2 ............................................tons
Strawberries 1 ...................................................... cwt
Total ......................................................................... Treenuts .................................................................. Almonds, shelled (California)
3 ...................... pounds
Hazelnuts (Oregon) ............................................tons Macadamias (Hawaii) .................................... pounds Pecans .......................................................... pounds Pistachios (California) .................................... pounds Walnuts (California)
1 ..........................................tons
Total .........................................................................
0.251
722.00 2,750.00
0.600 0.763
1.440 0.610 0.873
1.260 0.853 2.470
2,330.00 0.222 43.90
1,270.00 542.00 542.00
0.169
768.00 553.00 664.00 0.370
547.00 476.00 555.00
1,350.00 439.00 79.30
(X)
1.790 2,410.00
0.750 2.300 2.220
2,040.00
(X)
0.303
616.00 1,540.00
0.650 0.812
1.850 0.910 1.010
2.470 0.648 2.070
2,530.00 0.300 44.80
1,320.00 526.00 576.00
0.170
775.00 582.00 733.00 0.340
563.00 380.00 402.00
1,310.00 370.00 82.40
(X)
1.990 2,330.00
0.780 2.430 1.980
2,900.00
(X)
0.371
673.00 (NA) (NA)
0.834
1.700 0.758 1.050
2.650 0.642 2.470
2,020.00 0.594 47.90
1,340.00 (NA)
753.00
(NA) (NA)
767.00 813.00
(NA) 647.00 509.00 695.00
1,330.00 531.00 80.40
(X)
2.580 1,830.00
0.800 1.570 2.610
3,030.00
(X)
2,310,982
47,876 479,068 10,680 33,291
593,261 50,600 1,834
2,185 56,426
200,288 715,684 40,741
299,123 36,830 22,185
4,023,967
220 24,961
129,075 136,796 11,123
617,459 386,955 78,810
175,500 4,915
2,260,733
12,751,568
2,903,380 67,480 30,000
674,828 1,158,840 1,028,160
5,862,688
2,830,784
41,056 406,047 11,310 42,783
807,579 72,690 2,638
5,510 50,736
223,200 834,585 69,072
345,561 43,956 20,336
4,262,945
323 28,439
130,973 52,168 9,722
587,228 366,552 64,320
179,470 4,767
2,391,406
13,886,156
4,007,860 89,705 38,220
655,889 879,120
1,336,900
7,007,694
3,314,996
40,879 (NA) (NA)
43,590
772,588 69,075 2,044
5,689 44,515
239,820 843,313 50,520
385,506 41,674
(NA) 5,662,249
(NA) (NA)
144,906 130,038
(NA) 618,369 432,988 79,940
183,540 6,288
2,453,039
15,565,566
4,816,860 64,965 35,200
475,991 1,438,110 1,505,910
8,337,036
(NA) Not available. (X) Not applicable. 1
Harvested acreage. Yield based on utilized production. 2
Idaho, Michigan, Oregon, and Washington. 3
Yield based on in-shell equivalent. Shelling ratios are: 2010 - 0.580; 2011 - 0.596; 2012 - 0.571. 4
Prices for dried basis. 5
2012 total value of utilized production excludes: avocados, bananas, figs, guavas and papayas.
16 Noncitrus Fruits and Nuts Final Estimates 2007-2012 (October 2014) USDA, National Agricultural Statistics Service
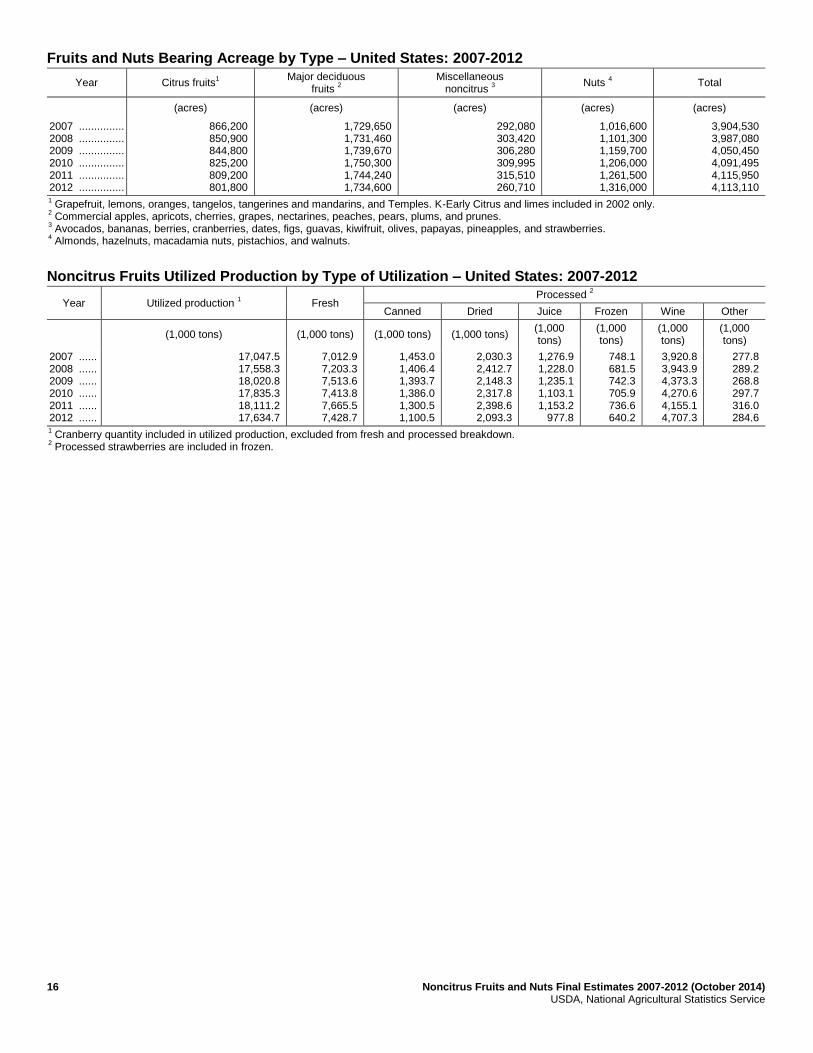
Fruits and Nuts Bearing Acreage by Type – United States: 2007-2012
Year Citrus fruits1
Major deciduous fruits
2
Miscellaneous noncitrus
3
Nuts 4 Total
(acres) (acres) (acres) (acres) (acres)
2007 ............... 2008 ............... 2009 ............... 2010 ............... 2011 ............... 2012 ...............
866,200 850,900 844,800 825,200 809,200 801,800
1,729,650 1,731,460 1,739,670 1,750,300 1,744,240 1,734,600
292,080 303,420 306,280 309,995 315,510 260,710
1,016,600 1,101,300 1,159,700 1,206,000 1,261,500 1,316,000
3,904,530 3,987,080 4,050,450 4,091,495 4,115,950 4,113,110
1 Grapefruit, lemons, oranges, tangelos, tangerines and mandarins, and Temples. K-Early Citrus and limes included in 2002 only.
2 Commercial apples, apricots, cherries, grapes, nectarines, peaches, pears, plums, and prunes.
3 Avocados, bananas, berries, cranberries, dates, figs, guavas, kiwifruit, olives, papayas, pineapples, and strawberries.
4 Almonds, hazelnuts, macadamia nuts, pistachios, and walnuts.
Noncitrus Fruits Utilized Production by Type of Utilization – United States: 2007-2012
Year Utilized production 1 Fresh
Processed 2
Canned Dried Juice Frozen Wine Other
(1,000 tons) (1,000 tons) (1,000 tons) (1,000 tons) (1,000 tons)
(1,000 tons)
(1,000 tons)
(1,000 tons)
2007 ...... 2008 ...... 2009 ...... 2010 ...... 2011 ...... 2012 ......
17,047.5 17,558.3 18,020.8 17,835.3 18,111.2 17,634.7
7,012.9 7,203.3 7,513.6 7,413.8 7,665.5 7,428.7
1,453.0 1,406.4 1,393.7 1,386.0 1,300.5 1,100.5
2,030.3 2,412.7 2,148.3 2,317.8 2,398.6 2,093.3
1,276.9 1,228.0 1,235.1 1,103.1 1,153.2
977.8
748.1 681.5 742.3 705.9 736.6 640.2
3,920.8 3,943.9 4,373.3 4,270.6 4,155.1 4,707.3
277.8 289.2 268.8 297.7 316.0 284.6
1 Cranberry quantity included in utilized production, excluded from fresh and processed breakdown.
2 Processed strawberries are included in frozen.

Noncitrus Fruits and Nuts Final Estimates 2007-2012 (October 2014) 17 USDA, National Agricultural Statistics Service
This page intentionally left blank.
18 Noncitrus Fruits and Nuts Final Estimates 2007-2012 (October 2014) USDA, National Agricultural Statistics Service
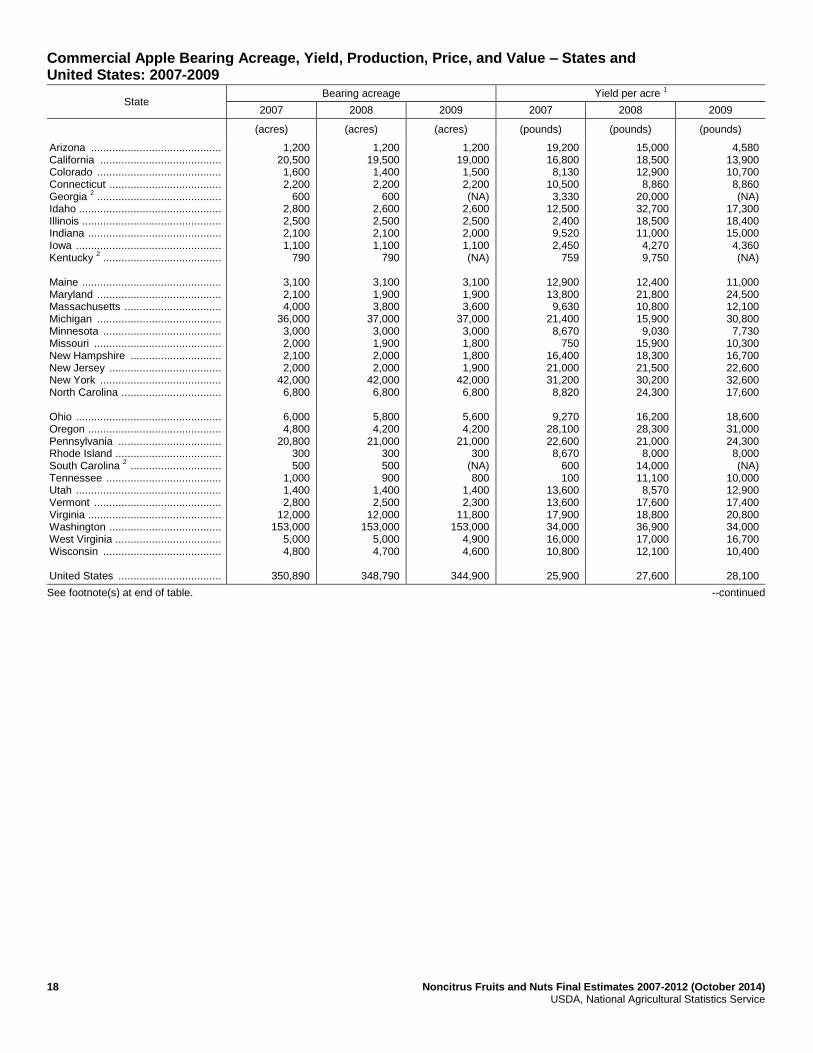
Commercial Apple Bearing Acreage, Yield, Production, Price, and Value – States and United States: 2007-2009
State Bearing acreage Yield per acre
1
2007 2008 2009 2007 2008 2009
(acres) (acres) (acres) (pounds) (pounds) (pounds)
Arizona ........................................... California ........................................ Colorado ......................................... Connecticut ..................................... Georgia
2 .........................................
Idaho ............................................... Illinois .............................................. Indiana ............................................ Iowa ................................................ Kentucky
2 .......................................
Maine .............................................. Maryland ......................................... Massachusetts ................................ Michigan ......................................... Minnesota ....................................... Missouri .......................................... New Hampshire .............................. New Jersey ..................................... New York ........................................ North Carolina ................................. Ohio ................................................ Oregon ............................................ Pennsylvania .................................. Rhode Island ................................... South Carolina
2 ..............................
Tennessee ...................................... Utah ................................................ Vermont .......................................... Virginia ............................................ Washington ..................................... West Virginia ................................... Wisconsin ....................................... United States ..................................
1,200 20,500 1,600 2,200
600 2,800 2,500 2,100 1,100
790
3,100 2,100 4,000
36,000 3,000 2,000 2,100 2,000
42,000 6,800
6,000 4,800
20,800 300 500
1,000 1,400 2,800
12,000 153,000
5,000 4,800
350,890
1,200 19,500 1,400 2,200
600 2,600 2,500 2,100 1,100
790
3,100 1,900 3,800
37,000 3,000 1,900 2,000 2,000
42,000 6,800
5,800 4,200
21,000 300 500 900
1,400 2,500
12,000 153,000
5,000 4,700
348,790
1,200 19,000 1,500 2,200 (NA)
2,600 2,500 2,000 1,100 (NA)
3,100 1,900 3,600
37,000 3,000 1,800 1,800 1,900
42,000 6,800
5,600 4,200
21,000 300
(NA) 800
1,400 2,300
11,800 153,000
4,900 4,600
344,900
19,200 16,800 8,130
10,500 3,330
12,500 2,400 9,520 2,450
759
12,900 13,800 9,630
21,400 8,670
750 16,400 21,000 31,200 8,820
9,270
28,100 22,600 8,670
600 100
13,600 13,600 17,900 34,000 16,000 10,800
25,900
15,000 18,500 12,900 8,860
20,000 32,700 18,500 11,000 4,270 9,750
12,400 21,800 10,800 15,900 9,030
15,900 18,300 21,500 30,200 24,300
16,200 28,300 21,000 8,000
14,000 11,100 8,570
17,600 18,800 36,900 17,000 12,100
27,600
4,580 13,900 10,700 8,860 (NA)
17,300 18,400 15,000 4,360 (NA)
11,000 24,500 12,100 30,800 7,730
10,300 16,700 22,600 32,600 17,600
18,600 31,000 24,300 8,000 (NA)
10,000 12,900 17,400 20,800 34,000 16,700 10,400
28,100
See footnote(s) at end of table. --continued
Noncitrus Fruits and Nuts Final Estimates 2007-2012 (October 2014) 19 USDA, National Agricultural Statistics Service
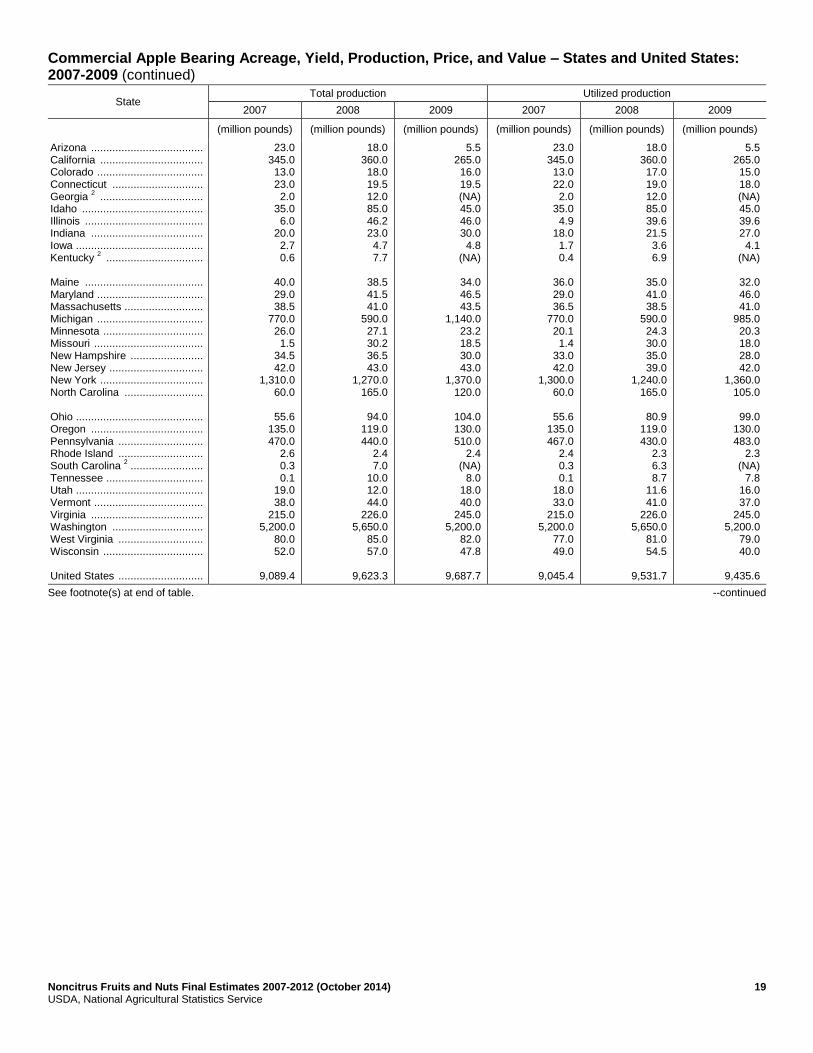
Commercial Apple Bearing Acreage, Yield, Production, Price, and Value – States and United States: 2007-2009 (continued)
State Total production Utilized production
2007 2008 2009 2007 2008 2009
(million pounds) (million pounds) (million pounds) (million pounds) (million pounds) (million pounds)
Arizona ..................................... California .................................. Colorado ................................... Connecticut .............................. Georgia
2 ..................................
Idaho ........................................ Illinois ....................................... Indiana ..................................... Iowa .......................................... Kentucky
2 ................................
Maine ....................................... Maryland ................................... Massachusetts .......................... Michigan ................................... Minnesota ................................. Missouri .................................... New Hampshire ........................ New Jersey ............................... New York .................................. North Carolina .......................... Ohio .......................................... Oregon ..................................... Pennsylvania ............................ Rhode Island ............................ South Carolina
2 ........................
Tennessee ................................ Utah .......................................... Vermont .................................... Virginia ..................................... Washington .............................. West Virginia ............................ Wisconsin ................................. United States ............................
23.0 345.0 13.0 23.0 2.0
35.0 6.0
20.0 2.7 0.6
40.0 29.0 38.5
770.0 26.0 1.5
34.5 42.0
1,310.0 60.0
55.6
135.0 470.0
2.6 0.3 0.1
19.0 38.0
215.0 5,200.0
80.0 52.0
9,089.4
18.0 360.0 18.0 19.5 12.0 85.0 46.2 23.0 4.7 7.7
38.5 41.5 41.0
590.0 27.1 30.2 36.5 43.0
1,270.0 165.0
94.0
119.0 440.0
2.4 7.0
10.0 12.0 44.0
226.0 5,650.0
85.0 57.0
9,623.3
5.5 265.0 16.0 19.5 (NA) 45.0 46.0 30.0 4.8
(NA)
34.0 46.5 43.5
1,140.0 23.2 18.5 30.0 43.0
1,370.0 120.0
104.0 130.0 510.0
2.4 (NA)
8.0 18.0 40.0
245.0 5,200.0
82.0 47.8
9,687.7
23.0 345.0 13.0 22.0 2.0
35.0 4.9
18.0 1.7 0.4
36.0 29.0 36.5
770.0 20.1 1.4
33.0 42.0
1,300.0 60.0
55.6
135.0 467.0
2.4 0.3 0.1
18.0 33.0
215.0 5,200.0
77.0 49.0
9,045.4
18.0 360.0 17.0 19.0 12.0 85.0 39.6 21.5 3.6 6.9
35.0 41.0 38.5
590.0 24.3 30.0 35.0 39.0
1,240.0 165.0
80.9
119.0 430.0
2.3 6.3 8.7
11.6 41.0
226.0 5,650.0
81.0 54.5
9,531.7
5.5 265.0 15.0 18.0 (NA) 45.0 39.6 27.0 4.1
(NA)
32.0 46.0 41.0
985.0 20.3 18.0 28.0 42.0
1,360.0 105.0
99.0
130.0 483.0
2.3 (NA)
7.8 16.0 37.0
245.0 5,200.0
79.0 40.0
9,435.6
See footnote(s) at end of table. --continued
20 Noncitrus Fruits and Nuts Final Estimates 2007-2012 (October 2014) USDA, National Agricultural Statistics Service
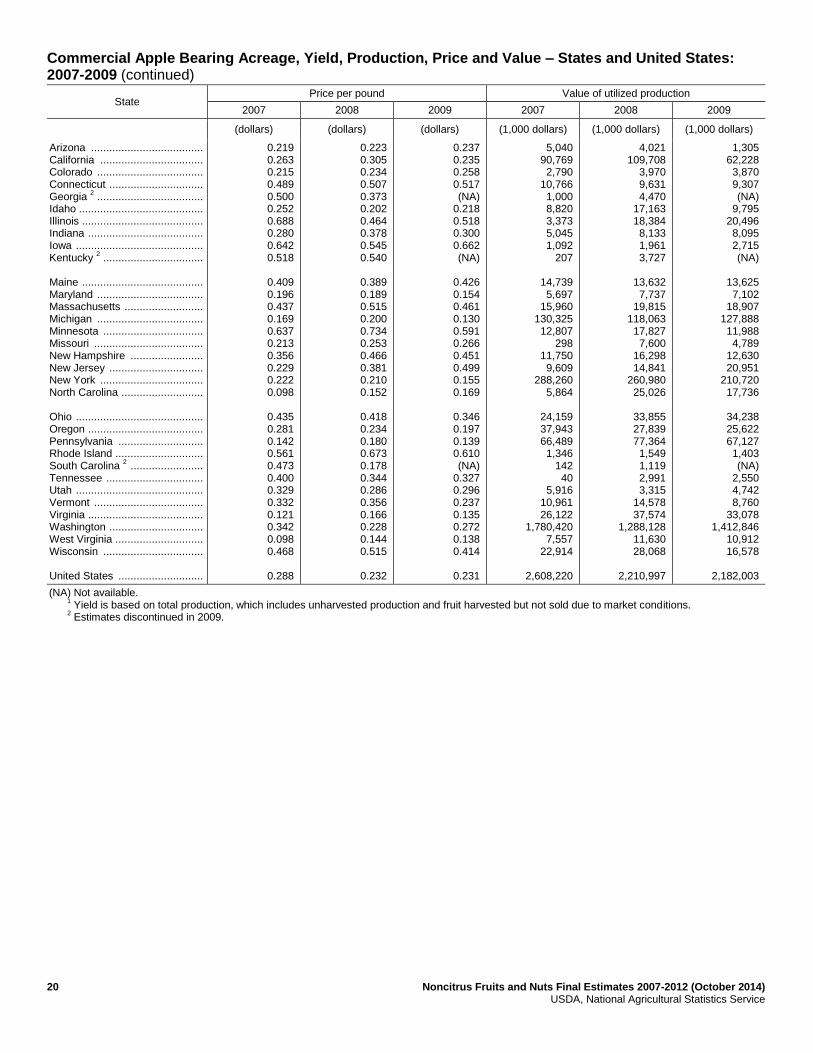
Commercial Apple Bearing Acreage, Yield, Production, Price and Value – States and United States: 2007-2009 (continued)
State Price per pound Value of utilized production
2007 2008 2009 2007 2008 2009
(dollars) (dollars) (dollars) (1,000 dollars) (1,000 dollars) (1,000 dollars)
Arizona ..................................... California .................................. Colorado ................................... Connecticut ............................... Georgia
2 ...................................
Idaho ......................................... Illinois ........................................ Indiana ...................................... Iowa .......................................... Kentucky
2 .................................
Maine ........................................ Maryland ................................... Massachusetts .......................... Michigan ................................... Minnesota ................................. Missouri .................................... New Hampshire ........................ New Jersey ............................... New York .................................. North Carolina ........................... Ohio .......................................... Oregon ...................................... Pennsylvania ............................ Rhode Island ............................. South Carolina
2 ........................
Tennessee ................................ Utah .......................................... Vermont .................................... Virginia ...................................... Washington ............................... West Virginia ............................. Wisconsin ................................. United States ............................
0.219 0.263 0.215 0.489 0.500 0.252 0.688 0.280 0.642 0.518
0.409 0.196 0.437 0.169 0.637 0.213 0.356 0.229 0.222 0.098
0.435 0.281 0.142 0.561 0.473 0.400 0.329 0.332 0.121 0.342 0.098 0.468
0.288
0.223 0.305 0.234 0.507 0.373 0.202 0.464 0.378 0.545 0.540
0.389 0.189 0.515 0.200 0.734 0.253 0.466 0.381 0.210 0.152
0.418 0.234 0.180 0.673 0.178 0.344 0.286 0.356 0.166 0.228 0.144 0.515
0.232
0.237 0.235 0.258 0.517 (NA)
0.218 0.518 0.300 0.662 (NA)
0.426 0.154 0.461 0.130 0.591 0.266 0.451 0.499 0.155 0.169
0.346 0.197 0.139 0.610 (NA)
0.327 0.296 0.237 0.135 0.272 0.138 0.414
0.231
5,040 90,769 2,790
10,766 1,000 8,820 3,373 5,045 1,092
207
14,739 5,697
15,960 130,325 12,807
298 11,750 9,609
288,260 5,864
24,159 37,943 66,489 1,346
142 40
5,916 10,961 26,122
1,780,420 7,557
22,914
2,608,220
4,021 109,708
3,970 9,631 4,470
17,163 18,384 8,133 1,961 3,727
13,632 7,737
19,815 118,063 17,827 7,600
16,298 14,841
260,980 25,026
33,855 27,839 77,364 1,549 1,119 2,991 3,315
14,578 37,574
1,288,128 11,630 28,068
2,210,997
1,305 62,228 3,870 9,307 (NA)
9,795 20,496 8,095 2,715 (NA)
13,625 7,102
18,907 127,888 11,988 4,789
12,630 20,951
210,720 17,736
34,238 25,622 67,127 1,403 (NA)
2,550 4,742 8,760
33,078 1,412,846
10,912 16,578
2,182,003
(NA) Not available. 1
Yield is based on total production, which includes unharvested production and fruit harvested but not sold due to market conditions. 2
Estimates discontinued in 2009.
Noncitrus Fruits and Nuts Final Estimates 2007-2012 (October 2014) 21 USDA, National Agricultural Statistics Service
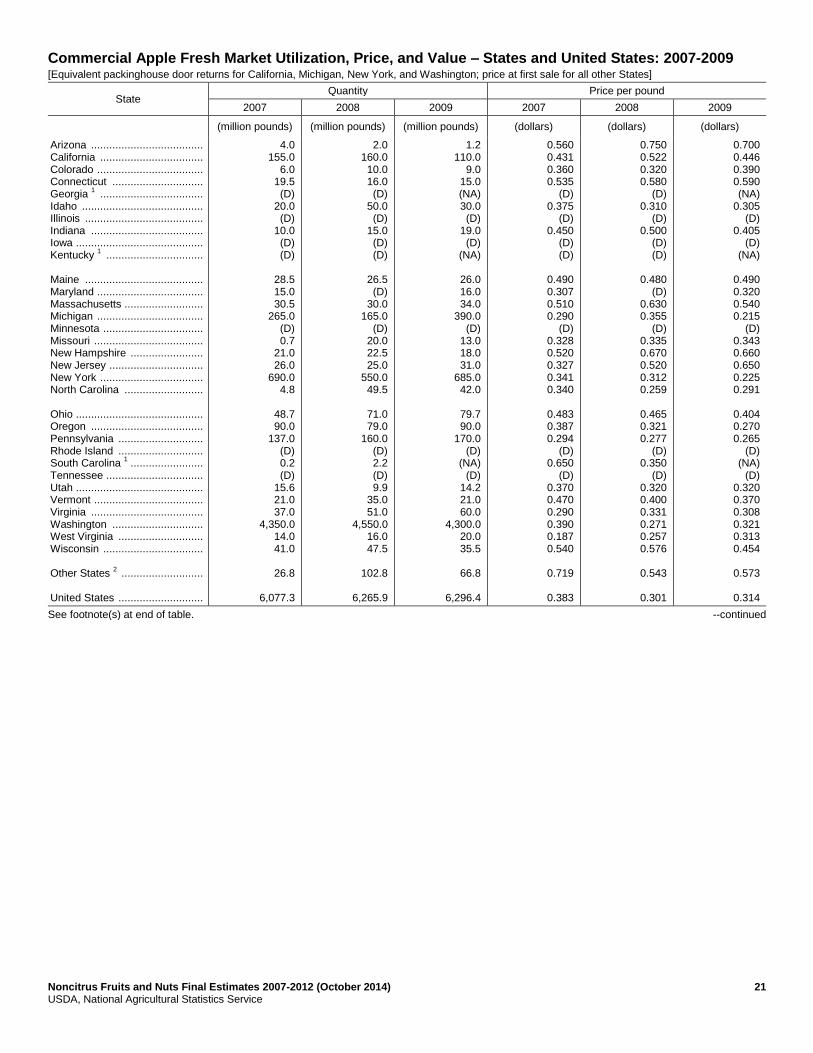
Commercial Apple Fresh Market Utilization, Price, and Value – States and United States: 2007-2009 [Equivalent packinghouse door returns for California, Michigan, New York, and Washington; price at first sale for all other States]
State Quantity Price per pound
2007 2008 2009 2007 2008 2009
(million pounds) (million pounds) (million pounds) (dollars) (dollars) (dollars)
Arizona ..................................... California .................................. Colorado ................................... Connecticut .............................. Georgia
1 ..................................
Idaho ........................................ Illinois ....................................... Indiana ..................................... Iowa .......................................... Kentucky
1 ................................
Maine ....................................... Maryland ................................... Massachusetts .......................... Michigan ................................... Minnesota ................................. Missouri .................................... New Hampshire ........................ New Jersey ............................... New York .................................. North Carolina .......................... Ohio .......................................... Oregon ..................................... Pennsylvania ............................ Rhode Island ............................ South Carolina
1 ........................
Tennessee ................................ Utah .......................................... Vermont .................................... Virginia ..................................... Washington .............................. West Virginia ............................ Wisconsin ................................. Other States
2 ...........................
United States ............................
4.0 155.0
6.0 19.5 (D)
20.0 (D)
10.0 (D) (D)
28.5 15.0 30.5
265.0 (D) 0.7
21.0 26.0
690.0 4.8
48.7 90.0
137.0 (D) 0.2 (D)
15.6 21.0 37.0
4,350.0 14.0 41.0
26.8
6,077.3
2.0 160.0 10.0 16.0 (D)
50.0 (D)
15.0 (D) (D)
26.5 (D)
30.0 165.0
(D) 20.0 22.5 25.0
550.0 49.5
71.0 79.0
160.0 (D) 2.2 (D) 9.9
35.0 51.0
4,550.0 16.0 47.5
102.8
6,265.9
1.2 110.0
9.0 15.0 (NA) 30.0 (D)
19.0 (D)
(NA)
26.0 16.0 34.0
390.0 (D)
13.0 18.0 31.0
685.0 42.0
79.7 90.0
170.0 (D)
(NA) (D)
14.2 21.0 60.0
4,300.0 20.0 35.5
66.8
6,296.4
0.560 0.431 0.360 0.535
(D) 0.375
(D) 0.450
(D) (D)
0.490 0.307 0.510 0.290
(D) 0.328 0.520 0.327 0.341 0.340
0.483 0.387 0.294
(D) 0.650
(D) 0.370 0.470 0.290 0.390 0.187 0.540
0.719
0.383
0.750 0.522 0.320 0.580
(D) 0.310
(D) 0.500
(D) (D)
0.480
(D) 0.630 0.355
(D) 0.335 0.670 0.520 0.312 0.259
0.465 0.321 0.277
(D) 0.350
(D) 0.320 0.400 0.331 0.271 0.257 0.576
0.543
0.301
0.700 0.446 0.390 0.590 (NA)
0.305 (D)
0.405 (D)
(NA)
0.490 0.320 0.540 0.215
(D) 0.343 0.660 0.650 0.225 0.291
0.404 0.270 0.265
(D) (NA)
(D) 0.320 0.370 0.308 0.321 0.313 0.454
0.573
0.314
See footnote(s) at end of table. --continued
22 Noncitrus Fruits and Nuts Final Estimates 2007-2012 (October 2014) USDA, National Agricultural Statistics Service
Commercial Apple Fresh Market Utilization, Price, and Value – States and United States: 2007-2009 (continued)
State Value of production
2007 2008 2009
(1,000 dollars) (1,000 dollars) (1,000 dollars)
Arizona ..................................... California .................................. Colorado ................................... Connecticut ............................... Georgia
1 ...................................
Idaho ......................................... Illinois ........................................ Indiana ...................................... Iowa .......................................... Kentucky
1 .................................
Maine ........................................ Maryland ................................... Massachusetts .......................... Michigan ................................... Minnesota ................................. Missouri .................................... New Hampshire ........................ New Jersey ............................... New York .................................. North Carolina ........................... Ohio .......................................... Oregon ...................................... Pennsylvania ............................ Rhode Island ............................. South Carolina
1 ........................
Tennessee ................................ Utah .......................................... Vermont .................................... Virginia ...................................... Washington ............................... West Virginia ............................. Wisconsin ................................. Other States
2 ...........................
United States ............................
2,240 66,805 2,160
10,433 (D)
7,500 (D)
4,500 (D) (D)
13,965 4,605
15,555 76,850
(D) 230
10,920 8,502
235,290 1,632
23,522 34,830 40,278
(D) 130 (D)
5,772 9,870
10,730 1,696,500
2,618 22,140
19,273
2,326,850
1,500 83,520 3,200 9,280
(D) 15,500
(D) 7,500
(D) (D)
12,720
(D) 18,900 58,575
(D) 6,700
15,075 13,000
171,600 12,821
33,015 25,359 44,320
(D) 770 (D)
3,168 14,000 16,881
1,233,050 4,112
27,360
55,806
1,887,732
840 49,060 3,510 8,850 (NA)
9,150 (D)
7,695 (D)
(NA)
12,740 5,120
18,360 83,850
(D) 4,459
11,880 20,150
154,125 12,222
32,199 24,300 45,050
(D) (NA)
(D) 4,544 7,770
18,480 1,380,300
6,260 16,117
38,246
1,975,277
See footnote(s) at end of table. --continued

Noncitrus Fruits and Nuts Final Estimates 2007-2012 (October 2014) 23 USDA, National Agricultural Statistics Service
Commercial Apple Processed Utilization, Price, and Value – States and United States: 2007-2009
State Quantity Price per ton
2007 2008 2009 2007 2008 2009
(million pounds) (million pounds) (million pounds) (dollars) (dollars) (dollars)
Arizona ..................................... California .................................. Colorado ................................... Connecticut .............................. Georgia
1 ..................................
Idaho ........................................ Illinois ....................................... Indiana ..................................... Iowa .......................................... Kentucky
1 ................................
Maine ....................................... Maryland ................................... Massachusetts .......................... Michigan ................................... Minnesota ................................. Missouri .................................... New Hampshire ........................ New Jersey ............................... New York .................................. North Carolina .......................... Ohio .......................................... Oregon ..................................... Pennsylvania ............................ Rhode Island ............................ South Carolina
1 ........................
Tennessee ................................ Utah .......................................... Vermont .................................... Virginia ..................................... Washington .............................. West Virginia ............................ Wisconsin ................................. Other States
2 ...........................
United States ............................
19.0 190.0
7.0 2.5 (D)
15.0 (D) 8.0 (D) (D)
7.5
14.0 6.0
505.0 (D) 0.7
12.0 16.0
610.0 55.2
6.9
45.0 330.0
(D) 0.1 (D) 2.4
12.0 178.0 850.0 63.0 8.0
4.8
2,968.1
16.0 200.0
7.0 3.0 (D)
35.0 (D) 6.5 (D) (D)
8.5 (D) 8.5
425.0 (D)
10.0 12.5 14.0
690.0 115.5
9.9
40.0 270.0
(D) 4.1 (D) 1.7 6.0
175.0 1,100.0
65.0 7.0
35.6
3,265.8
4.3 155.0
6.0 3.0
(NA) 15.0 (D) 8.0 (D)
(NA)
6.0 30.0 7.0
595.0 (D) 5.0
10.0 11.0
675.0 63.0
19.3 40.0
313.0 (D)
(NA) (D) 1.8
16.0 185.0 900.0 59.0 4.5
7.3
3,139.2
295.00 252.00 180.00 266.00
(D) 176.00
(D) 136.00
(D) (D)
206.00 156.00 135.00 212.00
(D) 194.00 138.00 138.00 174.00 153.00
185.00 138.00 159.00
(D) 240.00
(D) 120.00 182.00 154.00 197.00 157.00 194.00
247.00
190.00
315.00 262.00 220.00 234.00
(D) 95.00
(D) 195.00
(D) (D)
215.00
(D) 215.00 280.00
(D) 180.00 196.00 263.00 259.00 211.00
170.00 124.00 245.00
(D) 170.00
(D) 173.00 193.00 236.00 100.00 231.00 202.00
160.00
198.00
216.00 170.00 120.00 305.00
(NA) 86.00
(D) 100.00
(D) (NA)
295.00 132.00 156.00 148.00
(D) 132.00 150.00 146.00 168.00 175.00
211.00 66.10
141.00 (D)
(NA) (D)
220.00 124.00 158.00 72.30
158.00 205.00
248.00
132.00
See footnote(s) at end of table. --continued
24 Noncitrus Fruits and Nuts Final Estimates 2007-2012 (October 2014) USDA, National Agricultural Statistics Service
Commercial Apple Processed Utilization, Price, and Value – States and United States: 2007-2009 (continued)
State Value of production
2007 2008 2009
(1,000 dollars) (1,000 dollars) (1,000 dollars)
Arizona ..................................... California .................................. Colorado ................................... Connecticut ............................... Georgia ..................................... Idaho ......................................... Indiana ...................................... Iowa .......................................... Kentucky ................................... Maine ........................................ Maryland ................................... Massachusetts .......................... Michigan ................................... Minnesota ................................. Missouri .................................... New Hampshire ........................ New Jersey ............................... New York .................................. North Carolina ........................... Ohio .......................................... Oregon ...................................... Pennsylvania ............................ Rhode Island ............................. South Carolina .......................... Tennessee ................................ Utah .......................................... Vermont .................................... Virginia ...................................... Washington ............................... West Virginia ............................. Wisconsin ................................. Other States
2 ...........................
United States ............................
2,800 23,964
630 333 (D)
1,320 545 (D) (D)
774
1,092 405
53,475 (D) 68
830 1,107
52,970 4,232
637
3,113 26,211
(D) 12
(D) 144
1,091 15,392 83,920 4,939
774
592
281,370
2,521 26,188
770 351 (D)
1,663 633 (D) (D)
912 (D) 915
59,488 (D) 900
1,223 1,841
89,380 12,205
840
2,480 33,044
(D) 349 (D) 147 578
20,693 55,078 7,518
708
2,840
323,265
465 13,168
360 457 (D) 645 400 (D) (D)
885
1,982 547
44,038 (D) 330 750 801
56,595 5,514
2,039 1,322
22,077 (D) (D) (D) 198 990
14,598 32,546 4,652
461
906
206,726
(D) Withheld to avoid disclosing data for individual operations. 1
Estimates discontinued in 2009. 2
Includes data withheld above and/or data for States not listed in this table.
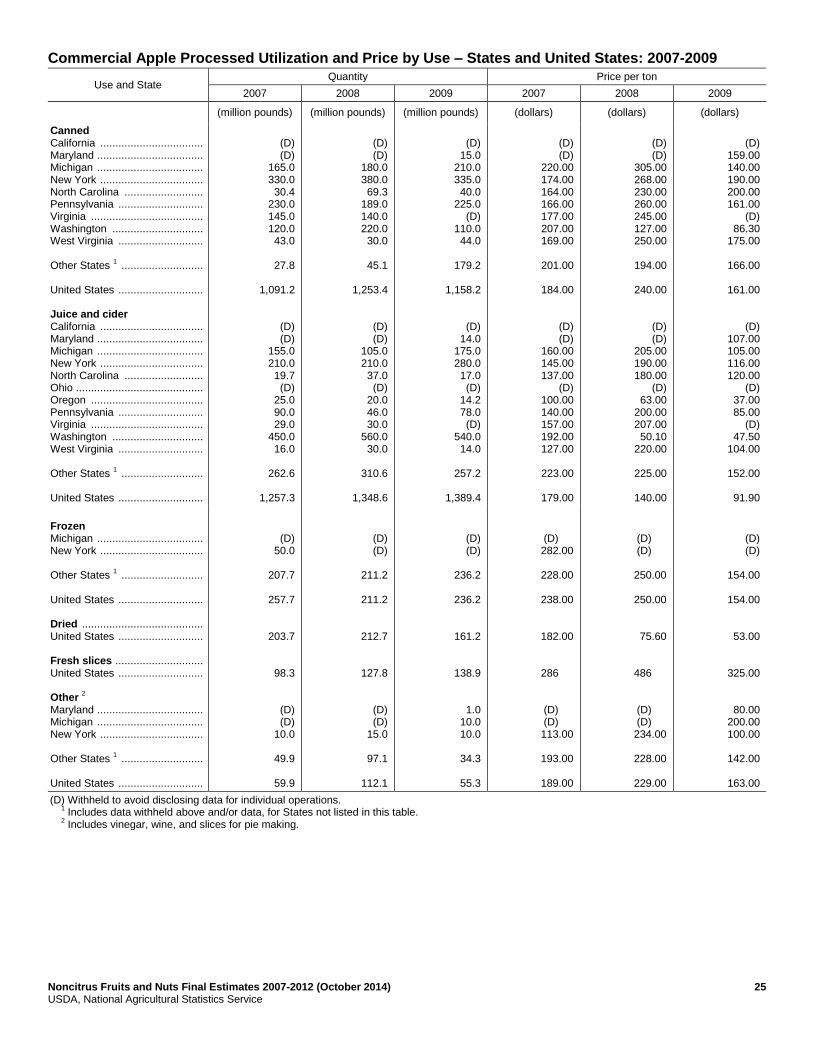
Noncitrus Fruits and Nuts Final Estimates 2007-2012 (October 2014) 25 USDA, National Agricultural Statistics Service
Commercial Apple Processed Utilization and Price by Use – States and United States: 2007-2009
Use and State Quantity Price per ton
2007 2008 2009 2007 2008 2009
(million pounds) (million pounds) (million pounds) (dollars) (dollars) (dollars)
Canned California .................................. Maryland ................................... Michigan ................................... New York .................................. North Carolina .......................... Pennsylvania ............................ Virginia ..................................... Washington .............................. West Virginia ............................ Other States
1 ...........................
United States ............................ Juice and cider California .................................. Maryland ................................... Michigan ................................... New York .................................. North Carolina .......................... Ohio .......................................... Oregon ..................................... Pennsylvania ............................ Virginia ..................................... Washington .............................. West Virginia ............................ Other States
1 ...........................
United States ............................
(D) (D)
165.0 330.0 30.4
230.0 145.0 120.0 43.0
27.8
1,091.2
(D) (D)
155.0 210.0 19.7 (D)
25.0 90.0 29.0
450.0 16.0
262.6
1,257.3
(D) (D)
180.0 380.0 69.3
189.0 140.0 220.0 30.0
45.1
1,253.4
(D) (D)
105.0 210.0 37.0 (D)
20.0 46.0 30.0
560.0 30.0
310.6
1,348.6
(D)
15.0 210.0 335.0 40.0
225.0 (D)
110.0 44.0
179.2
1,158.2
(D) 14.0
175.0 280.0 17.0 (D)
14.2 78.0 (D)
540.0 14.0
257.2
1,389.4
(D) (D)
220.00 174.00 164.00 166.00 177.00 207.00 169.00
201.00
184.00
(D) (D)
160.00 145.00 137.00
(D) 100.00 140.00 157.00 192.00 127.00
223.00
179.00
(D) (D)
305.00 268.00 230.00 260.00 245.00 127.00 250.00
194.00
240.00
(D) (D)
205.00 190.00 180.00
(D) 63.00
200.00 207.00 50.10
220.00
225.00
140.00
(D)
159.00 140.00 190.00 200.00 161.00
(D) 86.30
175.00
166.00
161.00
(D) 107.00 105.00 116.00 120.00
(D) 37.00 85.00
(D) 47.50
104.00
152.00
91.90
Frozen Michigan ................................... New York .................................. Other States
1 ...........................
United States ............................ Dried ........................................ United States ............................ Fresh slices ............................. United States ............................ Other
2
Maryland ................................... Michigan ................................... New York .................................. Other States
1 ...........................
United States ............................
(D) 50.0
207.7
257.7
203.7
98.3
(D) (D)
10.0
49.9
59.9
(D) (D)
211.2
211.2
212.7
127.8
(D) (D)
15.0
97.1
112.1
(D) (D)
236.2
236.2
161.2
138.9
1.0 10.0 10.0
34.3
55.3
(D) 282.00
228.00
238.00
182.00
286
(D) (D) 113.00
193.00
189.00
(D) (D)
250.00
250.00
75.60
486
(D) (D) 234.00
228.00
229.00
(D) (D)
154.00
154.00
53.00
325.00
80.00 200.00 100.00
142.00
163.00
(D) Withheld to avoid disclosing data for individual operations. 1
Includes data withheld above and/or data, for States not listed in this table. 2
Includes vinegar, wine, and slices for pie making.
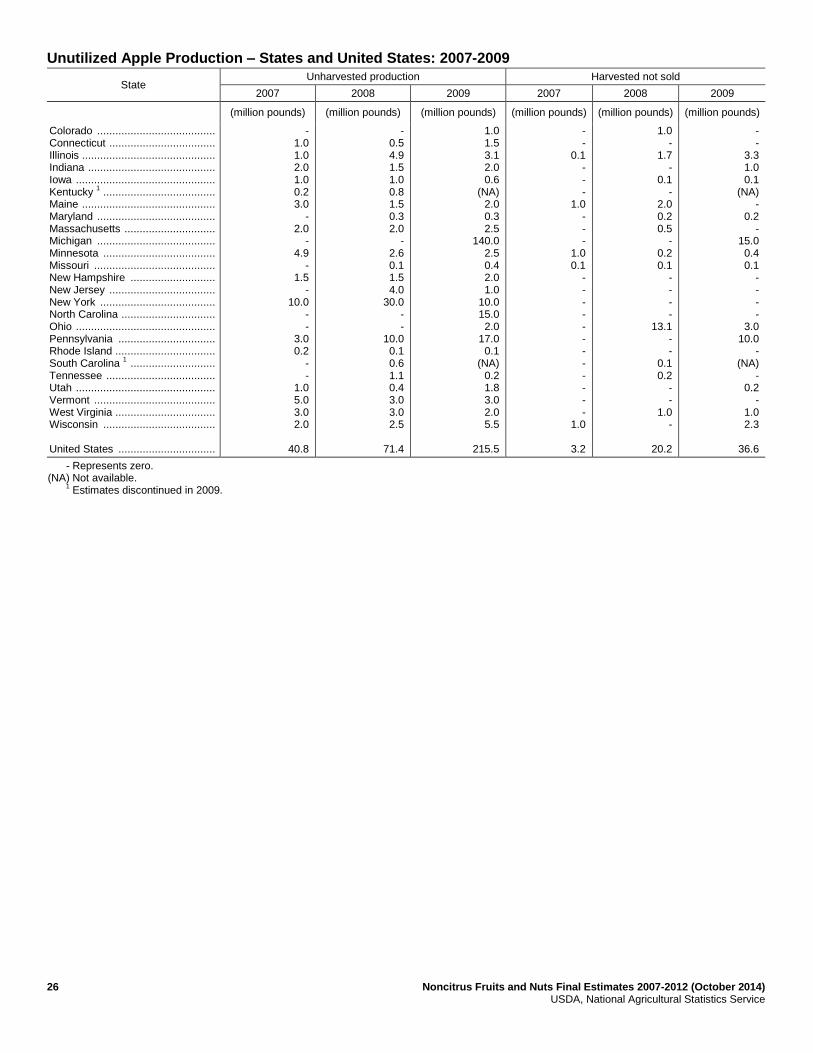
26 Noncitrus Fruits and Nuts Final Estimates 2007-2012 (October 2014) USDA, National Agricultural Statistics Service
Unutilized Apple Production – States and United States: 2007-2009
State Unharvested production Harvested not sold
2007 2008 2009 2007 2008 2009
(million pounds) (million pounds) (million pounds) (million pounds) (million pounds) (million pounds)
Colorado ....................................... Connecticut ................................... Illinois ............................................ Indiana .......................................... Iowa .............................................. Kentucky
1 .....................................
Maine ............................................ Maryland ....................................... Massachusetts .............................. Michigan ....................................... Minnesota ..................................... Missouri ........................................ New Hampshire ............................ New Jersey ................................... New York ...................................... North Carolina ............................... Ohio .............................................. Pennsylvania ................................ Rhode Island ................................. South Carolina
1 ............................
Tennessee .................................... Utah .............................................. Vermont ........................................ West Virginia ................................. Wisconsin ..................................... United States ................................
- 1.0 1.0 2.0 1.0 0.2 3.0
- 2.0
- 4.9
- 1.5
- 10.0
- -
3.0 0.2
- -
1.0 5.0 3.0 2.0
40.8
- 0.5 4.9 1.5 1.0 0.8 1.5 0.3 2.0
- 2.6 0.1 1.5 4.0
30.0 - -
10.0 0.1 0.6 1.1 0.4 3.0 3.0 2.5
71.4
1.0 1.5 3.1 2.0 0.6
(NA) 2.0 0.3 2.5
140.0 2.5 0.4 2.0 1.0
10.0 15.0 2.0
17.0 0.1
(NA) 0.2 1.8 3.0 2.0 5.5
215.5
- -
0.1 - - -
1.0 - - -
1.0 0.1
- - - - - - - - - - - -
1.0
3.2
1.0 -
1.7 -
0.1 -
2.0 0.2 0.5
- 0.2 0.1
- - - -
13.1 - -
0.1 0.2
- -
1.0 -
20.2
- -
3.3 1.0 0.1
(NA) -
0.2 -
15.0 0.4 0.1
- - - -
3.0 10.0
- (NA)
- 0.2
- 1.0 2.3
36.6
- Represents zero. (NA) Not available. 1
Estimates discontinued in 2009.
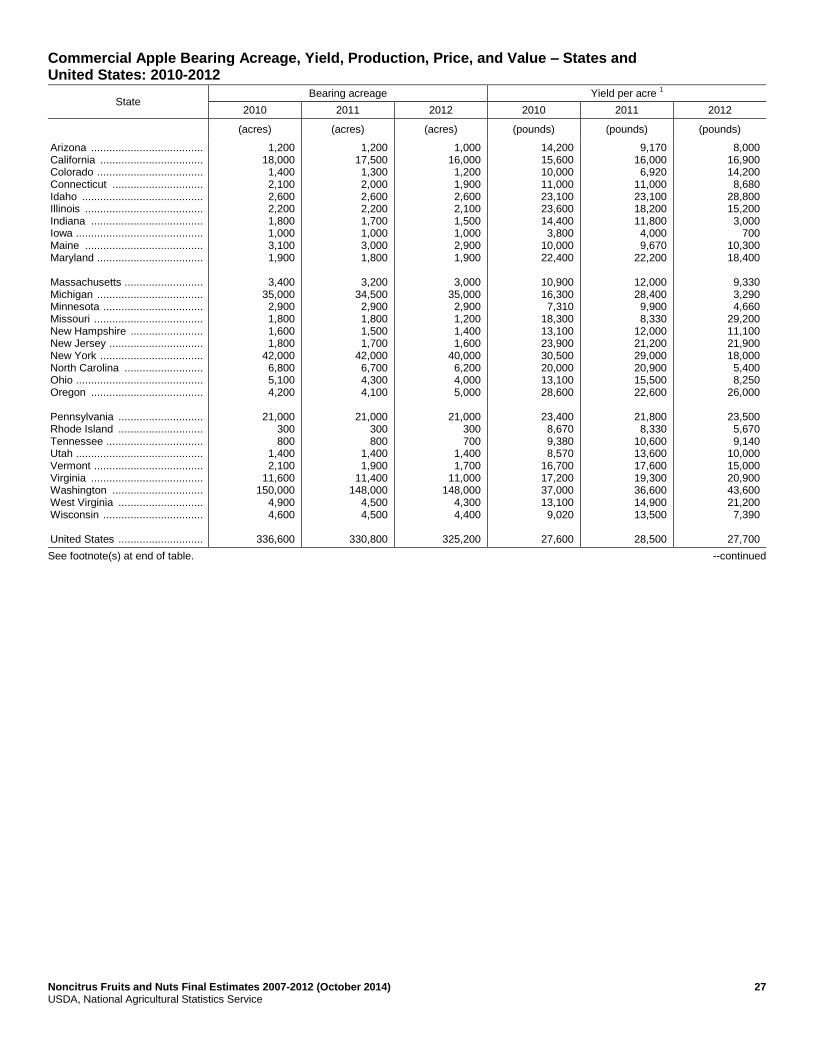
Noncitrus Fruits and Nuts Final Estimates 2007-2012 (October 2014) 27 USDA, National Agricultural Statistics Service
Commercial Apple Bearing Acreage, Yield, Production, Price, and Value – States and United States: 2010-2012
State Bearing acreage Yield per acre
1
2010 2011 2012 2010 2011 2012
(acres) (acres) (acres) (pounds) (pounds) (pounds)
Arizona ..................................... California .................................. Colorado ................................... Connecticut .............................. Idaho ........................................ Illinois ....................................... Indiana ..................................... Iowa .......................................... Maine ....................................... Maryland ................................... Massachusetts .......................... Michigan ................................... Minnesota ................................. Missouri .................................... New Hampshire ........................ New Jersey ............................... New York .................................. North Carolina .......................... Ohio .......................................... Oregon ..................................... Pennsylvania ............................ Rhode Island ............................ Tennessee ................................ Utah .......................................... Vermont .................................... Virginia ..................................... Washington .............................. West Virginia ............................ Wisconsin ................................. United States ............................
1,200 18,000 1,400 2,100 2,600 2,200 1,800 1,000 3,100 1,900
3,400
35,000 2,900 1,800 1,600 1,800
42,000 6,800 5,100 4,200
21,000
300 800
1,400 2,100
11,600 150,000
4,900 4,600
336,600
1,200 17,500 1,300 2,000 2,600 2,200 1,700 1,000 3,000 1,800
3,200
34,500 2,900 1,800 1,500 1,700
42,000 6,700 4,300 4,100
21,000
300 800
1,400 1,900
11,400 148,000
4,500 4,500
330,800
1,000 16,000 1,200 1,900 2,600 2,100 1,500 1,000 2,900 1,900
3,000
35,000 2,900 1,200 1,400 1,600
40,000 6,200 4,000 5,000
21,000
300 700
1,400 1,700
11,000 148,000
4,300 4,400
325,200
14,200 15,600 10,000 11,000 23,100 23,600 14,400 3,800
10,000 22,400
10,900 16,300 7,310
18,300 13,100 23,900 30,500 20,000 13,100 28,600
23,400 8,670 9,380 8,570
16,700 17,200 37,000 13,100 9,020
27,600
9,170 16,000 6,920
11,000 23,100 18,200 11,800 4,000 9,670
22,200
12,000 28,400 9,900 8,330
12,000 21,200 29,000 20,900 15,500 22,600
21,800 8,330
10,600 13,600 17,600 19,300 36,600 14,900 13,500
28,500
8,000 16,900 14,200 8,680
28,800 15,200 3,000
700 10,300 18,400
9,330 3,290 4,660
29,200 11,100 21,900 18,000 5,400 8,250
26,000
23,500 5,670 9,140
10,000 15,000 20,900 43,600 21,200 7,390
27,700
See footnote(s) at end of table. --continued
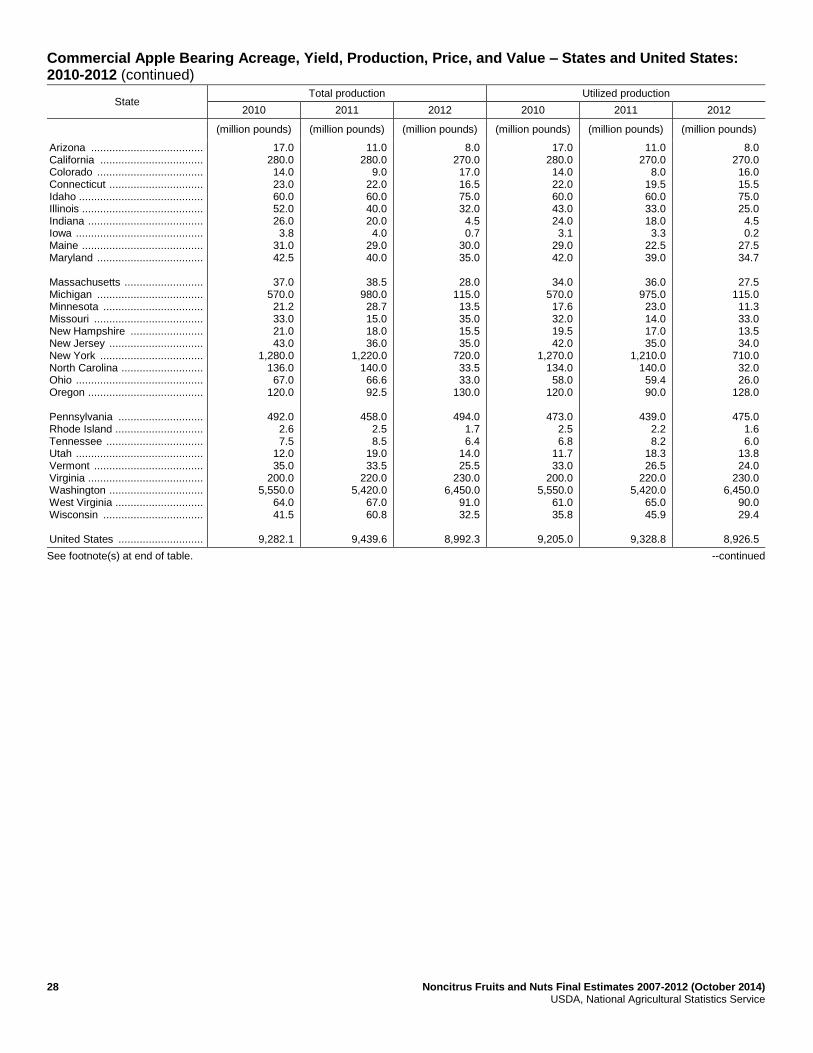
28 Noncitrus Fruits and Nuts Final Estimates 2007-2012 (October 2014) USDA, National Agricultural Statistics Service
Commercial Apple Bearing Acreage, Yield, Production, Price, and Value – States and United States: 2010-2012 (continued)
State Total production Utilized production
2010 2011 2012 2010 2011 2012
(million pounds) (million pounds) (million pounds) (million pounds) (million pounds) (million pounds)
Arizona ..................................... California .................................. Colorado ................................... Connecticut ............................... Idaho ......................................... Illinois ........................................ Indiana ...................................... Iowa .......................................... Maine ........................................ Maryland ................................... Massachusetts .......................... Michigan ................................... Minnesota ................................. Missouri .................................... New Hampshire ........................ New Jersey ............................... New York .................................. North Carolina ........................... Ohio .......................................... Oregon ...................................... Pennsylvania ............................ Rhode Island ............................. Tennessee ................................ Utah .......................................... Vermont .................................... Virginia ...................................... Washington ............................... West Virginia ............................. Wisconsin ................................. United States ............................
17.0 280.0 14.0 23.0 60.0 52.0 26.0 3.8
31.0 42.5
37.0
570.0 21.2 33.0 21.0 43.0
1,280.0 136.0 67.0
120.0
492.0 2.6 7.5
12.0 35.0
200.0 5,550.0
64.0 41.5
9,282.1
11.0 280.0
9.0 22.0 60.0 40.0 20.0 4.0
29.0 40.0
38.5
980.0 28.7 15.0 18.0 36.0
1,220.0 140.0 66.6 92.5
458.0
2.5 8.5
19.0 33.5
220.0 5,420.0
67.0 60.8
9,439.6
8.0 270.0 17.0 16.5 75.0 32.0 4.5 0.7
30.0 35.0
28.0
115.0 13.5 35.0 15.5 35.0
720.0 33.5 33.0
130.0
494.0 1.7 6.4
14.0 25.5
230.0 6,450.0
91.0 32.5
8,992.3
17.0 280.0 14.0 22.0 60.0 43.0 24.0 3.1
29.0 42.0
34.0
570.0 17.6 32.0 19.5 42.0
1,270.0 134.0 58.0
120.0
473.0 2.5 6.8
11.7 33.0
200.0 5,550.0
61.0 35.8
9,205.0
11.0 270.0
8.0 19.5 60.0 33.0 18.0 3.3
22.5 39.0
36.0
975.0 23.0 14.0 17.0 35.0
1,210.0 140.0 59.4 90.0
439.0
2.2 8.2
18.3 26.5
220.0 5,420.0
65.0 45.9
9,328.8
8.0 270.0 16.0 15.5 75.0 25.0 4.5 0.2
27.5 34.7
27.5
115.0 11.3 33.0 13.5 34.0
710.0 32.0 26.0
128.0
475.0 1.6 6.0
13.8 24.0
230.0 6,450.0
90.0 29.4
8,926.5
See footnote(s) at end of table. --continued

Noncitrus Fruits and Nuts Final Estimates 2007-2012 (October 2014) 29 USDA, National Agricultural Statistics Service
Commercial Apple Bearing Acreage, Yield, Production, Price, and Value – States and United States: 2010-2012 (continued)
State Price per pound Value of utilized production
2010 2011 2012 2010 2011 2012
(dollars) (dollars) (dollars) (1,000 dollars) (1,000 dollars) (1,000 dollars)
Arizona ..................................... California .................................. Colorado ................................... Connecticut .............................. Idaho ........................................ Illinois ....................................... Indiana ..................................... Iowa .......................................... Maine ....................................... Maryland ................................... Massachusetts .......................... Michigan ................................... Minnesota ................................. Missouri .................................... New Hampshire ........................ New Jersey ............................... New York .................................. North Carolina .......................... Ohio .......................................... Oregon ..................................... Pennsylvania ............................ Rhode Island ............................ Tennessee ................................ Utah .......................................... Vermont .................................... Virginia ..................................... Washington .............................. West Virginia ............................ Wisconsin ................................. United States ............................
0.179 0.207 0.216 0.539 0.232 0.617 0.403 0.719 0.461 0.182
0.570 0.181 0.797 0.301 0.463 0.480 0.175 0.185 0.364 0.224
0.158 0.820 0.305 0.250 0.309 0.154 0.278 0.144 0.523
0.251
0.241 0.215 0.293 0.539 0.239 0.575 0.398 0.663 0.474 0.259
0.603 0.207 0.832 0.313 0.505 0.672 0.202 0.192 0.367 0.221
0.182 0.793 0.279 0.222 0.304 0.182 0.357 0.175 0.497
0.303
0.217 0.241 0.304 0.654 0.320 0.557 0.396 0.675 0.560 0.402
0.623 0.352 0.825 0.471 0.581 0.839 0.352 0.313 0.336 0.250
0.281 0.851 0.480 0.263 0.434 0.297 0.385 0.258 0.649
0.371
3,048 57,820 3,020
11,853 13,910 26,548 9,672 2,228
13,371 7,650
19,366
103,375 14,029 9,635 9,036
20,180 221,620 24,793 21,124 26,855
74,896 2,050 2,076 2,928
10,210 30,760
1,541,420 8,797
18,712
2,310,982
2,647 57,975 2,340
10,507 14,350 18,989 7,166 2,187
10,676 10,115
21,690
201,650 19,126 4,379 8,588
23,505 244,000 26,863 21,808 19,861
79,739 1,745 2,290 4,054 8,044
40,055 1,932,260
11,371 22,804
2,830,784
1,738 64,970 4,860
10,130 24,000 13,928 1,784
135 15,388 13,939
17,123 40,475 9,322
15,554 7,845
28,540 249,790 10,016 8,735
32,018
133,595 1,362 2,880 3,635
10,405 68,220
2,482,350 23,193 19,066
3,314,996
1 Yield is based on total production, which includes unharvested production and fruit harvested but not sold due to market conditions.
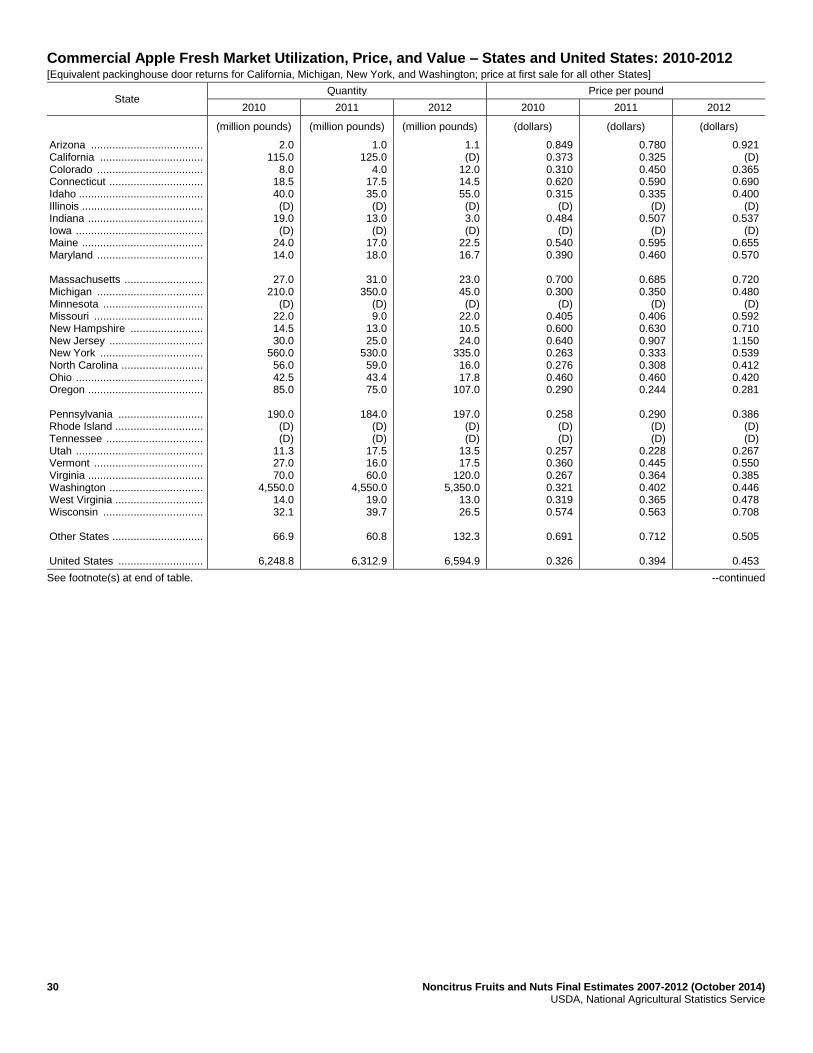
30 Noncitrus Fruits and Nuts Final Estimates 2007-2012 (October 2014) USDA, National Agricultural Statistics Service
Commercial Apple Fresh Market Utilization, Price, and Value – States and United States: 2010-2012 [Equivalent packinghouse door returns for California, Michigan, New York, and Washington; price at first sale for all other States]
State Quantity Price per pound
2010 2011 2012 2010 2011 2012
(million pounds) (million pounds) (million pounds) (dollars) (dollars) (dollars)
Arizona ..................................... California .................................. Colorado ................................... Connecticut ............................... Idaho ......................................... Illinois ........................................ Indiana ...................................... Iowa .......................................... Maine ........................................ Maryland ................................... Massachusetts .......................... Michigan ................................... Minnesota ................................. Missouri .................................... New Hampshire ........................ New Jersey ............................... New York .................................. North Carolina ........................... Ohio .......................................... Oregon ...................................... Pennsylvania ............................ Rhode Island ............................. Tennessee ................................ Utah .......................................... Vermont .................................... Virginia ...................................... Washington ............................... West Virginia ............................. Wisconsin ................................. Other States .............................. United States ............................
2.0 115.0
8.0 18.5 40.0 (D)
19.0 (D)
24.0 14.0
27.0
210.0 (D)
22.0 14.5 30.0
560.0 56.0 42.5 85.0
190.0
(D) (D)
11.3 27.0 70.0
4,550.0 14.0 32.1
66.9
6,248.8
1.0 125.0
4.0 17.5 35.0 (D)
13.0 (D)
17.0 18.0
31.0
350.0 (D) 9.0
13.0 25.0
530.0 59.0 43.4 75.0
184.0
(D) (D)
17.5 16.0 60.0
4,550.0 19.0 39.7
60.8
6,312.9
1.1 (D)
12.0 14.5 55.0 (D) 3.0 (D)
22.5 16.7
23.0 45.0 (D)
22.0 10.5 24.0
335.0 16.0 17.8
107.0
197.0 (D) (D)
13.5 17.5
120.0 5,350.0
13.0 26.5
132.3
6,594.9
0.849 0.373 0.310 0.620 0.315
(D) 0.484
(D) 0.540 0.390
0.700 0.300
(D) 0.405 0.600 0.640 0.263 0.276 0.460 0.290
0.258
(D) (D)
0.257 0.360 0.267 0.321 0.319 0.574
0.691
0.326
0.780 0.325 0.450 0.590 0.335
(D) 0.507
(D) 0.595 0.460
0.685 0.350
(D) 0.406 0.630 0.907 0.333 0.308 0.460 0.244
0.290
(D) (D)
0.228 0.445 0.364 0.402 0.365 0.563
0.712
0.394
0.921 (D)
0.365 0.690 0.400
(D) 0.537
(D) 0.655 0.570
0.720 0.480
(D) 0.592 0.710 1.150 0.539 0.412 0.420 0.281
0.386
(D) (D)
0.267 0.550 0.385 0.446 0.478 0.708
0.505
0.453
See footnote(s) at end of table. --continued
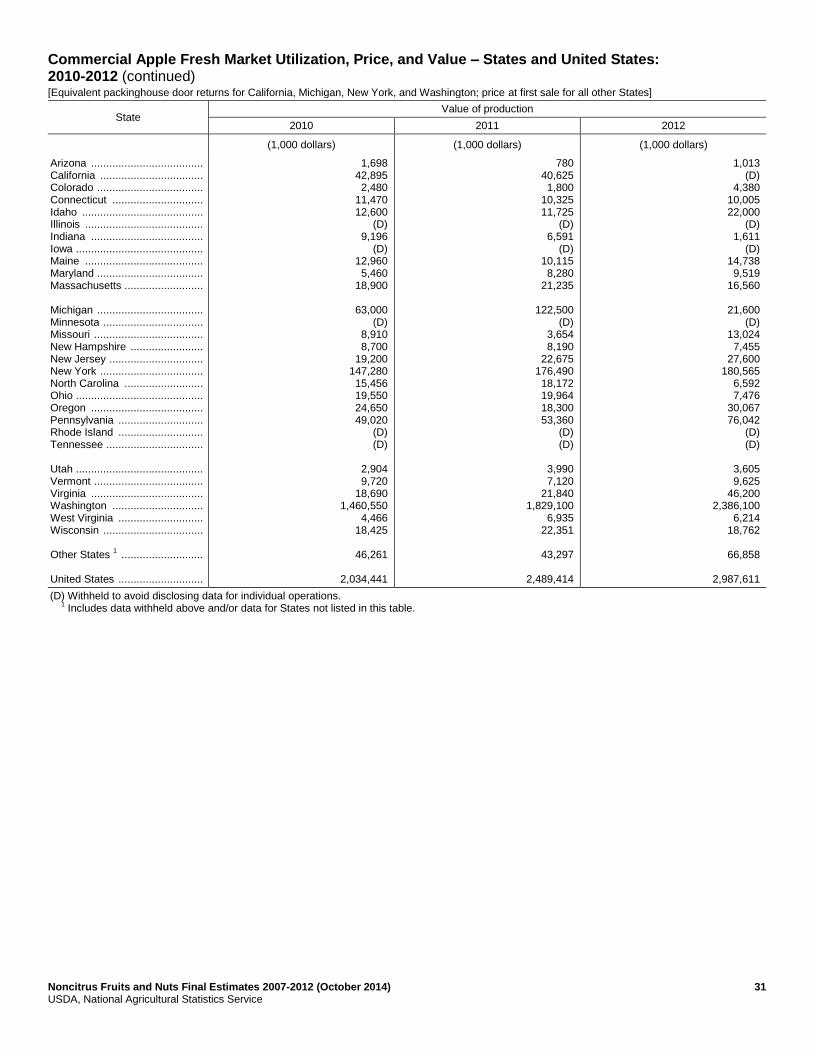
Noncitrus Fruits and Nuts Final Estimates 2007-2012 (October 2014) 31 USDA, National Agricultural Statistics Service
Commercial Apple Fresh Market Utilization, Price, and Value – States and United States: 2010-2012 (continued) [Equivalent packinghouse door returns for California, Michigan, New York, and Washington; price at first sale for all other States]
State Value of production
2010 2011 2012
(1,000 dollars) (1,000 dollars) (1,000 dollars)
Arizona ..................................... California .................................. Colorado ................................... Connecticut .............................. Idaho ........................................ Illinois ....................................... Indiana ..................................... Iowa .......................................... Maine ....................................... Maryland ................................... Massachusetts .......................... Michigan ................................... Minnesota ................................. Missouri .................................... New Hampshire ........................ New Jersey ............................... New York .................................. North Carolina .......................... Ohio .......................................... Oregon ..................................... Pennsylvania ............................ Rhode Island ............................ Tennessee ................................ Utah .......................................... Vermont .................................... Virginia ..................................... Washington .............................. West Virginia ............................ Wisconsin ................................. Other States
1 ...........................
United States ............................
1,698 42,895 2,480
11,470 12,600
(D) 9,196
(D) 12,960 5,460
18,900
63,000 (D)
8,910 8,700
19,200 147,280 15,456 19,550 24,650 49,020
(D) (D)
2,904 9,720
18,690 1,460,550
4,466 18,425
46,261
2,034,441
780 40,625 1,800
10,325 11,725
(D) 6,591
(D) 10,115 8,280
21,235
122,500 (D)
3,654 8,190
22,675 176,490 18,172 19,964 18,300 53,360
(D) (D)
3,990 7,120
21,840 1,829,100
6,935 22,351
43,297
2,489,414
1,013 (D)
4,380 10,005 22,000
(D) 1,611
(D) 14,738 9,519
16,560
21,600 (D)
13,024 7,455
27,600 180,565
6,592 7,476
30,067 76,042
(D) (D)
3,605 9,625
46,200 2,386,100
6,214 18,762
66,858
2,987,611
(D) Withheld to avoid disclosing data for individual operations. 1
Includes data withheld above and/or data for States not listed in this table.
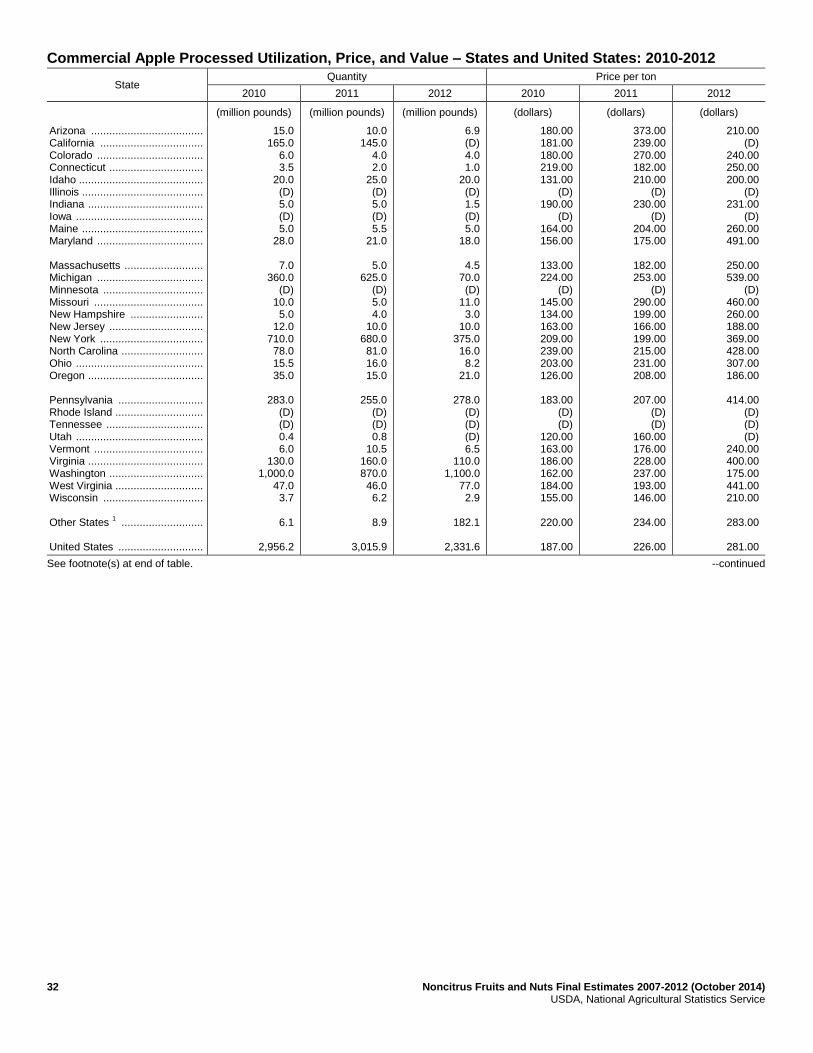
32 Noncitrus Fruits and Nuts Final Estimates 2007-2012 (October 2014) USDA, National Agricultural Statistics Service
Commercial Apple Processed Utilization, Price, and Value – States and United States: 2010-2012
State Quantity Price per ton
2010 2011 2012 2010 2011 2012
(million pounds) (million pounds) (million pounds) (dollars) (dollars) (dollars)
Arizona ..................................... California .................................. Colorado ................................... Connecticut ............................... Idaho ......................................... Illinois ........................................ Indiana ...................................... Iowa .......................................... Maine ........................................ Maryland ................................... Massachusetts .......................... Michigan ................................... Minnesota ................................. Missouri .................................... New Hampshire ........................ New Jersey ............................... New York .................................. North Carolina ........................... Ohio .......................................... Oregon ...................................... Pennsylvania ............................ Rhode Island ............................. Tennessee ................................ Utah .......................................... Vermont .................................... Virginia ...................................... Washington ............................... West Virginia ............................. Wisconsin ................................. Other States
1 ...........................
United States ............................
15.0 165.0
6.0 3.5
20.0 (D) 5.0 (D) 5.0
28.0
7.0 360.0
(D) 10.0 5.0
12.0 710.0 78.0 15.5 35.0
283.0
(D) (D) 0.4 6.0
130.0 1,000.0
47.0 3.7
6.1
2,956.2
10.0 145.0
4.0 2.0
25.0 (D) 5.0 (D) 5.5
21.0
5.0 625.0
(D) 5.0 4.0
10.0 680.0 81.0 16.0 15.0
255.0
(D) (D) 0.8
10.5 160.0 870.0 46.0 6.2
8.9
3,015.9
6.9 (D) 4.0 1.0
20.0 (D) 1.5 (D) 5.0
18.0
4.5 70.0 (D)
11.0 3.0
10.0 375.0 16.0 8.2
21.0
278.0 (D) (D) (D) 6.5
110.0 1,100.0
77.0 2.9
182.1
2,331.6
180.00 181.00 180.00 219.00 131.00
(D) 190.00
(D) 164.00 156.00
133.00 224.00
(D) 145.00 134.00 163.00 209.00 239.00 203.00 126.00
183.00
(D) (D)
120.00 163.00 186.00 162.00 184.00 155.00
220.00
187.00
373.00 239.00 270.00 182.00 210.00
(D) 230.00
(D) 204.00 175.00
182.00 253.00
(D) 290.00 199.00 166.00 199.00 215.00 231.00 208.00
207.00
(D) (D)
160.00 176.00 228.00 237.00 193.00 146.00
234.00
226.00
210.00 (D)
240.00 250.00 200.00
(D) 231.00
(D) 260.00 491.00
250.00 539.00
(D) 460.00 260.00 188.00 369.00 428.00 307.00 186.00
414.00
(D) (D) (D)
240.00 400.00 175.00 441.00 210.00
283.00
281.00
See footnote(s) at end of table. --continued
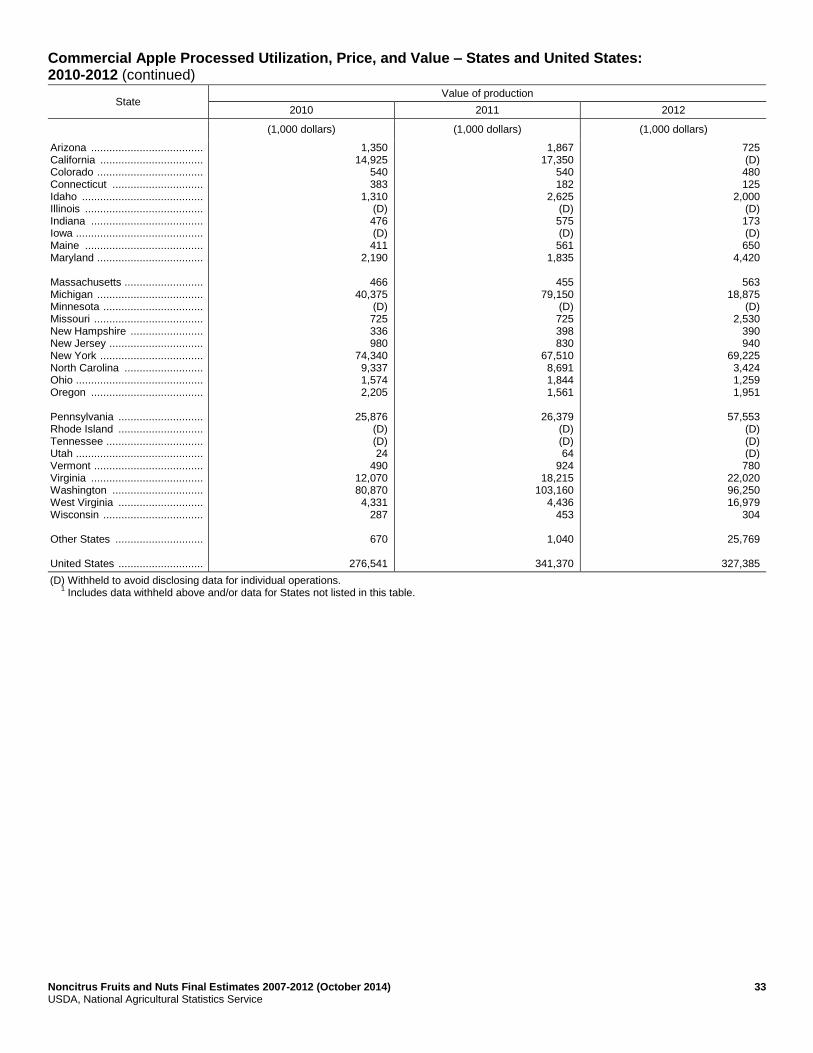
Noncitrus Fruits and Nuts Final Estimates 2007-2012 (October 2014) 33 USDA, National Agricultural Statistics Service
Commercial Apple Processed Utilization, Price, and Value – States and United States: 2010-2012 (continued)
State Value of production
2010 2011 2012
(1,000 dollars) (1,000 dollars) (1,000 dollars)
Arizona ..................................... California .................................. Colorado ................................... Connecticut .............................. Idaho ........................................ Illinois ....................................... Indiana ..................................... Iowa .......................................... Maine ....................................... Maryland ................................... Massachusetts .......................... Michigan ................................... Minnesota ................................. Missouri .................................... New Hampshire ........................ New Jersey ............................... New York .................................. North Carolina .......................... Ohio .......................................... Oregon ..................................... Pennsylvania ............................ Rhode Island ............................ Tennessee ................................ Utah .......................................... Vermont .................................... Virginia ..................................... Washington .............................. West Virginia ............................ Wisconsin ................................. Other States ............................. United States ............................
1,350 14,925
540 383
1,310 (D) 476 (D) 411
2,190
466 40,375
(D) 725 336 980
74,340 9,337 1,574 2,205
25,876
(D) (D) 24
490 12,070 80,870 4,331
287
670
276,541
1,867 17,350
540 182
2,625 (D) 575 (D) 561
1,835
455 79,150
(D) 725 398 830
67,510 8,691 1,844 1,561
26,379
(D) (D) 64
924 18,215
103,160 4,436
453
1,040
341,370
725 (D) 480 125
2,000 (D) 173 (D) 650
4,420
563 18,875
(D) 2,530
390 940
69,225 3,424 1,259 1,951
57,553
(D) (D) (D) 780
22,020 96,250 16,979
304
25,769
327,385
(D) Withheld to avoid disclosing data for individual operations. 1
Includes data withheld above and/or data for States not listed in this table.
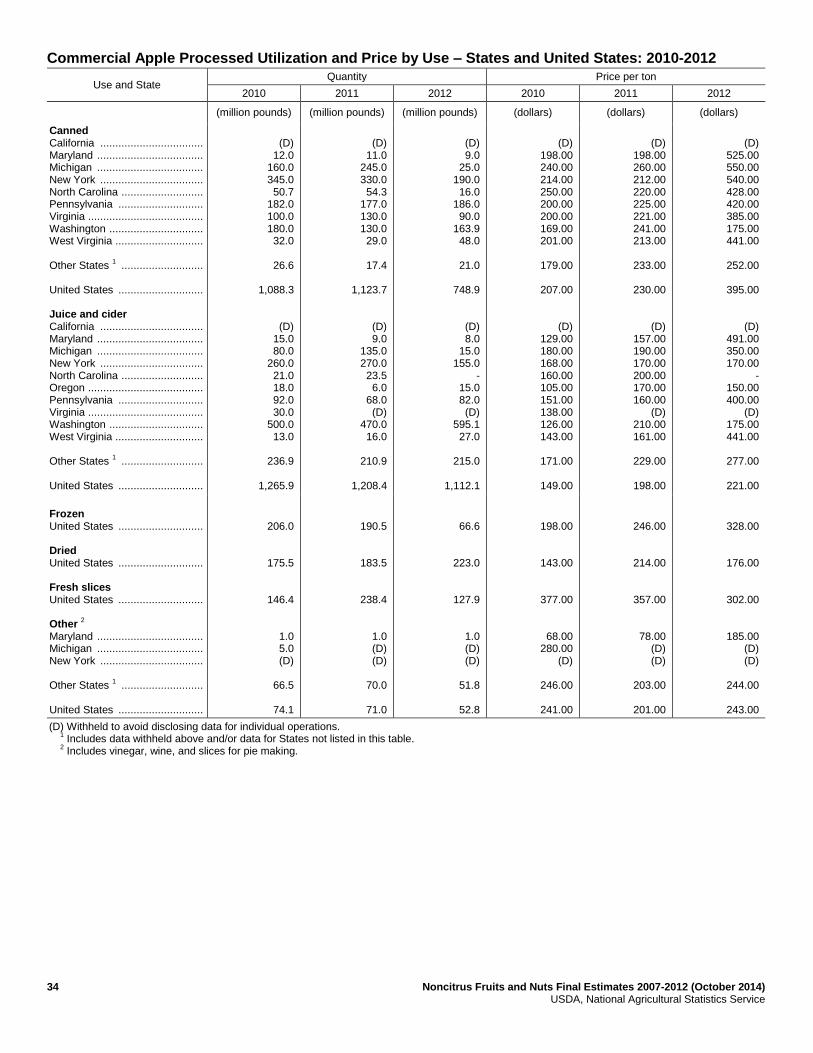
34 Noncitrus Fruits and Nuts Final Estimates 2007-2012 (October 2014) USDA, National Agricultural Statistics Service
Commercial Apple Processed Utilization and Price by Use – States and United States: 2010-2012
Use and State Quantity Price per ton
2010 2011 2012 2010 2011 2012
(million pounds) (million pounds) (million pounds) (dollars) (dollars) (dollars)
Canned California .................................. Maryland ................................... Michigan ................................... New York .................................. North Carolina ........................... Pennsylvania ............................ Virginia ...................................... Washington ............................... West Virginia ............................. Other States
1 ...........................
United States ............................ Juice and cider California .................................. Maryland ................................... Michigan ................................... New York .................................. North Carolina ........................... Oregon ...................................... Pennsylvania ............................ Virginia ...................................... Washington ............................... West Virginia ............................. Other States
1 ...........................
United States ............................
(D)
12.0 160.0 345.0 50.7
182.0 100.0 180.0 32.0
26.6
1,088.3
(D) 15.0 80.0
260.0 21.0 18.0 92.0 30.0
500.0 13.0
236.9
1,265.9
(D)
11.0 245.0 330.0 54.3
177.0 130.0 130.0 29.0
17.4
1,123.7
(D) 9.0
135.0 270.0 23.5 6.0
68.0 (D)
470.0 16.0
210.9
1,208.4
(D) 9.0
25.0 190.0 16.0
186.0 90.0
163.9 48.0
21.0
748.9
(D) 8.0
15.0 155.0
- 15.0 82.0 (D)
595.1 27.0
215.0
1,112.1
(D)
198.00 240.00 214.00 250.00 200.00 200.00 169.00 201.00
179.00
207.00
(D) 129.00 180.00 168.00 160.00 105.00 151.00 138.00 126.00 143.00
171.00
149.00
(D)
198.00 260.00 212.00 220.00 225.00 221.00 241.00 213.00
233.00
230.00
(D) 157.00 190.00 170.00 200.00 170.00 160.00
(D) 210.00 161.00
229.00
198.00
(D)
525.00 550.00 540.00 428.00 420.00 385.00 175.00 441.00
252.00
395.00
(D) 491.00 350.00 170.00
- 150.00 400.00
(D) 175.00 441.00
277.00
221.00
Frozen United States ............................ Dried United States ............................ Fresh slices United States ............................ Other
2
Maryland ................................... Michigan ................................... New York .................................. Other States
1 ...........................
United States ............................
206.0
175.5
146.4
1.0 5.0 (D)
66.5
74.1
190.5
183.5
238.4
1.0 (D) (D)
70.0
71.0
66.6
223.0
127.9
1.0 (D) (D)
51.8
52.8
198.00
143.00
377.00
68.00 280.00
(D)
246.00
241.00
246.00
214.00
357.00
78.00 (D) (D)
203.00
201.00
328.00
176.00
302.00
185.00 (D) (D)
244.00
243.00
(D) Withheld to avoid disclosing data for individual operations. 1
Includes data withheld above and/or data for States not listed in this table. 2
Includes vinegar, wine, and slices for pie making.
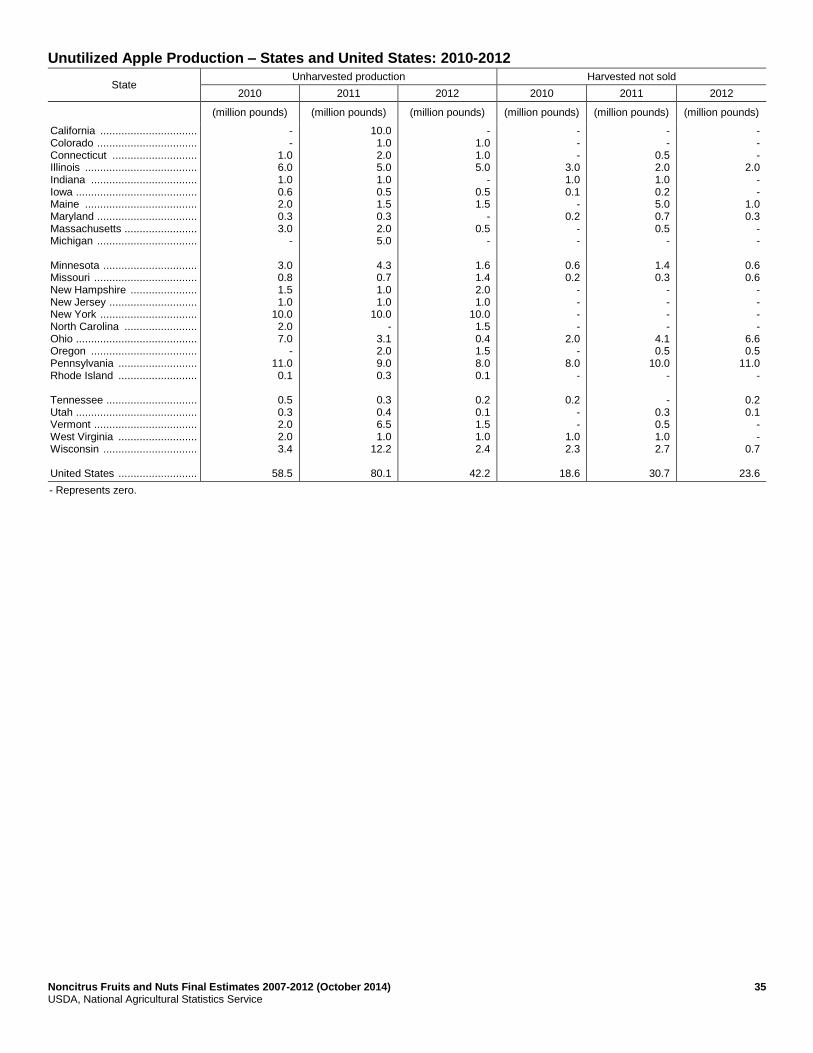
Noncitrus Fruits and Nuts Final Estimates 2007-2012 (October 2014) 35 USDA, National Agricultural Statistics Service
Unutilized Apple Production – States and United States: 2010-2012
State Unharvested production Harvested not sold
2010 2011 2012 2010 2011 2012
(million pounds) (million pounds) (million pounds) (million pounds) (million pounds) (million pounds)
California ................................ Colorado ................................. Connecticut ............................ Illinois ..................................... Indiana ................................... Iowa ........................................ Maine ..................................... Maryland ................................. Massachusetts ........................ Michigan ................................. Minnesota ............................... Missouri .................................. New Hampshire ...................... New Jersey ............................. New York ................................ North Carolina ........................ Ohio ........................................ Oregon ................................... Pennsylvania .......................... Rhode Island .......................... Tennessee .............................. Utah ........................................ Vermont .................................. West Virginia .......................... Wisconsin ............................... United States ..........................
- -
1.0 6.0 1.0 0.6 2.0 0.3 3.0
-
3.0 0.8 1.5 1.0
10.0 2.0 7.0
- 11.0 0.1
0.5 0.3 2.0 2.0 3.4
58.5
10.0 1.0 2.0 5.0 1.0 0.5 1.5 0.3 2.0 5.0
4.3 0.7 1.0 1.0
10.0 -
3.1 2.0 9.0 0.3
0.3 0.4 6.5 1.0
12.2
80.1
- 1.0 1.0 5.0
- 0.5 1.5
- 0.5
-
1.6 1.4 2.0 1.0
10.0 1.5 0.4 1.5 8.0 0.1
0.2 0.1 1.5 1.0 2.4
42.2
- - -
3.0 1.0 0.1
- 0.2
- -
0.6 0.2
- - - -
2.0 -
8.0 -
0.2 - -
1.0 2.3
18.6
- -
0.5 2.0 1.0 0.2 5.0 0.7 0.5
-
1.4 0.3
- - - -
4.1 0.5
10.0 -
- 0.3 0.5 1.0 2.7
30.7
- - -
2.0 - -
1.0 0.3
- -
0.6 0.6
- - - -
6.6 0.5
11.0 -
0.2 0.1
- -
0.7
23.6
- Represents zero.
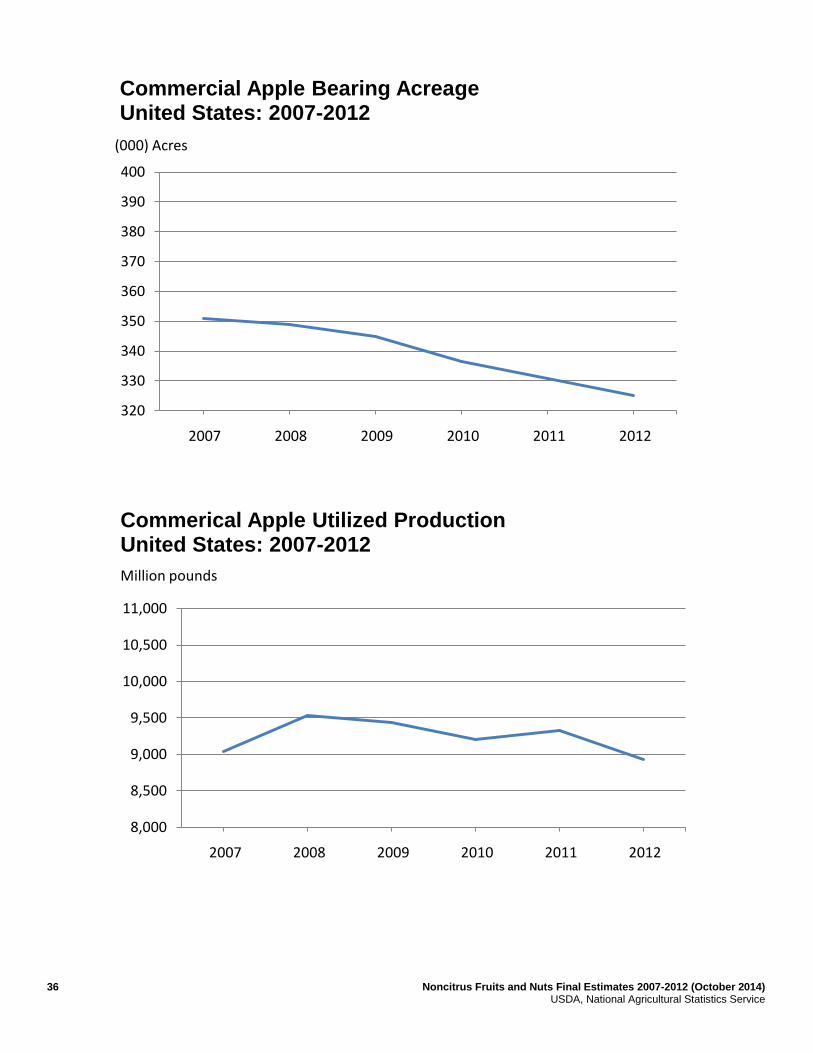
36 Noncitrus Fruits and Nuts Final Estimates 2007-2012 (October 2014) USDA, National Agricultural Statistics Service
320
330
340
350
360
370
380
390
400
2007 2008 2009 2010 2011 2012
(000) Acres
Commercial Apple Bearing AcreageUnited States: 2007-2012
8,000
8,500
9,000
9,500
10,000
10,500
11,000
2007 2008 2009 2010 2011 2012
Million pounds
Commerical Apple Utilized ProductionUnited States: 2007-2012
Noncitrus Fruits and Nuts Final Estimates 2007-2012 (October 2014) 37 USDA, National Agricultural Statistics Service
This page intentionally left blank.
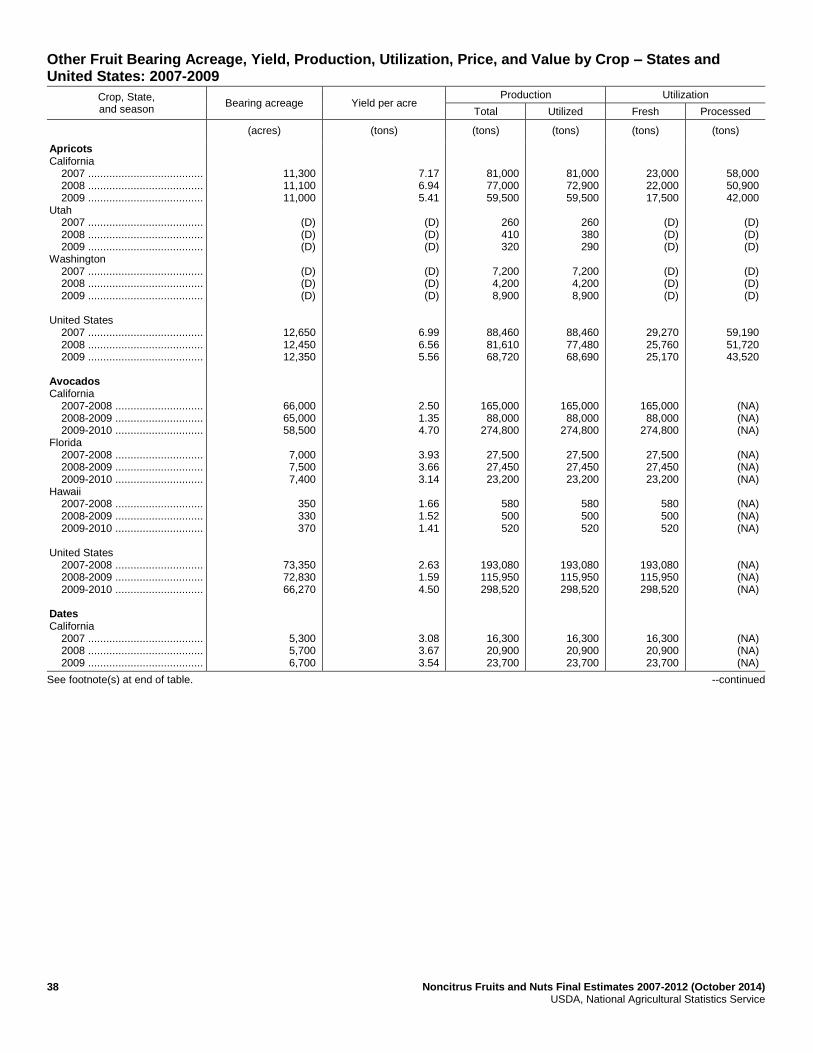
38 Noncitrus Fruits and Nuts Final Estimates 2007-2012 (October 2014) USDA, National Agricultural Statistics Service
Other Fruit Bearing Acreage, Yield, Production, Utilization, Price, and Value by Crop – States and United States: 2007-2009
Crop, State, and season
Bearing acreage Yield per acre Production Utilization
Total Utilized Fresh Processed
(acres) (tons) (tons) (tons) (tons) (tons)
Apricots California 2007 ...................................... 2008 ...................................... 2009 ...................................... Utah 2007 ...................................... 2008 ...................................... 2009 ...................................... Washington 2007 ...................................... 2008 ...................................... 2009 ...................................... United States 2007 ...................................... 2008 ...................................... 2009 ...................................... Avocados California 2007-2008 ............................. 2008-2009 ............................. 2009-2010 ............................. Florida 2007-2008 ............................. 2008-2009 ............................. 2009-2010 ............................. Hawaii 2007-2008 ............................. 2008-2009 ............................. 2009-2010 ............................. United States 2007-2008 ............................. 2008-2009 ............................. 2009-2010 ............................. Dates California 2007 ...................................... 2008 ...................................... 2009 ......................................
11,300 11,100 11,000
(D) (D) (D)
(D) (D) (D)
12,650 12,450 12,350
66,000 65,000 58,500
7,000 7,500 7,400
350 330 370
73,350 72,830 66,270
5,300 5,700 6,700
7.17 6.94 5.41
(D) (D) (D)
(D) (D) (D)
6.99 6.56 5.56
2.50 1.35 4.70
3.93 3.66 3.14
1.66 1.52 1.41
2.63 1.59 4.50
3.08 3.67 3.54
81,000 77,000 59,500
260 410 320
7,200 4,200 8,900
88,460 81,610 68,720
165,000 88,000
274,800
27,500 27,450 23,200
580 500 520
193,080 115,950 298,520
16,300 20,900 23,700
81,000 72,900 59,500
260 380 290
7,200 4,200 8,900
88,460 77,480 68,690
165,000 88,000
274,800
27,500 27,450 23,200
580 500 520
193,080 115,950 298,520
16,300 20,900 23,700
23,000 22,000 17,500
(D) (D) (D)
(D) (D) (D)
29,270 25,760 25,170
165,000 88,000
274,800
27,500 27,450 23,200
580 500 520
193,080 115,950 298,520
16,300 20,900 23,700
58,000 50,900 42,000
(D) (D) (D)
(D) (D) (D)
59,190 51,720 43,520
(NA) (NA) (NA)
(NA) (NA) (NA)
(NA) (NA) (NA)
(NA) (NA) (NA)
(NA) (NA) (NA)
See footnote(s) at end of table. --continued
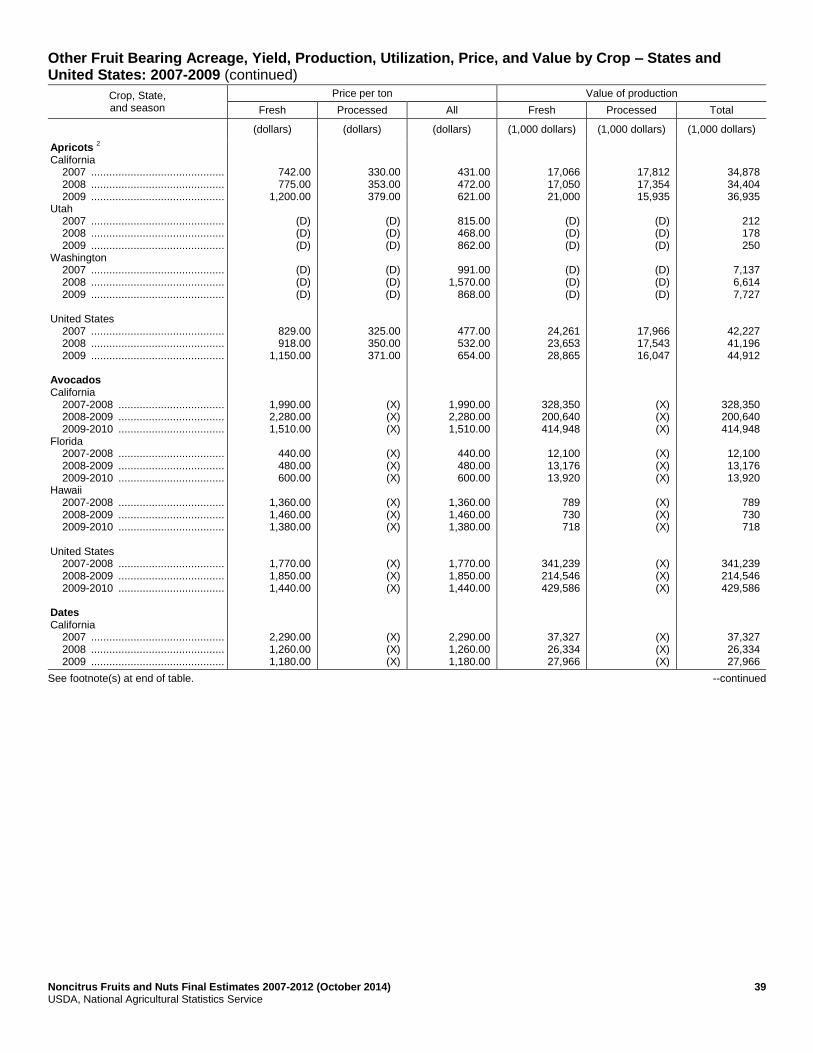
Noncitrus Fruits and Nuts Final Estimates 2007-2012 (October 2014) 39 USDA, National Agricultural Statistics Service
Other Fruit Bearing Acreage, Yield, Production, Utilization, Price, and Value by Crop – States and United States: 2007-2009 (continued)
Crop, State, and season
Price per ton Value of production
Fresh Processed All Fresh Processed Total
(dollars) (dollars) (dollars) (1,000 dollars) (1,000 dollars) (1,000 dollars)
Apricots 2
California 2007 ............................................ 2008 ............................................ 2009 ............................................ Utah 2007 ............................................ 2008 ............................................ 2009 ............................................ Washington 2007 ............................................ 2008 ............................................ 2009 ............................................ United States 2007 ............................................ 2008 ............................................ 2009 ............................................ Avocados California 2007-2008 ................................... 2008-2009 ................................... 2009-2010 ................................... Florida 2007-2008 ................................... 2008-2009 ................................... 2009-2010 ................................... Hawaii 2007-2008 ................................... 2008-2009 ................................... 2009-2010 ................................... United States 2007-2008 ................................... 2008-2009 ................................... 2009-2010 ................................... Dates California 2007 ............................................ 2008 ............................................ 2009 ............................................
742.00 775.00
1,200.00
(D) (D) (D)
(D) (D) (D)
829.00 918.00
1,150.00
1,990.00 2,280.00 1,510.00
440.00 480.00 600.00
1,360.00 1,460.00 1,380.00
1,770.00 1,850.00 1,440.00
2,290.00 1,260.00 1,180.00
330.00 353.00 379.00
(D) (D) (D)
(D) (D) (D)
325.00 350.00 371.00
(X) (X) (X)
(X) (X) (X)
(X) (X) (X)
(X) (X) (X)
(X) (X) (X)
431.00 472.00 621.00
815.00 468.00 862.00
991.00
1,570.00 868.00
477.00 532.00 654.00
1,990.00 2,280.00 1,510.00
440.00 480.00 600.00
1,360.00 1,460.00 1,380.00
1,770.00 1,850.00 1,440.00
2,290.00 1,260.00 1,180.00
17,066 17,050 21,000
(D) (D) (D)
(D) (D) (D)
24,261 23,653 28,865
328,350 200,640 414,948
12,100 13,176 13,920
789 730 718
341,239 214,546 429,586
37,327 26,334 27,966
17,812 17,354 15,935
(D) (D) (D)
(D) (D) (D)
17,966 17,543 16,047
(X) (X) (X)
(X) (X) (X)
(X) (X) (X)
(X) (X) (X)
(X) (X) (X)
34,878 34,404 36,935
212 178 250
7,137 6,614 7,727
42,227 41,196 44,912
328,350 200,640 414,948
12,100 13,176 13,920
789 730 718
341,239 214,546 429,586
37,327 26,334 27,966
See footnote(s) at end of table. --continued
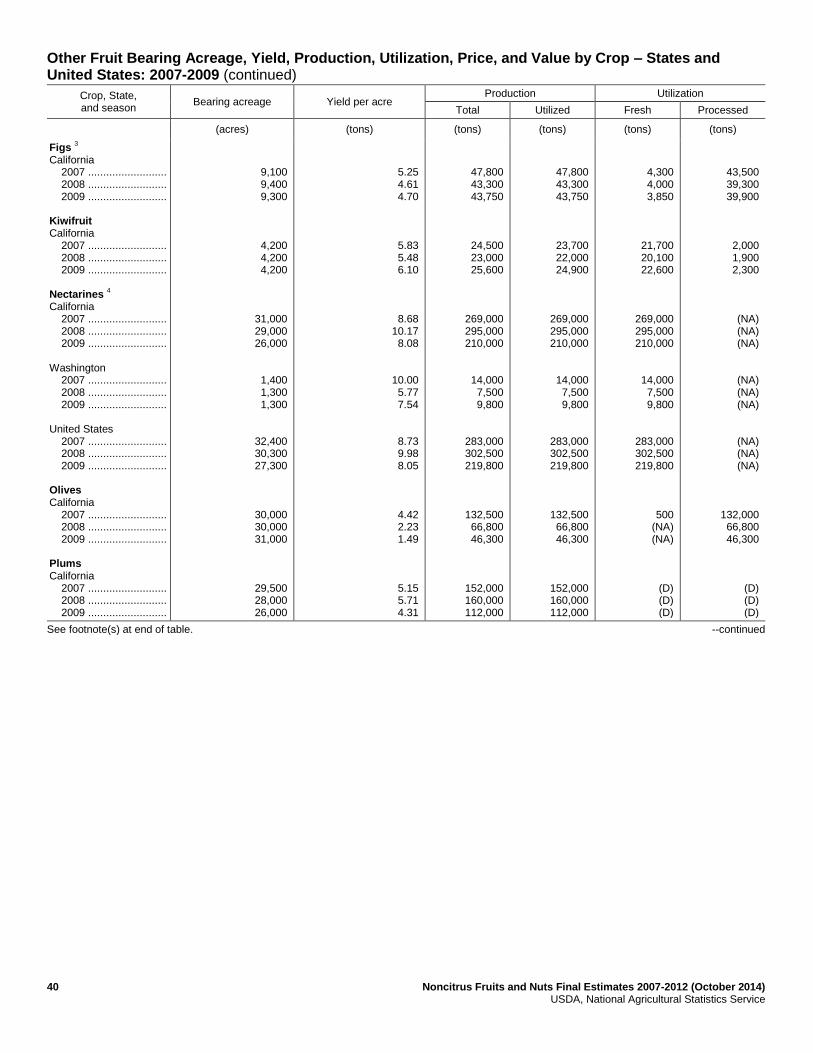
40 Noncitrus Fruits and Nuts Final Estimates 2007-2012 (October 2014) USDA, National Agricultural Statistics Service
Other Fruit Bearing Acreage, Yield, Production, Utilization, Price, and Value by Crop – States and United States: 2007-2009 (continued)
Crop, State, and season
Bearing acreage Yield per acre Production Utilization
Total Utilized Fresh Processed
(acres) (tons) (tons) (tons) (tons) (tons)
Figs 3
California 2007 .......................... 2008 .......................... 2009 .......................... Kiwifruit California 2007 .......................... 2008 .......................... 2009 .......................... Nectarines
4
California 2007 .......................... 2008 .......................... 2009 .......................... Washington 2007 .......................... 2008 .......................... 2009 .......................... United States 2007 .......................... 2008 .......................... 2009 .......................... Olives California 2007 .......................... 2008 .......................... 2009 .......................... Plums California 2007 .......................... 2008 .......................... 2009 ..........................
9,100 9,400 9,300
4,200 4,200 4,200
31,000 29,000 26,000
1,400 1,300 1,300
32,400 30,300 27,300
30,000 30,000 31,000
29,500 28,000 26,000
5.25 4.61 4.70
5.83 5.48 6.10
8.68 10.17 8.08
10.00 5.77 7.54
8.73 9.98 8.05
4.42 2.23 1.49
5.15 5.71 4.31
47,800 43,300 43,750
24,500 23,000 25,600
269,000 295,000 210,000
14,000 7,500 9,800
283,000 302,500 219,800
132,500 66,800 46,300
152,000 160,000 112,000
47,800 43,300 43,750
23,700 22,000 24,900
269,000 295,000 210,000
14,000 7,500 9,800
283,000 302,500 219,800
132,500 66,800 46,300
152,000 160,000 112,000
4,300 4,000 3,850
21,700 20,100 22,600
269,000 295,000 210,000
14,000 7,500 9,800
283,000 302,500 219,800
500 (NA) (NA)
(D) (D) (D)
43,500 39,300 39,900
2,000 1,900 2,300
(NA) (NA) (NA)
(NA) (NA) (NA)
(NA) (NA) (NA)
132,000 66,800 46,300
(D) (D) (D)
See footnote(s) at end of table. --continued
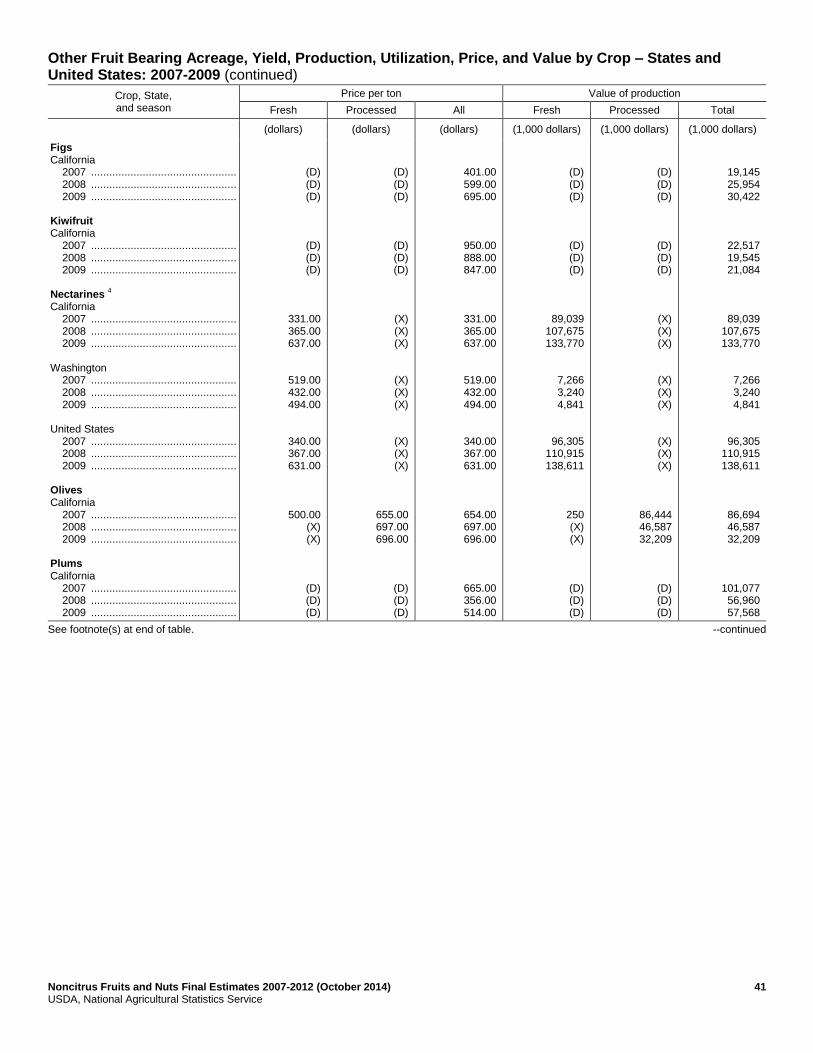
Noncitrus Fruits and Nuts Final Estimates 2007-2012 (October 2014) 41 USDA, National Agricultural Statistics Service
Other Fruit Bearing Acreage, Yield, Production, Utilization, Price, and Value by Crop – States and United States: 2007-2009 (continued)
Crop, State, and season
Price per ton Value of production
Fresh Processed All Fresh Processed Total
(dollars) (dollars) (dollars) (1,000 dollars) (1,000 dollars) (1,000 dollars)
Figs California 2007 ................................................ 2008 ................................................ 2009 ................................................ Kiwifruit California 2007 ................................................ 2008 ................................................ 2009 ................................................ Nectarines
4
California 2007 ................................................ 2008 ................................................ 2009 ................................................ Washington 2007 ................................................ 2008 ................................................ 2009 ................................................ United States 2007 ................................................ 2008 ................................................ 2009 ................................................ Olives California 2007 ................................................ 2008 ................................................ 2009 ................................................ Plums California 2007 ................................................ 2008 ................................................ 2009 ................................................
(D) (D) (D)
(D) (D) (D)
331.00 365.00 637.00
519.00 432.00 494.00
340.00 367.00 631.00
500.00 (X) (X)
(D) (D) (D)
(D) (D) (D)
(D) (D) (D)
(X) (X) (X)
(X) (X) (X)
(X) (X) (X)
655.00 697.00 696.00
(D) (D) (D)
401.00 599.00 695.00
950.00 888.00 847.00
331.00 365.00 637.00
519.00 432.00 494.00
340.00 367.00 631.00
654.00 697.00 696.00
665.00 356.00 514.00
(D) (D) (D)
(D) (D) (D)
89,039 107,675 133,770
7,266 3,240 4,841
96,305 110,915 138,611
250 (X) (X)
(D) (D) (D)
(D) (D) (D)
(D) (D) (D)
(X) (X) (X)
(X) (X) (X)
(X) (X) (X)
86,444 46,587 32,209
(D) (D) (D)
19,145 25,954 30,422
22,517 19,545 21,084
89,039 107,675 133,770
7,266 3,240 4,841
96,305 110,915 138,611
86,694 46,587 32,209
101,077 56,960 57,568
See footnote(s) at end of table. --continued
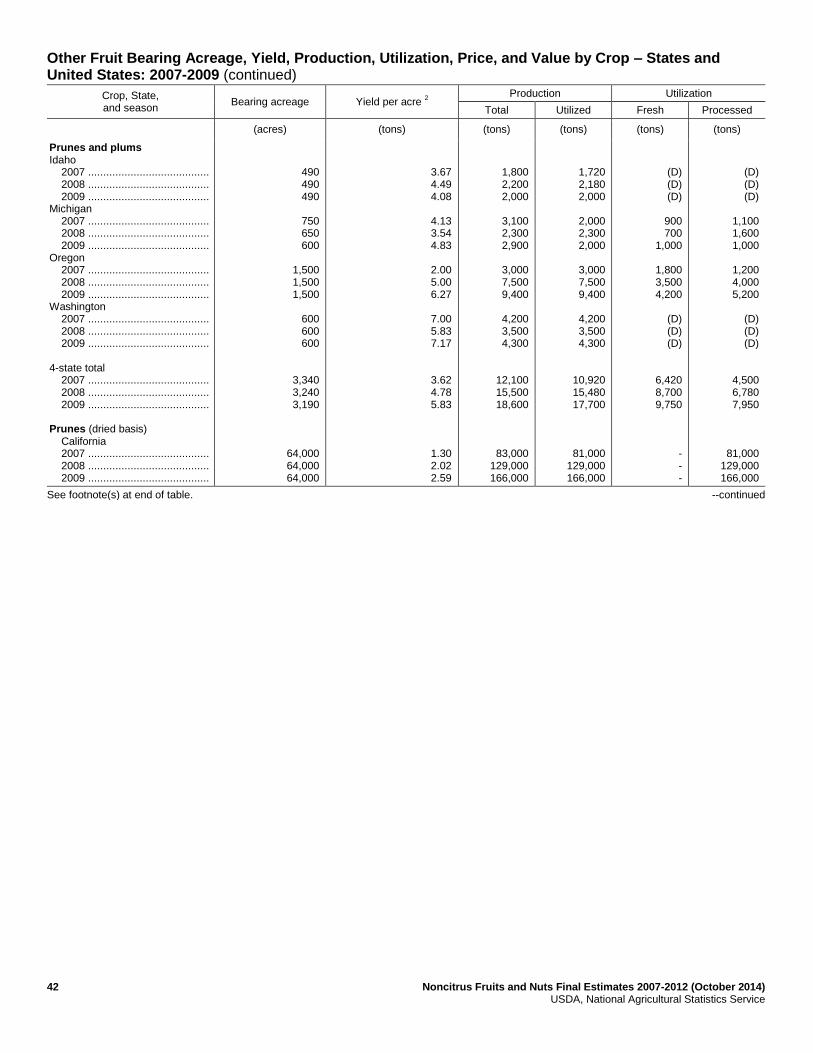
42 Noncitrus Fruits and Nuts Final Estimates 2007-2012 (October 2014) USDA, National Agricultural Statistics Service
Other Fruit Bearing Acreage, Yield, Production, Utilization, Price, and Value by Crop – States and United States: 2007-2009 (continued)
Crop, State, and season
Bearing acreage Yield per acre 2
Production Utilization
Total Utilized Fresh Processed
(acres) (tons) (tons) (tons) (tons) (tons)
Prunes and plums Idaho 2007 ........................................ 2008 ........................................ 2009 ........................................ Michigan 2007 ........................................ 2008 ........................................ 2009 ........................................ Oregon 2007 ........................................ 2008 ........................................ 2009 ........................................ Washington 2007 ........................................ 2008 ........................................ 2009 ........................................ 4-state total 2007 ........................................ 2008 ........................................ 2009 ........................................ Prunes (dried basis) California 2007 ........................................ 2008 ........................................ 2009 ........................................
490 490 490
750 650 600
1,500 1,500 1,500
600 600 600
3,340 3,240 3,190
64,000 64,000 64,000
3.67 4.49 4.08
4.13 3.54 4.83
2.00 5.00 6.27
7.00 5.83 7.17
3.62 4.78 5.83
1.30 2.02 2.59
1,800 2,200 2,000
3,100 2,300 2,900
3,000 7,500 9,400
4,200 3,500 4,300
12,100 15,500 18,600
83,000 129,000 166,000
1,720 2,180 2,000
2,000 2,300 2,000
3,000 7,500 9,400
4,200 3,500 4,300
10,920 15,480 17,700
81,000 129,000 166,000
(D) (D) (D)
900 700
1,000
1,800 3,500 4,200
(D) (D) (D)
6,420 8,700 9,750
- - -
(D) (D) (D)
1,100 1,600 1,000
1,200 4,000 5,200
(D) (D) (D)
4,500 6,780 7,950
81,000 129,000 166,000
See footnote(s) at end of table. --continued

Noncitrus Fruits and Nuts Final Estimates 2007-2012 (October 2014) 43 USDA, National Agricultural Statistics Service
Other Fruit Bearing Acreage, Yield, Production, Utilization, Price, and Value by Crop – States and United States: 2007-2009 (continued)
Crop, State, and season
Price per ton Value of production
Fresh Processed All Fresh Processed Total
(dollars) (dollars) (dollars) (1,000 dollars) (1,000 dollars) (1,000 dollars)
Prunes and plums Idaho 2007 ............................................ 2008 ............................................ 2009 ............................................ Michigan 2007 ............................................ 2008 ............................................ 2009 ............................................ Oregon 2007 ............................................ 2008 ............................................ 2009 ............................................ Washington 2007 ............................................ 2008 ............................................ 2009 ............................................ 4-state total 2007 ............................................ 2008 ............................................ 2009 ............................................ Prunes (dried basis) California 2007 ............................................ 2008 ............................................ 2009 ............................................
(D) (D) (D)
765.00 775.00 880.00
501.00 407.00 322.00
(D) (D) (D)
622.00 547.00 472.00
(X) (X) (X)
(D) (D) (D)
173.00 174.00 180.00
302.00 165.00 133.00
(D) (D) (D)
213.00 171.00 149.00
1,450.00 1,500.00 1,230.00
709.00 585.00 496.00
440.00 357.00 530.00
421.00 278.00 218.00
380.00 497.00 393.00
454.00 382.00 327.00
1,450.00 1,500.00 1,230.00
(D) (D) (D)
689 543 880
902
1,425 1,352
(D) (D) (D)
3,996 4,758 4,601
(X) (X) (X)
(D) (D) (D)
190 278 180
362 658 694
(D) (D) (D)
960 1,160 1,186
117,450 193,500 204,180
1,219 1,275
991
879 821
1,060
1,264 2,083 2,046
1,594 1,739 1,690
4,956 5,918 5,787
117,450 193,500 204,180
- Represents zero. (D) Withheld to avoid disclosing data for individual operations. (NA) Not available. (X) Not applicable. 1
Yield is based on total production. 2
Apricot processed price excludes dried. Processing value includes dried. 3
Small quantities of canned figs are included in fresh to avoid disclosure of individual operations. 4
Small quantities of processed nectarines are included in fresh to avoid disclosure of individual operations.
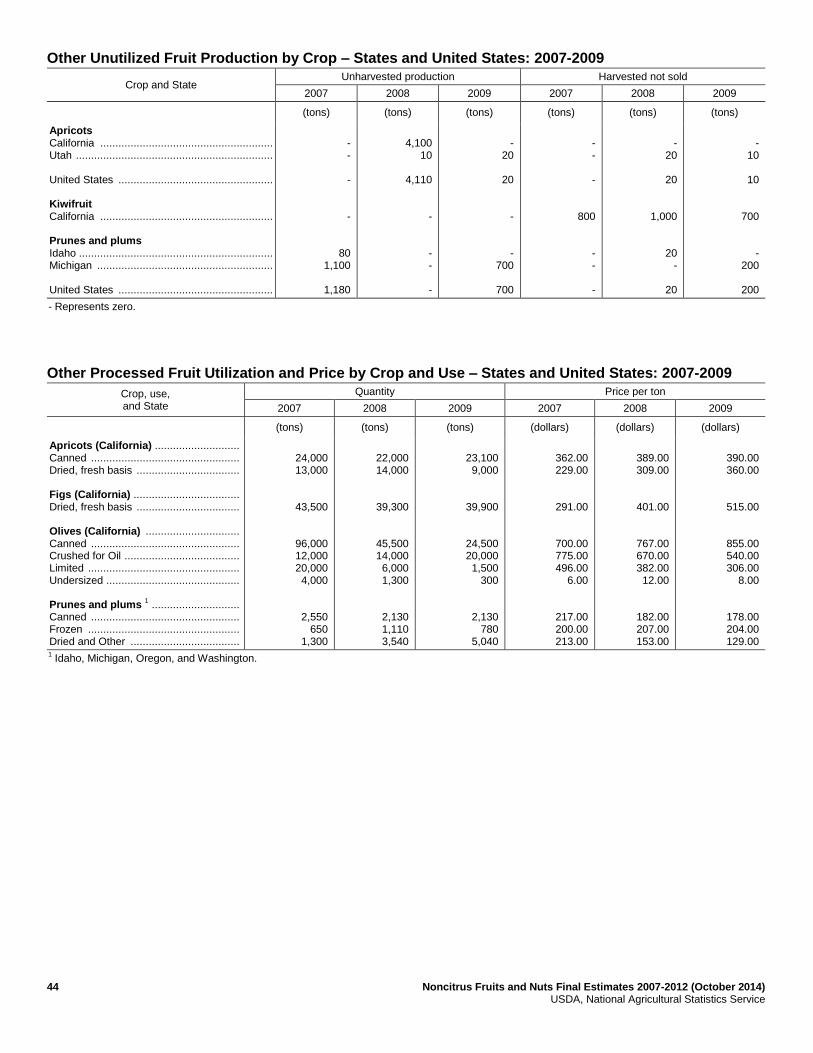
44 Noncitrus Fruits and Nuts Final Estimates 2007-2012 (October 2014) USDA, National Agricultural Statistics Service
Other Unutilized Fruit Production by Crop – States and United States: 2007-2009
Crop and State Unharvested production Harvested not sold
2007 2008 2009 2007 2008 2009
(tons) (tons) (tons) (tons) (tons) (tons)
Apricots California ......................................................... Utah ................................................................. United States ................................................... Kiwifruit California ......................................................... Prunes and plums Idaho ................................................................ Michigan .......................................................... United States ...................................................
- -
-
-
80 1,100
1,180
4,100
10
4,110
-
- -
-
-
20
20
-
- 700
700
- -
-
800
- -
-
-
20
20
1,000
20 -
20
-
10
10
700
- 200
200
- Represents zero.
Other Processed Fruit Utilization and Price by Crop and Use – States and United States: 2007-2009
Crop, use, and State
Quantity Price per ton
2007 2008 2009 2007 2008 2009
(tons) (tons) (tons) (dollars) (dollars) (dollars)
Apricots (California) ............................ Canned ................................................. Dried, fresh basis .................................. Figs (California) ................................... Dried, fresh basis .................................. Olives (California) ............................... Canned ................................................. Crushed for Oil ...................................... Limited .................................................. Undersized ............................................ Prunes and plums
1 .............................
Canned ................................................. Frozen .................................................. Dried and Other ....................................
24,000 13,000
43,500
96,000 12,000 20,000 4,000
2,550 650
1,300
22,000 14,000
39,300
45,500 14,000 6,000 1,300
2,130 1,110 3,540
23,100 9,000
39,900
24,500 20,000 1,500
300
2,130 780
5,040
362.00 229.00
291.00
700.00 775.00 496.00
6.00
217.00 200.00 213.00
389.00 309.00
401.00
767.00 670.00 382.00 12.00
182.00 207.00 153.00
390.00 360.00
515.00
855.00 540.00 306.00
8.00
178.00 204.00 129.00
1 Idaho, Michigan, Oregon, and Washington.
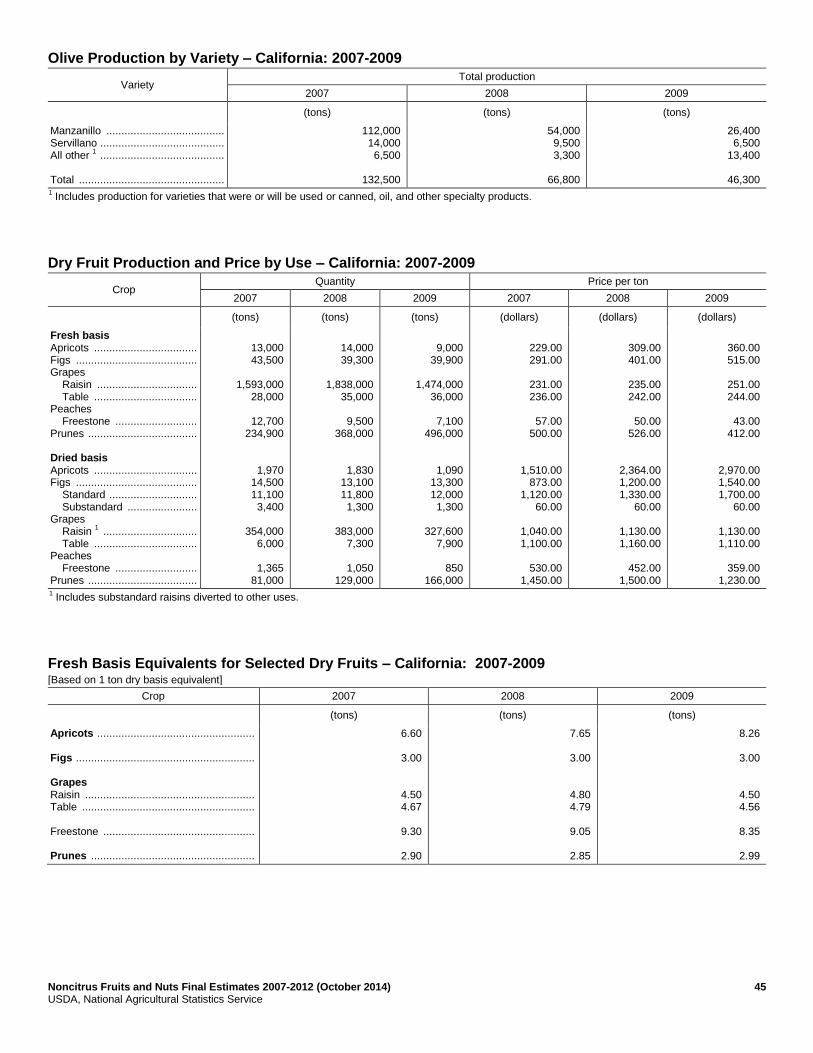
Noncitrus Fruits and Nuts Final Estimates 2007-2012 (October 2014) 45 USDA, National Agricultural Statistics Service
Olive Production by Variety – California: 2007-2009
Variety Total production
2007 2008 2009
(tons) (tons) (tons)
Manzanillo ....................................... Servillano ......................................... All other
1 .........................................
Total ................................................
112,000 14,000 6,500
132,500
54,000 9,500 3,300
66,800
26,400 6,500
13,400
46,300 1 Includes production for varieties that were or will be used or canned, oil, and other specialty products.
Dry Fruit Production and Price by Use – California: 2007-2009
Crop Quantity Price per ton
2007 2008 2009 2007 2008 2009
(tons) (tons) (tons) (dollars) (dollars) (dollars)
Fresh basis Apricots .................................. Figs ........................................ Grapes Raisin ................................. Table .................................. Peaches Freestone ........................... Prunes .................................... Dried basis Apricots .................................. Figs ........................................ Standard ............................. Substandard ....................... Grapes Raisin
1 ...............................
Table .................................. Peaches Freestone ........................... Prunes ....................................
13,000 43,500
1,593,000
28,000
12,700 234,900
1,970 14,500 11,100 3,400
354,000
6,000
1,365 81,000
14,000 39,300
1,838,000
35,000
9,500 368,000
1,830 13,100 11,800 1,300
383,000
7,300
1,050 129,000
9,000
39,900
1,474,000 36,000
7,100
496,000
1,090 13,300 12,000 1,300
327,600
7,900
850 166,000
229.00 291.00
231.00 236.00
57.00
500.00
1,510.00 873.00
1,120.00 60.00
1,040.00 1,100.00
530.00
1,450.00
309.00 401.00
235.00 242.00
50.00
526.00
2,364.00 1,200.00 1,330.00
60.00
1,130.00 1,160.00
452.00
1,500.00
360.00 515.00
251.00 244.00
43.00
412.00
2,970.00 1,540.00 1,700.00
60.00
1,130.00 1,110.00
359.00
1,230.00 1 Includes substandard raisins diverted to other uses.
Fresh Basis Equivalents for Selected Dry Fruits – California: 2007-2009 [Based on 1 ton dry basis equivalent]
Crop 2007 2008 2009
(tons) (tons) (tons)
Apricots .................................................... Figs ........................................................... Grapes Raisin ........................................................ Table ......................................................... Freestone .................................................. Prunes ......................................................
6.60
3.00
4.50 4.67
9.30
2.90
7.65
3.00
4.80 4.79
9.05
2.85
8.26
3.00
4.50 4.56
8.35
2.99

46 Noncitrus Fruits and Nuts Final Estimates 2007-2012 (October 2014) USDA, National Agricultural Statistics Service
Other Fruit Bearing Acreage, Yield, Production, Utilization, Price, and Value by Crop – States and United States: 2010-2012
Crop, State, and season
Bearing acreage Yield per acre 1
Production Utilization
Total Utilized Fresh Processed
(acres) (tons) (tons) (tons) (tons) (tons)
Apricots California 2010 ........................................ 2011 ........................................ 2012 ........................................ Utah 2010 ........................................ 2011 ........................................ 2012 ........................................ Washington 2010 ........................................ 2011 ........................................ 2012 ........................................ United States 2010 ........................................ 2011 ........................................ 2012 ........................................ Avocados California 2010-2011 ............................... 2011-2012 ............................... 2012-2013 ............................... Florida 2010-2011 ............................... 2011-2012 ............................... 2012-2013 ............................... Hawaii 2010-2011 ............................... 2011-2012 ............................... 2012-2013 ............................... United States 2010-2011 ............................... 2011-2012 ............................... 2012-2013 ............................... Dates California 2010 ........................................ 2011 ........................................ 2012 ........................................
10,800 10,500 10,000
(D) (D) (D)
(D) (D) (D)
12,150 11,850 11,350
52,200 52,200
(NA)
7,400 7,400 (NA)
330 350
(NA)
59,930 59,950
(NA)
7,700 8,400 8,800
5.57 5.96 5.38
(D) (D) (D)
(D) (D) (D)
5.46 5.62 5.36
2.90 4.43 (NA)
3.04 4.20 (NA)
1.00 1.00 (NA)
2.91 4.39 (NA)
3.77 3.96 3.53
60,200 62,550 53,800
280 200 300
5,900 3,900 6,700
66,380 66,650 60,800
151,500 231,500
(NA)
22,500 31,100
(NA)
330 350
(NA)
174,330 262,950
(NA)
29,000 33,300 31,100
60,200 62,550 53,800
250 170 270
5,900 3,900 6,700
66,350 66,620 60,770
151,500 231,500
(NA)
22,500 31,100
(NA)
330 350
(NA)
174,330 262,950
(NA)
29,000 33,300 31,100
18,500 20,500 17,000
(D) (D) (D)
(D) (D) (D)
23,510 23,990 23,130
151,500 231,500
(NA)
22,500 31,100
(NA)
330 350
(NA)
174,330 262,950
(NA)
29,000 33,300 31,100
41,700 42,050 36,800
(D) (D) (D)
(D) (D) (D)
42,840 42,630 37,640
(NA) (NA) (NA)
(NA) (NA) (NA)
(NA) (NA) (NA)
(NA) (NA) (NA)
(NA) (NA) (NA)
See footnote(s) at end of table. --continued
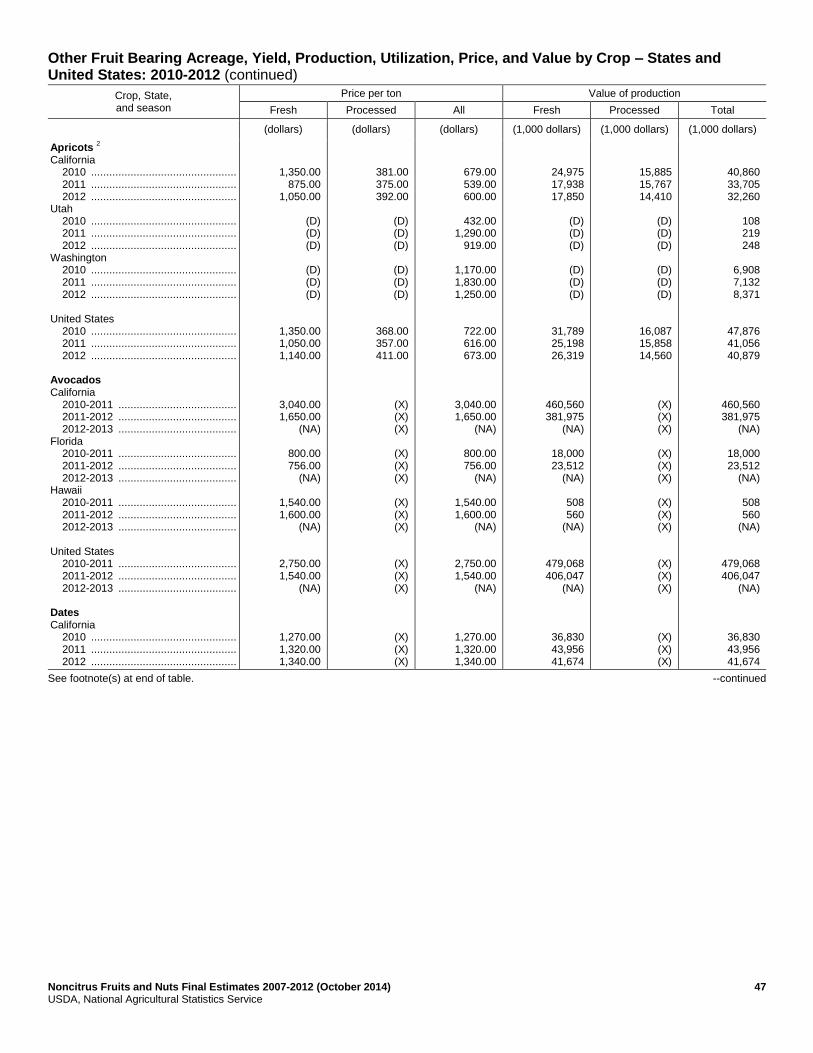
Noncitrus Fruits and Nuts Final Estimates 2007-2012 (October 2014) 47 USDA, National Agricultural Statistics Service
Other Fruit Bearing Acreage, Yield, Production, Utilization, Price, and Value by Crop – States and United States: 2010-2012 (continued)
Crop, State, and season
Price per ton Value of production
Fresh Processed All Fresh Processed Total
(dollars) (dollars) (dollars) (1,000 dollars) (1,000 dollars) (1,000 dollars)
Apricots 2
California 2010 ................................................ 2011 ................................................ 2012 ................................................ Utah 2010 ................................................ 2011 ................................................ 2012 ................................................ Washington 2010 ................................................ 2011 ................................................ 2012 ................................................ United States 2010 ................................................ 2011 ................................................ 2012 ................................................ Avocados California 2010-2011 ....................................... 2011-2012 ....................................... 2012-2013 ....................................... Florida 2010-2011 ....................................... 2011-2012 ....................................... 2012-2013 ....................................... Hawaii 2010-2011 ....................................... 2011-2012 ....................................... 2012-2013 ....................................... United States 2010-2011 ....................................... 2011-2012 ....................................... 2012-2013 ....................................... Dates California 2010 ................................................ 2011 ................................................ 2012 ................................................
1,350.00 875.00
1,050.00
(D) (D) (D)
(D) (D) (D)
1,350.00 1,050.00 1,140.00
3,040.00 1,650.00
(NA)
800.00 756.00
(NA)
1,540.00 1,600.00
(NA)
2,750.00 1,540.00
(NA)
1,270.00 1,320.00 1,340.00
381.00 375.00 392.00
(D) (D) (D)
(D) (D) (D)
368.00 357.00 411.00
(X) (X) (X)
(X) (X) (X)
(X) (X) (X)
(X) (X) (X)
(X) (X) (X)
679.00 539.00 600.00
432.00
1,290.00 919.00
1,170.00 1,830.00 1,250.00
722.00 616.00 673.00
3,040.00 1,650.00
(NA)
800.00 756.00
(NA)
1,540.00 1,600.00
(NA)
2,750.00 1,540.00
(NA)
1,270.00 1,320.00 1,340.00
24,975 17,938 17,850
(D) (D) (D)
(D) (D) (D)
31,789 25,198 26,319
460,560 381,975
(NA)
18,000 23,512
(NA)
508 560
(NA)
479,068 406,047
(NA)
36,830 43,956 41,674
15,885 15,767 14,410
(D) (D) (D)
(D) (D) (D)
16,087 15,858 14,560
(X) (X) (X)
(X) (X) (X)
(X) (X) (X)
(X) (X) (X)
(X) (X) (X)
40,860 33,705 32,260
108 219 248
6,908 7,132 8,371
47,876 41,056 40,879
460,560 381,975
(NA)
18,000 23,512
(NA)
508 560
(NA)
479,068 406,047
(NA)
36,830 43,956 41,674
See footnote(s) at end of table. --continued
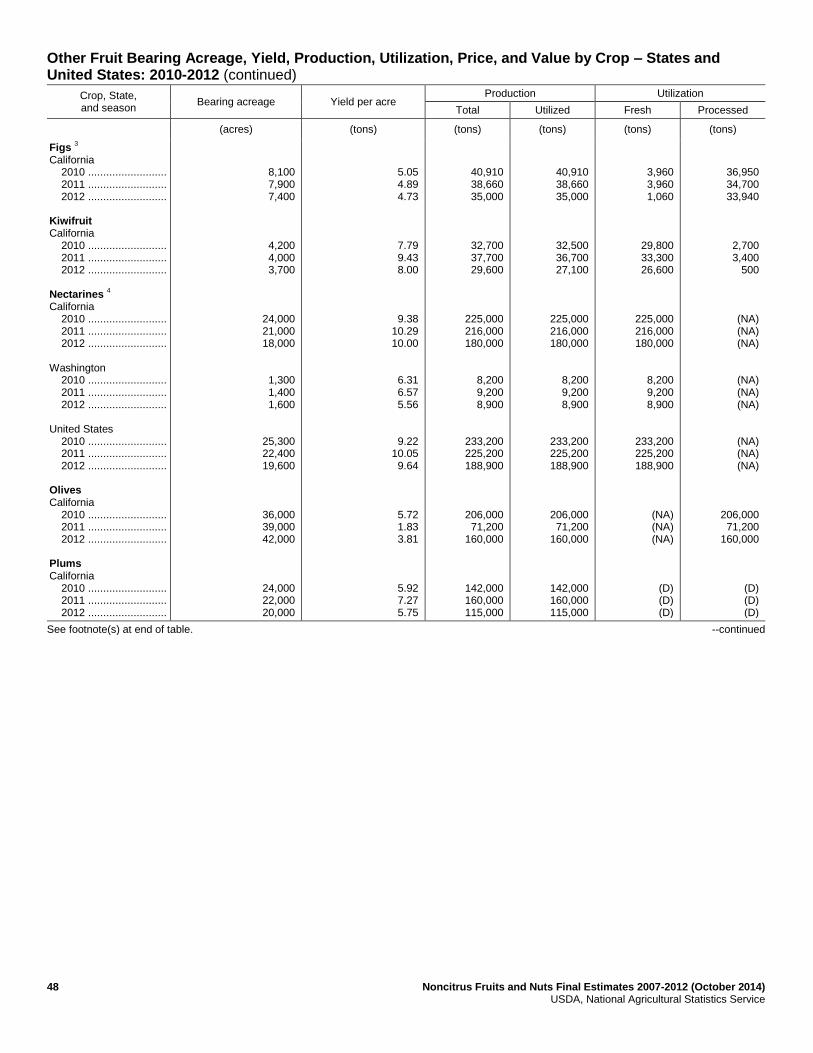
48 Noncitrus Fruits and Nuts Final Estimates 2007-2012 (October 2014) USDA, National Agricultural Statistics Service
Other Fruit Bearing Acreage, Yield, Production, Utilization, Price, and Value by Crop – States and United States: 2010-2012 (continued)
Crop, State, and season
Bearing acreage Yield per acre Production Utilization
Total Utilized Fresh Processed
(acres) (tons) (tons) (tons) (tons) (tons)
Figs 3
California 2010 .......................... 2011 .......................... 2012 .......................... Kiwifruit California 2010 .......................... 2011 .......................... 2012 .......................... Nectarines
4
California 2010 .......................... 2011 .......................... 2012 .......................... Washington 2010 .......................... 2011 .......................... 2012 .......................... United States 2010 .......................... 2011 .......................... 2012 .......................... Olives California 2010 .......................... 2011 .......................... 2012 .......................... Plums California 2010 .......................... 2011 .......................... 2012 ..........................
8,100 7,900 7,400
4,200 4,000 3,700
24,000 21,000 18,000
1,300 1,400 1,600
25,300 22,400 19,600
36,000 39,000 42,000
24,000 22,000 20,000
5.05 4.89 4.73
7.79 9.43 8.00
9.38 10.29 10.00
6.31 6.57 5.56
9.22 10.05 9.64
5.72 1.83 3.81
5.92 7.27 5.75
40,910 38,660 35,000
32,700 37,700 29,600
225,000 216,000 180,000
8,200 9,200 8,900
233,200 225,200 188,900
206,000 71,200
160,000
142,000 160,000 115,000
40,910 38,660 35,000
32,500 36,700 27,100
225,000 216,000 180,000
8,200 9,200 8,900
233,200 225,200 188,900
206,000 71,200
160,000
142,000 160,000 115,000
3,960 3,960 1,060
29,800 33,300 26,600
225,000 216,000 180,000
8,200 9,200 8,900
233,200 225,200 188,900
(NA) (NA) (NA)
(D) (D) (D)
36,950 34,700 33,940
2,700 3,400
500
(NA) (NA) (NA)
(NA) (NA) (NA)
(NA) (NA) (NA)
206,000 71,200
160,000
(D) (D) (D)
See footnote(s) at end of table. --continued

Noncitrus Fruits and Nuts Final Estimates 2007-2012 (October 2014) 49 USDA, National Agricultural Statistics Service
Other Fruit Bearing Acreage, Yield, Production, Utilization, Price, and, Value by Crop – States and United States: 2010-2012 (continued)
Crop, State, and season
Price per ton Value of production
Fresh Processed All Fresh Processed Total
(dollars) (dollars) (dollars) (1,000 dollars) (1,000 dollars) (1,000 dollars)
Figs California 2010 ................................................ 2011 ................................................ 2012 ................................................ Kiwifruit California 2010 ................................................ 2011 ................................................ 2012 ................................................ Nectarines
4
California 2010 ................................................ 2011 ................................................ 2012 ................................................ Washington 2010 ................................................ 2011 ................................................ 2012 ................................................ United States 2010 ................................................ 2011 ................................................ 2012 ................................................ Olives California 2010 ................................................ 2011 ................................................ 2012 ................................................ Plums California 2010 ................................................ 2011 ................................................ 2012 ................................................
(D) (D)
(NA)
(D) (D)
(NA)
560.00 590.00 777.00
375.00 384.00 567.00
553.00 582.00 767.00
(X) (X) (X)
(D) (D) (D)
(D) (D)
(NA)
(D) (D)
(NA)
(X) (X) (X)
(X) (X) (X)
(X) (X) (X)
664.00 733.00 813.00
(D) (D) (D)
542.00 526.00
(NA)
768.00 775.00
(NA)
560.00 590.00 777.00
375.00 384.00 567.00
553.00 582.00 767.00
664.00 733.00 813.00
555.00 402.00 695.00
(D) (D)
(NA)
(D) (D)
(NA)
126,000 127,440 139,860
3,075 3,533 5,046
129,075 130,973 144,906
(X) (X) (X)
(D) (D)
79,800
(D) (D)
(NA)
(D) (D)
(NA)
(X) (X) (X)
(X) (X) (X)
(X) (X) (X)
136,796 52,168
130,038
(D) (D) 140
22,185 20,336
(NA)
24,961 28,439
(NA)
126,000 127,440 139,860
3,075 3,533 5,046
129,075 130,973 144,906
136,796 52,168
130,038
78,810 64,320 79,940
See footnote(s) at end of table. --continued
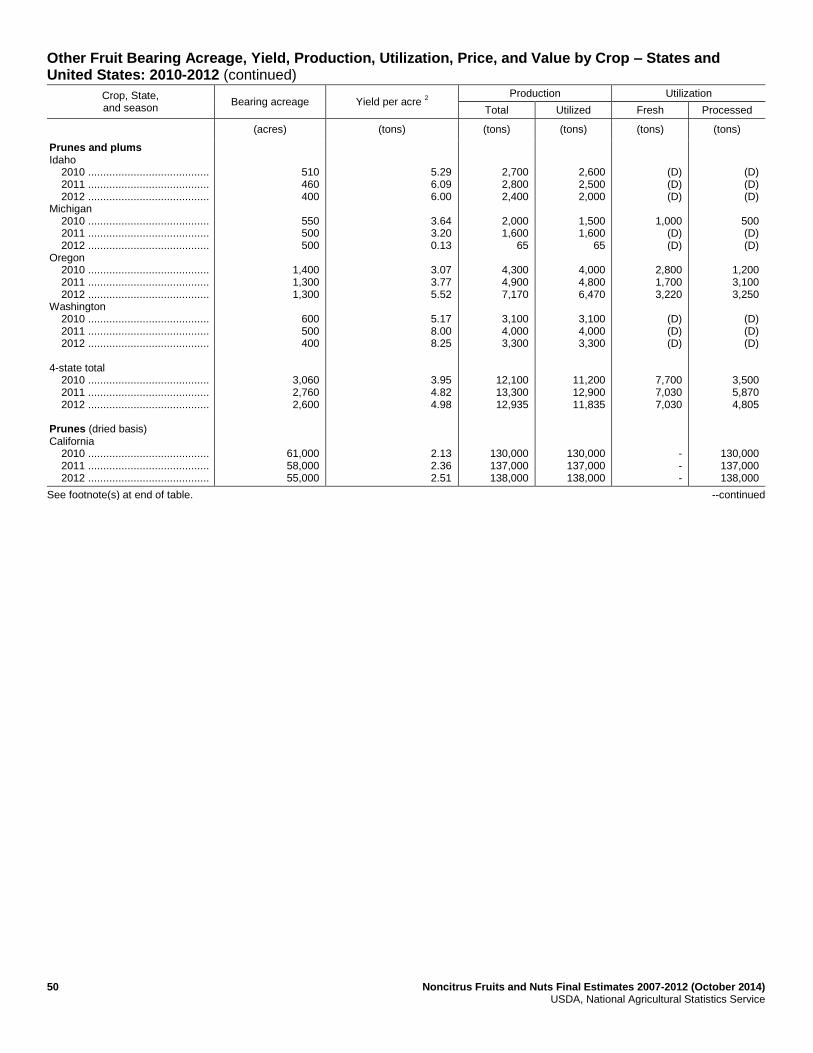
50 Noncitrus Fruits and Nuts Final Estimates 2007-2012 (October 2014) USDA, National Agricultural Statistics Service
Other Fruit Bearing Acreage, Yield, Production, Utilization, Price, and Value by Crop – States and United States: 2010-2012 (continued)
Crop, State, and season
Bearing acreage Yield per acre 2
Production Utilization
Total Utilized Fresh Processed
(acres) (tons) (tons) (tons) (tons) (tons)
Prunes and plums Idaho 2010 ........................................ 2011 ........................................ 2012 ........................................ Michigan 2010 ........................................ 2011 ........................................ 2012 ........................................ Oregon 2010 ........................................ 2011 ........................................ 2012 ........................................ Washington 2010 ........................................ 2011 ........................................ 2012 ........................................ 4-state total 2010 ........................................ 2011 ........................................ 2012 ........................................ Prunes (dried basis) California 2010 ........................................ 2011 ........................................ 2012 ........................................
510 460 400
550 500 500
1,400 1,300 1,300
600 500 400
3,060 2,760 2,600
61,000 58,000 55,000
5.29 6.09 6.00
3.64 3.20 0.13
3.07 3.77 5.52
5.17 8.00 8.25
3.95 4.82 4.98
2.13 2.36 2.51
2,700 2,800 2,400
2,000 1,600
65
4,300 4,900 7,170
3,100 4,000 3,300
12,100 13,300 12,935
130,000 137,000 138,000
2,600 2,500 2,000
1,500 1,600
65
4,000 4,800 6,470
3,100 4,000 3,300
11,200 12,900 11,835
130,000 137,000 138,000
(D) (D) (D)
1,000
(D) (D)
2,800 1,700 3,220
(D) (D) (D)
7,700 7,030 7,030
- - -
(D) (D) (D)
500 (D) (D)
1,200 3,100 3,250
(D) (D) (D)
3,500 5,870 4,805
130,000 137,000 138,000
See footnote(s) at end of table. --continued

Noncitrus Fruits and Nuts Final Estimates 2007-2012 (October 2014) 51 USDA, National Agricultural Statistics Service
Other Fruit Bearing Acreage, Yield, Production, Utilization, Price, and Value by Crop – States and United States: 2010-2012 (continued)
Crop, State, and season
Price per ton Value of production
Fresh Processed All Fresh Processed Total
(dollars) (dollars) (dollars) (1,000 dollars) (1,000 dollars) (1,000 dollars)
Prunes and plums Idaho 2010 ................................................ 2011 ................................................ 2012 ................................................ Michigan 2010 ................................................ 2011 ................................................ 2012 ................................................ Oregon 2010 ................................................ 2011 ................................................ 2012 ................................................ Washington 2010 ................................................ 2011 ................................................ 2012 ................................................ 4-state total 2010 ................................................ 2011 ................................................ 2012 ................................................ Prunes (dried basis) California 2010 ................................................ 2011 ................................................ 2012 ................................................
(D) (D) (D)
870.00
(D) (D)
498.00 441.00 813.00
(D) (D) (D)
551.00 482.00 739.00
(X) (X) (X)
(D) (D) (D)
180.00
(D) (D)
266.00 310.00 265.00
(D) (D) (D)
193.00 235.00 228.00
1,350.00 1,310.00 1,330.00
378.00 354.00 673.00
640.00 700.00 585.00
428.00 356.00 538.00
406.00 263.00 432.00
439.00 370.00 531.00
1,350.00 1,310.00 1,330.00
(D) (D) (D)
870 (D) (D)
1,394
750 2,618
(D) (D) (D)
4,240 3,389 5,194
(X) (X) (X)
(D) (D) (D)
90
(D) (D)
319 960 860
(D) (D) (D)
675 1,378 1,094
175,500 179,470 183,540
983 886
1,345
960 1,120
38
1,713 1,710 3,478
1,259 1,051 1,427
4,915 4,767 6,288
175,500 179,470 183,540
- Represents zero. (D) Withheld to avoid disclosing data for individual operations. (NA) Not available. (X) Not applicable. 1
Yield is based on total production. 2
Apricot processed price excludes dried. Processing value includes dried. 3
Small quantities of canned figs are included in fresh to avoid disclosure of individual operations. 4
Small quantities of processed nectarines are included in fresh to avoid disclosure of individual operations.
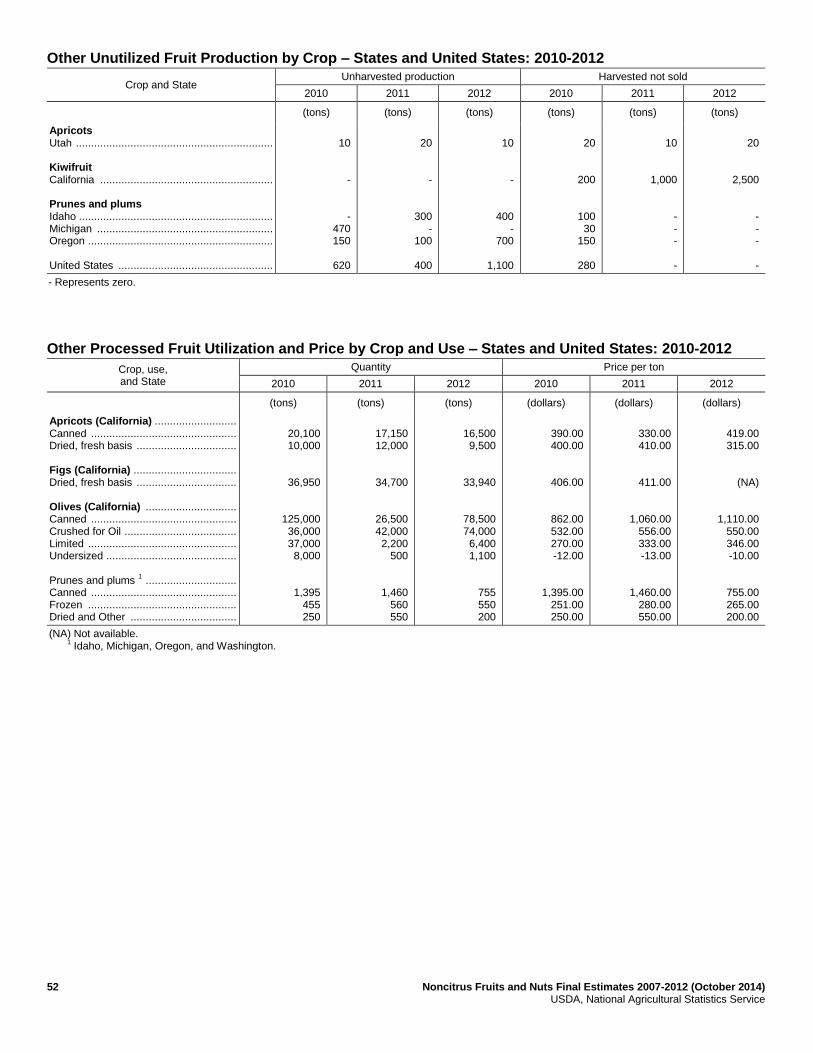
52 Noncitrus Fruits and Nuts Final Estimates 2007-2012 (October 2014) USDA, National Agricultural Statistics Service
Other Unutilized Fruit Production by Crop – States and United States: 2010-2012
Crop and State Unharvested production Harvested not sold
2010 2011 2012 2010 2011 2012
(tons) (tons) (tons) (tons) (tons) (tons)
Apricots Utah ................................................................. Kiwifruit California ......................................................... Prunes and plums Idaho ................................................................ Michigan .......................................................... Oregon ............................................................. United States ...................................................
10
-
- 470 150
620
20
-
300 -
100
400
10
-
400 -
700
1,100
20
200
100 30
150
280
10
1,000
- - -
-
20
2,500
- - -
-
- Represents zero.
Other Processed Fruit Utilization and Price by Crop and Use – States and United States: 2010-2012
Crop, use, and State
Quantity Price per ton
2010 2011 2012 2010 2011 2012
(tons) (tons) (tons) (dollars) (dollars) (dollars)
Apricots (California) ........................... Canned ................................................ Dried, fresh basis ................................. Figs (California) .................................. Dried, fresh basis ................................. Olives (California) .............................. Canned ................................................ Crushed for Oil ..................................... Limited ................................................. Undersized ........................................... Prunes and plums
1 ..............................
Canned ................................................ Frozen ................................................. Dried and Other ...................................
20,100 10,000
36,950
125,000 36,000 37,000 8,000
1,395 455 250
17,150 12,000
34,700
26,500 42,000 2,200
500
1,460 560 550
16,500 9,500
33,940
78,500 74,000 6,400 1,100
755 550 200
390.00 400.00
406.00
862.00 532.00 270.00 -12.00
1,395.00 251.00 250.00
330.00 410.00
411.00
1,060.00 556.00 333.00 -13.00
1,460.00 280.00 550.00
419.00 315.00
(NA)
1,110.00 550.00 346.00 -10.00
755.00 265.00 200.00
(NA) Not available. 1
Idaho, Michigan, Oregon, and Washington.
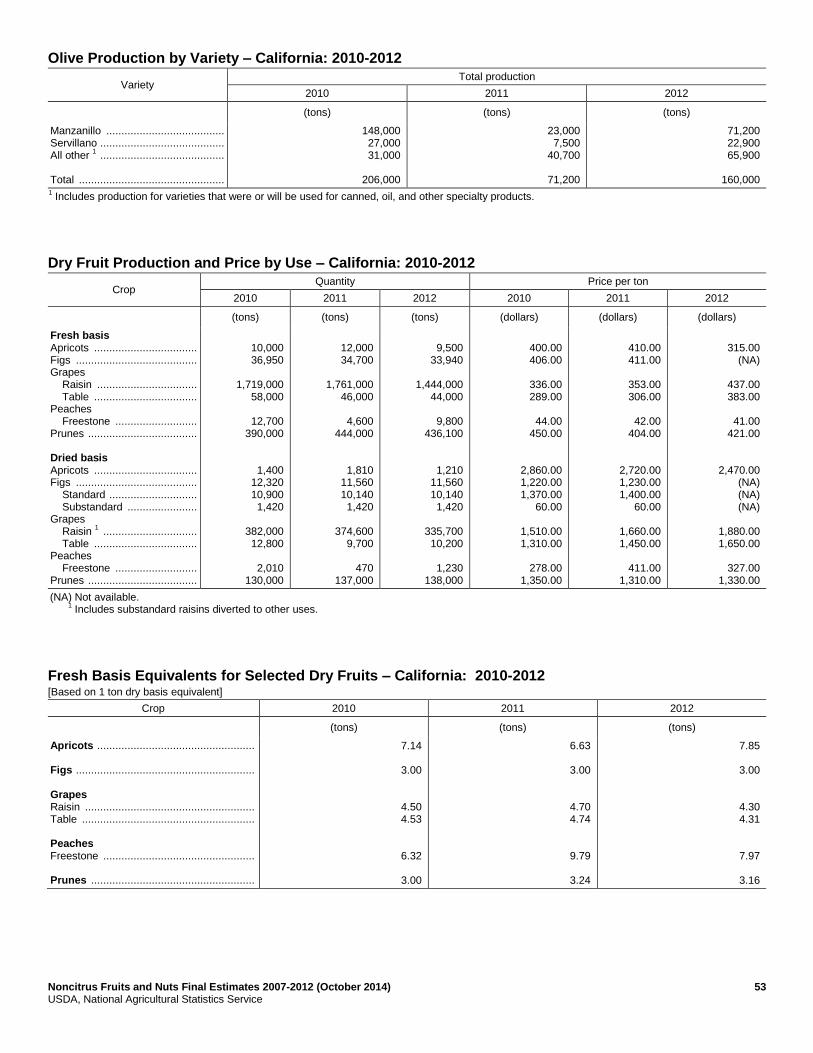
Noncitrus Fruits and Nuts Final Estimates 2007-2012 (October 2014) 53 USDA, National Agricultural Statistics Service
Olive Production by Variety – California: 2010-2012
Variety Total production
2010 2011 2012
(tons) (tons) (tons)
Manzanillo ....................................... Servillano ......................................... All other
1 .........................................
Total ................................................
148,000 27,000 31,000
206,000
23,000 7,500
40,700
71,200
71,200 22,900 65,900
160,000
1 Includes production for varieties that were or will be used for canned, oil, and other specialty products.
Dry Fruit Production and Price by Use – California: 2010-2012
Crop Quantity Price per ton
2010 2011 2012 2010 2011 2012
(tons) (tons) (tons) (dollars) (dollars) (dollars)
Fresh basis Apricots .................................. Figs ........................................ Grapes Raisin ................................. Table .................................. Peaches Freestone ........................... Prunes .................................... Dried basis Apricots .................................. Figs ........................................ Standard ............................. Substandard ....................... Grapes Raisin
1 ...............................
Table .................................. Peaches Freestone ........................... Prunes ....................................
10,000 36,950
1,719,000
58,000
12,700 390,000
1,400 12,320 10,900 1,420
382,000 12,800
2,010
130,000
12,000 34,700
1,761,000
46,000
4,600 444,000
1,810 11,560 10,140 1,420
374,600
9,700
470 137,000
9,500
33,940
1,444,000 44,000
9,800
436,100
1,210 11,560 10,140 1,420
335,700 10,200
1,230
138,000
400.00 406.00
336.00 289.00
44.00
450.00
2,860.00 1,220.00 1,370.00
60.00
1,510.00 1,310.00
278.00
1,350.00
410.00 411.00
353.00 306.00
42.00
404.00
2,720.00 1,230.00 1,400.00
60.00
1,660.00 1,450.00
411.00
1,310.00
315.00
(NA)
437.00 383.00
41.00
421.00
2,470.00 (NA) (NA) (NA)
1,880.00 1,650.00
327.00
1,330.00
(NA) Not available. 1
Includes substandard raisins diverted to other uses.
Fresh Basis Equivalents for Selected Dry Fruits – California: 2010-2012 [Based on 1 ton dry basis equivalent]
Crop 2010 2011 2012
(tons) (tons) (tons)
Apricots .................................................... Figs ........................................................... Grapes Raisin ........................................................ Table ......................................................... Peaches Freestone .................................................. Prunes ......................................................
7.14
3.00
4.50 4.53
6.32
3.00
6.63
3.00
4.70 4.74
9.79
3.24
7.85
3.00
4.30 4.31
7.97
3.16

54 Noncitrus Fruits and Nuts Final Estimates 2007-2012 (October 2014) USDA, National Agricultural Statistics Service
Strawberry Area Planted, Harvested, Yield, Production, Price, and Value – States and United States: 2007-2009
State Area planted Area harvested
2007 2008 2009 2007 2008 2009
(acres) (acres) (acres) (acres) (acres) (acres)
California ........................... Florida ............................... Michigan ........................... New York .......................... North Carolina ................... Ohio .................................. Oregon .............................. Pennsylvania ..................... Washington ....................... Wisconsin ......................... United States ....................
35,500 6,600 1,000 1,600 1,700 1,100 2,200 1,200 1,600
900
53,400
37,600 6,900
950 1,600 1,700 1,100 2,100 1,200 1,600
910
55,660
39,800 8,800
950 1,600 1,600 1,100 2,200 1,100 1,500
870
59,520
35,500 6,600
850 1,400 1,500
780 1,900 1,200 1,600
850
52,180
37,600 6,900
800 1,400 1,600
770 1,800 1,200 1,600
800
54,470
39,800 8,800
800 1,400 1,500
710 1,700 1,100 1,500
770
58,080
State Yield per acre Production
2007 2008 2009 2007 2008 2009
(cwt) (cwt) (cwt) (1,000 cwt) (1,000 cwt) (1,000 cwt)
California ........................... Florida ............................... Michigan ........................... New York .......................... North Carolina ................... Ohio .................................. Oregon .............................. Pennsylvania ..................... Washington ....................... Wisconsin ......................... United States ....................
605 320 51 33
125 49
130 47 84 56
469
605 260 61 32
130 55
130 61 90 61
465
625 270 58 31
130 42
125 59 95 61
482
21,540 2,112
43 46
189 38
247 56
134 48
24,453
22,675 1,794
49 45
208 42
238 73
144 49
25,317
24,856 2,376
46 44
195 30
211 65
143 47
28,013
State Per cwt Total
2007 2008 2009 2007 2008 2009
(dollars) (dollars) (dollars) (1,000 dollars) (1,000 dollars) (1,000 dollars)
California ........................... Florida ............................... Michigan ........................... New York .......................... North Carolina ................... Ohio .................................. Oregon .............................. Pennsylvania ..................... Washington ....................... Wisconsin ......................... United States ....................
65.50 124.00 117.00 165.00 95.00
154.00 66.30
187.00 65.40
136.00
71.60
69.60 139.00 119.00 165.00 100.00 174.00 70.50
211.00 70.10
145.00
75.80
69.40 132.00 144.00 205.00 135.00 191.00 65.80
208.00 58.30
155.00
76.00
1,410,652 261,888
5,028 7,590
17,955 5,852
16,378 10,472 8,765 6,528
1,751,108
1,578,175 249,366
5,846 7,425
20,800 7,308
16,768 15,403 10,092 7,105
1,918,288
1,725,232 313,632
6,615 9,020
26,325 5,730
13,888 13,520 8,338 7,285
2,129,585

Noncitrus Fruits and Nuts Final Estimates 2007-2012 (October 2014) 55 USDA, National Agricultural Statistics Service
Strawberry Utilization, Price, and Value by Utilization – States and United States: 2007-2009
Utilization and State Production
2007 2008 2009
(1,000 cwt) (1,000 cwt) (1,000 cwt)
Fresh market California ............................................. Florida ................................................. Michigan .............................................. New York ............................................. North Carolina ..................................... Ohio ..................................................... Oregon ................................................ Pennsylvania ....................................... Washington ......................................... Wisconsin ............................................ United States ....................................... Processing California ............................................. Michigan .............................................. Oregon ................................................ Washington ......................................... United States .......................................
17,159 2,112
41 46
189 38 27 56 17 48
19,733
4,381 2
220 117
4,720
18,605 1,794
47 45
208 42 26 73 22 49
20,911
4,070 2
212 122
4,406
20,040 2,376
43 44
195 30 29 65 11 47
22,880
4,816 3
182 132
5,133
Utilization and State Per unit Total
2007 2008 2009 2007 2008 2009
(dollars per cwt) (dollars per cwt) (dollars per cwt) (1,000 dollars) (1,000 dollars) (1,000 dollars)
Fresh market California ............................................. Florida ................................................. Michigan .............................................. New York ............................................. North Carolina ..................................... Ohio ..................................................... Oregon ................................................ Pennsylvania ....................................... Washington ......................................... Wisconsin ............................................ United States ....................................... Processing California ............................................. Michigan .............................................. Oregon ................................................ Washington ......................................... United States .......................................
75.70
124.00 120.00 165.00 95.00
154.00 134.00 187.00 146.00 136.00
82.10
25.50 54.00 58.00 53.70
27.70
77.30
139.00 122.00 165.00 100.00 174.00 172.00 211.00 172.00 145.00
84.10
34.40 56.00 58.00 51.70
36.00
79.00
132.00 150.00 205.00 135.00 191.00 140.00 208.00 158.00 155.00
86.10
29.50 55.00 54.00 50.00
30.90
1,298,936
261,888 4,920 7,590
17,955 5,852 3,618
10,472 2,482 6,528
1,620,241
111,716 108
12,760 6,283
130,867
1,438,167
249,366 5,734 7,425
20,800 7,308 4,472
15,403 3,784 7,105
1,759,564
140,008 112
12,296 6,308
158,724
1,583,160
313,632 6,450 9,020
26,325 5,730 4,060
13,520 1,738 7,285
1,970,920
142,072 165
9,828 6,600
158,665
(D) Withheld to avoid disclosing data for individual operations. (NA) Not available.
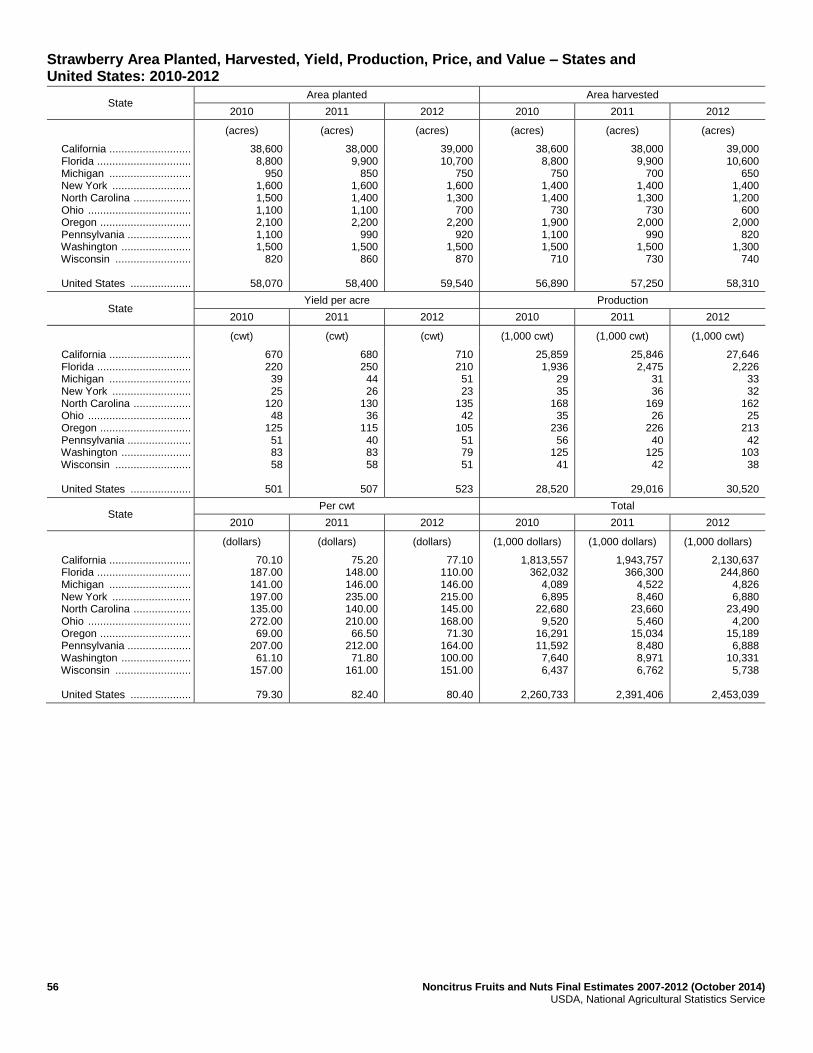
56 Noncitrus Fruits and Nuts Final Estimates 2007-2012 (October 2014) USDA, National Agricultural Statistics Service
Strawberry Area Planted, Harvested, Yield, Production, Price, and Value – States and United States: 2010-2012
State Area planted Area harvested
2010 2011 2012 2010 2011 2012
(acres) (acres) (acres) (acres) (acres) (acres)
California ........................... Florida ............................... Michigan ........................... New York .......................... North Carolina ................... Ohio .................................. Oregon .............................. Pennsylvania ..................... Washington ....................... Wisconsin ......................... United States ....................
38,600 8,800
950 1,600 1,500 1,100 2,100 1,100 1,500
820
58,070
38,000 9,900
850 1,600 1,400 1,100 2,200
990 1,500
860
58,400
39,000 10,700
750 1,600 1,300
700 2,200
920 1,500
870
59,540
38,600 8,800
750 1,400 1,400
730 1,900 1,100 1,500
710
56,890
38,000 9,900
700 1,400 1,300
730 2,000
990 1,500
730
57,250
39,000 10,600
650 1,400 1,200
600 2,000
820 1,300
740
58,310
State Yield per acre Production
2010 2011 2012 2010 2011 2012
(cwt) (cwt) (cwt) (1,000 cwt) (1,000 cwt) (1,000 cwt)
California ........................... Florida ............................... Michigan ........................... New York .......................... North Carolina ................... Ohio .................................. Oregon .............................. Pennsylvania ..................... Washington ....................... Wisconsin ......................... United States ....................
670 220 39 25
120 48
125 51 83 58
501
680 250 44 26
130 36
115 40 83 58
507
710 210 51 23
135 42
105 51 79 51
523
25,859 1,936
29 35
168 35
236 56
125 41
28,520
25,846 2,475
31 36
169 26
226 40
125 42
29,016
27,646 2,226
33 32
162 25
213 42
103 38
30,520
State Per cwt Total
2010 2011 2012 2010 2011 2012
(dollars) (dollars) (dollars) (1,000 dollars) (1,000 dollars) (1,000 dollars)
California ........................... Florida ............................... Michigan ........................... New York .......................... North Carolina ................... Ohio .................................. Oregon .............................. Pennsylvania ..................... Washington ....................... Wisconsin ......................... United States ....................
70.10 187.00 141.00 197.00 135.00 272.00 69.00
207.00 61.10
157.00
79.30
75.20 148.00 146.00 235.00 140.00 210.00 66.50
212.00 71.80
161.00
82.40
77.10 110.00 146.00 215.00 145.00 168.00 71.30
164.00 100.00 151.00
80.40
1,813,557 362,032
4,089 6,895
22,680 9,520
16,291 11,592 7,640 6,437
2,260,733
1,943,757 366,300
4,522 8,460
23,660 5,460
15,034 8,480 8,971 6,762
2,391,406
2,130,637 244,860
4,826 6,880
23,490 4,200
15,189 6,888
10,331 5,738
2,453,039
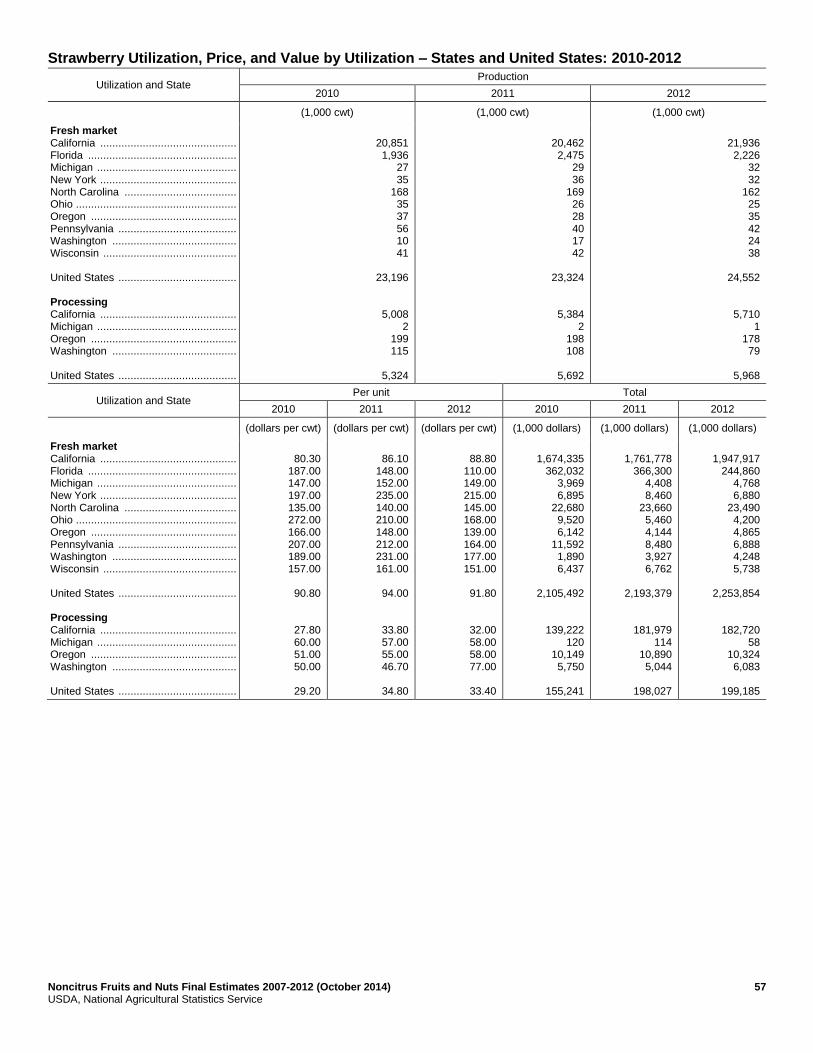
Noncitrus Fruits and Nuts Final Estimates 2007-2012 (October 2014) 57 USDA, National Agricultural Statistics Service
Strawberry Utilization, Price, and Value by Utilization – States and United States: 2010-2012
Utilization and State Production
2010 2011 2012
(1,000 cwt) (1,000 cwt) (1,000 cwt)
Fresh market California ............................................. Florida ................................................. Michigan .............................................. New York ............................................. North Carolina ..................................... Ohio ..................................................... Oregon ................................................ Pennsylvania ....................................... Washington ......................................... Wisconsin ............................................ United States ....................................... Processing California ............................................. Michigan .............................................. Oregon ................................................ Washington ......................................... United States .......................................
20,851 1,936
27 35
168 35 37 56 10 41
23,196
5,008 2
199 115
5,324
20,462 2,475
29 36
169 26 28 40 17 42
23,324
5,384 2
198 108
5,692
21,936 2,226
32 32
162 25 35 42 24 38
24,552
5,710 1
178 79
5,968
Utilization and State Per unit Total
2010 2011 2012 2010 2011 2012
(dollars per cwt) (dollars per cwt) (dollars per cwt) (1,000 dollars) (1,000 dollars) (1,000 dollars)
Fresh market California ............................................. Florida ................................................. Michigan .............................................. New York ............................................. North Carolina ..................................... Ohio ..................................................... Oregon ................................................ Pennsylvania ....................................... Washington ......................................... Wisconsin ............................................ United States ....................................... Processing California ............................................. Michigan .............................................. Oregon ................................................ Washington ......................................... United States .......................................
80.30
187.00 147.00 197.00 135.00 272.00 166.00 207.00 189.00 157.00
90.80
27.80 60.00 51.00 50.00
29.20
86.10
148.00 152.00 235.00 140.00 210.00 148.00 212.00 231.00 161.00
94.00
33.80 57.00 55.00 46.70
34.80
88.80
110.00 149.00 215.00 145.00 168.00 139.00 164.00 177.00 151.00
91.80
32.00 58.00 58.00 77.00
33.40
1,674,335
362,032 3,969 6,895
22,680 9,520 6,142
11,592 1,890 6,437
2,105,492
139,222 120
10,149 5,750
155,241
1,761,778
366,300 4,408 8,460
23,660 5,460 4,144 8,480 3,927 6,762
2,193,379
181,979 114
10,890 5,044
198,027
1,947,917
244,860 4,768 6,880
23,490 4,200 4,865 6,888 4,248 5,738
2,253,854
182,720 58
10,324 6,083
199,185
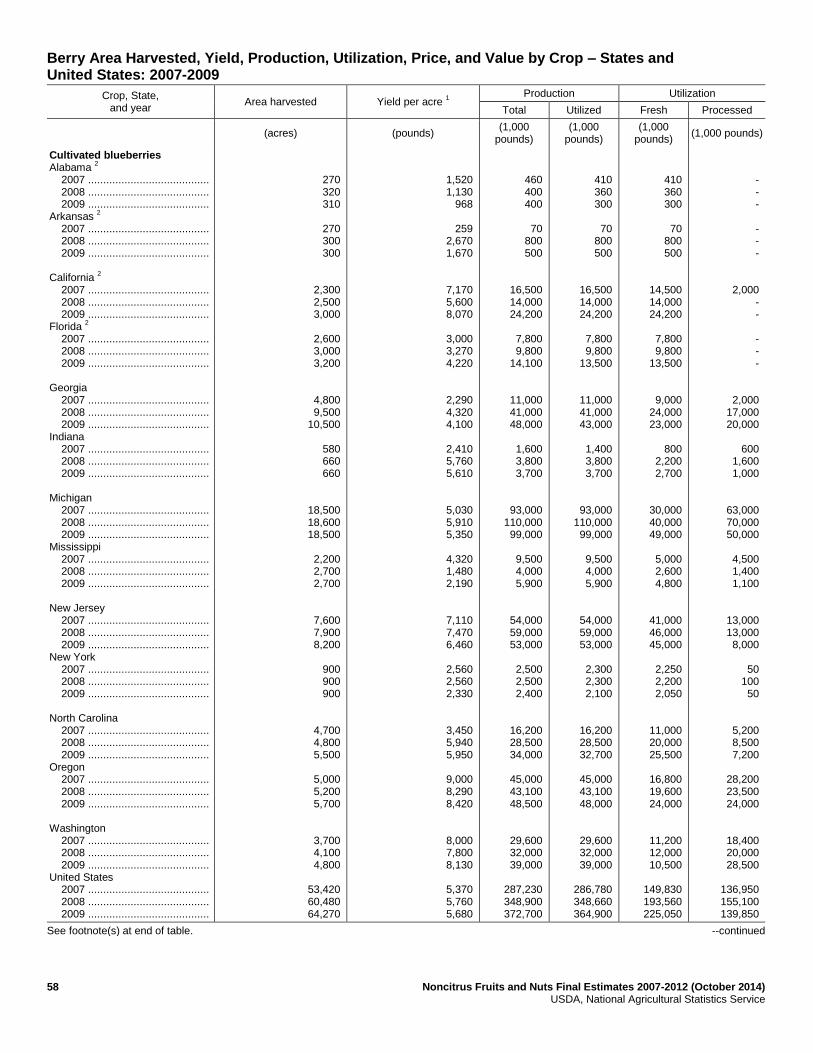
58 Noncitrus Fruits and Nuts Final Estimates 2007-2012 (October 2014) USDA, National Agricultural Statistics Service
Berry Area Harvested, Yield, Production, Utilization, Price, and Value by Crop – States and United States: 2007-2009
Crop, State, and year
Area harvested Yield per acre 1
Production Utilization
Total Utilized Fresh Processed
(acres) (pounds) (1,000
pounds) (1,000
pounds) (1,000
pounds) (1,000 pounds)
Cultivated blueberries Alabama
2
2007 ........................................ 2008 ........................................ 2009 ........................................ Arkansas
2
2007 ........................................ 2008 ........................................ 2009 ........................................ California
2
2007 ........................................ 2008 ........................................ 2009 ........................................ Florida
2
2007 ........................................ 2008 ........................................ 2009 ........................................ Georgia 2007 ........................................ 2008 ........................................ 2009 ........................................ Indiana 2007 ........................................ 2008 ........................................ 2009 ........................................ Michigan 2007 ........................................ 2008 ........................................ 2009 ........................................ Mississippi 2007 ........................................ 2008 ........................................ 2009 ........................................ New Jersey 2007 ........................................ 2008 ........................................ 2009 ........................................ New York 2007 ........................................ 2008 ........................................ 2009 ........................................ North Carolina 2007 ........................................ 2008 ........................................ 2009 ........................................ Oregon 2007 ........................................ 2008 ........................................ 2009 ........................................ Washington 2007 ........................................ 2008 ........................................ 2009 ........................................ United States 2007 ........................................ 2008 ........................................ 2009 ........................................
270 320 310
270 300 300
2,300 2,500 3,000
2,600 3,000 3,200
4,800 9,500
10,500
580 660 660
18,500 18,600 18,500
2,200 2,700 2,700
7,600 7,900 8,200
900 900 900
4,700 4,800 5,500
5,000 5,200 5,700
3,700 4,100 4,800
53,420 60,480 64,270
1,520 1,130
968
259 2,670 1,670
7,170 5,600 8,070
3,000 3,270 4,220
2,290 4,320 4,100
2,410 5,760 5,610
5,030 5,910 5,350
4,320 1,480 2,190
7,110 7,470 6,460
2,560 2,560 2,330
3,450 5,940 5,950
9,000 8,290 8,420
8,000 7,800 8,130
5,370 5,760 5,680
460 400 400
70
800 500
16,500 14,000 24,200
7,800 9,800
14,100
11,000 41,000 48,000
1,600 3,800 3,700
93,000 110,000 99,000
9,500 4,000 5,900
54,000 59,000 53,000
2,500 2,500 2,400
16,200 28,500 34,000
45,000 43,100 48,500
29,600 32,000 39,000
287,230 348,900 372,700
410 360 300
70
800 500
16,500 14,000 24,200
7,800 9,800
13,500
11,000 41,000 43,000
1,400 3,800 3,700
93,000 110,000 99,000
9,500 4,000 5,900
54,000 59,000 53,000
2,300 2,300 2,100
16,200 28,500 32,700
45,000 43,100 48,000
29,600 32,000 39,000
286,780 348,660 364,900
410 360 300
70
800 500
14,500 14,000 24,200
7,800 9,800
13,500
9,000 24,000 23,000
800
2,200 2,700
30,000 40,000 49,000
5,000 2,600 4,800
41,000 46,000 45,000
2,250 2,200 2,050
11,000 20,000 25,500
16,800 19,600 24,000
11,200 12,000 10,500
149,830 193,560 225,050
- - -
- - -
2,000 - -
- - -
2,000 17,000 20,000
600
1,600 1,000
63,000 70,000 50,000
4,500 1,400 1,100
13,000 13,000 8,000
50
100 50
5,200 8,500 7,200
28,200 23,500 24,000
18,400 20,000 28,500
136,950 155,100 139,850
See footnote(s) at end of table. --continued
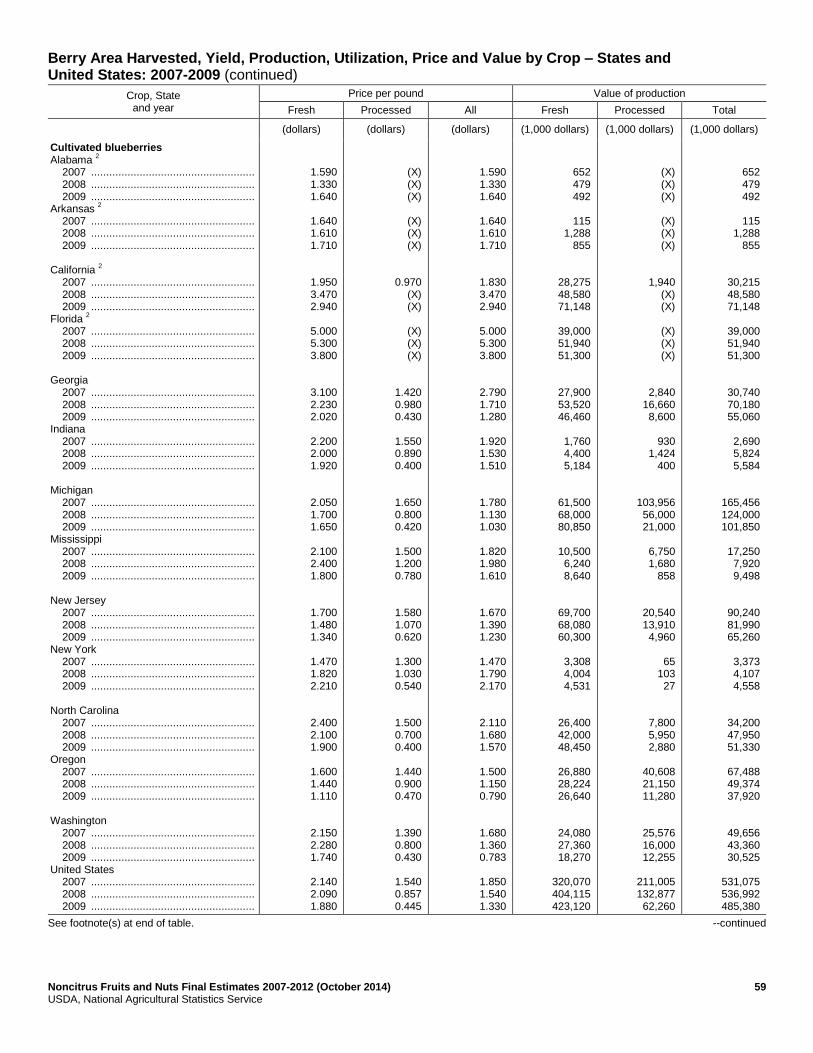
Noncitrus Fruits and Nuts Final Estimates 2007-2012 (October 2014) 59 USDA, National Agricultural Statistics Service
Berry Area Harvested, Yield, Production, Utilization, Price and Value by Crop – States and United States: 2007-2009 (continued)
Crop, State and year
Price per pound Value of production
Fresh Processed All Fresh Processed Total
(dollars) (dollars) (dollars) (1,000 dollars) (1,000 dollars) (1,000 dollars)
Cultivated blueberries Alabama
2
2007 ...................................................... 2008 ...................................................... 2009 ...................................................... Arkansas
2
2007 ...................................................... 2008 ...................................................... 2009 ...................................................... California
2
2007 ...................................................... 2008 ...................................................... 2009 ...................................................... Florida
2
2007 ...................................................... 2008 ...................................................... 2009 ...................................................... Georgia 2007 ...................................................... 2008 ...................................................... 2009 ...................................................... Indiana 2007 ...................................................... 2008 ...................................................... 2009 ...................................................... Michigan 2007 ...................................................... 2008 ...................................................... 2009 ...................................................... Mississippi 2007 ...................................................... 2008 ...................................................... 2009 ...................................................... New Jersey 2007 ...................................................... 2008 ...................................................... 2009 ...................................................... New York 2007 ...................................................... 2008 ...................................................... 2009 ...................................................... North Carolina 2007 ...................................................... 2008 ...................................................... 2009 ...................................................... Oregon 2007 ...................................................... 2008 ...................................................... 2009 ...................................................... Washington 2007 ...................................................... 2008 ...................................................... 2009 ...................................................... United States 2007 ...................................................... 2008 ...................................................... 2009 ......................................................
1.590 1.330 1.640
1.640 1.610 1.710
1.950 3.470 2.940
5.000 5.300 3.800
3.100 2.230 2.020
2.200 2.000 1.920
2.050 1.700 1.650
2.100 2.400 1.800
1.700 1.480 1.340
1.470 1.820 2.210
2.400 2.100 1.900
1.600 1.440 1.110
2.150 2.280 1.740
2.140 2.090 1.880
(X) (X) (X)
(X) (X) (X)
0.970 (X) (X)
(X) (X) (X)
1.420 0.980 0.430
1.550 0.890 0.400
1.650 0.800 0.420
1.500 1.200 0.780
1.580 1.070 0.620
1.300 1.030 0.540
1.500 0.700 0.400
1.440 0.900 0.470
1.390 0.800 0.430
1.540 0.857 0.445
1.590 1.330 1.640
1.640 1.610 1.710
1.830 3.470 2.940
5.000 5.300 3.800
2.790 1.710 1.280
1.920 1.530 1.510
1.780 1.130 1.030
1.820 1.980 1.610
1.670 1.390 1.230
1.470 1.790 2.170
2.110 1.680 1.570
1.500 1.150 0.790
1.680 1.360 0.783
1.850 1.540 1.330
652 479 492
115
1,288 855
28,275 48,580 71,148
39,000 51,940 51,300
27,900 53,520 46,460
1,760 4,400 5,184
61,500 68,000 80,850
10,500 6,240 8,640
69,700 68,080 60,300
3,308 4,004 4,531
26,400 42,000 48,450
26,880 28,224 26,640
24,080 27,360 18,270
320,070 404,115 423,120
(X) (X) (X)
(X) (X) (X)
1,940 (X) (X)
(X) (X) (X)
2,840 16,660 8,600
930
1,424 400
103,956 56,000 21,000
6,750 1,680
858
20,540 13,910 4,960
65
103 27
7,800 5,950 2,880
40,608 21,150 11,280
25,576 16,000 12,255
211,005 132,877 62,260
652 479 492
115
1,288 855
30,215 48,580 71,148
39,000 51,940 51,300
30,740 70,180 55,060
2,690 5,824 5,584
165,456 124,000 101,850
17,250 7,920 9,498
90,240 81,990 65,260
3,373 4,107 4,558
34,200 47,950 51,330
67,488 49,374 37,920
49,656 43,360 30,525
531,075 536,992 485,380
See footnote(s) at end of table. --continued
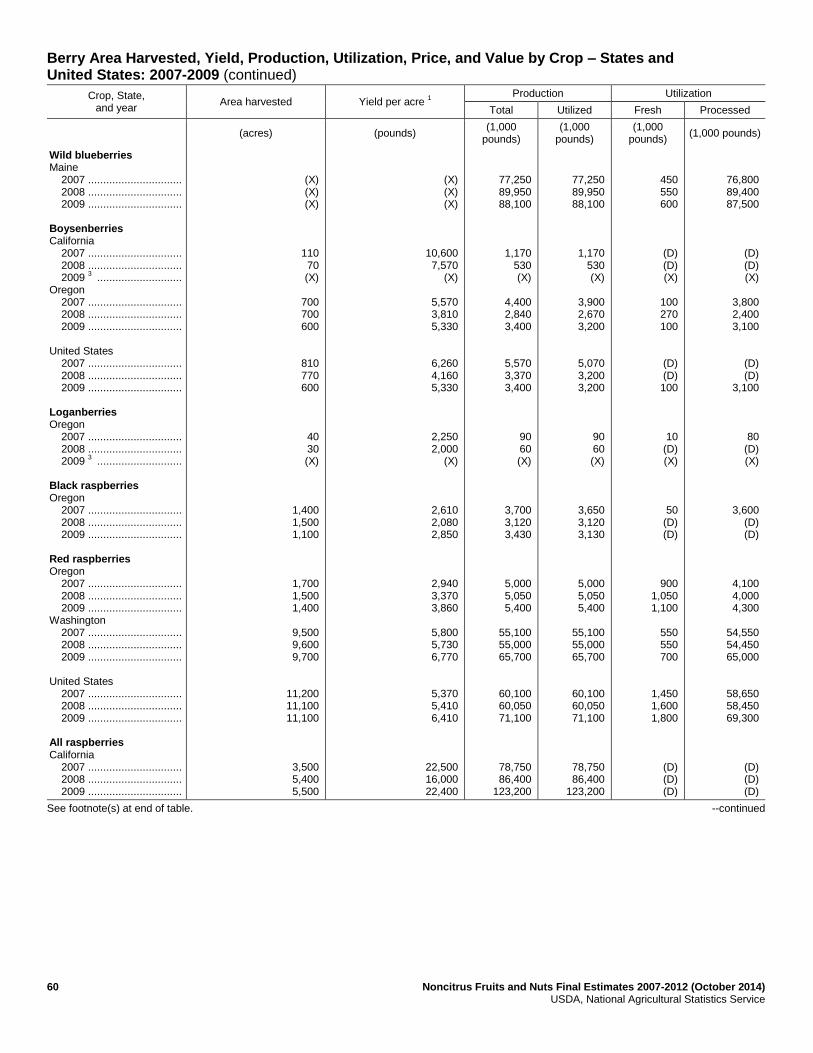
60 Noncitrus Fruits and Nuts Final Estimates 2007-2012 (October 2014) USDA, National Agricultural Statistics Service
Berry Area Harvested, Yield, Production, Utilization, Price, and Value by Crop – States and United States: 2007-2009 (continued)
Crop, State, and year
Area harvested Yield per acre 1
Production Utilization
Total Utilized Fresh Processed
(acres) (pounds) (1,000
pounds) (1,000
pounds) (1,000
pounds) (1,000 pounds)
Wild blueberries Maine 2007 ............................... 2008 ............................... 2009 ............................... Boysenberries California 2007 ............................... 2008 ............................... 2009
3 ............................
Oregon 2007 ............................... 2008 ............................... 2009 ............................... United States 2007 ............................... 2008 ............................... 2009 ............................... Loganberries Oregon 2007 ............................... 2008 ............................... 2009
3 ............................
Black raspberries Oregon 2007 ............................... 2008 ............................... 2009 ............................... Red raspberries Oregon 2007 ............................... 2008 ............................... 2009 ............................... Washington 2007 ............................... 2008 ............................... 2009 ............................... United States 2007 ............................... 2008 ............................... 2009 ............................... All raspberries California 2007 ............................... 2008 ............................... 2009 ...............................
(X) (X) (X)
110 70 (X)
700 700 600
810 770 600
40 30 (X)
1,400 1,500 1,100
1,700 1,500 1,400
9,500 9,600 9,700
11,200 11,100 11,100
3,500 5,400 5,500
(X) (X) (X)
10,600 7,570
(X)
5,570 3,810 5,330
6,260 4,160 5,330
2,250 2,000
(X)
2,610 2,080 2,850
2,940 3,370 3,860
5,800 5,730 6,770
5,370 5,410 6,410
22,500 16,000 22,400
77,250 89,950 88,100
1,170 530 (X)
4,400 2,840 3,400
5,570 3,370 3,400
90 60 (X)
3,700 3,120 3,430
5,000 5,050 5,400
55,100 55,000 65,700
60,100 60,050 71,100
78,750 86,400
123,200
77,250 89,950 88,100
1,170 530 (X)
3,900 2,670 3,200
5,070 3,200 3,200
90 60 (X)
3,650 3,120 3,130
5,000 5,050 5,400
55,100 55,000 65,700
60,100 60,050 71,100
78,750 86,400
123,200
450 550 600
(D) (D) (X)
100 270 100
(D) (D) 100
10 (D) (X)
50 (D) (D)
900 1,050 1,100
550 550 700
1,450 1,600 1,800
(D) (D) (D)
76,800 89,400 87,500
(D) (D) (X)
3,800 2,400 3,100
(D) (D)
3,100
80 (D) (X)
3,600 (D) (D)
4,100 4,000 4,300
54,550 54,450 65,000
58,650 58,450 69,300
(D) (D) (D)
See footnote(s) at end of table. --continued
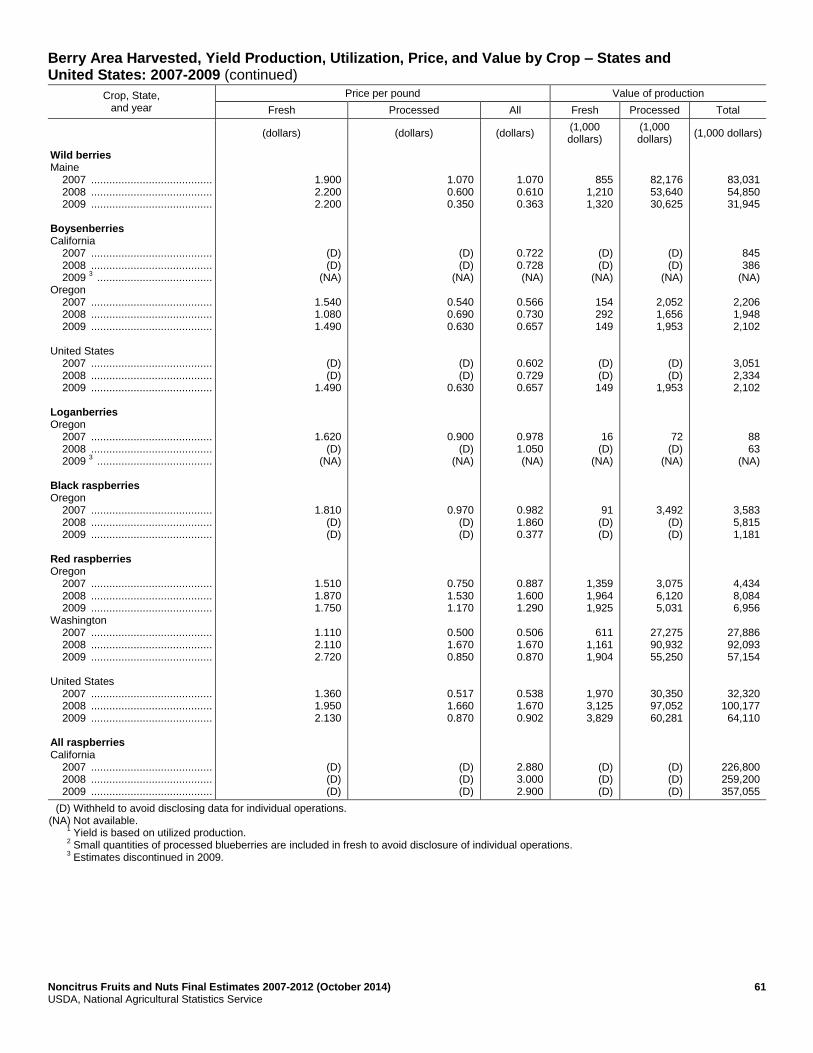
Noncitrus Fruits and Nuts Final Estimates 2007-2012 (October 2014) 61 USDA, National Agricultural Statistics Service
Berry Area Harvested, Yield Production, Utilization, Price, and Value by Crop – States and United States: 2007-2009 (continued)
Crop, State, and year
Price per pound Value of production
Fresh Processed All Fresh Processed Total
(dollars) (dollars) (dollars) (1,000 dollars)
(1,000 dollars)
(1,000 dollars)
Wild berries Maine 2007 ........................................ 2008 ........................................ 2009 ........................................ Boysenberries California 2007 ........................................ 2008 ........................................ 2009
3 ......................................
Oregon 2007 ........................................ 2008 ........................................ 2009 ........................................ United States 2007 ........................................ 2008 ........................................ 2009 ........................................ Loganberries Oregon 2007 ........................................ 2008 ........................................ 2009
3 ......................................
Black raspberries Oregon 2007 ........................................ 2008 ........................................ 2009 ........................................ Red raspberries Oregon 2007 ........................................ 2008 ........................................ 2009 ........................................ Washington 2007 ........................................ 2008 ........................................ 2009 ........................................ United States 2007 ........................................ 2008 ........................................ 2009 ........................................ All raspberries California 2007 ........................................ 2008 ........................................ 2009 ........................................
1.900 2.200 2.200
(D) (D)
(NA)
1.540 1.080 1.490
(D) (D)
1.490
1.620 (D)
(NA)
1.810 (D) (D)
1.510 1.870 1.750
1.110 2.110 2.720
1.360 1.950 2.130
(D) (D) (D)
1.070 0.600 0.350
(D) (D)
(NA)
0.540 0.690 0.630
(D) (D)
0.630
0.900 (D)
(NA)
0.970 (D) (D)
0.750 1.530 1.170
0.500 1.670 0.850
0.517 1.660 0.870
(D) (D) (D)
1.070 0.610 0.363
0.722 0.728 (NA)
0.566 0.730 0.657
0.602 0.729 0.657
0.978 1.050 (NA)
0.982 1.860 0.377
0.887 1.600 1.290
0.506 1.670 0.870
0.538 1.670 0.902
2.880 3.000 2.900
855 1,210 1,320
(D) (D)
(NA)
154 292 149
(D) (D) 149
16 (D)
(NA)
91 (D) (D)
1,359 1,964 1,925
611
1,161 1,904
1,970 3,125 3,829
(D) (D) (D)
82,176 53,640 30,625
(D) (D)
(NA)
2,052 1,656 1,953
(D) (D)
1,953
72 (D)
(NA)
3,492 (D) (D)
3,075 6,120 5,031
27,275 90,932 55,250
30,350 97,052 60,281
(D) (D) (D)
83,031 54,850 31,945
845 386
(NA)
2,206 1,948 2,102
3,051 2,334 2,102
88 63
(NA)
3,583 5,815 1,181
4,434 8,084 6,956
27,886 92,093 57,154
32,320 100,177 64,110
226,800 259,200 357,055
(D) Withheld to avoid disclosing data for individual operations. (NA) Not available. 1
Yield is based on utilized production. 2
Small quantities of processed blueberries are included in fresh to avoid disclosure of individual operations. 3
Estimates discontinued in 2009.
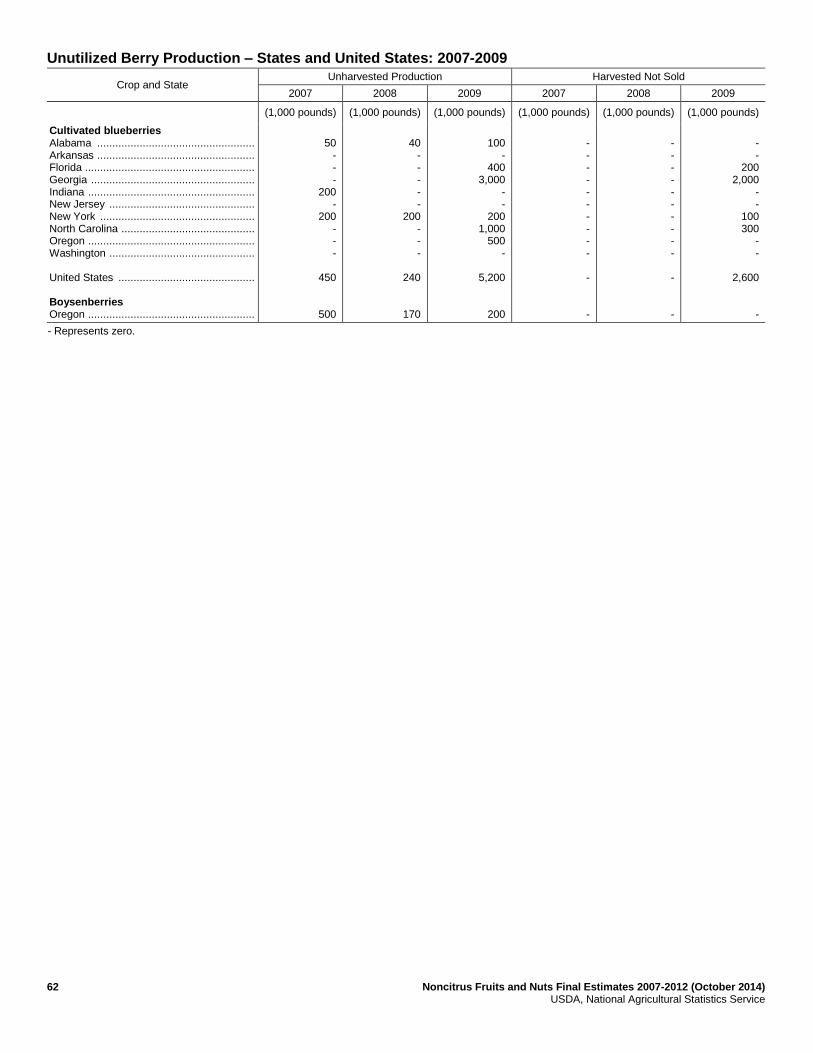
62 Noncitrus Fruits and Nuts Final Estimates 2007-2012 (October 2014) USDA, National Agricultural Statistics Service
Unutilized Berry Production – States and United States: 2007-2009
Crop and State Unharvested Production Harvested Not Sold
2007 2008 2009 2007 2008 2009
(1,000 pounds) (1,000 pounds) (1,000 pounds) (1,000 pounds) (1,000 pounds) (1,000 pounds)
Cultivated blueberries Alabama .................................................... Arkansas .................................................... Florida ........................................................ Georgia ...................................................... Indiana ....................................................... New Jersey ................................................ New York ................................................... North Carolina ............................................ Oregon ....................................................... Washington ................................................ United States ............................................. Boysenberries Oregon .......................................................
50
- - -
200 -
200 - - -
450
500
40
- - - - -
200 - - -
240
170
100
- 400
3,000 - -
200 1,000
500 -
5,200
200
- - - - - - - - - -
-
-
- - - - - - - - - -
-
-
- -
200 2,000
- -
100 300
- -
2,600
-
- Represents zero.
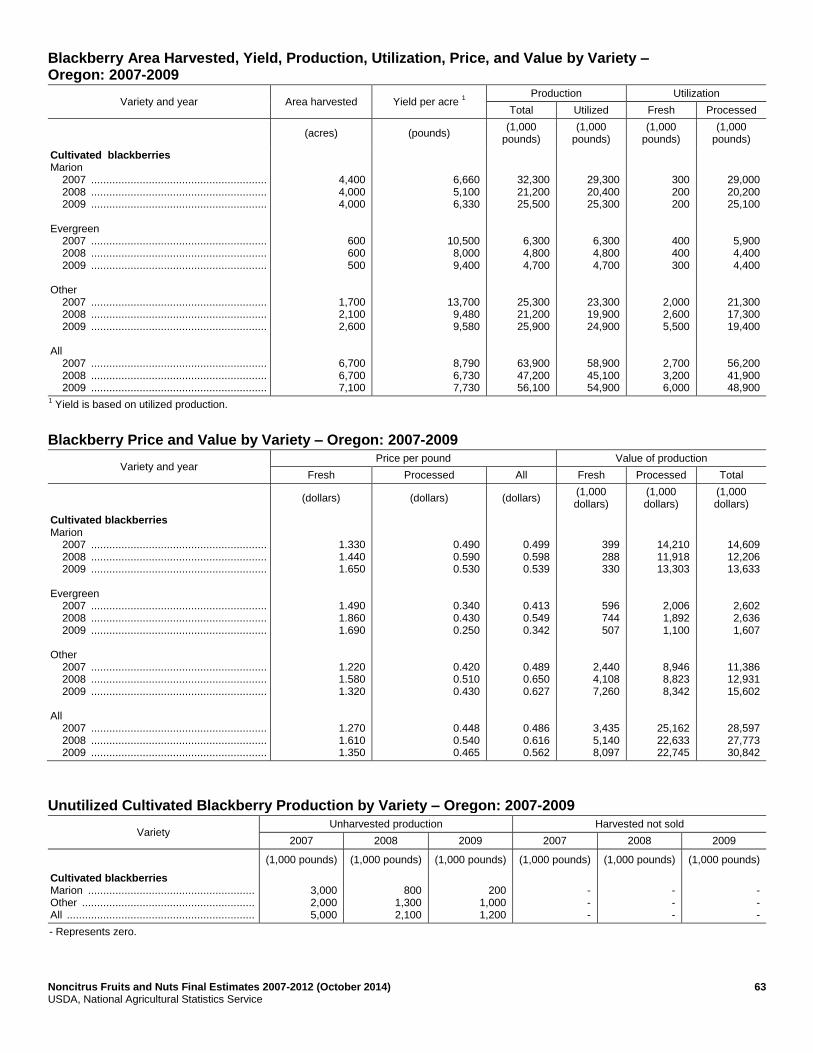
Noncitrus Fruits and Nuts Final Estimates 2007-2012 (October 2014) 63 USDA, National Agricultural Statistics Service
Blackberry Area Harvested, Yield, Production, Utilization, Price, and Value by Variety – Oregon: 2007-2009
Variety and year Area harvested Yield per acre 1
Production Utilization
Total Utilized Fresh Processed
(acres) (pounds) (1,000
pounds) (1,000
pounds) (1,000
pounds) (1,000
pounds)
Cultivated blackberries Marion 2007 .......................................................... 2008 .......................................................... 2009 .......................................................... Evergreen 2007 .......................................................... 2008 .......................................................... 2009 .......................................................... Other 2007 .......................................................... 2008 .......................................................... 2009 .......................................................... All 2007 .......................................................... 2008 .......................................................... 2009 ..........................................................
4,400 4,000 4,000
600 600 500
1,700 2,100 2,600
6,700 6,700 7,100
6,660 5,100 6,330
10,500 8,000 9,400
13,700 9,480 9,580
8,790 6,730 7,730
32,300 21,200 25,500
6,300 4,800 4,700
25,300 21,200 25,900
63,900 47,200 56,100
29,300 20,400 25,300
6,300 4,800 4,700
23,300 19,900 24,900
58,900 45,100 54,900
300 200 200
400 400 300
2,000 2,600 5,500
2,700 3,200 6,000
29,000 20,200 25,100
5,900 4,400 4,400
21,300 17,300 19,400
56,200 41,900 48,900
1 Yield is based on utilized production.
Blackberry Price and Value by Variety – Oregon: 2007-2009
Variety and year Price per pound Value of production
Fresh Processed All Fresh Processed Total
(dollars) (dollars) (dollars) (1,000 dollars)
(1,000 dollars)
(1,000 dollars)
Cultivated blackberries Marion 2007 .......................................................... 2008 .......................................................... 2009 .......................................................... Evergreen 2007 .......................................................... 2008 .......................................................... 2009 .......................................................... Other 2007 .......................................................... 2008 .......................................................... 2009 .......................................................... All 2007 .......................................................... 2008 .......................................................... 2009 ..........................................................
1.330 1.440 1.650
1.490 1.860 1.690
1.220 1.580 1.320
1.270 1.610 1.350
0.490 0.590 0.530
0.340 0.430 0.250
0.420 0.510 0.430
0.448 0.540 0.465
0.499 0.598 0.539
0.413 0.549 0.342
0.489 0.650 0.627
0.486 0.616 0.562
399 288 330
596 744 507
2,440 4,108 7,260
3,435 5,140 8,097
14,210 11,918 13,303
2,006 1,892 1,100
8,946 8,823 8,342
25,162 22,633 22,745
14,609 12,206 13,633
2,602 2,636 1,607
11,386 12,931 15,602
28,597 27,773 30,842
Unutilized Cultivated Blackberry Production by Variety – Oregon: 2007-2009
Variety Unharvested production Harvested not sold
2007 2008 2009 2007 2008 2009
(1,000 pounds) (1,000 pounds) (1,000 pounds) (1,000 pounds) (1,000 pounds) (1,000 pounds)
Cultivated blackberries Marion ....................................................... Other ......................................................... All ..............................................................
3,000 2,000 5,000
800
1,300 2,100
200
1,000 1,200
- - -
- - -
- - -
- Represents zero.
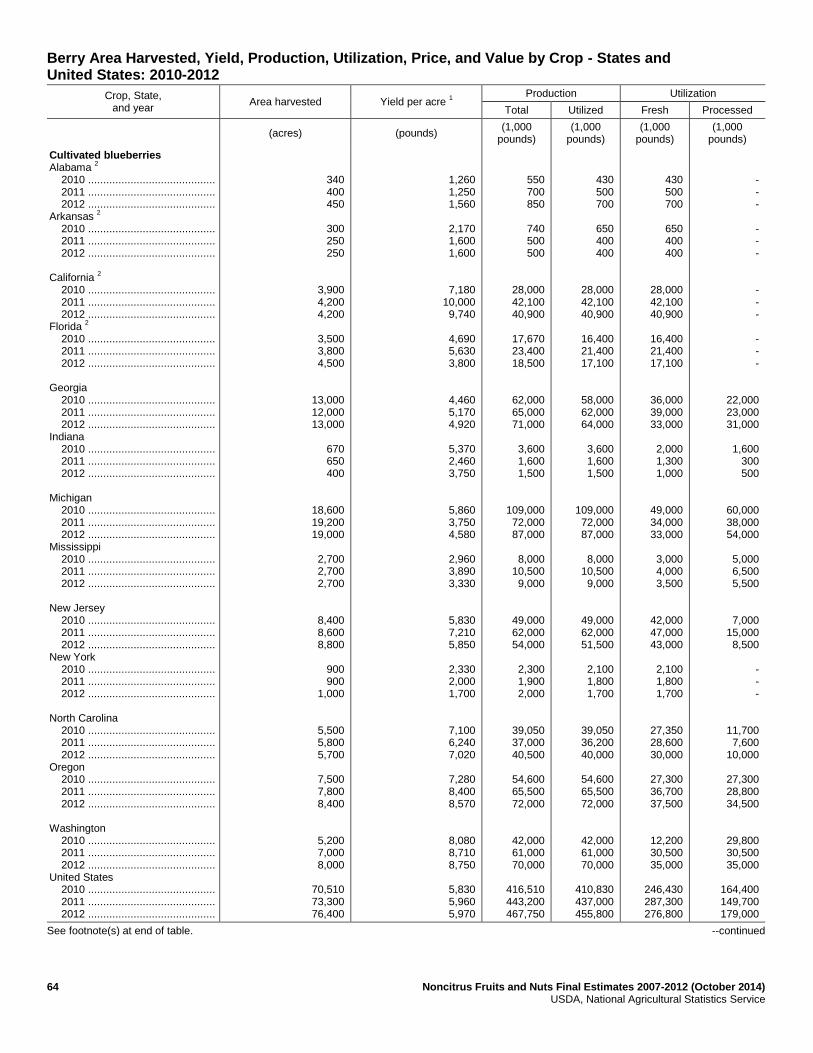
64 Noncitrus Fruits and Nuts Final Estimates 2007-2012 (October 2014) USDA, National Agricultural Statistics Service
Berry Area Harvested, Yield, Production, Utilization, Price, and Value by Crop - States and United States: 2010-2012
Crop, State, and year
Area harvested Yield per acre 1
Production Utilization
Total Utilized Fresh Processed
(acres) (pounds) (1,000
pounds) (1,000
pounds) (1,000
pounds) (1,000
pounds)
Cultivated blueberries Alabama
2
2010 .......................................... 2011 .......................................... 2012 .......................................... Arkansas
2
2010 .......................................... 2011 .......................................... 2012 .......................................... California
2
2010 .......................................... 2011 .......................................... 2012 .......................................... Florida
2
2010 .......................................... 2011 .......................................... 2012 .......................................... Georgia 2010 .......................................... 2011 .......................................... 2012 .......................................... Indiana 2010 .......................................... 2011 .......................................... 2012 .......................................... Michigan 2010 .......................................... 2011 .......................................... 2012 .......................................... Mississippi 2010 .......................................... 2011 .......................................... 2012 .......................................... New Jersey 2010 .......................................... 2011 .......................................... 2012 .......................................... New York 2010 .......................................... 2011 .......................................... 2012 .......................................... North Carolina 2010 .......................................... 2011 .......................................... 2012 .......................................... Oregon 2010 .......................................... 2011 .......................................... 2012 .......................................... Washington 2010 .......................................... 2011 .......................................... 2012 .......................................... United States 2010 .......................................... 2011 .......................................... 2012 ..........................................
340 400 450
300 250 250
3,900 4,200 4,200
3,500 3,800 4,500
13,000 12,000 13,000
670 650 400
18,600 19,200 19,000
2,700 2,700 2,700
8,400 8,600 8,800
900 900
1,000
5,500 5,800 5,700
7,500 7,800 8,400
5,200 7,000 8,000
70,510 73,300 76,400
1,260 1,250 1,560
2,170 1,600 1,600
7,180 10,000 9,740
4,690 5,630 3,800
4,460 5,170 4,920
5,370 2,460 3,750
5,860 3,750 4,580
2,960 3,890 3,330
5,830 7,210 5,850
2,330 2,000 1,700
7,100 6,240 7,020
7,280 8,400 8,570
8,080 8,710 8,750
5,830 5,960 5,970
550 700 850
740 500 500
28,000 42,100 40,900
17,670 23,400 18,500
62,000 65,000 71,000
3,600 1,600 1,500
109,000 72,000 87,000
8,000
10,500 9,000
49,000 62,000 54,000
2,300 1,900 2,000
39,050 37,000 40,500
54,600 65,500 72,000
42,000 61,000 70,000
416,510 443,200 467,750
430 500 700
650 400 400
28,000 42,100 40,900
16,400 21,400 17,100
58,000 62,000 64,000
3,600 1,600 1,500
109,000 72,000 87,000
8,000
10,500 9,000
49,000 62,000 51,500
2,100 1,800 1,700
39,050 36,200 40,000
54,600 65,500 72,000
42,000 61,000 70,000
410,830 437,000 455,800
430 500 700
650 400 400
28,000 42,100 40,900
16,400 21,400 17,100
36,000 39,000 33,000
2,000 1,300 1,000
49,000 34,000 33,000
3,000 4,000 3,500
42,000 47,000 43,000
2,100 1,800 1,700
27,350 28,600 30,000
27,300 36,700 37,500
12,200 30,500 35,000
246,430 287,300 276,800
- - -
- - -
- - -
- - -
22,000 23,000 31,000
1,600
300 500
60,000 38,000 54,000
5,000 6,500 5,500
7,000 15,000 8,500
- - -
11,700 7,600
10,000
27,300 28,800 34,500
29,800 30,500 35,000
164,400 149,700 179,000
See footnote(s) at end of table. --continued
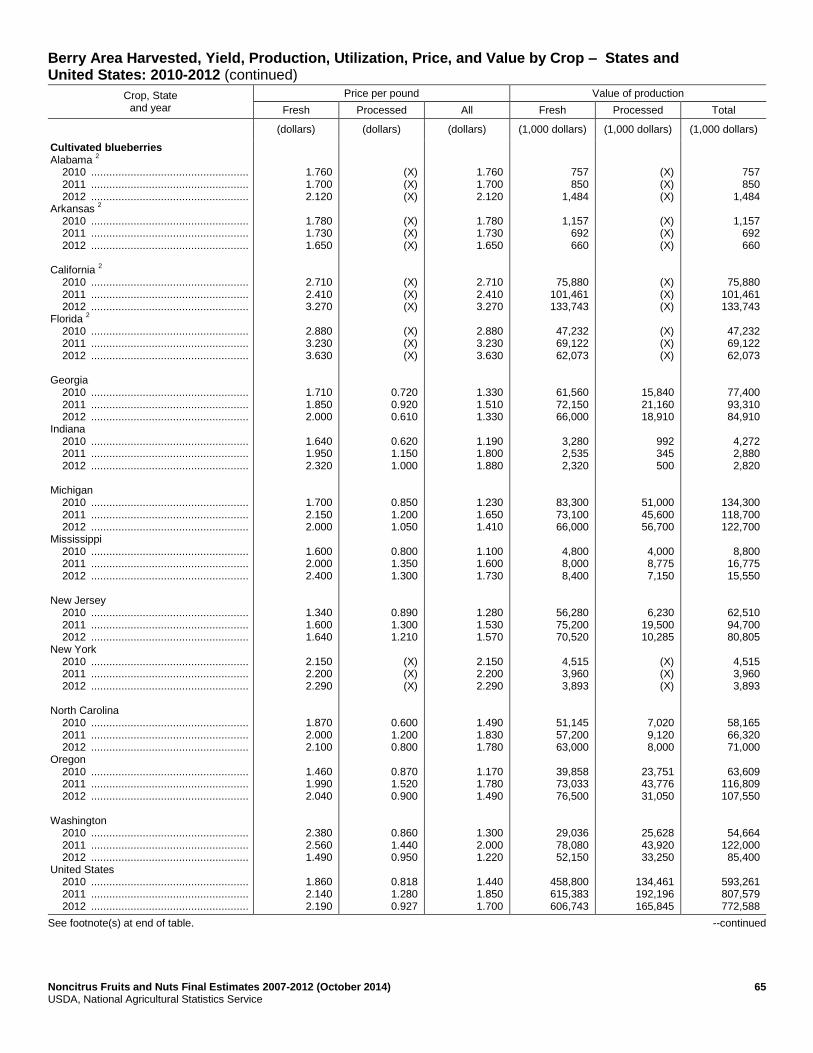
Noncitrus Fruits and Nuts Final Estimates 2007-2012 (October 2014) 65 USDA, National Agricultural Statistics Service
Berry Area Harvested, Yield, Production, Utilization, Price, and Value by Crop – States and United States: 2010-2012 (continued)
Crop, State and year
Price per pound Value of production
Fresh Processed All Fresh Processed Total
(dollars) (dollars) (dollars) (1,000 dollars) (1,000 dollars) (1,000 dollars)
Cultivated blueberries Alabama
2
2010 .................................................... 2011 .................................................... 2012 .................................................... Arkansas
2
2010 .................................................... 2011 .................................................... 2012 .................................................... California
2
2010 .................................................... 2011 .................................................... 2012 .................................................... Florida
2
2010 .................................................... 2011 .................................................... 2012 .................................................... Georgia 2010 .................................................... 2011 .................................................... 2012 .................................................... Indiana 2010 .................................................... 2011 .................................................... 2012 .................................................... Michigan 2010 .................................................... 2011 .................................................... 2012 .................................................... Mississippi 2010 .................................................... 2011 .................................................... 2012 .................................................... New Jersey 2010 .................................................... 2011 .................................................... 2012 .................................................... New York 2010 .................................................... 2011 .................................................... 2012 .................................................... North Carolina 2010 .................................................... 2011 .................................................... 2012 .................................................... Oregon 2010 .................................................... 2011 .................................................... 2012 .................................................... Washington 2010 .................................................... 2011 .................................................... 2012 .................................................... United States 2010 .................................................... 2011 .................................................... 2012 ....................................................
1.760 1.700 2.120
1.780 1.730 1.650
2.710 2.410 3.270
2.880 3.230 3.630
1.710 1.850 2.000
1.640 1.950 2.320
1.700 2.150 2.000
1.600 2.000 2.400
1.340 1.600 1.640
2.150 2.200 2.290
1.870 2.000 2.100
1.460 1.990 2.040
2.380 2.560 1.490
1.860 2.140 2.190
(X) (X) (X)
(X) (X) (X)
(X) (X) (X)
(X) (X) (X)
0.720 0.920 0.610
0.620 1.150 1.000
0.850 1.200 1.050
0.800 1.350 1.300
0.890 1.300 1.210
(X) (X) (X)
0.600 1.200 0.800
0.870 1.520 0.900
0.860 1.440 0.950
0.818 1.280 0.927
1.760 1.700 2.120
1.780 1.730 1.650
2.710 2.410 3.270
2.880 3.230 3.630
1.330 1.510 1.330
1.190 1.800 1.880
1.230 1.650 1.410
1.100 1.600 1.730
1.280 1.530 1.570
2.150 2.200 2.290
1.490 1.830 1.780
1.170 1.780 1.490
1.300 2.000 1.220
1.440 1.850 1.700
757 850
1,484
1,157 692 660
75,880 101,461 133,743
47,232 69,122 62,073
61,560 72,150 66,000
3,280 2,535 2,320
83,300 73,100 66,000
4,800 8,000 8,400
56,280 75,200 70,520
4,515 3,960 3,893
51,145 57,200 63,000
39,858 73,033 76,500
29,036 78,080 52,150
458,800 615,383 606,743
(X) (X) (X)
(X) (X) (X)
(X) (X) (X)
(X) (X) (X)
15,840 21,160 18,910
992 345 500
51,000 45,600 56,700
4,000 8,775 7,150
6,230 19,500 10,285
(X) (X) (X)
7,020 9,120 8,000
23,751 43,776 31,050
25,628 43,920 33,250
134,461 192,196 165,845
757 850
1,484
1,157 692 660
75,880 101,461 133,743
47,232 69,122 62,073
77,400 93,310 84,910
4,272 2,880 2,820
134,300 118,700 122,700
8,800
16,775 15,550
62,510 94,700 80,805
4,515 3,960 3,893
58,165 66,320 71,000
63,609
116,809 107,550
54,664 122,000 85,400
593,261 807,579 772,588
See footnote(s) at end of table. --continued
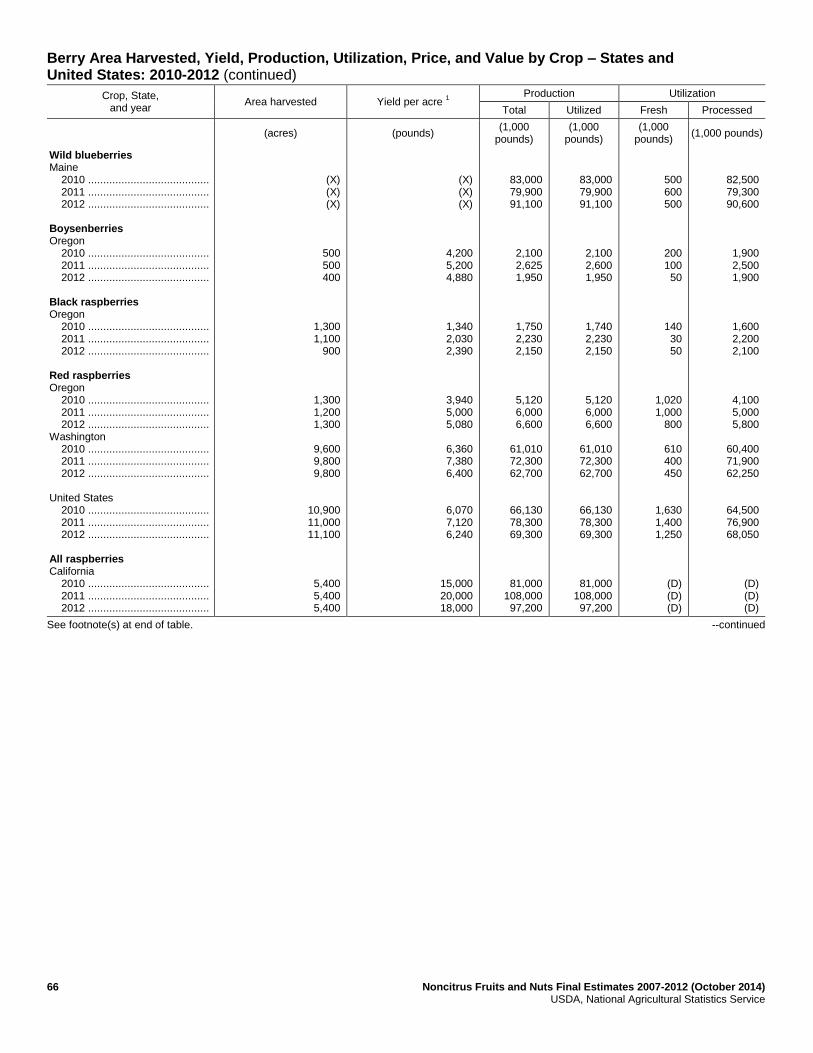
66 Noncitrus Fruits and Nuts Final Estimates 2007-2012 (October 2014) USDA, National Agricultural Statistics Service
Berry Area Harvested, Yield, Production, Utilization, Price, and Value by Crop – States and United States: 2010-2012 (continued)
Crop, State, and year
Area harvested Yield per acre 1
Production Utilization
Total Utilized Fresh Processed
(acres) (pounds) (1,000
pounds) (1,000
pounds) (1,000
pounds) (1,000 pounds)
Wild blueberries Maine 2010 ........................................ 2011 ........................................ 2012 ........................................ Boysenberries Oregon 2010 ........................................ 2011 ........................................ 2012 ........................................ Black raspberries Oregon 2010 ........................................ 2011 ........................................ 2012 ........................................ Red raspberries Oregon 2010 ........................................ 2011 ........................................ 2012 ........................................ Washington 2010 ........................................ 2011 ........................................ 2012 ........................................ United States 2010 ........................................ 2011 ........................................ 2012 ........................................ All raspberries California 2010 ........................................ 2011 ........................................ 2012 ........................................
(X) (X) (X)
500 500 400
1,300 1,100
900
1,300 1,200 1,300
9,600 9,800 9,800
10,900 11,000 11,100
5,400 5,400 5,400
(X) (X) (X)
4,200 5,200 4,880
1,340 2,030 2,390
3,940 5,000 5,080
6,360 7,380 6,400
6,070 7,120 6,240
15,000 20,000 18,000
83,000 79,900 91,100
2,100 2,625 1,950
1,750 2,230 2,150
5,120 6,000 6,600
61,010 72,300 62,700
66,130 78,300 69,300
81,000 108,000 97,200
83,000 79,900 91,100
2,100 2,600 1,950
1,740 2,230 2,150
5,120 6,000 6,600
61,010 72,300 62,700
66,130 78,300 69,300
81,000 108,000 97,200
500 600 500
200 100 50
140 30 50
1,020 1,000
800
610 400 450
1,630 1,400 1,250
(D) (D) (D)
82,500 79,300 90,600
1,900 2,500 1,900
1,600 2,200 2,100
4,100 5,000 5,800
60,400 71,900 62,250
64,500 76,900 68,050
(D) (D) (D)
See footnote(s) at end of table. --continued
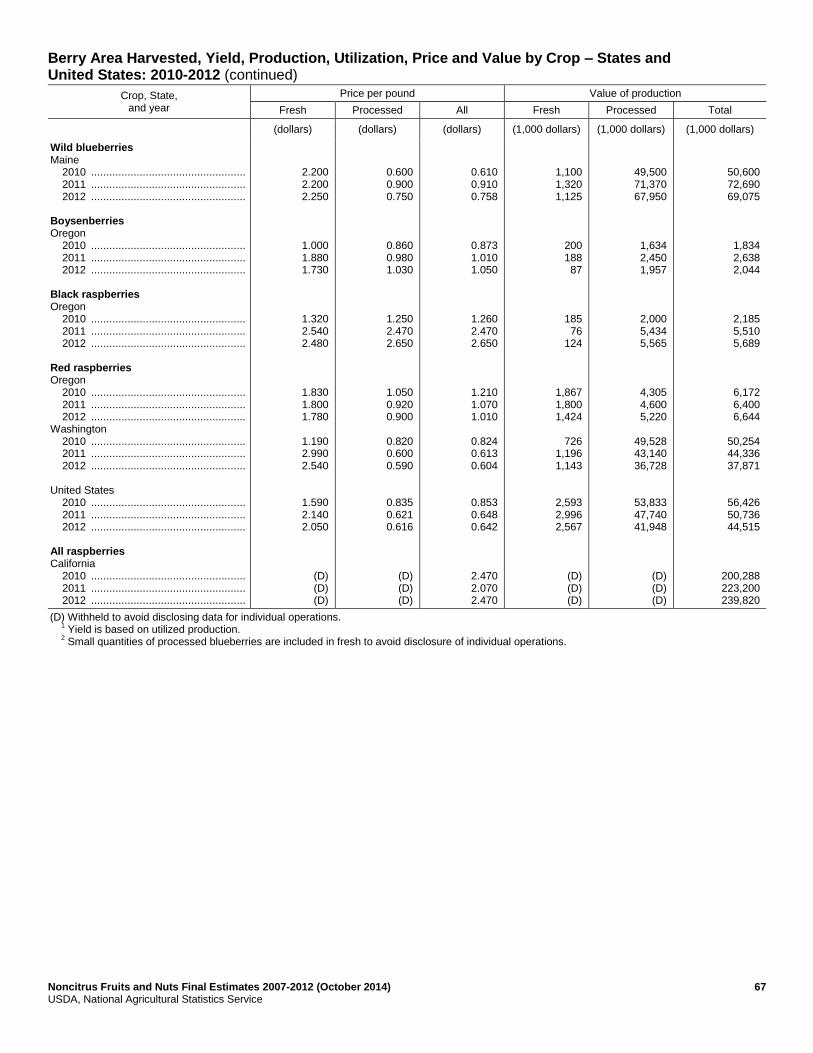
Noncitrus Fruits and Nuts Final Estimates 2007-2012 (October 2014) 67 USDA, National Agricultural Statistics Service
Berry Area Harvested, Yield, Production, Utilization, Price and Value by Crop – States and United States: 2010-2012 (continued)
Crop, State, and year
Price per pound Value of production
Fresh Processed All Fresh Processed Total
(dollars) (dollars) (dollars) (1,000 dollars) (1,000 dollars) (1,000 dollars)
Wild blueberries Maine 2010 ................................................... 2011 ................................................... 2012 ................................................... Boysenberries Oregon 2010 ................................................... 2011 ................................................... 2012 ................................................... Black raspberries Oregon 2010 ................................................... 2011 ................................................... 2012 ................................................... Red raspberries Oregon 2010 ................................................... 2011 ................................................... 2012 ................................................... Washington 2010 ................................................... 2011 ................................................... 2012 ................................................... United States 2010 ................................................... 2011 ................................................... 2012 ................................................... All raspberries California 2010 ................................................... 2011 ................................................... 2012 ...................................................
2.200 2.200 2.250
1.000 1.880 1.730
1.320 2.540 2.480
1.830 1.800 1.780
1.190 2.990 2.540
1.590 2.140 2.050
(D) (D) (D)
0.600 0.900 0.750
0.860 0.980 1.030
1.250 2.470 2.650
1.050 0.920 0.900
0.820 0.600 0.590
0.835 0.621 0.616
(D) (D) (D)
0.610 0.910 0.758
0.873 1.010 1.050
1.260 2.470 2.650
1.210 1.070 1.010
0.824 0.613 0.604
0.853 0.648 0.642
2.470 2.070 2.470
1,100 1,320 1,125
200 188 87
185 76
124
1,867 1,800 1,424
726
1,196 1,143
2,593 2,996 2,567
(D) (D) (D)
49,500 71,370 67,950
1,634 2,450 1,957
2,000 5,434 5,565
4,305 4,600 5,220
49,528 43,140 36,728
53,833 47,740 41,948
(D) (D) (D)
50,600 72,690 69,075
1,834 2,638 2,044
2,185 5,510 5,689
6,172 6,400 6,644
50,254 44,336 37,871
56,426 50,736 44,515
200,288 223,200 239,820
(D) Withheld to avoid disclosing data for individual operations. 1
Yield is based on utilized production. 2
Small quantities of processed blueberries are included in fresh to avoid disclosure of individual operations.

68 Noncitrus Fruits and Nuts Final Estimates 2007-2012 (October 2014) USDA, National Agricultural Statistics Service
Unutilized Berry Production – States and United States: 2010-2012
Crop and State Unharvested production Harvested not sold
2010 2011 2012 2010 2011 2012
(1,000 pounds) (1,000 pounds) (1,000 pounds) (1,000 pounds) (1,000 pounds) (1,000 pounds)
Cultivated blueberries Alabama .................................................... Arkansas .................................................... Florida ........................................................ Georgia ...................................................... Indiana ....................................................... New Jersey ................................................ New York ................................................... North Carolina ............................................ Washington ................................................ United States ............................................. Boysenberries Oregon .......................................................
110 90
970 4,000
- -
100 - -
5,270
-
180 10
1,200 3,000
- -
100 800
-
5,290
25
120 10
700 6,000
- 2,500
300 500
-
10,130
-
10
- 300
- - -
100 - -
410
-
20 90
800 - - - - - -
910
-
30 90
700 1,000
- - - - -
1,820
-
- Represents zero.
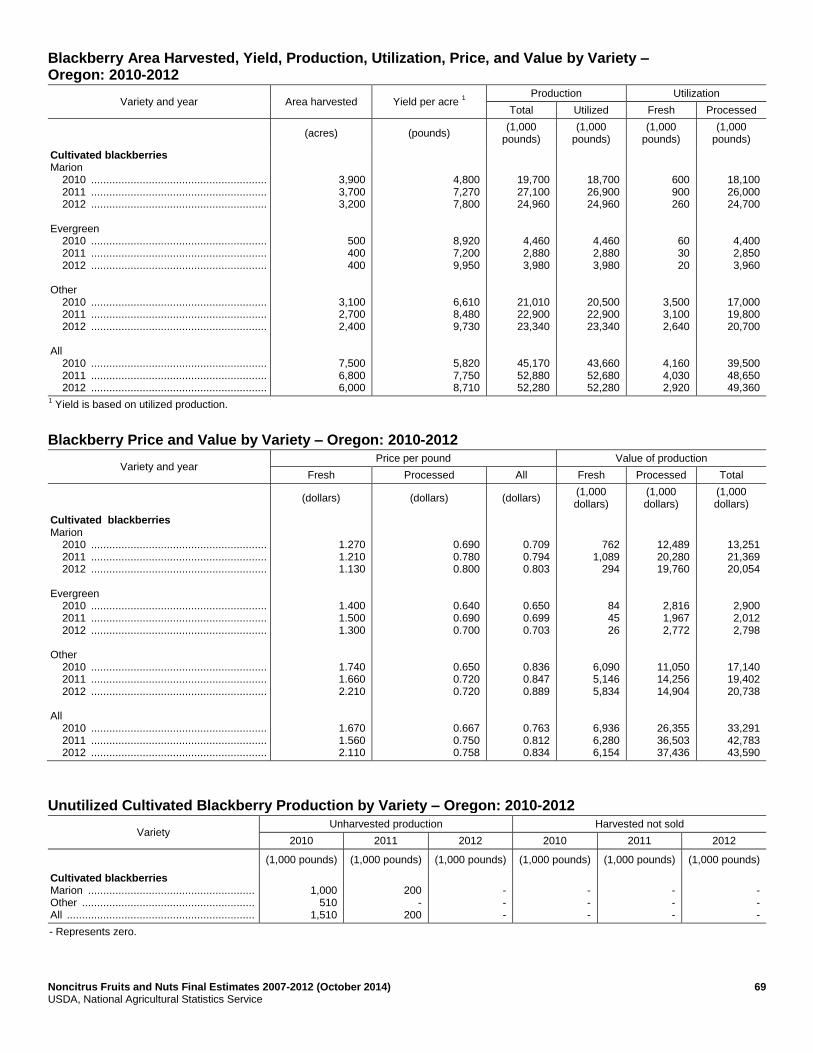
Noncitrus Fruits and Nuts Final Estimates 2007-2012 (October 2014) 69 USDA, National Agricultural Statistics Service
Blackberry Area Harvested, Yield, Production, Utilization, Price, and Value by Variety – Oregon: 2010-2012
Variety and year Area harvested Yield per acre 1
Production Utilization
Total Utilized Fresh Processed
(acres) (pounds) (1,000
pounds) (1,000
pounds) (1,000
pounds) (1,000
pounds)
Cultivated blackberries Marion 2010 .......................................................... 2011 .......................................................... 2012 .......................................................... Evergreen 2010 .......................................................... 2011 .......................................................... 2012 .......................................................... Other 2010 .......................................................... 2011 .......................................................... 2012 .......................................................... All 2010 .......................................................... 2011 .......................................................... 2012 ..........................................................
3,900 3,700 3,200
500 400 400
3,100 2,700 2,400
7,500 6,800 6,000
4,800 7,270 7,800
8,920 7,200 9,950
6,610 8,480 9,730
5,820 7,750 8,710
19,700 27,100 24,960
4,460 2,880 3,980
21,010 22,900 23,340
45,170 52,880 52,280
18,700 26,900 24,960
4,460 2,880 3,980
20,500 22,900 23,340
43,660 52,680 52,280
600 900 260
60 30 20
3,500 3,100 2,640
4,160 4,030 2,920
18,100 26,000 24,700
4,400 2,850 3,960
17,000 19,800 20,700
39,500 48,650 49,360
1 Yield is based on utilized production.
Blackberry Price and Value by Variety – Oregon: 2010-2012
Variety and year Price per pound Value of production
Fresh Processed All Fresh Processed Total
(dollars) (dollars) (dollars) (1,000 dollars)
(1,000 dollars)
(1,000 dollars)
Cultivated blackberries Marion 2010 .......................................................... 2011 .......................................................... 2012 .......................................................... Evergreen 2010 .......................................................... 2011 .......................................................... 2012 .......................................................... Other 2010 .......................................................... 2011 .......................................................... 2012 .......................................................... All 2010 .......................................................... 2011 .......................................................... 2012 ..........................................................
1.270 1.210 1.130
1.400 1.500 1.300
1.740 1.660 2.210
1.670 1.560 2.110
0.690 0.780 0.800
0.640 0.690 0.700
0.650 0.720 0.720
0.667 0.750 0.758
0.709 0.794 0.803
0.650 0.699 0.703
0.836 0.847 0.889
0.763 0.812 0.834
762 1,089
294
84 45 26
6,090 5,146 5,834
6,936 6,280 6,154
12,489 20,280 19,760
2,816 1,967 2,772
11,050 14,256 14,904
26,355 36,503 37,436
13,251 21,369 20,054
2,900 2,012 2,798
17,140 19,402 20,738
33,291 42,783 43,590
Unutilized Cultivated Blackberry Production by Variety – Oregon: 2010-2012
Variety Unharvested production Harvested not sold
2010 2011 2012 2010 2011 2012
(1,000 pounds) (1,000 pounds) (1,000 pounds) (1,000 pounds) (1,000 pounds) (1,000 pounds)
Cultivated blackberries Marion ....................................................... Other ......................................................... All ..............................................................
1,000
510 1,510
200
- 200
- - -
- - -
- - -
- - -
- Represents zero.
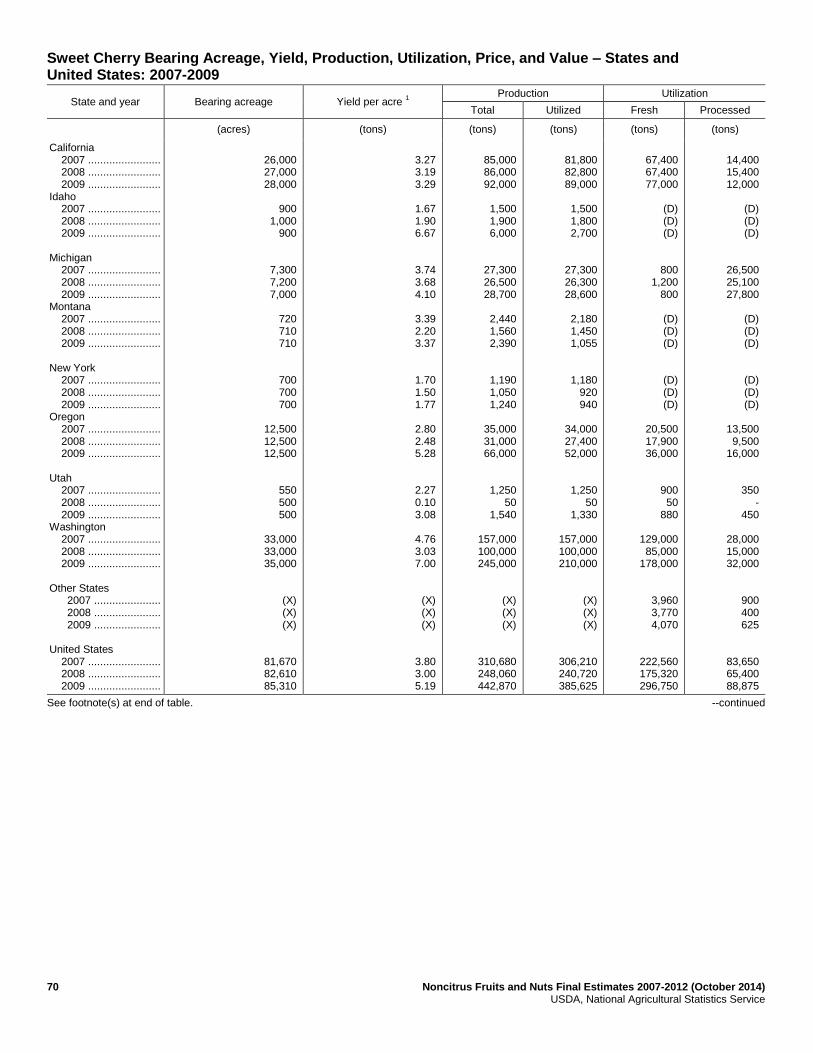
70 Noncitrus Fruits and Nuts Final Estimates 2007-2012 (October 2014) USDA, National Agricultural Statistics Service
Sweet Cherry Bearing Acreage, Yield, Production, Utilization, Price, and Value – States and United States: 2007-2009
State and year Bearing acreage Yield per acre 1
Production Utilization
Total Utilized Fresh Processed
(acres) (tons) (tons) (tons) (tons) (tons)
California 2007 ........................ 2008 ........................ 2009 ........................ Idaho 2007 ........................ 2008 ........................ 2009 ........................ Michigan 2007 ........................ 2008 ........................ 2009 ........................ Montana 2007 ........................ 2008 ........................ 2009 ........................ New York 2007 ........................ 2008 ........................ 2009 ........................ Oregon 2007 ........................ 2008 ........................ 2009 ........................ Utah 2007 ........................ 2008 ........................ 2009 ........................ Washington 2007 ........................ 2008 ........................ 2009 ........................ Other States 2007 ...................... 2008 ...................... 2009 ...................... United States 2007 ........................ 2008 ........................ 2009 ........................
26,000 27,000 28,000
900
1,000 900
7,300 7,200 7,000
720 710 710
700 700 700
12,500 12,500 12,500
550 500 500
33,000 33,000 35,000
(X) (X) (X)
81,670 82,610 85,310
3.27 3.19 3.29
1.67 1.90 6.67
3.74 3.68 4.10
3.39 2.20 3.37
1.70 1.50 1.77
2.80 2.48 5.28
2.27 0.10 3.08
4.76 3.03 7.00
(X) (X) (X)
3.80 3.00 5.19
85,000 86,000 92,000
1,500 1,900 6,000
27,300 26,500 28,700
2,440 1,560 2,390
1,190 1,050 1,240
35,000 31,000 66,000
1,250 50
1,540
157,000 100,000 245,000
(X) (X) (X)
310,680 248,060 442,870
81,800 82,800 89,000
1,500 1,800 2,700
27,300 26,300 28,600
2,180 1,450 1,055
1,180 920 940
34,000 27,400 52,000
1,250 50
1,330
157,000 100,000 210,000
(X) (X) (X)
306,210 240,720 385,625
67,400 67,400 77,000
(D) (D) (D)
800 1,200
800
(D) (D) (D)
(D) (D) (D)
20,500 17,900 36,000
900 50
880
129,000 85,000
178,000
3,960 3,770 4,070
222,560 175,320 296,750
14,400 15,400 12,000
(D) (D) (D)
26,500 25,100 27,800
(D) (D) (D)
(D) (D) (D)
13,500 9,500
16,000
350 -
450
28,000 15,000 32,000
900 400 625
83,650 65,400 88,875
See footnote(s) at end of table. --continued

Noncitrus Fruits and Nuts Final Estimates 2007-2012 (October 2014) 71 USDA, National Agricultural Statistics Service
Sweet Cherry Bearing Acreage, Yield, Production, Utilization, Price and Value – States and United States: 2007-2009 (continued)
State and year Price per ton Value of production
Fresh Processed All Fresh Processed All
(dollars) (dollars) (dollars) (1,000 dollars) (1,000 dollars) (1,000 dollars)
California 2007 ............................... 2008 ............................... 2009 ............................... Idaho 2007 ............................... 2008 ............................... 2009 ............................... Michigan 2007 ............................... 2008 ............................... 2009 ............................... Montana 2007 ............................... 2008 ............................... 2009 ............................... New York 2007 ............................... 2008 ............................... 2009 ............................... Oregon 2007 ............................... 2008 ............................... 2009 ............................... Utah 2007 ............................... 2008 ............................... 2009 ............................... Washington 2007 ............................... 2008 ............................... 2009 ............................... Other States 2007 ............................... 2008 ............................... 2009 ............................... United States 2007 ............................... 2008 ............................... 2009 ...............................
2,250.00 2,840.00 2,900.00
(D) (D) (D)
2,060.00 2,620.00 2,390.00
(D) (D) (D)
(D) (D) (D)
1,892.00 2,690.00
801.00
1,680.00 2,440.00 2,280.00
2,400.00 3,350.00 1,190.00
2,470.00 3,340.00 1,590.00
2,310.00 3,080.00 1,600.00
234.00 202.00 214.00
(D) (D) (D)
606.00 518.00 423.00
(D) (D) (D)
(D) (D) (D)
776.00 983.00 791.00
600.00 (X)
500.00
483.00 546.00 357.00
503.00 608.00 614.00
527.00 518.00 439.00
1,900.00 2,350.00 2,540.00
2,100.00 3,120.00 1,100.00
649.00 614.00 478.00
1,630.00 2,730.00 1,490.00
2,980.00 3,520.00 2,440.00
1,450.00 2,100.00
798.00
1,380.00 2,440.00 1,680.00
2,060.00 2,930.00 1,060.00
(X) (X) (X)
1,820.00 2,390.00 1,330.00
151,650 191,416 223,300
(D) (D) (D)
1,648 3,144 1,912
(D) (D) (D)
(D) (D) (D)
38,786 48,151 28,836
1,512 122
2,006
309,600 284,750 211,820
9,772 12,578 6,453
512,968 540,161 474,327
3,366 3,118 2,565
(D) (D) (D)
16,061 13,000 11,754
(D) (D) (D)
(D) (D) (D)
10,470 9,335
12,660
210 (X)
225
13,528 8,186
11,415
453 243 384
44,088 33,882 39,003
155,016 194,534 225,865
3,146 5,622 2,975
17,709 16,144 13,666
3,561 3,958 1,567
3,518 3,241 2,295
49,256 57,486 41,496
1,722 122
2,231
323,128 292,936 223,235
(X) (X) (X)
557,056 574,043 513,330
- Represents zero. (D) Withheld to avoid disclosing data for individual operations. (X) Not applicable. 1
Yield is based on total production.
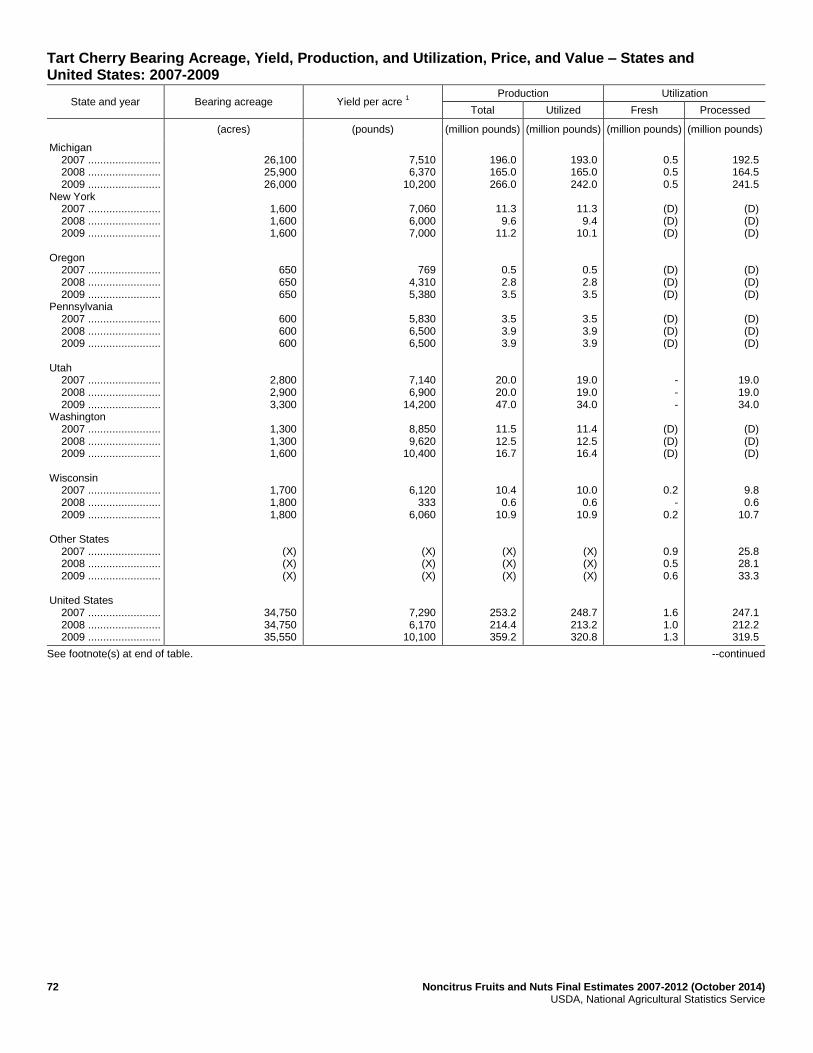
72 Noncitrus Fruits and Nuts Final Estimates 2007-2012 (October 2014) USDA, National Agricultural Statistics Service
Tart Cherry Bearing Acreage, Yield, Production, and Utilization, Price, and Value – States and United States: 2007-2009
State and year Bearing acreage Yield per acre 1
Production Utilization
Total Utilized Fresh Processed
(acres) (pounds) (million pounds) (million pounds) (million pounds) (million pounds)
Michigan 2007 ........................ 2008 ........................ 2009 ........................ New York 2007 ........................ 2008 ........................ 2009 ........................ Oregon 2007 ........................ 2008 ........................ 2009 ........................ Pennsylvania 2007 ........................ 2008 ........................ 2009 ........................ Utah 2007 ........................ 2008 ........................ 2009 ........................ Washington 2007 ........................ 2008 ........................ 2009 ........................ Wisconsin 2007 ........................ 2008 ........................ 2009 ........................ Other States 2007 ........................ 2008 ........................ 2009 ........................ United States 2007 ........................ 2008 ........................ 2009 ........................
26,100 25,900 26,000
1,600 1,600 1,600
650 650 650
600 600 600
2,800 2,900 3,300
1,300 1,300 1,600
1,700 1,800 1,800
(X) (X) (X)
34,750 34,750 35,550
7,510 6,370
10,200
7,060 6,000 7,000
769 4,310 5,380
5,830 6,500 6,500
7,140 6,900
14,200
8,850 9,620
10,400
6,120 333
6,060
(X) (X) (X)
7,290 6,170
10,100
196.0 165.0 266.0
11.3 9.6
11.2
0.5 2.8 3.5
3.5 3.9 3.9
20.0 20.0 47.0
11.5 12.5 16.7
10.4 0.6
10.9
(X) (X) (X)
253.2 214.4 359.2
193.0 165.0 242.0
11.3 9.4
10.1
0.5 2.8 3.5
3.5 3.9 3.9
19.0 19.0 34.0
11.4 12.5 16.4
10.0 0.6
10.9
(X) (X) (X)
248.7 213.2 320.8
0.5 0.5 0.5
(D) (D) (D)
(D) (D) (D)
(D) (D) (D)
- - -
(D) (D) (D)
0.2 -
0.2
0.9 0.5 0.6
1.6 1.0 1.3
192.5 164.5 241.5
(D) (D) (D)
(D) (D) (D)
(D) (D) (D)
19.0 19.0 34.0
(D) (D) (D)
9.8 0.6
10.7
25.8 28.1 33.3
247.1 212.2 319.5
See footnote(s) at end of table. --continued
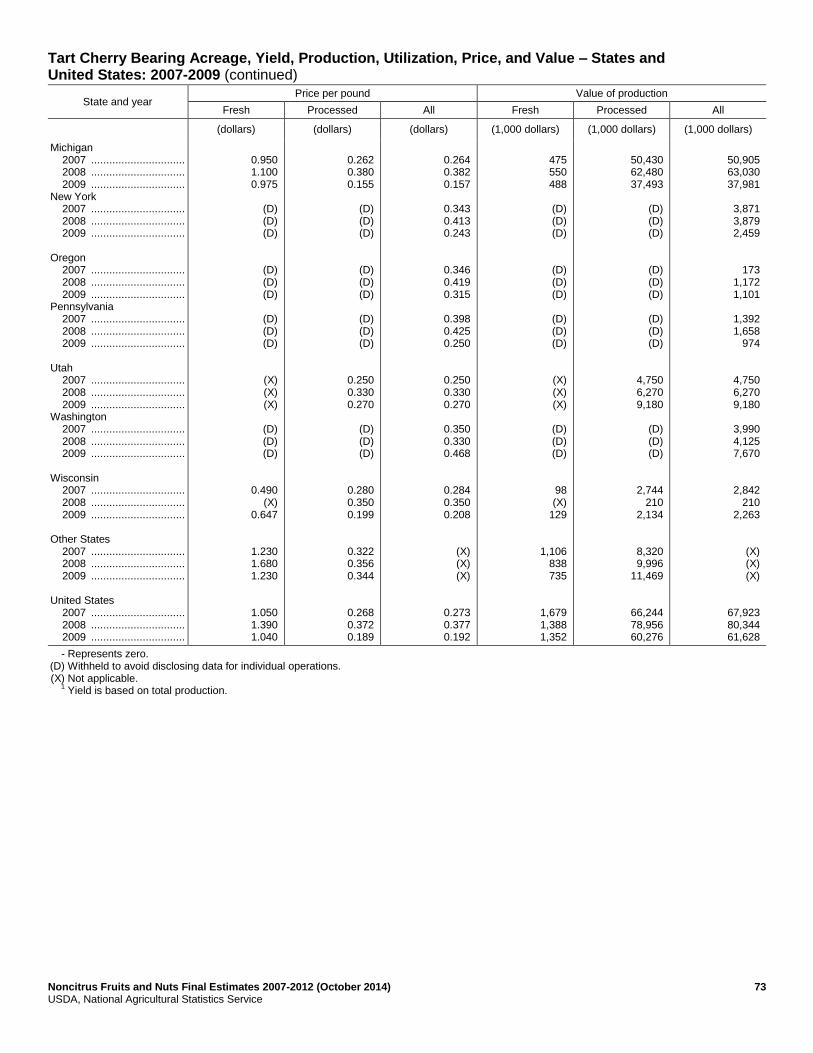
Noncitrus Fruits and Nuts Final Estimates 2007-2012 (October 2014) 73 USDA, National Agricultural Statistics Service
Tart Cherry Bearing Acreage, Yield, Production, Utilization, Price, and Value – States and United States: 2007-2009 (continued)
State and year Price per pound Value of production
Fresh Processed All Fresh Processed All
(dollars) (dollars) (dollars) (1,000 dollars) (1,000 dollars) (1,000 dollars)
Michigan 2007 ............................... 2008 ............................... 2009 ............................... New York 2007 ............................... 2008 ............................... 2009 ............................... Oregon 2007 ............................... 2008 ............................... 2009 ............................... Pennsylvania 2007 ............................... 2008 ............................... 2009 ............................... Utah 2007 ............................... 2008 ............................... 2009 ............................... Washington 2007 ............................... 2008 ............................... 2009 ............................... Wisconsin 2007 ............................... 2008 ............................... 2009 ............................... Other States 2007 ............................... 2008 ............................... 2009 ............................... United States 2007 ............................... 2008 ............................... 2009 ...............................
0.950 1.100 0.975
(D) (D) (D)
(D) (D) (D)
(D) (D) (D)
(X) (X) (X)
(D) (D) (D)
0.490 (X)
0.647
1.230 1.680 1.230
1.050 1.390 1.040
0.262 0.380 0.155
(D) (D) (D)
(D) (D) (D)
(D) (D) (D)
0.250 0.330 0.270
(D) (D) (D)
0.280 0.350 0.199
0.322 0.356 0.344
0.268 0.372 0.189
0.264 0.382 0.157
0.343 0.413 0.243
0.346 0.419 0.315
0.398 0.425 0.250
0.250 0.330 0.270
0.350 0.330 0.468
0.284 0.350 0.208
(X) (X) (X)
0.273 0.377 0.192
475 550 488
(D) (D) (D)
(D) (D) (D)
(D) (D) (D)
(X) (X) (X)
(D) (D) (D)
98 (X)
129
1,106 838 735
1,679 1,388 1,352
50,430 62,480 37,493
(D) (D) (D)
(D) (D) (D)
(D) (D) (D)
4,750 6,270 9,180
(D) (D) (D)
2,744 210
2,134
8,320 9,996
11,469
66,244 78,956 60,276
50,905 63,030 37,981
3,871 3,879 2,459
173 1,172 1,101
1,392 1,658
974
4,750 6,270 9,180
3,990 4,125 7,670
2,842 210
2,263
(X) (X) (X)
67,923 80,344 61,628
- Represents zero. (D) Withheld to avoid disclosing data for individual operations. (X) Not applicable. 1
Yield is based on total production.

74 Noncitrus Fruits and Nuts Final Estimates 2007-2012 (October 2014) USDA, National Agricultural Statistics Service
Sweet and Tart Cherry Processed Utilization, Use, and Price by Use – States and United States: 2007-2009
Crop, Utilization, and State
Quantity Price per unit
2007 2008 2009 2007 2008 2009
(tons) (tons) (tons) (dollars per ton) (dollars per ton) (dollars per ton)
Sweet cherries Canned Michigan ................................. Oregon .................................... Washington ............................. United States .......................... Brined Michigan ................................. Oregon .................................... Utah ........................................ Washington ............................. Other States
1 .........................
United States .......................... Other
2
Michigan ................................. Oregon .................................... Washington ............................. Other States
1 .........................
United States ..........................
1,060 1,500 4,000
6,560
17,400 8,300
(D) 13,000
9,460
48,160
8,040 3,700
11,000
6,190
28,930
1,830 850
2,000
4,680
14,100 7,500
- 8,000
10,150
39,750
9,170 1,150 5,000
5,650
20,970
1,250 2,000 5,000
8,250
17,750 13,000
450 11,000
9,371
51,571
8,800 1,000
16,000
3,253
29,053
730.00 1,010.00 1,170.00
1,062.00
440.00 765.00
(D) 508.00
315.00
490.00
949.00 704.00 204.00
169.00
468.00
460.00 1,290.00 1,390.00
1,008.00
450.00 957.00
- 502.00
244.00
504.00
634.00 922.00 278.00
153.00
435.00
590.00 850.00 653.00
691.00
410.00 800.00 500.00 450.00
266.00
491.00
425.00 560.00 200.00
141.00
274.00
(million pounds) (million pounds) (million pounds)
(dollars per pound)
(dollars per pound)
(dollars per pound)
Tart cherries Canned Michigan ................................. Other States
1 .........................
United States .......................... Frozen Michigan ................................. Other States
1 .........................
United States .......................... Other
3
Michigan ................................. Other States
1 .........................
United States ..........................
39.0
8.7
47.7
143.0
36.3
179.3
10.5
9.6
20.1
39.0
10.8
49.8
117.0
28.0
145.0
8.5
8.9
17.4
43.0
9.2
52.2
175.0
57.0
232.0
23.5
11.8
35.3
0.270
0.306
0.277
0.265
0.273
0.267
0.191
0.340
0.262
0.435
0.372
0.421
0.370
0.339
0.364
0.262
0.331
0.297
0.120
0.242
0.141
0.170
0.287
0.196
0.110
0.404
0.208
- Represents zero. (D) Withheld to avoid disclosing data for individual operations. 1
Includes data withheld above and/or data for States not listed in this table. 2
Includes California canned utilization and other processed utilizations (frozen, juice, etc) from all States. 3
Juice, wine, brined, and dried.
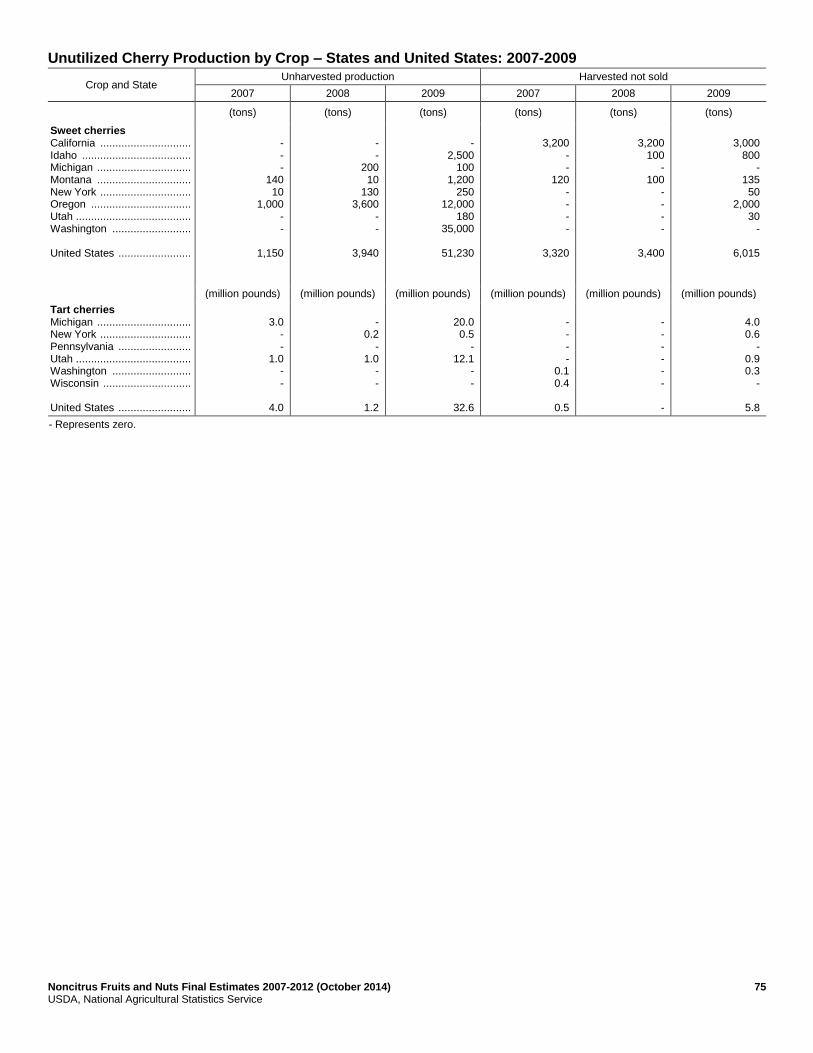
Noncitrus Fruits and Nuts Final Estimates 2007-2012 (October 2014) 75 USDA, National Agricultural Statistics Service
Unutilized Cherry Production by Crop – States and United States: 2007-2009
Crop and State Unharvested production Harvested not sold
2007 2008 2009 2007 2008 2009
(tons) (tons) (tons) (tons) (tons) (tons)
Sweet cherries California .............................. Idaho .................................... Michigan ............................... Montana ............................... New York .............................. Oregon ................................. Utah ...................................... Washington .......................... United States ........................
- - -
140 10
1,000 - -
1,150
- -
200 10
130 3,600
- -
3,940
-
2,500 100
1,200 250
12,000 180
35,000
51,230
3,200
- -
120 - - - -
3,320
3,200
100 -
100 - - - -
3,400
3,000
800 -
135 50
2,000 30
-
6,015
(million pounds) (million pounds) (million pounds) (million pounds) (million pounds) (million pounds)
Tart cherries Michigan ............................... New York .............................. Pennsylvania ........................ Utah ...................................... Washington .......................... Wisconsin ............................. United States ........................
3.0
- -
1.0 - -
4.0
-
0.2 -
1.0 - -
1.2
20.0 0.5
- 12.1
- -
32.6
- - - -
0.1 0.4
0.5
- - - - - -
-
4.0 0.6
- 0.9 0.3
-
5.8
- Represents zero.
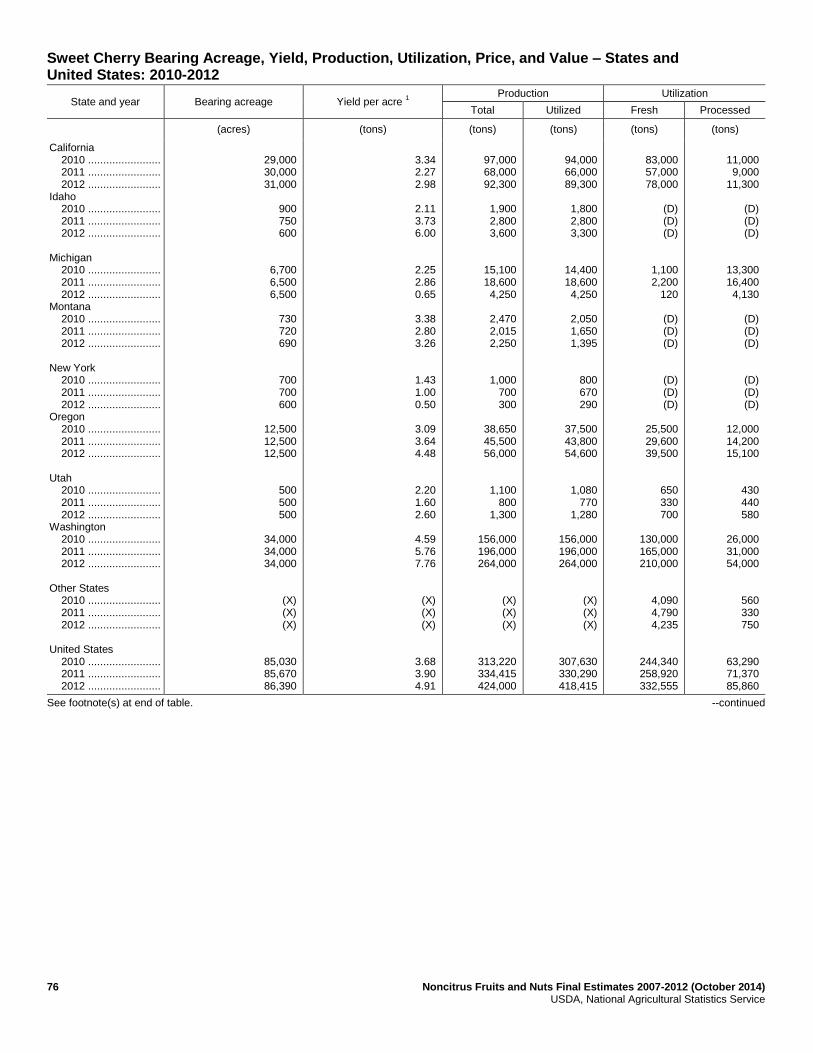
76 Noncitrus Fruits and Nuts Final Estimates 2007-2012 (October 2014) USDA, National Agricultural Statistics Service
Sweet Cherry Bearing Acreage, Yield, Production, Utilization, Price, and Value – States and United States: 2010-2012
State and year Bearing acreage Yield per acre 1
Production Utilization
Total Utilized Fresh Processed
(acres) (tons) (tons) (tons) (tons) (tons)
California 2010 ........................ 2011 ........................ 2012 ........................ Idaho 2010 ........................ 2011 ........................ 2012 ........................ Michigan 2010 ........................ 2011 ........................ 2012 ........................ Montana 2010 ........................ 2011 ........................ 2012 ........................ New York 2010 ........................ 2011 ........................ 2012 ........................ Oregon 2010 ........................ 2011 ........................ 2012 ........................ Utah 2010 ........................ 2011 ........................ 2012 ........................ Washington 2010 ........................ 2011 ........................ 2012 ........................ Other States 2010 ........................ 2011 ........................ 2012 ........................ United States 2010 ........................ 2011 ........................ 2012 ........................
29,000 30,000 31,000
900 750 600
6,700 6,500 6,500
730 720 690
700 700 600
12,500 12,500 12,500
500 500 500
34,000 34,000 34,000
(X) (X) (X)
85,030 85,670 86,390
3.34 2.27 2.98
2.11 3.73 6.00
2.25 2.86 0.65
3.38 2.80 3.26
1.43 1.00 0.50
3.09 3.64 4.48
2.20 1.60 2.60
4.59 5.76 7.76
(X) (X) (X)
3.68 3.90 4.91
97,000 68,000 92,300
1,900 2,800 3,600
15,100 18,600 4,250
2,470 2,015 2,250
1,000 700 300
38,650 45,500 56,000
1,100 800
1,300
156,000 196,000 264,000
(X) (X) (X)
313,220 334,415 424,000
94,000 66,000 89,300
1,800 2,800 3,300
14,400 18,600 4,250
2,050 1,650 1,395
800 670 290
37,500 43,800 54,600
1,080 770
1,280
156,000 196,000 264,000
(X) (X) (X)
307,630 330,290 418,415
83,000 57,000 78,000
(D) (D) (D)
1,100 2,200
120
(D) (D) (D)
(D) (D) (D)
25,500 29,600 39,500
650 330 700
130,000 165,000 210,000
4,090 4,790 4,235
244,340 258,920 332,555
11,000 9,000
11,300
(D) (D) (D)
13,300 16,400 4,130
(D) (D) (D)
(D) (D) (D)
12,000 14,200 15,100
430 440 580
26,000 31,000 54,000
560 330 750
63,290 71,370 85,860
See footnote(s) at end of table. --continued
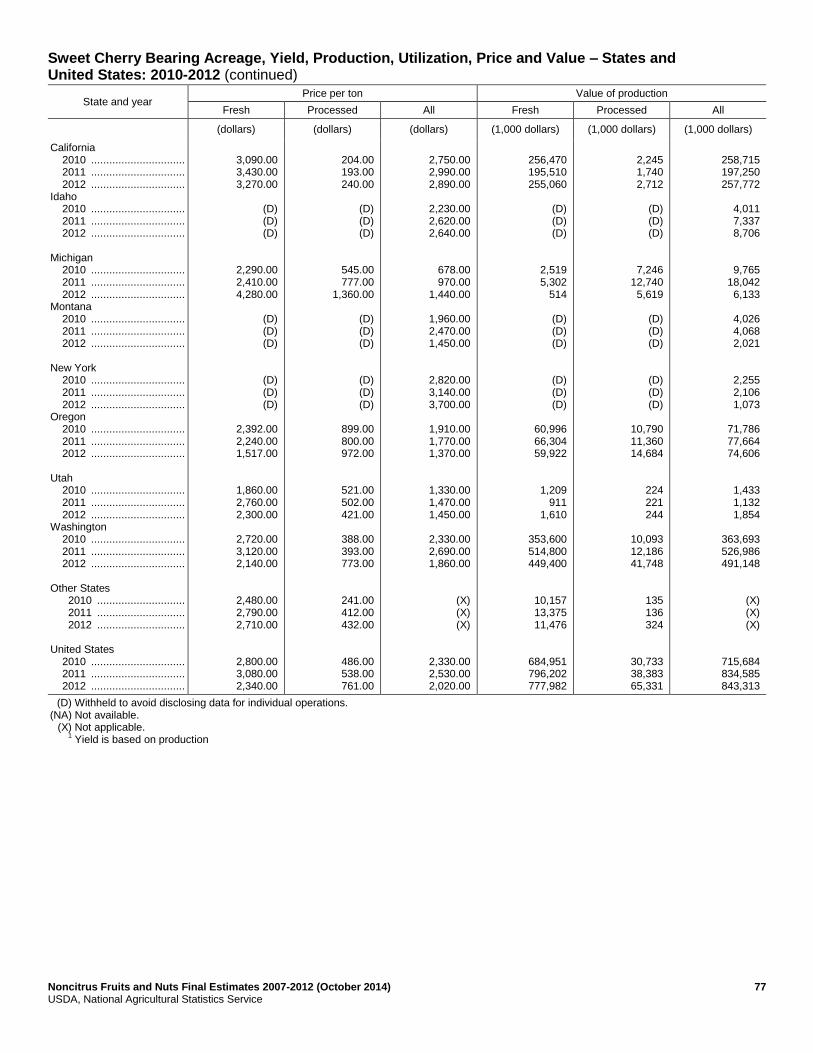
Noncitrus Fruits and Nuts Final Estimates 2007-2012 (October 2014) 77 USDA, National Agricultural Statistics Service
Sweet Cherry Bearing Acreage, Yield, Production, Utilization, Price and Value – States and United States: 2010-2012 (continued)
State and year Price per ton Value of production
Fresh Processed All Fresh Processed All
(dollars) (dollars) (dollars) (1,000 dollars) (1,000 dollars) (1,000 dollars)
California 2010 ............................... 2011 ............................... 2012 ............................... Idaho 2010 ............................... 2011 ............................... 2012 ............................... Michigan 2010 ............................... 2011 ............................... 2012 ............................... Montana 2010 ............................... 2011 ............................... 2012 ............................... New York 2010 ............................... 2011 ............................... 2012 ............................... Oregon 2010 ............................... 2011 ............................... 2012 ............................... Utah 2010 ............................... 2011 ............................... 2012 ............................... Washington 2010 ............................... 2011 ............................... 2012 ............................... Other States 2010 ............................. 2011 ............................. 2012 ............................. United States 2010 ............................... 2011 ............................... 2012 ...............................
3,090.00 3,430.00 3,270.00
(D) (D) (D)
2,290.00 2,410.00 4,280.00
(D) (D) (D)
(D) (D) (D)
2,392.00 2,240.00 1,517.00
1,860.00 2,760.00 2,300.00
2,720.00 3,120.00 2,140.00
2,480.00 2,790.00 2,710.00
2,800.00 3,080.00 2,340.00
204.00 193.00 240.00
(D) (D) (D)
545.00 777.00
1,360.00
(D) (D) (D)
(D) (D) (D)
899.00 800.00 972.00
521.00 502.00 421.00
388.00 393.00 773.00
241.00 412.00 432.00
486.00 538.00 761.00
2,750.00 2,990.00 2,890.00
2,230.00 2,620.00 2,640.00
678.00 970.00
1,440.00
1,960.00 2,470.00 1,450.00
2,820.00 3,140.00 3,700.00
1,910.00 1,770.00 1,370.00
1,330.00 1,470.00 1,450.00
2,330.00 2,690.00 1,860.00
(X) (X) (X)
2,330.00 2,530.00 2,020.00
256,470 195,510 255,060
(D) (D) (D)
2,519 5,302
514
(D) (D) (D)
(D) (D) (D)
60,996 66,304 59,922
1,209 911
1,610
353,600 514,800 449,400
10,157 13,375 11,476
684,951 796,202 777,982
2,245 1,740 2,712
(D) (D) (D)
7,246 12,740 5,619
(D) (D) (D)
(D) (D) (D)
10,790 11,360 14,684
224 221 244
10,093 12,186 41,748
135 136 324
30,733 38,383 65,331
258,715 197,250 257,772
4,011 7,337 8,706
9,765 18,042 6,133
4,026 4,068 2,021
2,255 2,106 1,073
71,786 77,664 74,606
1,433 1,132 1,854
363,693 526,986 491,148
(X) (X) (X)
715,684 834,585 843,313
(D) Withheld to avoid disclosing data for individual operations. (NA) Not available. (X) Not applicable. 1
Yield is based on production
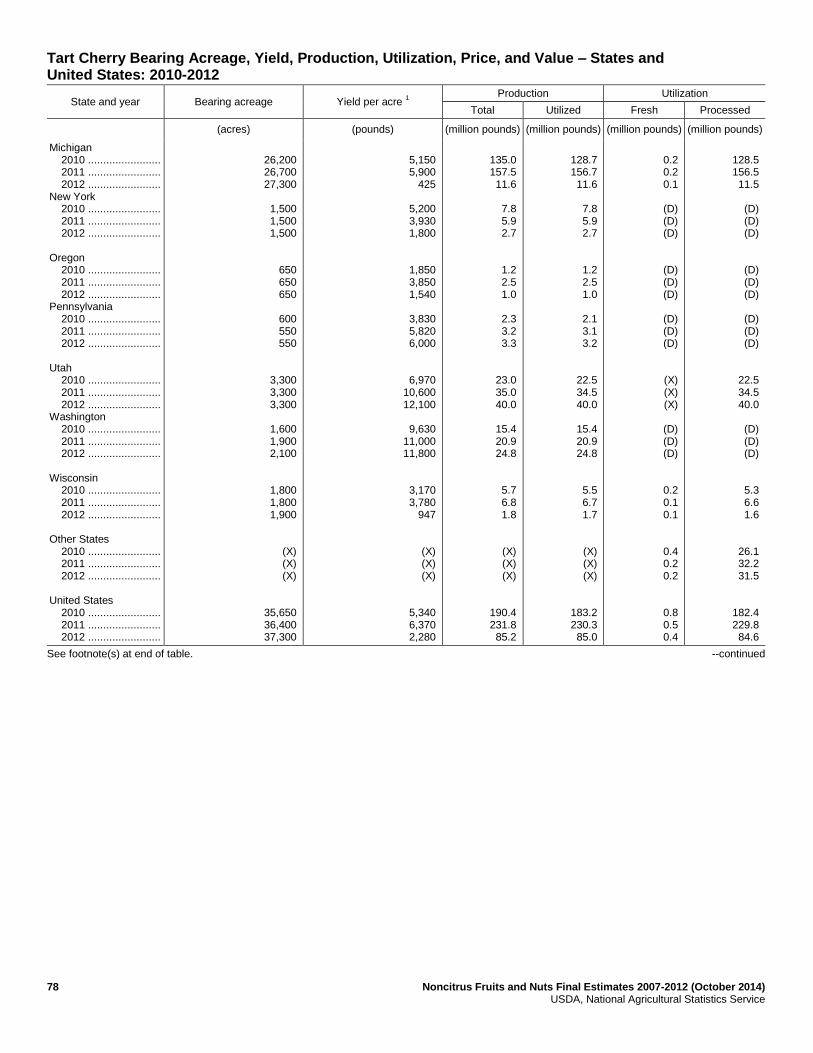
78 Noncitrus Fruits and Nuts Final Estimates 2007-2012 (October 2014) USDA, National Agricultural Statistics Service
Tart Cherry Bearing Acreage, Yield, Production, Utilization, Price, and Value – States and United States: 2010-2012
State and year Bearing acreage Yield per acre 1
Production Utilization
Total Utilized Fresh Processed
(acres) (pounds) (million pounds) (million pounds) (million pounds) (million pounds)
Michigan 2010 ........................ 2011 ........................ 2012 ........................ New York 2010 ........................ 2011 ........................ 2012 ........................ Oregon 2010 ........................ 2011 ........................ 2012 ........................ Pennsylvania 2010 ........................ 2011 ........................ 2012 ........................ Utah 2010 ........................ 2011 ........................ 2012 ........................ Washington 2010 ........................ 2011 ........................ 2012 ........................ Wisconsin 2010 ........................ 2011 ........................ 2012 ........................ Other States 2010 ........................ 2011 ........................ 2012 ........................ United States 2010 ........................ 2011 ........................ 2012 ........................
26,200 26,700 27,300
1,500 1,500 1,500
650 650 650
600 550 550
3,300 3,300 3,300
1,600 1,900 2,100
1,800 1,800 1,900
(X) (X) (X)
35,650 36,400 37,300
5,150 5,900
425
5,200 3,930 1,800
1,850 3,850 1,540
3,830 5,820 6,000
6,970 10,600 12,100
9,630
11,000 11,800
3,170 3,780
947
(X) (X) (X)
5,340 6,370 2,280
135.0 157.5 11.6
7.8 5.9 2.7
1.2 2.5 1.0
2.3 3.2 3.3
23.0 35.0 40.0
15.4 20.9 24.8
5.7 6.8 1.8
(X) (X) (X)
190.4 231.8 85.2
128.7 156.7 11.6
7.8 5.9 2.7
1.2 2.5 1.0
2.1 3.1 3.2
22.5 34.5 40.0
15.4 20.9 24.8
5.5 6.7 1.7
(X) (X) (X)
183.2 230.3 85.0
0.2 0.2 0.1
(D) (D) (D)
(D) (D) (D)
(D) (D) (D)
(X) (X) (X)
(D) (D) (D)
0.2 0.1 0.1
0.4 0.2 0.2
0.8 0.5 0.4
128.5 156.5 11.5
(D) (D) (D)
(D) (D) (D)
(D) (D) (D)
22.5 34.5 40.0
(D) (D) (D)
5.3 6.6 1.6
26.1 32.2 31.5
182.4 229.8 84.6
See footnote(s) at end of table. --continued
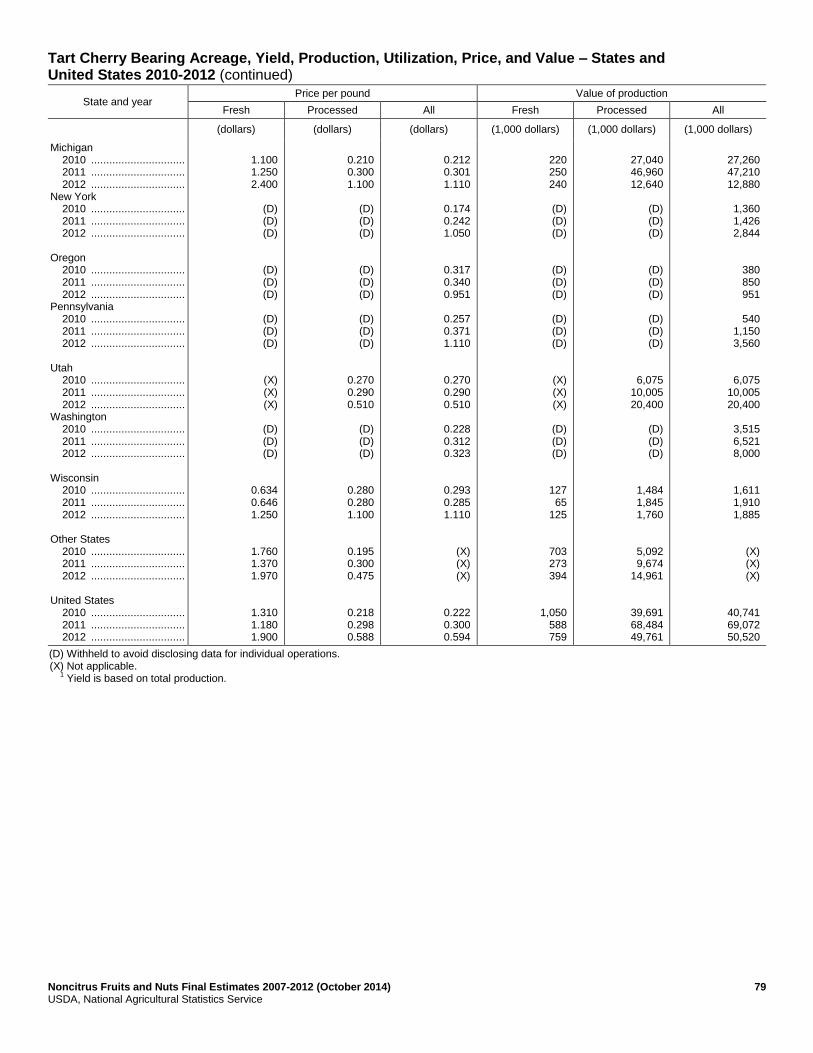
Noncitrus Fruits and Nuts Final Estimates 2007-2012 (October 2014) 79 USDA, National Agricultural Statistics Service
Tart Cherry Bearing Acreage, Yield, Production, Utilization, Price, and Value – States and United States 2010-2012 (continued)
State and year Price per pound Value of production
Fresh Processed All Fresh Processed All
(dollars) (dollars) (dollars) (1,000 dollars) (1,000 dollars) (1,000 dollars)
Michigan 2010 ............................... 2011 ............................... 2012 ............................... New York 2010 ............................... 2011 ............................... 2012 ............................... Oregon 2010 ............................... 2011 ............................... 2012 ............................... Pennsylvania 2010 ............................... 2011 ............................... 2012 ............................... Utah 2010 ............................... 2011 ............................... 2012 ............................... Washington 2010 ............................... 2011 ............................... 2012 ............................... Wisconsin 2010 ............................... 2011 ............................... 2012 ............................... Other States 2010 ............................... 2011 ............................... 2012 ............................... United States 2010 ............................... 2011 ............................... 2012 ...............................
1.100 1.250 2.400
(D) (D) (D)
(D) (D) (D)
(D) (D) (D)
(X) (X) (X)
(D) (D) (D)
0.634 0.646 1.250
1.760 1.370 1.970
1.310 1.180 1.900
0.210 0.300 1.100
(D) (D) (D)
(D) (D) (D)
(D) (D) (D)
0.270 0.290 0.510
(D) (D) (D)
0.280 0.280 1.100
0.195 0.300 0.475
0.218 0.298 0.588
0.212 0.301 1.110
0.174 0.242 1.050
0.317 0.340 0.951
0.257 0.371 1.110
0.270 0.290 0.510
0.228 0.312 0.323
0.293 0.285 1.110
(X) (X) (X)
0.222 0.300 0.594
220 250 240
(D) (D) (D)
(D) (D) (D)
(D) (D) (D)
(X) (X) (X)
(D) (D) (D)
127 65
125
703 273 394
1,050 588 759
27,040 46,960 12,640
(D) (D) (D)
(D) (D) (D)
(D) (D) (D)
6,075 10,005 20,400
(D) (D) (D)
1,484 1,845 1,760
5,092 9,674
14,961
39,691 68,484 49,761
27,260 47,210 12,880
1,360 1,426 2,844
380 850 951
540
1,150 3,560
6,075 10,005 20,400
3,515 6,521 8,000
1,611 1,910 1,885
(X) (X) (X)
40,741 69,072 50,520
(D) Withheld to avoid disclosing data for individual operations. (X) Not applicable. 1
Yield is based on total production.
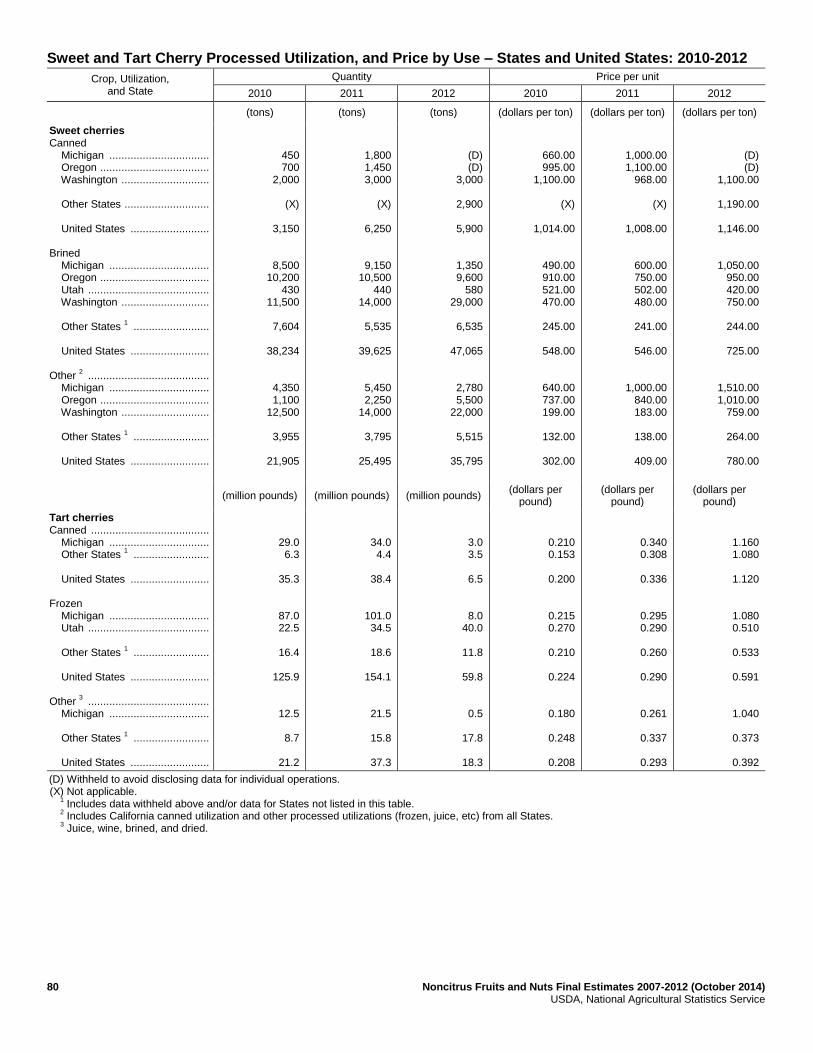
80 Noncitrus Fruits and Nuts Final Estimates 2007-2012 (October 2014) USDA, National Agricultural Statistics Service
Sweet and Tart Cherry Processed Utilization, and Price by Use – States and United States: 2010-2012
Crop, Utilization, and State
Quantity Price per unit
2010 2011 2012 2010 2011 2012
(tons) (tons) (tons) (dollars per ton) (dollars per ton) (dollars per ton)
Sweet cherries Canned Michigan ................................. Oregon .................................... Washington ............................. Other States ............................ United States .......................... Brined Michigan ................................. Oregon .................................... Utah ........................................ Washington ............................. Other States
1 .........................
United States .......................... Other
2 ........................................
Michigan ................................. Oregon .................................... Washington ............................. Other States
1 .........................
United States ..........................
450 700
2,000
(X)
3,150
8,500 10,200
430 11,500
7,604
38,234
4,350 1,100
12,500
3,955
21,905
1,800 1,450 3,000
(X)
6,250
9,150 10,500
440 14,000
5,535
39,625
5,450 2,250
14,000
3,795
25,495
(D) (D)
3,000
2,900
5,900
1,350 9,600
580 29,000
6,535
47,065
2,780 5,500
22,000
5,515
35,795
660.00 995.00
1,100.00
(X)
1,014.00
490.00 910.00 521.00 470.00
245.00
548.00
640.00 737.00 199.00
132.00
302.00
1,000.00 1,100.00
968.00
(X)
1,008.00
600.00 750.00 502.00 480.00
241.00
546.00
1,000.00 840.00 183.00
138.00
409.00
(D) (D)
1,100.00
1,190.00
1,146.00
1,050.00 950.00 420.00 750.00
244.00
725.00
1,510.00 1,010.00
759.00
264.00
780.00
(million pounds) (million pounds) (million pounds)
(dollars per pound)
(dollars per pound)
(dollars per pound)
Tart cherries Canned ....................................... Michigan ................................. Other States
1 .........................
United States .......................... Frozen Michigan ................................. Utah ........................................ Other States
1 .........................
United States .......................... Other
3 ........................................
Michigan ................................. Other States
1 .........................
United States ..........................
29.0 6.3
35.3
87.0 22.5
16.4
125.9
12.5
8.7
21.2
34.0 4.4
38.4
101.0 34.5
18.6
154.1
21.5
15.8
37.3
3.0 3.5
6.5
8.0 40.0
11.8
59.8
0.5
17.8
18.3
0.210 0.153
0.200
0.215 0.270
0.210
0.224
0.180
0.248
0.208
0.340 0.308
0.336
0.295 0.290
0.260
0.290
0.261
0.337
0.293
1.160 1.080
1.120
1.080 0.510
0.533
0.591
1.040
0.373
0.392
(D) Withheld to avoid disclosing data for individual operations. (X) Not applicable. 1
Includes data withheld above and/or data for States not listed in this table. 2
Includes California canned utilization and other processed utilizations (frozen, juice, etc) from all States. 3
Juice, wine, brined, and dried.
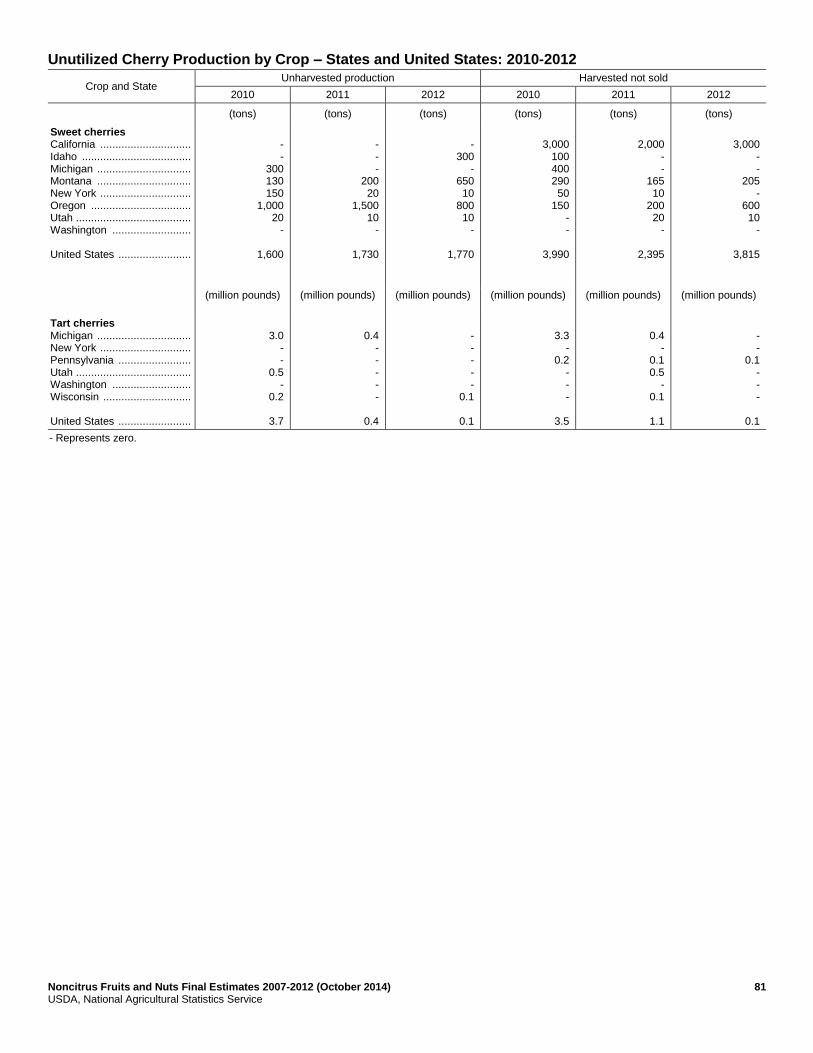
Noncitrus Fruits and Nuts Final Estimates 2007-2012 (October 2014) 81 USDA, National Agricultural Statistics Service
Unutilized Cherry Production by Crop – States and United States: 2010-2012
Crop and State Unharvested production Harvested not sold
2010 2011 2012 2010 2011 2012
(tons) (tons) (tons) (tons) (tons) (tons)
Sweet cherries California .............................. Idaho .................................... Michigan ............................... Montana ............................... New York .............................. Oregon ................................. Utah ...................................... Washington .......................... United States ........................
- -
300 130 150
1,000 20
-
1,600
- - -
200 20
1,500 10
-
1,730
-
300 -
650 10
800 10
-
1,770
3,000
100 400 290 50
150 - -
3,990
2,000
- -
165 10
200 20
-
2,395
3,000
- -
205 -
600 10
-
3,815
(million pounds) (million pounds) (million pounds) (million pounds) (million pounds) (million pounds)
Tart cherries Michigan ............................... New York .............................. Pennsylvania ........................ Utah ...................................... Washington .......................... Wisconsin ............................. United States ........................
3.0 - -
0.5 -
0.2
3.7
0.4 - - - - -
0.4
- - - - -
0.1
0.1
3.3 -
0.2 - - -
3.5
0.4 -
0.1 0.5
- 0.1
1.1
- -
0.1 - - -
0.1
- Represents zero.
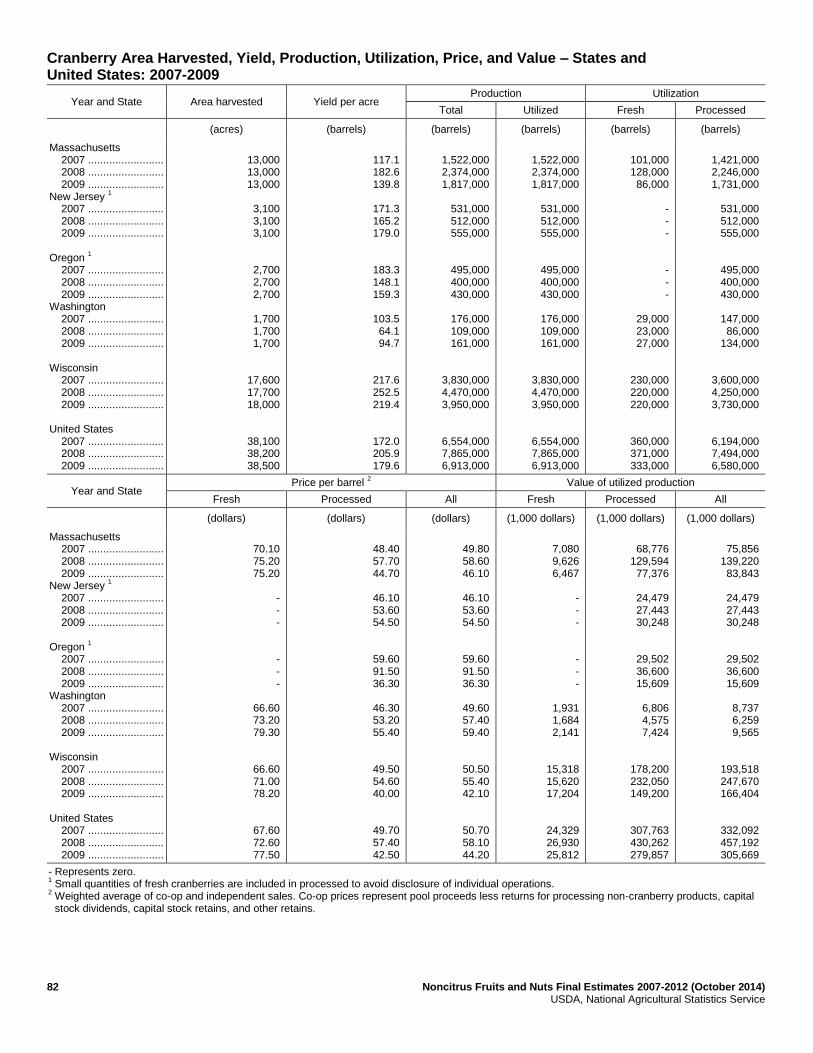
82 Noncitrus Fruits and Nuts Final Estimates 2007-2012 (October 2014) USDA, National Agricultural Statistics Service
Cranberry Area Harvested, Yield, Production, Utilization, Price, and Value – States and United States: 2007-2009
Year and State Area harvested Yield per acre Production Utilization
Total Utilized Fresh Processed
(acres) (barrels) (barrels) (barrels) (barrels) (barrels)
Massachusetts 2007 ......................... 2008 ......................... 2009 ......................... New Jersey
1
2007 ......................... 2008 ......................... 2009 ......................... Oregon
1
2007 ......................... 2008 ......................... 2009 ......................... Washington 2007 ......................... 2008 ......................... 2009 ......................... Wisconsin 2007 ......................... 2008 ......................... 2009 ......................... United States 2007 ......................... 2008 ......................... 2009 .........................
13,000 13,000 13,000
3,100 3,100 3,100
2,700 2,700 2,700
1,700 1,700 1,700
17,600 17,700 18,000
38,100 38,200 38,500
117.1 182.6 139.8
171.3 165.2 179.0
183.3 148.1 159.3
103.5 64.1 94.7
217.6 252.5 219.4
172.0 205.9 179.6
1,522,000 2,374,000 1,817,000
531,000 512,000 555,000
495,000 400,000 430,000
176,000 109,000 161,000
3,830,000 4,470,000 3,950,000
6,554,000 7,865,000 6,913,000
1,522,000 2,374,000 1,817,000
531,000 512,000 555,000
495,000 400,000 430,000
176,000 109,000 161,000
3,830,000 4,470,000 3,950,000
6,554,000 7,865,000 6,913,000
101,000 128,000 86,000
- - -
- - -
29,000 23,000 27,000
230,000 220,000 220,000
360,000 371,000 333,000
1,421,000 2,246,000 1,731,000
531,000 512,000 555,000
495,000 400,000 430,000
147,000 86,000
134,000
3,600,000 4,250,000 3,730,000
6,194,000 7,494,000 6,580,000
Year and State Price per barrel
2 Value of utilized production
Fresh Processed All Fresh Processed All
(dollars) (dollars) (dollars) (1,000 dollars) (1,000 dollars) (1,000 dollars)
Massachusetts 2007 ......................... 2008 ......................... 2009 ......................... New Jersey
1
2007 ......................... 2008 ......................... 2009 ......................... Oregon
1
2007 ......................... 2008 ......................... 2009 ......................... Washington 2007 ......................... 2008 ......................... 2009 ......................... Wisconsin 2007 ......................... 2008 ......................... 2009 ......................... United States 2007 ......................... 2008 ......................... 2009 .........................
70.10 75.20 75.20
- - -
- - -
66.60 73.20 79.30
66.60 71.00 78.20
67.60 72.60 77.50
48.40 57.70 44.70
46.10 53.60 54.50
59.60 91.50 36.30
46.30 53.20 55.40
49.50 54.60 40.00
49.70 57.40 42.50
49.80 58.60 46.10
46.10 53.60 54.50
59.60 91.50 36.30
49.60 57.40 59.40
50.50 55.40 42.10
50.70 58.10 44.20
7,080 9,626 6,467
- - -
- - -
1,931 1,684 2,141
15,318 15,620 17,204
24,329 26,930 25,812
68,776
129,594 77,376
24,479 27,443 30,248
29,502 36,600 15,609
6,806 4,575 7,424
178,200 232,050 149,200
307,763 430,262 279,857
75,856
139,220 83,843
24,479 27,443 30,248
29,502 36,600 15,609
8,737 6,259 9,565
193,518 247,670 166,404
332,092 457,192 305,669
- Represents zero. 1 Small quantities of fresh cranberries are included in processed to avoid disclosure of individual operations.
2 Weighted average of co-op and independent sales. Co-op prices represent pool proceeds less returns for processing non-cranberry products, capital stock dividends, capital stock retains, and other retains.
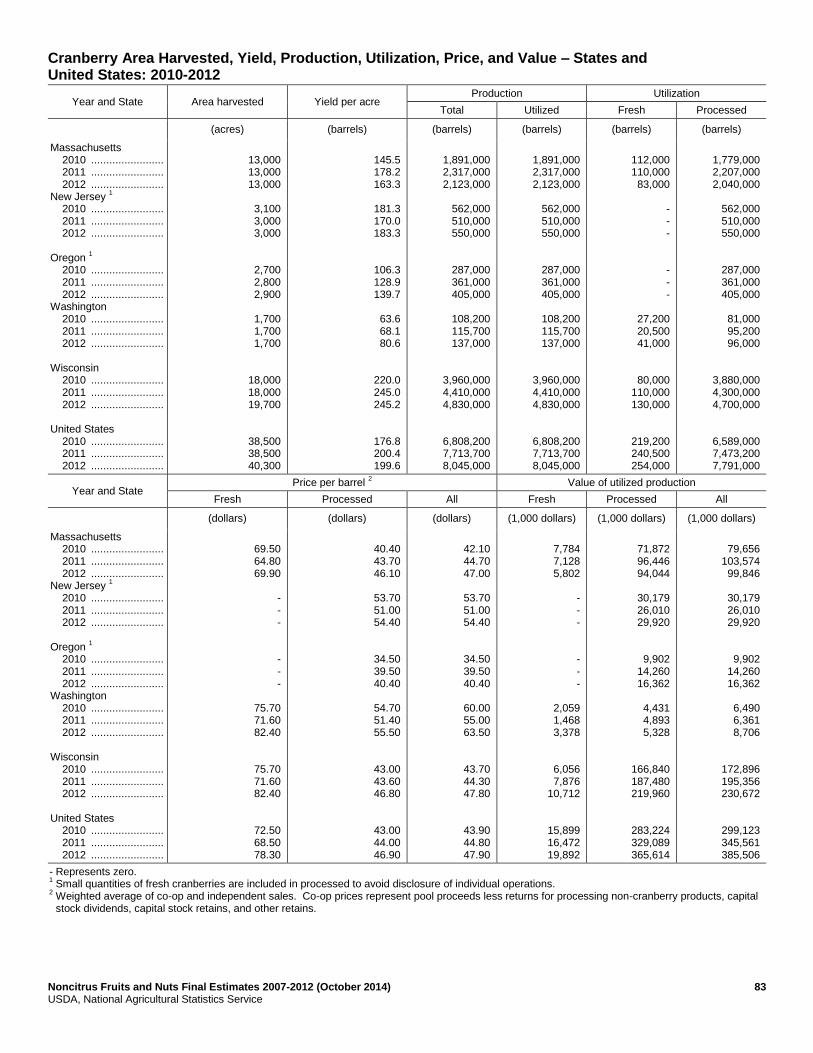
Noncitrus Fruits and Nuts Final Estimates 2007-2012 (October 2014) 83 USDA, National Agricultural Statistics Service
Cranberry Area Harvested, Yield, Production, Utilization, Price, and Value – States and United States: 2010-2012
Year and State Area harvested Yield per acre Production Utilization
Total Utilized Fresh Processed
(acres) (barrels) (barrels) (barrels) (barrels) (barrels)
Massachusetts 2010 ........................ 2011 ........................ 2012 ........................ New Jersey
1
2010 ........................ 2011 ........................ 2012 ........................ Oregon
1
2010 ........................ 2011 ........................ 2012 ........................ Washington 2010 ........................ 2011 ........................ 2012 ........................ Wisconsin 2010 ........................ 2011 ........................ 2012 ........................ United States 2010 ........................ 2011 ........................ 2012 ........................
13,000 13,000 13,000
3,100 3,000 3,000
2,700 2,800 2,900
1,700 1,700 1,700
18,000 18,000 19,700
38,500 38,500 40,300
145.5 178.2 163.3
181.3 170.0 183.3
106.3 128.9 139.7
63.6 68.1 80.6
220.0 245.0 245.2
176.8 200.4 199.6
1,891,000 2,317,000 2,123,000
562,000 510,000 550,000
287,000 361,000 405,000
108,200 115,700 137,000
3,960,000 4,410,000 4,830,000
6,808,200 7,713,700 8,045,000
1,891,000 2,317,000 2,123,000
562,000 510,000 550,000
287,000 361,000 405,000
108,200 115,700 137,000
3,960,000 4,410,000 4,830,000
6,808,200 7,713,700 8,045,000
112,000 110,000 83,000
- - -
- - -
27,200 20,500 41,000
80,000 110,000 130,000
219,200 240,500 254,000
1,779,000 2,207,000 2,040,000
562,000 510,000 550,000
287,000 361,000 405,000
81,000 95,200 96,000
3,880,000 4,300,000 4,700,000
6,589,000 7,473,200 7,791,000
Year and State Price per barrel
2 Value of utilized production
Fresh Processed All Fresh Processed All
(dollars) (dollars) (dollars) (1,000 dollars) (1,000 dollars) (1,000 dollars)
Massachusetts 2010 ........................ 2011 ........................ 2012 ........................ New Jersey
1
2010 ........................ 2011 ........................ 2012 ........................ Oregon
1
2010 ........................ 2011 ........................ 2012 ........................ Washington 2010 ........................ 2011 ........................ 2012 ........................ Wisconsin 2010 ........................ 2011 ........................ 2012 ........................ United States 2010 ........................ 2011 ........................ 2012 ........................
69.50 64.80 69.90
- - -
- - -
75.70 71.60 82.40
75.70 71.60 82.40
72.50 68.50 78.30
40.40 43.70 46.10
53.70 51.00 54.40
34.50 39.50 40.40
54.70 51.40 55.50
43.00 43.60 46.80
43.00 44.00 46.90
42.10 44.70 47.00
53.70 51.00 54.40
34.50 39.50 40.40
60.00 55.00 63.50
43.70 44.30 47.80
43.90 44.80 47.90
7,784 7,128 5,802
- - -
- - -
2,059 1,468 3,378
6,056 7,876
10,712
15,899 16,472 19,892
71,872 96,446 94,044
30,179 26,010 29,920
9,902 14,260 16,362
4,431 4,893 5,328
166,840 187,480 219,960
283,224 329,089 365,614
79,656
103,574 99,846
30,179 26,010 29,920
9,902 14,260 16,362
6,490 6,361 8,706
172,896 195,356 230,672
299,123 345,561 385,506
- Represents zero. 1 Small quantities of fresh cranberries are included in processed to avoid disclosure of individual operations.
2 Weighted average of co-op and independent sales. Co-op prices represent pool proceeds less returns for processing non-cranberry products, capital stock dividends, capital stock retains, and other retains.
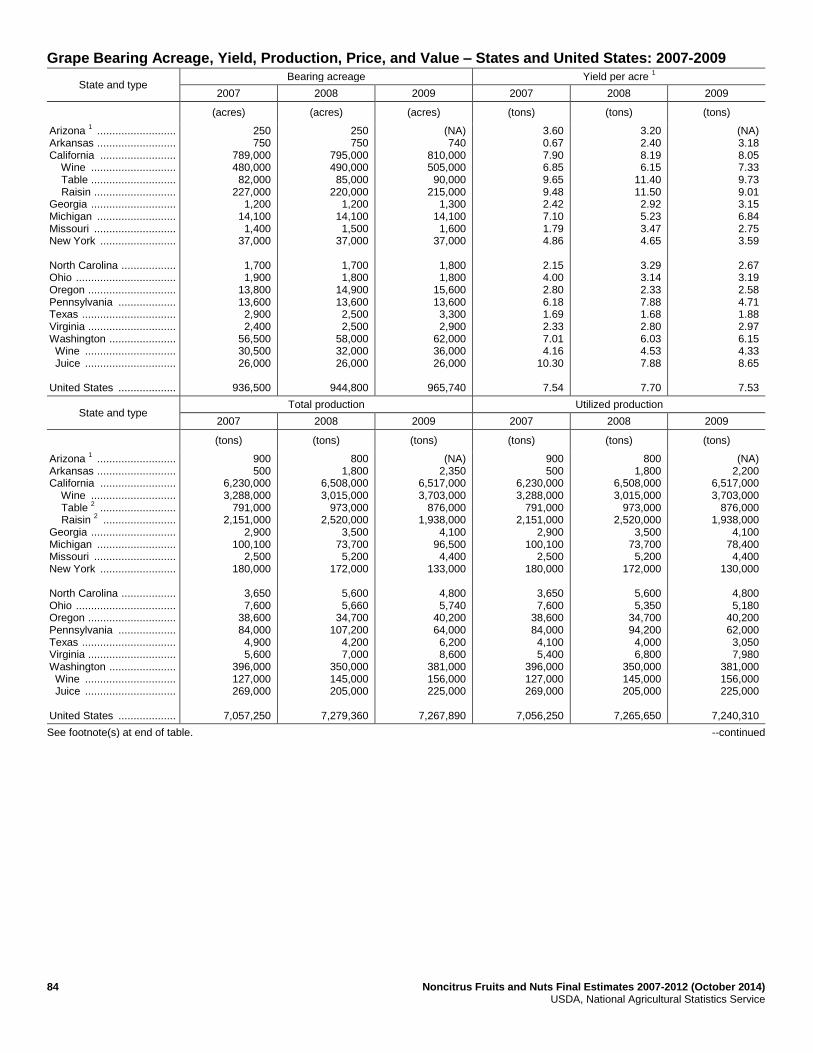
84 Noncitrus Fruits and Nuts Final Estimates 2007-2012 (October 2014) USDA, National Agricultural Statistics Service
Grape Bearing Acreage, Yield, Production, Price, and Value – States and United States: 2007-2009
State and type Bearing acreage Yield per acre
1
2007 2008 2009 2007 2008 2009
(acres) (acres) (acres) (tons) (tons) (tons)
Arizona 1 ..........................
Arkansas .......................... California ......................... Wine ............................ Table ............................ Raisin ........................... Georgia ............................ Michigan .......................... Missouri ........................... New York ......................... North Carolina .................. Ohio ................................. Oregon ............................. Pennsylvania ................... Texas ............................... Virginia ............................. Washington ...................... Wine .............................. Juice .............................. United States ...................
250 750
789,000 480,000 82,000
227,000 1,200
14,100 1,400
37,000
1,700 1,900
13,800 13,600 2,900 2,400
56,500 30,500 26,000
936,500
250 750
795,000 490,000 85,000
220,000 1,200
14,100 1,500
37,000
1,700 1,800
14,900 13,600 2,500 2,500
58,000 32,000 26,000
944,800
(NA) 740
810,000 505,000 90,000
215,000 1,300
14,100 1,600
37,000
1,800 1,800
15,600 13,600 3,300 2,900
62,000 36,000 26,000
965,740
3.60 0.67 7.90 6.85 9.65 9.48 2.42 7.10 1.79 4.86
2.15 4.00 2.80 6.18 1.69 2.33 7.01 4.16
10.30
7.54
3.20 2.40 8.19 6.15
11.40 11.50 2.92 5.23 3.47 4.65
3.29 3.14 2.33 7.88 1.68 2.80 6.03 4.53 7.88
7.70
(NA) 3.18 8.05 7.33 9.73 9.01 3.15 6.84 2.75 3.59
2.67 3.19 2.58 4.71 1.88 2.97 6.15 4.33 8.65
7.53
State and type Total production Utilized production
2007 2008 2009 2007 2008 2009
(tons) (tons) (tons) (tons) (tons) (tons)
Arizona 1 ..........................
Arkansas .......................... California ......................... Wine ............................ Table
2 .........................
Raisin 2 ........................
Georgia ............................ Michigan .......................... Missouri ........................... New York ......................... North Carolina .................. Ohio ................................. Oregon ............................. Pennsylvania ................... Texas ............................... Virginia ............................. Washington ...................... Wine .............................. Juice .............................. United States ...................
900 500
6,230,000 3,288,000
791,000 2,151,000
2,900 100,100
2,500 180,000
3,650 7,600
38,600 84,000 4,900 5,600
396,000 127,000 269,000
7,057,250
800 1,800
6,508,000 3,015,000
973,000 2,520,000
3,500 73,700 5,200
172,000
5,600 5,660
34,700 107,200
4,200 7,000
350,000 145,000 205,000
7,279,360
(NA) 2,350
6,517,000 3,703,000
876,000 1,938,000
4,100 96,500 4,400
133,000
4,800 5,740
40,200 64,000 6,200 8,600
381,000 156,000 225,000
7,267,890
900 500
6,230,000 3,288,000
791,000 2,151,000
2,900 100,100
2,500 180,000
3,650 7,600
38,600 84,000 4,100 5,400
396,000 127,000 269,000
7,056,250
800 1,800
6,508,000 3,015,000
973,000 2,520,000
3,500 73,700 5,200
172,000
5,600 5,350
34,700 94,200 4,000 6,800
350,000 145,000 205,000
7,265,650
(NA) 2,200
6,517,000 3,703,000
876,000 1,938,000
4,100 78,400 4,400
130,000
4,800 5,180
40,200 62,000 3,050 7,980
381,000 156,000 225,000
7,240,310
See footnote(s) at end of table. --continued

Noncitrus Fruits and Nuts Final Estimates 2007-2012 (October 2014) 85 USDA, National Agricultural Statistics Service
Grape Bearing Acreage, Yield, Production, Price, and Value – United States: 2007-2009 (continued)
State and type Price per ton Value of utilized production
2007 2008 2009 2007 2008 2009
Arizona 1 .................................
Arkansas ................................ California ................................ Wine ................................... Table
2 ................................
Raisin 2 ...............................
Georgia .................................. Michigan ................................. Missouri .................................. New York ................................ North Carolina ........................ Ohio ........................................ Oregon ................................... Pennsylvania .......................... Texas ..................................... Virginia ................................... Washington ............................ Wine ................................... Juice ................................... Other States
3 .........................
United States ..........................
(D) (D)
494.00 564.00 787.00 278.00
1,200.00 280.00 932.00 296.00
1,270.00
390.00 1,880.00
266.00 1,160.00 1,400.00
440.00 954.00 198.00
787.00
489.00
775.00 1,020.00
492.00 610.00 715.00 265.00
1,130.00 303.00 962.00 334.00 891.00
356.00
2,050.00 285.00
1,200.00 1,530.00
569.00 1,030.00
243.00
(NA)
497.00
(NA) 754.00 566.00 612.00 981.00 290.00
1,480.00 341.00 902.00 367.00 818.00
973.00
1,910.00 293.00
1,170.00 1,600.00
548.00 989.00 243.00
(NA)
566.00
(D) (D)
3,075,614 1,855,120
622,894 597,600
3,477 28,044 2,331
53,303 4,630
2,962
72,568 22,362 4,751 7,560
174,420 121,158 53,262
1,102
3,453,124
620 1,835
3,202,923 1,839,150
695,218 668,555
3,950 22,359 5,001
57,493 4,988
1,902
71,135 26,841 4,804
10,404 199,165 149,350 49,815
(NA)
3,613,420
(NA) 1,659
3,686,292 2,266,236
858,974 561,082
6,055 26,712 3,968
47,748 3,927
5,040
76,782 18,136 3,554
12,768 208,959 154,284 54,675
(NA)
4,101,600
(D) Withheld to avoid disclosing data for individual operations. (NA) Not available. 1
Estimates discontinued in 2009. 2
Fresh equivalent of dried and not dried. 3
Includes data withheld above and/or data for States not listed in this table.
Unutilized Grape Production – States and United States: 2007-2009
State Unharvested production Harvested not sold
2007 2008 2009 2007 2008 2009
(tons) (tons) (tons) (tons) (tons) (tons)
Arkansas ................................ Michigan ................................. New York ................................ Ohio ........................................ Pennsylvania .......................... Texas ..................................... Virginia ................................... United States ..........................
- - - - -
800 -
800
- - -
310 13,000
200 70
13,580
130 18,100 3,000
560 2,000 3,150
590
27,530
- - - - - -
200
200
- - - - - -
130
130
20 - - - - -
30
50
- Represents zero.
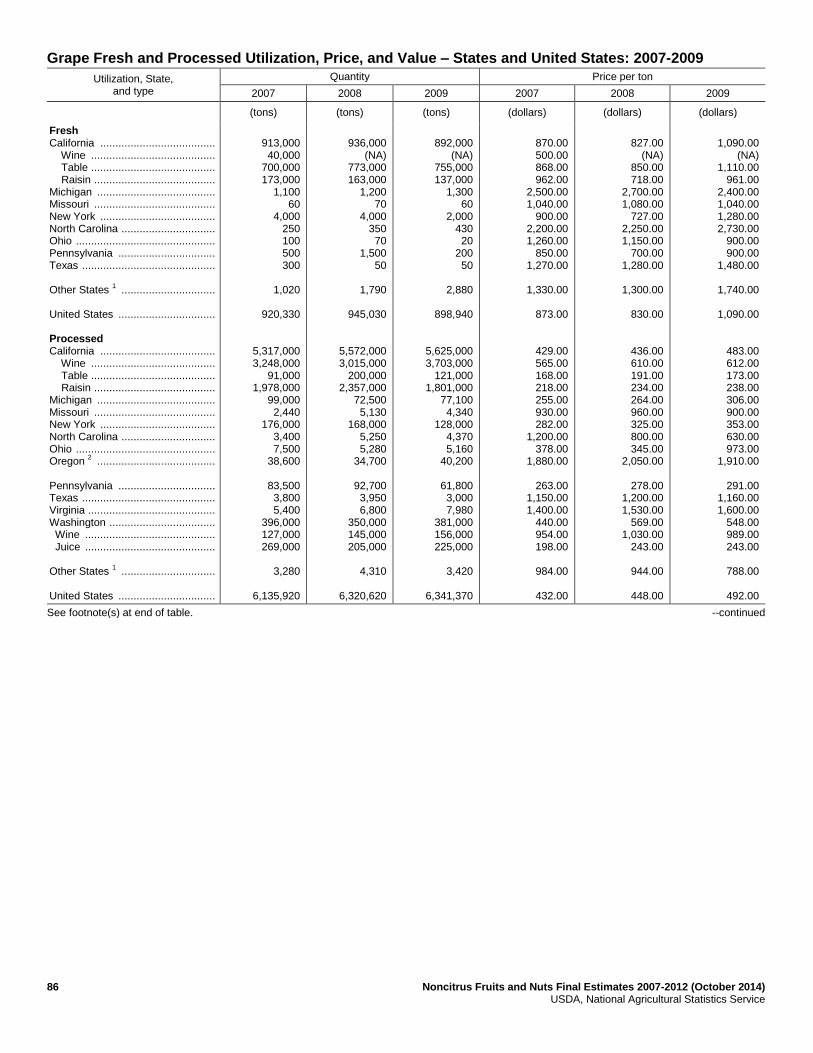
86 Noncitrus Fruits and Nuts Final Estimates 2007-2012 (October 2014) USDA, National Agricultural Statistics Service
Grape Fresh and Processed Utilization, Price, and Value – States and United States: 2007-2009
Utilization, State, and type
Quantity Price per ton
2007 2008 2009 2007 2008 2009
(tons) (tons) (tons) (dollars) (dollars) (dollars)
Fresh California ...................................... Wine ......................................... Table ......................................... Raisin ........................................ Michigan ....................................... Missouri ........................................ New York ...................................... North Carolina ............................... Ohio .............................................. Pennsylvania ................................ Texas ............................................ Other States
1 ...............................
United States ................................ Processed California ...................................... Wine ......................................... Table ......................................... Raisin ........................................ Michigan ....................................... Missouri ........................................ New York ...................................... North Carolina ............................... Ohio .............................................. Oregon
2 .......................................
Pennsylvania ................................ Texas ............................................ Virginia .......................................... Washington ................................... Wine ........................................... Juice ........................................... Other States
1 ...............................
United States ................................
913,000 40,000
700,000 173,000
1,100 60
4,000 250 100 500 300
1,020
920,330
5,317,000 3,248,000
91,000 1,978,000
99,000 2,440
176,000 3,400 7,500
38,600
83,500 3,800 5,400
396,000 127,000 269,000
3,280
6,135,920
936,000
(NA) 773,000 163,000
1,200 70
4,000 350 70
1,500 50
1,790
945,030
5,572,000 3,015,000
200,000 2,357,000
72,500 5,130
168,000 5,250 5,280
34,700
92,700 3,950 6,800
350,000 145,000 205,000
4,310
6,320,620
892,000
(NA) 755,000 137,000
1,300 60
2,000 430 20
200 50
2,880
898,940
5,625,000 3,703,000
121,000 1,801,000
77,100 4,340
128,000 4,370 5,160
40,200
61,800 3,000 7,980
381,000 156,000 225,000
3,420
6,341,370
870.00 500.00 868.00 962.00
2,500.00 1,040.00
900.00 2,200.00 1,260.00
850.00 1,270.00
1,330.00
873.00
429.00 565.00 168.00 218.00 255.00 930.00 282.00
1,200.00 378.00
1,880.00
263.00 1,150.00 1,400.00
440.00 954.00 198.00
984.00
432.00
827.00
(NA) 850.00 718.00
2,700.00 1,080.00
727.00 2,250.00 1,150.00
700.00 1,280.00
1,300.00
830.00
436.00 610.00 191.00 234.00 264.00 960.00 325.00 800.00 345.00
2,050.00
278.00 1,200.00 1,530.00
569.00 1,030.00
243.00
944.00
448.00
1,090.00
(NA) 1,110.00
961.00 2,400.00 1,040.00 1,280.00 2,730.00
900.00 900.00
1,480.00
1,740.00
1,090.00
483.00 612.00 173.00 238.00 306.00 900.00 353.00 630.00 973.00
1,910.00
291.00 1,160.00 1,600.00
548.00 989.00 243.00
788.00
492.00
See footnote(s) at end of table. --continued
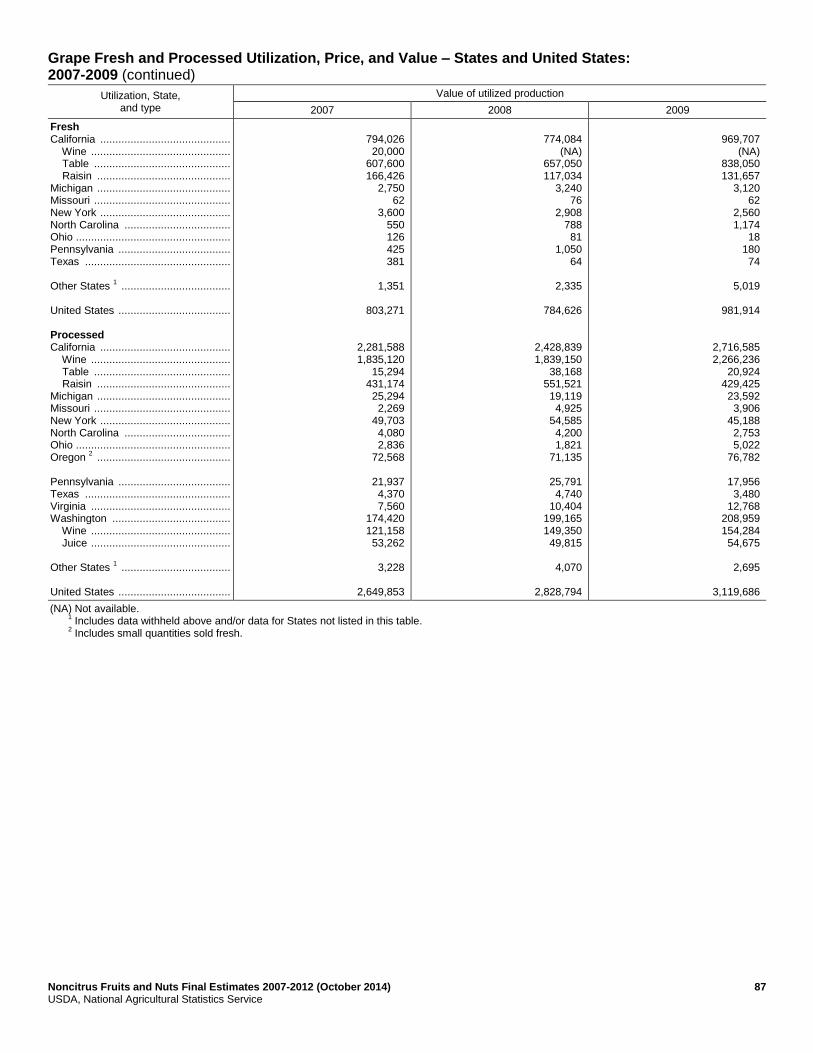
Noncitrus Fruits and Nuts Final Estimates 2007-2012 (October 2014) 87 USDA, National Agricultural Statistics Service
Grape Fresh and Processed Utilization, Price, and Value – States and United States: 2007-2009 (continued)
Utilization, State, and type
Value of utilized production
2007 2008 2009
Fresh California ........................................... Wine .............................................. Table ............................................. Raisin ............................................ Michigan ............................................ Missouri ............................................. New York ........................................... North Carolina ................................... Ohio ................................................... Pennsylvania ..................................... Texas ................................................ Other States
1 ....................................
United States ..................................... Processed California ........................................... Wine .............................................. Table ............................................. Raisin ............................................ Michigan ............................................ Missouri ............................................. New York ........................................... North Carolina ................................... Ohio ................................................... Oregon
2 ............................................
Pennsylvania ..................................... Texas ................................................ Virginia .............................................. Washington ....................................... Wine .............................................. Juice .............................................. Other States
1 ....................................
United States .....................................
794,026 20,000
607,600 166,426
2,750 62
3,600 550 126 425 381
1,351
803,271
2,281,588 1,835,120
15,294 431,174 25,294 2,269
49,703 4,080 2,836
72,568
21,937 4,370 7,560
174,420 121,158 53,262
3,228
2,649,853
774,084
(NA) 657,050 117,034
3,240 76
2,908 788 81
1,050 64
2,335
784,626
2,428,839 1,839,150
38,168 551,521 19,119 4,925
54,585 4,200 1,821
71,135
25,791 4,740
10,404 199,165 149,350 49,815
4,070
2,828,794
969,707
(NA) 838,050 131,657
3,120 62
2,560 1,174
18 180 74
5,019
981,914
2,716,585 2,266,236
20,924 429,425 23,592 3,906
45,188 2,753 5,022
76,782
17,956 3,480
12,768 208,959 154,284 54,675
2,695
3,119,686
(NA) Not available. 1
Includes data withheld above and/or data for States not listed in this table. 2
Includes small quantities sold fresh.
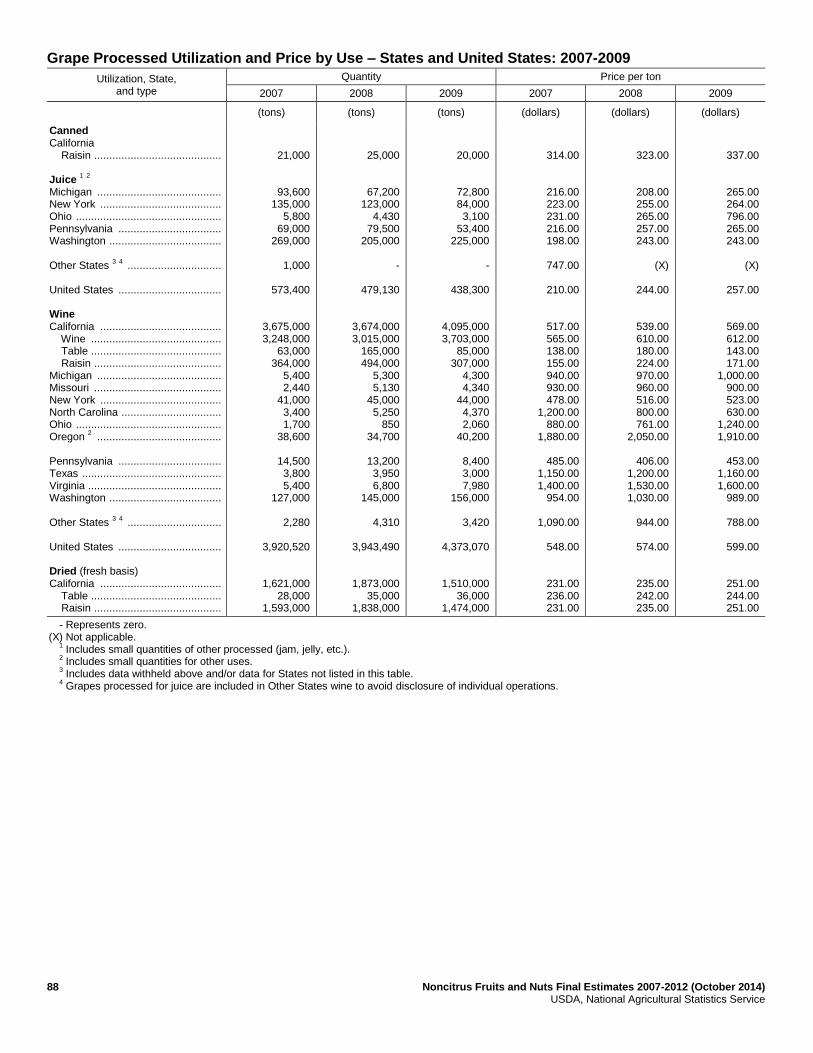
88 Noncitrus Fruits and Nuts Final Estimates 2007-2012 (October 2014) USDA, National Agricultural Statistics Service
Grape Processed Utilization and Price by Use – States and United States: 2007-2009
Utilization, State, and type
Quantity Price per ton
2007 2008 2009 2007 2008 2009
(tons) (tons) (tons) (dollars) (dollars) (dollars)
Canned California Raisin .......................................... Juice
1 2
Michigan ......................................... New York ........................................ Ohio ................................................ Pennsylvania .................................. Washington ..................................... Other States
3 4 ...............................
United States .................................. Wine California ........................................ Wine ........................................... Table ........................................... Raisin .......................................... Michigan ......................................... Missouri .......................................... New York ........................................ North Carolina ................................. Ohio ................................................ Oregon
2 .........................................
Pennsylvania .................................. Texas .............................................. Virginia ............................................ Washington ..................................... Other States
3 4 ...............................
United States .................................. Dried (fresh basis) California ........................................ Table ........................................... Raisin ..........................................
21,000
93,600 135,000
5,800 69,000
269,000
1,000
573,400
3,675,000 3,248,000
63,000 364,000
5,400 2,440
41,000 3,400 1,700
38,600
14,500 3,800 5,400
127,000
2,280
3,920,520
1,621,000 28,000
1,593,000
25,000
67,200 123,000
4,430 79,500
205,000
-
479,130
3,674,000 3,015,000
165,000 494,000
5,300 5,130
45,000 5,250
850 34,700
13,200 3,950 6,800
145,000
4,310
3,943,490
1,873,000 35,000
1,838,000
20,000
72,800 84,000 3,100
53,400 225,000
-
438,300
4,095,000 3,703,000
85,000 307,000
4,300 4,340
44,000 4,370 2,060
40,200
8,400 3,000 7,980
156,000
3,420
4,373,070
1,510,000 36,000
1,474,000
314.00
216.00 223.00 231.00 216.00 198.00
747.00
210.00
517.00 565.00 138.00 155.00 940.00 930.00 478.00
1,200.00 880.00
1,880.00
485.00 1,150.00 1,400.00
954.00
1,090.00
548.00
231.00 236.00 231.00
323.00
208.00 255.00 265.00 257.00 243.00
(X)
244.00
539.00 610.00 180.00 224.00 970.00 960.00 516.00 800.00 761.00
2,050.00
406.00 1,200.00 1,530.00 1,030.00
944.00
574.00
235.00 242.00 235.00
337.00
265.00 264.00 796.00 265.00 243.00
(X)
257.00
569.00 612.00 143.00 171.00
1,000.00 900.00 523.00 630.00
1,240.00 1,910.00
453.00
1,160.00 1,600.00
989.00
788.00
599.00
251.00 244.00 251.00
- Represents zero. (X) Not applicable. 1
Includes small quantities of other processed (jam, jelly, etc.). 2
Includes small quantities for other uses. 3
Includes data withheld above and/or data for States not listed in this table. 4
Grapes processed for juice are included in Other States wine to avoid disclosure of individual operations.
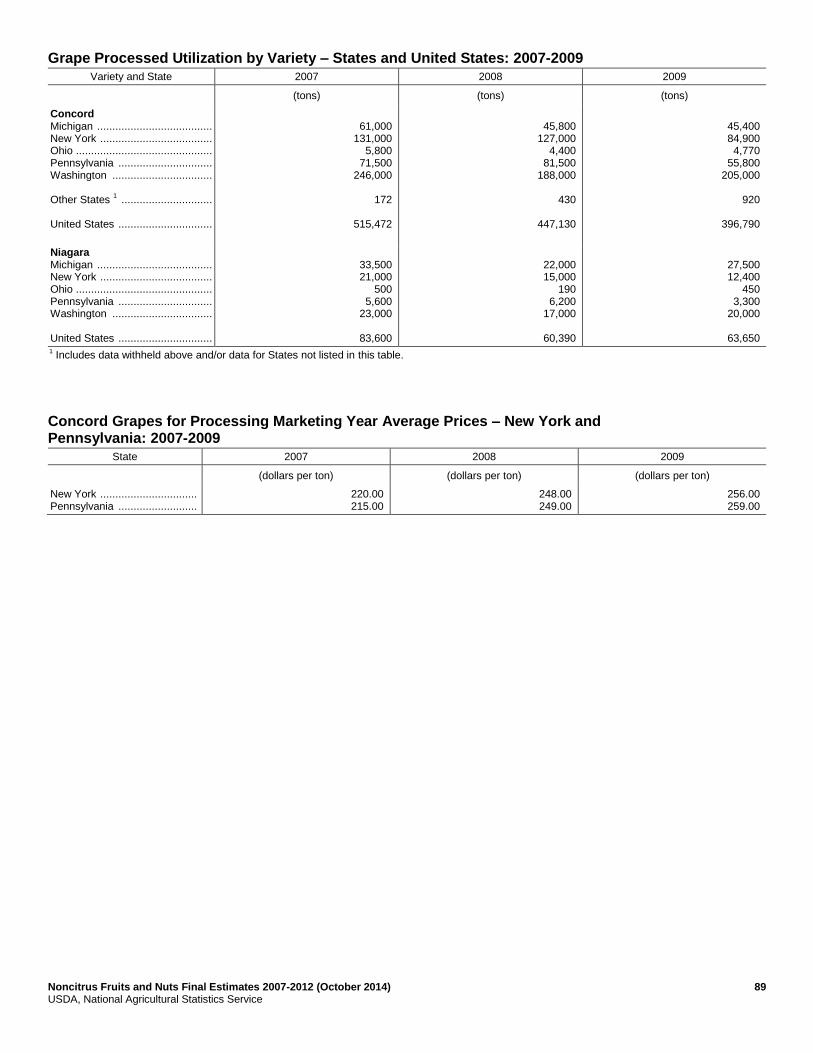
Noncitrus Fruits and Nuts Final Estimates 2007-2012 (October 2014) 89 USDA, National Agricultural Statistics Service
Grape Processed Utilization by Variety – States and United States: 2007-2009
Variety and State 2007 2008 2009
(tons) (tons) (tons)
Concord Michigan ...................................... New York ..................................... Ohio ............................................. Pennsylvania ............................... Washington ................................. Other States
1 ..............................
United States ...............................
61,000
131,000 5,800
71,500 246,000
172
515,472
45,800
127,000 4,400
81,500 188,000
430
447,130
45,400 84,900 4,770
55,800 205,000
920
396,790
Niagara Michigan ...................................... New York ..................................... Ohio ............................................. Pennsylvania ............................... Washington ................................. United States ...............................
33,500 21,000
500 5,600
23,000
83,600
22,000 15,000
190 6,200
17,000
60,390
27,500 12,400
450 3,300
20,000
63,650 1 Includes data withheld above and/or data for States not listed in this table.
Concord Grapes for Processing Marketing Year Average Prices – New York and Pennsylvania: 2007-2009
State 2007 2008 2009
(dollars per ton) (dollars per ton) (dollars per ton)
New York ................................ Pennsylvania ..........................
220.00 215.00
248.00 249.00
256.00 259.00

90 Noncitrus Fruits and Nuts Final Estimates 2007-2012 (October 2014) USDA, National Agricultural Statistics Service
Grape Bearing Acreage, Yield, Production, Price, and Value – States and United States: 2010-2012
State and type Bearing acreage Yield per acre
1
2010 2011 2012 2010 2011 2012
(acres) (acres) (acres) (tons) (tons) (tons)
Arkansas ................................. California ................................ Wine ................................... Table ................................... Raisin .................................. Georgia ................................... Michigan ................................. Missouri .................................. New York ................................ North Carolina ......................... Ohio ........................................ Oregon .................................... Pennsylvania .......................... Texas ...................................... Virginia .................................... Washington ............................. Wine ..................................... Juice ..................................... United States ..........................
730 835,000 525,000 100,000 210,000
1,300 14,000
1,700 37,000
1,900
1,700 16,900 13,600
3,000 2,900
65,000 39,000 26,000
994,730
730 845,000 540,000 100,000 205,000
1,500 14,000 1,700
37,000 1,900
1,700
17,500 13,600 4,400 2,900
67,000 41,000 26,000
1,008,930
720 855,000 550,000 105,000 200,000
1,800 13,900 1,700
35,000 2,100
1,700
18,000 13,600 4,400 3,100
67,000 43,000 24,000
1,018,020
3.49 8.06 6.84
10.10 10.20 3.54 2.57 3.00 4.76 2.74
2.04 1.85 6.10 2.97 2.45 5.17 4.10 6.77
7.47
1.99 7.86 6.20
10.30 11.00 2.33 6.74 3.06 5.08 2.74
4.40 2.37 6.69 1.21 2.65 4.72 3.46 6.69
7.34
2.15 8.01 7.31 9.75 9.05 2.61 2.75 2.71 3.29 2.36
3.14 2.56 4.49 2.18 2.60 5.67 4.37 8.00
7.40
State and type Total production Utilized production
2010 2011 2012 2010 2011 2012
(tons) (tons) (tons) (tons) (tons) (tons)
Arkansas ................................. California ................................ Wine ................................... Table
2 ................................
Raisin 2 ...............................
Georgia ................................... Michigan ................................. Missouri .................................. New York ................................ North Carolina ......................... Ohio ........................................ Oregon .................................... Pennsylvania .......................... Texas ...................................... Virginia .................................... Washington ............................. Wine ..................................... Juice ..................................... United States ..........................
2,550 6,733,000 3,589,000 1,011,000 2,133,000
4,600 36,000
5,100 176,000
5,200
3,470 31,200 83,000
8,900 7,100
336,000 160,000 176,000
7,432,120
1,450 6,642,000 3,347,000 1,032,000 2,263,000
3,500 94,400 5,200
188,000 5,200
7,480
41,500 91,000 5,330 7,680
316,000 142,000 174,000
7,408,740
1,550 6,852,000 4,018,000 1,024,000 1,810,000
4,700 38,200 4,600
115,000 4,950
5,335
46,000 61,000 9,570 8,060
380,000 188,000 192,000
7,530,965
2,450 6,733,000 3,589,000 1,011,000 2,133,000
4,300 36,000 5,100
176,000 4,950
3,050
31,200 82,000 8,500 6,940
336,000 160,000 176,000
7,429,490
1,350 6,642,000 3,347,000 1,032,000 2,263,000
3,300 93,400 5,200
188,000 4,980
7,330
41,500 87,000 4,610 6,700
316,000 142,000 174,000
7,401,370
1,300 6,852,000 4,018,000 1,024,000 1,810,000
4,000 38,200 4,600
112,000 4,800
5,293
46,000 59,000 9,450 7,800
380,000 188,000 192,000
7,524,443
See footnote(s) at end of table. --continued
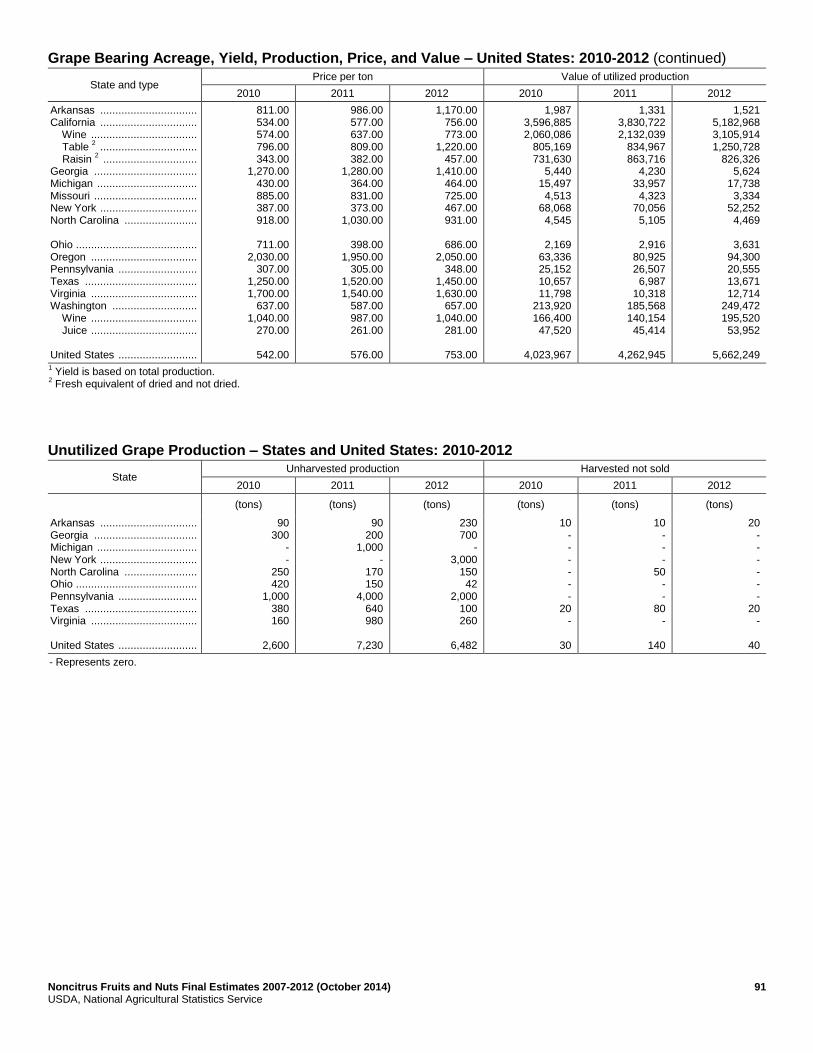
Noncitrus Fruits and Nuts Final Estimates 2007-2012 (October 2014) 91 USDA, National Agricultural Statistics Service
Grape Bearing Acreage, Yield, Production, Price, and Value – United States: 2010-2012 (continued)
State and type Price per ton Value of utilized production
2010 2011 2012 2010 2011 2012
Arkansas ................................ California ................................ Wine ................................... Table
2 ................................
Raisin 2 ...............................
Georgia .................................. Michigan ................................. Missouri .................................. New York ................................ North Carolina ........................ Ohio ........................................ Oregon ................................... Pennsylvania .......................... Texas ..................................... Virginia ................................... Washington ............................ Wine ................................... Juice ................................... United States ..........................
811.00 534.00 574.00 796.00 343.00
1,270.00 430.00 885.00 387.00 918.00
711.00
2,030.00 307.00
1,250.00 1,700.00
637.00 1,040.00
270.00
542.00
986.00 577.00 637.00 809.00 382.00
1,280.00 364.00 831.00 373.00
1,030.00
398.00 1,950.00
305.00 1,520.00 1,540.00
587.00 987.00 261.00
576.00
1,170.00 756.00 773.00
1,220.00 457.00
1,410.00 464.00 725.00 467.00 931.00
686.00
2,050.00 348.00
1,450.00 1,630.00
657.00 1,040.00
281.00
753.00
1,987 3,596,885 2,060,086
805,169 731,630
5,440 15,497 4,513
68,068 4,545
2,169
63,336 25,152 10,657 11,798
213,920 166,400 47,520
4,023,967
1,331 3,830,722 2,132,039
834,967 863,716
4,230 33,957 4,323
70,056 5,105
2,916
80,925 26,507 6,987
10,318 185,568 140,154 45,414
4,262,945
1,521 5,182,968 3,105,914 1,250,728
826,326 5,624
17,738 3,334
52,252 4,469
3,631
94,300 20,555 13,671 12,714
249,472 195,520 53,952
5,662,249
1 Yield is based on total production.
2 Fresh equivalent of dried and not dried.
Unutilized Grape Production – States and United States: 2010-2012
State Unharvested production Harvested not sold
2010 2011 2012 2010 2011 2012
(tons) (tons) (tons) (tons) (tons) (tons)
Arkansas ................................ Georgia .................................. Michigan ................................. New York ................................ North Carolina ........................ Ohio ........................................ Pennsylvania .......................... Texas ..................................... Virginia ................................... United States ..........................
90 300
- -
250 420
1,000 380 160
2,600
90 200
1,000 -
170 150
4,000 640 980
7,230
230 700
- 3,000
150 42
2,000 100 260
6,482
10 - - - - - -
20 -
30
10 - - -
50 - -
80 -
140
20 - - - - - -
20 -
40
- Represents zero.
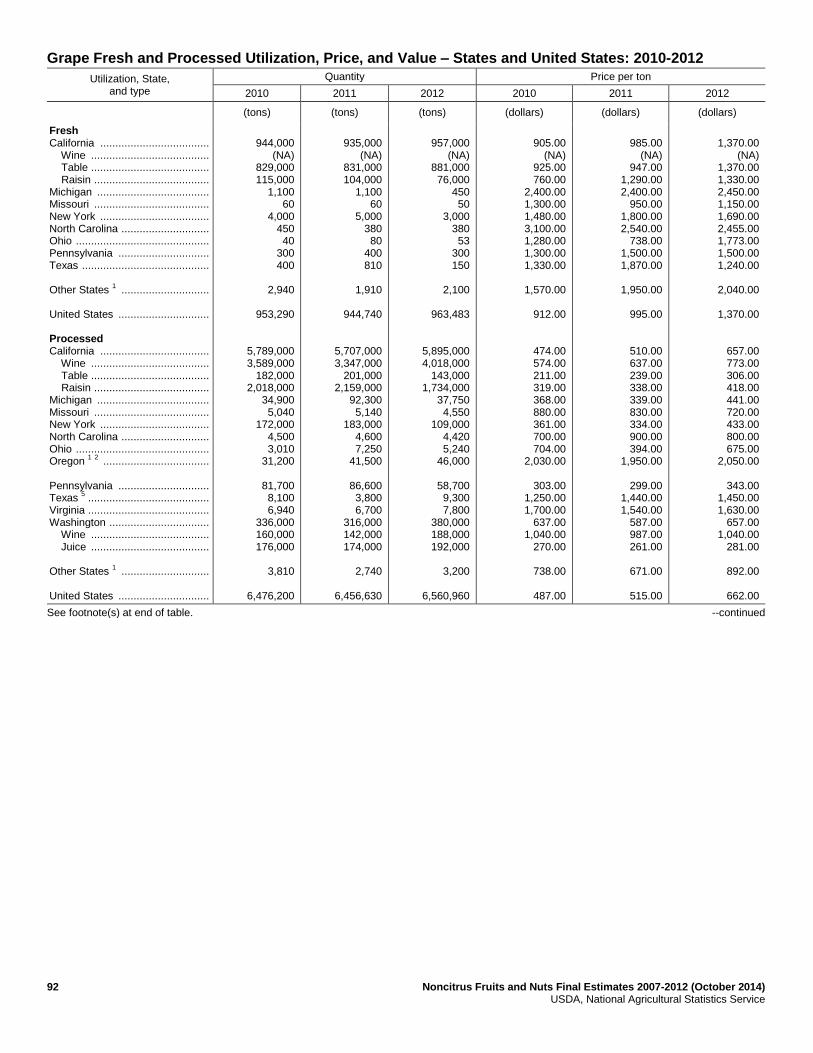
92 Noncitrus Fruits and Nuts Final Estimates 2007-2012 (October 2014) USDA, National Agricultural Statistics Service
Grape Fresh and Processed Utilization, Price, and Value – States and United States: 2010-2012
Utilization, State, and type
Quantity Price per ton
2010 2011 2012 2010 2011 2012
(tons) (tons) (tons) (dollars) (dollars) (dollars)
Fresh California .................................... Wine ....................................... Table ....................................... Raisin ...................................... Michigan ..................................... Missouri ...................................... New York .................................... North Carolina ............................. Ohio ............................................ Pennsylvania .............................. Texas .......................................... Other States
1 .............................
United States .............................. Processed California .................................... Wine ....................................... Table ....................................... Raisin ...................................... Michigan ..................................... Missouri ...................................... New York .................................... North Carolina ............................. Ohio ............................................ Oregon
1 2 ...................................
Pennsylvania .............................. Texas
5 ........................................
Virginia ........................................ Washington ................................. Wine ....................................... Juice ....................................... Other States
1 .............................
United States ..............................
944,000
(NA) 829,000 115,000
1,100 60
4,000 450 40
300 400
2,940
953,290
5,789,000 3,589,000
182,000 2,018,000
34,900 5,040
172,000 4,500 3,010
31,200
81,700 8,100 6,940
336,000 160,000 176,000
3,810
6,476,200
935,000
(NA) 831,000 104,000
1,100 60
5,000 380 80
400 810
1,910
944,740
5,707,000 3,347,000
201,000 2,159,000
92,300 5,140
183,000 4,600 7,250
41,500
86,600 3,800 6,700
316,000 142,000 174,000
2,740
6,456,630
957,000
(NA) 881,000 76,000
450 50
3,000 380 53
300 150
2,100
963,483
5,895,000 4,018,000
143,000 1,734,000
37,750 4,550
109,000 4,420 5,240
46,000
58,700 9,300 7,800
380,000 188,000 192,000
3,200
6,560,960
905.00
(NA) 925.00 760.00
2,400.00 1,300.00 1,480.00 3,100.00 1,280.00 1,300.00 1,330.00
1,570.00
912.00
474.00 574.00 211.00 319.00 368.00 880.00 361.00 700.00 704.00
2,030.00
303.00 1,250.00 1,700.00
637.00 1,040.00
270.00
738.00
487.00
985.00
(NA) 947.00
1,290.00 2,400.00
950.00 1,800.00 2,540.00
738.00 1,500.00 1,870.00
1,950.00
995.00
510.00 637.00 239.00 338.00 339.00 830.00 334.00 900.00 394.00
1,950.00
299.00 1,440.00 1,540.00
587.00 987.00 261.00
671.00
515.00
1,370.00
(NA) 1,370.00 1,330.00 2,450.00 1,150.00 1,690.00 2,455.00 1,773.00 1,500.00 1,240.00
2,040.00
1,370.00
657.00 773.00 306.00 418.00 441.00 720.00 433.00 800.00 675.00
2,050.00
343.00 1,450.00 1,630.00
657.00 1,040.00
281.00
892.00
662.00
See footnote(s) at end of table. --continued
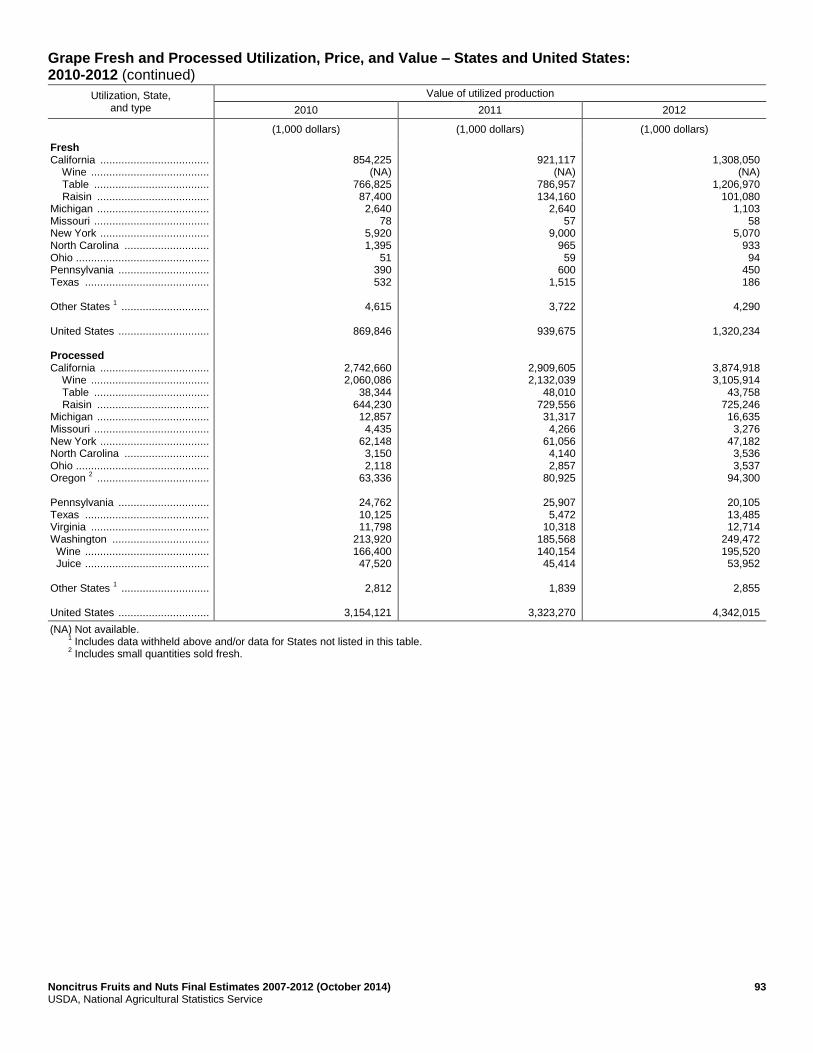
Noncitrus Fruits and Nuts Final Estimates 2007-2012 (October 2014) 93 USDA, National Agricultural Statistics Service
Grape Fresh and Processed Utilization, Price, and Value – States and United States: 2010-2012 (continued)
Utilization, State, and type
Value of utilized production
2010 2011 2012
(1,000 dollars) (1,000 dollars) (1,000 dollars)
Fresh California .................................... Wine ....................................... Table ...................................... Raisin ..................................... Michigan ..................................... Missouri ...................................... New York .................................... North Carolina ............................ Ohio ............................................ Pennsylvania .............................. Texas ......................................... Other States
1 .............................
United States .............................. Processed California .................................... Wine ....................................... Table ...................................... Raisin ..................................... Michigan ..................................... Missouri ...................................... New York .................................... North Carolina ............................ Ohio ............................................ Oregon
2 .....................................
Pennsylvania .............................. Texas ......................................... Virginia ....................................... Washington ................................ Wine ......................................... Juice ......................................... Other States
1 .............................
United States ..............................
854,225
(NA) 766,825 87,400 2,640
78 5,920 1,395
51 390 532
4,615
869,846
2,742,660 2,060,086
38,344 644,230 12,857 4,435
62,148 3,150 2,118
63,336
24,762 10,125 11,798
213,920 166,400 47,520
2,812
3,154,121
921,117
(NA) 786,957 134,160
2,640 57
9,000 965 59
600 1,515
3,722
939,675
2,909,605 2,132,039
48,010 729,556 31,317 4,266
61,056 4,140 2,857
80,925
25,907 5,472
10,318 185,568 140,154 45,414
1,839
3,323,270
1,308,050
(NA) 1,206,970
101,080 1,103
58 5,070
933 94
450 186
4,290
1,320,234
3,874,918 3,105,914
43,758 725,246 16,635 3,276
47,182 3,536 3,537
94,300
20,105 13,485 12,714
249,472 195,520 53,952
2,855
4,342,015
(NA) Not available. 1
Includes data withheld above and/or data for States not listed in this table. 2
Includes small quantities sold fresh.
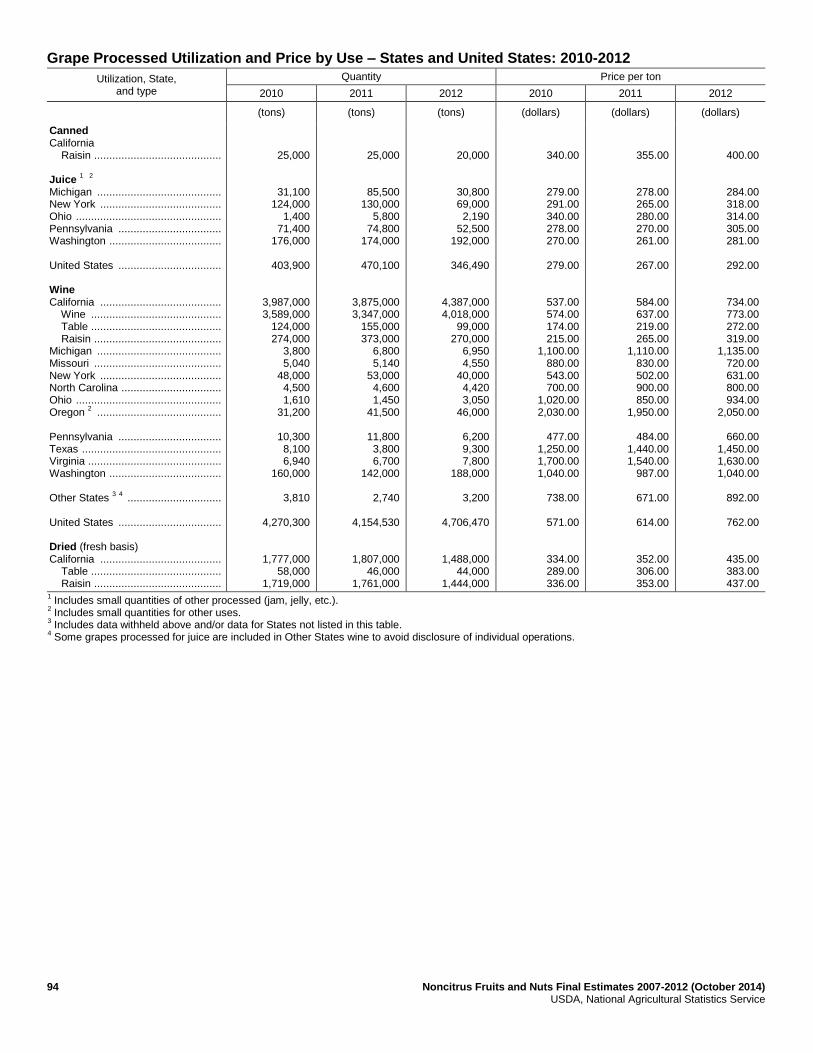
94 Noncitrus Fruits and Nuts Final Estimates 2007-2012 (October 2014) USDA, National Agricultural Statistics Service
Grape Processed Utilization and Price by Use – States and United States: 2010-2012
Utilization, State, and type
Quantity Price per ton
2010 2011 2012 2010 2011 2012
(tons) (tons) (tons) (dollars) (dollars) (dollars)
Canned California Raisin .......................................... Juice
1
2
Michigan ......................................... New York ........................................ Ohio ................................................ Pennsylvania .................................. Washington ..................................... United States .................................. Wine California ........................................ Wine ........................................... Table ........................................... Raisin .......................................... Michigan ......................................... Missouri .......................................... New York ........................................ North Carolina ................................. Ohio ................................................ Oregon
2 .........................................
Pennsylvania .................................. Texas .............................................. Virginia ............................................ Washington ..................................... Other States
3 4 ...............................
United States .................................. Dried (fresh basis) California ........................................ Table ........................................... Raisin ..........................................
25,000
31,100 124,000
1,400 71,400
176,000
403,900
3,987,000 3,589,000
124,000 274,000
3,800 5,040
48,000 4,500 1,610
31,200
10,300 8,100 6,940
160,000
3,810
4,270,300
1,777,000 58,000
1,719,000
25,000
85,500 130,000
5,800 74,800
174,000
470,100
3,875,000 3,347,000
155,000 373,000
6,800 5,140
53,000 4,600 1,450
41,500
11,800 3,800 6,700
142,000
2,740
4,154,530
1,807,000 46,000
1,761,000
20,000
30,800 69,000 2,190
52,500 192,000
346,490
4,387,000 4,018,000
99,000 270,000
6,950 4,550
40,000 4,420 3,050
46,000
6,200 9,300 7,800
188,000
3,200
4,706,470
1,488,000 44,000
1,444,000
340.00
279.00 291.00 340.00 278.00 270.00
279.00
537.00 574.00 174.00 215.00
1,100.00 880.00 543.00 700.00
1,020.00 2,030.00
477.00
1,250.00 1,700.00 1,040.00
738.00
571.00
334.00 289.00 336.00
355.00
278.00 265.00 280.00 270.00 261.00
267.00
584.00 637.00 219.00 265.00
1,110.00 830.00 502.00 900.00 850.00
1,950.00
484.00 1,440.00 1,540.00
987.00
671.00
614.00
352.00 306.00 353.00
400.00
284.00 318.00 314.00 305.00 281.00
292.00
734.00 773.00 272.00 319.00
1,135.00 720.00 631.00 800.00 934.00
2,050.00
660.00 1,450.00 1,630.00 1,040.00
892.00
762.00
435.00 383.00 437.00
1 Includes small quantities of other processed (jam, jelly, etc.).
2 Includes small quantities for other uses.
3 Includes data withheld above and/or data for States not listed in this table.
4 Some grapes processed for juice are included in Other States wine to avoid disclosure of individual operations.

Noncitrus Fruits and Nuts Final Estimates 2007-2012 (October 2014) 95 USDA, National Agricultural Statistics Service
Grape Processed Utilization by Variety – States and United States: 2010-2012
Variety and State 2010 2011 2012
(tons) (tons) (tons)
Concord Michigan ...................................... New York ..................................... Ohio ............................................. Pennsylvania ............................... Washington ................................. Other States
1 ..............................
United States ...............................
18,100
117,300 2,900
71,900 162,000
790
372,990
55,100
124,700 6,210
74,500 156,000
490
417,000
21,000 64,600 4,430
45,500 174,000
580
310,110
Niagara Michigan ...................................... New York ..................................... Ohio ............................................. Pennsylvania ............................... Washington ................................. United States ...............................
13,000 21,600
290 6,300
14,000
55,190
31,000 20,300
630 6,800
18,000
76,730
10,800 11,400
450 9,500
18,000
50,150 1 Includes data withheld above and/or for States not listed in this table.
Concord Grapes for Processing Marketing Year Average Prices – New York and Pennsylvania: 2010-2012
State 2010 2011 2012
(dollars per ton) (dollars per ton) (dollars per ton)
New York ................................ Pennsylvania ..........................
287.00 274.00
262.00 268.00
316.00 301.00
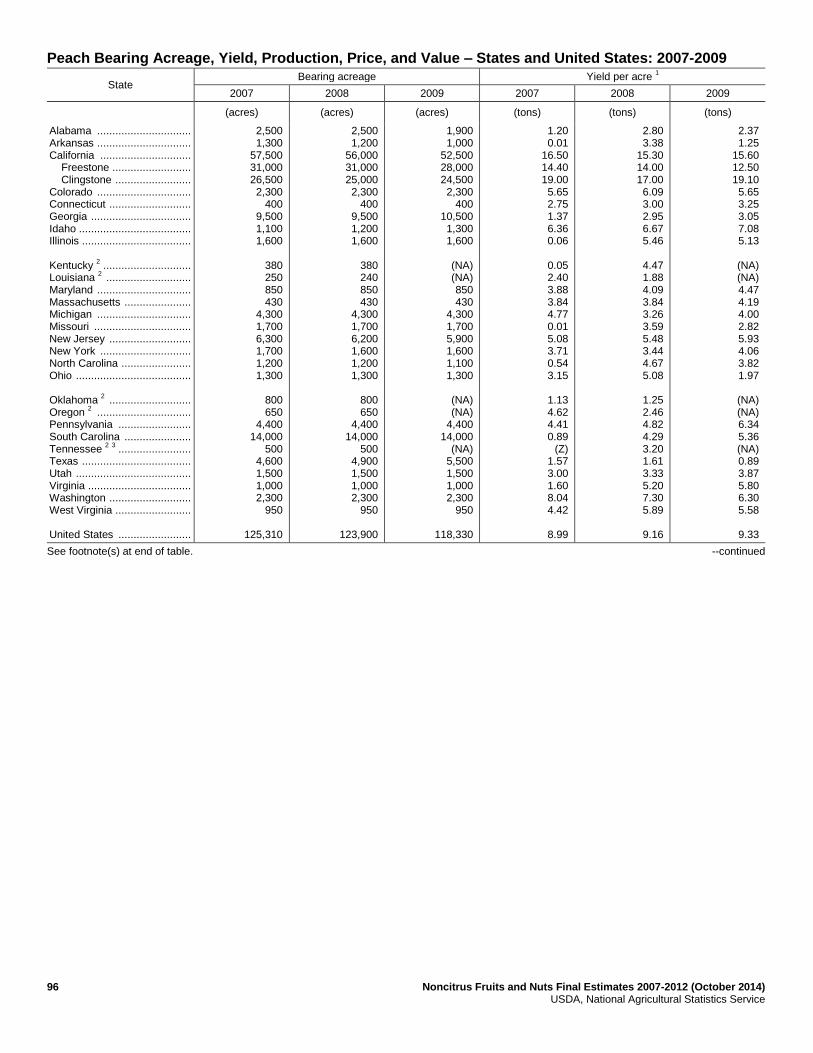
96 Noncitrus Fruits and Nuts Final Estimates 2007-2012 (October 2014) USDA, National Agricultural Statistics Service
Peach Bearing Acreage, Yield, Production, Price, and Value – States and United States: 2007-2009
State Bearing acreage Yield per acre
1
2007 2008 2009 2007 2008 2009
(acres) (acres) (acres) (tons) (tons) (tons)
Alabama ............................... Arkansas ............................... California .............................. Freestone .......................... Clingstone ......................... Colorado ............................... Connecticut ........................... Georgia ................................. Idaho ..................................... Illinois .................................... Kentucky
2 .............................
Louisiana 2 ............................
Maryland ............................... Massachusetts ...................... Michigan ............................... Missouri ................................ New Jersey ........................... New York .............................. North Carolina ....................... Ohio ...................................... Oklahoma
2 ...........................
Oregon 2 ...............................
Pennsylvania ........................ South Carolina ...................... Tennessee
2 3 ........................
Texas .................................... Utah ...................................... Virginia .................................. Washington ........................... West Virginia ......................... United States ........................
2,500 1,300
57,500 31,000 26,500 2,300
400 9,500 1,100 1,600
380 250 850 430
4,300 1,700 6,300 1,700 1,200 1,300
800 650
4,400 14,000
500 4,600 1,500 1,000 2,300
950
125,310
2,500 1,200
56,000 31,000 25,000 2,300
400 9,500 1,200 1,600
380 240 850 430
4,300 1,700 6,200 1,600 1,200 1,300
800 650
4,400 14,000
500 4,900 1,500 1,000 2,300
950
123,900
1,900 1,000
52,500 28,000 24,500 2,300
400 10,500 1,300 1,600
(NA) (NA) 850 430
4,300 1,700 5,900 1,600 1,100 1,300
(NA) (NA)
4,400 14,000
(NA) 5,500 1,500 1,000 2,300
950
118,330
1.20 0.01
16.50 14.40 19.00 5.65 2.75 1.37 6.36 0.06
0.05 2.40 3.88 3.84 4.77 0.01 5.08 3.71 0.54 3.15
1.13 4.62 4.41 0.89
(Z) 1.57 3.00 1.60 8.04 4.42
8.99
2.80 3.38
15.30 14.00 17.00 6.09 3.00 2.95 6.67 5.46
4.47 1.88 4.09 3.84 3.26 3.59 5.48 3.44 4.67 5.08
1.25 2.46 4.82 4.29 3.20 1.61 3.33 5.20 7.30 5.89
9.16
2.37 1.25
15.60 12.50 19.10 5.65 3.25 3.05 7.08 5.13
(NA) (NA) 4.47 4.19 4.00 2.82 5.93 4.06 3.82 1.97
(NA) (NA) 6.34 5.36 (NA) 0.89 3.87 5.80 6.30 5.58
9.33
See footnote(s) at end of table. --continued
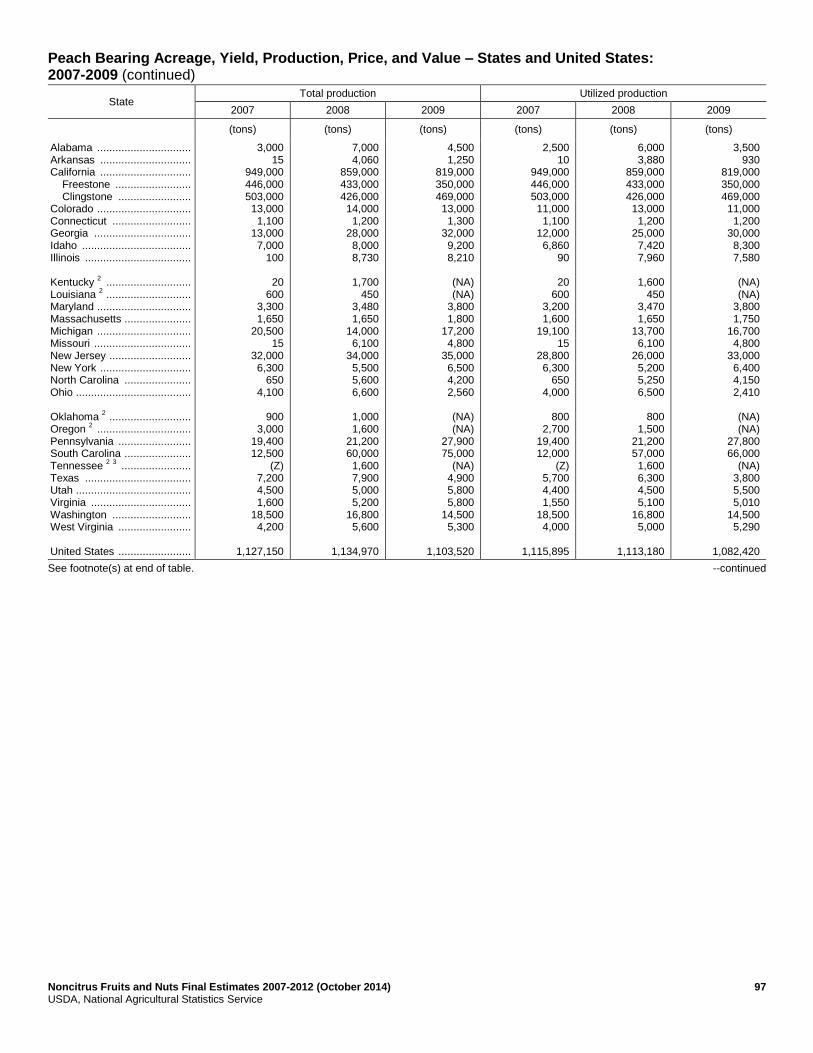
Noncitrus Fruits and Nuts Final Estimates 2007-2012 (October 2014) 97 USDA, National Agricultural Statistics Service
Peach Bearing Acreage, Yield, Production, Price, and Value – States and United States: 2007-2009 (continued)
State Total production Utilized production
2007 2008 2009 2007 2008 2009
(tons) (tons) (tons) (tons) (tons) (tons)
Alabama ............................... Arkansas .............................. California .............................. Freestone ......................... Clingstone ........................ Colorado ............................... Connecticut .......................... Georgia ................................ Idaho .................................... Illinois ................................... Kentucky
2 ............................
Louisiana 2 ............................
Maryland ............................... Massachusetts ...................... Michigan ............................... Missouri ................................ New Jersey ........................... New York .............................. North Carolina ...................... Ohio ...................................... Oklahoma
2 ...........................
Oregon 2 ...............................
Pennsylvania ........................ South Carolina ...................... Tennessee
2 3 .......................
Texas ................................... Utah ...................................... Virginia ................................. Washington .......................... West Virginia ........................ United States ........................
3,000 15
949,000 446,000 503,000 13,000 1,100
13,000 7,000
100
20 600
3,300 1,650
20,500 15
32,000 6,300
650 4,100
900
3,000 19,400 12,500
(Z) 7,200 4,500 1,600
18,500 4,200
1,127,150
7,000 4,060
859,000 433,000 426,000 14,000 1,200
28,000 8,000 8,730
1,700
450 3,480 1,650
14,000 6,100
34,000 5,500 5,600 6,600
1,000 1,600
21,200 60,000 1,600 7,900 5,000 5,200
16,800 5,600
1,134,970
4,500 1,250
819,000 350,000 469,000 13,000 1,300
32,000 9,200 8,210
(NA) (NA)
3,800 1,800
17,200 4,800
35,000 6,500 4,200 2,560
(NA) (NA)
27,900 75,000
(NA) 4,900 5,800 5,800
14,500 5,300
1,103,520
2,500 10
949,000 446,000 503,000 11,000 1,100
12,000 6,860
90
20 600
3,200 1,600
19,100 15
28,800 6,300
650 4,000
800
2,700 19,400 12,000
(Z) 5,700 4,400 1,550
18,500 4,000
1,115,895
6,000 3,880
859,000 433,000 426,000 13,000 1,200
25,000 7,420 7,960
1,600
450 3,470 1,650
13,700 6,100
26,000 5,200 5,250 6,500
800
1,500 21,200 57,000 1,600 6,300 4,500 5,100
16,800 5,000
1,113,180
3,500 930
819,000 350,000 469,000 11,000 1,200
30,000 8,300 7,580
(NA) (NA)
3,800 1,750
16,700 4,800
33,000 6,400 4,150 2,410
(NA) (NA)
27,800 66,000
(NA) 3,800 5,500 5,010
14,500 5,290
1,082,420
See footnote(s) at end of table. --continued
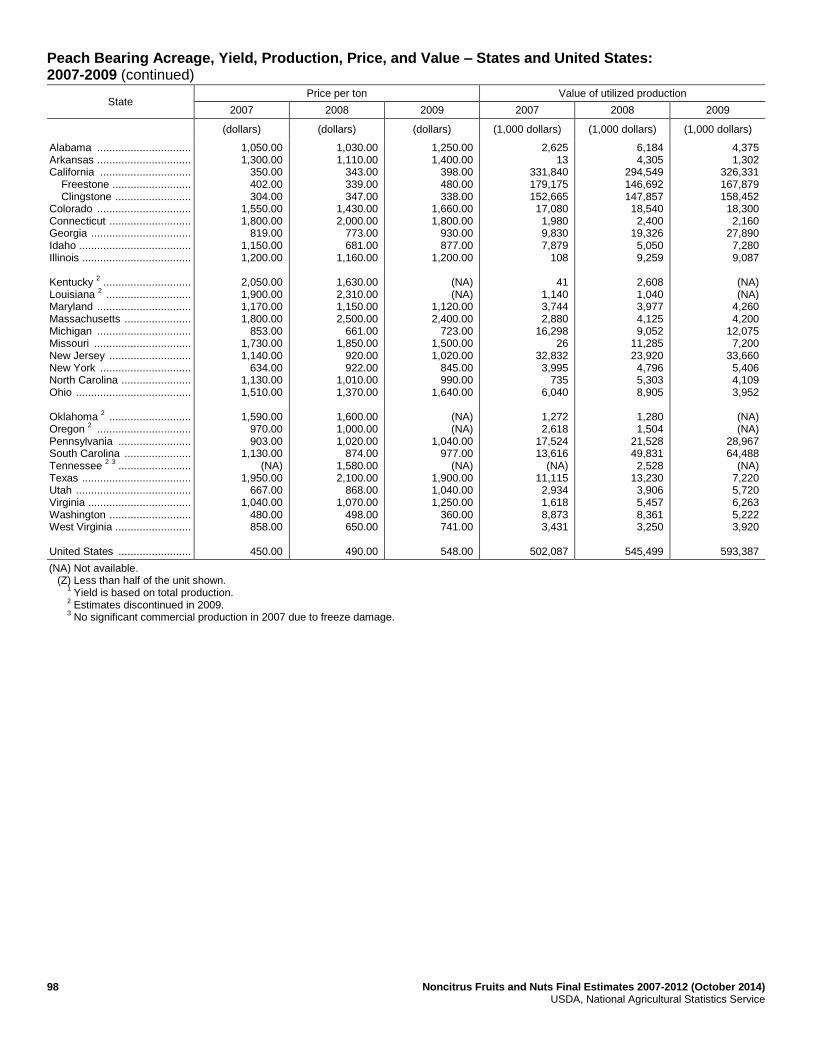
98 Noncitrus Fruits and Nuts Final Estimates 2007-2012 (October 2014) USDA, National Agricultural Statistics Service
Peach Bearing Acreage, Yield, Production, Price, and Value – States and United States: 2007-2009 (continued)
State Price per ton Value of utilized production
2007 2008 2009 2007 2008 2009
(dollars) (dollars) (dollars) (1,000 dollars) (1,000 dollars) (1,000 dollars)
Alabama ............................... Arkansas ............................... California .............................. Freestone .......................... Clingstone ......................... Colorado ............................... Connecticut ........................... Georgia ................................. Idaho ..................................... Illinois .................................... Kentucky
2 .............................
Louisiana 2 ............................
Maryland ............................... Massachusetts ...................... Michigan ............................... Missouri ................................ New Jersey ........................... New York .............................. North Carolina ....................... Ohio ...................................... Oklahoma
2 ...........................
Oregon 2 ...............................
Pennsylvania ........................ South Carolina ...................... Tennessee
2 3 ........................
Texas .................................... Utah ...................................... Virginia .................................. Washington ........................... West Virginia ......................... United States ........................
1,050.00 1,300.00
350.00 402.00 304.00
1,550.00 1,800.00
819.00 1,150.00 1,200.00
2,050.00 1,900.00 1,170.00 1,800.00
853.00 1,730.00 1,140.00
634.00 1,130.00 1,510.00
1,590.00
970.00 903.00
1,130.00 (NA)
1,950.00 667.00
1,040.00 480.00 858.00
450.00
1,030.00 1,110.00
343.00 339.00 347.00
1,430.00 2,000.00
773.00 681.00
1,160.00
1,630.00 2,310.00 1,150.00 2,500.00
661.00 1,850.00
920.00 922.00
1,010.00 1,370.00
1,600.00 1,000.00 1,020.00
874.00 1,580.00 2,100.00
868.00 1,070.00
498.00 650.00
490.00
1,250.00 1,400.00
398.00 480.00 338.00
1,660.00 1,800.00
930.00 877.00
1,200.00
(NA) (NA)
1,120.00 2,400.00
723.00 1,500.00 1,020.00
845.00 990.00
1,640.00
(NA) (NA)
1,040.00 977.00
(NA) 1,900.00 1,040.00 1,250.00
360.00 741.00
548.00
2,625 13
331,840 179,175 152,665 17,080 1,980 9,830 7,879
108
41 1,140 3,744 2,880
16,298 26
32,832 3,995
735 6,040
1,272 2,618
17,524 13,616
(NA) 11,115 2,934 1,618 8,873 3,431
502,087
6,184 4,305
294,549 146,692 147,857 18,540 2,400
19,326 5,050 9,259
2,608 1,040 3,977 4,125 9,052
11,285 23,920 4,796 5,303 8,905
1,280 1,504
21,528 49,831 2,528
13,230 3,906 5,457 8,361 3,250
545,499
4,375 1,302
326,331 167,879 158,452 18,300 2,160
27,890 7,280 9,087
(NA) (NA)
4,260 4,200
12,075 7,200
33,660 5,406 4,109 3,952
(NA) (NA)
28,967 64,488
(NA) 7,220 5,720 6,263 5,222 3,920
593,387
(NA) Not available. (Z) Less than half of the unit shown. 1
Yield is based on total production. 2
Estimates discontinued in 2009. 3
No significant commercial production in 2007 due to freeze damage.

Noncitrus Fruits and Nuts Final Estimates 2007-2012 (October 2014) 99 USDA, National Agricultural Statistics Service
Peach Utilized Production, Price and Value by Utilization – States and United States: 2007-2009
Use and State Quantity Price per unit
2007 2008 2009 2007 2008 2009
(tons) (tons) (tons) (dollars) (dollars) (dollars)
Fresh Alabama ............................................... California, Freestone ............................ Connecticut .......................................... Georgia ................................................ Illinois ................................................... Kentucky
1 ............................................
Louisiana 1 ............................................
Maryland ............................................... Massachusetts ...................................... Missouri ................................................ New York .............................................. Ohio ...................................................... Oklahoma
1 ...........................................
South Carolina ...................................... Tennessee
1 2 .......................................
Texas ................................................... Virginia ................................................. West Virginia ........................................ Other States
3 .......................................
United States ........................................
2,500
297,000 1,100
11,500 90 20
600 3,200 1,600
15
3,000 4,000
800 11,000
(Z) 5,700 1,550 4,000
93,510
441,185
(D)
299,000 1,200
24,000 (D)
1,600 450
3,360 1,650
6,100
(D) 6,500
800 53,000 1,600 6,300 5,100 5,000
114,140
529,800
(D)
261,000 1,200
28,000 (D)
(NA) (NA)
(D) 1,750
4,800
(D) 2,410 (NA)
63,000 (NA)
3,800 5,010 5,290
126,660
502,920
1,050.00
498.00 1,800.00
840.00 1,200.00 2,050.00 1,900.00 1,170.00 1,800.00
1,730.00
754.00 1,510.00 1,590.00 1,200.00
(Z) 1,950.00 1,040.00
858.00
1,090.00
706.00
(D)
395.00 2,000.00
792.00 (D)
1,630.00 2,310.00 1,170.00 2,500.00
1,850.00
(D) 1,370.00 1,600.00
915.00 1,580.00 2,100.00 1,070.00
650.00
1,020.00
684.00
(D)
563.00 1,800.00
971.00 (D)
(NA) (NA)
(D) 2,400.00
1,500.00
(D) 1,640.00
(NA) 1,010.00
(NA) 1,900.00 1,250.00
741.00
1,070.00
811.00
Processed California Clingstone ........................................ Freestone
4 .......................................
Georgia ................................................ Maryland ............................................... New York .............................................. South Carolina ...................................... Other States
3 .......................................
United States
5 ......................................
503,000 149,000
500 (D)
3,300 1,000
17,910
674,710
426,000 134,000
1,000 110 (D)
4,000
18,590
583,700
469,000 89,000 2,000
(D) (D)
3,000
16,690
579,690
304.00 224.00 340.00
(D) 525.00 416.00
250.00
283.00
347.00 226.00 318.00 418.00
(D) 334.00
297.00
315.00
338.00 252.00 351.00
(D) (D)
286.00
302.00
321.00
See footnote(s) at end of table. --continued
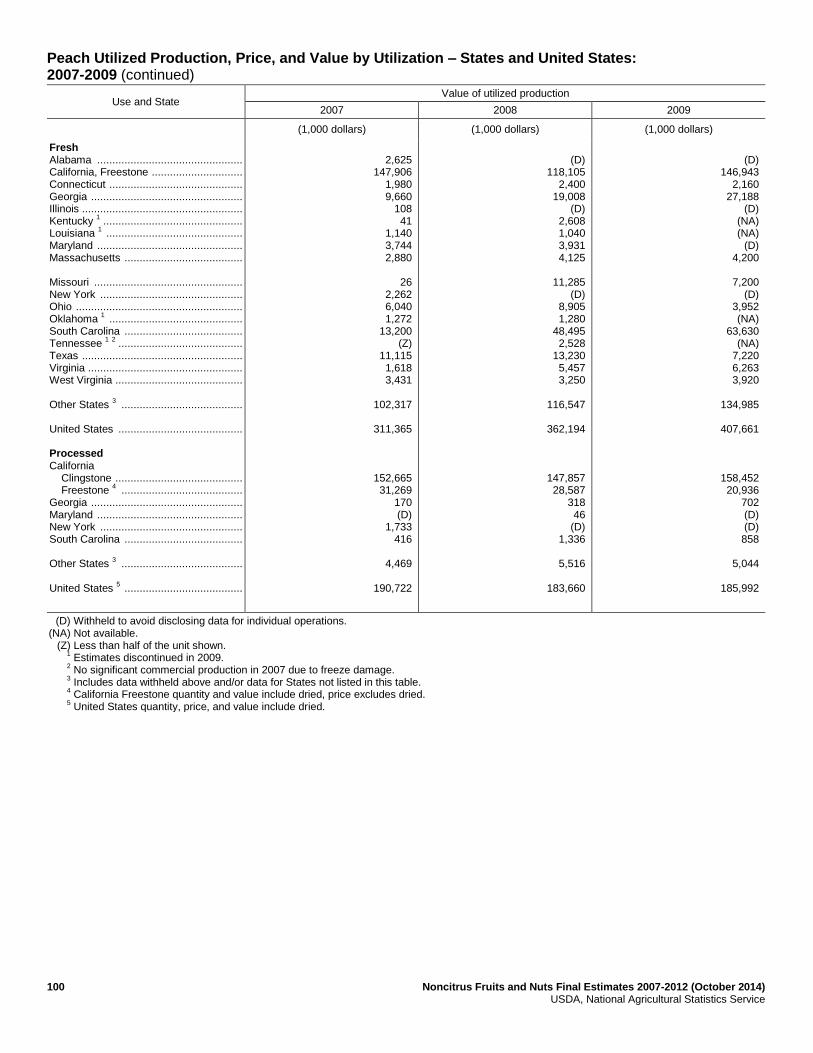
100 Noncitrus Fruits and Nuts Final Estimates 2007-2012 (October 2014) USDA, National Agricultural Statistics Service
Peach Utilized Production, Price, and Value by Utilization – States and United States: 2007-2009 (continued)
Use and State Value of utilized production
2007 2008 2009
(1,000 dollars) (1,000 dollars) (1,000 dollars)
Fresh Alabama ................................................ California, Freestone .............................. Connecticut ............................................ Georgia .................................................. Illinois ..................................................... Kentucky
1 ..............................................
Louisiana 1 .............................................
Maryland ................................................ Massachusetts ....................................... Missouri ................................................. New York ............................................... Ohio ....................................................... Oklahoma
1 ............................................
South Carolina ....................................... Tennessee
1 2 .........................................
Texas ..................................................... Virginia ................................................... West Virginia .......................................... Other States
3 ........................................
United States ......................................... Processed California Clingstone .......................................... Freestone
4 ........................................
Georgia .................................................. Maryland ................................................ New York ............................................... South Carolina ....................................... Other States
3 ........................................
United States
5 .......................................
2,625
147,906 1,980 9,660
108 41
1,140 3,744 2,880
26
2,262 6,040 1,272
13,200 (Z)
11,115 1,618 3,431
102,317
311,365
152,665 31,269
170 (D)
1,733 416
4,469
190,722
(D)
118,105 2,400
19,008 (D)
2,608 1,040 3,931 4,125
11,285
(D) 8,905 1,280
48,495 2,528
13,230 5,457 3,250
116,547
362,194
147,857 28,587
318 46
(D) 1,336
5,516
183,660
(D)
146,943 2,160
27,188 (D)
(NA) (NA)
(D) 4,200
7,200
(D) 3,952 (NA)
63,630 (NA)
7,220 6,263 3,920
134,985
407,661
158,452 20,936
702 (D) (D) 858
5,044
185,992
(D) Withheld to avoid disclosing data for individual operations. (NA) Not available. (Z) Less than half of the unit shown. 1
Estimates discontinued in 2009. 2
No significant commercial production in 2007 due to freeze damage. 3
Includes data withheld above and/or data for States not listed in this table. 4
California Freestone quantity and value include dried, price excludes dried. 5
United States quantity, price, and value include dried.
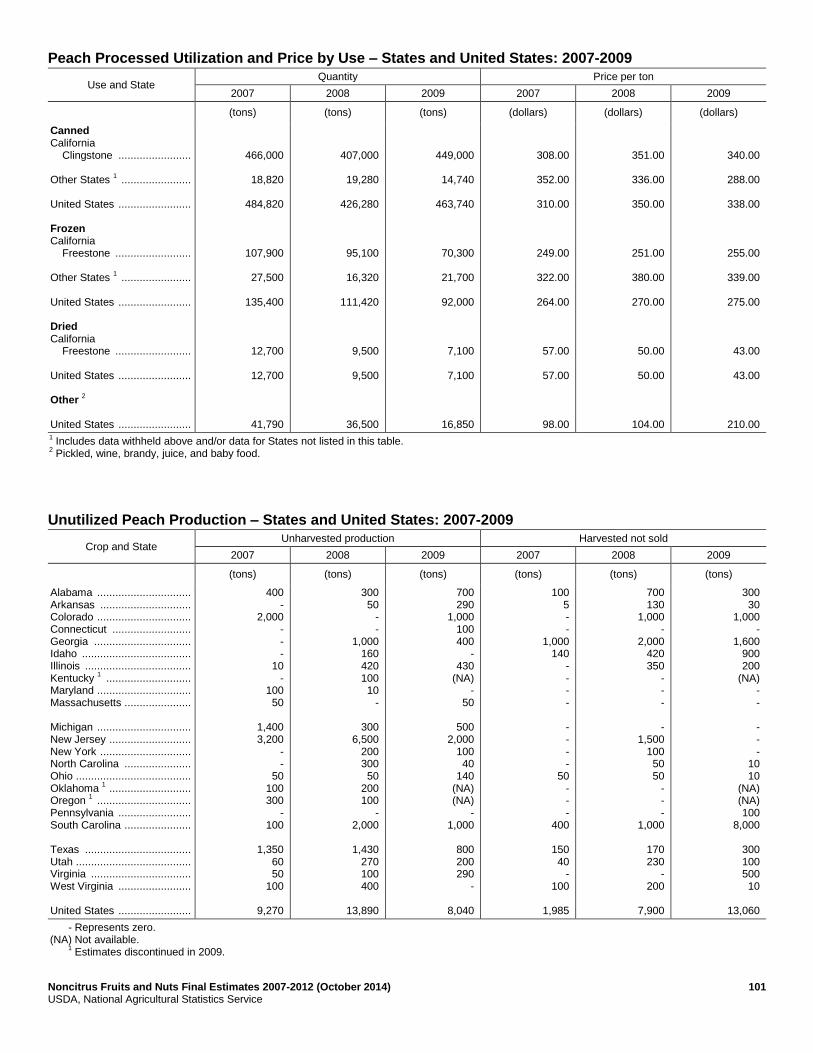
Noncitrus Fruits and Nuts Final Estimates 2007-2012 (October 2014) 101 USDA, National Agricultural Statistics Service
Peach Processed Utilization and Price by Use – States and United States: 2007-2009
Use and State Quantity Price per ton
2007 2008 2009 2007 2008 2009
(tons) (tons) (tons) (dollars) (dollars) (dollars)
Canned California Clingstone ........................ Other States
1 .......................
United States ........................ Frozen California Freestone ......................... Other States
1 .......................
United States ........................ Dried California Freestone ......................... United States ........................ Other
2
United States ........................
466,000
18,820
484,820
107,900
27,500
135,400
12,700
12,700
41,790
407,000
19,280
426,280
95,100
16,320
111,420
9,500
9,500
36,500
449,000
14,740
463,740
70,300
21,700
92,000
7,100
7,100
16,850
308.00
352.00
310.00
249.00
322.00
264.00
57.00
57.00
98.00
351.00
336.00
350.00
251.00
380.00
270.00
50.00
50.00
104.00
340.00
288.00
338.00
255.00
339.00
275.00
43.00
43.00
210.00 1 Includes data withheld above and/or data for States not listed in this table.
2 Pickled, wine, brandy, juice, and baby food.
Unutilized Peach Production – States and United States: 2007-2009
Crop and State Unharvested production Harvested not sold
2007 2008 2009 2007 2008 2009
(tons) (tons) (tons) (tons) (tons) (tons)
Alabama ............................... Arkansas .............................. Colorado ............................... Connecticut .......................... Georgia ................................ Idaho .................................... Illinois ................................... Kentucky
1 ............................
Maryland ............................... Massachusetts ...................... Michigan ............................... New Jersey ........................... New York .............................. North Carolina ...................... Ohio ...................................... Oklahoma
1 ...........................
Oregon 1 ...............................
Pennsylvania ........................ South Carolina ...................... Texas ................................... Utah ...................................... Virginia ................................. West Virginia ........................ United States ........................
400 -
2,000 - - -
10 -
100 50
1,400 3,200
- -
50 100 300
- 100
1,350
60 50
100
9,270
300 50
- -
1,000 160 420 100 10
-
300 6,500
200 300 50
200 100
- 2,000
1,430
270 100 400
13,890
700 290
1,000 100 400
- 430
(NA) -
50
500 2,000
100 40
140 (NA) (NA)
- 1,000
800 200 290
-
8,040
100 5 - -
1,000 140
- - - -
- - - -
50 - - -
400
150 40
- 100
1,985
700 130
1,000 -
2,000 420 350
- - -
- 1,500
100 50 50
- - -
1,000
170 230
- 200
7,900
300 30
1,000 -
1,600 900 200
(NA) - -
- - -
10 10
(NA) (NA) 100
8,000
300 100 500 10
13,060
- Represents zero. (NA) Not available. 1
Estimates discontinued in 2009.
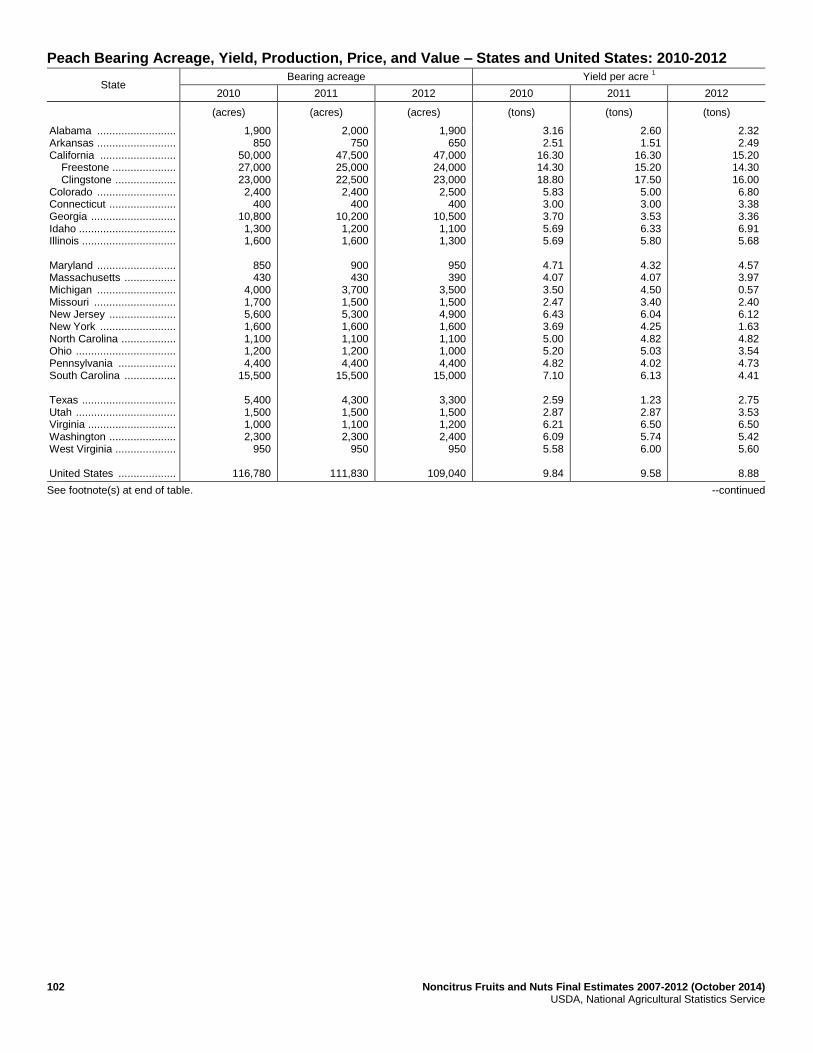
102 Noncitrus Fruits and Nuts Final Estimates 2007-2012 (October 2014) USDA, National Agricultural Statistics Service
Peach Bearing Acreage, Yield, Production, Price, and Value – States and United States: 2010-2012
State Bearing acreage Yield per acre
1
2010 2011 2012 2010 2011 2012
(acres) (acres) (acres) (tons) (tons) (tons)
Alabama .......................... Arkansas .......................... California ......................... Freestone ..................... Clingstone .................... Colorado .......................... Connecticut ...................... Georgia ............................ Idaho ................................ Illinois ............................... Maryland .......................... Massachusetts ................. Michigan .......................... Missouri ........................... New Jersey ...................... New York ......................... North Carolina .................. Ohio ................................. Pennsylvania ................... South Carolina ................. Texas ............................... Utah ................................. Virginia ............................. Washington ...................... West Virginia .................... United States ...................
1,900 850
50,000 27,000 23,000 2,400
400 10,800 1,300 1,600
850 430
4,000 1,700 5,600 1,600 1,100 1,200 4,400
15,500
5,400 1,500 1,000 2,300
950
116,780
2,000 750
47,500 25,000 22,500 2,400
400 10,200 1,200 1,600
900 430
3,700 1,500 5,300 1,600 1,100 1,200 4,400
15,500
4,300 1,500 1,100 2,300
950
111,830
1,900 650
47,000 24,000 23,000 2,500
400 10,500 1,100 1,300
950 390
3,500 1,500 4,900 1,600 1,100 1,000 4,400
15,000
3,300 1,500 1,200 2,400
950
109,040
3.16 2.51
16.30 14.30 18.80 5.83 3.00 3.70 5.69 5.69
4.71 4.07 3.50 2.47 6.43 3.69 5.00 5.20 4.82 7.10
2.59 2.87 6.21 6.09 5.58
9.84
2.60 1.51
16.30 15.20 17.50 5.00 3.00 3.53 6.33 5.80
4.32 4.07 4.50 3.40 6.04 4.25 4.82 5.03 4.02 6.13
1.23 2.87 6.50 5.74 6.00
9.58
2.32 2.49
15.20 14.30 16.00 6.80 3.38 3.36 6.91 5.68
4.57 3.97 0.57 2.40 6.12 1.63 4.82 3.54 4.73 4.41
2.75 3.53 6.50 5.42 5.60
8.88
See footnote(s) at end of table. --continued
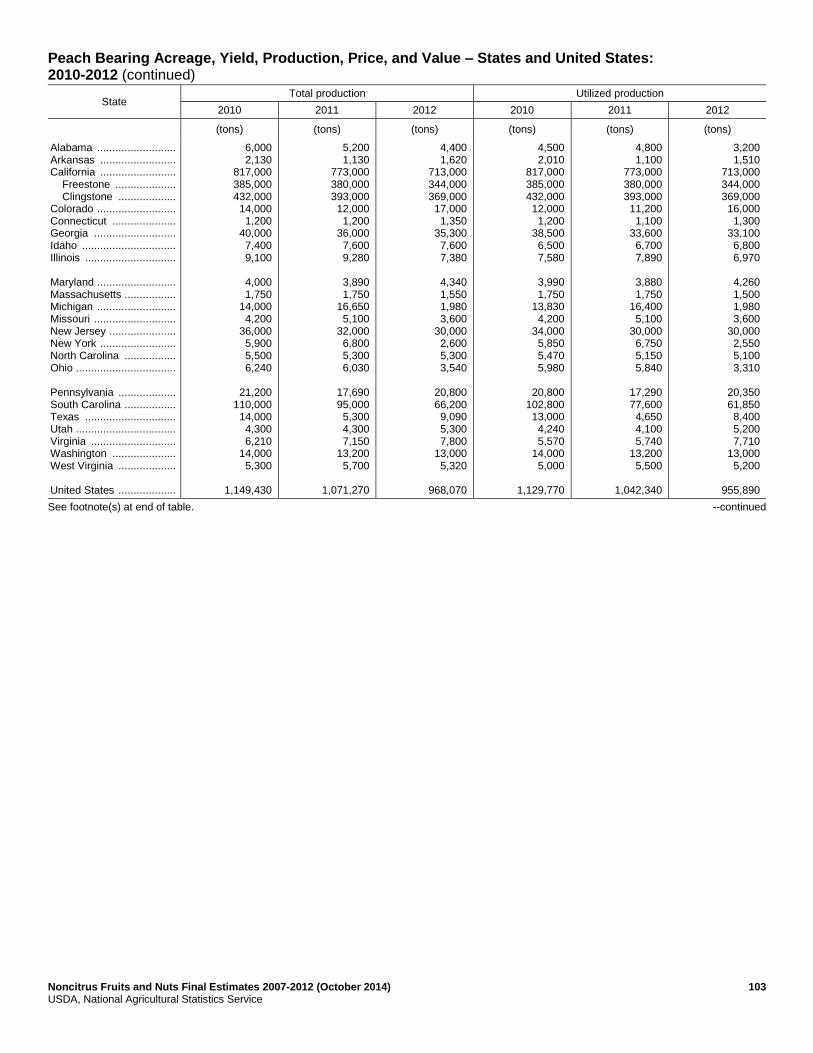
Noncitrus Fruits and Nuts Final Estimates 2007-2012 (October 2014) 103 USDA, National Agricultural Statistics Service
Peach Bearing Acreage, Yield, Production, Price, and Value – States and United States: 2010-2012 (continued)
State Total production Utilized production
2010 2011 2012 2010 2011 2012
(tons) (tons) (tons) (tons) (tons) (tons)
Alabama .......................... Arkansas ......................... California ......................... Freestone .................... Clingstone ................... Colorado .......................... Connecticut ..................... Georgia ........................... Idaho ............................... Illinois .............................. Maryland .......................... Massachusetts ................. Michigan .......................... Missouri ........................... New Jersey ...................... New York ......................... North Carolina ................. Ohio ................................. Pennsylvania ................... South Carolina ................. Texas .............................. Utah ................................. Virginia ............................ Washington ..................... West Virginia ................... United States ...................
6,000 2,130
817,000 385,000 432,000 14,000 1,200
40,000 7,400 9,100
4,000 1,750
14,000 4,200
36,000 5,900 5,500 6,240
21,200
110,000 14,000 4,300 6,210
14,000 5,300
1,149,430
5,200 1,130
773,000 380,000 393,000 12,000 1,200
36,000 7,600 9,280
3,890 1,750
16,650 5,100
32,000 6,800 5,300 6,030
17,690 95,000 5,300 4,300 7,150
13,200 5,700
1,071,270
4,400 1,620
713,000 344,000 369,000 17,000 1,350
35,300 7,600 7,380
4,340 1,550 1,980 3,600
30,000 2,600 5,300 3,540
20,800 66,200 9,090 5,300 7,800
13,000 5,320
968,070
4,500 2,010
817,000 385,000 432,000 12,000 1,200
38,500 6,500 7,580
3,990 1,750
13,830 4,200
34,000 5,850 5,470 5,980
20,800
102,800 13,000 4,240 5,570
14,000 5,000
1,129,770
4,800 1,100
773,000 380,000 393,000 11,200 1,100
33,600 6,700 7,890
3,880 1,750
16,400 5,100
30,000 6,750 5,150 5,840
17,290 77,600 4,650 4,100 5,740
13,200 5,500
1,042,340
3,200 1,510
713,000 344,000 369,000 16,000 1,300
33,100 6,800 6,970
4,260 1,500 1,980 3,600
30,000 2,550 5,100 3,310
20,350 61,850 8,400 5,200 7,710
13,000 5,200
955,890
See footnote(s) at end of table. --continued
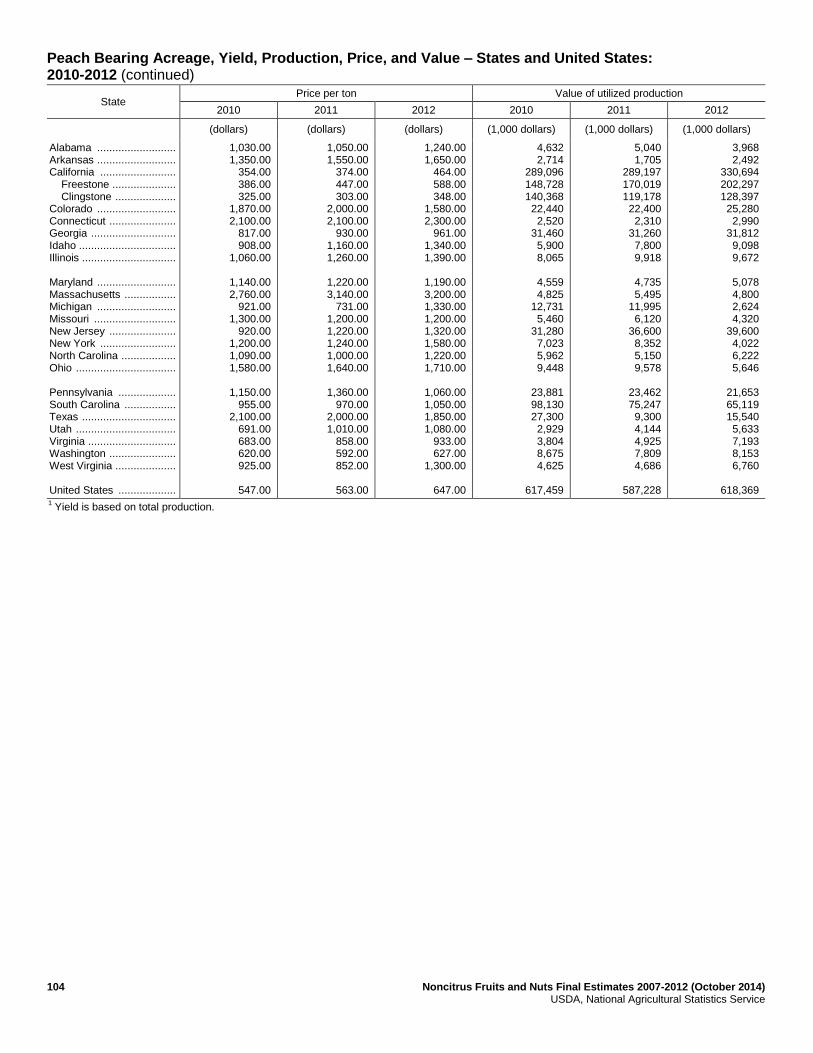
104 Noncitrus Fruits and Nuts Final Estimates 2007-2012 (October 2014) USDA, National Agricultural Statistics Service
Peach Bearing Acreage, Yield, Production, Price, and Value – States and United States: 2010-2012 (continued)
State Price per ton Value of utilized production
2010 2011 2012 2010 2011 2012
(dollars) (dollars) (dollars) (1,000 dollars) (1,000 dollars) (1,000 dollars)
Alabama .......................... Arkansas .......................... California ......................... Freestone ..................... Clingstone .................... Colorado .......................... Connecticut ...................... Georgia ............................ Idaho ................................ Illinois ............................... Maryland .......................... Massachusetts ................. Michigan .......................... Missouri ........................... New Jersey ...................... New York ......................... North Carolina .................. Ohio ................................. Pennsylvania ................... South Carolina ................. Texas ............................... Utah ................................. Virginia ............................. Washington ...................... West Virginia .................... United States ...................
1,030.00 1,350.00
354.00 386.00 325.00
1,870.00 2,100.00
817.00 908.00
1,060.00
1,140.00 2,760.00
921.00 1,300.00
920.00 1,200.00 1,090.00 1,580.00
1,150.00
955.00 2,100.00
691.00 683.00 620.00 925.00
547.00
1,050.00 1,550.00
374.00 447.00 303.00
2,000.00 2,100.00
930.00 1,160.00 1,260.00
1,220.00 3,140.00
731.00 1,200.00 1,220.00 1,240.00 1,000.00 1,640.00
1,360.00
970.00 2,000.00 1,010.00
858.00 592.00 852.00
563.00
1,240.00 1,650.00
464.00 588.00 348.00
1,580.00 2,300.00
961.00 1,340.00 1,390.00
1,190.00 3,200.00 1,330.00 1,200.00 1,320.00 1,580.00 1,220.00 1,710.00
1,060.00 1,050.00 1,850.00 1,080.00
933.00 627.00
1,300.00
647.00
4,632 2,714
289,096 148,728 140,368 22,440 2,520
31,460 5,900 8,065
4,559 4,825
12,731 5,460
31,280 7,023 5,962 9,448
23,881 98,130 27,300 2,929 3,804 8,675 4,625
617,459
5,040 1,705
289,197 170,019 119,178 22,400 2,310
31,260 7,800 9,918
4,735 5,495
11,995 6,120
36,600 8,352 5,150 9,578
23,462 75,247 9,300 4,144 4,925 7,809 4,686
587,228
3,968 2,492
330,694 202,297 128,397 25,280 2,990
31,812 9,098 9,672
5,078 4,800 2,624 4,320
39,600 4,022 6,222 5,646
21,653 65,119 15,540 5,633 7,193 8,153 6,760
618,369
1 Yield is based on total production.
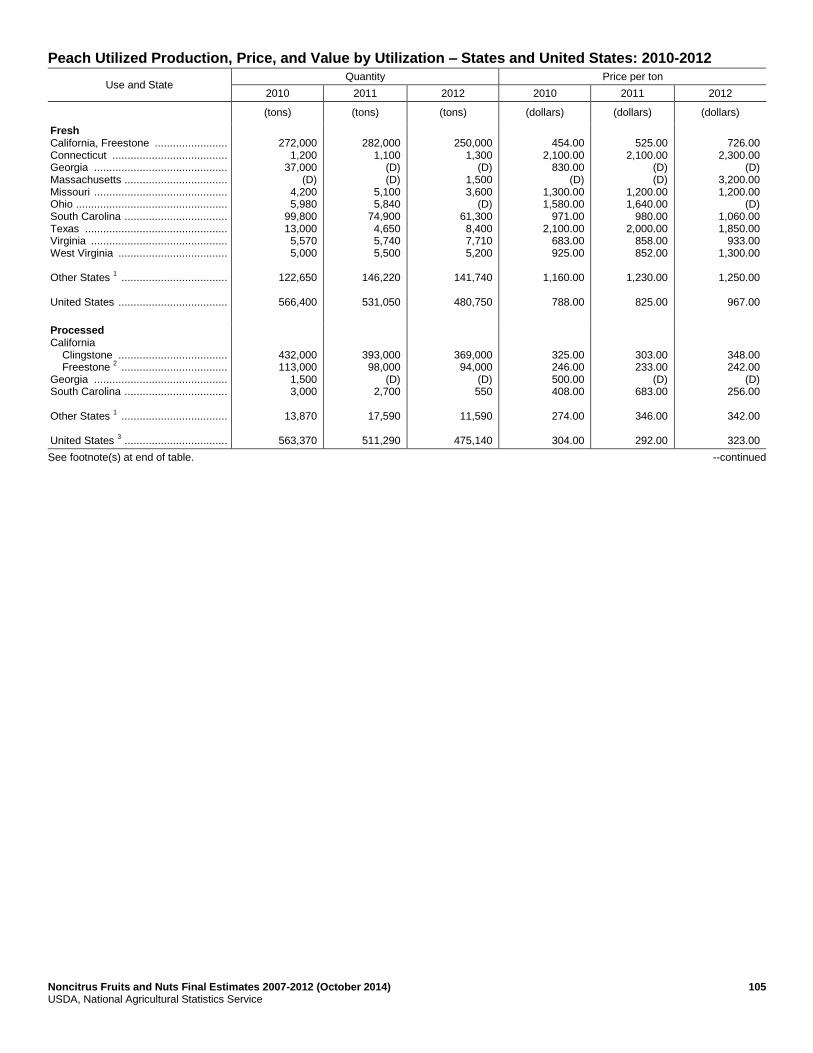
Noncitrus Fruits and Nuts Final Estimates 2007-2012 (October 2014) 105 USDA, National Agricultural Statistics Service
Peach Utilized Production, Price, and Value by Utilization – States and United States: 2010-2012
Use and State Quantity Price per ton
2010 2011 2012 2010 2011 2012
(tons) (tons) (tons) (dollars) (dollars) (dollars)
Fresh California, Freestone ........................ Connecticut ...................................... Georgia ............................................ Massachusetts .................................. Missouri ............................................ Ohio .................................................. South Carolina .................................. Texas ............................................... Virginia ............................................. West Virginia .................................... Other States
1 ...................................
United States ....................................
272,000
1,200 37,000
(D) 4,200 5,980
99,800 13,000 5,570 5,000
122,650
566,400
282,000
1,100 (D) (D)
5,100 5,840
74,900 4,650 5,740 5,500
146,220
531,050
250,000
1,300 (D)
1,500 3,600
(D) 61,300 8,400 7,710 5,200
141,740
480,750
454.00
2,100.00 830.00
(D) 1,300.00 1,580.00
971.00 2,100.00
683.00 925.00
1,160.00
788.00
525.00
2,100.00 (D) (D)
1,200.00 1,640.00
980.00 2,000.00
858.00 852.00
1,230.00
825.00
726.00
2,300.00 (D)
3,200.00 1,200.00
(D) 1,060.00 1,850.00
933.00 1,300.00
1,250.00
967.00
Processed California Clingstone .................................... Freestone
2 ...................................
Georgia ............................................ South Carolina .................................. Other States
1 ...................................
United States
3 ..................................
432,000 113,000
1,500 3,000
13,870
563,370
393,000 98,000
(D) 2,700
17,590
511,290
369,000 94,000
(D) 550
11,590
475,140
325.00 246.00 500.00 408.00
274.00
304.00
303.00 233.00
(D) 683.00
346.00
292.00
348.00 242.00
(D) 256.00
342.00
323.00
See footnote(s) at end of table. --continued
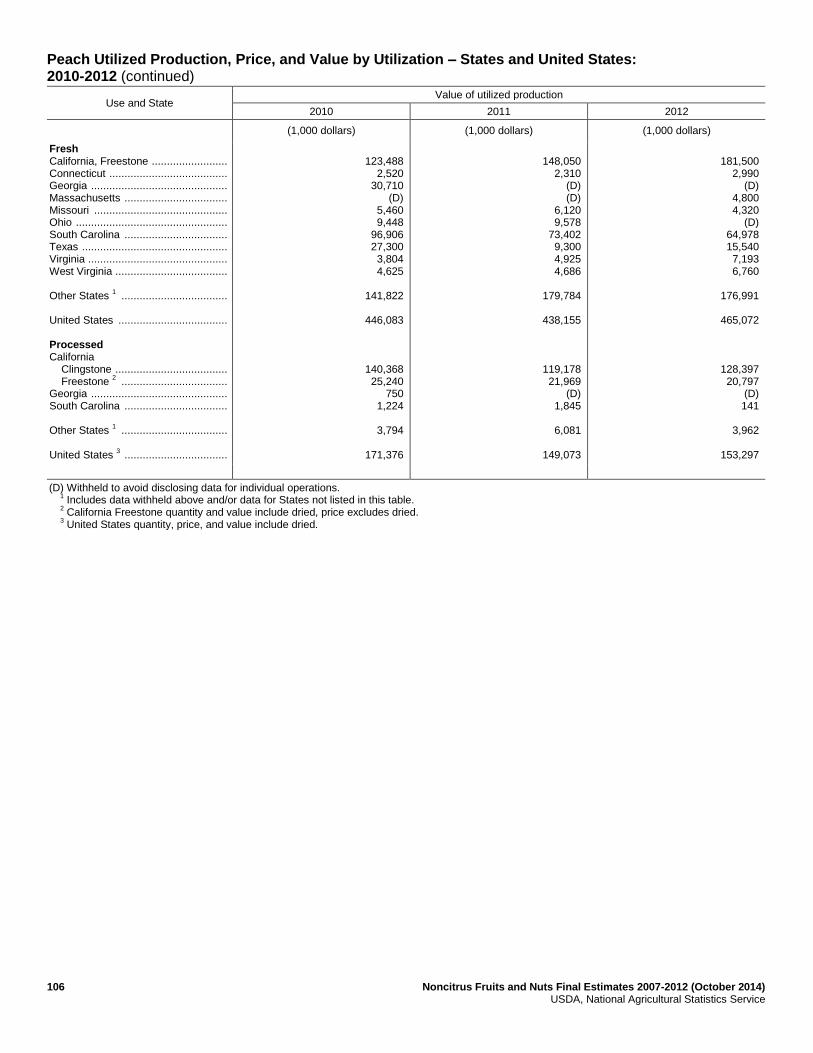
106 Noncitrus Fruits and Nuts Final Estimates 2007-2012 (October 2014) USDA, National Agricultural Statistics Service
Peach Utilized Production, Price, and Value by Utilization – States and United States: 2010-2012 (continued)
Use and State Value of utilized production
2010 2011 2012
(1,000 dollars) (1,000 dollars) (1,000 dollars)
Fresh California, Freestone ......................... Connecticut ....................................... Georgia ............................................. Massachusetts .................................. Missouri ............................................ Ohio .................................................. South Carolina .................................. Texas ................................................ Virginia .............................................. West Virginia ..................................... Other States
1 ...................................
United States .................................... Processed California Clingstone ..................................... Freestone
2 ...................................
Georgia ............................................. South Carolina .................................. Other States
1 ...................................
United States
3 ..................................
123,488
2,520 30,710
(D) 5,460 9,448
96,906 27,300 3,804 4,625
141,822
446,083
140,368 25,240
750 1,224
3,794
171,376
148,050
2,310 (D) (D)
6,120 9,578
73,402 9,300 4,925 4,686
179,784
438,155
119,178 21,969
(D) 1,845
6,081
149,073
181,500
2,990 (D)
4,800 4,320
(D) 64,978 15,540 7,193 6,760
176,991
465,072
128,397 20,797
(D) 141
3,962
153,297
(D) Withheld to avoid disclosing data for individual operations. 1
Includes data withheld above and/or data for States not listed in this table. 2
California Freestone quantity and value include dried, price excludes dried. 3
United States quantity, price, and value include dried.
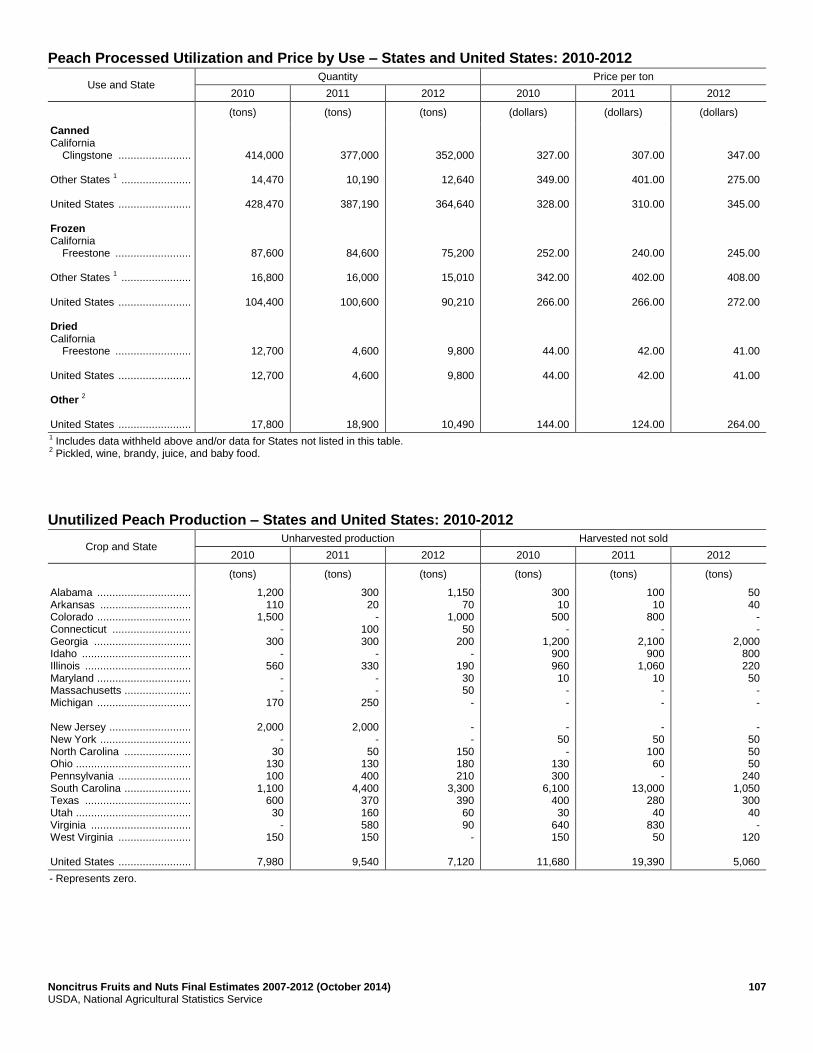
Noncitrus Fruits and Nuts Final Estimates 2007-2012 (October 2014) 107 USDA, National Agricultural Statistics Service
Peach Processed Utilization and Price by Use – States and United States: 2010-2012
Use and State Quantity Price per ton
2010 2011 2012 2010 2011 2012
(tons) (tons) (tons) (dollars) (dollars) (dollars)
Canned California Clingstone ........................ Other States
1 .......................
United States ........................ Frozen California Freestone ......................... Other States
1 .......................
United States ........................ Dried California Freestone ......................... United States ........................ Other
2
United States ........................
414,000
14,470
428,470
87,600
16,800
104,400
12,700
12,700
17,800
377,000
10,190
387,190
84,600
16,000
100,600
4,600
4,600
18,900
352,000
12,640
364,640
75,200
15,010
90,210
9,800
9,800
10,490
327.00
349.00
328.00
252.00
342.00
266.00
44.00
44.00
144.00
307.00
401.00
310.00
240.00
402.00
266.00
42.00
42.00
124.00
347.00
275.00
345.00
245.00
408.00
272.00
41.00
41.00
264.00 1 Includes data withheld above and/or data for States not listed in this table.
2 Pickled, wine, brandy, juice, and baby food.
Unutilized Peach Production – States and United States: 2010-2012
Crop and State Unharvested production Harvested not sold
2010 2011 2012 2010 2011 2012
(tons) (tons) (tons) (tons) (tons) (tons)
Alabama ............................... Arkansas .............................. Colorado ............................... Connecticut .......................... Georgia ................................ Idaho .................................... Illinois ................................... Maryland ............................... Massachusetts ...................... Michigan ............................... New Jersey ........................... New York .............................. North Carolina ...................... Ohio ...................................... Pennsylvania ........................ South Carolina ...................... Texas ................................... Utah ...................................... Virginia ................................. West Virginia ........................ United States ........................
1,200 110
1,500 -
300 -
560 - -
170
2,000 -
30 130 100
1,100 600 30
- 150
7,980
300 20
- 100 300
- 330
- -
250
2,000 -
50 130 400
4,400 370 160 580 150
9,540
1,150 70
1,000 50
200 -
190 30 50
-
- -
150 180 210
3,300 390 60 90
-
7,120
300 10
500 -
1,200 900 960 10
- -
- 50
- 130 300
6,100 400 30
640 150
11,680
100 10
800 -
2,100 900
1,060 10
- -
- 50
100 60
- 13,000
280 40
830 50
19,390
50 40
- -
2,000 800 220 50
- -
- 50 50 50
240 1,050
300 40
- 120
5,060
- Represents zero.
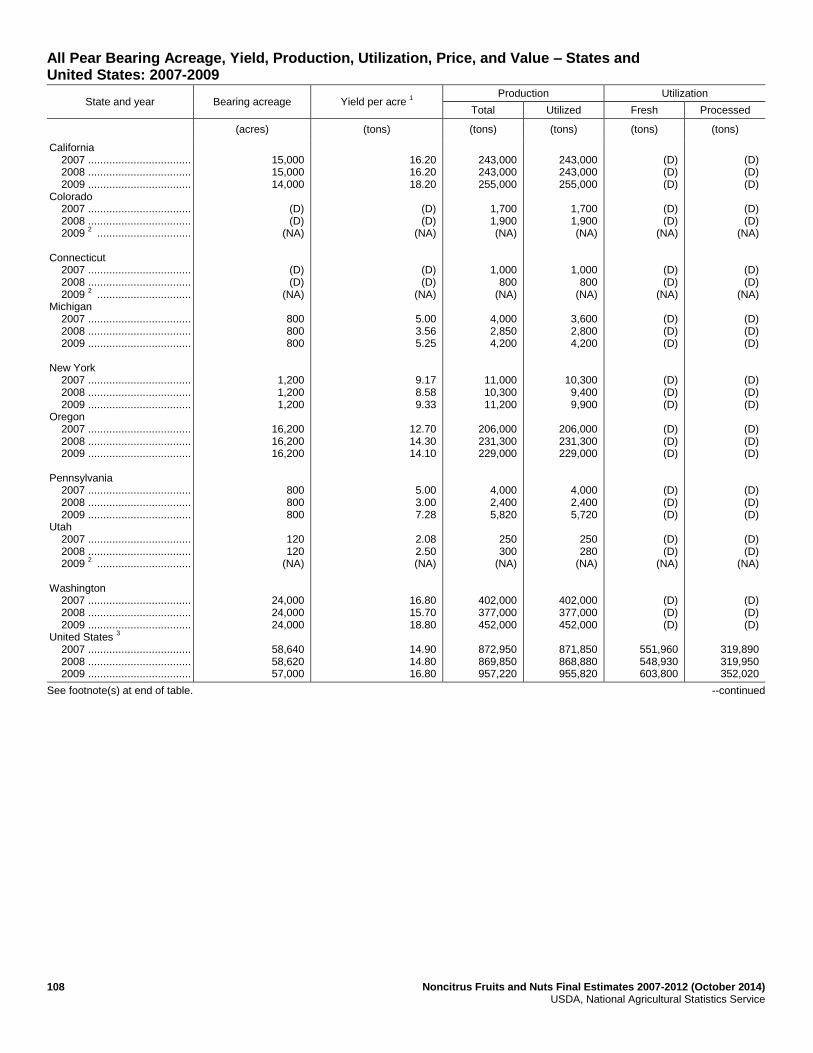
108 Noncitrus Fruits and Nuts Final Estimates 2007-2012 (October 2014) USDA, National Agricultural Statistics Service
All Pear Bearing Acreage, Yield, Production, Utilization, Price, and Value – States and United States: 2007-2009
State and year Bearing acreage Yield per acre 1
Production Utilization
Total Utilized Fresh Processed
(acres) (tons) (tons) (tons) (tons) (tons)
California 2007 .................................. 2008 .................................. 2009 .................................. Colorado 2007 .................................. 2008 .................................. 2009
2 ...............................
Connecticut 2007 .................................. 2008 .................................. 2009
2 ...............................
Michigan 2007 .................................. 2008 .................................. 2009 .................................. New York 2007 .................................. 2008 .................................. 2009 .................................. Oregon 2007 .................................. 2008 .................................. 2009 .................................. Pennsylvania 2007 .................................. 2008 .................................. 2009 .................................. Utah 2007 .................................. 2008 .................................. 2009
2 ...............................
Washington 2007 .................................. 2008 .................................. 2009 .................................. United States
3
2007 .................................. 2008 .................................. 2009 ..................................
15,000 15,000 14,000
(D) (D)
(NA)
(D) (D)
(NA)
800 800 800
1,200 1,200 1,200
16,200 16,200 16,200
800 800 800
120 120
(NA)
24,000 24,000 24,000
58,640 58,620 57,000
16.20 16.20 18.20
(D) (D)
(NA)
(D) (D)
(NA)
5.00 3.56 5.25
9.17 8.58 9.33
12.70 14.30 14.10
5.00 3.00 7.28
2.08 2.50 (NA)
16.80 15.70 18.80
14.90 14.80 16.80
243,000 243,000 255,000
1,700 1,900 (NA)
1,000 800
(NA)
4,000 2,850 4,200
11,000 10,300 11,200
206,000 231,300 229,000
4,000 2,400 5,820
250 300
(NA)
402,000 377,000 452,000
872,950 869,850 957,220
243,000 243,000 255,000
1,700 1,900 (NA)
1,000 800
(NA)
3,600 2,800 4,200
10,300 9,400 9,900
206,000 231,300 229,000
4,000 2,400 5,720
250 280
(NA)
402,000 377,000 452,000
871,850 868,880 955,820
(D) (D) (D)
(D) (D)
(NA)
(D) (D)
(NA)
(D) (D) (D)
(D) (D) (D)
(D) (D) (D)
(D) (D) (D)
(D) (D)
(NA)
(D) (D) (D)
551,960 548,930 603,800
(D) (D) (D)
(D) (D)
(NA)
(D) (D)
(NA)
(D) (D) (D)
(D) (D) (D)
(D) (D) (D)
(D) (D) (D)
(D) (D)
(NA)
(D) (D) (D)
319,890 319,950 352,020
See footnote(s) at end of table. --continued
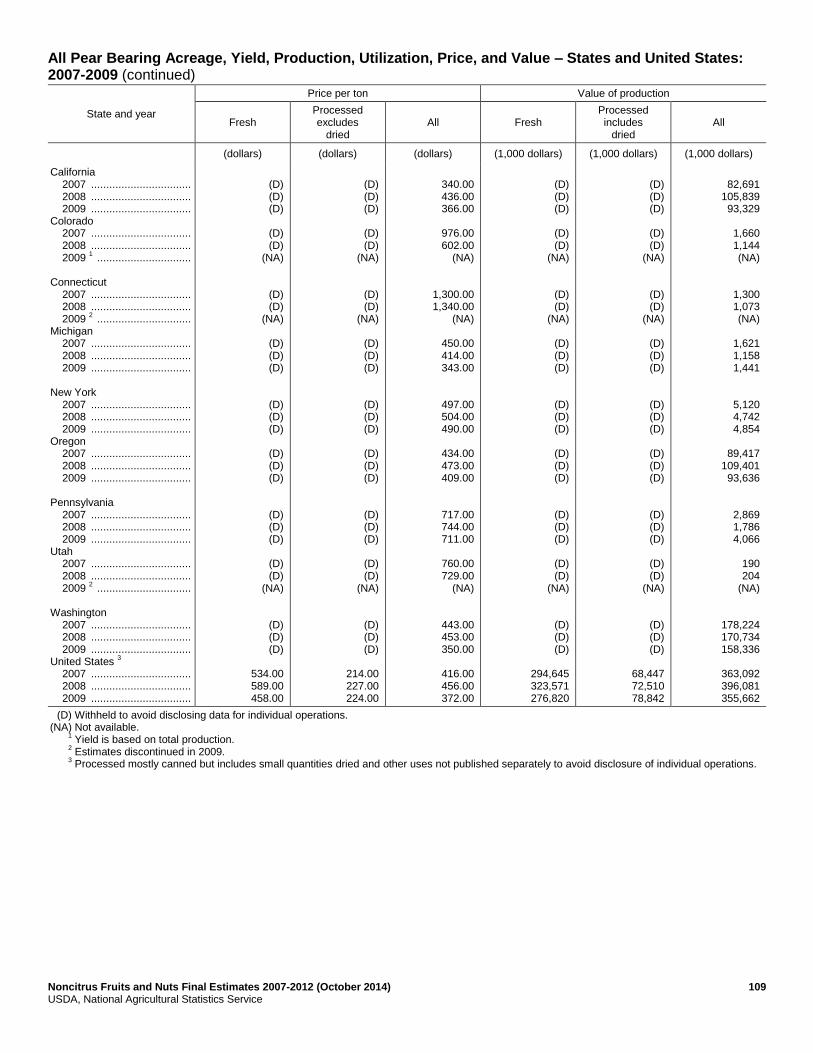
Noncitrus Fruits and Nuts Final Estimates 2007-2012 (October 2014) 109 USDA, National Agricultural Statistics Service
All Pear Bearing Acreage, Yield, Production, Utilization, Price, and Value – States and United States: 2007-2009 (continued)
State and year
Price per ton Value of production
Fresh Processed excludes
dried All Fresh
Processed includes
dried All
(dollars) (dollars) (dollars) (1,000 dollars) (1,000 dollars) (1,000 dollars)
California 2007 ................................. 2008 ................................. 2009 ................................. Colorado 2007 ................................. 2008 ................................. 2009
1 ...............................
Connecticut 2007 ................................. 2008 ................................. 2009
2 ...............................
Michigan 2007 ................................. 2008 ................................. 2009 ................................. New York 2007 ................................. 2008 ................................. 2009 ................................. Oregon 2007 ................................. 2008 ................................. 2009 ................................. Pennsylvania 2007 ................................. 2008 ................................. 2009 ................................. Utah 2007 ................................. 2008 ................................. 2009
2 ...............................
Washington 2007 ................................. 2008 ................................. 2009 ................................. United States
3
2007 ................................. 2008 ................................. 2009 .................................
(D) (D) (D)
(D) (D)
(NA)
(D) (D)
(NA)
(D) (D) (D)
(D) (D) (D)
(D) (D) (D)
(D) (D) (D)
(D) (D)
(NA)
(D) (D) (D)
534.00 589.00 458.00
(D) (D) (D)
(D) (D)
(NA)
(D) (D)
(NA)
(D) (D) (D)
(D) (D) (D)
(D) (D) (D)
(D) (D) (D)
(D) (D)
(NA)
(D) (D) (D)
214.00 227.00 224.00
340.00 436.00 366.00
976.00 602.00
(NA)
1,300.00 1,340.00
(NA)
450.00 414.00 343.00
497.00 504.00 490.00
434.00 473.00 409.00
717.00 744.00 711.00
760.00 729.00
(NA)
443.00 453.00 350.00
416.00 456.00 372.00
(D) (D) (D)
(D) (D)
(NA)
(D) (D)
(NA)
(D) (D) (D)
(D) (D) (D)
(D) (D) (D)
(D) (D) (D)
(D) (D)
(NA)
(D) (D) (D)
294,645 323,571 276,820
(D) (D) (D)
(D) (D)
(NA)
(D) (D)
(NA)
(D) (D) (D)
(D) (D) (D)
(D) (D) (D)
(D) (D) (D)
(D) (D)
(NA)
(D) (D) (D)
68,447 72,510 78,842
82,691
105,839 93,329
1,660 1,144 (NA)
1,300 1,073 (NA)
1,621 1,158 1,441
5,120 4,742 4,854
89,417
109,401 93,636
2,869 1,786 4,066
190 204
(NA)
178,224 170,734 158,336
363,092 396,081 355,662
(D) Withheld to avoid disclosing data for individual operations. (NA) Not available. 1
Yield is based on total production. 2
Estimates discontinued in 2009. 3
Processed mostly canned but includes small quantities dried and other uses not published separately to avoid disclosure of individual operations.

110 Noncitrus Fruits and Nuts Final Estimates 2007-2012 (October 2014) USDA, National Agricultural Statistics Service
Pear Bearing Acreage, Yield, Production, Utilization, Price, and Value by Type – States and United States: 2007-2009
Type, State and year
Bearing acreage Yield per acre 1
Production Utilization
Total Utilized Fresh Processed
(acres) (tons) (tons) (tons) (tons) (tons)
Bartlett 2
California 2007 ..................... 2008 ..................... 2009 ..................... Oregon 2007 ..................... 2008 ..................... 2009 ..................... Washington 2007 ..................... 2008 ..................... 2009 ..................... United States ........... 2007 ..................... 2008 ..................... 2009 ..................... Other
3
California 2007 ..................... 2008 ..................... 2009 ..................... Oregon 2007 ..................... 2008 ..................... 2009 ..................... Washington 2007 ..................... 2008 ..................... 2009 ..................... United States ........... 2007 ..................... 2008 ..................... 2009 .....................
11,000 11,000 10,000
4,200 4,200 4,200
11,000 11,000 11,000
26,200 26,200 25,200
4,000 4,000 4,000
12,000 12,000 12,000
13,000 13,000 13,000
29,000 29,000 29,000
18.30 17.70 20.00
14.00 13.40 15.70
14.80 15.10 16.90
16.20 15.90 17.90
10.50 12.00 13.80
12.30 14.60 13.60
18.40 16.20 20.50
14.80 15.00 16.70
201,000 195,000 200,000
59,000 56,300 66,000
163,000 166,000 186,000
423,000 417,300 452,000
42,000 48,000 55,000
147,000 175,000 163,000
239,000 211,000 266,000
428,000 434,000 484,000
201,000 195,000 200,000
59,000 56,300 66,000
163,000 166,000 186,000
423,000 417,300 452,000
42,000 48,000 55,000
147,000 175,000 163,000
239,000 211,000 266,000
428,000 434,000 484,000
64,000 70,000 70,000
31,000 30,000 40,000
66,000 61,000 67,000
161,000 161,000 177,000
(D) (D) (D)
(D) (D) (D)
(D) (D) (D)
375,500 375,000 411,000
137,000 125,000 130,000
28,000 26,300 26,000
97,000
105,000 119,000
262,000 256,300 275,000
(D) (D) (D)
(D) (D) (D)
(D) (D) (D)
52,500 59,000 73,000
See footnote(s) at end of table. --continued

Noncitrus Fruits and Nuts Final Estimates 2007-2012 (October 2014) 111 USDA, National Agricultural Statistics Service
Pear Bearing Acreage, Yield, Production, Utilization, Price, and Value by Type – States and United States: 2007-2009 (continued)
Type, State and year
Price per ton Value of production
Fresh Processed excludes
dried All Fresh
Processed excludes
dried All
(dollars) (dollars) (dollars) (1,000 dollars) (1,000 dollars) (1,000 dollars)
Bartlett 2 .......................
California 2007 .......................... 2008 .......................... 2009 .......................... Oregon 2007 .......................... 2008 .......................... 2009 .......................... Washington 2007 .......................... 2008 .......................... 2009 .......................... United States ................. 2007 .......................... 2008 .......................... 2009 .......................... Other
3
California 2007 .......................... 2008 .......................... 2009 .......................... Oregon 2007 .......................... 2008 .......................... 2009 .......................... Washington 2007 .......................... 2008 .......................... 2009 .......................... United States ................. 2007 .......................... 2008 .......................... 2009 ..........................
367.00 532.00 404.00
517.00 493.00 540.00
573.00 598.00 471.00
480.00 550.00 460.00
(D) (D) (D)
(D) (D) (D)
(D) (D) (D)
549.00 603.00 453.00
253.00 285.00 323.00
219.00 283.00 283.00
239.00 234.00 220.00
244.00 264.00 274.00
(D) (D) (D)
(D) (D) (D)
(D) (D) (D)
55.40 62.80 32.30
289.00 373.00 351.00
375.00 395.00 439.00
374.00 368.00 310.00
334.00 374.00 347.00
586.00 689.00 422.00
458.00 498.00 397.00
491.00 520.00 378.00
489.00 530.00 390.00
23,488 37,240 28,280
16,027 14,790 21,600
37,818 36,478 31,557
77,333 88,508 81,437
(D) (D) (D)
(D) (D) (D)
(D) (D) (D)
206,191 226,213 186,190
34,610 35,508 41,823
6,120 7,446 7,345
23,172 24,596 26,151
63,902 67,550 75,319
(D) (D) (D)
(D) (D) (D)
(D) (D) (D)
2,906 3,703 2,355
58,098 72,748 70,103
22,147 22,236 28,945
60,990 61,074 57,708
141,235 156,058 156,756
24,593 33,091 23,226
67,270 87,165 64,691
117,234 109,660 100,628
209,097 229,916 188,545
(D) Withheld to avoid disclosing data for individual operations. 1
Yield is based on total production. 2
Processed mostly canned but includes small quantities dried and other uses not published separately to avoid disclosure of individual operations. 3
Processed mostly juice, but includes small quantities canned and other uses not published separately to avoid disclosure of individual operations.
Unutilized Pear Production – States and United States: 2007-2009
State Unharvested production Harvested not sold
2007 2008 2009 2007 2008 2009
(tons) (tons) (tons) (tons) (tons) (tons)
Michigan ............................... New York .............................. Pennsylvania ........................ Utah ...................................... United States ........................
400 700
- -
1,100
50 900
- 10
960
- 1,300
- -
1,300
- - - -
-
- - -
10
10
- -
100 -
100
- Represents zero.

112 Noncitrus Fruits and Nuts Final Estimates 2007-2012 (October 2014) USDA, National Agricultural Statistics Service
All Pear Bearing Acreage, Yield, Production, Price, and Value – States and United States: 2010-2012
State and year Bearing acreage Yield per acre 1
Production Utilization
Total Utilized Fresh Processed
(acres) (tons) (tons) (tons) (tons) (tons)
California ....................... 2010 ........................... 2011 ........................... 2012 ........................... Michigan ........................ 2010 ........................... 2011 ........................... 2012 ........................... New York ....................... 2010 ........................... 2011 ........................... 2012 ........................... Oregon ........................... 2010 ........................... 2011 ........................... 2012 ........................... Pennsylvania ................. 2010 ........................... 2011 ........................... 2012 ........................... Washington .................... 2010 ........................... 2011 ........................... 2012 ........................... United States
2 ...............
2010 ........................... 2011 ........................... 2012 ...........................
14,000 14,000 11,500
800 700 700
1,200 1,200 1,000
16,200 15,400 14,600
800 800 800
23,000 21,500 21,500
56,000 53,600 50,100
15.70 18.00 18.10
1.13 6.29 0.06
6.92 10.10 3.10
11.90 14.70 17.00
3.00 2.78 1.38
17.00 21.80 18.20
14.50 18.00 17.00
220,000 252,000 208,000
900
4,400 40
8,300 12,100 3,100
192,000 227,000 248,000
2,400 2,220 1,100
390,000 468,000 391,000
813,600 965,720 851,240
220,000 252,000 208,000
900
4,400 40
8,200 11,600 3,100
192,000 227,000 248,000
2,300 2,110
990
390,000 468,000 391,000
813,400 965,110 851,130
(D) (D) (D)
(D) (D) (D)
(D) (D) (D)
(D) (D) (D)
(D) (D) (D)
(D) (D) (D)
531,430 643,710 551,820
(D) (D) (D)
(D) (D) (D)
(D) (D) (D)
(D) (D) (D)
(D) (D) (D)
(D) (D) (D)
281,970 321,400 299,310
See footnote(s) at end of table. --continued
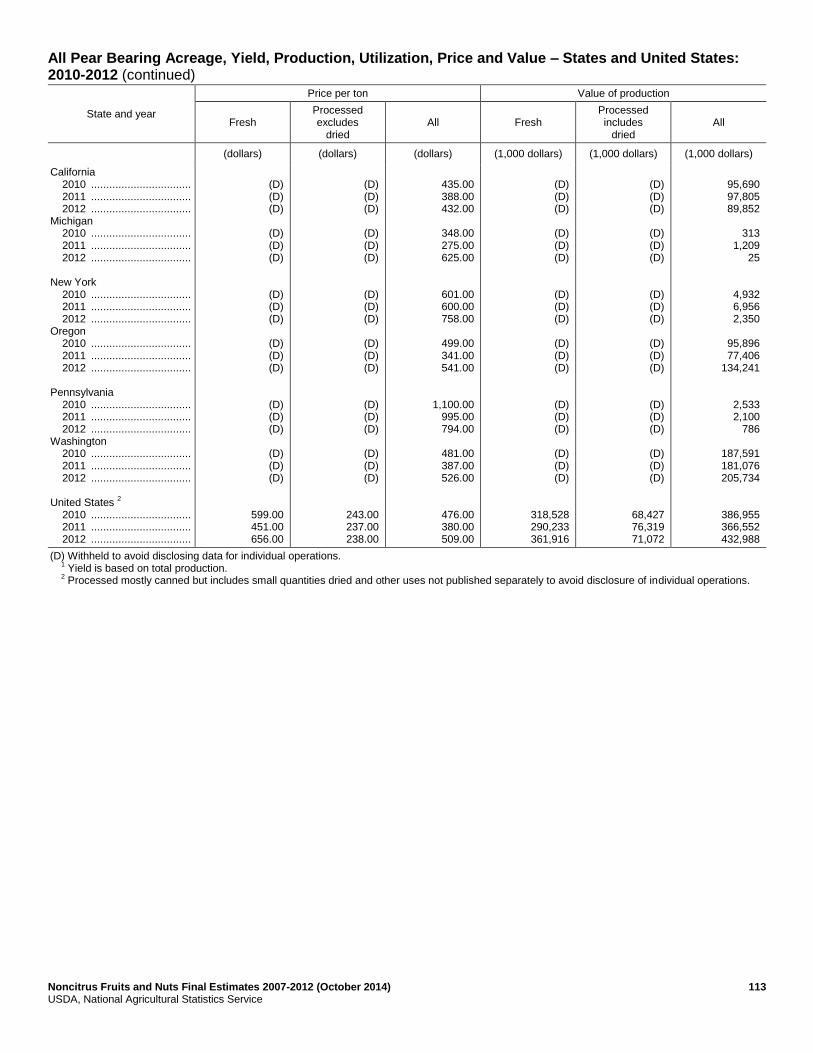
Noncitrus Fruits and Nuts Final Estimates 2007-2012 (October 2014) 113 USDA, National Agricultural Statistics Service
All Pear Bearing Acreage, Yield, Production, Utilization, Price and Value – States and United States: 2010-2012 (continued)
State and year
Price per ton Value of production
Fresh Processed excludes
dried All Fresh
Processed includes
dried All
(dollars) (dollars) (dollars) (1,000 dollars) (1,000 dollars) (1,000 dollars)
California 2010 ................................. 2011 ................................. 2012 ................................. Michigan 2010 ................................. 2011 ................................. 2012 ................................. New York 2010 ................................. 2011 ................................. 2012 ................................. Oregon 2010 ................................. 2011 ................................. 2012 ................................. Pennsylvania 2010 ................................. 2011 ................................. 2012 ................................. Washington 2010 ................................. 2011 ................................. 2012 ................................. United States
2
2010 ................................. 2011 ................................. 2012 .................................
(D) (D) (D)
(D) (D) (D)
(D) (D) (D)
(D) (D) (D)
(D) (D) (D)
(D) (D) (D)
599.00 451.00 656.00
(D) (D) (D)
(D) (D) (D)
(D) (D) (D)
(D) (D) (D)
(D) (D) (D)
(D) (D) (D)
243.00 237.00 238.00
435.00 388.00 432.00
348.00 275.00 625.00
601.00 600.00 758.00
499.00 341.00 541.00
1,100.00 995.00 794.00
481.00 387.00 526.00
476.00 380.00 509.00
(D) (D) (D)
(D) (D) (D)
(D) (D) (D)
(D) (D) (D)
(D) (D) (D)
(D) (D) (D)
318,528 290,233 361,916
(D) (D) (D)
(D) (D) (D)
(D) (D) (D)
(D) (D) (D)
(D) (D) (D)
(D) (D) (D)
68,427 76,319 71,072
95,690 97,805 89,852
313
1,209 25
4,932 6,956 2,350
95,896 77,406
134,241
2,533 2,100
786
187,591 181,076 205,734
386,955 366,552 432,988
(D) Withheld to avoid disclosing data for individual operations. 1
Yield is based on total production. 2
Processed mostly canned but includes small quantities dried and other uses not published separately to avoid disclosure of individual operations.
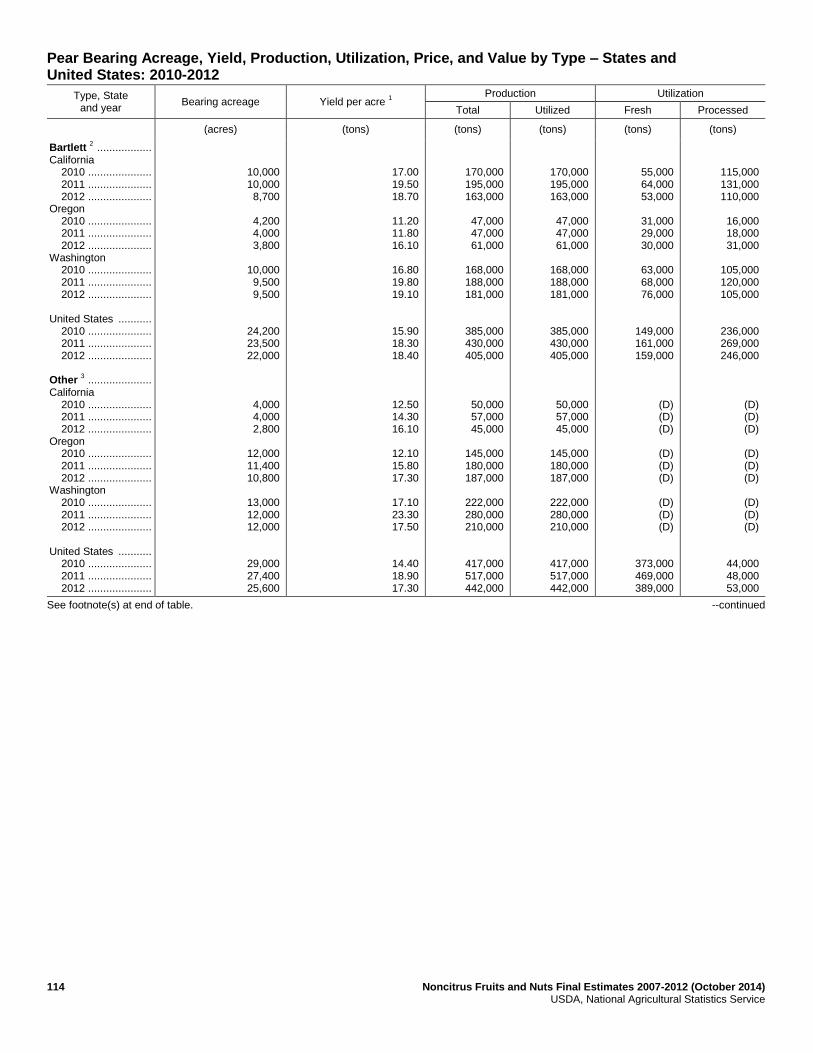
114 Noncitrus Fruits and Nuts Final Estimates 2007-2012 (October 2014) USDA, National Agricultural Statistics Service
Pear Bearing Acreage, Yield, Production, Utilization, Price, and Value by Type – States and United States: 2010-2012
Type, State and year
Bearing acreage Yield per acre 1
Production Utilization
Total Utilized Fresh Processed
(acres) (tons) (tons) (tons) (tons) (tons)
Bartlett 2 ..................
California 2010 ..................... 2011 ..................... 2012 ..................... Oregon 2010 ..................... 2011 ..................... 2012 ..................... Washington 2010 ..................... 2011 ..................... 2012 ..................... United States ........... 2010 ..................... 2011 ..................... 2012 ..................... Other
3 .....................
California 2010 ..................... 2011 ..................... 2012 ..................... Oregon 2010 ..................... 2011 ..................... 2012 ..................... Washington 2010 ..................... 2011 ..................... 2012 ..................... United States ........... 2010 ..................... 2011 ..................... 2012 .....................
10,000 10,000 8,700
4,200 4,000 3,800
10,000 9,500 9,500
24,200 23,500 22,000
4,000 4,000 2,800
12,000 11,400 10,800
13,000 12,000 12,000
29,000 27,400 25,600
17.00 19.50 18.70
11.20 11.80 16.10
16.80 19.80 19.10
15.90 18.30 18.40
12.50 14.30 16.10
12.10 15.80 17.30
17.10 23.30 17.50
14.40 18.90 17.30
170,000 195,000 163,000
47,000 47,000 61,000
168,000 188,000 181,000
385,000 430,000 405,000
50,000 57,000 45,000
145,000 180,000 187,000
222,000 280,000 210,000
417,000 517,000 442,000
170,000 195,000 163,000
47,000 47,000 61,000
168,000 188,000 181,000
385,000 430,000 405,000
50,000 57,000 45,000
145,000 180,000 187,000
222,000 280,000 210,000
417,000 517,000 442,000
55,000 64,000 53,000
31,000 29,000 30,000
63,000 68,000 76,000
149,000 161,000 159,000
(D) (D) (D)
(D) (D) (D)
(D) (D) (D)
373,000 469,000 389,000
115,000 131,000 110,000
16,000 18,000 31,000
105,000 120,000 105,000
236,000 269,000 246,000
(D) (D) (D)
(D) (D) (D)
(D) (D) (D)
44,000 48,000 53,000
See footnote(s) at end of table. --continued
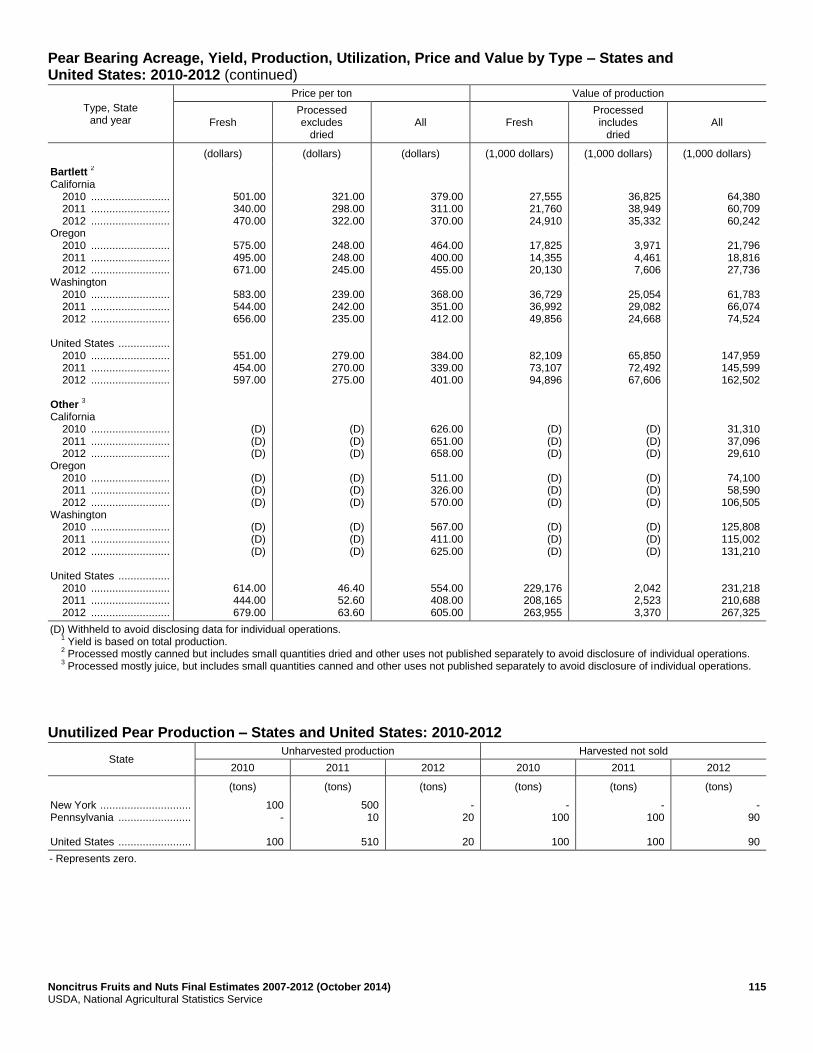
Noncitrus Fruits and Nuts Final Estimates 2007-2012 (October 2014) 115 USDA, National Agricultural Statistics Service
Pear Bearing Acreage, Yield, Production, Utilization, Price and Value by Type – States and United States: 2010-2012 (continued)
Type, State and year
Price per ton Value of production
Fresh Processed excludes
dried All Fresh
Processed includes
dried All
(dollars) (dollars) (dollars) (1,000 dollars) (1,000 dollars) (1,000 dollars)
Bartlett 2
California 2010 .......................... 2011 .......................... 2012 .......................... Oregon 2010 .......................... 2011 .......................... 2012 .......................... Washington 2010 .......................... 2011 .......................... 2012 .......................... United States ................. 2010 .......................... 2011 .......................... 2012 .......................... Other
3
California 2010 .......................... 2011 .......................... 2012 .......................... Oregon 2010 .......................... 2011 .......................... 2012 .......................... Washington 2010 .......................... 2011 .......................... 2012 .......................... United States ................. 2010 .......................... 2011 .......................... 2012 ..........................
501.00 340.00 470.00
575.00 495.00 671.00
583.00 544.00 656.00
551.00 454.00 597.00
(D) (D) (D)
(D) (D) (D)
(D) (D) (D)
614.00 444.00 679.00
321.00 298.00 322.00
248.00 248.00 245.00
239.00 242.00 235.00
279.00 270.00 275.00
(D) (D) (D)
(D) (D) (D)
(D) (D) (D)
46.40 52.60 63.60
379.00 311.00 370.00
464.00 400.00 455.00
368.00 351.00 412.00
384.00 339.00 401.00
626.00 651.00 658.00
511.00 326.00 570.00
567.00 411.00 625.00
554.00 408.00 605.00
27,555 21,760 24,910
17,825 14,355 20,130
36,729 36,992 49,856
82,109 73,107 94,896
(D) (D) (D)
(D) (D) (D)
(D) (D) (D)
229,176 208,165 263,955
36,825 38,949 35,332
3,971 4,461 7,606
25,054 29,082 24,668
65,850 72,492 67,606
(D) (D) (D)
(D) (D) (D)
(D) (D) (D)
2,042 2,523 3,370
64,380 60,709 60,242
21,796 18,816 27,736
61,783 66,074 74,524
147,959 145,599 162,502
31,310 37,096 29,610
74,100 58,590
106,505
125,808 115,002 131,210
231,218 210,688 267,325
(D) Withheld to avoid disclosing data for individual operations. 1
Yield is based on total production. 2
Processed mostly canned but includes small quantities dried and other uses not published separately to avoid disclosure of individual operations. 3
Processed mostly juice, but includes small quantities canned and other uses not published separately to avoid disclosure of individual operations.
Unutilized Pear Production – States and United States: 2010-2012
State Unharvested production Harvested not sold
2010 2011 2012 2010 2011 2012
(tons) (tons) (tons) (tons) (tons) (tons)
New York .............................. Pennsylvania ........................ United States ........................
100 -
100
500 10
510
- 20
20
- 100
100
- 100
100
- 90
90
- Represents zero.
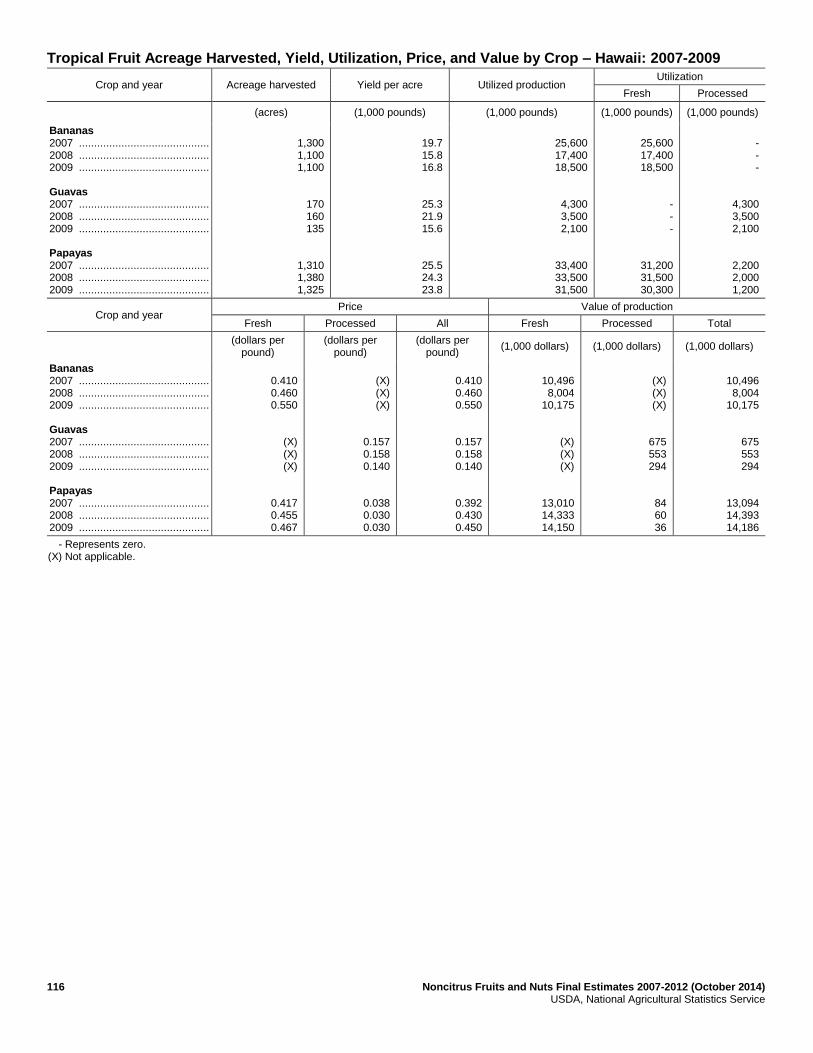
116 Noncitrus Fruits and Nuts Final Estimates 2007-2012 (October 2014) USDA, National Agricultural Statistics Service
Tropical Fruit Acreage Harvested, Yield, Utilization, Price, and Value by Crop – Hawaii: 2007-2009
Crop and year Acreage harvested Yield per acre Utilized production Utilization
Fresh Processed
(acres) (1,000 pounds) (1,000 pounds) (1,000 pounds) (1,000 pounds)
Bananas 2007 ........................................... 2008 ........................................... 2009 ........................................... Guavas 2007 ........................................... 2008 ........................................... 2009 ........................................... Papayas 2007 ........................................... 2008 ........................................... 2009 ...........................................
1,300 1,100 1,100
170 160 135
1,310 1,380 1,325
19.7 15.8 16.8
25.3 21.9 15.6
25.5 24.3 23.8
25,600 17,400 18,500
4,300 3,500 2,100
33,400 33,500 31,500
25,600 17,400 18,500
- - -
31,200 31,500 30,300
- - -
4,300 3,500 2,100
2,200 2,000 1,200
Crop and year Price Value of production
Fresh Processed All Fresh Processed Total
(dollars per
pound) (dollars per
pound) (dollars per
pound) (1,000 dollars) (1,000 dollars) (1,000 dollars)
Bananas 2007 ........................................... 2008 ........................................... 2009 ........................................... Guavas 2007 ........................................... 2008 ........................................... 2009 ........................................... Papayas 2007 ........................................... 2008 ........................................... 2009 ...........................................
0.410 0.460 0.550
(X) (X) (X)
0.417 0.455 0.467
(X) (X) (X)
0.157 0.158 0.140
0.038 0.030 0.030
0.410 0.460 0.550
0.157 0.158 0.140
0.392 0.430 0.450
10,496 8,004
10,175
(X) (X) (X)
13,010 14,333 14,150
(X) (X) (X)
675 553 294
84 60 36
10,496 8,004
10,175
675 553 294
13,094 14,393 14,186
- Represents zero. (X) Not applicable.

Noncitrus Fruits and Nuts Final Estimates 2007-2012 (October 2014) 117 USDA, National Agricultural Statistics Service
Tropical Fruit Acreage Harvested, Yield, Utilization, Price, and Value by Crop – Hawaii: 2010-2012
Crop and year Acreage harvested Yield per acre Utilized production Utilization
Fresh Processed
(acres) (1,000 pounds) (1,000 pounds) (1,000 pounds) (1,000 pounds)
Bananas 2010 ........................................... 2011 ........................................... 2012 ........................................... Guavas 2010 ........................................... 2011 ........................................... 2012 ........................................... Papayas 2010 ........................................... 2011 ........................................... 2012 ...........................................
1,100 1,000 (NA)
115 110
(NA)
1,350 1,300 (NA)
16.2 17.4 (NA)
11.3 17.3 (NA)
22.3 22.0 (NA)
17,800 17,400
(NA)
1,300 1,900 (NA)
30,100 28,600
(NA)
17,800 17,400
(NA)
(NA) (NA) (NA)
29,200 27,700
(NA)
(NA) (NA) (NA)
1,300 1,900 (NA)
900 900
(NA)
Crop and year Price Value of production
Fresh Processed All Fresh Processed Total
Bananas 2010 ........................................... 2011 ........................................... 2012 ........................................... Guavas 2010 ........................................... 2011 ........................................... 2012 ........................................... Papayas 2010 ........................................... 2011 ........................................... 2012 ...........................................
0.600 0.650 (NA)
(X) (X) (X)
0.380 0.350 (NA)
(X) (X) (X)
0.169 0.170 (NA)
0.030 0.030 (NA)
0.600 0.650 (NA)
0.169 0.170 (NA)
0.370 0.340 (NA)
10,680 11,310
(NA)
(X) (X) (X)
11,096 9,695 (NA)
(X) (X) (X)
220 323
(NA)
27 27
(NA)
10,680 11,310
(NA)
220 323
(NA)
11,123 9,722 (NA)
(NA) Not available. (X) Not applicable.
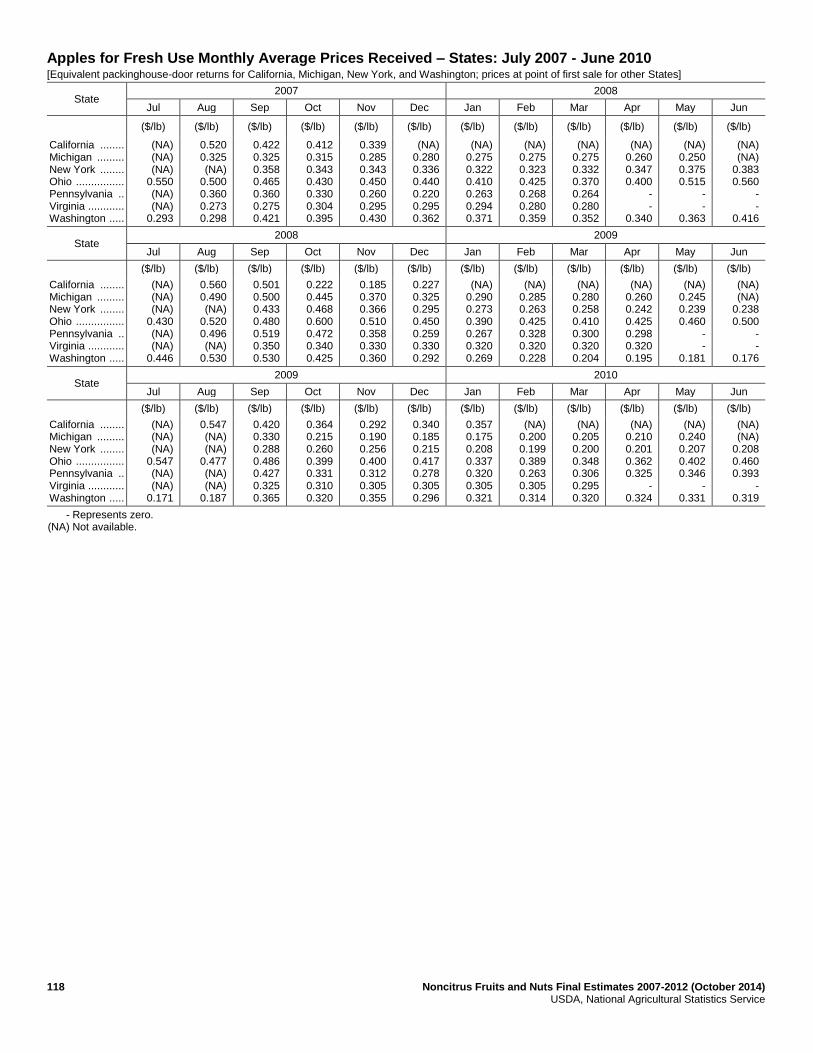
118 Noncitrus Fruits and Nuts Final Estimates 2007-2012 (October 2014) USDA, National Agricultural Statistics Service
Apples for Fresh Use Monthly Average Prices Received – States: July 2007 - June 2010 [Equivalent packinghouse-door returns for California, Michigan, New York, and Washington; prices at point of first sale for other States]
State 2007 2008
Jul Aug Sep Oct Nov Dec Jan Feb Mar Apr May Jun
($/lb) ($/lb) ($/lb) ($/lb) ($/lb) ($/lb) ($/lb) ($/lb) ($/lb) ($/lb) ($/lb) ($/lb)
California ........ Michigan ......... New York ........ Ohio ................ Pennsylvania .. Virginia ............ Washington .....
(NA) (NA) (NA)
0.550 (NA) (NA)
0.293
0.520 0.325 (NA)
0.500 0.360 0.273 0.298
0.422 0.325 0.358 0.465 0.360 0.275 0.421
0.412 0.315 0.343 0.430 0.330 0.304 0.395
0.339 0.285 0.343 0.450 0.260 0.295 0.430
(NA) 0.280 0.336 0.440 0.220 0.295 0.362
(NA) 0.275 0.322 0.410 0.263 0.294 0.371
(NA) 0.275 0.323 0.425 0.268 0.280 0.359
(NA) 0.275 0.332 0.370 0.264 0.280 0.352
(NA) 0.260 0.347 0.400
- -
0.340
(NA) 0.250 0.375 0.515
- -
0.363
(NA) (NA)
0.383 0.560
- -
0.416
State 2008 2009
Jul Aug Sep Oct Nov Dec Jan Feb Mar Apr May Jun
($/lb) ($/lb) ($/lb) ($/lb) ($/lb) ($/lb) ($/lb) ($/lb) ($/lb) ($/lb) ($/lb) ($/lb)
California ........ Michigan ......... New York ........ Ohio ................ Pennsylvania .. Virginia ............ Washington .....
(NA) (NA) (NA)
0.430 (NA) (NA)
0.446
0.560 0.490 (NA)
0.520 0.496 (NA)
0.530
0.501 0.500 0.433 0.480 0.519 0.350 0.530
0.222 0.445 0.468 0.600 0.472 0.340 0.425
0.185 0.370 0.366 0.510 0.358 0.330 0.360
0.227 0.325 0.295 0.450 0.259 0.330 0.292
(NA) 0.290 0.273 0.390 0.267 0.320 0.269
(NA) 0.285 0.263 0.425 0.328 0.320 0.228
(NA) 0.280 0.258 0.410 0.300 0.320 0.204
(NA) 0.260 0.242 0.425 0.298 0.320 0.195
(NA) 0.245 0.239 0.460
- -
0.181
(NA) (NA)
0.238 0.500
- -
0.176
State 2009 2010
Jul Aug Sep Oct Nov Dec Jan Feb Mar Apr May Jun
($/lb) ($/lb) ($/lb) ($/lb) ($/lb) ($/lb) ($/lb) ($/lb) ($/lb) ($/lb) ($/lb) ($/lb)
California ........ Michigan ......... New York ........ Ohio ................ Pennsylvania .. Virginia ............ Washington .....
(NA) (NA) (NA)
0.547 (NA) (NA)
0.171
0.547 (NA) (NA)
0.477 (NA) (NA)
0.187
0.420 0.330 0.288 0.486 0.427 0.325 0.365
0.364 0.215 0.260 0.399 0.331 0.310 0.320
0.292 0.190 0.256 0.400 0.312 0.305 0.355
0.340 0.185 0.215 0.417 0.278 0.305 0.296
0.357 0.175 0.208 0.337 0.320 0.305 0.321
(NA) 0.200 0.199 0.389 0.263 0.305 0.314
(NA) 0.205 0.200 0.348 0.306 0.295 0.320
(NA) 0.210 0.201 0.362 0.325
- 0.324
(NA) 0.240 0.207 0.402 0.346
- 0.331
(NA) (NA)
0.208 0.460 0.393
- 0.319
- Represents zero. (NA) Not available.
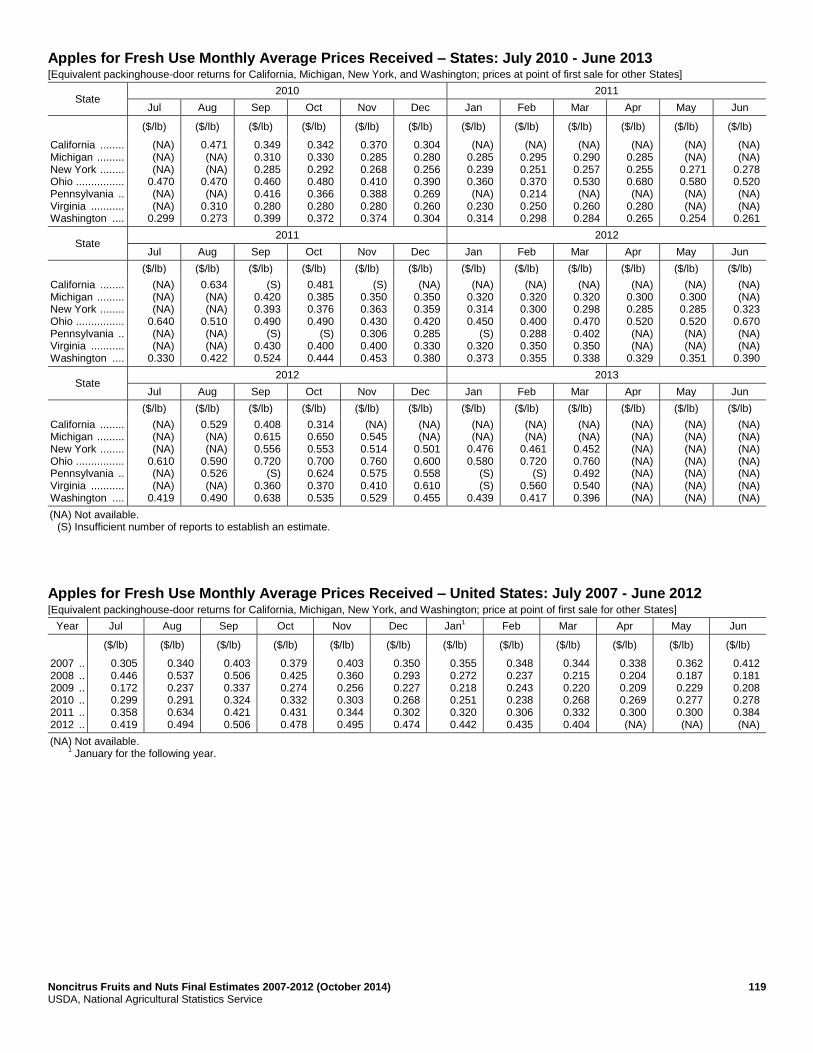
Noncitrus Fruits and Nuts Final Estimates 2007-2012 (October 2014) 119 USDA, National Agricultural Statistics Service
Apples for Fresh Use Monthly Average Prices Received – States: July 2010 - June 2013 [Equivalent packinghouse-door returns for California, Michigan, New York, and Washington; prices at point of first sale for other States]
State 2010 2011
Jul Aug Sep Oct Nov Dec Jan Feb Mar Apr May Jun
($/lb) ($/lb) ($/lb) ($/lb) ($/lb) ($/lb) ($/lb) ($/lb) ($/lb) ($/lb) ($/lb) ($/lb)
California ........ Michigan ......... New York ........ Ohio ................ Pennsylvania .. Virginia ........... Washington ....
(NA) (NA) (NA)
0.470 (NA) (NA)
0.299
0.471 (NA) (NA)
0.470 (NA)
0.310 0.273
0.349 0.310 0.285 0.460 0.416 0.280 0.399
0.342 0.330 0.292 0.480 0.366 0.280 0.372
0.370 0.285 0.268 0.410 0.388 0.280 0.374
0.304 0.280 0.256 0.390 0.269 0.260 0.304
(NA) 0.285 0.239 0.360 (NA)
0.230 0.314
(NA) 0.295 0.251 0.370 0.214 0.250 0.298
(NA) 0.290 0.257 0.530 (NA)
0.260 0.284
(NA) 0.285 0.255 0.680 (NA)
0.280 0.265
(NA) (NA)
0.271 0.580 (NA) (NA)
0.254
(NA) (NA)
0.278 0.520 (NA) (NA)
0.261
State 2011 2012
Jul Aug Sep Oct Nov Dec Jan Feb Mar Apr May Jun
($/lb) ($/lb) ($/lb) ($/lb) ($/lb) ($/lb) ($/lb) ($/lb) ($/lb) ($/lb) ($/lb) ($/lb)
California ........ Michigan ......... New York ........ Ohio ................ Pennsylvania .. Virginia ........... Washington ....
(NA) (NA) (NA)
0.640 (NA) (NA)
0.330
0.634 (NA) (NA)
0.510 (NA) (NA)
0.422
(S) 0.420 0.393 0.490
(S) 0.430 0.524
0.481 0.385 0.376 0.490
(S) 0.400 0.444
(S) 0.350 0.363 0.430 0.306 0.400 0.453
(NA) 0.350 0.359 0.420 0.285 0.330 0.380
(NA) 0.320 0.314 0.450
(S) 0.320 0.373
(NA) 0.320 0.300 0.400 0.288 0.350 0.355
(NA) 0.320 0.298 0.470 0.402 0.350 0.338
(NA) 0.300 0.285 0.520 (NA) (NA)
0.329
(NA) 0.300 0.285 0.520 (NA) (NA)
0.351
(NA) (NA)
0.323 0.670 (NA) (NA)
0.390
State 2012 2013
Jul Aug Sep Oct Nov Dec Jan Feb Mar Apr May Jun
($/lb) ($/lb) ($/lb) ($/lb) ($/lb) ($/lb) ($/lb) ($/lb) ($/lb) ($/lb) ($/lb) ($/lb)
California ........ Michigan ......... New York ........ Ohio ................ Pennsylvania .. Virginia ........... Washington ....
(NA) (NA) (NA)
0.610 (NA) (NA)
0.419
0.529 (NA) (NA)
0.590 0.526 (NA)
0.490
0.408 0.615 0.556 0.720
(S) 0.360 0.638
0.314 0.650 0.553 0.700 0.624 0.370 0.535
(NA) 0.545 0.514 0.760 0.575 0.410 0.529
(NA) (NA)
0.501 0.600 0.558 0.610 0.455
(NA) (NA)
0.476 0.580
(S) (S)
0.439
(NA) (NA)
0.461 0.720
(S) 0.560 0.417
(NA) (NA)
0.452 0.760 0.492 0.540 0.396
(NA) (NA) (NA) (NA) (NA) (NA) (NA)
(NA) (NA) (NA) (NA) (NA) (NA) (NA)
(NA) (NA) (NA) (NA) (NA) (NA) (NA)
(NA) Not available. (S) Insufficient number of reports to establish an estimate.
Apples for Fresh Use Monthly Average Prices Received – United States: July 2007 - June 2012 [Equivalent packinghouse-door returns for California, Michigan, New York, and Washington; price at point of first sale for other States]
Year Jul Aug Sep Oct Nov Dec Jan1 Feb Mar Apr May Jun
($/lb) ($/lb) ($/lb) ($/lb) ($/lb) ($/lb) ($/lb) ($/lb) ($/lb) ($/lb) ($/lb) ($/lb)
2007 .. 2008 .. 2009 .. 2010 .. 2011 .. 2012 ..
0.305 0.446 0.172 0.299 0.358 0.419
0.340 0.537 0.237 0.291 0.634 0.494
0.403 0.506 0.337 0.324 0.421 0.506
0.379 0.425 0.274 0.332 0.431 0.478
0.403 0.360 0.256 0.303 0.344 0.495
0.350 0.293 0.227 0.268 0.302 0.474
0.355 0.272 0.218 0.251 0.320 0.442
0.348 0.237 0.243 0.238 0.306 0.435
0.344 0.215 0.220 0.268 0.332 0.404
0.338 0.204 0.209 0.269 0.300 (NA)
0.362 0.187 0.229 0.277 0.300 (NA)
0.412 0.181 0.208 0.278 0.384 (NA)
(NA) Not available. 1
January for the following year.
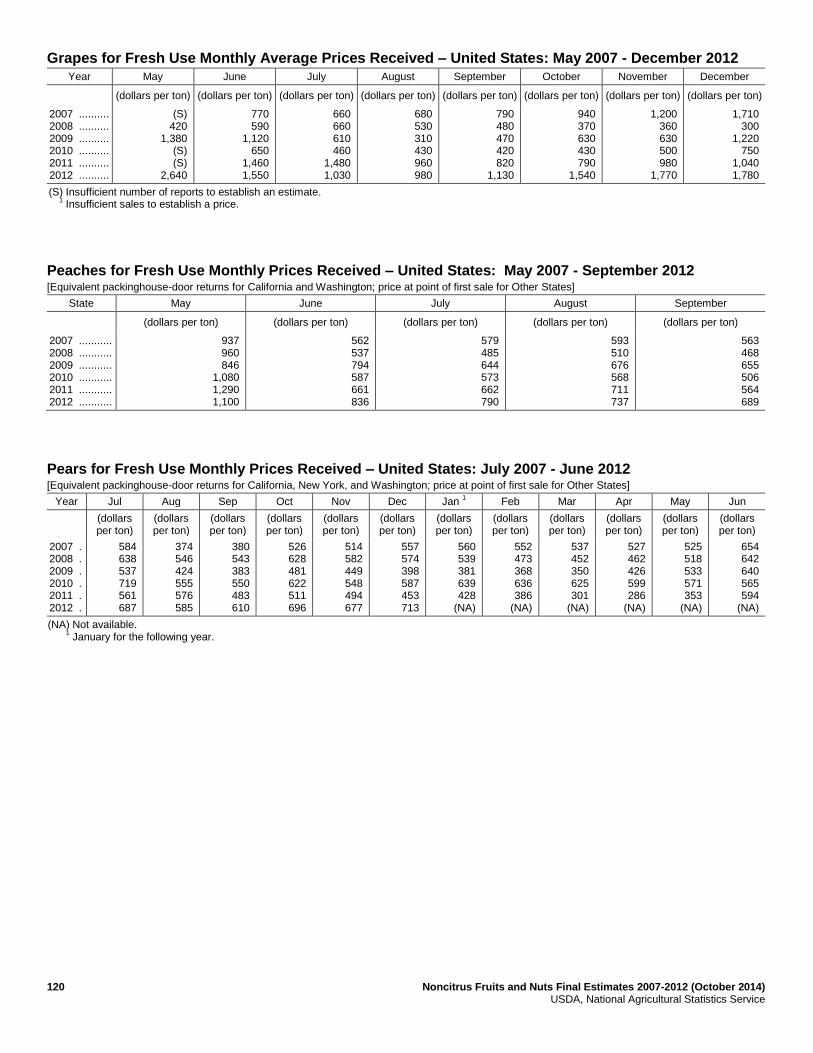
120 Noncitrus Fruits and Nuts Final Estimates 2007-2012 (October 2014) USDA, National Agricultural Statistics Service
Grapes for Fresh Use Monthly Average Prices Received – United States: May 2007 - December 2012
Year May June July August September October November December
(dollars per ton) (dollars per ton) (dollars per ton) (dollars per ton) (dollars per ton) (dollars per ton) (dollars per ton) (dollars per ton)
2007 .......... 2008 .......... 2009 .......... 2010 .......... 2011 .......... 2012 ..........
(S) 420
1,380 (S) (S)
2,640
770 590
1,120 650
1,460 1,550
660 660 610 460
1,480 1,030
680 530 310 430 960 980
790 480 470 420 820
1,130
940 370 630 430 790
1,540
1,200 360 630 500 980
1,770
1,710 300
1,220 750
1,040 1,780
(S) Insufficient number of reports to establish an estimate. 1
Insufficient sales to establish a price.
Peaches for Fresh Use Monthly Prices Received – United States: May 2007 - September 2012 [Equivalent packinghouse-door returns for California and Washington; price at point of first sale for Other States]
State May June July August September
(dollars per ton) (dollars per ton) (dollars per ton) (dollars per ton) (dollars per ton)
2007 ........... 2008 ........... 2009 ........... 2010 ........... 2011 ........... 2012 ...........
937 960 846
1,080 1,290 1,100
562 537 794 587 661 836
579 485 644 573 662 790
593 510 676 568 711 737
563 468 655 506 564 689
Pears for Fresh Use Monthly Prices Received – United States: July 2007 - June 2012 [Equivalent packinghouse-door returns for California, New York, and Washington; price at point of first sale for Other States]
Year Jul Aug Sep Oct Nov Dec Jan 1 Feb Mar Apr May Jun
(dollars per ton)
(dollars per ton)
(dollars per ton)
(dollars per ton)
(dollars per ton)
(dollars per ton)
(dollars per ton)
(dollars per ton)
(dollars per ton)
(dollars per ton)
(dollars per ton)
(dollars per ton)
2007 . 2008 . 2009 . 2010 . 2011 . 2012 .
584 638 537 719 561 687
374 546 424 555 576 585
380 543 383 550 483 610
526 628 481 622 511 696
514 582 449 548 494 677
557 574 398 587 453 713
560 539 381 639 428
(NA)
552 473 368 636 386
(NA)
537 452 350 625 301
(NA)
527 462 426 599 286
(NA)
525 518 533 571 353
(NA)
654 642 640 565 594
(NA)
(NA) Not available. 1
January for the following year.

Noncitrus Fruits and Nuts Final Estimates 2007-2012 (October 2014) 121 USDA, National Agricultural Statistics Service
Tree Nut Bearing Acreage, Yield, Production, Price, and Value by Crop – States: 2007-2009
Crop, State, and year
Bearing acreage Yield per acre 1 Utilized production Price per unit
Value of utilized production
(acres) (tons) (tons) (dollars per ton) (1,000 dollars)
English walnuts, in-shell California 2007 ................................ 2008 ................................ 2009 ................................
218,000 230,000 240,000
1.50 1.90 1.82
328,000 436,000 437,000
2,290 1,280 1,710
751,120 558,080 747,270
Hazelnuts, in-shell Oregon 2007 ................................ 2008 ................................ 2009 ................................
28,600 28,300 28,700
1.29 1.13 1.64
37,000 32,000 47,000
2,040 1,620 1,690
75,480 51,840 79,430
(acres) (pounds) (1,000 pounds) (dollars per pound) (1,000 dollars)
Almonds, shelled 2 3
California 2007 ................................ 2008 ................................ 2009 ................................
640,000 710,000 750,000
2,170 2,300 1,880
1,390,000 1,630,000 1,410,000
1.750 1.450 1.650
2,401,875 2,343,200 2,293,500
Macadamia nuts, in-shell Hawaii 2007 ................................ 2008 ................................ 2009 ................................
15,000 15,000 15,000
2,730 3,330 2,800
41,000 50,000 42,000
0.600 0.670 0.700
24,600 33,500 29,400
Pistachios, in-shell California 2007 ................................ 2008 ................................ 2009 ................................
115,000 118,000 126,000
3,620 2,360 2,820
416,000 278,000 355,000
1.410 2.050 1.670
586,560 569,900 592,850
1 Yield is based on utilized production.
2 Price and value are based on the edible portion of the crop only. Production includes inedible quantities of no value as follows: 2007 - 17.5 million pounds; 2008 - 14.0 million pounds; 2009 - 20.0 million pounds.
3 Shelling ratios are: 2007 - .573; 2008 - .578; 2009 - .597.
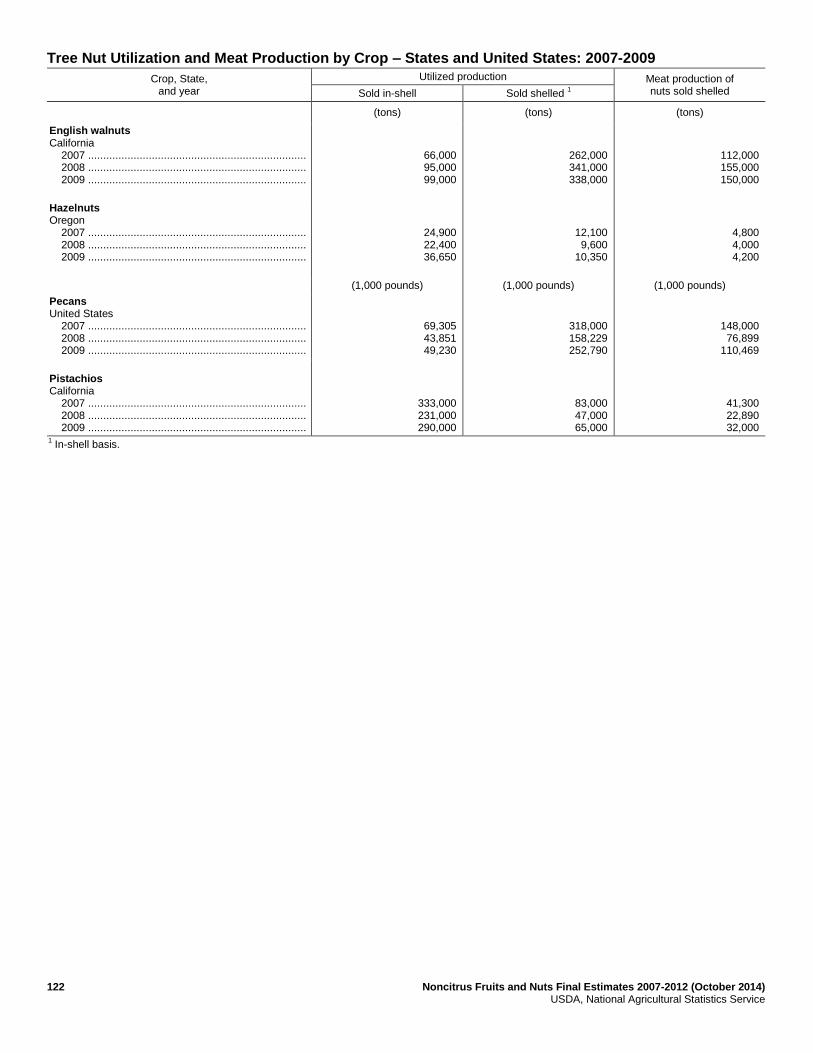
122 Noncitrus Fruits and Nuts Final Estimates 2007-2012 (October 2014) USDA, National Agricultural Statistics Service
Tree Nut Utilization and Meat Production by Crop – States and United States: 2007-2009
Crop, State, and year
Utilized production Meat production of nuts sold shelled Sold in-shell Sold shelled
1
(tons) (tons) (tons)
English walnuts California 2007 ........................................................................ 2008 ........................................................................ 2009 ........................................................................
66,000 95,000 99,000
262,000 341,000 338,000
112,000 155,000 150,000
Hazelnuts Oregon 2007 ........................................................................ 2008 ........................................................................ 2009 ........................................................................
24,900 22,400 36,650
12,100 9,600
10,350
4,800 4,000 4,200
(1,000 pounds) (1,000 pounds) (1,000 pounds)
Pecans United States 2007 ........................................................................ 2008 ........................................................................ 2009 ........................................................................
69,305 43,851 49,230
318,000 158,229 252,790
148,000 76,899
110,469
Pistachios California 2007 ........................................................................ 2008 ........................................................................ 2009 ........................................................................
333,000 231,000 290,000
83,000 47,000 65,000
41,300 22,890 32,000
1 In-shell basis.
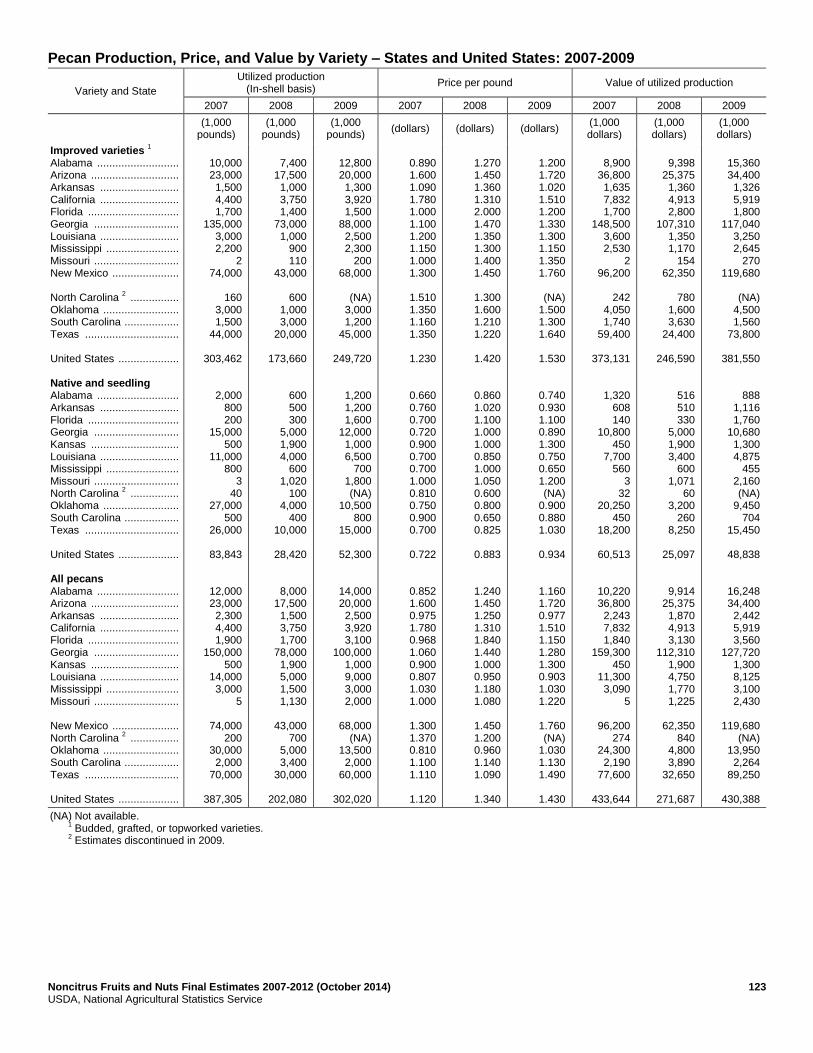
Noncitrus Fruits and Nuts Final Estimates 2007-2012 (October 2014) 123 USDA, National Agricultural Statistics Service
Pecan Production, Price, and Value by Variety – States and United States: 2007-2009
Variety and State
Utilized production (In-shell basis)
Price per pound Value of utilized production
2007 2008 2009 2007 2008 2009 2007 2008 2009
(1,000
pounds) (1,000
pounds) (1,000
pounds) (dollars) (dollars) (dollars)
(1,000 dollars)
(1,000 dollars)
(1,000 dollars)
Improved varieties 1
Alabama ........................... Arizona ............................. Arkansas .......................... California .......................... Florida .............................. Georgia ............................ Louisiana .......................... Mississippi ........................ Missouri ............................ New Mexico ...................... North Carolina
2 ................
Oklahoma ......................... South Carolina .................. Texas ............................... United States .................... Native and seedling Alabama ........................... Arkansas .......................... Florida .............................. Georgia ............................ Kansas ............................. Louisiana .......................... Mississippi ........................ Missouri ............................ North Carolina
2 ................
Oklahoma ......................... South Carolina .................. Texas ............................... United States .................... All pecans Alabama ........................... Arizona ............................. Arkansas .......................... California .......................... Florida .............................. Georgia ............................ Kansas ............................. Louisiana .......................... Mississippi ........................ Missouri ............................ New Mexico ...................... North Carolina
2 ................
Oklahoma ......................... South Carolina .................. Texas ............................... United States ....................
10,000 23,000 1,500 4,400 1,700
135,000 3,000 2,200
2 74,000
160
3,000 1,500
44,000
303,462
2,000 800 200
15,000 500
11,000 800
3 40
27,000 500
26,000
83,843
12,000 23,000 2,300 4,400 1,900
150,000 500
14,000 3,000
5
74,000 200
30,000 2,000
70,000
387,305
7,400
17,500 1,000 3,750 1,400
73,000 1,000
900 110
43,000
600 1,000 3,000
20,000
173,660
600 500 300
5,000 1,900 4,000
600 1,020
100 4,000
400 10,000
28,420
8,000 17,500 1,500 3,750 1,700
78,000 1,900 5,000 1,500 1,130
43,000
700 5,000 3,400
30,000
202,080
12,800 20,000 1,300 3,920 1,500
88,000 2,500 2,300
200 68,000
(NA)
3,000 1,200
45,000
249,720
1,200 1,200 1,600
12,000 1,000 6,500
700 1,800 (NA)
10,500 800
15,000
52,300
14,000 20,000 2,500 3,920 3,100
100,000 1,000 9,000 3,000 2,000
68,000
(NA) 13,500 2,000
60,000
302,020
0.890 1.600 1.090 1.780 1.000 1.100 1.200 1.150 1.000 1.300
1.510 1.350 1.160 1.350
1.230
0.660 0.760 0.700 0.720 0.900 0.700 0.700 1.000 0.810 0.750 0.900 0.700
0.722
0.852 1.600 0.975 1.780 0.968 1.060 0.900 0.807 1.030 1.000
1.300 1.370 0.810 1.100 1.110
1.120
1.270 1.450 1.360 1.310 2.000 1.470 1.350 1.300 1.400 1.450
1.300 1.600 1.210 1.220
1.420
0.860 1.020 1.100 1.000 1.000 0.850 1.000 1.050 0.600 0.800 0.650 0.825
0.883
1.240 1.450 1.250 1.310 1.840 1.440 1.000 0.950 1.180 1.080
1.450 1.200 0.960 1.140 1.090
1.340
1.200 1.720 1.020 1.510 1.200 1.330 1.300 1.150 1.350 1.760
(NA)
1.500 1.300 1.640
1.530
0.740 0.930 1.100 0.890 1.300 0.750 0.650 1.200 (NA)
0.900 0.880 1.030
0.934
1.160 1.720 0.977 1.510 1.150 1.280 1.300 0.903 1.030 1.220
1.760 (NA)
1.030 1.130 1.490
1.430
8,900
36,800 1,635 7,832 1,700
148,500 3,600 2,530
2 96,200
242
4,050 1,740
59,400
373,131
1,320 608 140
10,800 450
7,700 560
3 32
20,250 450
18,200
60,513
10,220 36,800 2,243 7,832 1,840
159,300 450
11,300 3,090
5
96,200 274
24,300 2,190
77,600
433,644
9,398
25,375 1,360 4,913 2,800
107,310 1,350 1,170
154 62,350
780
1,600 3,630
24,400
246,590
516 510 330
5,000 1,900 3,400
600 1,071
60 3,200
260 8,250
25,097
9,914 25,375 1,870 4,913 3,130
112,310 1,900 4,750 1,770 1,225
62,350
840 4,800 3,890
32,650
271,687
15,360 34,400 1,326 5,919 1,800
117,040 3,250 2,645
270 119,680
(NA)
4,500 1,560
73,800
381,550
888 1,116 1,760
10,680 1,300 4,875
455 2,160 (NA)
9,450 704
15,450
48,838
16,248 34,400 2,442 5,919 3,560
127,720 1,300 8,125 3,100 2,430
119,680
(NA) 13,950 2,264
89,250
430,388
(NA) Not available. 1
Budded, grafted, or topworked varieties. 2
Estimates discontinued in 2009.

124 Noncitrus Fruits and Nuts Final Estimates 2007-2012 (October 2014) USDA, National Agricultural Statistics Service
Tree Nut Bearing Acreage, Yield, Production, Price, and Value by Crop – States: 2010-2012
Crop, State, and year
Bearing acreage Yield per acre 1 Utilized production Price per unit
Value of utilized production
(acres) (tons) (tons) (dollars per ton) (1,000 dollars)
English walnuts, in-shell California 2010 ................................. 2011 ................................. 2012 .................................
255,000 265,000 270,000
1.98 1.74 1.84
504,000 461,000 497,000
2,040 2,900 3,030
1,028,160 1,336,900 1,505,910
Hazelnuts, in-shell Oregon 2010 ................................. 2011 ................................. 2012 .................................
29,000 28,500 29,000
0.97 1.35 1.22
28,000 38,500 35,500
2,410 2,330 1,830
67,480 89,705 64,965
(acres) (pounds) (1,000 pounds) (dollars per pound) (1,000 dollars)
Almonds, shelled 2 3
California 2010 ................................. 2011 ................................. 2012 .................................
770,000 800,000 820,000
2,130 2,540 2,310
1,640,000 2,030,000 1,890,000
1.790 1.990 2.580
2,903,380 4,007,860 4,816,860
Macadamia nuts, in-shell Hawaii 2010 ................................. 2011 ................................. 2012 .................................
15,000 15,000 15,000
2,670 3,270 2,930
40,000 49,000 44,000
0.750 0.780 0.800
30,000 38,220 35,200
Pistachios, in-shell ............. California ............................. 2010 ................................. 2011 ................................. 2012 .................................
137,000 153,000 182,000
3,810 2,900 3,030
522,000 444,000 551,000
2.220 1.980 2.610
1,158,840 879,120
1,438,110 1 Yield is based on utilized production.
2 Price and value are based on the edible portion of the crop only. Production includes inedible quantities of no value as follows: 2010 - 18.0 million pounds; 2011 - 16.0 million pounds; 2012 - 23.0 million pounds.
3 Shelling ratios are: 2010 - .580; 2011 - .596; 2012 - .571.

Noncitrus Fruits and Nuts Final Estimates 2007-2012 (October 2014) 125 USDA, National Agricultural Statistics Service
Tree Nut Utilization and Meat Production by Crop – States and United States: 2010-2012
Crop, State, and year
Utilized production Meat production of nuts sold shelled Sold in-shell Sold shelled
1
(tons) (tons) (tons)
English walnuts California 2010 ........................................................................ 2011 ........................................................................ 2012 ........................................................................
141,000 125,000 153,000
363,000 336,000 344,000
159,000 146,000 153,000
Hazelnuts Oregon 2010 ........................................................................ 2011 ........................................................................ 2012 ........................................................................
20,050 29,300 28,000
7,950 9,200 7,500
3,100 3,730 3,000
(1,000 pounds) (1,000 pounds) (1,000 pounds)
Pecans United States 2010 ........................................................................ 2011 ........................................................................ 2012 ........................................................................
89,884 220,345
(NA)
203,856 49,335
(NA)
97,443 101,799
(NA)
Pistachios California 2010 ........................................................................ 2011 ........................................................................ 2012 ........................................................................
378,000 341,000 464,000
144,000 103,000 87,000
69,000 51,500 43,935
(NA) Not available. 1
In-shell basis.
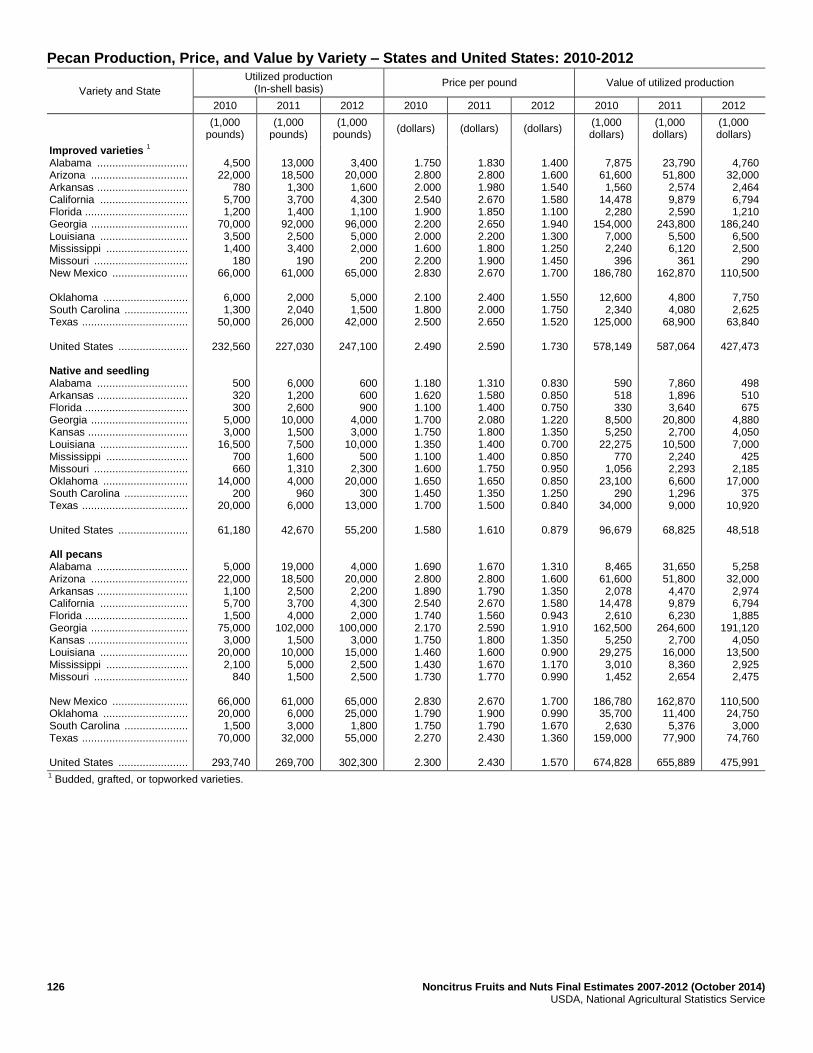
126 Noncitrus Fruits and Nuts Final Estimates 2007-2012 (October 2014) USDA, National Agricultural Statistics Service
Pecan Production, Price, and Value by Variety – States and United States: 2010-2012
Variety and State
Utilized production (In-shell basis)
Price per pound Value of utilized production
2010 2011 2012 2010 2011 2012 2010 2011 2012
(1,000
pounds) (1,000
pounds) (1,000
pounds) (dollars) (dollars) (dollars)
(1,000 dollars)
(1,000 dollars)
(1,000 dollars)
Improved varieties 1
Alabama .............................. Arizona ................................ Arkansas .............................. California ............................. Florida .................................. Georgia ................................ Louisiana ............................. Mississippi ........................... Missouri ............................... New Mexico ......................... Oklahoma ............................ South Carolina ..................... Texas ................................... United States ....................... Native and seedling Alabama .............................. Arkansas .............................. Florida .................................. Georgia ................................ Kansas ................................. Louisiana ............................. Mississippi ........................... Missouri ............................... Oklahoma ............................ South Carolina ..................... Texas ................................... United States ....................... All pecans Alabama .............................. Arizona ................................ Arkansas .............................. California ............................. Florida .................................. Georgia ................................ Kansas ................................. Louisiana ............................. Mississippi ........................... Missouri ............................... New Mexico ......................... Oklahoma ............................ South Carolina ..................... Texas ................................... United States .......................
4,500
22,000 780
5,700 1,200
70,000 3,500 1,400
180 66,000
6,000 1,300
50,000
232,560
500 320 300
5,000 3,000
16,500 700 660
14,000 200
20,000
61,180
5,000 22,000 1,100 5,700 1,500
75,000 3,000
20,000 2,100
840
66,000 20,000 1,500
70,000
293,740
13,000 18,500 1,300 3,700 1,400
92,000 2,500 3,400
190 61,000
2,000 2,040
26,000
227,030
6,000 1,200 2,600
10,000 1,500 7,500 1,600 1,310 4,000
960 6,000
42,670
19,000 18,500 2,500 3,700 4,000
102,000 1,500
10,000 5,000 1,500
61,000 6,000 3,000
32,000
269,700
3,400
20,000 1,600 4,300 1,100
96,000 5,000 2,000
200 65,000
5,000 1,500
42,000
247,100
600 600 900
4,000 3,000
10,000 500
2,300 20,000
300 13,000
55,200
4,000 20,000 2,200 4,300 2,000
100,000 3,000
15,000 2,500 2,500
65,000 25,000 1,800
55,000
302,300
1.750 2.800 2.000 2.540 1.900 2.200 2.000 1.600 2.200 2.830
2.100 1.800 2.500
2.490
1.180 1.620 1.100 1.700 1.750 1.350 1.100 1.600 1.650 1.450 1.700
1.580
1.690 2.800 1.890 2.540 1.740 2.170 1.750 1.460 1.430 1.730
2.830 1.790 1.750 2.270
2.300
1.830 2.800 1.980 2.670 1.850 2.650 2.200 1.800 1.900 2.670
2.400 2.000 2.650
2.590
1.310 1.580 1.400 2.080 1.800 1.400 1.400 1.750 1.650 1.350 1.500
1.610
1.670 2.800 1.790 2.670 1.560 2.590 1.800 1.600 1.670 1.770
2.670 1.900 1.790 2.430
2.430
1.400 1.600 1.540 1.580 1.100 1.940 1.300 1.250 1.450 1.700
1.550 1.750 1.520
1.730
0.830 0.850 0.750 1.220 1.350 0.700 0.850 0.950 0.850 1.250 0.840
0.879
1.310 1.600 1.350 1.580 0.943 1.910 1.350 0.900 1.170 0.990
1.700 0.990 1.670 1.360
1.570
7,875
61,600 1,560
14,478 2,280
154,000 7,000 2,240
396 186,780
12,600
2,340 125,000
578,149
590 518 330
8,500 5,250
22,275 770
1,056 23,100
290 34,000
96,679
8,465 61,600
2,078 14,478
2,610 162,500
5,250 29,275
3,010 1,452
186,780 35,700
2,630 159,000
674,828
23,790 51,800 2,574 9,879 2,590
243,800 5,500 6,120
361 162,870
4,800 4,080
68,900
587,064
7,860 1,896 3,640
20,800 2,700
10,500 2,240 2,293 6,600 1,296 9,000
68,825
31,650 51,800 4,470 9,879 6,230
264,600 2,700
16,000 8,360 2,654
162,870 11,400 5,376
77,900
655,889
4,760
32,000 2,464 6,794 1,210
186,240 6,500 2,500
290 110,500
7,750 2,625
63,840
427,473
498 510 675
4,880 4,050 7,000
425 2,185
17,000 375
10,920
48,518
5,258 32,000 2,974 6,794 1,885
191,120 4,050
13,500 2,925 2,475
110,500 24,750 3,000
74,760
475,991 1 Budded, grafted, or topworked varieties.
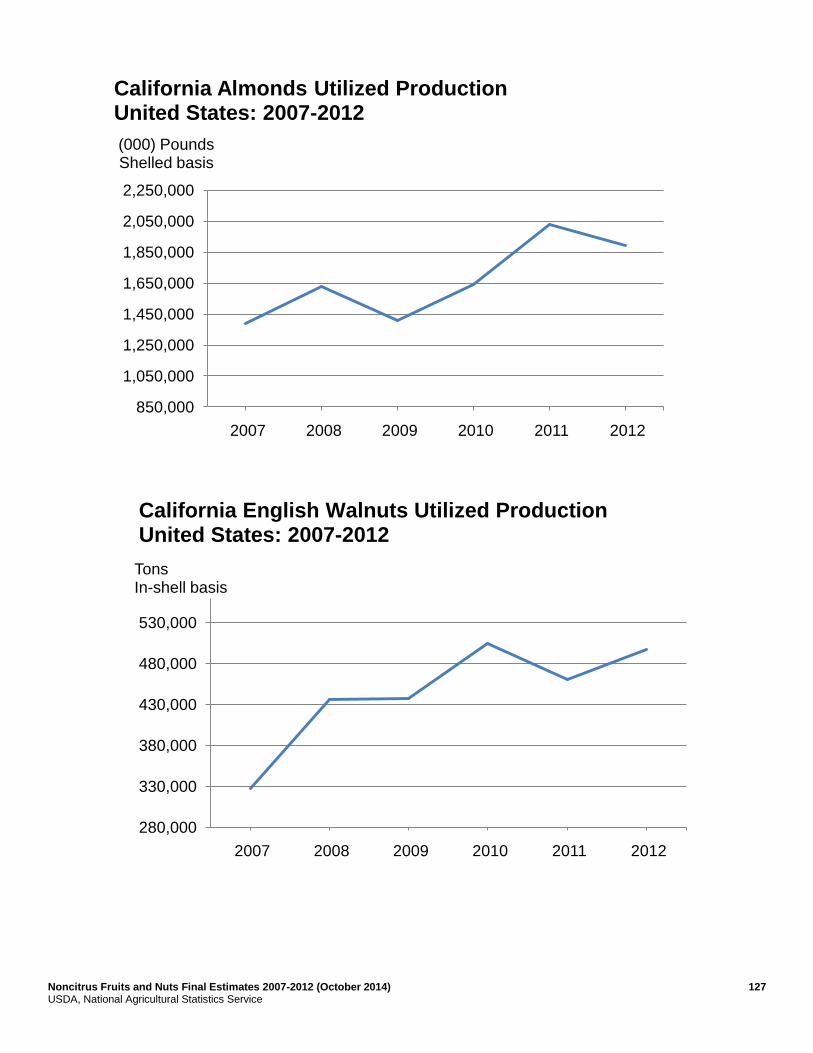
Noncitrus Fruits and Nuts Final Estimates 2007-2012 (October 2014) 127 USDA, National Agricultural Statistics Service
850,000
1,050,000
1,250,000
1,450,000
1,650,000
1,850,000
2,050,000
2,250,000
2007 2008 2009 2010 2011 2012
(000) PoundsShelled basis
California Almonds Utilized ProductionUnited States: 2007-2012
280,000
330,000
380,000
430,000
480,000
530,000
2007 2008 2009 2010 2011 2012
TonsIn-shell basis
California English Walnuts Utilized ProductionUnited States: 2007-2012
128 Noncitrus Fruits and Nuts Final Estimates 2007-2012 (October 2014) USDA, National Agricultural Statistics Service
Definition of Terms
Bearing acreage: An orchard, grove, or vineyard is considered to be of bearing age when it can normally be expected to
produce a commercially significant quantity of the crop. Bearing age is a function of many factors including variety,
rootstock, year planted, etc.
Apple crop: Apple production estimates are published only for commercial orchards, according to the laws governing
crop production reports (7 U.S.C 411b). Commercial orchards, under these laws, are defined as orchards of 100 or more
bearing trees.
Harvested not sold: Fruit of marketable quality that was picked but not sold for various reasons up to 2 percent of total
production is considered normal seasonal loss and is excluded from total production. Reported values are above and
beyond these normal seasonal losses.
Total production: The quantity of a crop actually harvested plus quantities which would have been acceptable for fresh
market or processing but were not harvested because of economic or natural reasons are included in production estimates.
Unutilized production: The difference between total and utilized production, which is marketable fruit not harvested for
economic or natural reasons and harvested fruit not sold or utilized, is unutilized production.
Unharvested production: Marketable fruit produced, but not harvested for various reasons, is unharvested production.
Unharvested amounts up to 2 percent of total production are considered normal seasonal losses and are excluded from
total production. Published estimates of unharvested production represent quantities above and beyond these normal
seasonal losses.
Utilization: These estimates refer to the first utilization, not necessarily the final utilization of a crop. For example, frozen
fruit includes some fruit that may be later used for making preserves. Grade-outs for fresh market fruit which are
processed are included in the processing quantity. Fruit graded-out from canning or freezing and utilized for juice is
included with juice.
Utilized production: The amount of a crop sold plus the quantities used at home or held in storage represents utilized
production.
Yield per acre: Unless otherwise stated, yield per acre is based on total production.
Noncitrus Fruits and Nuts Final Estimates 2007-2012 (October 2014) 129 USDA, National Agricultural Statistics Service
Price and Value Definitions
Price: Except where specified as monthly, prices in this report represent the Market Year Average (MYA) price. For a
crop sold for both fresh market and processing, the total crop MYA is a weighted average of the fresh and processing
prices.
Prices for fresh fruit represent the average price producers receive at the point of first sale. This is commonly referred to
as the average price as sold. The exception is fresh fruit sales in California, Michigan (apples only), New York (apples
only), and Washington which are equivalent returns at packinghouse door.
Prices for fruit sold for processing are equivalent returns for fruit delivered to the processing plant door except for
cranberries, California olives, and freestone peaches, which are priced at the first delivery point.
Value: Crop value estimates in this report cover the marketing season or crop year and should not be confused with cash
receipts which are based on a calendar year.
State MYA Price and Value Computations
Fresh Market Value
Fresh Market MYA * Fresh Market Utilization
Processed Value
Processed MYA * Processed Utilization
"All" Value
Fresh Market Value + Processed Value
"All" MYA
"All" Value / "All" Utilization
For commodities with components not identified by market channel, substitute breakdown name for fresh
market/processed and use the same procedure.
United States MYA Price and Value Computations
Fresh Market MYA
∑(Fresh Market Value For All States)
∑(Fresh Market Utilization For All States)
Processed MYA
∑(Processed Value For All States)
∑(Processed Utilization For All States)
"All" MYA
∑(Value For All States)
∑(Utilization For All States)

130 Noncitrus Fruits and Nuts Final Estimates 2007-2012 (October 2014) USDA, National Agricultural Statistics Service
Marketing Seasons for Noncitrus Fruits
Apples: August to June for Eastern States, excluding Georgia, New Jersey, and South Carolina; July to May for Central
States, excluding Iowa, Kentucky, Minnesota, Missouri, Tennessee, and Wisconsin; August to June for Western States,
excluding Arizona; August to December for all other states.
Apricots: May 15 to July 5 for California; June 10 to August 15 for Utah; June 20 to August 1 for Washington.
Avocados: November 1 to October for California; June 20 to March 1 for Florida; January 1 to December 31 for Hawaii.
Bananas: January 1 to December 31
Cherries, sweet: April 25 to June 15 for California; July 20 to August 20 for Montana; June to July for all other States.
Cherries, tart: June 25 to August 15
Cranberries: September 15 to January 1
Dates: August 15 to March 15
Figs: June 5 to October 30
Grapes: May 25 to July for Table (California); June 5 to July 31 for Raisin (California); August 15 to December 15 for
Wine (California and Washington); September 15 to November 1 for Juice (Washington); July to October for all other
States.
Guavas: January 1 to December 31
Kiwifruit: October 1 to May 31
Nectarines: April 30 to October 15
Olives: August 1 to July 31 for Fresh, Canned, and other processing; December 1 to November 30 for Crushed for Oil
Papayas: January 1 to December 31
Peaches: July 10 to September 15 for Clingstone (California); April 20 to October 10 for Freestone (California); May to
August for Georgia and South Carolina; July to September for all other States.
Pears: July to December for Bartlett (California, Oregon, and Washington); July to June for other (California, Oregon,
and Washington); August to November for all other States.
Plums: May 15 to October 20 for California
Prunes, dried: August 20 to April 15 for California
Prunes and plums: August 15 to October 15 for Fresh and Canning (Idaho, Michigan, Oregon, and Washington)

Noncitrus Fruits and Nuts Final Estimates 2007-2012 (October 2014) 131 USDA, National Agricultural Statistics Service
Marketing Seasons for Tree Nuts
Almonds: August 5 to November 15
Hazelnuts: October 1 to November 30
Macadamia nuts: July 1 to June 30
Pecans: October 1 to March 31
Pistachios: September 30 to January 30
Walnuts: September 15 to November 10
For detail by States, see Agricultural Handbook No. 729, Fruits and Tree Nuts: Blooming, Harvesting, and Marketing
Dates, December 2006.
132 Noncitrus Fruits and Nuts Final Estimates 2007-2012 (October 2014) USDA, National Agricultural Statistics Service
Information Contacts
Listed below are the commodity statisticians in the Crops Branch of the National Agricultural Statistics Service to contact
for additional information. E-mail inquiries may be sent to [email protected]
Lance Honig, Chief, Crops Branch ....................................................................................................... (202) 720-2127
Jorge Garcia-Pratts, Head, Fruits, Vegetables and Special Crops Section ............................................ (202) 720-2127
Vincent Davis – Fresh and Processing Vegetables, Onions, Strawberries, Cherries ....................... (202) 720-2157
Fred Granja – Apples, Apricots, Plums, Prunes, Tobacco .............................................................. (202) 720-9085
LaKeya Jones – Citrus, Coffee, Grapes, Sugar Crops, Tropical Fruits ............................................ (202) 720-5412
Greg Lemmons – Berries, Cranberries, Potatoes, Sweet Potatoes .................................................. (202) 720-4285
Dave Losh – Hops ............................................................................................................................ (360) 709-2400
Dan Norris – Austrian Winter Peas, Dry Edible Peas, Lentils, Mint,
Mushrooms, Peaches, Pears, Wrinkled Seed Peas, Dry Beans .................................................. (202) 720-3250
Daphne Schauber – Floriculture, Maple Syrup, Nursery, Tree Nuts .............................................. (202) 720-4215
Noncitrus Fruits and Nuts Final Estimates 2007-2012 (October 2014) 133 USDA, National Agricultural Statistics Service
Statistical Bulletin Publication Schedule Statistical Bulletins (SB): The National Agricultural Statistics Service will issue a series of nineteen bulletins containing
final estimates for agricultural data series based on the review of the 2012 Census of Agriculture and other information.
The product number, bulletin title, and tentative release dates are as follows.
SB1030 Farms and Land in Farms – Final Estimates 2008-2012 05/28/14
SB1031 Agricultural Land Values – Final Estimates 2009-2013 06/19/14
SB1032 Citrus Fruits – Final Estimates 2008-2012 08/26/14
SB1033 Vegetables – Final Estimates 2008-2012 08/26/14
SB1034 Cattle – Final Estimates 2009-2013 09/04/14
SB1035 Hogs and Pigs – Final Estimates 2008-2012 09/04/14
SB1036 Milk Cows and Production – Final Estimates 2008-2012 09/04/14
SB1037 Sheep and Goats – Final Estimates 2009-2013 09/04/14
SB1038 Chickens and Eggs – Final Estimates 2008-2012 09/04/14
SB1039 Honey – Final Estimates 2008-2012 09/04/14
SB1040 Meat Animals, PDI – Final Estimates 2008-2012 10/29/14
SB1041 Milk Disposition and Income – Final Estimates 2008-2012 10/29/14
SB1042 Poultry Production and Value – Final Estimates 2008-2012 10/29/14
SB1043 Noncitrus Fruits and Nuts – Final Estimates 2007-2012 10/30/14
SB1044 Field Crops – Final Estimates 2007-2012 11/03/14
SB1045 Rice Stocks – Final Estimates 2008-2013 11/03/14
SB1046 Stocks of Grains, Oilseeds, and Hay – Final Estimates 2008-2013 11/03/14
SB1047 Potatoes and Sweet Potatoes – Final Estimates 2008-2012 11/03/14
SB1048 Crop Values – Final Estimates 2007-2012 11/03/14
Agricultural Census Publications: The U. S. Department of Agriculture's National Agricultural Statistics Service
(NASS) released several products from the 2012 Census of Agriculture on May 2, 2014. The Census is the leading source
of statistics about the Nation’s agricultural production and the only source of consistent, comparable data at the county,
State, and national levels. The Census includes all places from which $1,000 or more of agricultural products, including
government payments, were produced and sold, or normally would have been sold, during the census year. Census
publications also include demographic items such as sex of operator, residence on or off the farm, days worked off farm,
years present on farm, age group categories, race, and number of persons living in each household.

Access to NASS Reports For your convenience, you may access NASS reports and products the following ways:
All reports are available electronically, at no cost, on the NASS web site: http://www.nass.usda.gov
Both national and state specific reports are available via a free e-mail subscription. To set-up this free
subscription, visit http://www.nass.usda.gov and in the “Follow NASS” box under “Receive reports by Email,”
click on “National” or “State” to select the reports you would like to receive.
For more information on NASS surveys and reports, call the NASS Agricultural Statistics Hotline at (800) 727-9540,
7:30 a.m. to 4:00 p.m. ET, or e-mail: [email protected].
The U.S. Department of Agriculture (USDA) prohibits discrimination against its customers, employees, and applicants for
employment on the basis of race, color, national origin, age, disability, sex, gender identity, religion, reprisal, and where
applicable, political beliefs, marital status, familial or parental status, sexual orientation, or all or part of an individual's
income is derived from any public assistance program, or protected genetic information in employment or in any program
or activity conducted or funded by the Department. (Not all prohibited bases will apply to all programs and/or
employment activities.)
If you wish to file a Civil Rights program complaint of discrimination, complete the USDA Program Discrimination
Complaint Form (PDF), found online at http://www.ascr.usda.gov/complaint_filing_cust.html, or at any USDA office, or
call (866) 632-9992 to request the form. You may also write a letter containing all of the information requested in the
form. Send your completed complaint form or letter to us by mail at U.S. Department of Agriculture, Director, Office of
Adjudication, 1400 Independence Avenue, S.W., Washington, D.C. 20250-9410, by fax (202) 690-7442 or email at