Embed Size (px)
Citation preview
Noname manuscript No.
(will be inserted by the editor)
A meso-mechanical model for concrete under dynamic tensile
and compressive loading
L. Snozzi · F. Gatuingt · J.F. Molinari
Received: date / Accepted: date
Abstract We present a computational model, which combines interface debonding and
frictional contact, in order to investigate the response of concrete specimens subjected to
dynamic tensile and compressive loading. Concrete is modeled using a meso-mechanical
approach in which aggregates and mortar are represented explicitly, thus allowing all ma-
terial parameters to be physically identified. The material phases are considered to behave
elastically, while initiation, coalescence and propagation of cracks are modeled by dynam-
ically inserted cohesive elements. The impenetrability condition is enforced by a contact
algorithm that resorts to the classical law of Coulomb friction. We show that the proposed
model is able to capture the general increase in strength with increasing rate of loading and
the tension/compression asymmetry. Moreover, we simulate compression with lateral con-
finement showing that the model reproduces the increase in peak strength with increasing
confinement level. We also quantify the increase in the ratio between dissipated frictional
energy and dissipated fracture energy as the confining pressure is augmented. Our results
demonstrate the fundamental importance of capturing frictional mechanisms, which appear
to dissipate a similar amount of energy when compared to cracking under compressive load-
ing.
Keywords Cohesive Zone Model · Dynamic Fracture · Concrete · Frictional Contact ·Meso-scale · Numerical Methods
L. Snozzi · J.F. Molinari
ECole Polytechnique Federale de Lausanne (EPFL), School of Architecture, Civil and Environmental Engi-
neering (ENAC), Computational Solid Mechanics Laboratory (LSMS), Batiment GC - A2, Station 18, CH
1015-Lausanne
Tel.: (+41) 21 693 24 11
Fax: (+41) 21 693 63 40
F. Gatuingt (corresponding author)
L.M.T. Cachan, 61 Avenue du President Wilson, FR 94235-CACHAN Cedex
Tel.: (+33) 1 47 40 74 60
Fax: (+33) 1 47 40 22 40
E-mail: [email protected]
2 L. Snozzi et al.
1 Introduction
Failure of heterogeneous (quasi) brittle materials such as concrete is a complex and non-
linear phenomenon, which dissipates energy according to its (meso-structural) composition,
geometry and loading conditions. Fracture of these materials involves the opening of lo-
cal micro-cracks, which may propagate, coalesce and subsequently opposing crack surfaces
enter into contact influencing the nonlinear failure process. Therefore, a careful treatment
of both fracture and frictional mechanisms is needed in order to correctly reproduce the
material’s behavior.
The concrete constitutive behavior can be formulated either at the macro-scale or at the
meso-scale. At the macro scale, the ingredients that characterize concrete’s heterogeneity
are not represented and one considers it as a homogeneous material. Therefore, in this case,
the constitutive models need to have recourse to (visco)-plasticity coupled with a continuum
damage formulation [35,18,47,2,24,37,23,16,39,15]. This leads to models with a rela-
tively high number of parameters, which are difficult to relate to physical mechanisms that
occur during failure. On the contrary, a meso-scale level of observation (as proposed in [56])
allows an explicit representation of some concrete constituents, which enables reducing the
number of model parameters and to describe the interactions between matrix and inclusions.
In the literature one can find several meso-scale models for concrete. They can be divided
in two main computational classes. A first family is represented by lattice models (for in-
stance [46,4]), where the continuum is replaced by a system of discrete particles and the
mechanical properties of the lattice beams aim to represent the concrete meso-structure [29,
27,26,14]. The second class resorts to the finite-element approach, in which concrete is
usually represented as a biphasic material, made of a mixture of aggregates embedded in a
matrix phase with an interfacial transition zone (ITZ) between them [42,52,11,32,10,6,49,
25].
The aim of this study is to exploit a 2D meso-mechanical finite-element model for analyz-
ing failure of concrete specimens in compression. Our intention is to extend the mesoscopic
approach that has been already applied to tensile loading in [49,25]. To this end, a contact
algorithm is included in the formulation to avoid interpenetration of the generated crack sur-
faces and allow mode II debonding of cohesive surfaces under the presence of (local) com-
pression. The coupling between cohesive zone modeling and the impenetrability constraint
is performed in an explicit dynamics scheme. This coupling has been already described in
a previous work [50], where it has been tested with a simple shearing problem, while in
this paper it is applied to a more complex problem that involves a dense network of micro-
cracks. The main characteristics of this model are a continuous transition from decohesion
to pure frictional sliding (note that the onset of friction starts in conjunction with the onset
of cracking). The debonding is controlled by an initially-rigid traction separation law, which
enables us to define two separate values for the dissipated fracture energy in mode I and
II. In this paper we will verify if the approach is able to reproduce the dissymmetric ten-
sile/compressive behavior, strain rate strengthening and confinement effects. Comparison
with experimental results is provided.
The paper is composed as follows. Section 2 describes the chosen finite element framework
with frictional and cohesive capability for representing crack propagation. In Section 3 the
meso-scale approach with its material parameters is presented. Results are reported in Sec-
tion 4 for uniaxial tension and compression. While results on biaxial compressive loading
are listed in Section 5. Finally, concluding remarks are stated in Section 6.
A meso-mechanical model for concrete under dynamic tensile and compressive loading 3
2 Numerical Approach
The following section summarizes the formulation of the adopted frictional/cohesive capa-
bility for modeling crack propagation in FE including the adopted Traction Separation Law
(TSL), the selected contact enforcement algorithm and the coupling scheme between these
two components. However, a more complete formulation and validation of the method can
be found in [50]. The approach has been conceived for simulations in explicit dynamics (sec-
ond order explicit version of the popular Newmark β -method [34]). This scheme is applied
to the discretized equation of dynamic equilibrium:
Mx+Rint = Rext (1)
where M represents the mass matrix, x the nodal acceleration vector and Rext and Rint
are the external and internal force vector respectively. The combination of a lumped mass
matrix with the explicit scheme allows to trivially invert the mass matrix solving explicitly
the scheme. Stability is achieved under the condition that the time step is below a critical
value, which is
∆ tcrit = α min1≤e≤Ne
(
le
c
)
(2)
where c represents the plain strain compression stress wave speed and le is the size of the ele-
ment. The stable time step has to be chosen equal to the smallest value over all elements (Ne)
multiplied by a security coefficient α (typically around 0.1). All the simulations presented
thereafter have been conducted in a 2D plane strain configuration using mesh composed of
6-noded quadratic triangles.
2.1 Cohesive approach
A well-known method to model the onset of fracture is to have recourse to cohesive zone
modeling, which has been introduced by Dugdale [19] and Barenblatt [1] in the 1960s. This
method describes fracture as a separation process by relating the displacement jump, which
occurs at the crack tip, with tractions.
Within the computational framework this region (also called fracture process zone) is rep-
resented by interface elements with null thickness. While damage is concentrated in these
elements, we will assume that the surrounding bulk material behaves linear elastically. The
decohesion process is controlled by a constitutive relationship called traction separation law
(TSL), which is usually related to a potential. Depending on the response of the cohesive
surface prior softening behavior it is possible to distinguish between two main classes of
TSL. The interface can exhibit an initial elastic behavior, intrinsic approach (e.g. [57]), or is
assumed to be initially rigid, extrinsic approach (e.g. [7]). This second method implies that
cohesive elements have to be inserted dynamically, avoiding the artificial compliance of the
uncracked body generated by having recourse to the intrinsic one. One of the most popular
TSL for the extrinsic approach was proposed by Camacho and Ortiz [7] in 2D (and Pandolfi
and Ortiz [36] in 3D). There, the cohesive law is a linear decreasing function of the effective
opening displacement and is derived from a free potential energy.
In this work we have used a TSL, previously reported in [50], which allows us to define two
separate values for energy dissipation in mode I and II (Gc,I and Gc,II). The cohesive law
resorts to the classical model of Camacho and Ortiz. Nevertheless, conversely to the Cama-
cho Ortiz TSL, the cohesive tractions are not anymore bounded by a free potential energy
4 L. Snozzi et al.
(as previously suggested in [5] for the intrinsic cohesive model of Xu and Needleman [57]).
The tractions are assumed to be a function of an effective scalar displacement, which has
the following form:
δ =
√
β 2
κ2∆ 2
t +∆ 2n (3)
where ∆n and ∆t represent the normal and the tangential separation over the cohesive sur-
face with unit outward normal n and unit tangential vector t respectively. The parameter βaccounts for the coupling between normal and tangential displacement, whereas κ enables
us to define the ratio between the dissipated fracture energy in mode II (Gc,II) and in mode I
(Gc,I)
κ =Gc,II
Gc,I(4)
In case of crack opening the traction vector is defined as follows:
T =
(
β 2
κ∆tt+∆nn
)
σc
δ
(
1−δ
δc
)
for δ = δmax (5)
where σc represents the local material strength and δc denotes the effective relative displace-
ment beyond which complete decohesion occurs, while δmax stores the maximal effective
opening displacement attained and enables thus to account for the irreversibility of the law
(similarly to [7]). Unloading or reloading occurs if δ < δmax, which results in the following
tractions:
T =
(
β 2
κ∆tt+∆nn
)
σc
δmax
(
1−δmax
δc
)
for δ < δmax (6)
2.2 Contact enforcement
Since the failure process of concrete can involve, besides cracking, frictional contact be-
tween the cracked rough surfaces, one has to enforce the impenetrability condition. For this
purpose it is possible to simply avoid contact by adding a penalty term in case of negative
normal opening (∆n < 0 in the TSL). However, because our goal is to be able to deal with nu-
merous asperities entering into contact and large displacements, we have preferred to couple
the TSL with a contact algorithm. Since our numerical setup is implemented in an explicit
dynamic code, we have selected an explicit master-slave contact algorithm called decom-
position contact response (DCR) developed by Cirak and West [12]. This method resorts
to the conservation of linear and angular momentum, while the impenetrability condition
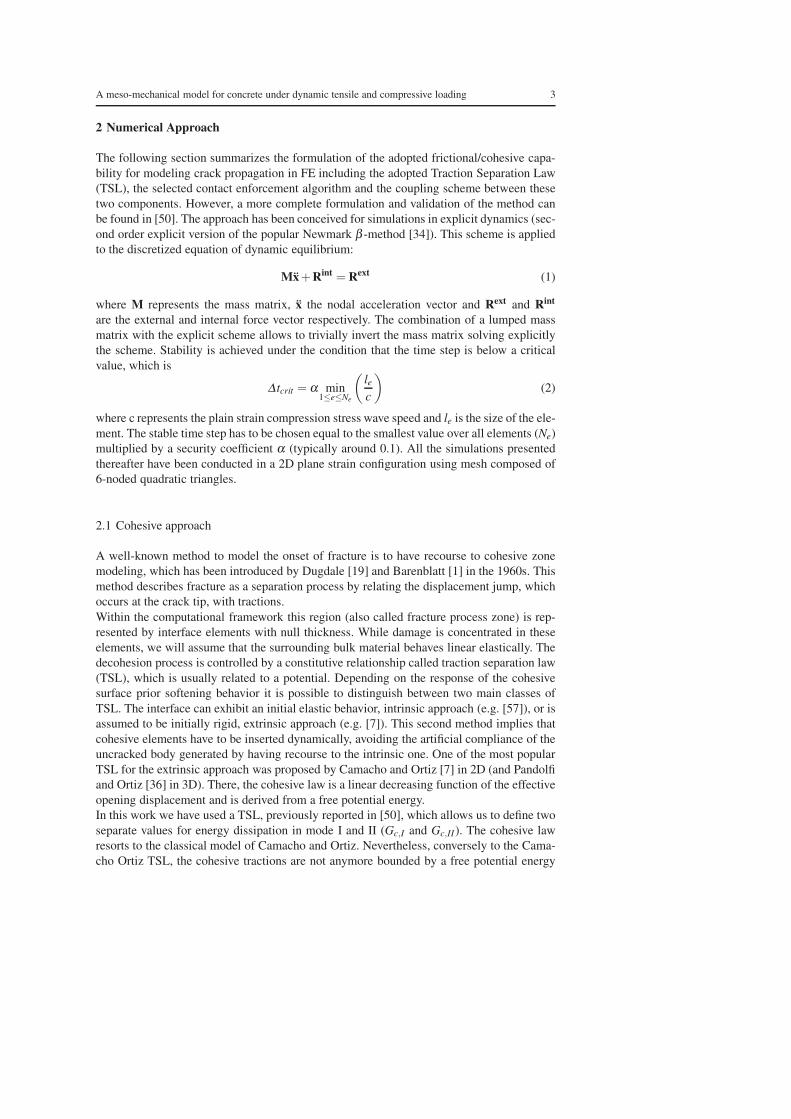
is enforced directly on the displacements, e.g. by projecting the impacting slave nodes on
the penetrated master surface (Fig. 1). The quantity of motion of the contacting nodes after
collision is governed by the following equations
pt+i −pt−i = λ∇xg(xt+i ) (7)
[
pT M−1p]t+i
t−i= 0 (8)
where p = Mx represents the momentum vector of slave and master nodes (x position vec-
tor), g is the gap function, λ a scalar parameter and t−i and t+i refer to the stage before and
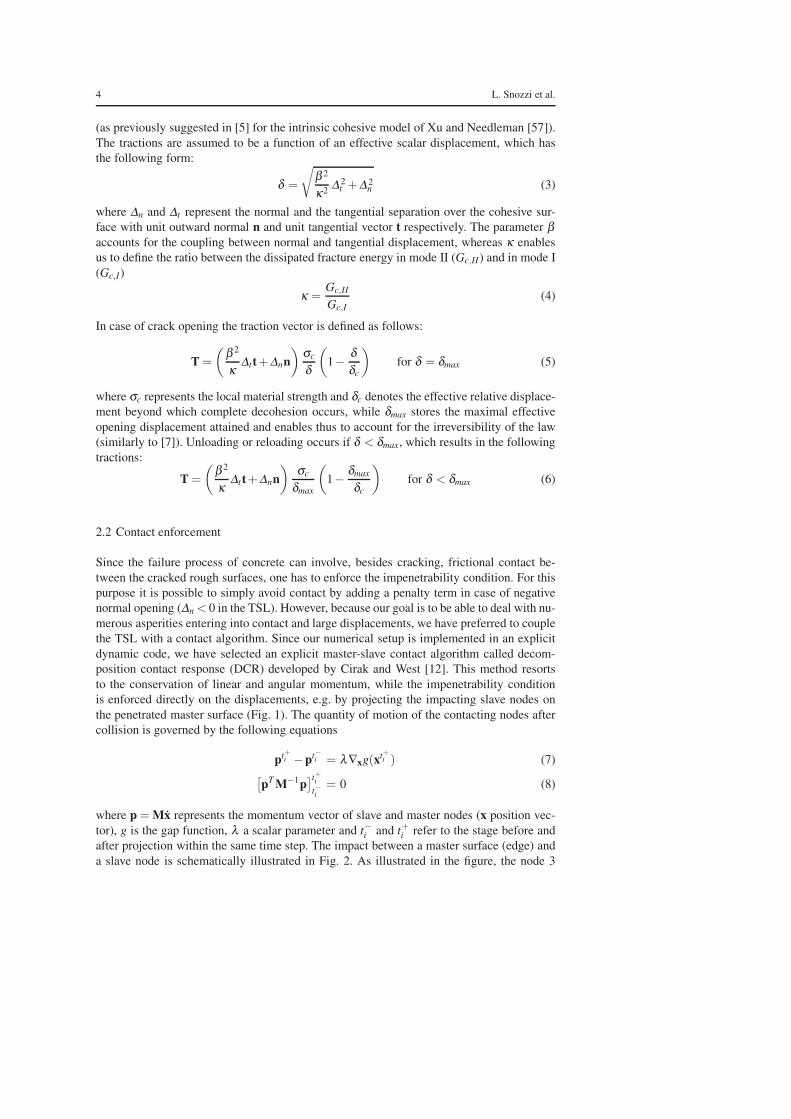
after projection within the same time step. The impact between a master surface (edge) and
a slave node is schematically illustrated in Fig. 2. As illustrated in the figure, the node 3
A meso-mechanical model for concrete under dynamic tensile and compressive loading 5
Fig. 1: Penetration removed by projecting back penetrating node on the master surface
1
23
Fig. 2: Contacting triplet: node 1 and 2 belong to the target edge, whereas node 3 is the
impacting node
has been already projected onto the surface, the gap function is thus equal to the distance
between node 1 and node 3 projected on the segment direction, which can be expressed as
follows:
g = nT (x3 −x1) (9)
Once the gap function has been determined the post-impact velocities of the contacting
nodes need to be corrected according to Eq. 7 and Eq. 8.
x+ = x−− x−n (1+ cres)− x−f ric (10)
where cres represents the coefficient of restitution, which can range between zero (com-
pletely inelastic contact) and one (perfectly elastic contact) and the superscripts + and −
denote quantities before and after projection respectively. For the remainder of the paper we
will keep cres equal to zero. Two terms need therefore to be computed: x f ric, which accounts
for friction, and xn, which represents the normal quantity of motion exchanged during im-
pact. The latter is defined by
xn =
(
(∇g)T x
(∇g)T M−1∇g
)
M−1∇g (11)
6 L. Snozzi et al.
In order to account for friction the relative motion between the contacting triplets (two mas-
ter nodes and one slave node) needs to be corrected according to a simple Coulomb friction
law which accounts for stick/slip. To this end one needs to extract the velocity leading to
relative tangential separation. First the slide components of the velocity can be computed:
xslide = M−1(∇h)T
(
(∇h)x
(∇h)M−1(∇h)T
)
− xn (12)
where h stands for the separation vector between impacting node and target segment. This
can be expressed as
h = x1ξ +x2(1−ξ )−x3 (13)
where the parameter ξ ∈ [0,1] stands for the relative location on the edge at which impact
occurs as illustrated in Fig. 2. xslide represents therefore the velocity leading to a tangential
relative motion between the bodies and corresponds to the maximal impulse which can be
delivered during friction (i.e. stick case). Whereas, in case of slip, according to Coulomb’s
friction law, the correction depends on the coefficient of friction µ and on the amount of
exchanged motion during impact xn.
xµ = µ‖xT
n M−1xn‖
‖xTslideM−1xslide‖
xslide (14)
Thus, the delivered frictional impulse will be equal to the smallest value between the slip
(14) and stick (12) velocity:
x f ric = min(
xslide, xµ
)
(15)
2.3 Coupling
Mixed mode crack propagation implies that some micro-cracks might grow and debond
without the generated surfaces entering into contact before the crack is fully debonded. On
the contrary, other interfaces might already experience contact during this phase. Therefore,
it is important to define how friction and decohesion act on the same surface during this
process. In the proposed approach the TSL and the contact algorithm are coupled together
in parallel. This implies a simultaneous onset of fracture and friction if a crack is growing
under compression. However, we consider a progressive rise in the amount of frictional
force during debonding. I.e. when the cohesive zone is activated, friction does not act on the
inter-element boundary, but it increases gradually with progressive damage of the cohesive
zone following the relation:
1− (1−δ
δc
)q (16)
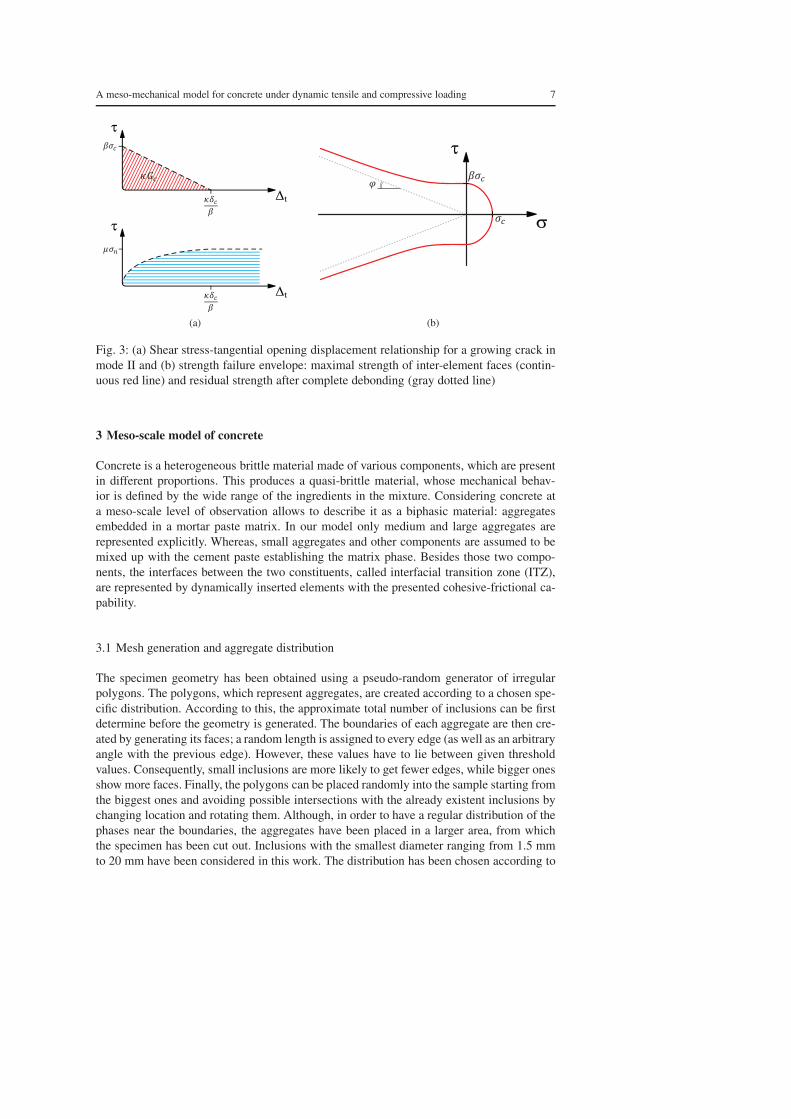
where the exponent q has been set in this work to three. This results in a continuous pro-
gressive transition from debonding to the pure frictional stage. During this shift (when ∆t
reaches κδc/β ) a fracture energy corresponding to Gc,II multiplied by the length of the co-
hesive zone will have been dissipated. This approach produces a strength failure envelope
for concrete drawn in Figure 3b. The parameters (σc, δc, µ , κ and β ) of the interfacial zone
need to be identified according to the chosen material as reported in Section 3.
A meso-mechanical model for concrete under dynamic tensile and compressive loading 7
∆t
τ
∆t
τ
(a)
τ
σ
(b)
Fig. 3: (a) Shear stress-tangential opening displacement relationship for a growing crack in
mode II and (b) strength failure envelope: maximal strength of inter-element faces (contin-
uous red line) and residual strength after complete debonding (gray dotted line)
3 Meso-scale model of concrete
Concrete is a heterogeneous brittle material made of various components, which are present
in different proportions. This produces a quasi-brittle material, whose mechanical behav-
ior is defined by the wide range of the ingredients in the mixture. Considering concrete at
a meso-scale level of observation allows to describe it as a biphasic material: aggregates
embedded in a mortar paste matrix. In our model only medium and large aggregates are
represented explicitly. Whereas, small aggregates and other components are assumed to be
mixed up with the cement paste establishing the matrix phase. Besides those two compo-
nents, the interfaces between the two constituents, called interfacial transition zone (ITZ),
are represented by dynamically inserted elements with the presented cohesive-frictional ca-
pability.
3.1 Mesh generation and aggregate distribution
The specimen geometry has been obtained using a pseudo-random generator of irregular
polygons. The polygons, which represent aggregates, are created according to a chosen spe-
cific distribution. According to this, the approximate total number of inclusions can be first
determine before the geometry is generated. The boundaries of each aggregate are then cre-
ated by generating its faces; a random length is assigned to every edge (as well as an arbitrary
angle with the previous edge). However, these values have to lie between given threshold
values. Consequently, small inclusions are more likely to get fewer edges, while bigger ones
show more faces. Finally, the polygons can be placed randomly into the sample starting from
the biggest ones and avoiding possible intersections with the already existent inclusions by
changing location and rotating them. Although, in order to have a regular distribution of the
phases near the boundaries, the aggregates have been placed in a larger area, from which
the specimen has been cut out. Inclusions with the smallest diameter ranging from 1.5 mm
to 20 mm have been considered in this work. The distribution has been chosen according to
8 L. Snozzi et al.
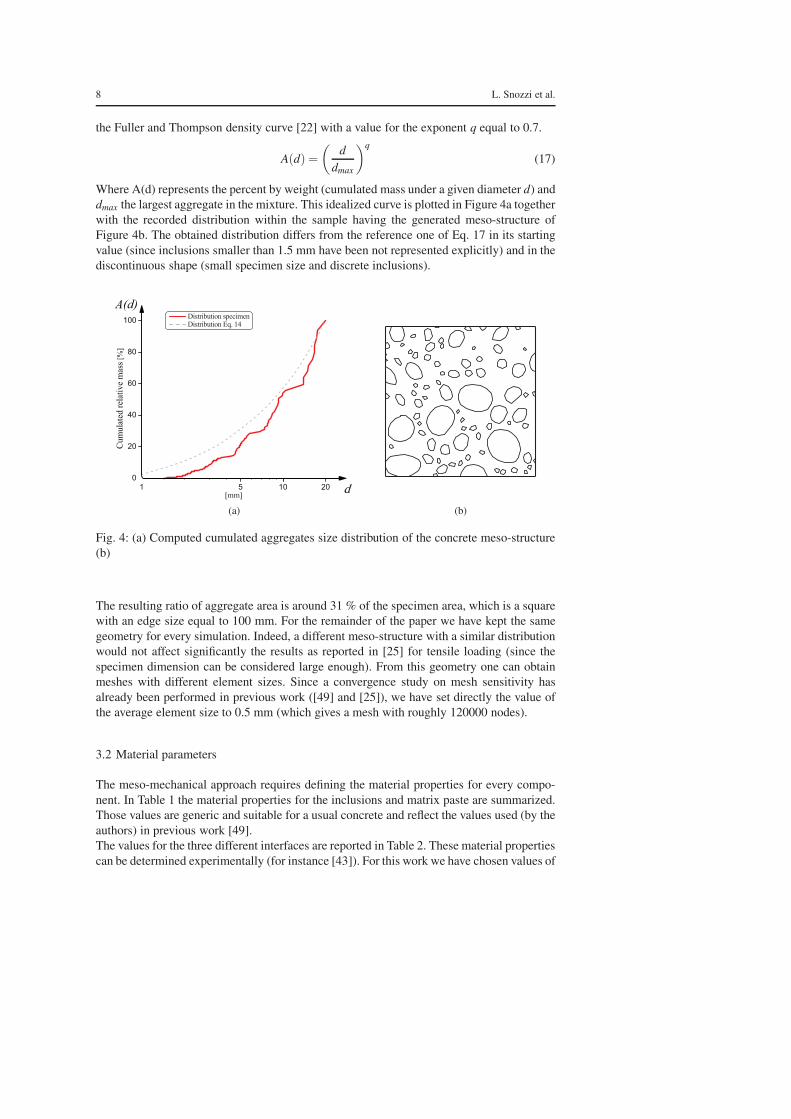
the Fuller and Thompson density curve [22] with a value for the exponent q equal to 0.7.
A(d) =
(
d
dmax
)q
(17)
Where A(d) represents the percent by weight (cumulated mass under a given diameter d) and
dmax the largest aggregate in the mixture. This idealized curve is plotted in Figure 4a together
with the recorded distribution within the sample having the generated meso-structure of
Figure 4b. The obtained distribution differs from the reference one of Eq. 17 in its starting
value (since inclusions smaller than 1.5 mm have been not represented explicitly) and in the
discontinuous shape (small specimen size and discrete inclusions).
Distribution specimenDistribution Eq. 14
[mm]
Cu
mu
late
d r
elat
ive
mas
s [%
]
d
A(d)
0
80
100
40
20
60
1 205 10
(a) (b)
Fig. 4: (a) Computed cumulated aggregates size distribution of the concrete meso-structure
(b)
The resulting ratio of aggregate area is around 31 % of the specimen area, which is a square
with an edge size equal to 100 mm. For the remainder of the paper we have kept the same
geometry for every simulation. Indeed, a different meso-structure with a similar distribution
would not affect significantly the results as reported in [25] for tensile loading (since the
specimen dimension can be considered large enough). From this geometry one can obtain
meshes with different element sizes. Since a convergence study on mesh sensitivity has
already been performed in previous work ([49] and [25]), we have set directly the value of
the average element size to 0.5 mm (which gives a mesh with roughly 120000 nodes).
3.2 Material parameters
The meso-mechanical approach requires defining the material properties for every compo-
nent. In Table 1 the material properties for the inclusions and matrix paste are summarized.
Those values are generic and suitable for a usual concrete and reflect the values used (by the
authors) in previous work [49].
The values for the three different interfaces are reported in Table 2. These material properties
can be determined experimentally (for instance [43]). For this work we have chosen values of
A meso-mechanical model for concrete under dynamic tensile and compressive loading 9
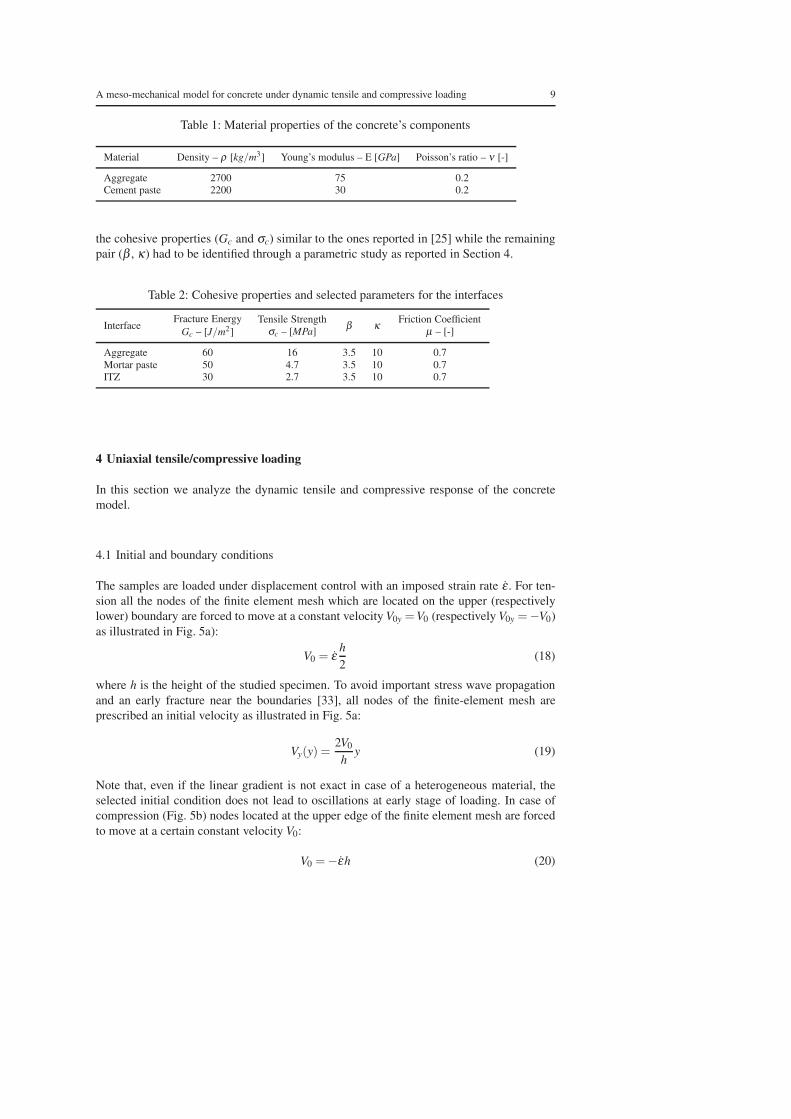
Table 1: Material properties of the concrete’s components
Material Density – ρ [kg/m3] Young’s modulus – E [GPa] Poisson’s ratio – ν [-]
Aggregate 2700 75 0.2
Cement paste 2200 30 0.2
the cohesive properties (Gc and σc) similar to the ones reported in [25] while the remaining
pair (β , κ) had to be identified through a parametric study as reported in Section 4.
Table 2: Cohesive properties and selected parameters for the interfaces
InterfaceFracture Energy
Gc – [J/m2]
Tensile Strength
σc – [MPa]β κ
Friction Coefficient
µ – [-]
Aggregate 60 16 3.5 10 0.7
Mortar paste 50 4.7 3.5 10 0.7
ITZ 30 2.7 3.5 10 0.7
4 Uniaxial tensile/compressive loading
In this section we analyze the dynamic tensile and compressive response of the concrete
model.
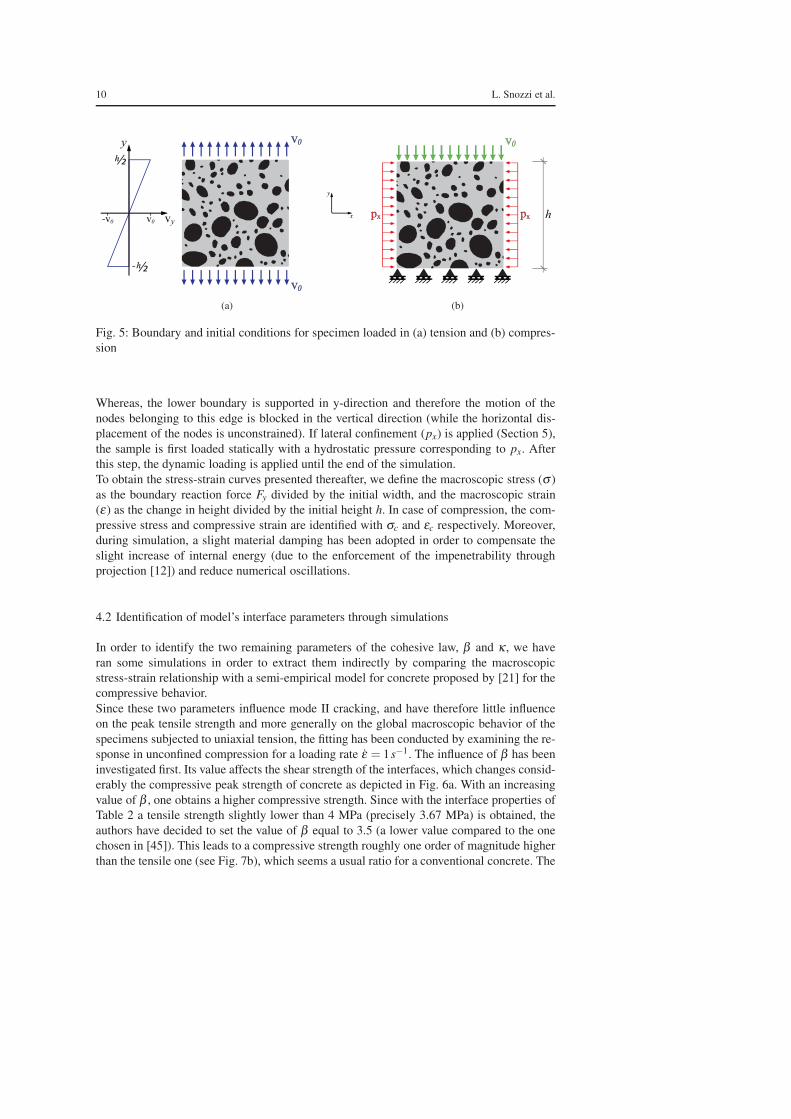
4.1 Initial and boundary conditions
The samples are loaded under displacement control with an imposed strain rate ε . For ten-
sion all the nodes of the finite element mesh which are located on the upper (respectively
lower) boundary are forced to move at a constant velocity V0y =V0 (respectively V0y =−V0)
as illustrated in Fig. 5a):
V0 = εh
2(18)
where h is the height of the studied specimen. To avoid important stress wave propagation
and an early fracture near the boundaries [33], all nodes of the finite-element mesh are
prescribed an initial velocity as illustrated in Fig. 5a:
Vy(y) =2V0
hy (19)
Note that, even if the linear gradient is not exact in case of a heterogeneous material, the
selected initial condition does not lead to oscillations at early stage of loading. In case of
compression (Fig. 5b) nodes located at the upper edge of the finite element mesh are forced
to move at a certain constant velocity V0:
V0 =−εh (20)
10 L. Snozzi et al.
vyv0-v0
y
x
y
v0
v0
(a)
hpx px
v0
(b)
Fig. 5: Boundary and initial conditions for specimen loaded in (a) tension and (b) compres-
sion
Whereas, the lower boundary is supported in y-direction and therefore the motion of the
nodes belonging to this edge is blocked in the vertical direction (while the horizontal dis-
placement of the nodes is unconstrained). If lateral confinement (px) is applied (Section 5),
the sample is first loaded statically with a hydrostatic pressure corresponding to px. After
this step, the dynamic loading is applied until the end of the simulation.
To obtain the stress-strain curves presented thereafter, we define the macroscopic stress (σ )
as the boundary reaction force Fy divided by the initial width, and the macroscopic strain
(ε) as the change in height divided by the initial height h. In case of compression, the com-
pressive stress and compressive strain are identified with σc and εc respectively. Moreover,
during simulation, a slight material damping has been adopted in order to compensate the
slight increase of internal energy (due to the enforcement of the impenetrability through
projection [12]) and reduce numerical oscillations.
4.2 Identification of model’s interface parameters through simulations
In order to identify the two remaining parameters of the cohesive law, β and κ , we have
ran some simulations in order to extract them indirectly by comparing the macroscopic
stress-strain relationship with a semi-empirical model for concrete proposed by [21] for the
compressive behavior.
Since these two parameters influence mode II cracking, and have therefore little influence
on the peak tensile strength and more generally on the global macroscopic behavior of the
specimens subjected to uniaxial tension, the fitting has been conducted by examining the re-
sponse in unconfined compression for a loading rate ε = 1s−1. The influence of β has been
investigated first. Its value affects the shear strength of the interfaces, which changes consid-
erably the compressive peak strength of concrete as depicted in Fig. 6a. With an increasing
value of β , one obtains a higher compressive strength. Since with the interface properties of
Table 2 a tensile strength slightly lower than 4 MPa (precisely 3.67 MPa) is obtained, the
authors have decided to set the value of β equal to 3.5 (a lower value compared to the one
chosen in [45]). This leads to a compressive strength roughly one order of magnitude higher
than the tensile one (see Fig. 7b), which seems a usual ratio for a conventional concrete. The
A meso-mechanical model for concrete under dynamic tensile and compressive loading 11
β = 1β = 2β = 3β = 4
[%]
[M
Pa]
σc
εc
0
40
20
10
30
0 421 3
(a)
κ = 6κ = 8κ = 10κ = 16
[%]
[M
Pa]
σc
εc
0
40
20
10
30
0 421 3
(b)
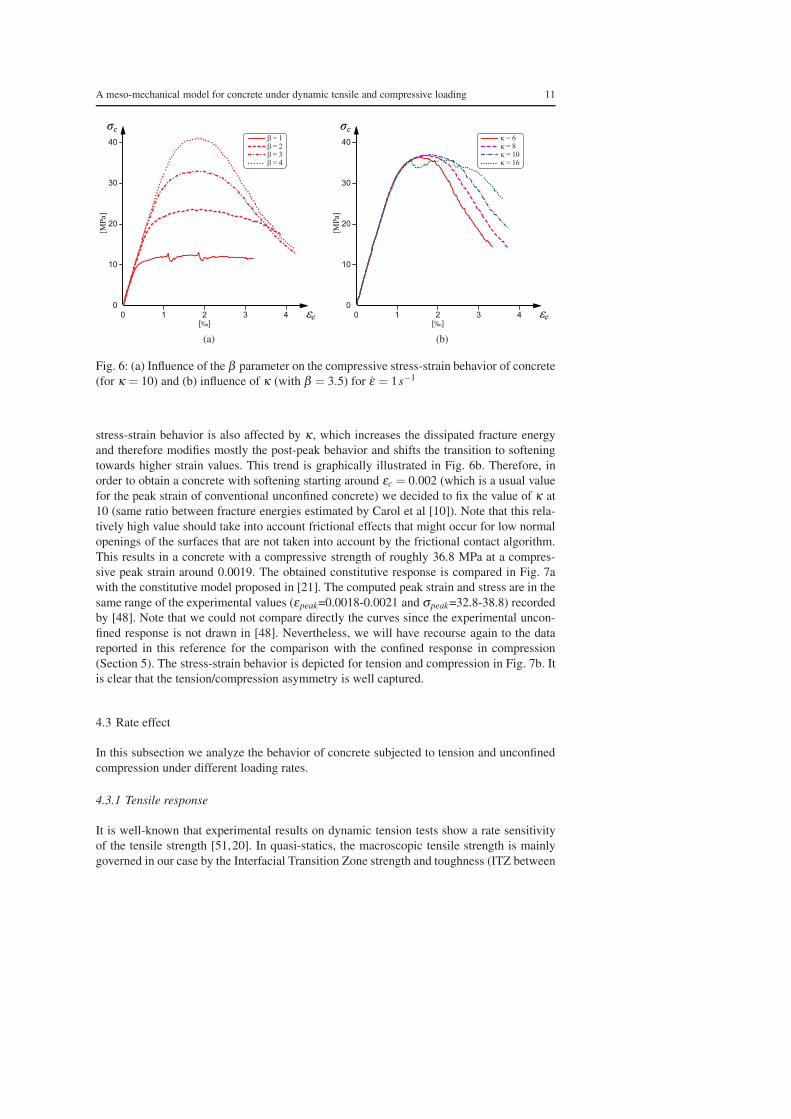
Fig. 6: (a) Influence of the β parameter on the compressive stress-strain behavior of concrete
(for κ = 10) and (b) influence of κ (with β = 3.5) for ε = 1s−1
stress-strain behavior is also affected by κ , which increases the dissipated fracture energy
and therefore modifies mostly the post-peak behavior and shifts the transition to softening
towards higher strain values. This trend is graphically illustrated in Fig. 6b. Therefore, in
order to obtain a concrete with softening starting around εc = 0.002 (which is a usual value
for the peak strain of conventional unconfined concrete) we decided to fix the value of κ at
10 (same ratio between fracture energies estimated by Carol et al [10]). Note that this rela-
tively high value should take into account frictional effects that might occur for low normal
openings of the surfaces that are not taken into account by the frictional contact algorithm.
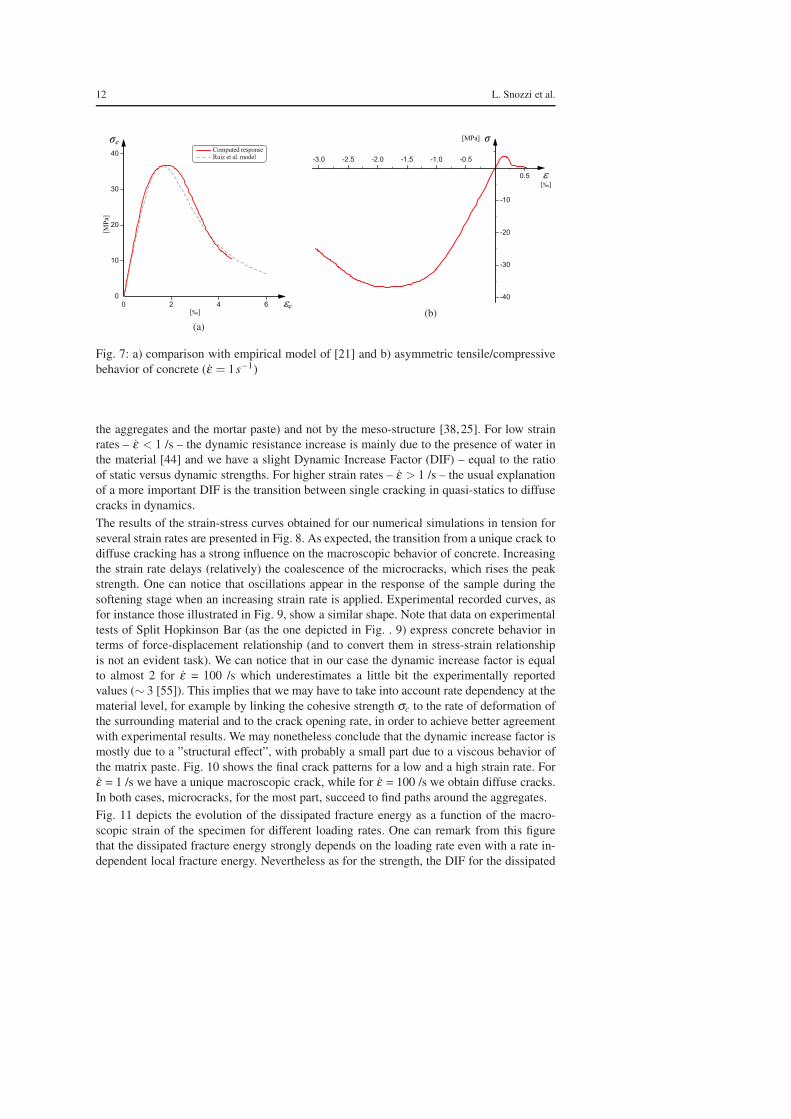
This results in a concrete with a compressive strength of roughly 36.8 MPa at a compres-
sive peak strain around 0.0019. The obtained constitutive response is compared in Fig. 7a
with the constitutive model proposed in [21]. The computed peak strain and stress are in the
same range of the experimental values (εpeak=0.0018-0.0021 and σpeak=32.8-38.8) recorded
by [48]. Note that we could not compare directly the curves since the experimental uncon-
fined response is not drawn in [48]. Nevertheless, we will have recourse again to the data
reported in this reference for the comparison with the confined response in compression
(Section 5). The stress-strain behavior is depicted for tension and compression in Fig. 7b. It
is clear that the tension/compression asymmetry is well captured.
4.3 Rate effect
In this subsection we analyze the behavior of concrete subjected to tension and unconfined
compression under different loading rates.
4.3.1 Tensile response
It is well-known that experimental results on dynamic tension tests show a rate sensitivity
of the tensile strength [51,20]. In quasi-statics, the macroscopic tensile strength is mainly
governed in our case by the Interfacial Transition Zone strength and toughness (ITZ between
12 L. Snozzi et al.
Computed responseRuiz et al. model
[%]
[M
Pa]
σc
εc
0
40
20
10
30
0 62 4
(a)
[MPa]
[%]
σ
ε
-30
-40
-20
-10
-2.5-3.0 -2.0
0.5
-1.5 -0.5-1.0
(b)
Fig. 7: a) comparison with empirical model of [21] and b) asymmetric tensile/compressive
behavior of concrete (ε = 1s−1)
the aggregates and the mortar paste) and not by the meso-structure [38,25]. For low strain
rates – ε < 1 /s – the dynamic resistance increase is mainly due to the presence of water in
the material [44] and we have a slight Dynamic Increase Factor (DIF) – equal to the ratio
of static versus dynamic strengths. For higher strain rates – ε > 1 /s – the usual explanation
of a more important DIF is the transition between single cracking in quasi-statics to diffuse
cracks in dynamics.
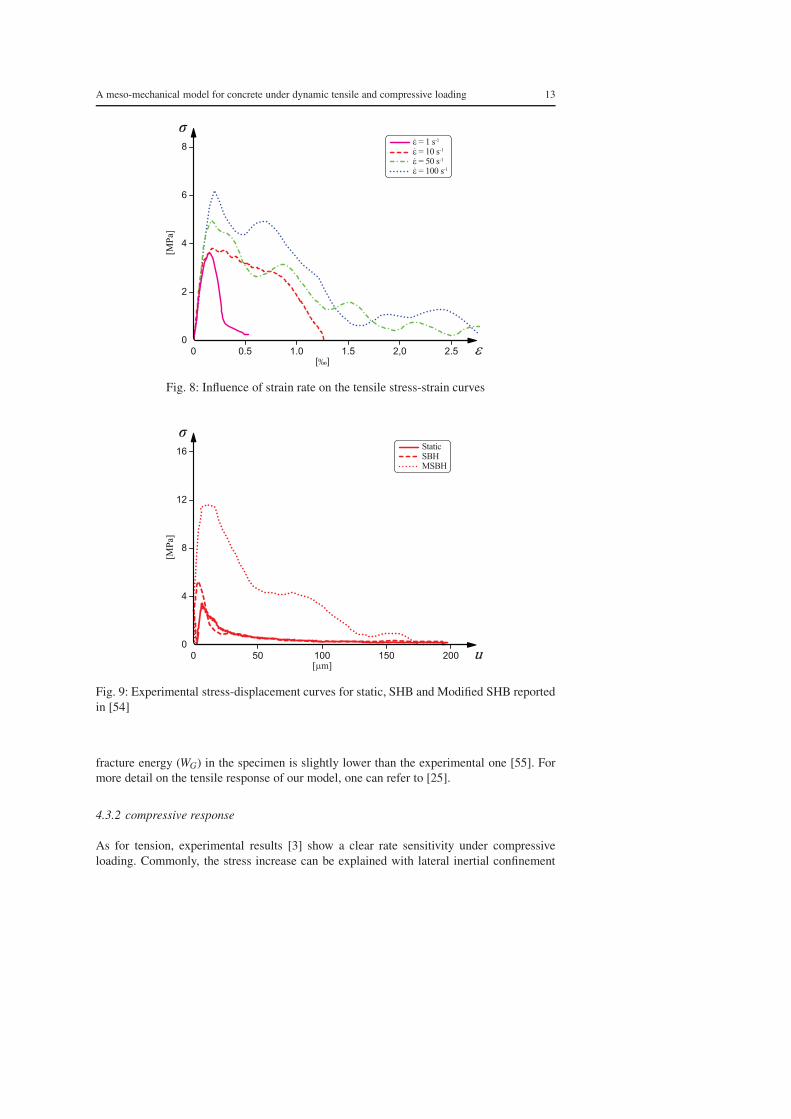
The results of the strain-stress curves obtained for our numerical simulations in tension for
several strain rates are presented in Fig. 8. As expected, the transition from a unique crack to
diffuse cracking has a strong influence on the macroscopic behavior of concrete. Increasing
the strain rate delays (relatively) the coalescence of the microcracks, which rises the peak
strength. One can notice that oscillations appear in the response of the sample during the
softening stage when an increasing strain rate is applied. Experimental recorded curves, as
for instance those illustrated in Fig. 9, show a similar shape. Note that data on experimental
tests of Split Hopkinson Bar (as the one depicted in Fig. . 9) express concrete behavior in
terms of force-displacement relationship (and to convert them in stress-strain relationship
is not an evident task). We can notice that in our case the dynamic increase factor is equal
to almost 2 for ε = 100 /s which underestimates a little bit the experimentally reported
values (∼ 3 [55]). This implies that we may have to take into account rate dependency at the
material level, for example by linking the cohesive strength σc to the rate of deformation of
the surrounding material and to the crack opening rate, in order to achieve better agreement
with experimental results. We may nonetheless conclude that the dynamic increase factor is
mostly due to a ”structural effect”, with probably a small part due to a viscous behavior of
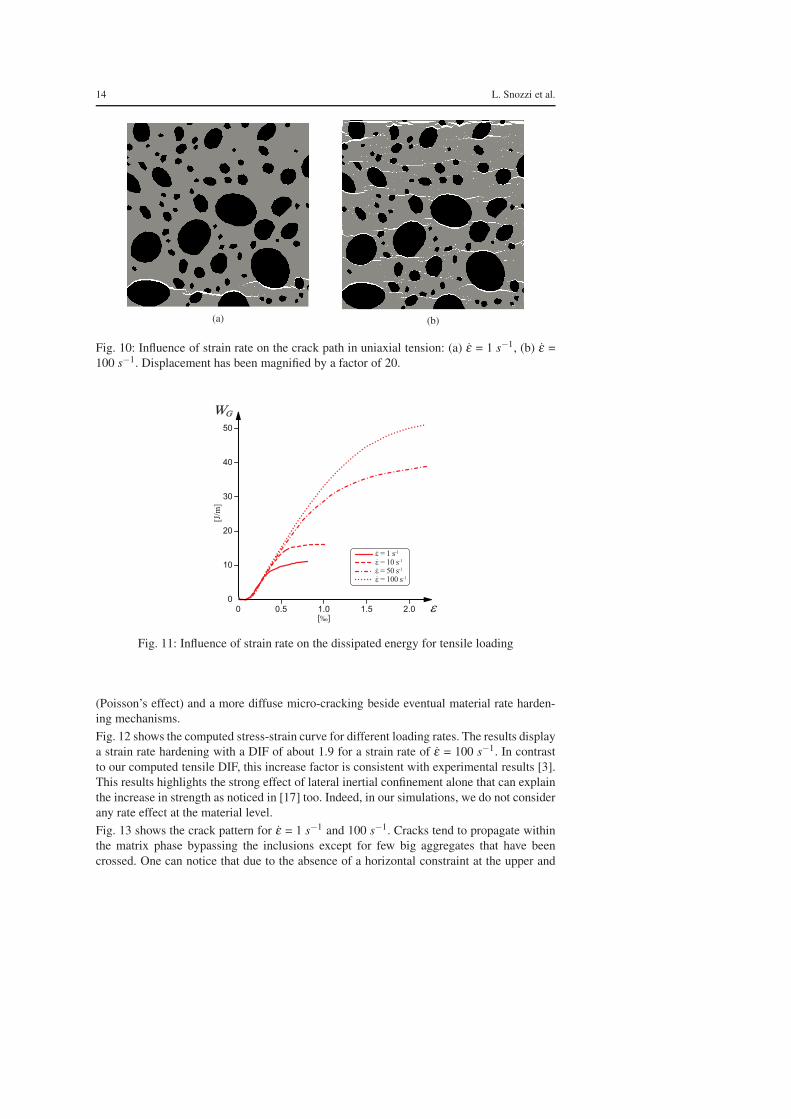
the matrix paste. Fig. 10 shows the final crack patterns for a low and a high strain rate. For
ε = 1 /s we have a unique macroscopic crack, while for ε = 100 /s we obtain diffuse cracks.
In both cases, microcracks, for the most part, succeed to find paths around the aggregates.
Fig. 11 depicts the evolution of the dissipated fracture energy as a function of the macro-
scopic strain of the specimen for different loading rates. One can remark from this figure
that the dissipated fracture energy strongly depends on the loading rate even with a rate in-
dependent local fracture energy. Nevertheless as for the strength, the DIF for the dissipated
A meso-mechanical model for concrete under dynamic tensile and compressive loading 13
ε = 1 s-1
ε = 10 s-1
ε = 50 s-1
ε = 100 s-1
[%]
[M
Pa]
σ
ε0
8
2
4
6
0 2.50.5 1.0 2,01.5
Fig. 8: Influence of strain rate on the tensile stress-strain curves
StaticSBHMSBH
[µm]
[M
Pa]
σ
u0
16
4
8
12
0 20050 150100
Fig. 9: Experimental stress-displacement curves for static, SHB and Modified SHB reported
in [54]
fracture energy (WG) in the specimen is slightly lower than the experimental one [55]. For
more detail on the tensile response of our model, one can refer to [25].
4.3.2 compressive response
As for tension, experimental results [3] show a clear rate sensitivity under compressive
loading. Commonly, the stress increase can be explained with lateral inertial confinement
14 L. Snozzi et al.
(a) (b)
Fig. 10: Influence of strain rate on the crack path in uniaxial tension: (a) ε = 1 s−1, (b) ε =
100 s−1. Displacement has been magnified by a factor of 20.
[%]
[J/
m]
ε
WG
0
50
30
20
10
40
0 2.00.5 1.51.0
ε = 1 s-1
ε = 10 s-1
ε = 50 s-1
ε = 100 s-1
Fig. 11: Influence of strain rate on the dissipated energy for tensile loading
(Poisson’s effect) and a more diffuse micro-cracking beside eventual material rate harden-
ing mechanisms.
Fig. 12 shows the computed stress-strain curve for different loading rates. The results display
a strain rate hardening with a DIF of about 1.9 for a strain rate of ε = 100 s−1. In contrast
to our computed tensile DIF, this increase factor is consistent with experimental results [3].
This results highlights the strong effect of lateral inertial confinement alone that can explain
the increase in strength as noticed in [17] too. Indeed, in our simulations, we do not consider
any rate effect at the material level.
Fig. 13 shows the crack pattern for ε = 1 s−1 and 100 s−1. Cracks tend to propagate within
the matrix phase bypassing the inclusions except for few big aggregates that have been
crossed. One can notice that due to the absence of a horizontal constraint at the upper and
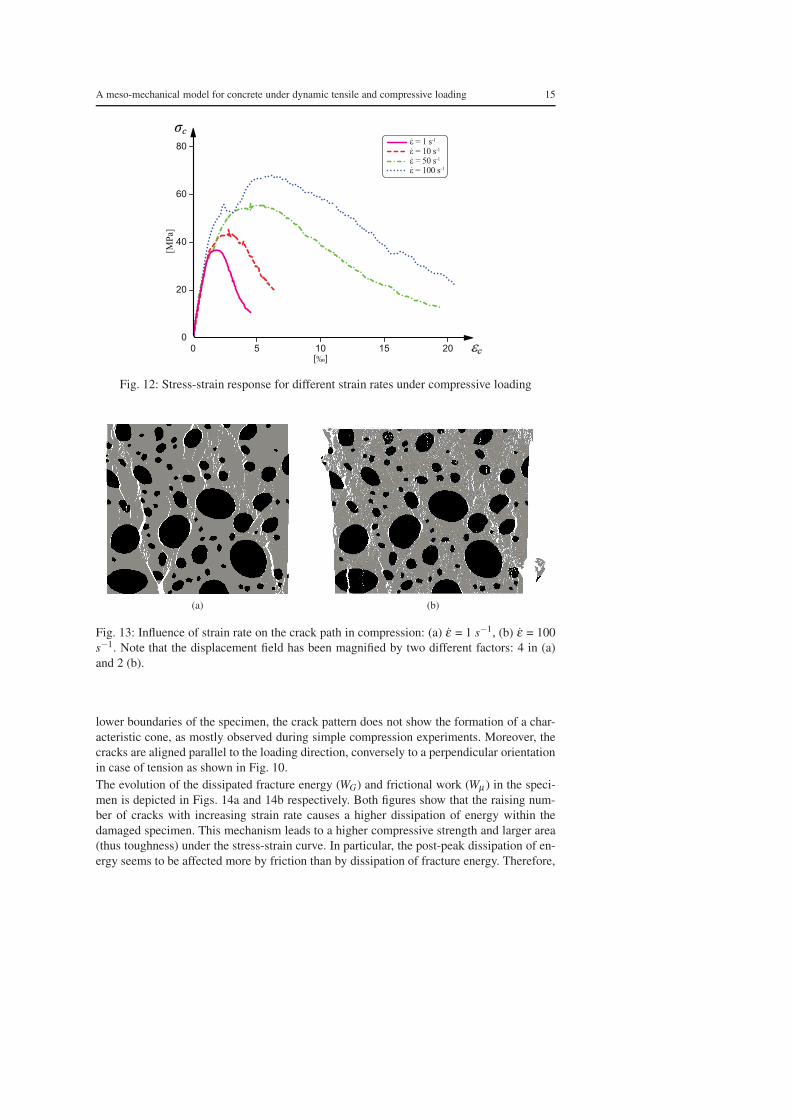
A meso-mechanical model for concrete under dynamic tensile and compressive loading 15
ε = 1 s-1
ε = 10 s-1
ε = 50 s-1
ε = 100 s-1
[%]
[M
Pa]
σc
εc
0
40
60
20
80
0 205 1510
Fig. 12: Stress-strain response for different strain rates under compressive loading
(a) (b)
Fig. 13: Influence of strain rate on the crack path in compression: (a) ε = 1 s−1, (b) ε = 100
s−1. Note that the displacement field has been magnified by two different factors: 4 in (a)
and 2 (b).
lower boundaries of the specimen, the crack pattern does not show the formation of a char-
acteristic cone, as mostly observed during simple compression experiments. Moreover, the
cracks are aligned parallel to the loading direction, conversely to a perpendicular orientation
in case of tension as shown in Fig. 10.
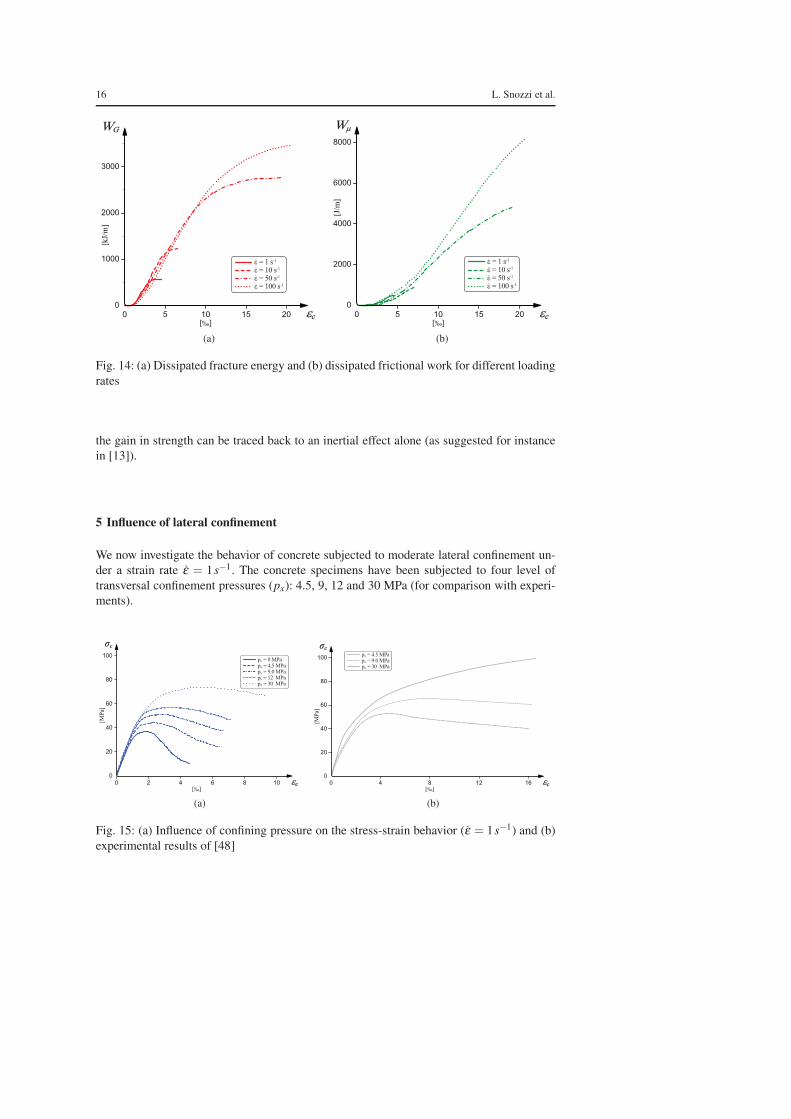
The evolution of the dissipated fracture energy (WG) and frictional work (Wµ ) in the speci-
men is depicted in Figs. 14a and 14b respectively. Both figures show that the raising num-
ber of cracks with increasing strain rate causes a higher dissipation of energy within the
damaged specimen. This mechanism leads to a higher compressive strength and larger area
(thus toughness) under the stress-strain curve. In particular, the post-peak dissipation of en-
ergy seems to be affected more by friction than by dissipation of fracture energy. Therefore,
16 L. Snozzi et al.
[%]
[k
J/m
]
εc
WG
0
3000
1000
2000
0 205 1510
ε = 1 s-1
ε = 10 s-1
ε = 50 s-1
ε = 100 s-1
(a)
ε = 1 s-1
ε = 10 s-1
ε = 50 s-1
ε = 100 s-1
[%]
[J/
m]
εc
Wµ
0
4000
2000
6000
8000
0 205 1510
(b)
Fig. 14: (a) Dissipated fracture energy and (b) dissipated frictional work for different loading
rates
the gain in strength can be traced back to an inertial effect alone (as suggested for instance
in [13]).
5 Influence of lateral confinement
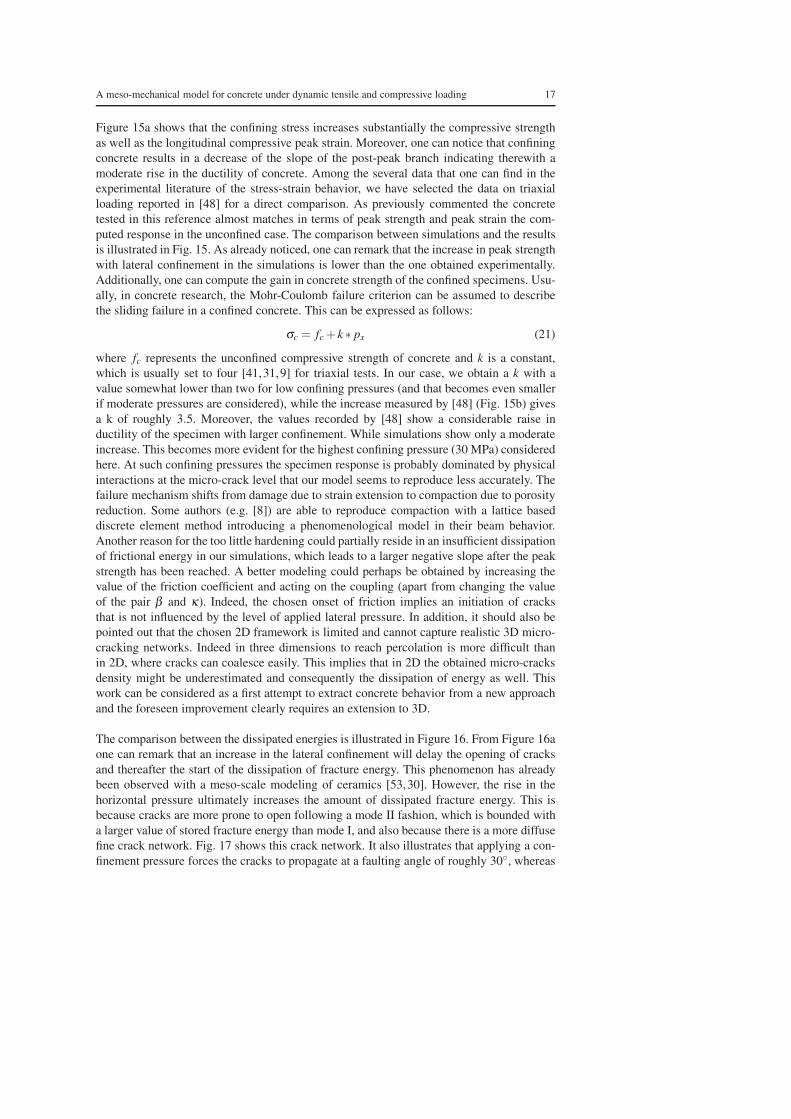
We now investigate the behavior of concrete subjected to moderate lateral confinement un-
der a strain rate ε = 1s−1. The concrete specimens have been subjected to four level of
transversal confinement pressures (px): 4.5, 9, 12 and 30 MPa (for comparison with experi-
ments).
px = 0 MPapx = 4,5 MPapx = 9.0 MPapx = 12 MPapx = 30 MPa
[%]
[M
Pa]
σc
εc
0
0 62 4 108
100
60
80
20
40
(a)
px = 4.5 MPapx = 9.0 MPapx = 30 MPa
[%]
[M
Pa]
σc
εc
0
0 12 164 8
100
60
80
20
40
(b)
Fig. 15: (a) Influence of confining pressure on the stress-strain behavior (ε = 1s−1) and (b)
experimental results of [48]
A meso-mechanical model for concrete under dynamic tensile and compressive loading 17
Figure 15a shows that the confining stress increases substantially the compressive strength
as well as the longitudinal compressive peak strain. Moreover, one can notice that confining
concrete results in a decrease of the slope of the post-peak branch indicating therewith a
moderate rise in the ductility of concrete. Among the several data that one can find in the
experimental literature of the stress-strain behavior, we have selected the data on triaxial
loading reported in [48] for a direct comparison. As previously commented the concrete
tested in this reference almost matches in terms of peak strength and peak strain the com-
puted response in the unconfined case. The comparison between simulations and the results
is illustrated in Fig. 15. As already noticed, one can remark that the increase in peak strength
with lateral confinement in the simulations is lower than the one obtained experimentally.
Additionally, one can compute the gain in concrete strength of the confined specimens. Usu-
ally, in concrete research, the Mohr-Coulomb failure criterion can be assumed to describe
the sliding failure in a confined concrete. This can be expressed as follows:
σc = fc + k ∗ px (21)
where fc represents the unconfined compressive strength of concrete and k is a constant,
which is usually set to four [41,31,9] for triaxial tests. In our case, we obtain a k with a
value somewhat lower than two for low confining pressures (and that becomes even smaller
if moderate pressures are considered), while the increase measured by [48] (Fig. 15b) gives
a k of roughly 3.5. Moreover, the values recorded by [48] show a considerable raise in
ductility of the specimen with larger confinement. While simulations show only a moderate
increase. This becomes more evident for the highest confining pressure (30 MPa) considered
here. At such confining pressures the specimen response is probably dominated by physical
interactions at the micro-crack level that our model seems to reproduce less accurately. The
failure mechanism shifts from damage due to strain extension to compaction due to porosity
reduction. Some authors (e.g. [8]) are able to reproduce compaction with a lattice based
discrete element method introducing a phenomenological model in their beam behavior.
Another reason for the too little hardening could partially reside in an insufficient dissipation
of frictional energy in our simulations, which leads to a larger negative slope after the peak
strength has been reached. A better modeling could perhaps be obtained by increasing the
value of the friction coefficient and acting on the coupling (apart from changing the value
of the pair β and κ). Indeed, the chosen onset of friction implies an initiation of cracks
that is not influenced by the level of applied lateral pressure. In addition, it should also be
pointed out that the chosen 2D framework is limited and cannot capture realistic 3D micro-
cracking networks. Indeed in three dimensions to reach percolation is more difficult than
in 2D, where cracks can coalesce easily. This implies that in 2D the obtained micro-cracks
density might be underestimated and consequently the dissipation of energy as well. This
work can be considered as a first attempt to extract concrete behavior from a new approach
and the foreseen improvement clearly requires an extension to 3D.
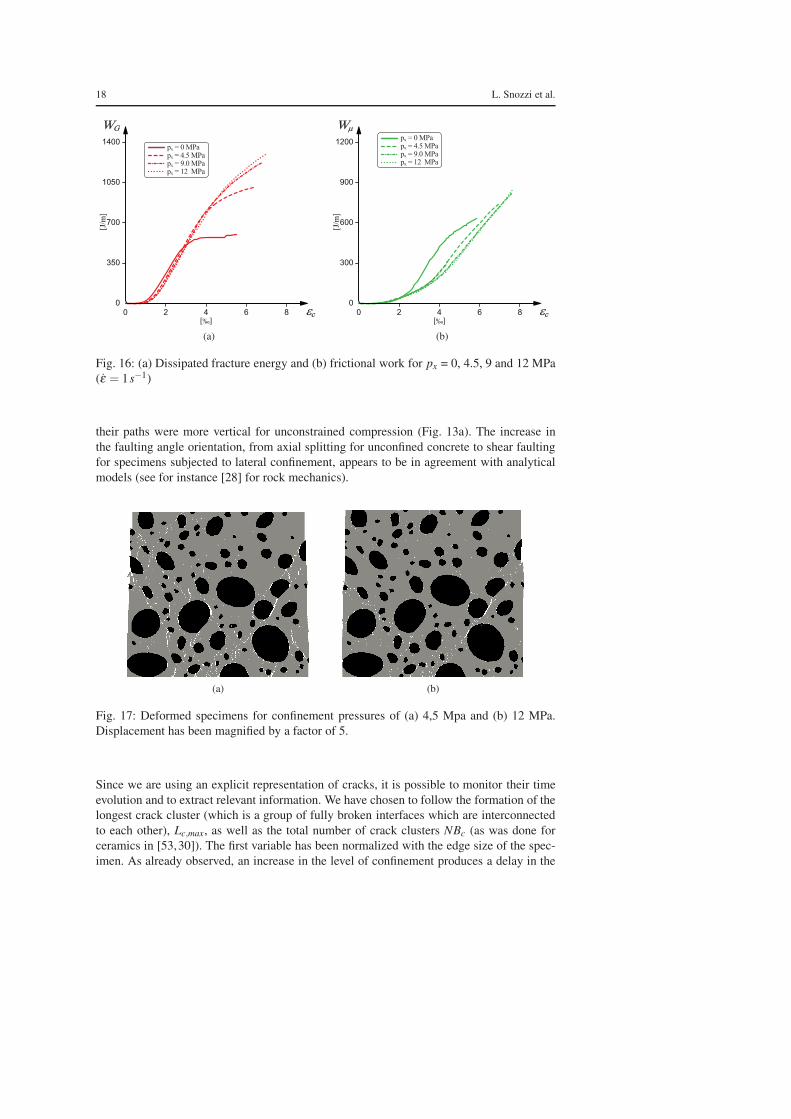
The comparison between the dissipated energies is illustrated in Figure 16. From Figure 16a
one can remark that an increase in the lateral confinement will delay the opening of cracks
and thereafter the start of the dissipation of fracture energy. This phenomenon has already
been observed with a meso-scale modeling of ceramics [53,30]. However, the rise in the
horizontal pressure ultimately increases the amount of dissipated fracture energy. This is
because cracks are more prone to open following a mode II fashion, which is bounded with
a larger value of stored fracture energy than mode I, and also because there is a more diffuse
fine crack network. Fig. 17 shows this crack network. It also illustrates that applying a con-
finement pressure forces the cracks to propagate at a faulting angle of roughly 30◦, whereas
18 L. Snozzi et al.
px = 0 MPapx = 4.5 MPapx = 9.0 MPapx = 12 MPa
[%]
[J/
m]
εc
WG
0
1400
700
350
1050
0 8642
(a)
px = 0 MPapx = 4.5 MPapx = 9.0 MPapx = 12 MPa
[%]
[J/
m]
εc
Wµ
0
1200
300
600
900
0 8642
(b)
Fig. 16: (a) Dissipated fracture energy and (b) frictional work for px = 0, 4.5, 9 and 12 MPa
(ε = 1s−1)
their paths were more vertical for unconstrained compression (Fig. 13a). The increase in
the faulting angle orientation, from axial splitting for unconfined concrete to shear faulting
for specimens subjected to lateral confinement, appears to be in agreement with analytical
models (see for instance [28] for rock mechanics).
(a) (b)
Fig. 17: Deformed specimens for confinement pressures of (a) 4,5 Mpa and (b) 12 MPa.
Displacement has been magnified by a factor of 5.
Since we are using an explicit representation of cracks, it is possible to monitor their time
evolution and to extract relevant information. We have chosen to follow the formation of the
longest crack cluster (which is a group of fully broken interfaces which are interconnected
to each other), Lc,max, as well as the total number of crack clusters NBc (as was done for
ceramics in [53,30]). The first variable has been normalized with the edge size of the spec-
imen. As already observed, an increase in the level of confinement produces a delay in the
A meso-mechanical model for concrete under dynamic tensile and compressive loading 19
px = 0 MPapx = 4.5 MPapx = 9.0 MPapx = 12 MPa
[%]
[1/h
]
εc
Lc,max
0
0.6
0.3
0.15
0.45
0 8642
(a)
px = 0 MPapx = 4.5 MPapx = 9.0 MPapx = 12 MPa
[%]
[-]
εc
NBc
0
750
250
500
0 8642
(b)
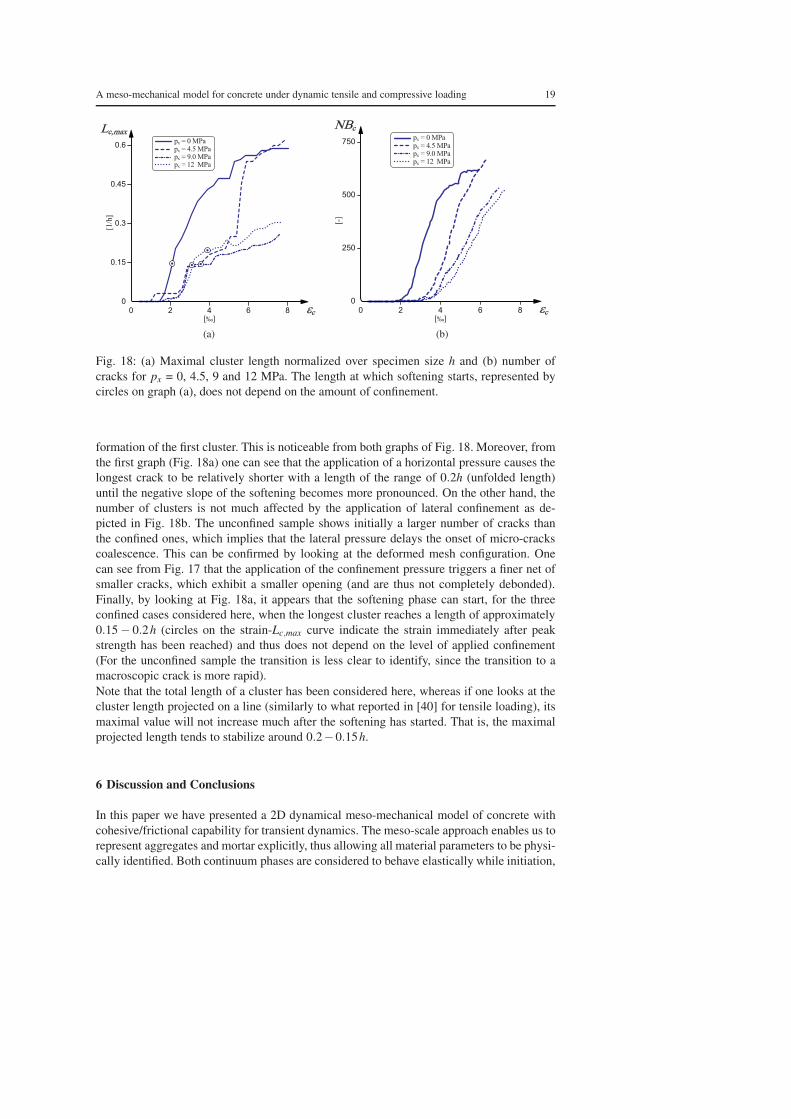
Fig. 18: (a) Maximal cluster length normalized over specimen size h and (b) number of
cracks for px = 0, 4.5, 9 and 12 MPa. The length at which softening starts, represented by
circles on graph (a), does not depend on the amount of confinement.
formation of the first cluster. This is noticeable from both graphs of Fig. 18. Moreover, from
the first graph (Fig. 18a) one can see that the application of a horizontal pressure causes the
longest crack to be relatively shorter with a length of the range of 0.2h (unfolded length)
until the negative slope of the softening becomes more pronounced. On the other hand, the
number of clusters is not much affected by the application of lateral confinement as de-
picted in Fig. 18b. The unconfined sample shows initially a larger number of cracks than
the confined ones, which implies that the lateral pressure delays the onset of micro-cracks
coalescence. This can be confirmed by looking at the deformed mesh configuration. One
can see from Fig. 17 that the application of the confinement pressure triggers a finer net of
smaller cracks, which exhibit a smaller opening (and are thus not completely debonded).
Finally, by looking at Fig. 18a, it appears that the softening phase can start, for the three
confined cases considered here, when the longest cluster reaches a length of approximately
0.15 − 0.2h (circles on the strain-Lc,max curve indicate the strain immediately after peak
strength has been reached) and thus does not depend on the level of applied confinement
(For the unconfined sample the transition is less clear to identify, since the transition to a
macroscopic crack is more rapid).
Note that the total length of a cluster has been considered here, whereas if one looks at the
cluster length projected on a line (similarly to what reported in [40] for tensile loading), its
maximal value will not increase much after the softening has started. That is, the maximal
projected length tends to stabilize around 0.2−0.15h.
6 Discussion and Conclusions
In this paper we have presented a 2D dynamical meso-mechanical model of concrete with
cohesive/frictional capability for transient dynamics. The meso-scale approach enables us to
represent aggregates and mortar explicitly, thus allowing all material parameters to be physi-
cally identified. Both continuum phases are considered to behave elastically while initiation,
20 L. Snozzi et al.
coalescence and propagation of cracks are modeled by dynamically inserted interface ele-
ments with the proposed cohesive frictional capability. The debonding process is controlled
by an extrinsic traction separation law which accounts for path dependent behavior and
therefore enables us to define two separate values for energy dissipation in mode I and II.
The impenetrability condition is enforced directly by projecting the impacting nodes on the
penetrated surface.
We have used this model to simulate dynamic concrete’s behavior in traction and compres-
sion. From the obtained results we can draw the following conclusions.
Simulations in tension as well as in compression show that the model gives an increase in
peak strength and strain at failure with increasing rate of loading although the interfacial
constitutive law is rate independent. This rise in strength resides in a more diffuse micro-
cracking and is thereby bounded with a higher dissipation of fracture energy as well as
energy dissipated through friction in case of compressive cracking. A comparison between
our simulation results and experimental literature indicates that inertial forces alone in case
of compressive loading are sufficient to explain the increase in strength with increasing load-
ing rate. On the contrary, if the specimen is subjected to tensile loading, a small strain-rate
dependence at the material level (material hardening) should be added in order to achieve a
better agreement with experimental results.
Specimens subjected to lateral confinement in compression exhibit an increase in peak
strength and strain at maximum stress with increasing confining pressure. However, the rise
in strength is lower than experimental reported values. It has been observed that an increase
in the lateral pressure produces delays in the formation of the first crack cluster and in micro-
cracks coalescence. Dissipation of energy through fracture and friction is also an increasing
function of the applied confinement. The model also shows the importance of capturing
frictional mechanisms, which appear to dissipate a raising amount of frictional energy with
increasing strain and applied pressure (the work done by friction is on the same range of
magnitude as the energy dissipated trough crack opening under compressive loading).
It is however important to emphasize that our model needs further improvement to capture
experiments better. In particular, the ductility of the specimen is less affected by the con-
fining pressure than the one measured experimentally and the post-peak behavior remains
more brittle. This could perhaps be traced back to a yet insufficient increase in the amount
of dissipated frictional energy or to the lack of others physical phenomenon in the model
(such as compaction). Moreover, the chosen 2D setting is limiting to capture the complexity
of 3D micro-cracking. Indeed, in 2D the density of the cracks is underestimated since it is
easier to reach percolation than in 3D. Besides this, the influence of the internal ordering
of the meso-structure has not been investigated in this paper. In the future, we plan to use
our model as a basis to investigate shearing resistance (including asperities interlocking) of
structural components.
Acknowledgements This material is based on the work supported by the Swiss National Foundation under
Grant no. 200021 122046/1.
References
1. Barenblatt, G.I.: The mathematical theory of equilibrium of cracks in brittle fracture. Advances in Ap-
plied Mechanics 7, 55–129 (1962)
2. Bazant, Z.P., Caner, F.C., Adley, M.D., Akers, S.A.: Fracturing rate effect and creep in microplane model
for dynamics. Journal of Engineering Mechanics-ASCE 126(9), 962–970 (2000)
A meso-mechanical model for concrete under dynamic tensile and compressive loading 21
3. Bischoff, P.H., Perry, S.H.: Compressive behaviour of concrete at high strain rates. Materials and Struc-
tures 24, 425–450 (1991)
4. Bolander Jr., J.E., Saito, S.: Fracture analysis using spring networks with random geometry. Engineering
Fracture Mechanics 61(5-6), 569–591 (1998)
5. Von den Bosch, M.J., G., S.P.J., Geers, M.G.D.: A critical evaluation of the exponential Xu and Needle-
man cohesive zone law for mixed mode decohesion. Engineering Fracture Mechanics 72, 2247–2267
(2005)
6. Caballero, A., Lopez, C.M., Carol, I.: 3D meso-structural analysis of concrete specimens under uniaxial
tension. Computer Methods in Applied Mechanics and Engineering 195(52), 7182–7195 (2006)
7. Camacho, G.T., Ortiz, M.: Computational modelling of impact damage in brittle materials. International
Journal of Solids and Structures 33(20-22), 2899–2938 (1996)
8. Camborde, F., Donze, F.V., Mariotti: Numerical study of rock and concrete behaviour by discrete element
modelling. Computers and Geotechnics 27, 225–247 (2000)
9. Candappa, D.C., Sanjayan, J.G., Setunge, S.: Complete Triaxial Stress-Strain Curves of High-Strength
Concrete. Journal of Materials in Civil Engineering 13(3), 209–215 (2001)
10. Carol, I., Lopez, C.M., Roa, O.: Micromechanical analysis of quasi-brittle materials using fracture-based
interface elements. International Journal for Numerical Methods in Engineering 52(1-2), 193–215 (2001)
11. Cervenka, J., Chandra Kishen, J.M., Saouma, V.E.: Mixed mode fracture of cementitious bimaterial
interfaces; part ii: Numerical simulation. Engineering Fracture Mechanics 60(1), 95–107 (1998)
12. Cirak, F., West, M.: Decomposition contact response (DCR) for explicit finite element dynamics. Inter-
national Journal for Numerical Methods in Engineering 64, 1078–1110 (2005)
13. Cotsovos, D.M., Pavlovic, M.N.: Numerical investigation of concrete subjected to compressive impact
loading. Part 1: A fundamental explanation for the apparent strength gain at high loading rates. Comput-
ers and Structures 86, 145–163 (2008)
14. Cusatis, G.: Strain-rate effects on concrete behavior. International Journal of Impact Engineering 38(4),
162–170 (2011)
15. Desmorat, R., Chambart, M., Gatuingt, F., Guilbaud, D.: Delay-active damage versus non-local enhance-
ment for anisotropic damage dynamics computations with alternated loading. Engineering Fracture Me-
chanics 77(12), 2294–2315 (2010)
16. Desmorat, R., Gatuingt, F., Ragueneau, F.: Nonstandard Thermodynamics Framework for Robust Com-
putations with Induced Anisotropic Damage. International Journal of Damage Mechanics 19(1), 53–73
(2010)
17. Donze, F.V., Magnier, S., Daudeville, L., Mariotti, C., Davenne, L.: Numerical study of compressive
behavior of concrete at high strain rates. Journal of Engineering Mechanics 125(10), 1154–1162 (1999)
18. Dube, J.F., Pijaudier-Cabot, G., La Borderie, C.: Rate dependent damage model for concrete in dynamics.
Journal of Engineering Mechanics-ASCE 122(10), 939–947 (1996)
19. Dugdale, D.S.: Yielding of steel sheets containing slits. Journal of the Mechanics and Physics of Solids
8, 100–108 (1960)
20. Erzar, B., Forquin, P.: An Experimental Method to Determine the Tensile Strength of Concrete at High
Rates of Strain. Experimental Mechanics 50(7), 941–955 (2010)
21. Fernandez Ruiz, M., Muttoni, A., Gambarova, P.: Relationship between nonlinear creep and cracking of
concrete under uniaxial compression. Journal of Advanced Concrete Technology 5, 383–393 (2007)
22. Fuller, W.B., Thompson, S.E.: The Laws of Proportioning Concrete. Journal of Transportation Division
59 (1907)
23. Gatuingt, F., Desmorat, R., Chambart, M., Combescure, D., Guilbaud, D.: Anisotropic 3D delay-damage
model to simulate concrete structures. Revue Europeenne de mecanique numerique 17, 740–60 (2008)
24. Gatuingt, F., Pijaudier-Cabot, G.: Coupled damage and plasticity modeling in transient dynamic analysis
of concrete. International Journal for Numerical and Analytical Methods in Geomechanics 26, 1–24
(2002)
25. Gatuingt, F., Snozzi, L., Molinari, J.F.: Numerical determination of the tensile response and the dissipated
fracture energy of concrete: role of the meso-structure and influence of the loading rate. International
Journal for Numerical and Analytical Methods in Geomechanics, accepted
26. Grassl, P., Jirasek, M.: Meso-scale approach to modelling the fracture process zone of concrete subjected
to uniaxial tension. International Journal of Solids and Structures 47(7-8), 957–968 (2010)
27. Grassl, P., Rempling, R.: A damage-plasticity interface approach to the meso-scale modelling of concrete
subjected to cyclic compressive loading. Engineering Fracture Mechanics 75(16), 4804–4818 (2008)
28. Horii, H., Nemat-Nasser, S.: Compression-Induced Microcrack Growth in Brittle Solids: Axial Splitting
and Shear Failure. Journal of Geophysical Research 90, 3105–3125 (1985)
29. Kozicki, J., Tejchman, J.: Effect of aggregate structure on fracture process in concrete using 2d lattice
model. Archives of Mechanics 59, 365–384 (2007)
22 L. Snozzi et al.
30. Kraft, R.H., Molinari, J.F., Ramesh, K.T., Warner, D.H.: Computational micromechanics of dynamic
compressive loading of a brittle polycrystalline material using a distribution of grain boundary properties.
Journal of the Mechanics and Physics of Solids 56 56(8), 2618–2641 (2008)31. Lahlou, K., Aitcin, P., Chaallal, O.: Behaviour of high-strength concrete under confined stresses. Cement
and Concrete Composites 14(3), 185–193 (1992)32. Lopez, C.: Microstructural analysis of concrete fracture using interface elements. Application to various
concretes. Ph.D. thesis, Universitat Politcnica de Catalunya, Spain (1999)33. Miller, O., Freund, L.B., Needleman, A.: Modeling and simulation of dynamic fragmentation in brittle
materials. International Journal of Fracture 96(2), 101–125 (1999)34. Newmark, N.M.: A method of computation for structural dynamics. Journal of Engineering Mechanics
85, 67–94 (1959)35. Ottosen, N.S.: Constitutive model for short-time loading of concrete. Journal of the Engineering Me-
chanics Division-ASCE 105(1), 127–141 (1979)36. Pandolfi, A., Ortiz, M.: Finite-deformation irreversible cohesive elements for three dimensional crack-
propagation analysis. International Journal for Numerical Methods in Engineering 74, 1393–1420 (1999)37. Pedersen, R.R., Simone, A., Sluys, L.J.: An analysis of dynamic fracture in concrete with a continuum
visco-elastic visco-plastic damage model. Engineering Fracture Mechanics 75, 3782–805 (2008)38. Pedersen, R.R., Simone, A., Stroeven, M., Sluys, L.J.: Mesoscopic modelling of concrete under impact.
In: 6th International Conference on Fracture Mechanics of Concrete and Concrete Structures - FRAM-
COS VI, pp. 571–578 (2007)39. Pontiroli, C., Rouquand, A., Mazars, J.: Predicting concrete behaviour from quasi-static loading to hy-
pervelocity impact An overview of the PRM model. European Journal of Environmental and Civil
Engineering 14(6-7), 703–727 (2010)40. Prado, E.P., van Mier, J.G.M.: Effect of particle structure on mode i fracture process in concrete. Engi-
neering Fracture Mechanics 70(14), 1793–1807 (2003)41. Richart, F.E., Brandtzaeg, A., Brown, R.L.: Failure of Plain and Spirally Reinforced Concrete in Com-
pression. Tech. Rep. 190, University of Illinois, Urbana (1929)42. Roelfstra, P., Sadouki, H., Wittmann, F.: Le beton numerique. Materials & Structures - RILEM 18,
309–317 (1985)43. Rossello, C., Elices, M., Guinea, G.V.: Fracture of model concrete: 2. Fracture energy and characteristic
length. Cement and Concrete Research 36, 1345–1353 (2006)44. Rossi, P., van Mier, J.G.M., Boulay, C., Le Maou, F.: The dynamic behaviour of concrete: influence of
free water. Materials and Structures 25, 509–514 (1992)45. Ruiz, G., Ortiz, M., Pandolfi, A.: Three-dimensional finite-element simulation of the dynamic Brazilian
tests on concrete cylinders. International Journal for Numerical Methods in Engineering 48(7), 963–994
(2000)46. Schlangen, E., van Mier, J.G.M.: Simple lattice model for numerical simulation of fracture of concrete
materials and structures. Materials and Structures 25(9), 534–542 (1992)47. Sercombe, J., Ulm, F.J., Toutlemonde, F.: Viscous hardening plasticity for concrete in high-rate dynam-
ics. Journal of Engineering Mechanics-ASCE 124(9), 1050–1057 (1998)48. Sfer, D., Carol, I., Gettu, R., Etse, G.: Study of the behavior of concrete under triaxial compression.
Journal of Engineering Mechanics 128(2), 156–163 (2002)49. Snozzi, L., Caballero, A., Molinari, J.F.: Influence of the meso-structure in dynamic fracture simulation
of concrete under tensile loading. Cement and Concrete Research 41, 1130–1142 (2011)50. Snozzi, L., Molinari, J.F.: A cohesive element model for mixed mode loading with frictional contact
capability. International Journal for Numerical Methods in Engineering Article in Press51. Vegt, I., Pedersen, R.R., Sluys, L.J., Weerheijm, J.: Modelling of impact behaviour of concrete - An
experimental approach. In: Computational Modelling of Concrete Structures - EURO-C 2006, pp. 451–
458 (2006)52. Vonk, R.A.: Micromechanical investigation of softening of concrete loaded in compression. Heron 38,
5–94 (1993)53. Warner, D.H., Molinari, J.F.: Micromechanical finite element modeling of compressive fracture in con-
fined alumina ceramic. Acta Materialia 54(19), 5135–5145 (2006)54. Weerheijm, J., Vegt, I., van Breugel, K.: The rate dependency of concrete in tension - New data for
wet, normal and dry conditions. In: DYMAT 2009: 9th International Conference on the Mechanical and
Physical Behavior of Materials under Dynamic Loading, Vol. 1, pp. 95–101 (2009)55. Weerheijm, J., Vegt, I., van Breugel, K.: Research developments and experimental data on dynamic
concrete behaviour. In: Conference on Advances in Construction Materials, pp. 765–773 (2007)56. Wittmann, F.H.: Structure of concrete with respect to crack formation. Fracture Mechanics of Concrete,
Elsevier Science Publishers pp. 43–74 (1983)57. Xu, X.P., Needleman, A.: Void nucleation by inclusions debonding in a crystal matrix. Modelling and
Simulation in Materials Science and Engineering 1, 111–132 (1993)


![arxiv.orgarXiv:1511.04926v1 [cs.PL] 16 Nov 2015 Noname manuscript No. (will be inserted by the editor) A FrameworkforDeadlockDetectionin coreABS Elena Giachino · Cosimo](https://img.pdfslide.us/doc/110x75/5ec559fb13b08355f20aa694/arxivorg-arxiv151104926v1-cspl-16-nov-2015-noname-manuscript-no-will-be.jpg)