Embed Size (px)
Citation preview

Non-Gaussian statistical properties of virtual breast phantoms
Craig K. Abbey*ab, Predrag R. Bakicc, David D. Pokrajacd, Andrew D.A. Maidmentc, Miguel P. Ecksteina, and John M. Booneb
aDept. of Psychological and Brain Sciences, UC Santa Barbara, Santa Barbara, CA. USA 93106; bDept of Radiology, UC Davis Medical Center, Sacramento CA. USA; cDepartment of
Radiology, University of Pennsylvania, Philadelphia, PA. USA; dDepartment of Computer and Information Sciences, Delaware State University, Dover, Delaware. USA.
ABSTRACT
Images derived from a “phantom” are useful for characterizing the performance of imaging systems. In particular, the modulation transfer properties of imaging detectors are traditionally assessed by physical phantoms consisting of an edge. More recently researchers have come to realize that quantifying the effects of object variability can also be accomplished with phantoms in modalities such as breast imaging where anatomical structure may be the principal limitation in performance. This has driven development of virtual phantoms that can be used in simulation environments. In breast imaging, several such phantoms have been proposed. In this work, we analyze non-Gaussian statistical properties of virtual phantoms, and compare them to similar statistics from a database of breast images.
The virtual phantoms assessed consist of three classes. The first is known as clustered-blob lumpy backgrounds. The second class is “binarized” textures which typically apply some sort of threshold to a stochastic 3D texture intended to represent the distribution of adipose and glandular tissue in the breast. The third approach comes from efforts at the University of Pennsylvania to directly simulate the 3D anatomy of the breast. We use Laplacian fractional entropy (LFE) as a measure of the non-Gaussian statistical properties of each simulation.
Our results show that the simulation approaches differ considerably in LFE with very low scores for the clustered-blob lumpy background to very high values for the UPenn phantom. These results suggest that LFE may have value in developing and tuning virtual phantom simulation procedures.
Keywords: Laplacian Fractional Entropy, Breast phantoms, image statistics, and natural scene statistics
1. INTRODUCTION The use of “virtual” breast phantoms for evaluating new breast imaging technology has many appealing qualities. These phantoms are the output of simulations of breast tissue, with the intent of capturing the effect of anatomical variability on the performance of imaging systems. As such, the “phantom” may be considered as the ensemble of image backgrounds produced by the simulation procedure. Virtual phantoms have advantages that arise from known ground truth about the object being imaged, and the ability to evaluate an unbuilt system through a subsequent simulation of the imaging process.
However, in order to be effective, a virtual phantom must accurately capture the effects of patient structured images. We will refer to this goal as phantom realism; a more realistic phantom will more fully capture anatomical effects than a less realistic phantom. But it is not clear at this point in time how to validate such a comparison, or how such a validation might depend on the task that drives development of the imaging system.. The approach we are exploring in this work is based on the idea that realism can be characterized by comparing statistical properties of the phantom ensemble (or the subsequent images) and actual patient images in cases where such images are available. Traditionally, statistical properties have been limited to the power-spectrum [1, 2], which characterize second-order statistical properties (i.e. variance, covariance, and correlations), under the assumption of stationarity. However, it is well known that the power spectrum does not fully capture the appearance
Medical Imaging 2014: Image Perception, Observer Performance, and Technology Assessment, edited by Claudia R. Mello-Thoms, Matthew A. Kupinski, Proc. of SPIE Vol. 9037, 90370G
© 2014 SPIE · CCC code: 1605-7422/14/$18 · doi: 10.1117/12.2044446
Proc. of SPIE Vol. 9037 90370G-1
Downloaded From: http://spiedigitallibrary.org/ on 07/15/2016 Terms of Use: http://spiedigitallibrary.org/ss/TermsOfUse.aspx
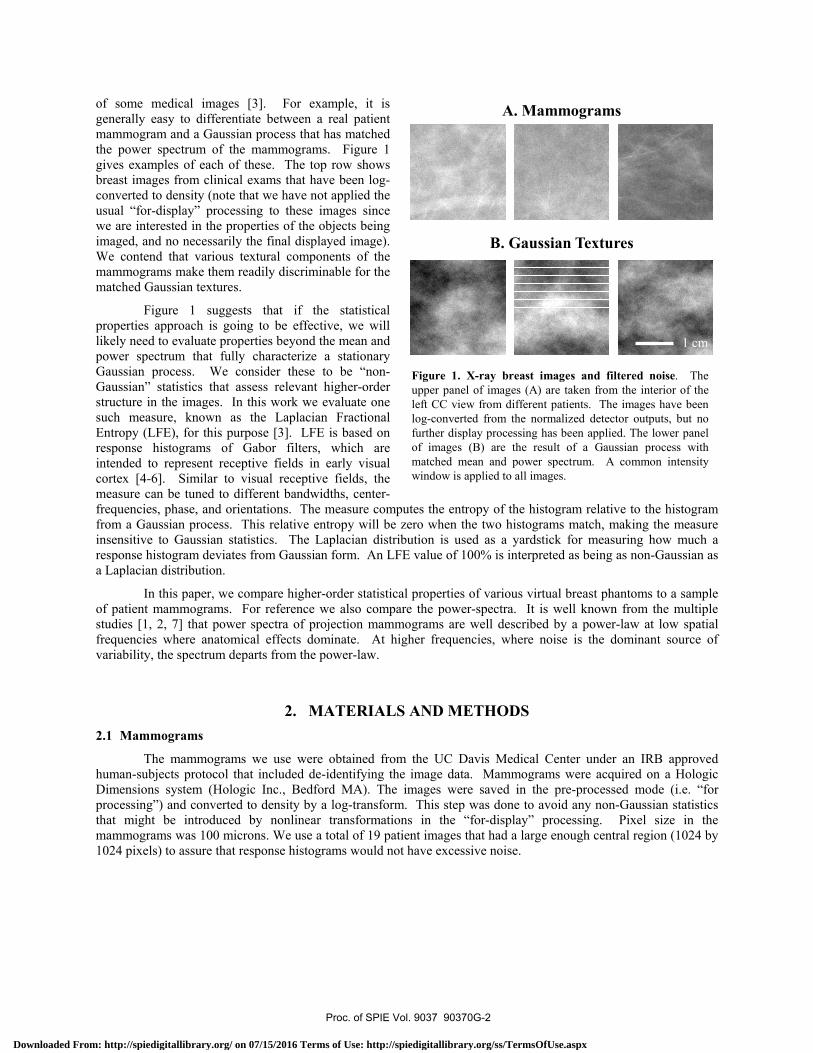
of some medical images [3]. For example, it is generally easy to differentiate between a real patient mammogram and a Gaussian process that has matched the power spectrum of the mammograms. Figure 1 gives examples of each of these. The top row shows breast images from clinical exams that have been log-converted to density (note that we have not applied the usual “for-display” processing to these images since we are interested in the properties of the objects being imaged, and no necessarily the final displayed image). We contend that various textural components of the mammograms make them readily discriminable for the matched Gaussian textures.
Figure 1 suggests that if the statistical properties approach is going to be effective, we will likely need to evaluate properties beyond the mean and power spectrum that fully characterize a stationary Gaussian process. We consider these to be “non-Gaussian” statistics that assess relevant higher-order structure in the images. In this work we evaluate one such measure, known as the Laplacian Fractional Entropy (LFE), for this purpose [3]. LFE is based on response histograms of Gabor filters, which are intended to represent receptive fields in early visual cortex [4-6]. Similar to visual receptive fields, the measure can be tuned to different bandwidths, center-frequencies, phase, and orientations. The measure computes the entropy of the histogram relative to the histogram from a Gaussian process. This relative entropy will be zero when the two histograms match, making the measure insensitive to Gaussian statistics. The Laplacian distribution is used as a yardstick for measuring how much a response histogram deviates from Gaussian form. An LFE value of 100% is interpreted as being as non-Gaussian as a Laplacian distribution.
In this paper, we compare higher-order statistical properties of various virtual breast phantoms to a sample of patient mammograms. For reference we also compare the power-spectra. It is well known from the multiple studies [1, 2, 7] that power spectra of projection mammograms are well described by a power-law at low spatial frequencies where anatomical effects dominate. At higher frequencies, where noise is the dominant source of variability, the spectrum departs from the power-law.
2. MATERIALS AND METHODS 2.1 Mammograms
The mammograms we use were obtained from the UC Davis Medical Center under an IRB approved human-subjects protocol that included de-identifying the image data. Mammograms were acquired on a Hologic Dimensions system (Hologic Inc., Bedford MA). The images were saved in the pre-processed mode (i.e. “for processing”) and converted to density by a log-transform. This step was done to avoid any non-Gaussian statistics that might be introduced by nonlinear transformations in the “for-display” processing. Pixel size in the mammograms was 100 microns. We use a total of 19 patient images that had a large enough central region (1024 by 1024 pixels) to assure that response histograms would not have excessive noise.
Figure 1. X-ray breast images and filtered noise. Theupper panel of images (A) are taken from the interior of theleft CC view from different patients. The images have beenlog-converted from the normalized detector outputs, but nofurther display processing has been applied. The lower panelof images (B) are the result of a Gaussian process withmatched mean and power spectrum. A common intensitywindow is applied to all images.
1 cm
A. Mammograms
B. Gaussian Textures
Proc. of SPIE Vol. 9037 90370G-2
Downloaded From: http://spiedigitallibrary.org/ on 07/15/2016 Terms of Use: http://spiedigitallibrary.org/ss/TermsOfUse.aspx
A. AB08 B. RN10 C. Gaussian
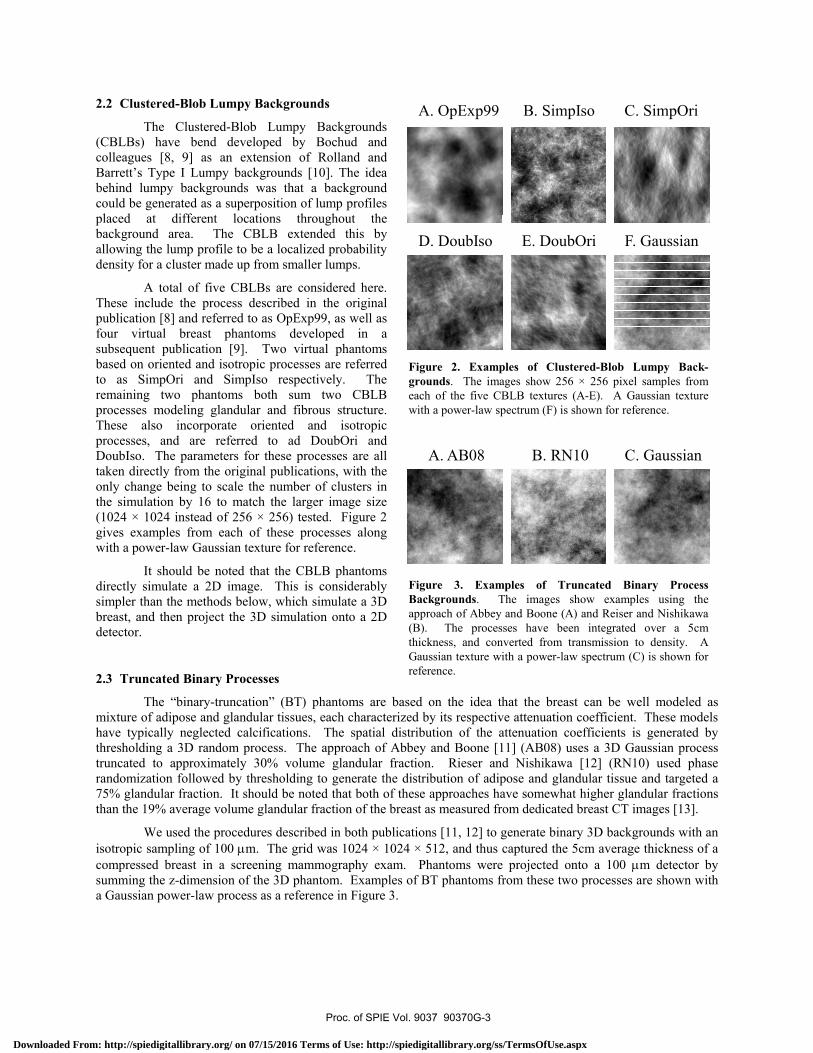
Figure 3. Examples of Truncated Binary ProcessBackgrounds. The images show examples using theapproach of Abbey and Boone (A) and Reiser and Nishikawa(B). The processes have been integrated over a 5cmthickness, and converted from transmission to density. AGaussian texture with a power-law spectrum (C) is shown forreference.
2.2 Clustered-Blob Lumpy Backgrounds
The Clustered-Blob Lumpy Backgrounds (CBLBs) have bend developed by Bochud and colleagues [8, 9] as an extension of Rolland and Barrett’s Type I Lumpy backgrounds [10]. The idea behind lumpy backgrounds was that a background could be generated as a superposition of lump profiles placed at different locations throughout the background area. The CBLB extended this by allowing the lump profile to be a localized probability density for a cluster made up from smaller lumps.
A total of five CBLBs are considered here. These include the process described in the original publication [8] and referred to as OpExp99, as well as four virtual breast phantoms developed in a subsequent publication [9]. Two virtual phantoms based on oriented and isotropic processes are referred to as SimpOri and SimpIso respectively. The remaining two phantoms both sum two CBLB processes modeling glandular and fibrous structure. These also incorporate oriented and isotropic processes, and are referred to ad DoubOri and DoubIso. The parameters for these processes are all taken directly from the original publications, with the only change being to scale the number of clusters in the simulation by 16 to match the larger image size (1024 × 1024 instead of 256 × 256) tested. Figure 2 gives examples from each of these processes along with a power-law Gaussian texture for reference.
It should be noted that the CBLB phantoms directly simulate a 2D image. This is considerably simpler than the methods below, which simulate a 3D breast, and then project the 3D simulation onto a 2D detector.
2.3 Truncated Binary Processes
The “binary-truncation” (BT) phantoms are based on the idea that the breast can be well modeled as mixture of adipose and glandular tissues, each characterized by its respective attenuation coefficient. These models have typically neglected calcifications. The spatial distribution of the attenuation coefficients is generated by thresholding a 3D random process. The approach of Abbey and Boone [11] (AB08) uses a 3D Gaussian process truncated to approximately 30% volume glandular fraction. Rieser and Nishikawa [12] (RN10) used phase randomization followed by thresholding to generate the distribution of adipose and glandular tissue and targeted a 75% glandular fraction. It should be noted that both of these approaches have somewhat higher glandular fractions than the 19% average volume glandular fraction of the breast as measured from dedicated breast CT images [13].
We used the procedures described in both publications [11, 12] to generate binary 3D backgrounds with an isotropic sampling of 100 μm. The grid was 1024 × 1024 × 512, and thus captured the 5cm average thickness of a compressed breast in a screening mammography exam. Phantoms were projected onto a 100 μm detector by summing the z-dimension of the 3D phantom. Examples of BT phantoms from these two processes are shown with a Gaussian power-law process as a reference in Figure 3.
A. OpExp99 B. SimpIso C. SimpOri
D. DoubIso E. DoubOri F. Gaussian
Figure 2. Examples of Clustered-Blob Lumpy Back-grounds. The images show 256 × 256 pixel samples fromeach of the five CBLB textures (A-E). A Gaussian texturewith a power-law spectrum (F) is shown for reference.
Proc. of SPIE Vol. 9037 90370G-3
Downloaded From: http://spiedigitallibrary.org/ on 07/15/2016 Terms of Use: http://spiedigitallibrary.org/ss/TermsOfUse.aspx

2.4 The UPenn Virtual Breast Phantom
A virtual breast phantom has been under development at the University of Pennsylvania for several years [14-16]. This phantom is based on simulating the major anatomical components of the breast, including skin, adipose tissue, fibroglandular tissue, and Cooper’s ligaments. The breast simulation is initially generated in an uncompressed state, to which a compression transform is applied using a finite element model.
We consider two versions of the UPenn phantom. The first is the published version of the phantom, tailored for projection mammography [15]. In the second version, a new approach currently under investigation was used that involved simulating additional microstructure in the adipose compartments. Mammograms were simulated from the 3D phantom assuming, a 950 mL breast volume with 6.4 cm compressed breast thickness, a polyenergetic x-ray beam, and 100 μm detector pixels. Examples images from these two phantoms are given in Figure 4.
2.5 Image Analysis
Gaussian white noise was added to the phantoms to simulate the effects of quantum and electronic acquisition noise. The magnitude of the noise was set to approximately equal the amplitude of anatomical noise at 1.0 cyc/mm, the spatial frequency at which the power spectrum begins to diverge from the power-law form. Figure 5 gives examples of the appearance of the phantom images after noise has been added.
Power spectra were computed by sampling fifty 256 ×256 pixel ROIs at random from within the ROI of the images, These were mean subtracted and then windowed using a radially symmetric Hanning window that extended to the edge of the ROI [17]. The average of the squared magnitude of the Fourier Transform was taken as the estimate of the power spectrum for that image. Averages across images were used as the final estimate of the power spectrum.
The LFE was computed according to a recent publication [3]. Gabor filters that spanned center frequencies from 0.125 cyc/mm to 2.8 cyc/mm were evaluated at six different orientations. The filters were sine-phase with 1.4 octave bandwidth, and an aspect ratio of 1. Filter responses from 1cm inside the boundary of the ROI were used. The histograms binned the central 99% of the responses, with an additional 1% bin for the remaining extremal values.
3. RESULTS AND DISCUSSION The main results of this work are power and LFE averaged over orientations and plotted as a function of spatial frequency (i.e. power spectra and LFE spectra).
A. No Microstructure
B. With Microstructure
C. Gaussian
Figure 4. Examples of the UPenn Virtual Breast Phantom.The images show an example of the breast phantom beingdeveloped at the University of Pennsylvania (A) and a recentversion that includes a model of breast microstructure (B).The backgrounds have been converted from transmission todensity. A Gaussian texture with a power-law spectrum (C) isshown for reference.
A. Backgrounds
B. Backgrounds with added Noise
Figure 5. Addition of Acquisition noise. Example CBLB,TB and Upenn phantom images before and after the additionof noise. The magnitude of the noise was set toapproximately equate power at 1 cyc/mm.
Proc. of SPIE Vol. 9037 90370G-4
Downloaded From: http://spiedigitallibrary.org/ on 07/15/2016 Terms of Use: http://spiedigitallibrary.org/ss/TermsOfUse.aspx
3.1 Power Spectra
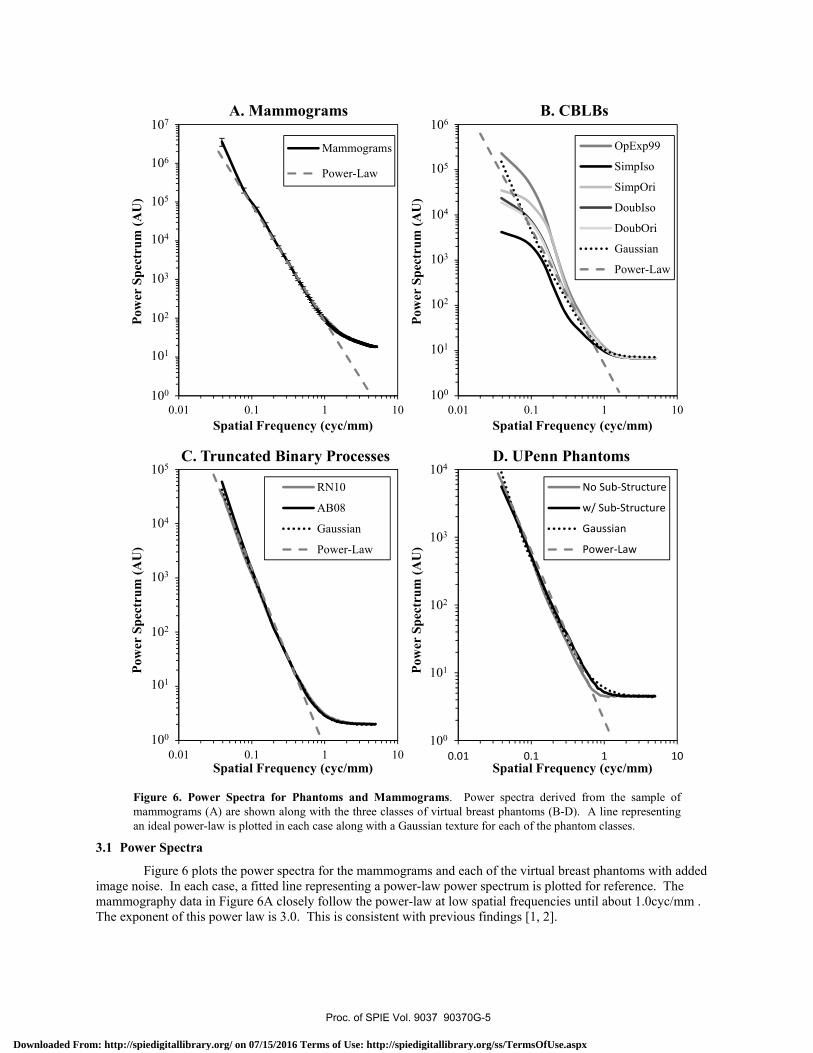
Figure 6 plots the power spectra for the mammograms and each of the virtual breast phantoms with added image noise. In each case, a fitted line representing a power-law power spectrum is plotted for reference. The mammography data in Figure 6A closely follow the power-law at low spatial frequencies until about 1.0cyc/mm . The exponent of this power law is 3.0. This is consistent with previous findings [1, 2].
0.01 0.1 1 10
OpExp99
SimpIso
SimpOri
DoubIso
DoubOri
Gaussian
Power-Law
0.01 0.1 1 10
No Sub-Structure
w/ Sub-Structure
Gaussian
Power-Law
0.01 0.1 1 10
Mammograms
Power-Law
0.01 0.1 1 10
RN10
AB08
Gaussian
Power-Law
100
101
102
103
104
105
106
107
100
101
102
103
104
105
106
100
101
102
103
104
100
101
102
103
104
105
Spatial Frequency (cyc/mm)Spatial Frequency (cyc/mm)
Spatial Frequency (cyc/mm)Spatial Frequency (cyc/mm)
Pow
er S
pect
rum
(AU
)
Pow
er S
pect
rum
(AU
)
Pow
er S
pect
rum
(AU
)
Pow
er S
pect
rum
(AU
)
A. Mammograms B. CBLBs
C. Truncated Binary Processes D. UPenn Phantoms
Figure 6. Power Spectra for Phantoms and Mammograms. Power spectra derived from the sample ofmammograms (A) are shown along with the three classes of virtual breast phantoms (B-D). A line representingan ideal power-law is plotted in each case along with a Gaussian texture for each of the phantom classes.
Proc. of SPIE Vol. 9037 90370G-5
Downloaded From: http://spiedigitallibrary.org/ on 07/15/2016 Terms of Use: http://spiedigitallibrary.org/ss/TermsOfUse.aspx
The CBLBs in Figure 6B appear to rolloff at the lowest spetial frequencies plotted, before adopting an approximately power-law form (exponent is 3.0) from 0.1 to 1.0 cyc/mm, and then departing from this as the contribution of noise increases at higher frequencies. Similar power-law evaluations of the CBLBs were made in the primary publications [8, 9], and the processes did not exhibit as much departure from the power law at low spatial frequencies. This may be due to differences in how the power spectra were computed, although further investigation of this difference is warranted. The truncated binary processes in Figure 6C and the UPenn phantoms in Figure 6D are well approximated by power-laws at low spatial frequencies, with noise-induced departure beginning at 1cyc/mm. We note that the TB phantoms are fit by a power-law with an exponent of 3.3, and the UPenn phantom is fit by a power-law with exponent of 2.5. Even with some departures at low-frequencies by the CBLBs, the general finding is that the power spectra of the virtual phantoms are reasonably well fit by a power-law over the frequencies in which anatomical variability dominates, even though the various phantoms have quite different visual appearances. This is a testament to the ubiquitous nature of the power law. However, when the goal is to distinguish between various models, the generality of the power law may work against its usefulness. This serves as the motivation for investigating higher-order statistical properties. 3.2 Laplacian Fractional Entropy
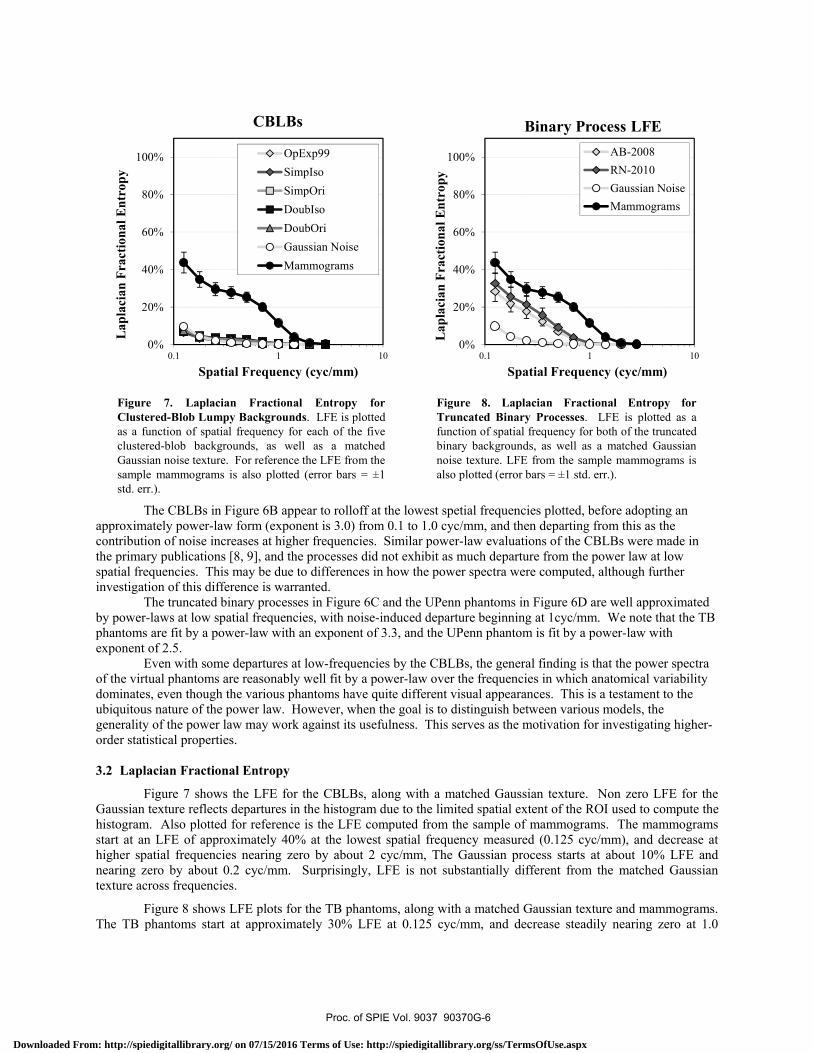
Figure 7 shows the LFE for the CBLBs, along with a matched Gaussian texture. Non zero LFE for the Gaussian texture reflects departures in the histogram due to the limited spatial extent of the ROI used to compute the histogram. Also plotted for reference is the LFE computed from the sample of mammograms. The mammograms start at an LFE of approximately 40% at the lowest spatial frequency measured (0.125 cyc/mm), and decrease at higher spatial frequencies nearing zero by about 2 cyc/mm, The Gaussian process starts at about 10% LFE and nearing zero by about 0.2 cyc/mm. Surprisingly, LFE is not substantially different from the matched Gaussian texture across frequencies.
Figure 8 shows LFE plots for the TB phantoms, along with a matched Gaussian texture and mammograms. The TB phantoms start at approximately 30% LFE at 0.125 cyc/mm, and decrease steadily nearing zero at 1.0
Figure 7. Laplacian Fractional Entropy forClustered-Blob Lumpy Backgrounds. LFE is plottedas a function of spatial frequency for each of the fiveclustered-blob backgrounds, as well as a matchedGaussian noise texture. For reference the LFE from thesample mammograms is also plotted (error bars = ±1std. err.).
0%
20%
40%
60%
80%
100%
0.1 1 10
OpExp99SimpIsoSimpOriDoubIsoDoubOriGaussian NoiseMammograms
Spatial Frequency (cyc/mm)
Lap
laci
anFr
actio
nal E
ntro
pyCBLBs
Figure 8. Laplacian Fractional Entropy forTruncated Binary Processes. LFE is plotted as afunction of spatial frequency for both of the truncatedbinary backgrounds, as well as a matched Gaussiannoise texture. LFE from the sample mammograms isalso plotted (error bars = ±1 std. err.).
0%
20%
40%
60%
80%
100%
0.1 1 10
AB-2008RN-2010Gaussian NoiseMammograms
Spatial Frequency (cyc/mm)
Lap
laci
anFr
actio
nal E
ntro
py
Binary Process LFE
Proc. of SPIE Vol. 9037 90370G-6
Downloaded From: http://spiedigitallibrary.org/ on 07/15/2016 Terms of Use: http://spiedigitallibrary.org/ss/TermsOfUse.aspx
cyc/mm. While substantially greater than the Gaussian process, LFE from the TB processes is still substantially less than the average measured from mammograms.
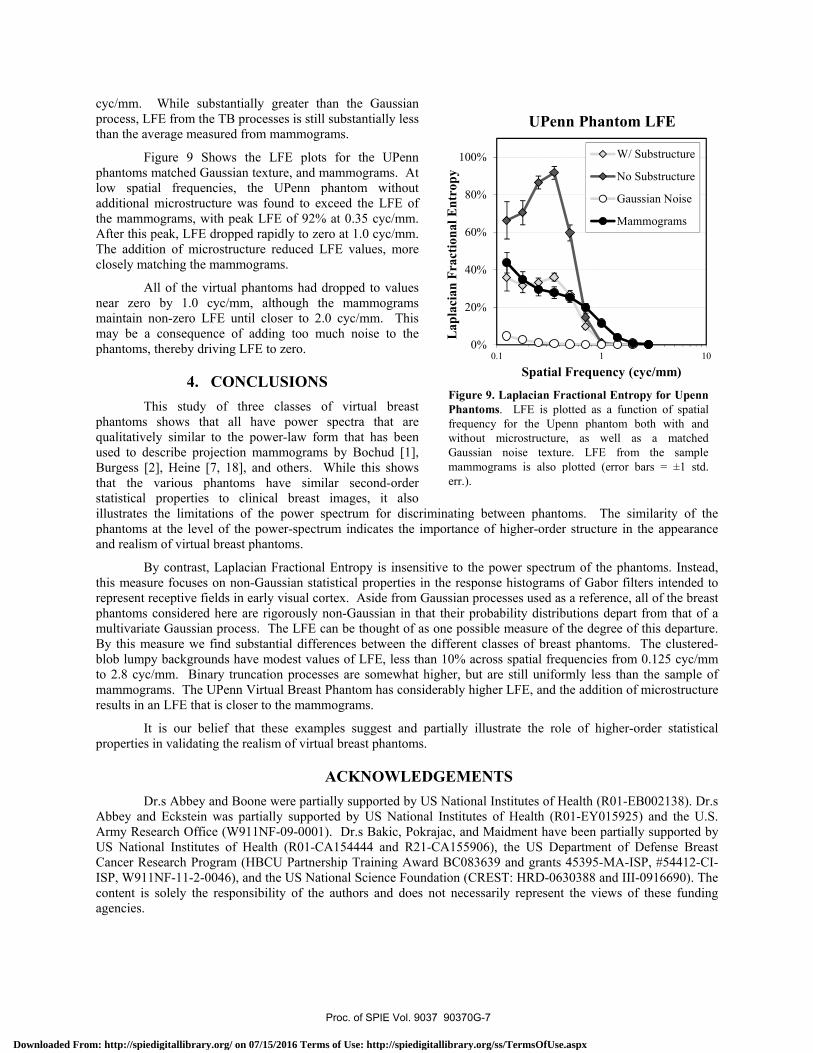
Figure 9 Shows the LFE plots for the UPenn phantoms matched Gaussian texture, and mammograms. At low spatial frequencies, the UPenn phantom without additional microstructure was found to exceed the LFE of the mammograms, with peak LFE of 92% at 0.35 cyc/mm. After this peak, LFE dropped rapidly to zero at 1.0 cyc/mm. The addition of microstructure reduced LFE values, more closely matching the mammograms.
All of the virtual phantoms had dropped to values near zero by 1.0 cyc/mm, although the mammograms maintain non-zero LFE until closer to 2.0 cyc/mm. This may be a consequence of adding too much noise to the phantoms, thereby driving LFE to zero.
4. CONCLUSIONS This study of three classes of virtual breast phantoms shows that all have power spectra that are qualitatively similar to the power-law form that has been used to describe projection mammograms by Bochud [1], Burgess [2], Heine [7, 18], and others. While this shows that the various phantoms have similar second-order statistical properties to clinical breast images, it also illustrates the limitations of the power spectrum for discriminating between phantoms. The similarity of the phantoms at the level of the power-spectrum indicates the importance of higher-order structure in the appearance and realism of virtual breast phantoms.
By contrast, Laplacian Fractional Entropy is insensitive to the power spectrum of the phantoms. Instead, this measure focuses on non-Gaussian statistical properties in the response histograms of Gabor filters intended to represent receptive fields in early visual cortex. Aside from Gaussian processes used as a reference, all of the breast phantoms considered here are rigorously non-Gaussian in that their probability distributions depart from that of a multivariate Gaussian process. The LFE can be thought of as one possible measure of the degree of this departure. By this measure we find substantial differences between the different classes of breast phantoms. The clustered-blob lumpy backgrounds have modest values of LFE, less than 10% across spatial frequencies from 0.125 cyc/mm to 2.8 cyc/mm. Binary truncation processes are somewhat higher, but are still uniformly less than the sample of mammograms. The UPenn Virtual Breast Phantom has considerably higher LFE, and the addition of microstructure results in an LFE that is closer to the mammograms.
It is our belief that these examples suggest and partially illustrate the role of higher-order statistical properties in validating the realism of virtual breast phantoms.
ACKNOWLEDGEMENTS Dr.s Abbey and Boone were partially supported by US National Institutes of Health (R01-EB002138). Dr.s Abbey and Eckstein was partially supported by US National Institutes of Health (R01-EY015925) and the U.S. Army Research Office (W911NF-09-0001). Dr.s Bakic, Pokrajac, and Maidment have been partially supported by US National Institutes of Health (R01-CA154444 and R21-CA155906), the US Department of Defense Breast Cancer Research Program (HBCU Partnership Training Award BC083639 and grants 45395-MA-ISP, #54412-CI-ISP, W911NF-11-2-0046), and the US National Science Foundation (CREST: HRD-0630388 and III-0916690). The content is solely the responsibility of the authors and does not necessarily represent the views of these funding agencies.
Figure 9. Laplacian Fractional Entropy for UpennPhantoms. LFE is plotted as a function of spatialfrequency for the Upenn phantom both with andwithout microstructure, as well as a matchedGaussian noise texture. LFE from the samplemammograms is also plotted (error bars = ±1 std.err.).
0%
20%
40%
60%
80%
100%
0.1 1 10
W/ Substructure
No Substructure
Gaussian Noise
Mammograms
Spatial Frequency (cyc/mm)
Lap
laci
anFr
actio
nal E
ntro
py
UPenn Phantom LFE
Proc. of SPIE Vol. 9037 90370G-7
Downloaded From: http://spiedigitallibrary.org/ on 07/15/2016 Terms of Use: http://spiedigitallibrary.org/ss/TermsOfUse.aspx

REFERENCES
[1] F. O. Bochud, F. R. Verdun, C. Hessler, and J. F. Valley, "Detectability of radiological images: The influence of anatomical noise," Proc. SPIE, 2436, 156-164 (1995).
[2] A. E. Burgess, F. L. Jacobson, and P. F. Judy, "Human observer detection experiments with mammograms and power-law noise," Med Phys, 28, 419-37 (2001).
[3] C. K. Abbey, A. Nosrateih, J. Sohl-Dickstein, K. Yang, and J. M. Boone, "Non-Gaussian statistical properties of breast images," Med Phys, 39, 7121-30 (2012).
[4] R. L. De Valois, D. G. Albrecht, and L. G. Thorell, "Spatial frequency selectivity of cells in macaque visual cortex," Vision Res, 22, 545-59 (1982).
[5] D. J. Field, "Relations between the statistics of natural images and the response properties of cortical cells," J Opt Soc Am A, 4, 2379-94 (1987).
[6] D. L. Ringach, M. J. Hawken, and R. Shapley, "Receptive field structure of neurons in monkey primary visual cortex revealed by stimulation with natural image sequences," J Vis, 2, 12-24 (2002).
[7] J. J. Heine, S. R. Deans, D. K. Cullers, R. Stauduhar, and L. P. Clarke, "Multiresolution statistical analysis of high-resolution digital mammograms," IEEE Transactions on Medical Imaging, 16, 503-515 (1997).
[8] F. Bochud, C. Abbey, and M. Eckstein, "Statistical texture synthesis of mammographic images with super-blob lumpy backgrounds," Opt Express, 4, 33-42 (1999).
[9] C. Castella, K. Kinkel, F. Descombes, M. P. Eckstein, P. E. Sottas, F. R. Verdun, and F. O. Bochud, "Mammographic texture synthesis: second-generation clustered lumpy backgrounds using a genetic algorithm," Opt Express, 16, 7595-607 (2008).
[10] J. P. Rolland and H. H. Barrett, "Effect of random background inhomogeneity on observer detection performance," J Opt Soc Am A, 9, 649-58 (1992).
[11] C. K. Abbey and J. M. Boone, "An ideal observer for a model of x-ray imaging in breast parenchymal tissue," Proceedings of IWDM, 5116, 393-400 (2008).
[12] I. Reiser and R. M. Nishikawa, "Task-based assessment of breast tomosynthesis: effect of acquisition parameters and quantum noise," Med Phys, 37, 1591-600 (2010).
[13] M. J. Yaffe, J. M. Boone, N. Packard, O. Alonzo-Proulx, S. Y. Huang, C. L. Peressotti, A. Al-Mayah, and K. Brock, "The myth of the 50-50 breast," Med Phys, 36, 5437-43 (2009).
[14] P. R. Bakic, M. Albert, D. Brzakovic, and A. D. Maidment, "Mammogram synthesis using a 3D simulation. I. Breast tissue model and image acquisition simulation," Medical Physics, 29, 2131-2139 (2002).
[15] P. R. Bakic, C. Zhang, and A. D. Maidment, "Development and characterization of an anthropomorphic breast software phantom based upon region-growing algorithm," Medical Physics, 38, 3165-76 (2011).
[16] D. D. Pokrajac, A. D. Maidment, and P. R. Bakic, "Optimized generation of high resolution breast anthropomorphic software phantoms," Medical Physics, 39, 2290-302 (2012).
[17] K. G. Metheany, C. K. Abbey, N. Packard, and J. M. Boone, "Characterizing anatomical variability in breast CT images," Med Phys, 35, 4685-94 (2008).
[18] J. J. Heine, S. R. Deans, R. P. Velthuizen, and L. P. Clarke, "On the statistical nature of mammograms," Med Phys, 26, 2254-65 (1999).
Proc. of SPIE Vol. 9037 90370G-8
Downloaded From: http://spiedigitallibrary.org/ on 07/15/2016 Terms of Use: http://spiedigitallibrary.org/ss/TermsOfUse.aspx