Embed Size (px)
Citation preview

Rural Non-Farm Economy Project Central Avenue, Chatham Maritime, Kent ME4 4TB, United Kingdom
Tel: +44 (0)1634 880088; Fax: +44 (0)1634 883706 Email: [email protected] WWW: http://www.nri.org/rnfe/index.html
Non-Farm Employment in Small-Scale Enterprises in Romania: Policy and Development Issues
Junior Davis and Angela Gaburici
Natural Resources Institute Report No. 2637
August 2001
Department for International Development (DFID)/World Bank Collaborative Program for Rural Development
CEE/CIS Rural Non-Farm Economy and Livelihoods Enhancement: Policy Research Initiative
Acknowledgements The author(s) gratefully acknowledge the support of the Department for International Development (DFID)/World Bank Collaborative Program for Rural Development, Project No. V0135, in preparing this paper. Any remaining errors and omissions are solely the authors’ responsibility. The views in this paper are solely those of the authors and not necessarily those of the DFID or World Bank.

2
Non-Farm Employment in Small-Scale Enterprises in Romania: Policy and Development Issues
Junior Davis and Angela Gaburici1 Introduction During the central planning era, rural development in transition economies was frequently associated with agricultural development; recently opinion has begun to move away from this position. Arguments in favour of paying greater attention to the non-farm sector in the context of rural economic development centres around the sector’s potential in absorbing excess labour from the agricultural sector and urban-rural migration (especially in transition countries), in contributing to income growth and in promoting a more equitable distribution of income. In most transition economies a sizeable part of the population still lives in rural areas.2 Employment and income from small-scale or micro-small-medium sized non-farm enterprise (MSME) activities are becoming of growing importance in the rural economy of transition countries. There is growing evidence that rural households in the Central and Eastern European Countries (CEECs) may obtain 30 to 50 per cent of their income from non-farm sources (Davis and Gaburici, 1999; Greif, 1997). For example, in Poland, agriculture is the main source of income for only 29 per cent of village households and 40 per cent of the rural population, whereas non-farm income is the main source for 30 per cent of village households (Christensen and Lacroix, 1997). In rural areas dominated by poor, subsistence based farming, non-farm enterprise development will to some extent depend on restructuring the small farm sector, increasing agricultural incomes and creating a demand for inputs and services. This will require public sector involvement, support and incentives. Incentives should encourage the development of private associations and co-operatives to begin to add value to farm produce and bring agriculture-industry-trade multiplier effects into the rural sector (Davis, 2001). In 1997, only 17 per cent of MSMEs in Romania were found in rural areas (Florian and Rusu, 2000). Despite its importance the rural small enterprise sector remains limited, though growing. The aim of this paper is to bring together information that we have collected about MSMEs in Romania and to examine their impact on the development of sustainable rural livelihoods. As these firms operate in fixed locations and are therefore more easily located and observed, most of the data presented is based on our survey of 74 firms in Brasov and Dolj counties of Romania. This data is complemented with information about unregistered gathering, hawking, and handicraft activities collected through our qualitative social development studies in the same counties. Both categories of information document the situation at a particular point in time and can provide insights into the functioning of enterprises, but not on the dynamics of change. There are however, some initial complications in understanding the operation of small non-farm firms. On the one hand, for many of those involved in rural non-farm enterprise activities, there is no difference between activities to meet their subsistence needs and producing for the market. Thus, they sell what is surplus to their needs or in response to the opportunity selling provides to

3
generate additional cash income. On the other hand, many of the registered rural non-farm firms are commercially oriented and operate in a competitive market. In the next section we outline the existing types of firms and research methodology. Afterwards, we consider the activity profile, structure and potential for rural non-farm micro-enterprise development in Romania.

4
Types of enterprises during the transition period Those firms on the official Register of Trade may be grouped into two categories, if we consider the official accounting reports for 1999/2000. Category I includes those enterprises that submitted their balance sheet (at the official local authority), which attests that they were not merely registered enterprises, but were also active in the respective year. Category II includes those enterprises that did not submit a balance sheet, however this does not necessarily mean that they did not have any economic activity. In certain cases, this has to do with activities related to the informal economy which has developed during the transition period. Micro small to medium-sized enterprises (MSMEs) comprise 98 per cent of registered firms in Romania. Law no. 133/1999 classifies enterprises by size “number of employees.” Thus, firms are classified as follows: a) Micro-enterprises - with less than 9 employees; b) Small enterprises - with 10 - 49 employees; and c) Medium sized enterprises - with 50 - 249 employees. Most of the surveyed firms in this study are MSMEs. The Romanian Government passed Law no. 133/1999 to improve the business environment for private entrepreneurs by providing a number of facilities for MSMEs (e.g. taxation concessions, financial support etc.) intended to contribute to the sectors future development. Within the MSME group, the average turnover in 1999 was: (i) Romanian Lei (ROL) 0.45 billion per micro-enterprise; (ii) ROL 6.2 billion per small-sized enterprise; and (iii) ROL 18.4 billion per medium-sized enterprise. As medium-sized companies are few in number, they have a smaller contribution to the total turnover of the MSME sector (see Table 1).
Table 1- Turnover of SMEs in Romania by category, 1999 Number Sum bill. ROL Average bill. ROL
Total SME 394,472 404,736 1.03 of which: Micro-enterprises 366,235 163,736 0.45 Small-sized companies 22,933 143,339 6.25 Medium-sized companies 5,304 97,660 18.41
Note: Our estimates are based on data from “Adevarul economic” no. 12, 21.03.2001.
Those firms with foreign investment contributed 28.4 per cent to total turnover and 31.6 per cent to the gross profit of Romanian firms in 1999. At present around 18,000 Romanians are employed in these enterprises (Adevarul economic, 2001). In Romania, around half the firms with foreign capital are located in Bucharest, the rest are spread throughout the country. During the period December 1990 - November 2000, 2,040 enterprises with foreign capital were registered in Brasov county, compared to 891 in Dolj. In both cases, foreign investment has been concentrated in large urban centres. In the subsequent sections of this paper we focus on the results of our small baseline survey of rural non-farm micro-enterprise development, performance and activities in Romania.

5
1. Enterprise Size and Characteristics Our survey of non-farm enterprises was preceded by and based on a county baseline survey (mainly based on secondary data collection and the interview of key stakeholders such as mayors, agricultural extension officers and bank managers) of natural, economic and social conditions of the villages where the surveyed enterprises are located. We interviewed 74 rural non-farm enterprises, which were randomly selected from a list of active (operating) firms provided at the Town Hall (administrative centre) of each commune. However, we found that some enterprises, considered as active at the town hall, were not in fact operational, and a few entrepreneurs simply refused to participate in the questionnaire. In such circumstances, for 3 per cent of our sample, we replaced the initial randomly selected firm with another from the town hall list. The size of the survey sample was limited for budgetary reasons; it does not reflect a lack of potential firms to interview. The sample of 74 enterprises includes 31 firms located in Brasov County and 43 in Dolj County. Sample size by commune is directly proportional to the total number of active firms in each locality, representing about 10 per cent of the total. The largest sample is for Segarcea, and the smallest in Isalnita (Table 2).
Table 2- Non-farm enterprises sample by county and locality Locality Brasov
County Dolj county Total
sample Population
density (persons/km2)
Unemployed Nos.
Feldioara 12 12 96.1 485 Moeciu 9 9 53.2 474 Voila 10 10 30.1 312 Dabuleni 10 10 86.9 853 Isalnita 8 8 136.0 225 Motatei 10 10 71.4 200 Segarcea 15 15 72.9 330 Total sample 31 43 74
We have grouped the firms by fields of activity. We found that across 11-activity fields trade enterprises have the highest share in our sample followed by service sector firms. In Brasov, “wood processing” and “other services” have the same share, while in Dolj agricultural product processing is the second most important rural non-farm enterprise activity (Table 3).
Table 3 – RNFE Fields of activity by county Brasov County Dolj county Total sample Fields N % N % N %
Agricultural product processing 2 6.4 5 11.6 7 9.4 Wood processing 5 16.1 2 4.6 7 9.4 Construction 1 2.3 1 1.3 Bakery 4 12.9 1 2.3 5 6.7 Hotel, restaurant, confectionery 4 12.9 2 4.6 5 6.7 Direct trade/ retail trade 8 25.8 17 39.5 25 33.7

6
Repair services - - 4 9.3 4 5.4 Other services 5 16.1 4 9.3 9 12.1 Telecommunication, TV 1 3.2 2 4.6 3 4.0 Health, social services 2 6.4 4 9.3 6 8.1 Other fields - - 1 2.3 1 1.3 Total sample 31 100.0 43 100.0 74 100.
0

7
Our analysis of the sample by commune (Table 4) shows that certain localities have a wide range of non-farm activities, while other communes have a concentration of firms in a particular activity. For example, in Motatei commune 70 per cent of firms are trading companies, and only four other activity fields were identified; in contrast the localities of Voila and Dabuleni have the same sample size, but here there are six different fields of rural non-farm enterprise.
Table 4 - Fields of activity by locality
Brasov County Dolj county Activity Total sampl
e Feldi-oara
Moeciu
Voila Dabuleni
Isalnita
Motatei Segarcea
Agricultural product processing
7 2 3 1 1
Wood processing 7 2 3 1 1
Constructions 1 1 Bakery 5 1 1 2 1 Hotel, restaurant & confectionery
6 4 1 1
Direct trade/ retail trade
25 3 4 1 2 3 7 5
Repair services 4 2 2
Other services 9 2 2 1 1 3
Telecommunications 3 1 1 1
Health, social services
6 1 1 1 1 2
Other fields 1 1 Total sample 74 12 9 10 10 8 10 15
Most of the firms in our survey (69 per cent) are limited liability companies (LLC), followed by “sole-trader” (13.5 per cent); the latter being most often found in Dolj. Our surveyalso included a state hospital in Segarcea, Dolj County. The organisation of health care is a complex and politically sensitive issue. Some privatisations of health care services have taken place, but it is progressing slowly. In the seven surveyed localities there were no private hospitals. There is only one hospital in Segarcea, which is state-owned. We have included it in our survey, but deal with it separately as it is the only state-owned enterprise in the sample. We also considered the distribution of firms by locality grouped according to their legal form. The localities of Motatei and Segarcea stand out by the high percentage of “sole trader” enterprises as compared to other localities. In all communes the entrepreneurs preference for limited liability companies is obvious and easily explained. According to present legislation, any person who holds Romanian Lei (ROL) 2 million (for share capital) (US$ 110) and another ROL 1 million (the cost of fees, documentation etc.) (US$ 55) may establish a limited liability company. Table 5 shows that limited liability companies are mainly involved in rural retail and direct trade activities.

8
Table 5 - Non-farm enterprises grouped by field of activity and legal form
Sole trader
Partnership
LLC Coop./ Assoc.
Other private
enterprise
State Total N
Constructions 1 1 Hotel, restaurant 5 1 6 Wood processing 1 2 4 7 Repair services 2 1 1 4 Telecommunication TV 3 3 Direct trade / retail trade 3 1 19 1 1 25 Health, social services 4 1 1 6 Other services 2 5 2 9 Bakery 4 1 5 Agricultural pdt processing
2 5 7
Other fields 1 1 Total N 10 3 51 2 7 1 74
Of the 25 enterprises that have trade as a primary activity, 19 are limited liability companies (LLC). The owners established most of the firms in our survey in 1994. A few firms (6) were taken over from other administrators, and very few (4) were bought from other owners during the period 1990-97. 65 per cent of the firms surveyed have at least one full time regular paid worker. Every enterprise within the “Partnership”, “Co-operative”, “Other Private Form”, and “State” groups, has employees. Within the “Limited Liability” group, only 67 per cent of enterprises have employees. “Sole Trader” firms employ the fewest people and tend to be based solely on the owner’s labour. The total number of employees of enterprises within the sample is 354 persons, thus the average per enterprise is 7. In the Segarcea State Hospital 107 people are employed, which is 30 per cent of the total. If we exclude it from our estimates, there remain 247 employees in 47 firms, which results in an average of 5 workers per private enterprise (Table 6). Only one LLC comes close to the legal maximum of 50 employees/ associates in a firm (see Law 31/ 1991). In the LLC group, which holds the highest share of the sample, 1-12 persons are employed, 3.6 persons on average. According to the classification established through Law 133/1999, most of the sampled private enterprises may be classified as “micro-enterprises” (the main exception being the Segarcea hospital).
Table 6 - Full time non-family employees
N Total number of workers Average per enterprise
LLC 34 123 3.6 Partnership 3 11 3.7 Co-operative 2 28 14 Sole trader 1 4 4 Other private 7 81 11.6 Total private firms 47 247 5.3 State Hospital 1 107 107 Total: Sample 48 354 7.4

9
2. Economic Activity of Non-Farm Enterprises in Rural Areas
The living standards of the Romanian rural population still largely depend on the performance of the agricultural sector, but also increasingly on non-farm enterprise activities (Davis and Pearce, 2000). In theory, the development of the rural non-farm economy should increase the level of investment in villages and job supply (Reardon, 1998). A critical component to this will be the economic and institutional environment within which firms operate. Hare (2001) notes that the institutional environment has a critical influence on enterprise behaviour and economic performance. As far as the institutional environment is concerned, three types of change are potentially important:
• The entry of new firms; • The restructuring and re-organisation of existing firms; and • Exit from the market by failing firms, or the decline of low productivity firms (Hare
2001).
Where possible we adopt the Hare (2001) framework, so that a reasonably comprehensive assessment of the type of rural non-farm enterprise activities and performance may be made.
2.1. Economic Indicators The survey included a module on the financial results of firms during 1998 - 1999. The answers to these questions were recorded in the database as numeric values expressed in ROL. We have translated these values into US$, based upon the annual average exchange rate ROL/US$ (See Figure 1).
Exchange Rate ROL / $
Year
Oct-200019991998199719961995
Valu
e R
OL
/ $
30000
20000
10000
0
Exchange rate ROL /$
Annual average rate
End of period
Figure 1 - Exchange Rate ROL / $
The sample average value of registered capital declined in 1999 as compared to 1998. However, the lowest value of registered capital increased in both Brasov and Dolj, due to Law 133/1999, which requires an enterprise to retain a minimum of ROL 2 million of

10
registered share capital. For the whole sample, average turnover declined from US$ 60,639, to US$ 49,700 per enterprise. However, in Dolj a rise in the minimum level of turnover from US$ 788 to US$ 1,304 suggests improved business activity and performance among microenterprises (Table 7). Table 7 – Registered share capital and turnover for non-farm enterprises, 1998 - 1999
Valid N
Mean
Registered capital 1998 (US$) N=27 809.6 Registered capital 1999 (US$) N=28 620.2 Turnover 1998 (US$) N=26 49,681.4
Brasov
Turnover 1999 (US$) N=26 41,128.5 Registered capital 1998 (US$) N=38 5,988.5 Registered capital 1999 (US$) N=42 5,028.8 Turnover 1998 (US$) N=37 68,339.4
Dolj
Turnover 1999 (US$) N=42 55,007 Registered capital 1998 (US$) N=65 3,837.3 Registered capital 1999 (US$) N=70 3,265.4 Turnover 1998 (US$) N=63 60,639.3
Total
Turnover 1999 (US$) N=68 49,700.5
Turnover 1999 (USD)
5000004000003000002000001000000-100000
Estim
ate
Turn
over
USD
, for
200
0
400000
300000
200000
100000
0
-100000
Figure 2 - Scatterplot for turnover 1999 and estimated turnover for 2000
National currency devaluation in 1999 and 2000 against the US$ had a negative impact upon the economic performance of the surveyed firms. At the same time, the inadequate rural financial market hampers long-term investment in rural MSMEs and industry. The average value of turnover US$49,700 was lower in 1999 than in 1998 (US$ 60,639). This decline was mainly due to a dramatic fall in large firm turnover. Annual returns to capital increased slightly, but all other statistical indicators show a decline during the period of 1998 - 1999; this situation is similar for both counties.

11
Our analysis of the economic situation of the non-farm rural enterprise sector is based on the investigation of firms organised at village level. This is important, because for some firms in our sample it would be difficult to understand how turnover of less than US$100 per annum keeps an enterprise operational. In much of our sample, MSMEs mainly utilise family labour, the value of which is not included in their accounts. The situation is similar in the case of mutual help or barter of labour for goods among friends and neighbours; this is a common feature of rural life in Romania. In the sample, wages represent a maximum of 40 per cent of annual operating ecosts. As is well known, investment costs are usually paid-off in the long run based on annual amortisation rates. Among our respondents, when investment occurs, it is usually written-off against costs in just one year. Some of the owner/ managers surveyed register the whole investment value once they have made it; thus annual expenditures are artificially increased in the year when the investment was made. Although in Romania there is some provision for firms to carry forward losses to set against tax in future years, very few entrepreneurs make long-term investments, as their own funds are limited, especially while bank interest rates remain high in Romania (see Figure 6). Furthermore, this situation does not imply that rates of return on investment are so high that projects are paid back after just one year; rather the problem is one more of risk and access to credit implying that long term finance (e.g. a three year loan – which by UK standards would not be considered long term) is either unavailable or too costly.
2.2. Annual net profit Annual net profit is a well-known indicator to all the interviewees . The average net profit per enterprise was US$4,717 in 1999 (where possible our enumerators cross-checked these figures with bank account/ tax documentation and broader estimates based on interviews with local bank managers concerning the financial performance and loan portfolios of local firms). However, as shown in Table 8 the standard deviation is quite high and thus it is better to consider the 5 per cent trimmed Mean statistic, which indicates a level of US$ 3,390 and Median value in particular, which indicates a level of $1,826 per firm.
Table 8 - Statistics for annual net profit - total sample Annual net profit (US$) Statistic Std. Error
Mean 4,717.1 1,024.7 Lower bound 2,674.4 95% Confidence interval
for Mean Upper bound 6,759.8 5% trimmed mean 3,390.4 Median 1,826.1 Skewness 3.46 .281 Kurtosis 14.4 .555
Note: 5% Trimmed Mean is an arithmetic mean calculated when the largest 5% and the smallest 5% of the cases have been eliminated. Eliminating extreme cases from the computation of the mean results in a better estimate of central tendency, especially when the data are non-normal. Skewness is a measure of the asymmetry of a distribution. The normal distribution is symmetric, and has a skewness value of zero.
In 1999 of the 73 surveyed firms, 64 recorded a net profit while the remaining firms recorded losses. These 64 firms achieved a total net profit of US$ 355,634.7. Of the

12
remainder, five suffered losses and four firms broke-even. The negative net profit values ranged between US$ -8,152.3 and US$ -391.3. The amount of loss stated by enterprises totalled US$ -11,282 and it represents 3.2 per cent of total net profit. 12.3 per cent share of the sample is comprised of firms recording losses and is still lower than the national average of 30 per cent for all active firms (those which submitted a balance sheet) reporting a loss in 19993. The type of enterprise activity may have a significant impact on net profit. The annual average net profit for the sample of 73 was US$4,717. Of the 11 rural non-farm activities identified, four stand out where above average profits are generated, namely: construction, wood processing, repair services and hotel-restaurant. Given the small sample size, it is difficult to draw firm conclusions, particularly in the field of construction. However, increased house building demand in rural areas, particularly where tourism is well developed, offers considerable growth potential for the construction industry. For example, in Voila commune urban -dwellers began building dachas/vacation homes, and the demand for such accommodation is increasing, due to the low costs of building materials (stone and wood), which are abundant at the local level. At the same time, the skills and talent of local builders resulted in high quality buildings. For the same reason, the building of dachas or vacation homes in Moeciu (Brasov County), has also grown. This is also true of Segarcea and Isalnita (Dolj County) although the building materials most frequently used (mainly brick and cement) are more expensive than those used in the mountainous zones. Besides houses, stables and small stores are also being built, while roads and courtyards are being asphalted. Although the quality of construction in the sample areas is considered good, the living conditions in the houses are usually harsh due to the poor quality and/or lack of access to public potable water supplies, waste management and sanitation services, and other utility services. Nonetheless, the growth of non-farm construction firms and business activity in the rural areas of Romania has positive portents. For example, when agriculture started to grow in China, following the late 1970s’ liberalisation, one of the first visible signs of improvement was a huge increase in rural investment. What people mostly wanted initially was to improve their houses by renewing the roof, adding a room, etc. Once that was done, they moved onto other things. Much of the investment was made through the people’s own work (self-help), but they also had cash to purchase materials. There was not much use of credit in the early years, just more cash due to increased agricultural production and sales in mostly local markets. In Romania the comparison falls down in terms of increased agricultural production generating sufficient additional income for most of the rural poor, however access to remittances from the city and abroad, and as in China the rural households diversification into local non-farm activities, sales and income sources (through secondary employment, state benefits, or lease of land assets and machinery) are important stimuli to rural non-farm economic growth. Table 9 summarises sample data on the most and least profitable primary non-farm rural enterprise activities. Many rural households in transition economies have diversified income strategies in more than one principal activity. In our survey, we found that typically forest based activities are only part of a household activity. Wood processing is one of the most profitable rural non-farm activities in Romania. The reported net profit of the surveyed wood processing firms appears to confirm this. However, most of the firms we interviewed in this sector maintained that they did not have the means to procure modern equipment, to improve labour productivity and achieve a higher quality end

13
product. The comparatively high level of both skill and capital for entry into wood processing, carpentry and furniture making activities may partially explain their higher returns to labour and profitability. Forest based manufacturing MSMEs that produce mainly for rural consumers are exposed to significant seasonal income constraints, being to some extent agriculture based, they have a short peak during which demand may exceed their capacity to supply. The resulting supply gap may be filled by external suppliers and forces local MSMEs to invest in capacity that may remain idle for much of the year. A lack of working capital prevents many forest based MSMEs from stocking adequate productive inputs to even-out seasonal fluctuations in their markets; thus trapping these firms in one-off responses to individual orders. Nonetheless, some wood processing MSMEs can improve efficiency and scale of operation by introducing better tools and technology. They can also concentrate on new market niches in which for example, factory furniture products are not competitive, such as very low cost basic furniture below the price range of the latter; or high quality hand carved pieces of high value. In Brasov (a region of high tourist potential), there is some growth in the development of handicrafts production and the establishment of marketing chains between specific craftsmen (with a tradition and track-record in a particular handicraft) and urban market outlets e.g., museum shops, tourist shops etc. There is still some scope to further develop this market.

14
Table 9 - Most and least successful non-farm rural enterprises4
Rank Primary activity Value (US$)
1 Wood processing 52,175.3
2 Confectionery 38,022.7
3 Agriculture 29,348.6
4 Construction 19,565
Highest
5 Forest exploitation 19,565.7
1 Wood cutting -1,304.4
2 Sunflower oil production -782.6
3 Trade -652.2
Annual net profit 1999 (US$)
Lowest
4 Tyre repairs -391.3
1 Distillery 666.7
2 Soft drinks trade 471.4
3 Car repairs 375.0
4 Barber shop 333.4
Highest
5 Carpentry - wood processing 233.3
1 Retail trade -71.4
2 Wood cutting -66.7
3 Trade -33.3
4 Tyre repairs -11.7
Profit/ Expenditure %
Lowest
5 Sunflower oil production -8.4
The repair services firms in our survey earn relatively high profits in the rural areas. The high demand for these services in part reflects the lack of purchasing power and poor living conditions of most rural households. Most people (as during the communist era) tend to repair existing or purchase second hand goods. There are relatively few repair firms in rural areas despite the high demand for their services. Competition in rural areas being largely absent, the quality of repair services is very poor. The existence and development of hotel-restaurant activities in rural Romania is often considered an indicator of local prosperity. We found most of these were located in villages in close proximity to tourism zones. At the same time, the restaurants, cafés and discos, which are profitable in certain villages indicate that a small segment of the rural population (we estimate between 8 – 10 per cent) has sufficient cash income to afford these services.

15
Agricultural product processing is an important activity in the communes located a great distance from towns or isolated villages with inaccessible roads during certain times of the year. Within this group, grain mills are the most profitable (net profit over US$ 5,600), being located in almost all the plain zone communes grinding wheat and/or maize into flour. Certain mills also have secondary activities such as processing livestock feed. At the same time, we found significant profits in firms producing traditional alcoholic drinks. For example, “tzuica” (a brandy) which is made by distilling fermented plum juice (or other fruits), or “tescovina” from the sediment left after processing grapes into wine. A small enterprise is also included in the agricultural products processing group from our sample, in which edible oil is extracted from sunflower seeds (without using any solvent). The -$783 losses of this enterprise was the result of equipment investments made during 1999, and as such it would be premature to suggest that this activity is unprofitable. Trade related activity attracted a large number of small investors during the early years of transition, and in terms of numbers continues to dominate the non-farm enterprise sector in villages. Sectoral profits in 1999/2000 were much lower than in other activities (including the lowest profit/expenditure ratios). In certain communes, the structure of goods from retail stores does not correspond to local demand, as supply is not based upon adequate market information/research. Some of the traders in our survey reported losses due to the retention of large stocks of merchandise they cannot sell (at almost any price). The bakeries in our sample achieved reasonable profits; indeed no bakery reported losses in 1999/2000. Again, health and social service firms achieved reasonable profits although this varies according to enterprise size, legal form and key aspects of the business (see Table 10).
Table 10 - Annual Net Profit for health and social services firms
Commune Annual net profit 1999 (US$)
Primary profile of activity
Dabuleni 6,521.9 Pharmacy Feldioara 1,826.1 Drugstore Motatei 3,456.6 Drugstore Segarcea 2,282.6 Sanitary-veterinary services Segarcea 11,087.2 Hospital Voila 358.7 Medical services Median 2,869.6
Clearly, the hospital from Segarcea with 107 employees cannot be compared to any private medical centre where there is usually only one physician. Considering the specific characteristics in this field, its analysis should be based upon a special study, which should focus upon the quality of health services, structure of medicine supply, etc. For investigating all these issues, a different questionnaire is required. However, our baseline analysis of seven communes enabled us to distinguish two important aspects, namely:
(i) The pace of privatisation in health and social services is slower than other sectors of the economy; and
(ii) There are very few health professionals or medical services in rural Romania. This is not only a function of the collapse in government funding of these services in

16
rural areas, but also due to slowness of private sector response. This has resulted in limited accessibility and poor quality health services for the rural population.
If we classify firms according to their legal form, net profits grew during the period 1998 – 1999/2000 in the Limited Liability Company (LLC) group and it declined in the others (see Table 11). The decline in profit across the enterprise sector reflected a general downturn in the economy during that period. With the turmoil in international capital markets during 1998-1999, GDP declined by around -7% for 1998, -3.2% for 1999; GDP is currently 20% less than its 1990 level and unemployment is still rising.

17
Table 11 - Average net profit by type of enterprise Annual net profit
1999 (US$) Annual net profit
1998 (US$) Type of enterprise
Average Average Legal form – sole trader with w/o employees
1,998.7 2,478.9
Partnership (joint-stock company) 17,065 18,892.4 Limited Liability Company 3,971.2 3,454.1 Co-operative/ association 832.2 2,955.1 Other private enterprises 8,268.8 8,627.9 State Hospital 11,087.2 16,901.7
The LLC group is the most common legal form of enterprise in rural areas. Among the enterprises from this group, as in the case of other groups, profit largely depends upon the field of activity, number of employees and other factors that will be presented in the other sections of this study. The Sole-trader group is represented by MSMEs, mainly with one self-employed owner working alone or assisted by 1 - 3 family members. Only one enterprise from this group used non-family labour. In the co-operatives/associations group we included consumption co-operative firms and a private agricultural association which, although having agricultural production as its primary activity, also performs many other different complementary activities i.e., livestock product processing, tractor and agricultural machinery repair and mechanisation services for private farms, etc. It should be noted that certain agricultural associations having diversified their portfolio of non-farm activities now earn more than in agricultural production. 2.3. Net profit / expenditure ratio The 73 economically active enterprises in 1999 earned on average US$45 net profit for every US$100 of expenditure. This ratio is different from one enterprise group to another, according to the field of activity and company’s legal form. The highest levels of this ratio were found among Sole-trader enterprises involved in agricultural product processing and repair services.

18
3. Relationship of Rural Non-Farm Enterprises with the Financial Market The development of a viable rural financial market is a critical factor in SME development. Previous work by Heidhues et. al., (1998); Breitschopf, et. al., (1999); Gaburici, Davis and Hare, (1998) reveal the importance of access to credit in the economic development of rural firms and farms in the private sector. The private sector in rural areas is small, nascent and largely non-competitive, suggesting that privatization is a necessary but not sufficient condition the stimulation of economic development in rural areas. It could be argued that from the very beginning the privatization process should have been accompanied by an infusion of funds into the non-farm enterprise sector. However, both Government and the state banks, which focused their attention on the larger enterprises, neglected this. 3.1. Credit During the period 1995-1999, 35 firms in our sample applied for a formal loan, and 27 applications were successful. During the period 1995 - 1997, only 8 private enterprises received a formal loan.
Table 12 - Group statistics by the year the business started and credit received
The year the business started
No. of firm per year
Credit received
1995 - 1997
Credit received
1998
Credit received
1999
No. of firms with credit
1990 3 1 1 2 1991 7 1 1 1 3 1992 9 1 1 1 1993 7 3 3 1994 16 1 2 3 6 1995 8 2 1 3 1996 6 1 1 2 1997 4 1 1 1998 6 1 3 4 1999 6 2 2 Total 72 8 7 12 27
Thus, by grouping firms according to access to formal credit between 1995-1999 and comparing this with the net profit performance of each group, we can broadly assess the influence of credit on the short/medium term economic results of the three groups presented in Table 13. However, we are not trying to infer causality from this exercise, as those firms which were profitable prior to applying for a loan, may have had more ready access to credit.
Table 13 – In the past five years, have you applied for a loan?
No Yes, but was refused
Yes, and was successful
Table Total
Count 39 8 27 74 Annual Expenditure 1998 (US$) Mean 55,046 44,634.7 52,872.4 52,993.7
Count 39 8 27 74 Annual Expenditure 1999 (US$) Mean 41,654.9 26,421.8 43,618.3 40,711.7

19
Count 39 8 27 74 Annual net profit 1998 (US$) Mean 4,339.6 3,971.9 6,626.4 5,126.6
Count 39 8 27 74 Annual net profit 1999 (US$) Mean 4,145.5 2,861.4 6,071.4 4,717.1
On average, higher profits were reported for the group that received a loan over the last 5 years (27 firms), as compared to the other groups (those that did not apply for credit; or applied unsuccessfully). The evolution of expenditure in the three groups over the last 2 years (1998 - 1999) is quite interesting. The firms that received no credit (particularly those firms refused a loan by the bank) reduced investment and expenditure on inputs with a negative impact on profits. If this trend continues, a further decapitalization of MSMEs may be anticipated resulting in increased bankrupcies. Table 14 shows the economic situation and activity profile for each enterprise comprising the group of firms that unsuccessfully applied for credit.
Table 14 - Enterprises that applied for credit, in the last 5 years but were refused credit
Code Annual net profit 1998
(US$)
Annual net profit 1999
(US$)
Primary profile of activity Bank applied to
BM08 225.3 -652.1 Trade Banca Agricola DD02 5,633.9 4,891.4 Trade BRD Dabuleni DD07 5,633.9 6,521.9 Pharmacy BRD Dabuleni DD10 5,633.9 3,260.9 Cereals Production BRD Dabuleni DM09 9,014.2 4,174 Agricultural Product
Acquisition Banca Agricola
DM10 1,802.8 1,630.4 Trade BCR DM21 2,704.2 1,760.9 Trade Banca Agricola DS13 1,126.7 1,304.3 Distillery Banca Agricola Sum 31,775.3 22,891.9 Mean 3,971.9 2,861.4
In 1999 of the 8 enterprises that were refused access to credit, only one reported a loss. Three of the firms achieved a profit performance above the sample average. Under these circumstances, the objectivity of certain banks in screening and providing loans may be questioned. It is clear that the village based MSMEs cannot afford to ask for large loans, as they would not have the resources to repay them. For example, the largest rural bank in Romania, the Agricultural Bank (Banca Agricola), refused half of the enterprises because they had insufficient collateral or assets to cover loans. The Agricultural Bank was a state bank until it was privatised in 2001. From 1990 to 2000 it received massive funds from the state budget, in order to maintain its operation and provide subsidised loans to the state-owned farm sector. The Romanian Commercial Bank (BCR) is also a state bank, while the International Bank of Religions (BIR) is a private bank that went bankrupt in 1999. The delay in bank privatisation and poor management/regulation and operation of rural private banks led to more bankrupcies (i.e., Albina Bank, Bankcoop, Columna Bank, etc.) and has been a difficult economic development obstacle in the transition to a market economy., During the period 1998-1999 the number of enterprises in our sample that received a loan increased from 7 to 12, while the loan average value per company was up

20
from US$ 2,688 to US$ 4,130. Most loans were given to milling, direct/ wholesale trade and forest exploitation enterprises.
Table 15 - Value of formal loans received by source in 1999
Number Sum (US$) Credit Co-operative 3 10,761 BCR 4 24,783 Banc Post 2 8,152 Agricultural Bank 3 5,869 Total 12 49,566

21
Primary profile of activity
Car repairs
Trade(drinks)
TradeFood products trade
Carpernter - wood pr
Retail trade
Forest exploitation
Milling
Cre
dit r
ecei
ved
1999
(USD
)30000
20000
10000
0
Percent50
25
032613261
6848
9783
22827
Figure 3 - Value of credit (US$) by profile of activity in 1999 (also shows % of total credit to sample)
22
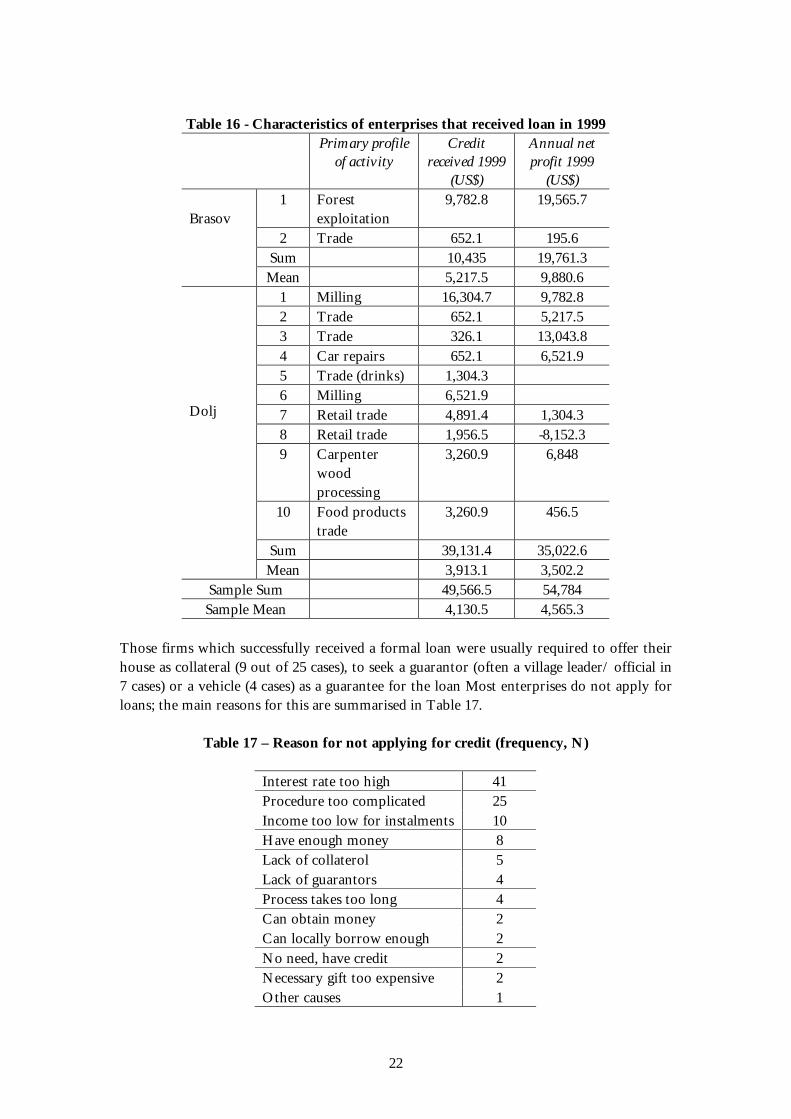
Table 16 - Characteristics of enterprises that received loan in 1999
Primary profile of activity
Credit received 1999
(US$)
Annual net profit 1999
(US$) 1 Forest
exploitation 9,782.8 19,565.7
2 Trade 652.1 195.6 Sum 10,435 19,761.3
Brasov
Mean 5,217.5 9,880.6 1 Milling 16,304.7 9,782.8 2 Trade 652.1 5,217.5 3 Trade 326.1 13,043.8 4 Car repairs 652.1 6,521.9 5 Trade (drinks) 1,304.3 6 Milling 6,521.9 7 Retail trade 4,891.4 1,304.3 8 Retail trade 1,956.5 -8,152.3 9 Carpenter
wood processing
3,260.9 6,848
10 Food products trade
3,260.9 456.5
Sum 39,131.4 35,022.6
Dolj
Mean 3,913.1 3,502.2 Sample Sum 49,566.5 54,784 Sample Mean 4,130.5 4,565.3
Those firms which successfully received a formal loan were usually required to offer their house as collateral (9 out of 25 cases), to seek a guarantor (often a village leader/ official in 7 cases) or a vehicle (4 cases) as a guarantee for the loan Most enterprises do not apply for loans; the main reasons for this are summarised in Table 17.
Table 17 – Reason for not applying for credit (frequency, N)
Interest rate too high 41 Procedure too complicated 25 Income too low for instalments 10 Have enough money 8 Lack of collaterol 5 Lack of guarantors 4 Process takes too long 4 Can obtain money 2 Can locally borrow enough 2 No need, have credit 2 Necessary gift too expensive 2 Other causes 1

23
Most of the firms that did not apply for credit maintain that interest rates are too high and the procedures for obtaining a loan are too complicated. The annual interest rate for a loan received in 1999 was between 40-69 per cent per annum (Figure 4).5
Interest rate for credit (% / year)
696765605756474540
20000
10000
0
Credit received 1999
Mean
Sum1957
3261
4891
9781304
16305
9783
Figure 4 - Group loans by interest rate (% per annum) in 1999
Only 8 of the sample maintained that the main reason they did not apply for a loan was that they earned enough. Ten firms did not apply for a loan because they felt that they could not afford to repay the loan instalments. The lack of collateral for a banking loan is also an often-cited concern among MSMEs. In both transition economies and Western Europe, collateral plays a key role in lending practices. It has two main functions: (i) collateral insures the lenders’ loan portfolio in case of borrowers’ default; and (ii) it represents an incentive for the borrowers to repay. Lenders attempt to overcome the lack of collateral by using the following collateral substitutes: tied contracts (specific credit cum labour, land, or marketing arrangements in which the lender controls part of the output or production resources of the borrower); third-party guarantees; stocks and equipment as security similar to leasing arrangements; threat of loss of access to future borrowing opportunities; and social sanctions of household members, extended family, informal groups etc. In order to surmount the lack of collateral, new collateral-free loan programmes are being developed in Romania. For example, the Center for Economic Development (CED, a member of the Soros Open Network) has initiated a microfinance programme for Romanian villages. This microfinance programme is based on the Grameen Bank model of collective moral responsibility for loan repayment. Credit is offered on an individual basis to particular entrepreneurs without collateral being required. In return, the whole community assumes the moral responsibility for repaying the loan on time. If even one member of the community defaults on their instalment, no other community member will receive a loan. Furthermore, it is the community members that decide who can apply

24
for/receive a loan. For this purpose, informal associations are established as non-legal entities, consisting of a maximum of 60 members who take decisions on a majority vote basis. Loans are provided through Banc Post, with a subsidised interest rate of 6 per cent per annum (see Figure 5), while the maximum value of a loan is US$ 2,000. This type of microfinance scheme although common in developing countries is relatively new to CEECs. At the time of writing, 1,800 of these loans have been granted with a total value of US$ 900,000 in three counties; this programme will soon be extended in terms of county coverage and the upper limit of loans. The results have been very promising, as there is currently a 100 per cent loan repayment rate. Most of the MSME loan recipients have made small investments in rural tourism, wood processing, milk processing, and construction (often home improvements)6. To promote financial deepening in the rural financial market of Romania, the behaviour of banks (especially in terms of the processing of savings and/ or credit contracts) and the formal financial intermediaries has to change. In the future, new and innovative financial products such as leasing, asset backed securities, warehouse receipt programmes or a guarantee fund need to be considered for introduction into the market (see Heidhues, Davis and Schrieder, 1998). Priorities for the formal financial sector should include deposit mobilisation among the MSMEs and lowering their credit access barriers. This would also require the formal financial sector to find ways of lowering transaction costs; Group saving and credit activities like CED may provide important lessons on how to limit these costs through group screening and monitoring. The formal financial sector could also adapt or complement the CED schemes and legal association shareholding patterns of capital mobilisation and risk sharing. Policy makers and formal financial institutions could contribute to improving the financial access of the (usually poor) MSMEs by recognizing and building on the role of the informal sector in providing these services. In Romania, most subsidised interventions have proved inefficient and wasteful, however experience from other countries shows that greater success (in terms of rural income growth) is achieved where credit is combined with non-financial business development activities [Yaron, 1994]. 3.2. Enterprise Savings Status The enterprise savings status is also interesting as the value of savings in our sample increased during the period Autumn 1999 (20 respondents) to Autumn 2000 (27 respondents) from ROL 2,245 (million) to ROL 5,554 (million) in current prices. Most of the latter figure is concentrated in the interest rate range of 35 per cent (see Figure 5). Average savings range between ROL 30 (million) in current prices for firms based in Isalnita to ROL 445 (million) in Voila and Feldioara. Interest rates on savings are substantially lower than those on loans, and fell sharply during the period 1999 to 2000 (Figure 6).

25
Annual interest rate 2000 (%)
4433384537423240343935
Savi
ngs
fall
2000
(mill.
RO
L)3000
2000
1000
0
Percent50
25
0200260315393
555
1145
2420
Figure 5 - Volume of savings grouped by Interest rate, fall 2000
Trezorerie
BRD Dabuleni
BIR; Trezorerie
BCRBASA Brasov
Banca Agricola; Trez
Banca Agricola
Banc Post
Mea
n %
60
50
40
30
20
Interest rate %
1999
Interest rate %
2000

26
Figure 6 - Mean interest rate for savings by banks, 1999-2000

27
4. Human Resources and Employment in the Rural Non-Farm Economy An important factor for rural poverty alleviation is the mobilisation of non-farm activities; in this way jobs are provided for people who either do not own land or are subsistence farmers on plots too small to provide a sustainable livelihood. Key factors which have constrained the Romanian rural poor from diversifying their livelihoods into micro-enterprise highlight: (i) a lack of capital to start a business: “I have ideas. But ideas are fed from the pocket” – a poor farmer in Motatei-Gara; (ii) corruption: people often feel they cannot find jobs without connections, and some of our respondents noted the importance of family connections and informal networks of kinship and influence (especially among former SOE managers) in securing jobs both locally and abroad (see case study 2 in Annex 1); and (iii) a lack of informational infrastructure. Below we report the results of our survey identifying the characteristics of those members of the rural community in Brasov and Dolj that have managed to establish a non-farm MSME. 4.1. Rural Non-Farm Enterprise Owner/ managers all of the surveyed enterprises (apart from the hospital) were operated by owners or joint owners. In most cases the owner also directly contributes their labour (often with other family members) in the enterprise and on-farm. Most of our respondents (52) grew-up in the area the business is located and 86% of them started their own business (64% of these firms are located at home). 40% of the surveyed owner/ managers have dependent children, under the age of 19 years. Most of the surveyed MSMEs are pluriactive households where there is no difference between rural non-farm activities to meet their subsistence needs through employment and producing for the market (see case study 1 in Annex 1). As previously noted, many of the registered rural non-farm firms are commercially oriented and operate in a competitive market (see case study 2 in Annex 1). The average age of the surveyed MSME owner/ manager is 44 years; ranging between 24 to 64 years. The survey sample is comprised of 60 males and 14 females. Most interviewees had graduated from high (secondary) school (39.2 per cent), 32.4 per cent were university graduates, and 9.5 per cent were engineers - graduates of the Polytechnic Faculty. Only 16.2 per cent of the sample graduated from vocational school, while 2.7 per cent graduated from primary school (Table 18).
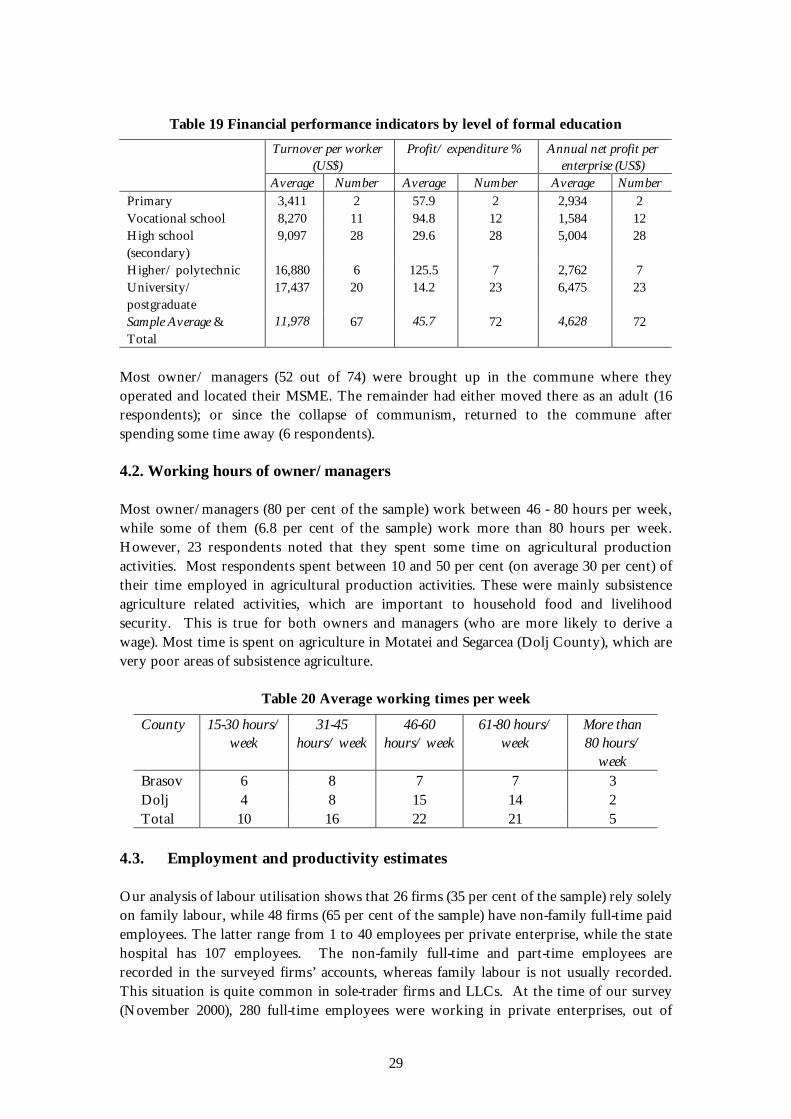
Table 18 Level of formal education Number % Primary 2 2.7 Vocational school 12 16.2 High school (secondary) 29 39.2 Higher/ polytechnic 7 9.5 University/ postgraduate 24 32.4
It could be expected that the stage of formal education of the effective enterprise owner/ manager has an important impact upon labour productivity and the value of annual net profit (see Annex 2). The turnover per full-time standard worker is around three times higher in those firms where the manager graduated from university, as compared to firms where owner/ managers only attended primary or vocational schools (Table 19.). Of

28
course, the level of education may have important social capital features, which enable better access to local political and financial resources. Similarly, the level of education may also have an important impact on the type of non-farm enterprise developed; some require greater levels of technical skill than others.
29
Table 19 Financial performance indicators by level of formal education
Turnover per worker (US$)
Profit/ expenditure % Annual net profit per enterprise (US$)
Average Number Average Number Average Number Primary 3,411 2 57.9 2 2,934 2 Vocational school 8,270 11 94.8 12 1,584 12 High school (secondary)
9,097 28 29.6 28 5,004 28
Higher/ polytechnic 16,880 6 125.5 7 2,762 7 University/ postgraduate
17,437 20 14.2 23 6,475 23
Sample Average & Total
11,978 67 45.7 72 4,628 72
Most owner/ managers (52 out of 74) were brought up in the commune where they operated and located their MSME. The remainder had either moved there as an adult (16 respondents); or since the collapse of communism, returned to the commune after spending some time away (6 respondents). 4.2. Working hours of owner/ managers Most owner/managers (80 per cent of the sample) work between 46 - 80 hours per week, while some of them (6.8 per cent of the sample) work more than 80 hours per week. However, 23 respondents noted that they spent some time on agricultural production activities. Most respondents spent between 10 and 50 per cent (on average 30 per cent) of their time employed in agricultural production activities. These were mainly subsistence agriculture related activities, which are important to household food and livelihood security. This is true for both owners and managers (who are more likely to derive a wage). Most time is spent on agriculture in Motatei and Segarcea (Dolj County), which are very poor areas of subsistence agriculture.
Table 20 Average working times per week
County 15-30 hours/ week
31-45 hours/ week
46-60 hours/ week
61-80 hours/ week
More than 80 hours/
week Brasov 6 8 7 7 3 Dolj 4 8 15 14 2 Total 10 16 22 21 5
4.3. Employment and productivity estimates Our analysis of labour utilisation shows that 26 firms (35 per cent of the sample) rely solely on family labour, while 48 firms (65 per cent of the sample) have non-family full-time paid employees. The latter range from 1 to 40 employees per private enterprise, while the state hospital has 107 employees. The non-family full-time and part-time employees are recorded in the surveyed firms’ accounts, whereas family labour is not usually recorded. This situation is quite common in sole-trader firms and LLCs. At the time of our survey (November 2000), 280 full-time employees were working in private enterprises, out of

30
which 247 were non-family workers and 33 were family workers. Besides full-time employees, there are part-time employees and certain non-paid family members who are working part-time (students, pupils during their summer holiday etc.). Approximately 410 people in our sample are involved to a greater or lesser extent in MSMEs. The co-operatives and associations only employ full-time workers. This is also the case for joint-stock companies. For a comparative analysis of different enterprise groups and firm labour productivity estimates, we transformed all employee categories into full-time standard workers, applying 0.5 transformation coefficients for part-time workers and 0.1 - 0.2 for occasional/seasonal workers. These estimates show that the average number of full-time standard workers is 4.6 per private enterprise, with extreme values of 0.5 and 40 (see Table 21).
Table 21 Full time workers per enterprise by county and communes
County Commune Average Feldioara 5.7 Brasov Moeciu 4.1 Voila 3.3 Sub-total 4.4 Dabuleni 3.3 Isalnita 11.6 Dolj Motatei 1.5 Segarcea 4.1 Sub-total 4.7 Sample Average 4.6
We found that particular localities (Isalnita, Segarcea, Dabuleni and Feldioara) have labour resources with a high degree of professional potential, which could contribute to economic development, if they had the necessary financial resources and a favourable business environment. As the current economic recession deepens, the number of Romanian emigrants to rural towns and tourism centres from the mountain regions is increasing (see Davis and Gaburici Report 6, 2001). 80 per cent of the surveyed firms have between 0.5 and 10 full-time standard workers. The statistics by enterprise group is revealed in Table 22.
Table 22 Full-time Standard employees by type of enterprise
Full-time employees Average Total
Sole trader, with or w/o employees 1.3 13.0 LLC 3.8 193.5 JSC 5.0 15.0 Co-operative/ association 14.0 28.0 Other private enterprises 12.3 86.0 Total Sample 4.6 335.5
By comparing the type of enterprise to the number of full-time standard workers, we can estimate employee productivity levels. We found that labour productivity was highest in

31
the joint-stock company group, and lowest in the co-operatives/associations (see Figure 7). Turnover per full-time standard worker by field of activity is highest in trading, agricultural product, and wood processing activities (see Figure 8).
19,321
12,389
12,137
7,302
5,686
4,248
- 5,000 10,000 15,000 20,000 25,000
Joint Stock Company
Limited Liability Company
Sole trader
Other private enterprise
Cooperative/ assoc.
State hospital
Turnover (USD) per worker
Figure 7 Turnover per workers by type of enterprise
5,506
6,216
6,951
7,222
7,479
12,492
12,879
13,096
-1,000 1,000 3,000 5,000 7,000 9,00011,000 13,000 15,000
Repair service
Telecommunication
Other services
Hotels, Restauran
Bakery
Wood processing
Agr. prod. processin
Trade
Mean turnover (USD) per worker
Figure 8 Turnover (US$) per full-time standard worker by field of activity in 1999
32
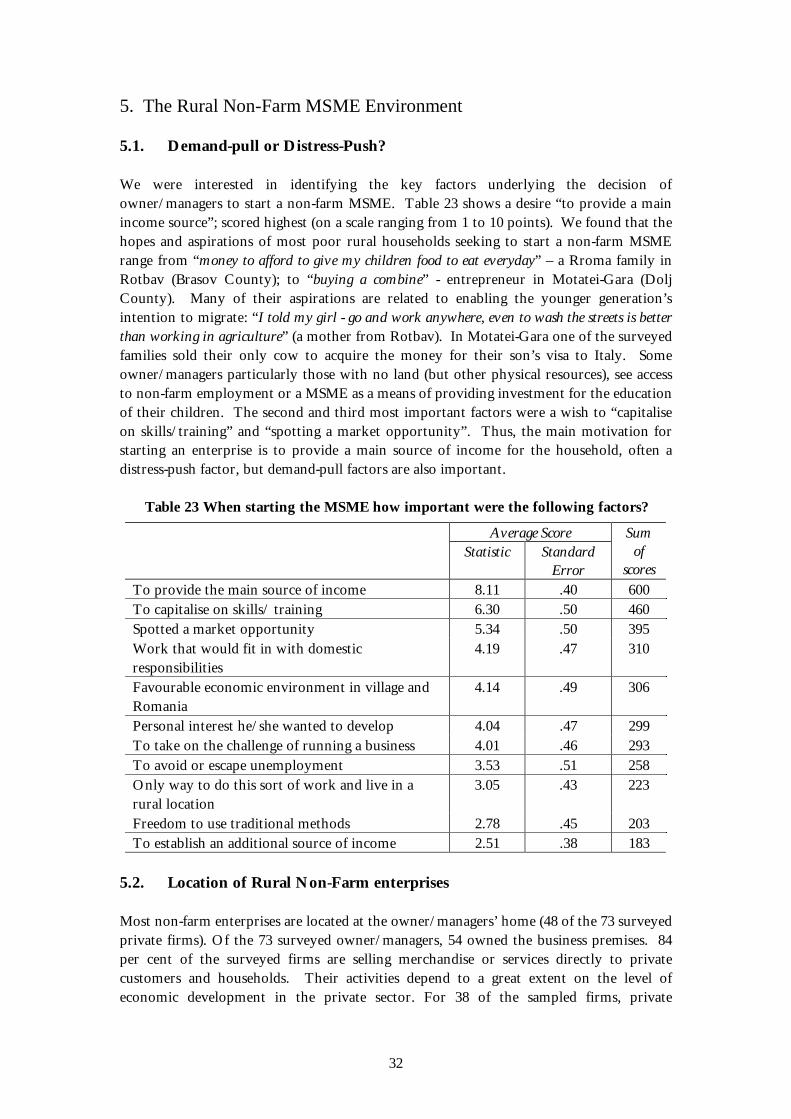
5. The Rural Non-Farm MSME Environment 5.1. Demand-pull or Distress-Push? We were interested in identifying the key factors underlying the decision of owner/managers to start a non-farm MSME. Table 23 shows a desire “to provide a main income source”; scored highest (on a scale ranging from 1 to 10 points). We found that the hopes and aspirations of most poor rural households seeking to start a non-farm MSME range from “money to afford to give my children food to eat everyday” – a Rroma family in Rotbav (Brasov County); to “buying a combine” - entrepreneur in Motatei-Gara (Dolj County). Many of their aspirations are related to enabling the younger generation’s intention to migrate: “I told my girl - go and work anywhere, even to wash the streets is better than working in agriculture” (a mother from Rotbav). In Motatei-Gara one of the surveyed families sold their only cow to acquire the money for their son’s visa to Italy. Some owner/managers particularly those with no land (but other physical resources), see access to non-farm employment or a MSME as a means of providing investment for the education of their children. The second and third most important factors were a wish to “capitalise on skills/training” and “spotting a market opportunity”. Thus, the main motivation for starting an enterprise is to provide a main source of income for the household, often a distress-push factor, but demand-pull factors are also important.
Table 23 When starting the MSME how important were the following factors?
Average Score Statistic Standard
Error
Sum of
scores To provide the main source of income 8.11 .40 600 To capitalise on skills/ training 6.30 .50 460 Spotted a market opportunity 5.34 .50 395 Work that would fit in with domestic responsibilities
4.19 .47 310
Favourable economic environment in village and Romania
4.14 .49 306
Personal interest he/she wanted to develop 4.04 .47 299 To take on the challenge of running a business 4.01 .46 293 To avoid or escape unemployment 3.53 .51 258 Only way to do this sort of work and live in a rural location
3.05 .43 223
Freedom to use traditional methods 2.78 .45 203 To establish an additional source of income 2.51 .38 183
5.2. Location of Rural Non-Farm enterprises Most non-farm enterprises are located at the owner/managers’ home (48 of the 73 surveyed private firms). Of the 73 surveyed owner/managers, 54 owned the business premises. 84 per cent of the surveyed firms are selling merchandise or services directly to private customers and households. Their activities depend to a great extent on the level of economic development in the private sector. For 38 of the sampled firms, private

33
customers and rural households account for 100 per cent of their sales. For 25 firms, private customers and households account for between 10 – 90 per cent of the sales value. Only 8 firms reported public sector customers accounting for between 2 – 80 per cent of the sales value. In 92 per cent of the cases, customers were located in the same commune as the enterprise, or a neighbouring locality within 50 km. Most of the sample (63 out of 74) sourced enterprise supplies from local areas (within 60 km). These suppliers provided between 10 and 100 per cent of their supply needs. 22 firms used regional suppliers, and 13 were supplied by entities outside their region. Only 2 firms import commodities from other countries (Table 24).
Table 24 Location of MSME suppliers.
Local suppliers
Regional suppliers
National suppliers
Outside Romania to
CEEC
Outside Romania to others
Brasov 29 11 5 0 1 Dolj 34 11 8 1 0 Total 63 22 13 1 1
5.3. Distances to key commune institutions For MSMEs the distance to key institutions, suppliers and customers may have a significant impact on the firm’s development. Poor infrastructure and telecommunications can retard both MSME and village level economic development opportunities. The great distances to key institutions and markets may be an obstacle to the development of competition and/or collaboration between rural enterprises (see Table 25). We aimed to address this issue in our MSME survey and found that 70 firms were an average distance of 9 km from their main competitor. Those firms located in Motatei (14.2 km), Dabuleni, (12.2 km) Segarcea (11.5 km) and Voila (10 km) were above the average distance from their nearest competitor. Moeciu (2km) was well below the average.
Table 25 Location of the business – Distances km
Maximum Mean Standard deviation
Distance to the main competitor (km) 75.0 9.1 15.1 Distance to general supplies (km) 300.0 59.9 63.9 Distance to bank (km) 60.0 16.1 14.4 Distance to post office (km) 30.0 2.0 4.5 Distance to training for employees (km)
75.0 21.2 15.8
With the exception of retail and direct trading companies (which are the most frequent in villages), other firms are often in a monopoly position (mainly agricultural and repair service providers). Most of the surveyed firms are located within 0.5 - 80 km of a Chamber of Commerce and Industry where they were registered when they were established. Access to consulting services differs according to enterprise activity and the kind of consultancy required (e.g., accounting, tax advice, computing etc.). 5.4. Business support institutions for MSMEs

34
Since 1990, non-farm MSMEs have needed consultancy in accounting and finance. Most owner/managers require training and assistance in MSME accounts and financial management. 43 firms in our sample sought specialised accounting and finance consulting services. In many cases the firm’s owner/ managers used consultants/specialists among their extended family or friends for advice in different fields of MSME activity (Table 26).

35
Table 26 Since 1990, whom have you approached for business advice? (Frequency, N)
County Brasov Dolj Total
Accountant/ financial consultant 14 29 43 Family & friends with specialist knowledge
12 14 26
Chamber of commerce 12 8 20 Local council 9 11 20 Bank manager 5 9 14 Other 2 2 4 Rural development agency 2 1 3 Trade/ professional organisation 2 1 3 Business consultant 1 1 2 County council - 2 2 Business centre 1 - 1 Extension office - 1 1
5.5. Business support areas considered as useful in the past/ present There is a great difference between the knowledge and skills deemed necessary in the past and those currently required. In our survey we asked respondents to suggest any business support and/ or training needs which they found useful in the past, and those which would currently be of use to them. The results of this exercise are presented in Table 27 below.
Table 27 Business support areas thought as useful in past/ present (frequency, N)
Frequency (N)
Table Per cent
Past 16 34.8% Business strategy Present 30 65.2% Past 17 50.0% Negotiation skills Present 17 50.0% Past 26 53.1% Employing staff Present 23 46.9% Past 13 46.4% Staff training/ development Present 15 53.6% Past 17 42.5% Management organisation Present 23 57.5% Past 4 8.5% Advertising Present 43 91.5% Past 8 17.0% Marketing Present 39 83.0% Past 8 17.8% Market research Present 37 82.2% Past 5 17.9% Identifying new market
opportunity Present 23 82.1%

36
Past 10 21.7% Public relations Present 36 78.3% Past 9 17.3% Financial management/ taxation Present 43 82.7% Past 5 11.9% Developing new products/ services Present 37 88.1% Past 1 2.9% Computing Present 33 97.1%
New technology Present 37 100.0% Table 27 shows that in the past most of the business support areas were useful for very few owners/managers. For example, only one interviewed person mentioned computing for the past, while 33 respondents noted the same area of business support or training for the present. Our survey identified the most useful areas for future business support and training as being: advertising and financial management (frequency of 43), marketing, market research, public relations, developing new products and new technology. 5.5. Factors influencing the village business environment We also wanted to know how the entrepreneurs evaluated the importance, impact and quality of local factors (institutions, infrastructure and public utility services) on their non-farm MSME. Most of the sample (84.9 per cent) considered “state financial protection” as being the most significant constraining local factor. Similarly, the “supply of affordable housing” is a local constraint that mainly affects young rural people who need new houses (see Table 28).
Table 28 Assessment of local factors (% of responses)
Quality of Local factors Good % Medium % Low %
Road network 41.7 34.7 23.6 Railway connection 54.2 19.4 26.4 Supply of housing 2.8 19.4 77.8 Supply of skilled/ qualified labour 21.1 33.8 45.1 Supply of unskilled labour 58.9 34.2 6.8 Labour motivation 40.8 45.1 14.1 Costs/ charges for communal services 25.4 49.3 25.4 State financial protection 2.7 12.3 84.9 High level of salaries 8.2 38.4 53.4 High electricity costs 42.5 31.5 26.0 Access to water supply 35.6 26.0 38.4 Access to power supply 80.8 17.8 1.4 Access to telecommunications 69.9 20.5 9.6
All of the surveyed communes have some access to electricity; 80 per cent of respondents have good “access to the power supply”. Those who rated access to the power supply as medium (17.8 per cent) referred to the poor quality of service, and disruptions in supply. However, in the poorest communes (e.g. Motatei, Voila), there are villages comprised of

37
isolated groups of houses located at the edge of a locality, without access to electricity. For many of the surveyed households, the cost of electricity comprises a significant proportion of household income, thus being a constraint on the economic development of the poorest rural areas and MSMEs located in these villages. Although most of the sample has access to a water source, they do not have piped running water in their homes. In most cases drinking water is supplied from household wells or from local public (village) pumps. Some firms fund and construct their own piped water installation, however these incur much higher construction costs than municipal water supply systems providing access to a community. These are the main reasons for access to water supply receiving a relatively low rating from our survey respondents. Both the road network and connections to the railway are of better quality in Brasov than Dolj. Feldioara and Voila communes (in Brasov County) have a local railway station, and Moeciu has a direct-asphalted motorway connection to Brasov city (county capital). A bus passes at regular one-hour intervals through Moeciu to Brasov City. In Dolj County Dabuleni and Motatei communes have no local railway station. For Dabuleni, the nearest railway station is 30 km away; for Motatei it is 60 km. The roads connecting Motatei to other villages and towns are not of good quality either. Segarcea has better roads, while Isalnita has the advantage of being located near the county capital city of Craiova, to which it is connected by a tramway and an asphalted road. In the communes of Voila, Moeciu, Motatei and even in the small agricultural town of Segarcea the majority of the workforce is unskilled (this is also the case in 5 of the 7 surveyed communes). The situation is better in Feldioara where there is a uranium plant, known as Plant R, which has a lot of highly skilled workers. In addition, the relatively short distance from Feldioara to Brasov city (12 km), which is an industrial city, has made access to jobs in factories and plants there for Feldioara’s citizens an important source of non-farm employment. Since 1994 with a deepening economic recession, many state factories have closed or downsized leading to a reduction of jobs in local industries. Thus, many of those workers from Feldioara previously employed in Brasov city have returned to their rural homesteads. A lack of access to business start-up support, microfinance and rural finance facilities has constrained the potential contribution to the rural non-farm economy that these former workers (from a wide age range) could make to Feldioara. We also found that Isalnita commune near the city of Craiova in Dolj-county is in a similar situation. 5.7. Factors influencing the general level of commune development There is no doubt that the general level of development in villages impacts MSME in the non-farm rural economy. In order to identify the key factors for the social and economic development of rural communities, we asked respondents to rate on a scale of 1 - 10 (ten being the most critical) the importance of the 12 factors listed below. Table 29 Importance of factors for community development – scores (% of responses)
Least important
Most important
Infrastructure development 1.4 74

38
Health protection - 66 Central, local budget support 1.4 56 Local development projects for the community - 52 Cooperation with foreign organisations 2.7 49 Tourism promotion 1.4 47 Intensive development of agriculture 1.4 42 Cultural institutions - 42 Own efforts of the community - 42 Reforms, privatisation 11 40 Non-agricultural development 1.4 36 Local autonomy 1.4 36
74 per cent of respondents rated “Infrastructure development” as being the most important factor for community development followed by “Improvements in medical assistance and health protection” (see Table 29). 5.8. Assessment of Legal Safety Legislation covering competition, contracts, property rights, restitution and regulatory reform has developed at a slow pace in Romania, such that most respondents (55.4 per cent of the sample) considered existing legislation covering competition, contracts and property rights to be ineffective and poor. Agricultural land privatisation resulted in numerous legal cases to re-establish expropriated property (during the communist era) rights. The cost of undertaking legal action is very high in Romania putting these opportunities beyond the reach of most households and some MSMEs. The creation of an institution, which enables legal aid to the poor or as in the USA a Public Defender office, would help address this problem.

39
6. Future Prospects for Micro Enterprise Development In our survey, the main factors limiting current production are the lack of working capital and investment funds. In addition, respondents have noted the lack of managerial expertise or know-how, an unstable market and legal environment, the lack of financial support from the state to support MSME start-ups, the restrictive provisions of the Land Law of 1991 regarding land use and rental (until 1997), similarly the requirement of only being able to use land for agricultural purposes (until 1997) which restricted the development of a land market for rent, sale or collateral. Also, delays in the dissemination of property certificates for landowners made it difficult for them to receive credit (as they could not provide evidence of assets for collateral) to finance rural non-farm enterprises. In summary, the respondents highlighted the following factors restricting the successful development of their MSME: 1. A lack of investment and working capital, which inhibits business development (47
out of 69 respondents). 2. A lack of space or affordable real estate for business premises and equipment
expansion 3. Need to hire more staff, particularly skilled workers Table 30 shows that in the short-term (over the next two years) the main aim of most firms is to remain financially viable and establish the business (get onto a secure footing, mainly firms with above average profitability) or maintain its current position (i.e. survive, mainly those firms with below average profitability). As regards the sample’s future outlook on business development over the next 10 years, the views of our respondents may be classified into two main categories (with the balance expressing no clear view): 1. Those who were not interested in expanding the business (13 per cent of sample). 2. Those who expect their business to expand in the future (60 per cent of sample). The respondents’ are mainly optimistic about future business development. 45 of the 74 respondents expect to significantly expand their business over the next 10 years. This optimism is more prevalent in Dolj County (81 per cent of the county sample) than in Brasov (32 per cent). The smaller agricultural land area per rural person in Dolj compared to Brasov County is a distress-push factor encouraging non-farm business expansion as an absolute necessity for income diversification and to improve living standards. We estimated a series of multinomial regression models using different categories of employment as the dependent variable and amongst others, population density and the proportion of non-farm employed in each commune as explanatory variables. We found that in more densely populated areas there is greater demand for non-farm jobs (activities) or where no alternative exists people seek agricultural incomes. Furthermore, where high levels of commune level non-farm employment exist, the greater the likelihood that an individual will participate in non-farm activities than agriculture (we explore this in greater detail in Davis and Gaburici, Report 6).

40
Table 30 Plans for the next 2 years – Group Net Profit in 1999
Annual Net Profit 1999 (US$) Count Mean
Maintain current position 25 2,752.8 Get onto a secure footing 28 6,815.1 Reduce the scale of activities 1 4,174 Substantial expansion 17 4,941.3 Sell the business 1 326.1 Stop trading 2 -521.7 Total 74 4,717.1
67 per cent of the sample felt they could increase their sales in the future, while those who felt that they did not have a sufficiently wide customer base and thus growth potential comprised 33 per cent of the sample. In the future, for some MSMEs it should be possible to develop on the basis of being sub-contractors to larger, established firms, or on the basis of getting second hand capital from such firms. However, to date there have been very few of these business ventures outside of the agri-processing sector in rural areas. An additional factor that may constrain the potential for developing these types of business ventures is the prevalence of (and potential for) inter-enterprise arrears7. The provision of public services and infrastructure to rural areas is a key facet of attracting investment and promoting rural MSME development. Population centres in rural areas can constitute key growth points. Enterprise support measures may include business incubators, phased financial assistance to start-ups, advisory and networking centres, and training and consultancy services for MSMEs. The needs of MSMEs could also receive priority in publicly funded agricultural research and extension.

41
Conclusions In those rural areas of Romania dominated by poor, subsistence based farming, non-farm enterprise development will to some extent depend on restructuring the small-farm sector, increasing agricultural incomes and creating a demand for inputs and services. This will require public sector involvement, support and incentives. Incentives could encourage the development of private associations and co-operatives to begin to add value to farm produce and bring agriculture-industry-trade multiplier effects into the rural sector (Chirca and Tesliuc, 1999). A strategy for non-farm MSME development should include vocational training in information and agricultural technology, processing and marketing and access to such training for the rural part-time employed as well as the unemployed. Similarly, it is important that the government initiates job-creation schemes tied to the development of rural infrastructure, since this would not only provide an immediate social benefit, but would help reduce the constraints imposed by poor infrastructure on rural development. A further constraint to MSME development in the transition economies is the lack of knowledge or experience in starting a new enterprise, together with the lack of market experience. In rural areas like Dolj, where agricultural productivity among family associations is comparatively high but rural unemployment is also high (see Table 2), there may be more scope to promote non-farm-related enterprises. These enterprises will not necessarily be reliant on the purchasing power of the rural community. However they will be based on particular endowments of the rural areas in the form of cheap labour, low-cost housing, rural amenities and seek to capture investment and spending from outside the area. In our survey, tourism and forest-based activities such as wood processing and furniture manufacturing have the potential to develop along these lines. It is in these situations where some of the rural development experiences and lessons from developed countries outlined in Davis (2001) may be relevant. As previously noted, the surveyed MSMEs have not developed extensive supply and distribution networks. The former state enterprises had their own networks, which either do not now exist or, if they do, they do not match the requirements of current MSMEs. Few of our respondents, see Annex 2 have highlighted the need for regional co-operation and networking, which are not seen as a priority concern among the majority of MSME owner/ managers we interviewed. In Romania, insufficient infrastructure, such as roads, communications and markets, and widening gaps in relative farm/non-farm prices represent important barriers to MSME establishment and development. Main characteristics of the rural non-farm enterprise sector
• Private non-farm MSMEs began operating in the Romanian countryside in 1990; this is expanding and becoming more diverse. 57 per cent of surveyed private firms were established in the first 5 years following the collapse of communism (1990 - 1994) with the remainder during 1995 - 2000.
• The most common legal form of private rural enterprise is the Limited Liability Company (69.9 per cent of the sample). At the same time, certain agricultural associations also began performing non-farm activities.
42
• The field of activity for MSMEs differs from one region to another according to local natural, economic and social conditions. The entrepreneurs’ own financial resources at the foundation of the company play a significant role in entering a particular type of business activity. We identified 11 different non-farm MSME fields of activity. The most numerous are the trade/ service companies (34 per cent of the sample). The entrepreneurs’ preference for this field was strongest in the early years of transition.
• Rural non-farm MSMEs may be expected to emerge where there are dispersed raw materials, small markets or high transport costs. In our survey, MSME development also occurred where no diseconomies of small-scale or of labour intensive production processes exist. The wood processing and other forest based activities are a prevalent source of non-farm employment and income because in relatively remote rural areas of Romania forest based resources are widely available and often state-owned, providing cheap or free access to these resources. Also, wood processing and forest-based activities such as wood-cutting can provide the basis for production of a wide range of low cost products such as fuel, building materials, packaging, furniture, food etc., which are important components of low-income rural household consumption.
• Most of the surveyed MSME rural non-farm products, goods and services are confined to local markets. Only two MSMEs exported products within Romania beyond their home county. If we consider the factors conditioning access to RNF enterprise the demand for local services is limited in sparsely populated rural areas and where incomes are low. For tradables, access to markets will be crucial.
• The lack of capital and limited access to credit has a negative impact upon the development of those non-farm activities that require major capital investment for machinery and equipment procurement. Thus, the number of enterprises for agricultural produce processing and services for agriculture is still small, and this area of business activity needs further investment.
• The typical size of Romanian non-farm rural firms is small. By transforming different worker categories into Standard Full-time Workers, we estimated the total number of employees. The average number of standard full-time workers in our survey is 4.6 per enterprise, with a range of between 0.5 and 40 full-time standard workers. At the end of 1999, their share capital ranged from US$65 to US$4,370 per enterprise.
• Most MSME labour comes from the owner/manager’s family, although depending on the firm’s turnover non-family members are hired. 65 per cent of firms from our sample have a full-time employee from outside the family. The enterprises from the LLC and Sole-trader groups mainly utilise part-time family or non-family labour. Only certain family members (mainly wives and children) contribute part-time or occasional un-paid labour.
• Where firms have only one owner they are usually also the manager. In joint-stock companies (which have several owners), the effective enterprise manager is also one of the joint owners, while the main decisions are taken collectively. We found that 79 per cent of owner/ managers work between 31 - 80 hours per week, while others (6.8 per cent of the sample) work more than 80 hours. The average age of the owner/ manager is 44 years.
• For some firms we found a decline in real terms of both turnover and net profit per enterprise during the period 1998 - 1999. However, 88 per cent of the firms in our sample reported a net profit in 1999/ 2000.

43
Main factors influencing the economic activity of non-farm rural enterprises
On the basis of our statistical analysis and regression model, the following main factors were identified as being an important influence on the economic activity of non-farm rural MSMEs: 1. MSME relationships with the financial market. This factor has a direct impact upon
invested capital and the annual expenditure of the MSME. Our statistical analysis shows that the firms which received credit in the last 5 years made a net profit higher than those without credit. Access to capital allowed the firms to invest more capital in the MSME, thus increasing their volume of business. There is also a correlation between profit performance in 1999 and expenditure from the previous year (see Annex 2).
2. The savings deposited in banks increased during the period 1999 - 2000, however not all depositors have received the interest promised by the banks. Those who deposited their savings at the National Investment Fund are at present (unsuccessfully) struggling to withdraw their deposits, as this fund recently went bankrupt.
3. We also found some correlation between the managers’ level of education and labour productivity. The value of turnover per Full-time Standard Worker is 3 times higher in the MSMEs where the manager is a university graduate, as compared to firms where the managers graduated from a primary or vocational school.
4. The general level of economic development where the enterprise is located may affect the prospects and financial performance of a firm, but to a lesser extent than internal factors such as access to capital, annual expenditure, the legal form of the enterprise, time spent in agriculture and the level of management education, skills and experience.
References “Adevarul economic” no. 12, 21.03.2001. Romania. Bleahu, A. (2001) Household-level involvement in Romanian non-farm rural economy
report, April 2001, (unpublished mimeo). Cartwright, A. L. (2001) The return of the peasant: Land reform in post-Communist Romania.
Published by Ashgate, UK. Chirca C and Tesliuc E (eds) (1999) From Rural Poverty to Rural Development, World Bank
and National Commission for Statistics, Romania.
Christensen G and Lacroix R (1997) Competitiveness and Employment: A Framework for Rural Development in Poland World Bank Discussion Paper No. 383, Washington DC, World Bank.
Davis J.R.. (2001) Conceptual Issues in Analysing the Rural Non-Farm Economy in Transition Economies (unpublished mimeo), NRI-CEECIS Report 2.
Davis, J.R. and Janowski M. (2001) Approach and methods used for the fieldwork conducted in Romania (unpublished mimeo), NRI-CEECIS Report 3.

44
Davis J.R., and Gaburici A. (2001) Economic Activity in the Romanian Rural Non-farm Economy: A case study of two communities in Dolj and Brasov judete, Report 6 (in preparation).
Davis J.R., and Gaburici A. (1999) The economic activity of private farms in Romania during transition Europe-Asia Studies Vol. 51 No. 5 pp 843-869.
Florian V and Rusu M (2000) Concepts, policies, programs and institutions of rural development in Romania. Unpublished mimeo.
Greif F (1997) Off-farm income sources and uses in transition economies. Unpublished mimeo. Federal Institute of Agricultural Economics, Vienna and FAO/REU, Rome.
Hare, P. G. (2001) Institutional Change and economic performance in the transition Economies (unpublished mimeo, May 2001).
Heidhues, F., Davis, J.R., & Schrieder G. (1998) Agricultural transformation and implications for designing rural financial policies in Romania, the European Review of Agricultural Economics, vol. 25, Issue No. 3, 1998.
Yaron, J., (1994) What makes rural finance institutions successful? The World Bank Research Observer, vol. 9, no. 1 (January 1994), pp. 49-70.

45
Annex 1. Case study 1. Sunflower oil micro-enterprise, Motatei-Gara The household/ firm The household members are: husband (56), wife (46), three sons (24, 20, 14). The parents worked as Agricultural Production Cooperative (APC8) members before 1990. The household is comprised of two houses: an old 2-room inherited house made of “chirpici” and a new house made in 1975 of brick (4 rooms). The houses are heated with wood, bought from a forest or from the train station (where sometimes they exchange chickens for wood with people from Maramures region). They also own two cows and 30 chickens. They kill one cow per annum for self-consumption providing meat for the year. They also make cheese for household consumption. They have no pastoral land and graze cows on the roadside. They received a 3 ha and 1 ha plots after de-collectivisation (without a formal title), an additional 1 ha of land was purchased for ROL 2 million. They own a tractor, the household members do the manual work, and neither hire labour or work other people’s land with it. Non-farm Activities They produce sunflowers and corn. They have no money for fertilizer but have planted grapevines and make grape juice. Most household income is spent on agriculture. They save very little because the spare parts for the tractor, the fuel and seed are expensive and farmgate prices are low. Savings are being retained for the youngest son’s training (to become a mechanic), or for unforeseen circumstances (health problems). Every spring they sell the sunflower to an oil factory, and after processing the waste product to locals as livestock feed, and/ or exchange sunflower oil for sunflower seeds, cheese, or honey. They own the only sunflower press for making oil in Motatei-Gara; so all the village uses their press. From 100 kg of sunflower they make 28 litres of oil from which they give 6 litres to the owner of the sunflower (the press needs a lot of electricity and they retain some of the output to pay the bill). They only process 6 litres of oil per customer; the remainder is stored and sold in the spring to the local oil factory. The eldest son works in Italy as a driver. The family had to sell a cow to cover visa and travel expenses. In a years time he will receive Italian citizenship. His younger brother would also like to emigrate. The family was able to extend their non-farm household activities after the son from Italy started to send money home (they bought the tractor, and the sunflower press). Now they use the remittance money to repair the tractor, to invest in agriculture, and some is saved. 70% of the household’s non-farm income is spent on agricultural production, whilst only 20% of earnings from the sale of agricultural produce are invested in non-agricultural activities. Other non-farm activities in the area are hard to develop because most of the populace is poor (i.e. there is no market for any product or services). For more information see Bleahu (2001).
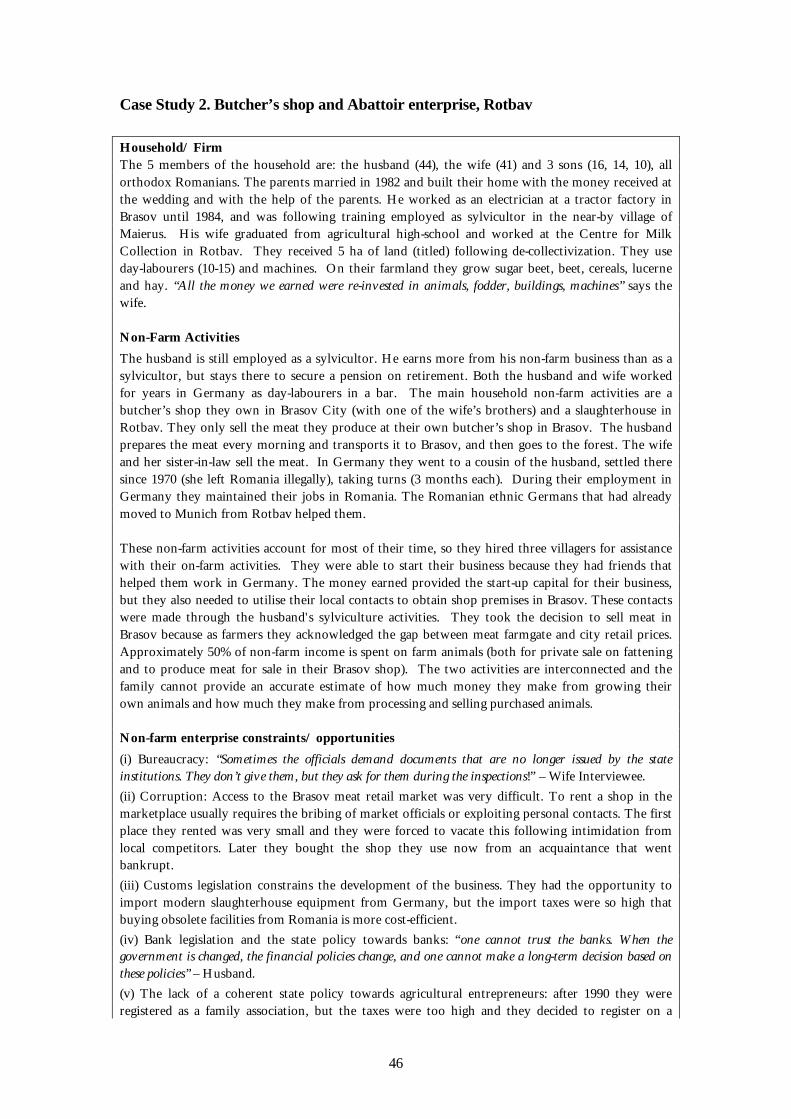
46
Case Study 2. Butcher’s shop and Abattoir enterprise, Rotbav Household/ Firm The 5 members of the household are: the husband (44), the wife (41) and 3 sons (16, 14, 10), all orthodox Romanians. The parents married in 1982 and built their home with the money received at the wedding and with the help of the parents. He worked as an electrician at a tractor factory in Brasov until 1984, and was following training employed as sylvicultor in the near-by village of Maierus. His wife graduated from agricultural high-school and worked at the Centre for Milk Collection in Rotbav. They received 5 ha of land (titled) following de-collectivization. They use day-labourers (10-15) and machines. On their farmland they grow sugar beet, beet, cereals, lucerne and hay. “All the money we earned were re-invested in animals, fodder, buildings, machines” says the wife. Non-Farm Activities
The husband is still employed as a sylvicultor. He earns more from his non-farm business than as a sylvicultor, but stays there to secure a pension on retirement. Both the husband and wife worked for years in Germany as day-labourers in a bar. The main household non-farm activities are a butcher’s shop they own in Brasov City (with one of the wife’s brothers) and a slaughterhouse in Rotbav. They only sell the meat they produce at their own butcher’s shop in Brasov. The husband prepares the meat every morning and transports it to Brasov, and then goes to the forest. The wife and her sister-in-law sell the meat. In Germany they went to a cousin of the husband, settled there since 1970 (she left Romania illegally), taking turns (3 months each). During their employment in Germany they maintained their jobs in Romania. The Romanian ethnic Germans that had already moved to Munich from Rotbav helped them. These non-farm activities account for most of their time, so they hired three villagers for assistance with their on-farm activities. They were able to start their business because they had friends that helped them work in Germany. The money earned provided the start-up capital for their business, but they also needed to utilise their local contacts to obtain shop premises in Brasov. These contacts were made through the husband's sylviculture activities. They took the decision to sell meat in Brasov because as farmers they acknowledged the gap between meat farmgate and city retail prices. Approximately 50% of non-farm income is spent on farm animals (both for private sale on fattening and to produce meat for sale in their Brasov shop). The two activities are interconnected and the family cannot provide an accurate estimate of how much money they make from growing their own animals and how much they make from processing and selling purchased animals. Non-farm enterprise constraints/ opportunities
(i) Bureaucracy: “Sometimes the officials demand documents that are no longer issued by the state institutions. They don’t give them, but they ask for them during the inspections!” – Wife Interviewee. (ii) Corruption: Access to the Brasov meat retail market was very difficult. To rent a shop in the marketplace usually requires the bribing of market officials or exploiting personal contacts. The first place they rented was very small and they were forced to vacate this following intimidation from local competitors. Later they bought the shop they use now from an acquaintance that went bankrupt. (iii) Customs legislation constrains the development of the business. They had the opportunity to import modern slaughterhouse equipment from Germany, but the import taxes were so high that buying obsolete facilities from Romania is more cost-efficient. (iv) Bank legislation and the state policy towards banks: “one cannot trust the banks. When the government is changed, the financial policies change, and one cannot make a long-term decision based on these policies” – Husband. (v) The lack of a coherent state policy towards agricultural entrepreneurs: after 1990 they were registered as a family association, but the taxes were too high and they decided to register on a

47
farmer certificate that allows them to sell agricultural products. The disadvantage is that they have no means of associating with similar firms to make their voice heard. They intend to continue these activities and possibly diversify them. They want to open a shop of traditional food products in the area, which would create 10-15 jobs for people in the village. Finally, they note that villagers are unhappy about their household being involved in trading, while most of them are limited to land working. Trade related non-farm activities are often seen as dishonest. For more information see Bleahu (2001).

48
Annex 2. Table A1.
Nonparametric Correlations Spearman's rho
1.000 .533** .621** .110 .726** .227 .025 .439**
.533** 1.000 .942** .212 .481** .414 -.029 .637**
.621** .942** 1.000 .332 .498** .577 -.042 .732**
.110 .212 .332 1.000 .237 .985** .406 .597*
.726** .481** .498** .237 1.000 .373 .023 .300*
.227 .414 .577 .985** .373 1.000 -.564 .800
.025 -.029 -.042 .406 .023 -.564 1.000 .114
.439** .637** .732** .597* .300* .800 .114 1.000
. .000 .000 .367 .000 .312 .418 .001
.000 . .000 .254 .000 .178 .406 .000
.000 .000 . .146 .000 .088 .370 .000
.367 .254 .146 . .241 .000 .095 .045
.000 .000 .000 .241 . .205 .423 .021
.312 .178 .088 .000 .205 . .094 .100
.418 .406 .370 .095 .423 .094 . .226
.001 .000 .000 .045 .021 .100 .226 .
Annual netprofit 1999(USD)Annualexpenditure1999 (USD)Turnover1999 (USD)Creditreceived1999 (USD)Annual netprofit 1998(USD)Creditreceived1998 (USD)F2. Age(years)Full timeregular paidworkersAnnual netprofit 1999(USD)Annualexpenditure1999 (USD)Turnover1999 (USD)Creditreceived1999 (USD)Annual netprofit 1998(USD)Creditreceived1998 (USD)F2. Age(years)Full timeregular paidworkers
CorrelationCoefficient
Sig.(1-tailed)
Annualnet
profit1999
(USD)
Annualexpenditure 1999
(USD)
Turnover 1999(USD)
Creditreceived
1999(USD)
Annualnet
profit1998
(USD)
Creditreceived
1998(USD)
F2.Age
(years)
Fulltime
regularpaid
workers
Correlation is significant at the .01 level (1-tailed).**.
Correlation is significant at the .05 level (1-tailed).*.

49
1 Dr. Junior Davis is a Senior Economist at the Natural Resources Institute, UK. Dr Angela Gaburici is an Economist at the Economic Forecasting Institute, Bucharest, Romania. 2 In some CEECs, e.g., between 30 and 45% of the population still lived in rural areas in 1994, i.e. Bulgaria-30%, Czech Republic-35%, Hungary-36%, Poland-36%, Slovak Republic-42%, and Romania-45% (World Bank, 1996). 3 Cristina Trefas – “1999 – a poor financial year, filled with losses and financial frauds”, published in “Adevarul” newspaper edition of Monday, March 19th 2001. 4 Given that rural retailers and traders are usually very astute about local market conditions, price information and local demand, there may be some mis-reporting concerning their profitability, which both local stakeholders (particularly local bank mangers and academics) felt should be higher. We found that they were the most concerned of our respondents to avoid incurring taxation on their activities. On the other hand, as most of these micro firms do not utilise professional accounting and enterprise management services, the method of valuing the volume of trade, profit and family labour costs may vary. The survey team attempted to avoid this by fully explaining the concepts used prior to the respondent answering, and where possible, by cross-checking with the respondents bank statements etc (see Davis and Janowski, 2001 for a fuller explanation of the approach used in the baseline survey). 5 The average rate of inflation for 1999 was 45.8%. 6 The Center for Economic Development was positively evaluated by the “Rural Finance Development Program” of the World Bank, which allocates US$150 million to Romania for village development. A component of this program is dedicated to large investments, funded through banks; another component is dedicated to small investors from rural areas that will receive micro-credits through non-government organizations and other habilitated institutions. 7 For example, the problem of inter-enterprise arrears is particularly severe in the energy sector. As energy suppliers have been unable to obtain payments from their customers, they have incurred arrears to their suppliers (mainly Renel in Romania). The Romanian government has had to intervene by making payments on behalf of importers in order to guarantee the continuation of energy supply for the country. This situation also occurs at the micro level between firms, where usually to the disadvantage of small firms, large firms incur arrears. Sometimes arrears are cleared through non-monetary payments based on barter and/or in-kind through produce or equipment. 8 APC (Agricultural Production Co-operative): created during the collectivization process in the 50's and 60's, were in theory the result of the member's free will to associate. In fact, farmers were forced to give their land, faced threats of deportation and imprisonment. The land, livestock, stables, tools the owners would bring to the APC became the indivisible property of the association. Legally, they still owned the land, but were forbidden to withdraw and work it individually. Each member was still entitled to 1,500 m2 to work in private. The members were paid in produce or/and money in proportion to the profit of the association. The extent to which the co-operativization was imposed varied in different regions: the mountain areas were much less affected than the plains. By 1989 there were 3,775 APCs, owning 58% of the arable land in Romania. (Cartwright, 2001).

Enterprise Trade and Finance Group Natural Resources Institute
University of Greenwich at Medway Central Avenue
Chatham Maritime Kent ME4 4TB Unted Kingdom
Tel: +44 (0)1634 883199Fax: +44 (0)1634 883706
Email: [email protected]://www.nri.org/rnfe/index.html
FS 54723ISO 9001