Embed Size (px)
Citation preview

NON-DUVERGERIAN EQUILIBRIA IN THE UNITED KINGDOM: CONUNDRUM OR HUMDRUM?
Brian J. Gaines *
January 8, 2006
* Department of Political Science, University of Illinois at Urbana-Champaign and Institute of Government and Public Affairs, University of Illinois Paper prepared for presentation to “Strategic Voting, Seats-Votes Relationships and Non-Duvergerian Equilibria” conference, Irvine, California, February 18-19, 2006. Please address comments, complaints, cavils, quibbles, quarrels or questions to [email protected]. Thanks to Delinda Swanson for assistance with assembling data.

INTRODUCTION Textbooks on British politics differ in how they characterize the party system. Some emphasize that the UK has traditionally had a two-party system, but that the last few decades have seen movement towards multi-partism in the electoral arena, and, to a lesser extent, in Parliament (e.g. Jones and Kavanagh 1998 45-55; Norton 1994, 110; Freedman 1996).1 Others place more emphasis on the proliferation of parties, highlighting multi-party politics as an essential aspect of modern British politics (Peele 1995, 182-183). Amongst electoral-system specialists, this same difference in shadings can be found insofar as some scholars characterize Britain as a slight or minor exception to the Duvergerian prediction of plurality-electoral-systems having two-party politics (e.g. Taagepera and Grofman 1985, Sartori 1997, 38-39), while others seem to take more seriously the puzzle of extra British parties (e.g. Duverger in Grofman and Lijphart 1986: 76-80). More recently, Curtice et al. declare, “[t]he mould of Britain’s two-party system appeared decidedly cracked” (in Kavanagh and Butler 2005: 235). Nuance aside, there is little doubt that Britain today does not have a pure two-party system, and few would disagree that the trend over the past few decades has been increasing dispersion in support of parties. How puzzling is this current state of the British party system? Obviously, the answer depends in part on how well-founded is the law usually attributed to Duverger, that plurality electoral rule should result in two-party politics. As is now well appreciated, the dependent variable in this formulation is complicated, as one can measure party competition nationally or in districts, with or without weighting of party performances, in seats or in votes, statically or dynamically, and so on. This paper will endeavour to clarify whether Britain’s electoral and party system pose a serious challenge to Duverger’s law by simply dwelling on the dependent variable, and examining in detail how much dispersion in support for parties exists in the countries and constituencies of the United Kingdom. I also briefly revisit some key qualifications to Duverger’s law concerning why the fit between electoral systems and their most natural party systems should not necessarily be exact. PARTY SYSTEMS AND “DUVERGERIAN EQUILIBRIA”
There are two fundamental aspects of a party system: how many parties exist
and where they lie in ideological space. Although these two traits are undoubtedly related, it is not uncommon to treat them in isolation, probably because both issues are more complex than they first appear. Counting parties usually entails weighting them in some manner to reflect their importance, and there is no obviously optimal weighting scheme. When one’s focus is the preferences of the electorate, votes are probably the most natural metric for party size, raising further complications such as whether or not all parties field equal numbers of candidates, what to do with independent or non-affiliated candidates, which vote total to consider in systems that involve multiple votes
1 To be clear, I will use “British” and “Britain” to refer to the whole of the UK in this paper, not excluding Northern Ireland except where explicitly noted.
1

or counts, whether local or national electorates are more relevant, and so on. An institutional focus, by contrast, suggests emphasizing seats, not votes, and perhaps moving on to consider legislative activity, extent of discipline in each party’s ranks, etcetera. Placing parties in ideological space, meanwhile, requires identifying the number and nature of relevant dimensions and then somehow fixing parties in terms of both central tendency and dispersion, perhaps distinguishing between the party in the mass electorate and the party’s office holders.
Moreover, the chronological stages of behaviour that result in each democracy
having an array of parties of various ideological stripes and sizes are tightly inter-linked by expectations about the future, learning from the past, and beliefs about others. Candidates, parties, and voters are all engaged in (potentially) strategic behaviour, all under the shadow of a set of electoral institutions and a set of legislative and constitutional features. Candidacies are generated by the interplay of decisions made by ambitious individuals and decisions by party leaders acting on some variety of collective interest, in expectation of likely electoral outcomes and, in turn, how votes are translated into seats, and how seat shares are translated into policy. Meanwhile, election returns, as an aggregate of individual voting behaviour, are strictly conditional on candidate entry and are very probably influenced by expectations shaped by past outcomes, polls, and so on. Insofar as the most important or interesting outcome of an election is not vote share or even seat shares, but policies, the complexity of the process is further multiplied by the seats-votes curve, party discipline, styles of prospective leaders and on and on.
Despite all of this complexity, the strict formulation of Duverger’s law posits a simple relationship between electoral rule and number of parties, without qualification involving ideological location, and without any sharp qualifications about timing or dynamics. Moreover, if the law is understood as a claim about district competition, it does not address national party numeracy without some auxiliary lemmas dealing with the aggregation of district competition into a national party system. This latter point has often been ignored or downplayed, as the preferred method of assessing how well states conform to the law has been analysis of national aggregate data. However, both of the posited mechanisms generating the law can operate at the district and national level. An allegedly near-universal psychological proclivity not to waste one’s vote by supporting any candidate who seems to have a very low probability of winning clearly operates at the district level, though expectations about national relevance of parties or candidates might also shape voters’ decisions. The elite-level concomitant, of withdrawal or non-entry in the face of an electoral system that fails to reward candidates not in first place should operate at the district level, but could, through the party system, also exert its force nationally. This paper’s title invokes “equilibria,” a term that deserves some elaboration. In game-theoretic work, the term equilibrium is under-descriptive, since there are a great many different concepts of equilibrium. In general, all of them apply to outcomes that have the potential to be stable in the sense that rational individuals (or coalitions of individuals) lack any incentive unilaterally to alter their behaviour from that which led to the equilibrium (given the outcome and perhaps their beliefs about others).
2
Evolutionary models take the dynamics of the process more seriously, and define equilibria as, e.g., asymptotically stable fixed points of evolutionary dynamics, that is processes of change wherein an ecology of actors generates and regenerates in a systematic fashion according to interactions. Here, I will eschew all of the technical details and invoke “equilibria” in a loose fashion to suggest outcomes that reflect some amount of stability. So the central idea is that Duvergerian equilibria are repeated instances of electoral competition featuring only two serious contenders. I will not aim here to distinguish carefully between non-Duvergerian equilibria, stable multi-candidate competition, and non-equilibria, an absence of apparent convergence in the number of serious candidates per seat. PARTY COMPETITION IN THE UNITED KINGDOM
Figure 1 shows, in five panels, how much party competition has occurred in each general election since 1922, the first election after the south of Ireland was carved out of the UK. Panel A reveals an unmistakable growth in candidacies over the last three decades: whereas 1922 to 1970 saw between 2 and 3 office-seekers per constituency, that figure is now about twice as high, following steady increases over the last 9 elections.2 By contrast, the “effective” number of parties, when computed with seat shares for the whole House of Commons, has risen only slightly over this period, with the 2005 election having produced the highest value since 1931, 2.46.3 Lying in between these two extremes, the effective number of parties in terms of vote share increased from about 2.5 to just over 3 in the 1974-1992 period, and has continued to climb over the past 3 elections so that the 2005 value of 3.6 ties the 1922 value and is exceeded only by 1983 if one treats the partnered Liberal and SDP parties as distinct.
How much do the distinct nations united within the UK differ in this respect?
Panels B-E answer that question. Not surprisingly, the picture for England strongly resembles panel A—since England has had about 80% of the seats in the House over these years, B could hardly differ dramatically from A. There are, nonetheless, subtle variations. Both of the effective parties series for England are shifted downward as against the whole of the UK, and the seats line clings to the 2.0 gridline from 1935 to 2001, reaching 2.35 only in 2005, when Labour’s huge majority gave way to substantial gains for both the Tories and the Liberal Democrats. England’s Parliamentary representation has almost always been true to the Duvergerian proposition, it seems, but the voting public has, in recent decades, spread its support over more than two parties even while the electoral rule usually dealt with losing parties quite mercilessly. 2 There is occasionally a slight discrepancy between “candidates” and individuals seeking office, since there are a few instances in these data of individuals standing for office in multiple constituencies (as many as five) simultaneously, and there are a few jointly sponsored candidates (e.g. Plaid Cymru and Green) who get double-counted. 3 Hereafter, the “effective number of parties” will refer to the Laakso-Taagepera index, Ne=Σi vi2 + vr where vi is the vote or seat share won by party i and vr is the residual, the aggregate of votes (or seats) won by independents and assorted tiny parties. The slight modification of not squaring the residual share follows Taagepera (1997), and fairly few candidates are combined into this ‘other’ category in most cases examined here, since the data include totals for most small parties to have competed in the UK in this period.
3

Panels B and C reveal somewhat more complex stories in Scotland and Wales.
Like England, both have seen increasing numbers of candidates per seat nearly every election since 1950, with period averages of about 2.5 for 1922-1945, 4 for 1974-1992, and 6 for 1997-2005. In both countries—but in Scotland most dramatically—the gap between number of parties measured by seats and number measured by votes has grown in recent decades, as Labour has dominated elections and other parties have felt the plurality loser’s curse rather badly. In Scotland, the Alliance reaped little gain from a vote surge in 1983 and 1987, the Conservatives have been severely penalized by the seats-votes function since 1987, and the SNP has seen its vote shares deflated into meagre seats shares every year since 1970. In Wales, Plaid Cymru’s more concentrated vote base means that it does reasonably well at winning seats in proportion to its vote share, and fewer minor parties win any substantial share of the vote, so the gap is smaller and the vote-based count of parties is usually lower than its Scottish counterpart.
Northern Ireland is typically set aside as too exceptional to merit inclusion in
discussion of parties in the UK. After 1970, sectarian parties have dominated, so the labels of the competitors are, indeed, completely different. There are few enough seats that this anomaly plays only a small part in increasing the overall party-counting indices for the whole of the UK. But the Northern Irish races do provide interesting additional evidence of how first-past-the-post logic exerts itself on voting. Panel E reveals that the broad trends in level of competition in Ulster are not all different in kind from those in the rest of the UK. Again, candidacies have risen steadily, and the last 30 years have seen more parties in vote terms. Atypically, the proliferation of parties shows up in seat shares too, by virtue of splits within the loyalist and republican camps. PARTY COMPETITION IN THE COUNTRIES AND CONSTITUENCIES OF THE UK
All of these figures, of course, are aggregates that do not directly represent district-level competition. Hence, variance in how uniform is the proliferation of candidacies and serious candidacies is suppressed in these figures. Table 1 shows for total candidacies how much variance underlies those country averages. In all four countries, of late, 5 or 6 is the modal number of candidates per district, and two-way battles are non-existent. Indeed, three-cornered fights are non-existent except in England, where they are very scarce. One component of the drift to the right (that is, the multiplication of candidacies) in the table has been the decision by the three major parties in England and the four major parties in Scotland and Wales to field complete slates of candidates, and thus to compete in all constituencies (outside of Northern Ireland) regardless of how poorly they have done there historically. The nationalists in fact beat the Liberals (in their various guises) to pursuing this full-slate approach, as they were running virtually everywhere in the 1970s, whereas it was the formation of the Alliance that marked the beginning of a genuine blanket-Great-Britain strategy for the Liberals, who had skipped nearly 100 races in February 1974, a handful in October 1974, and about 50 in 1979.
4

Of course, to get from 3 to 5 candidates in England, or from 4 to 5 or 6 candidates in Wales and Scotland, requires additional parties, and these have varied from year to year. Fringe right-wing parties with nationalist, anti-European integration, and sometimes racist appeals have provided the most candidates, between the BNP, National Front, Referendum, and UKIP. Hundreds of Green candidates have stood since 1979, none of them ever coming within shouting distance of winning a seat. New Age believers in transcendental meditation stood under the Natural Law banner in about 300 constituencies in 1992 and about 200 in 1997, before withdrawing from politics back to serenity. The votes won by Natural Law candidates were always very few, and the most interesting aspect of the movement might have been that it was a rare international party that made similar tiny inroads into the electoral scene in other advanced democracies. A trickle of Communist candidates in the early period has been replaced, of late, by a smattering of leftists unhappy with Labour’s moderation and, in 2005, by the Iraq war in particular. Amongst the horde of other minor candidates are many small and short-lived parties plus unaffiliated independents, only a handful of whom have ever won. Incumbent Speakers running for re-election are sometimes treated as independent candidates, since the norm is for major parties not to oppose them, but the Speakers are included with their original parties in these calculations. The most recent “other” winners include a physician whose original campaign was meant to protest closure of a local medical unit (Richard Taylor in Wyre Forest in 2001, curiously re-elected in 2005), a show-boating “anti-corruption” BBC journalist (Martin Bell, successful in 1997 and unsuccessful in his quest to remain in power in 2001), a Welsh exile from Labour running as an independent in protest of his former party having forced an all-women list on the local constituency (Peter Law in Blaenau Gwent in 2005) and the pugnacious ex-Labour, ex-Scotland maverick George Galloway—who did recruit a small number of like-minded other into his “RESPECT party”—parlaying a mix of anti-Americanism and anti-Semitism into victory in Bethnal Green in 2005.
Northern Ireland exhibits the same evolution from a norm of two-candidate
races (and even some uncontested races in the 1950s) to a norm of five or more competitors per seat at present. The proliferation reflects divisions within the loyalist/ unionist and the republican/nationalist camps. As unionist domination has faded, intramural splits on their side have settled, for now, into division between the more moderate Ulster Unionists and less conciliatory Democratic Unionists, temporarily ascendant after 2005. Sinn Fein re-emerged on the electoral scene in the 1980s, and has taken an increasing share of the separatist vote away from the moderate alternative, the SDLP, in each successive election. Beyond the sectarian split, a few parties have fought in multiple elections with a cross-community pitch, the most long-lived being the (fading) Alliance Party of Northern Ireland (APNI).
A very strong form of Duverger’s law would predict two candidacies, and the
evidence in Table 1 would thus constitute a clear refutation of the alleged tendency to bipartism under first-past-the-post rules. But the very large literature on electoral rule and party systems has already thrown up a catalogue of reasons why there might be some noise in the relationship, and, in particular, why candidates who garner little support should perhaps not count very strongly as evidence of multi-partism. Quite apart from the obvious point that hopeless-cause candidates who win only a handful of
5

votes do not really count, there is the question of what motivates the supporters of distant losers. Most backers of fringe parties, for example, seem to be aware that their preferred candidates stand no chance of winning, but derive some pleasure from expressing support for these individuals or their movement just the same. These voters are probably not impervious to pressures to be strategic by voting for the best candidate who might win, but their preferences are frequently extreme in the sense that none of the ostensibly viable candidates appeal to them enough to induce them to forego the expressive benefit of voting on the fringe.
A related or rival account emphasizes far-sightedness. Some Green supporters,
for instance, know perfectly well that their votes today will go to a loser, but believe that increasing vote shares in plurality races will help the party gain legitimacy or prominence, improving their prospects tomorrow. The fact that the UK now features elections held under a variety of electoral rules may also play a part in expanding some voters’ understanding of reasons to support likely losers. Since 1999, there have been two Green MEPs (elected by PR) and in 2003, the Greens returned 7 Members to the Scottish Parliament (courtesy of a mixed system). Recruitment of candidates to stand for House of Commons elections (and typically to forfeit their ₤ 500 deposit for having failed to secure 5% of the local vote) may be facilitated by the sense of success the party generates by electing individuals to regional assemblies, local government, or the European Parliament. The same logic could apply to UKIP, the Scottish Socialist Party and other small parties that have repeatedly fielded large slates for national British elections without ever winning, or coming at all close to winning, a House of Commons seat.
The most popular avenue for addressing these sorts of concerns about how to deal with relatively weak parties is to shift from counting candidates to counting weighted candidates, with the weights reflecting vote shares. A variety of entropy-based indices convert a vector of vote shares into a scalar index of “effective” candidacies (or “parties” for short, notwithstanding the presence of some independent candidates in the sums). The Laakso-Taagepera index, which inverts the sum of the squares of all vote proportions, remains the workhorse index in electoral studies, and Taagepera’s suggested slight variant on that index was used in Figure 1. Reducing dimensions has many attractions, and the index captures an essential aspect of dispersion by smoothly rising from k, when k parties exactly tie, to 1 as a single party captures the entire vote. Alternative statistics, ranging from the ratio of the second to the first loser’s vote share (due to Cox) to the winner’s margin to alternative entropy-like indices that increase or decrease the weight attached to the winner’s share, have their backers.
The lack of consensus is not surprising since information is unavoidably
discarded in collapsing the vote-share vector, and exactly what “two-party competition” should mean once one makes the move to weighting candidates is ambiguous. Consider that a three-way contest producing 49%-38%-13% outcome and a five-way race ending 60%-10%-10%-10%-10% get scored as nearly identical with effective parties counts of 2.49 and 2.5, respectively. The former race, however, has the feature that the combined vote of the 2 losers exceeds the vote of the winner, and thus the case seems more
6

problematic in terms of foregone strategic voting opportunities (depending, perhaps on the ideological character of these competitors). At an informal level, most commentators regard the failure of the various parties losing to the 60% winner to consolidate as less surprising or contrary to the bipolar prediction given the apparent (after-the-fact) invulnerability of the winner. Again, then, the effective-parties index is designed to deal with smallness, but not to take any account of inferred motivations of voters as revealed by closeness per se.
Figure 2 momentarily sets aside these concerns about what is lost in
transforming vote shares into effective-number-of-parties indices, and displays distributions of this index for the constituencies of Scotland, Wales, and four different regions of England over three elections held on a (virtually) constant electoral map, 1983, 1987 and 1992. The rationale for dividing England is not that different parties make explicitly regional appeals across the green and pleasant land—apart from the curiosity of the very small Cornwall separatist party Mebyon Kernow, England has not bred separatist parties. The UKIP and BNP are not, moreover, EIP and ENP, and there is relatively little England-wide nationalism. But the sheer size of England relative to the other countries of the UK makes it a natural candidate for some exploration of possible heterogeneity.
Of course, the three elections covered by Figure 2 vary in a number of manners.
It is probably fair to say that they are ordered inversely to the level of suspense concerning the national outcome (i.e. which party would form the next government). The 1983 election was a runaway for Mrs. Thatcher, in the wake of the successful Falklands war. In 1987, most expected the Conservatives to be returned to power, but the size of the victory on election night came as a surprise, and may exaggerate our retrospective since of how close that election was expected to be in the run-up. Finally, 1992 is now remembered for its faulty pre-election polls that made the fourth consecutive Tory win a dramatic shock. Accordingly, insofar as the incentives for voters strategically to abandon favoured weak parties are augmented when the national picture is cloudy, one might expect increasing fit with Duverger’s law as one moves down the panels. Likewise, redistricting between 1979 and 1983 potentially complicated estimates about the nature of the constituencies in the first of these elections. In that sense, ceteris paribus, voters, candidates, and parties should have had an increasingly easy time bringing normal vote patterns to bear on their decisions as time passed.
In keeping with these arguments, the 1992 election does seem to fit Duverger’s
law best of this trio, with the notable exception of Scotland. The English constituencies, in particular, shift to the left over the apportionment period, until the modal seat has a little less than 2.5 effective parties by 1992. 2.4 is not, of course, 2, but there does appear to be a distinct diminishing of party competition with movement from multi- toward bi- partisan competition, within England in any case. The Welsh data increase in variance dramatically without shifting mean, while the Scottish data are exactly contrary to the English trend, and appear to represent the clearest instance of “non-Duvergerian” trends, if not “equilibria.”
7

Figure 3 presents the most recent counterparts to the bottom two panels of figure 2, effective-parties distributions for the 2001 and 2005 elections. For simplicity, England is no longer subdivided by region, and I again omit the Northern Irish constituencies mainly because they are so few in number. Whereas the 1983-1992 trend showed England looking increasingly bipolar, the distribution of parties weighted by size corresponds to the earlier evidence at the national level, that the British party system is breaking with its the Duvergerian past, even in England. Without trying to draw a sharp line at, say, 2.5, it is clear that most contests for the House of Commons now feature more than 2 “effective” parties (candidacies). Indeed, only a handful fall at 2 or lower, even though skewed bipolar races get scored close to 1. This point says nothing direct about closeness, and there are still many safe seats whose winners enjoy huge margins. The losers who trail beyond these safe MPs, however, are always numerous.
An incidental point about Figures 2 and 3 is that comparison to Figure 1 reveals
that the vote-based effective-parties values for national aggregates are generally on the high end of the actual constituency distribution for the given year. This is not a logical necessity, though it seems to be a common phenomenon empirically. At one extreme, k districts each having the minimum possible effective-parties value of 1 can aggregate to vote totals that map into an index of k, if each district is won uncontested by a different party. A set of districts that are identical in size and party splits, meanwhile, produce a national-aggregate party score matching the district scores. The national score can also be smaller than most of the scores for its component districts, if, for example, there are two kinds of districts, even splits and uncontested races all won by the same party.
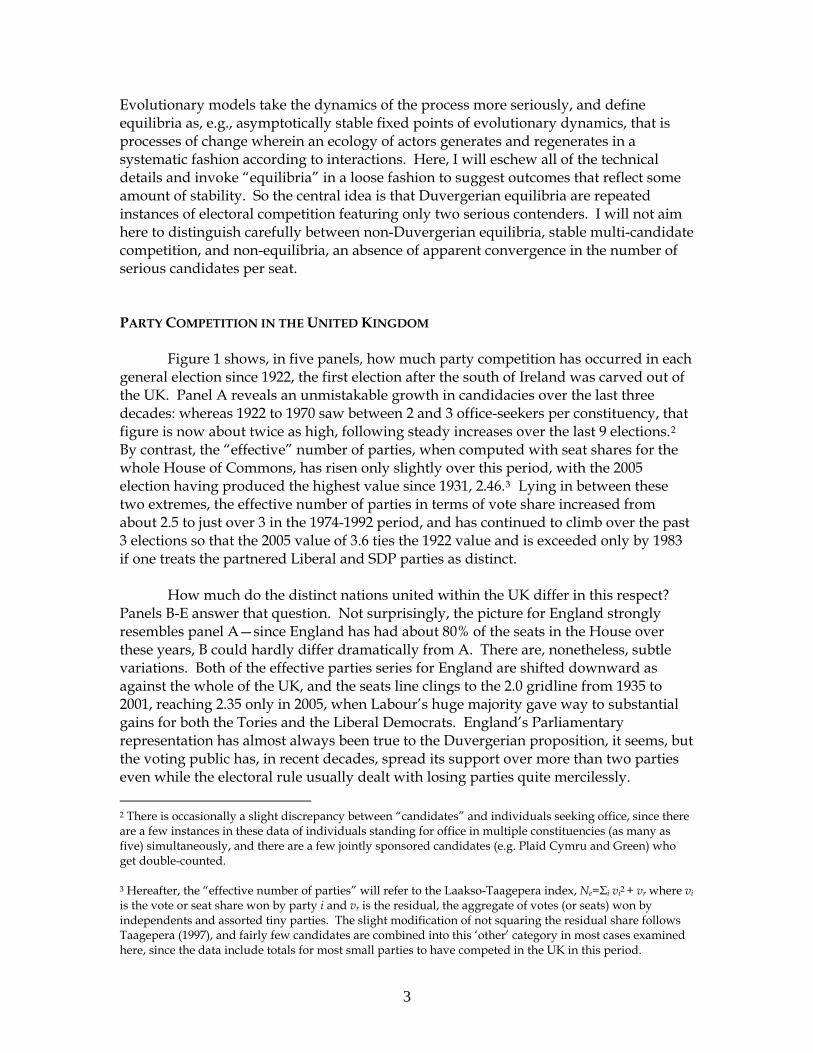
Figure 4 shows the values for constituencies and the national total for Northern
Ireland, where the contrast is especially stark. The country-level totals always map into a higher value than nearly all the constituencies, mainly because of variation in the identity of unionist and republican contenders from seat to seat. The 1986 simultaneous by-elections in 15 of the 17 Northern Irish seats, for instance, were centred around a mean of 2. Atypically for by-elections, they drew relatively few candidates (see Table 1), perhaps because they were also atypical by-elections insofar as incumbents were standing in each case. Nonetheless, the showdowns varied across seats, from Ulster Unionist versus The Worker’s Party to UDUP versus Sinn Fein versus SDLP versus The Worker’s Party to UPUP versus APNI, and so on. In sum, then, the races generated votes spread across 8 parties that translate to a country-wide figure of about 4.7 effective parties. The general lesson is that the convenience of using easily obtained national totals to characterize party systems comes at a cost. Insofar as Duverger’s law operates most directly in the units in which seats are won, characterizations of party competition based on national totals are inappropriate and potentially misleading. CONCLUSION
This paper had rather limited ambitions. I have endeavoured to present clear
evidence about the extent of party competition in recent elections to the British House of Commons with an eye to confirming the general sense that the UK increasingly poses a challenge to Duverger’s law. Indeed, district competition in the last few elections has
8

been multi-faceted, belying the alleged tendency towards bipolar competition wherever the electoral formula is simple plurality rule. The data raise a host of interesting questions touched on only briefly or tangentially here. Three particular issues stand out in my mind.
First, to what extent can one account for the multiplication of British parties by
the multiplication of British electoral rules. First European elections, and then devolution produced not just additional levels of salient government in Britain, but also variety in the electoral rule. A mostly ignored point about studying how electoral law affects party systems is that countries with federal or quasi-federal arrangements probably experience interactions between the multiple electoral systems, given that they are linked by a common electorate. There is not yet much work on how multi-venue “mixed” electoral rules affect voters’ attachments to parties, their proclivities for strategic voting, and so on, but it would appear to be a fruitful research area.
Second, the point that a great many British House of Commons seats remain
quite safe for one party calls into question whether the simplicity of the effective-number-of-parties index is ill-suited to understanding how and why voters support seemingly hopeless losers. Notwithstanding the considerable work that has gone into formalizing Duverger’s law in terms of probabilities of casting decisive votes, it seems unlikely that one can understand the dispersion of support across losing parties without reference to the plausibility of formal or informal cooperation or merger in terms of ideological bases and district normal vote. Figure 5 shows the 2005 election outcomes for English constituencies in terms of Labour and Conservative vote shares, with the distance from the hypotenuse thus representing residual vote (mostly, but not entirely, won by Liberal Democrats). In the bottom right triangle are seats where the Tory candidate won a majority of the vote; the top triangle contains Labour’s equally safe seats. The remaining square spanning the 0-0.5 intervals holds the most closely contested seats. There are concentrations of observations in two areas which correspond to relatively large effective-seat values by virtue of the fact that all three major parties are winning substantial numbers of votes. The densest region, for example, is the segment where the Conservative candidates won 30-40 percent, the Labour candidates won 40-50 percent, and the Liberal Democrats won most of the remaining 10-20 percent. Students of tactical voting make much of the variance in inter-election swings of vote-shares for each party according to which parties finished in first and second place in the prior election. Whether dispersion of vote across losers in these races is different in kind or in degree from dispersion in the safer regions seems an open question, dependent on how one understands the behavioural pillars on which Duverger’s law rests.
Finally, Figure 5—indeed, all of the data discussed thus far—obscures an
important point about recent elections in the UK, namely that rather large blocs of potential voters have been staying at home. Calculations about the number of parties and extent of fractionalization within partisan support are almost always conditional on turnout level. One can instantly inflate all such numbers by re-computing them as shares of the eligible electorate, including abstainers as a category. That is not a common strategy because conflating turnout and voting patterns by those who do turn out appears to mix apples and oranges. However, strong claims about electoral law and
9

party competition rely, at some point, on theories about individuals’ voting decisions, and it seems perverse to omit the first important such decision, or whether or not to vote. The “party” of abstention automatically wins no seats, exhibits no discipline, and has no ideological unity. But a thorough understanding of how institutions shape electoral outcomes probably requires a slightly broader understanding of outcomes, that encompasses turnout or at least explores the extent to which turnout and concentration of vote are related.
10

REFERENCES * BBC 2005 Election website
(http://news.bbc.co.uk/1/hi/uk_politics/vote_2005/default.stm) * Bedford, Michael (ed.) 1999. Dod’s Parliamentary Companion 1999. Westminster: Vacher
Dod Publishing Limited. Cox, Gary W. 1997. Making Votes Count. Cambridge: Cambridge University Press. * Craig, F.W.S. 1973. British Parliamentary Election Results 1950-1970. London: McMillan. * Craig, F.W.S. 1980. Britain Votes 2: British Parliamentary Election Results 1974-1979.
Chichester: Parliamentary Research Services. * Craig, F.W.S. 1989. Britain Votes 4: British Parliamentary Election Results 1983-1987.
Aldesrshot: Gower/Parliamentary Research Services. Craig, F.W.S. 1989. British Electoral Facts 1832-1987. Dartmouth: Parliamentary Research
Services. Freedman, Leonard. 1996. Politics and Policy in Britain. White Plains, NY: Longman. Grofman, Bernand and Arend Lijphart. 1986. Electoral Laws and Their Political
Consequences. New York, NY: Agathon Press. * Henig, Simon and Lewis Baston. 2002. The Political Map of Britain. London: Politico’s
Publishing. Jones, Bill and Dennis Kavanagh. 1998. British Politics Today (6th). Washington, DC: CQ
Press. Kavanagh, Dennis and David Butler. 2005. The British General Election of 2005. New York,
NY: Palgrave-Macmillan. Norton, Philip. 1994. The British Polity (3rd). New York, NY: Longman. Peele, Gillian. 1995. Governing the UK (3rd). Oxford: Blackwell. * Rawlings, Colin and Michael Thrasher. 1993. Britain Votes 5: British Parliamentary
Election Results 1988-1992. Aldershot: Dartmouth/Parliamentary Research Services.
Sartori, Giovanni. 1997. Comparative Constitutional Engineering: An Inquiry into Structures,
Incentives and Outcomes (2nd). New York, NY: NYU Press.
11

Taagepera, Rein. 1997. “Effective Number of Parties for Incomplete Data.” Electoral Studies 16, 2 (June): 145-151.
Taagepera, Rein and Bernard Grofman. 1985. “Rethinking Duverger’s Law: Predicting
the Effective Number of Parties in Plurality and PR Systems—Parties Minus Issues Equals One.” European Journal of Political Research 13, 4 (December): 341-352.
* data sources used to compile 1950-2005 constituency-level election returns file
12

Figure 1A. Party Competition in the United Kingdom, 1922-2005
EFFECTIVE PARTIES (SEATS)
EFFECTIVE PARTIES (VOTES)
CANDIDATES PER SEAT
0.000
1.000
2.000
3.000
4.000
5.000
6.000
29.01.1921 30.08.1930 30.03.1940 29.10.1949 30.05.1959 28.12.1968 29.07.1978 27.02.1988 27.09.1997 28.04.2007
Figure 1B. Party Competition in England, 1922-2005
CANDIDATES PER SEAT
EFFECTIVE PARTIES (VOTES)
EFFECTIVE PARTIES (SEATS)
0.000
1.000
2.000
3.000
4.000
5.000
6.000
29.01.1921 30.08.1930 30.03.1940 29.10.1949 30.05.1959 28.12.1968 29.07.1978 27.02.1988 27.09.1997 28.04.2007
13

Figure 1C. Party Competition in Scotland, 1922-2005
CANDIDATES PER SEAT
EFFECTIVE PARTIES (VOTES)
EFFECTIVE PARTIES (SEATS)
0.000
1.000
2.000
3.000
4.000
5.000
6.000
7.000
29.01.1921 30.08.1930 30.03.1940 29.10.1949 30.05.1959 28.12.1968 29.07.1978 27.02.1988 27.09.1997 28.04.2007
Figure 1D. Party Competition in Wales, 1922-2005
CANDIDATES PER SEAT
EFFECTIVE PARTIES (VOTES)
EFFECTIVE PARTIES (SEATS)
0.000
1.000
2.000
3.000
4.000
5.000
6.000
7.000
29.01.1921 30.08.1930 30.03.1940 29.10.1949 30.05.1959 28.12.1968 29.07.1978 27.02.1988 27.09.1997 28.04.2007
14
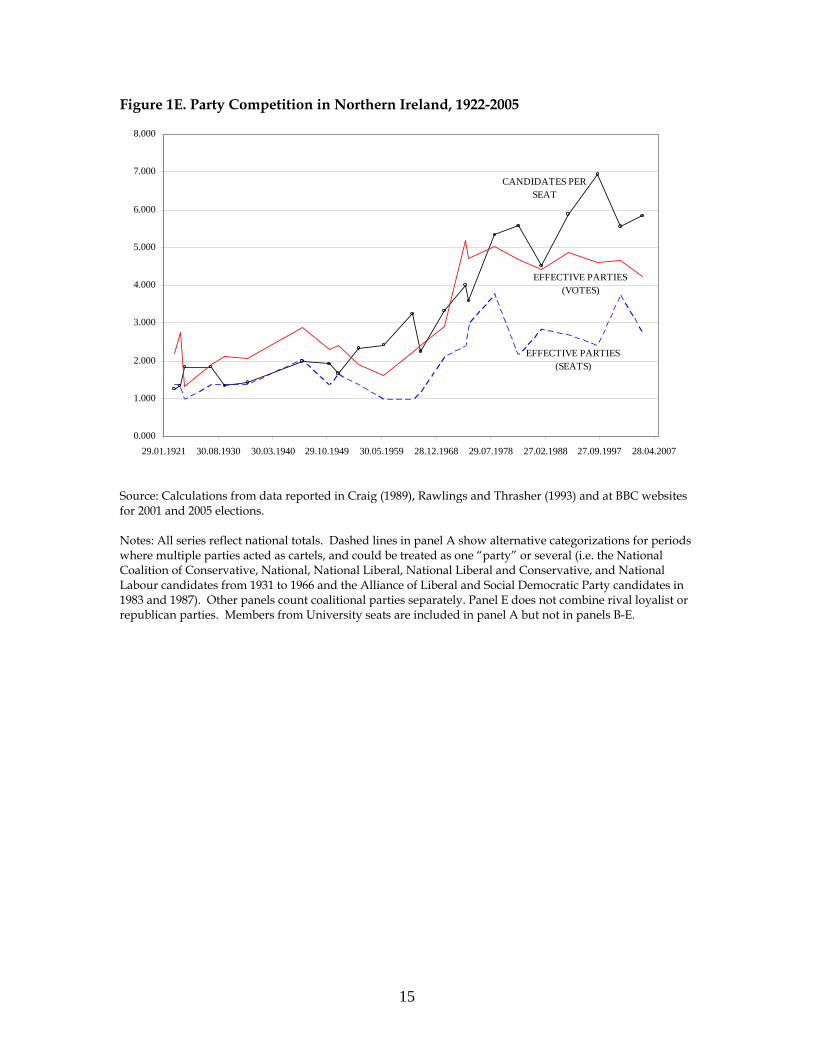
Figure 1E. Party Competition in Northern Ireland, 1922-2005
CANDIDATES PER SEAT
EFFECTIVE PARTIES (VOTES)
EFFECTIVE PARTIES (SEATS)
0.000
1.000
2.000
3.000
4.000
5.000
6.000
7.000
8.000
29.01.1921 30.08.1930 30.03.1940 29.10.1949 30.05.1959 28.12.1968 29.07.1978 27.02.1988 27.09.1997 28.04.2007
Source: Calculations from data reported in Craig (1989), Rawlings and Thrasher (1993) and at BBC websites for 2001 and 2005 elections. Notes: All series reflect national totals. Dashed lines in panel A show alternative categorizations for periods where multiple parties acted as cartels, and could be treated as one “party” or several (i.e. the National Coalition of Conservative, National, National Liberal, National Liberal and Conservative, and National Labour candidates from 1931 to 1966 and the Alliance of Liberal and Social Democratic Party candidates in 1983 and 1987). Other panels count coalitional parties separately. Panel E does not combine rival loyalist or republican parties. Members from University seats are included in panel A but not in panels B-E.
15

Table 1. Number-of-Candidates Distributions for Constituencies, 1950-2005 England 2 3 4 5 6 7 8 9 10+ N
1950 75 349 79 3 0 0 0 0 0 506 1951 409 94 3 0 0 0 0 0 0 506 1955 403 104 4 0 0 0 0 0 0 511 1959 310 191 10 0 0 0 0 0 0 511 1964 156 324 30 1 0 0 0 0 0 511 1966 196 294 18 2 1 0 0 0 0 511 1970 180 288 37 5 1 0 0 0 0 511
Feb. 1974 37 341 115 21 1 1 0 0 0 516 Oct. 1974 0 338 144 28 6 0 0 0 0 516
1979 3 152 236 96 19 9 0 1 0 516 1983 0 251 176 59 21 10 4 1 1 523 1987 0 348 145 22 8 0 0 0 0 523 1992 0 103 201 136 60 19 4 0 1 524 1997 0 18 127 127 131 76 24 21 4 528 2001 0 44 187 156 86 36 15 4 0 528 2005 0 21 131 189 94 58 20 12 2 527
Scotland 2 3 4 5 6 7 8 9 10+ N
1950 18 38 13 2 0 0 0 0 0 71 1951 54 16 1 0 0 0 0 0 0 71 1955 57 14 0 0 0 0 0 0 0 71 1959 42 28 1 0 0 0 0 0 0 71 1964 27 35 7 2 0 0 0 0 0 71 1966 19 40 12 0 0 0 0 0 0 71 1970 1 29 38 3 0 0 0 0 0 71
Feb. 1974 0 24 42 4 1 0 0 0 0 71 Oct. 1974 0 1 61 8 1 0 0 0 0 71
1979 0 17 42 8 3 1 0 0 0 71 1983 0 0 48 23 0 1 0 0 0 72 1987 0 0 55 15 1 1 0 0 0 72 1992 0 0 33 27 10 2 0 0 0 72 1997 0 0 3 28 17 19 2 2 1 72 2001 0 0 0 33 33 4 2 0 0 72 2005 0 0 0 18 12 17 8 2 1 58
16

Table 1. Number-of-Candidates Distributions for Constituencies, 1950-2005 (cont’d) Wales 2 3 4 5 6 7 8 9 10+ N
1950 11 17 8 0 0 0 0 0 0 36 1951 24 12 0 0 0 0 0 0 0 36 1955 21 11 4 0 0 0 0 0 0 36 1959 14 15 7 0 0 0 0 0 0 36 1964 9 15 11 1 0 0 0 0 0 36 1966 11 11 14 0 0 0 0 0 0 36 1970 0 8 26 2 0 0 0 0 0 36
Feb. 1974 0 3 28 4 1 0 0 0 0 36 Oct. 1974 0 1 29 6 0 0 0 0 0 36
1979 0 3 24 6 3 0 0 0 0 36 1983 0 1 22 13 2 0 0 0 0 38 1987 0 1 31 6 0 0 0 0 0 38 1992 0 0 18 13 6 1 0 0 0 38 1997 0 0 3 18 15 1 3 0 0 40 2001 0 0 7 13 11 6 3 0 0 40 2005 0 0 4 7 13 10 3 3 0 40
N. Ireland 2- 3 4 5 6 7 8 9 10+ N
1950 11 1 0 0 0 0 0 0 0 12 1951 12 0 0 0 0 0 0 0 0 12 1955 8 4 0 0 0 0 0 0 0 12 1959 8 3 1 0 0 0 0 0 0 12 1964 2 5 5 0 0 0 0 0 0 12 1966 9 3 0 0 0 0 0 0 0 12 1970 4 3 2 3 0 0 0 0 0 12
Feb. 1974 0 3 6 3 0 0 0 0 0 12 Oct. 1974 0 7 3 2 0 0 0 0 0 12
1979 0 1 0 7 2 2 0 0 0 12 1983 0 0 3 4 8 1 1 0 0 17
1986* 8 3 4 0 0 0 0 0 0 15 1987 0 3 4 8 2 0 0 0 0 17 1992 0 0 1 7 5 1 3 0 0 17 1997 0 0 0 4 4 3 4 2 1 18 2001 0 1 3 6 4 2 1 1 0 18 2005 0 0 1 7 5 4 1 0 0 18
Source: Author’s computations. See data sources in references. Notes: Bold designates the frequency for the modal category for each country in each year. In 1986, all 15 of Northern Ireland’s Unionist MPs resigned in protest of the 1985 Anglo-Irish agreement, in order to force an unofficial referendum via simultaneous by-elections in which they sought re-election to their seats.
17
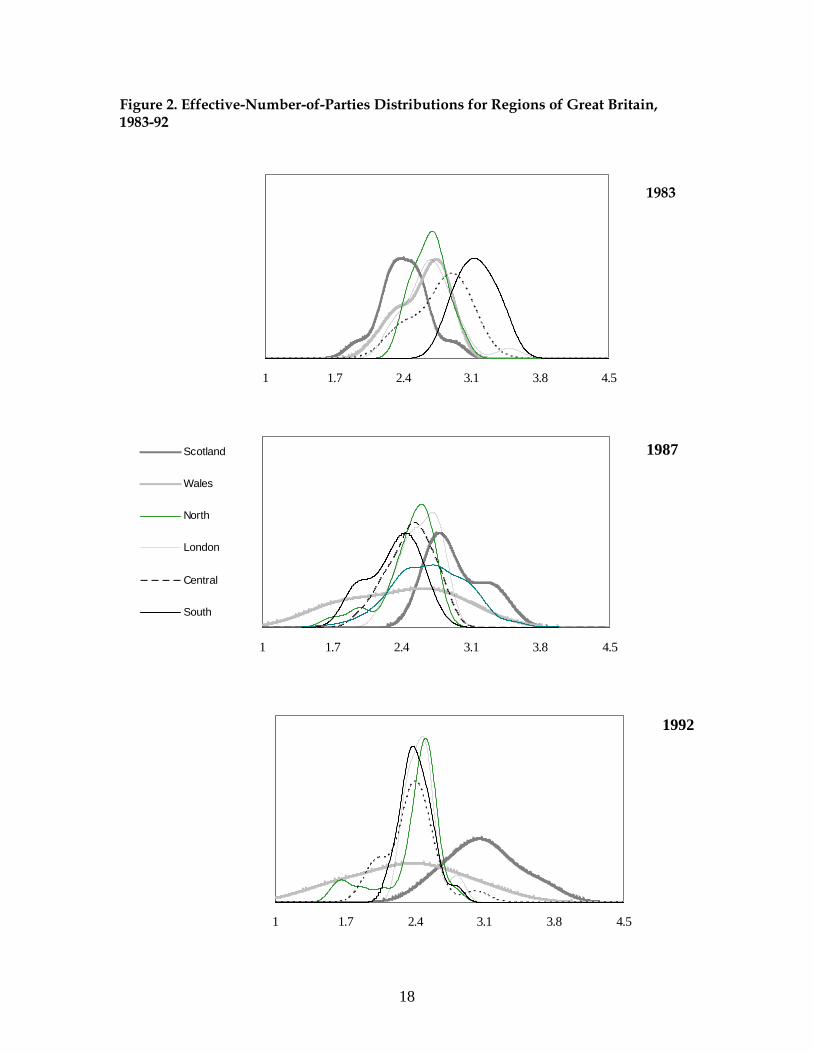
Figure 2. Effective-Number-of-Parties Distributions for Regions of Great Britain, 1983-92
1983
1 1.7 2.4 3.1 3.8 4.5
1987
1 1.7 2.4 3.1 3.8 4.5
Scotland
Wales
North
London
Central
South
1 1.7 2.4 3.1 3.8 4.5
1992
18

Figure 3. Effective-Number-of-Parties Distributions for British Countries, 2001-2005
1 2 3 4 5
England
Scotland
Wales
1 2 3 4 5
Scotland
Wales
England
19

Figure 4. Effective Number of Parties (by Votes), Northern Ireland, 1970-2005
0.00
1.00
2.00
3.00
4.00
5.00
6.00
1-Jan-1972 30-Dec-1976 29-Dec-1981 28-Dec-1986 27-Dec-1991 25-Dec-1996 24-Dec-2001 23-Dec-2006
Notes: Hollow squares show the values for the whole of Northern Ireland, while dots mark individual constituencies.
20

Figure 5. Vote-Share Distribution for the 2005 Election in England
Safe Labour
Safe Conservative
00.10.20.30.40.50.000
0.100
0.200
0.300
0.400
0.500
0.600
0.700
0.800
0.900
1.000
0.000 0.100 0.200 0.300 0.400 0.500 0.600 0.700 0.800 0.900 1.000
Conservative Vote
Labo
ur Vote
Notes: Each marker represents a constituency. Crosses designate seats won by Liberal Democrats while triangles mark seats won by others (Wyre Forest and Bethnal Green). A few seats in the (0.1,0.4) region might appear to be Liberal Democrat wins, mislabeled as Labour triumphs, but are, instead, anomalies where other parties did exceptionally well. For instance, Birmingham Sparkbrook and Smallheath was won by Labour (36.1%), while the RESPECT candidate finished second (27.5%), ahead of the Liberal Democrat (20.2%), the Tory (9.1%), and candidates for the UKIP and the Greens plus an independent (7.1% total). Burnley, meanwhile, had an effective N of just over 4, from vote shares of: 38.5% (Labour), 23.7% (Liberal Democrat), 14.8% (independent), 10.8% (Conservative), 10.3% (BNP), 1.0% (independent), 1.0% (UKIP).
21