Embed Size (px)
Citation preview
Communication
Non-destructive tomographic energy-dispersive diffraction imaging of the
interior of bulk concrete
Christopher Halla, Sally L. Colstonb, Andrew C. Jupeb, Simon D.M. Jacquesb,Richard Livingstonc, Alsaid O.A. Ramadand, Amde W. Amded, Paul Barnesb,*
aCentre for Materials Science and Engineering, School of Mechanical Engineering, King's Building, Edinburgh ED9 3JL, UKbIndustrial Materials Group, Department of Crystallography, Birkbeck College, Malet Street, London WC1E 7HX, UK
cOffice of Infrastructure R&D, Federal Highway Administration, Mclean, VA, USAdDepartment of Civil Engineering, University of Maryland, College Park, MD, USA
Received 9 September 1999; accepted 3 January 2000
Abstract
A new tomographic technique, termed TEDDI (tomographic energy-dispersive diffraction imaging) has recently been invented by Hall
et al. [C. Hall, P.Barnes, J.K. Cockcroft, S.L. Colston, D. Hausermann, S.D.M. Jacques, A.C. Jupe, M. Kunz, Synchrotron radiation
energy-dispersive diffraction tomography, Nucl Instrum Methods Res, Sect B 140 (1998) 253±257; C. Hall, P. Barnes, J.K. Cockcroft,
S.D.M. Jacques, A.C. Jupe, X. Turrillas, M. Hanfland, D. Hausermann, Rapid whole-rock mineral analysis and composition mapping by
synchrotron X-ray diffraction, Anal Commun 33 (1996) 245±248] and applied to cementitious systems. TEDDI has notable unique features
in that: it exploits diffraction, rather than spectroscopic sensing, and therefore directly yields compositional/structural information about the
sample; the diffracting region can be made small or large depending on application, the ultimate spatial resolution being in the micron range;
with the use of energetic (20±125 keV) synchrotron beams, bulk objects such as concrete blocks can be penetrated so that the technique
becomes non-destructive. We report on early tests of this technique as a means to non-destructively examine the interior of concrete prism
specimens. Concrete, by definition, is a heterogeneous material because it contains coarse aggregates on a length scale of � 1 cm. This is
orders of magnitude larger than the effective penetration depth of conventional X-ray diffraction systems (typically <100 mm at 1.54 A)
which, therefore, cannot probe the interior of intact concrete specimens. It is possible to pulverize concrete, sift out the aggregates, and
analyze the remaining fraction but the degree of representation of such powders is questioned since certain phases may be lost or enriched
during this process; furthermore, the spatial distribution of the analyzed phases within the concrete will be lost and, with it, important
information such as whether the phase in question forms in the cement paste matrix or at the aggregate interface. Even after these limitations,
conventional diffraction/microscopy analysis is at best a `̀ one shot'' process in time. The TEDDI technique has the promise to avoid all these
problems by enabling the examination of intact concrete specimens on the length scale of several centimeters. D 2000 Elsevier Science Inc.
All rights reserved.
Keywords: Characterization; Image analysis; X-ray diffraction; Concrete; Synchrotron
1. Tomographic energy-dispersive diffraction imaging
(TEDDI)
TEDDI has been developed from energy-dispersive dif-
fraction, a technique which has already found wide applica-
tion in the field of time-resolved in-situ diffraction studies of
materials such as catalysts and zeolites [2,3], ceramics [4],
cements [5,6], and rocks [1,7]. The basis of the technique is
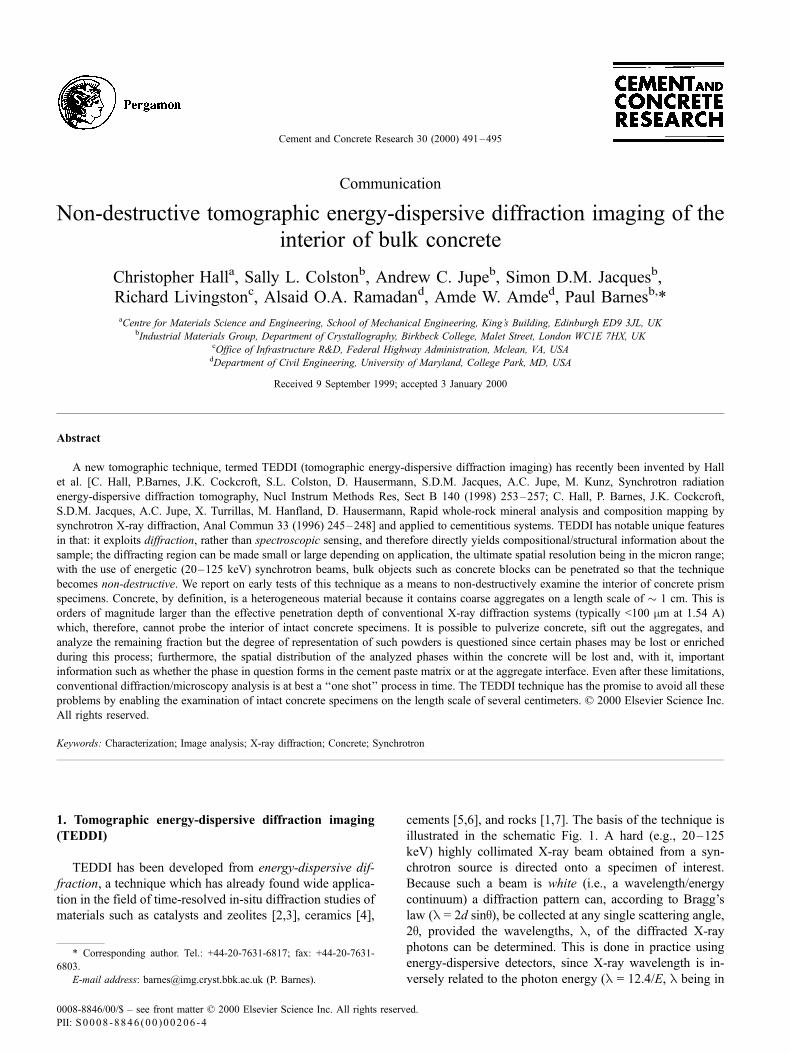
illustrated in the schematic Fig. 1. A hard (e.g., 20±125
keV) highly collimated X-ray beam obtained from a syn-
chrotron source is directed onto a specimen of interest.
Because such a beam is white (i.e., a wavelength/energy
continuum) a diffraction pattern can, according to Bragg's
law (l = 2d sinq), be collected at any single scattering angle,
2q, provided the wavelengths, l, of the diffracted X-ray
photons can be determined. This is done in practice using
energy-dispersive detectors, since X-ray wavelength is in-
versely related to the photon energy (l = 12.4/E, l being in
* Corresponding author. Tel.: +44-20-7631-6817; fax: +44-20-7631-
6803.
E-mail address: [email protected] (P. Barnes).
0008-8846/00/$ ± see front matter D 2000 Elsevier Science Inc. All rights reserved.
PII: S0 0 0 8 - 8 8 4 6 ( 0 0 ) 0 0 2 06 - 4
Cement and Concrete Research 30 (2000) 491±495
units of angstroÈms (A) and E in kilo-electron-volts (keV)),
and the diffraction pattern then becomes a plot of intensity
versus photon energy, E, rather than versus angle, 2q. Since
the energy-dispersive method is a fixed geometry techni-
que, with the incident and diffracted X-ray beams defined
by the slit/collimator system, the diffracted signal is seen
to originate from a precise region termed a lozenge (see
Fig. 1). This region can be made large (� 1 mm3) or small
(� 10,000 mm3) by appropriate manipulation [8] of the
X-ray beam slits, collimation system, and diffracting
angle, 2q; this is a distinguishing feature of TEDDI
from neutron diffraction techniques which, while posses-
sing similar attributes of penetration, cannot compete in
terms of spatial resolution. The particular novelty with
TEDDI is to arrange so that the diffraction-lozenge is
scanned through the specimen, collecting EDD patterns
at each point. The scanning procedure is performed by
mechanically moving the specimen through the stationary
synchrotron white X-ray beam, the scanning being either
one-, two- or three-dimensional (1D, 2D, 3D, respec-
tively) in nature. In this study, three energy-dispersive
detectors were used (see Fig. 1) with the result that three
separate diffraction patterns were collected simulta-
neously from substantially the same sample region. Since
these three detectors cover different ranges of reciprocal
space, the overall diffraction information becomes ex-
tended, this being a particularly desirable feature in the
case of multi-phase materials such as cement/concrete.
2. A prototype tomographic study of concrete
A prototype study has been undertaken of the potential of
TEDDI to non-destructively examine bulk concrete objects.
In this first study, the emphasis was on assessing the
technique's capability to non-destructively examine cemen-
titious material on a relatively coarse scale. The concrete
sample used in this study was produced as part of a research
project to develop an improved method of measuring the
damage associated with delayed ettringite formation [9].
Three batches of concrete, made with the same Type III
Portland cement, were mixed with varying levels of potas-
sium (0.7%, 1.4%, and 2.1% K2O). The fine aggregate was
Maryland quartz sand and the coarse aggregate Frederick
Maryland limestone. The concrete batches were then cast
into both 3 � 3 � 11.25-in. prisms and 4 � 8-in. cylinders.
Some of the specimens were cured at elevated temperatures
and the others at room temperature. From some of the
prisms, 1-in. diameter cores were drilled according to the
Duggan test procedure [10]. The cylinders, cores, and
complete prisms were exposed to the standard Duggan test
temperature cycles to induce microcracking, and then im-
mersed in a room temperature water bath. Periodically, the
linear expansion of the specimens was measured with a
length comparator according to ASTM C490. The steam-
cured specimens with the highest potassium content
achieved 1% expansion at 65 days compared to 115 days
for the lowest potassium content. The compressive strengths
at the end of the test period were around 5 and 20 MPa,
respectively [11].
Examination of fracture surfaces with the scanning
electron microscope and EDAX revealed abundant amounts
of ettringite in cracks and at aggregate interfaces at all levels
of potassium content. The presence of thaumasite was also
suspected. It was not possible from the SEM examination to
establish if the amount of ettringite correlated with the
potassium content. To make this correlation, it would be
necessary to quantify the amount of ettringite over the entire
Fig. 1. Schematic illustrating the basic mode of action of the TEDDI configuration in relation to the three energy-dispersive detectors and the concrete sample
under study. The incident beam defines, with each diffracted beam, three diffraction lozenges which are then aligned into coincidence. The TEDDI maps in this
study were obtained by first aligning the concrete sample with the y-traverse so that the lozenges fell just inside the concrete sample and then traversing the
concrete sample along x and z to obtain a 2D TEDDI map.
C. Hall et al. / Cement and Concrete Research 30 (2000) 491±495492
volume of the specimen. Consequently, it was decided to
apply TEDDI to this problem.
The 1 � 2-in. cores drilled from the prisms are the ideal
size and shape for TEDDI examination. Cores were avail-
able for the concrete batches for the two lowest levels of
potassium content. For the highest level of potassium, it was
necessary to cut a 1-in. slice off the end of one of the prisms.
The first results of the TEDDI analysis of this concrete piece
are reported here.
3. TEDDI configuration
Initial tests confirmed that high quality transmission
EDD patterns could be collected within minutes along
any principal direction including the longest axis, 77 mm,
which is the greatest thickness penetrated by this technique
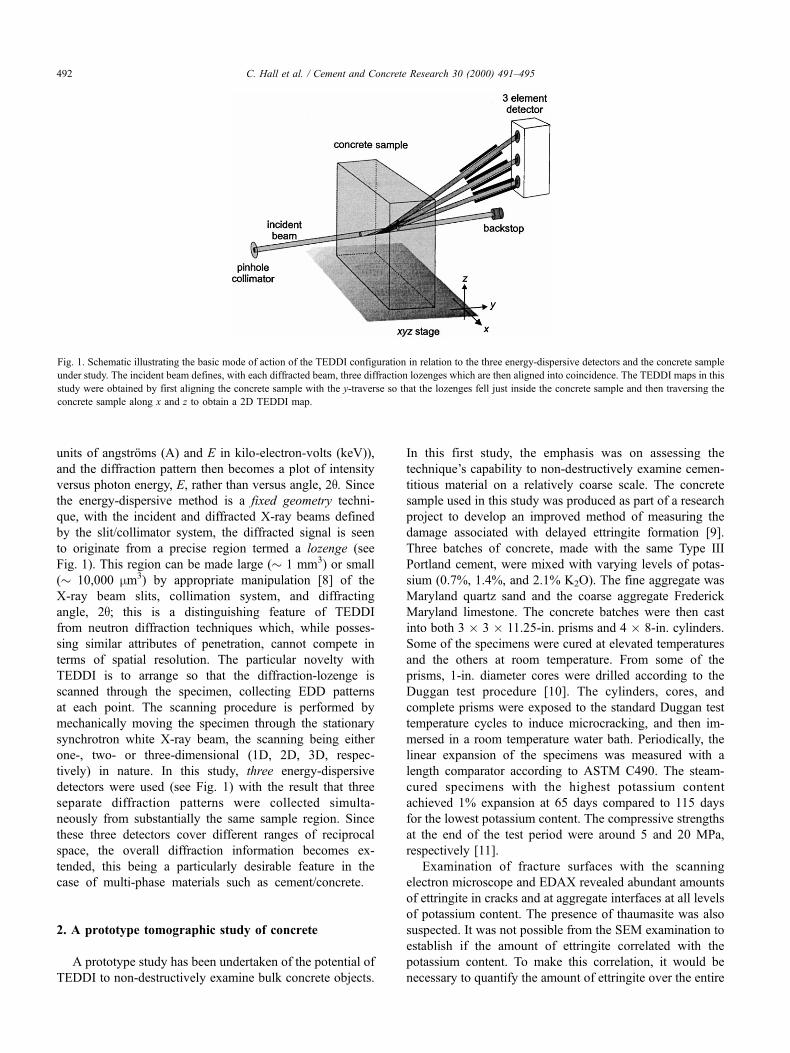
to date. A rectangular 13 � 6-mm area was selected on one
of the external faces (Fig. 2a,b), on account that it contains
mortar and parts of two aggregate particles of differing
appearance. The concrete piece was set up on the TEDDI
system (station 16.4 of the 6-T wiggler beamline of the SRS
synchrotron at Daresbury, UK) in such a configuration to
tomograph a rectangular volume starting from this surface
area and extending inside the block (this volume is indi-
cated schematically in Fig. 1). The energy-dispersive de-
tectors were set at 2q-angles of 2.399°, 5.138°, and 7.911°and the diffracting lozenges were 0.5 mm in diameter by
13.1, 6.67 and 4.3 mm in length, respectively. A 2D
tomographic scan was set in motion in which the external
limit of the longest (13.1 mm) diffraction lozenge traversed
the 13 � 6-mm area in 13 � 13 steps: the position of the
scanned area is indicated using X-ray sensitive paper placed
on the concrete surface (Fig. 2a). The collection time at
each point was 300 s, this amounting to an overall scan time
of just over 14 h.
4. Results
Although the aim of this study was to yield point by
point tomographic information, we also note the sheer size
Fig. 2. Ordinary photographic display of the rectangular concrete block
showing the largest 77 � 78 mm face uppermost: (a) with the X-ray beam
sensitive paper still intact on surface; the actual beam traverse area is just
about visible as 13 parallel stripes within the lighter central region; (b) with
the X-ray beam sensitive paper removed but the outlines of the paper (outer
rectangle) and the traverse area (inner rectangle) marked in pencil.
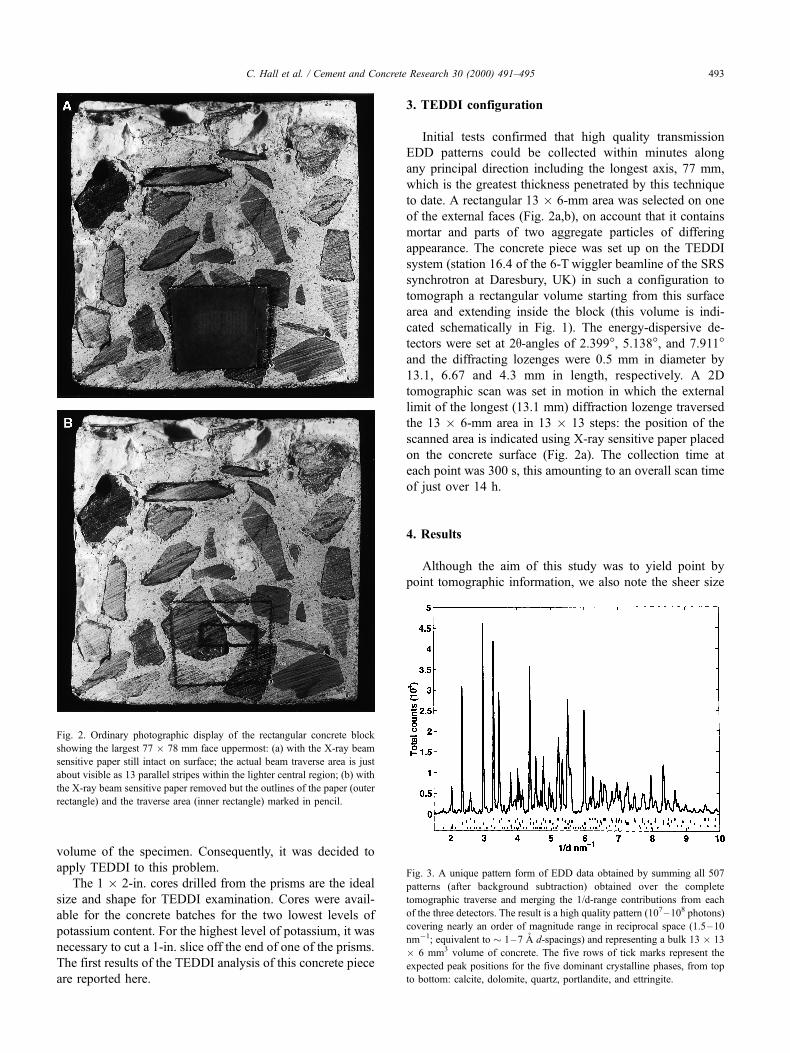
Fig. 3. A unique pattern form of EDD data obtained by summing all 507
patterns (after background subtraction) obtained over the complete
tomographic traverse and merging the 1/d-range contributions from each
of the three detectors. The result is a high quality pattern (107 ± 108 photons)
covering nearly an order of magnitude range in reciprocal space (1.5± 10
nmÿ1; equivalent to � 1 ± 7 AÊ d-spacings) and representing a bulk 13 � 13
� 6 mm3 volume of concrete. The five rows of tick marks represent the
expected peak positions for the five dominant crystalline phases, from top
to bottom: calcite, dolomite, quartz, portlandite, and ettringite.
C. Hall et al. / Cement and Concrete Research 30 (2000) 491±495 493
of a 14-h scan, encompassing some 108 scattered/diffracted
photons, yielding a 2.1-Mb data set, and being representa-
tive of a sizable specimen volume (� 1000 mm3, or 1 cm3);
as such, it amounts to a truly bulk-averaged result with high
counting statistics. One can distill all this diffraction in-
formation from the three detectors into one single plot
provided the patterns are expressed in units of reciprocal
space (1/d) rather than photon energy (this is shown in Fig.
3), the final pattern covering nearly an order of magnitude
range in reciprocal space, and representing a truly bulk
volume (� 1000 mm3) of concrete. The five rows of marks
show the expected peak positions for the five dominant
crystalline phases, from top to bottom: calcite, dolomite,
quartz, portlandite, and ettringite, which together account
for 98% of the diffracted intensity.
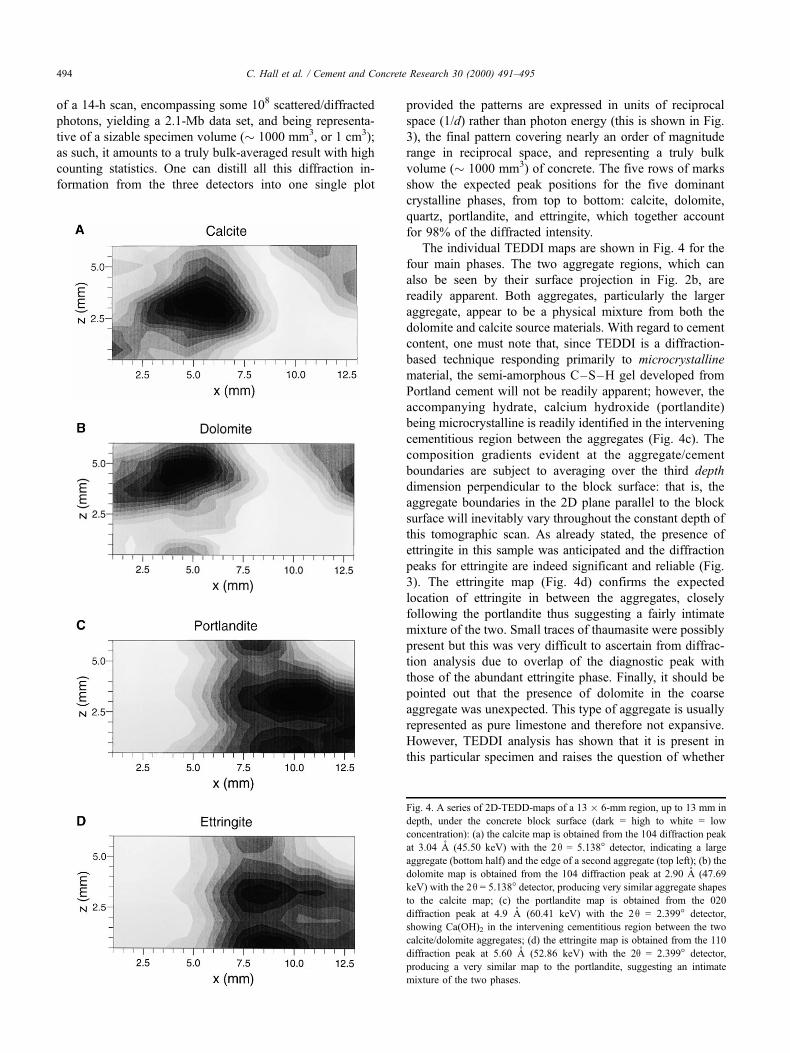
The individual TEDDI maps are shown in Fig. 4 for the
four main phases. The two aggregate regions, which can
also be seen by their surface projection in Fig. 2b, are
readily apparent. Both aggregates, particularly the larger
aggregate, appear to be a physical mixture from both the
dolomite and calcite source materials. With regard to cement
content, one must note that, since TEDDI is a diffraction-
based technique responding primarily to microcrystalline
material, the semi-amorphous C±S±H gel developed from
Portland cement will not be readily apparent; however, the
accompanying hydrate, calcium hydroxide (portlandite)
being microcrystalline is readily identified in the intervening
cementitious region between the aggregates (Fig. 4c). The
composition gradients evident at the aggregate/cement
boundaries are subject to averaging over the third depth
dimension perpendicular to the block surface: that is, the
aggregate boundaries in the 2D plane parallel to the block
surface will inevitably vary throughout the constant depth of
this tomographic scan. As already stated, the presence of
ettringite in this sample was anticipated and the diffraction
peaks for ettringite are indeed significant and reliable (Fig.
3). The ettringite map (Fig. 4d) confirms the expected
location of ettringite in between the aggregates, closely
following the portlandite thus suggesting a fairly intimate
mixture of the two. Small traces of thaumasite were possibly
present but this was very difficult to ascertain from diffrac-
tion analysis due to overlap of the diagnostic peak with
those of the abundant ettringite phase. Finally, it should be
pointed out that the presence of dolomite in the coarse
aggregate was unexpected. This type of aggregate is usually
represented as pure limestone and therefore not expansive.
However, TEDDI analysis has shown that it is present in
this particular specimen and raises the question of whether
Fig. 4. A series of 2D-TEDD-maps of a 13 � 6-mm region, up to 13 mm in
depth, under the concrete block surface (dark = high to white = low
concentration): (a) the calcite map is obtained from the 104 diffraction peak
at 3.04 AÊ (45.50 keV) with the 2 q = 5.138° detector, indicating a large
aggregate (bottom half) and the edge of a second aggregate (top left); (b) the
dolomite map is obtained from the 104 diffraction peak at 2.90 AÊ (47.69
keV) with the 2q = 5.138° detector, producing very similar aggregate shapes
to the calcite map; (c) the portlandite map is obtained from the 020
diffraction peak at 4.9 AÊ (60.41 keV) with the 2 q = 2.399° detector,
showing Ca(OH)2 in the intervening cementitious region between the two
calcite/dolomite aggregates; (d) the ettringite map is obtained from the 110
diffraction peak at 5.60 AÊ (52.86 keV) with the 2q = 2.399° detector,
producing a very similar map to the portlandite, suggesting an intimate
mixture of the two phases.
C. Hall et al. / Cement and Concrete Research 30 (2000) 491±495494
some of the expansion was produced by the dolomite
through the alkali±carbonate reaction.
5. Conclusions and future studies
We have demonstrated that TEDDI is potentially a
powerful technique for identifying the main microcrystal-
line constituents of concrete within a large sampling
volume and for grading the concentration of these consti-
tuents on a sub-millimeter scale. Since the technique is
non-destructive, at least for samples with thicknesses up to
50±80 mm, there is the future prospect of performing
repeated TEDDI analyses on the same bulk specimen
throughout its long-term hydration history (i.e., over years).
In this way, we could envisage monitoring the hydration
progression around precisely the same intergranular re-
gions, from the earliest stages when the calcium silicate/
alumino-ferrite phases are predominant to various hydra-
tion regimes where portlandite, ettringite, and monosulfate
phases might be anticipated. Such samples could be stored,
and even analyzed, under a variety of environmental
conditions (temperature, humidity, surrounding solution,
stress/load) so as to seek more definitive answers to long-
standing problems such as delayed ettringite/thaumasite
formation. The intention is also to push, in parallel, the
technique at the microscopic end (1±100 mm scale) and
find corresponding micro-applications for non-destructive
TEDDI analysis in the field of cements.
Acknowledgments
We wish to thank the Research Councils (EPSRC,
CLRC) for research grants and the use of synchrotron
facilities, particularly Prof. D. Norman (Daresbury Labora-
tory) for granting discretionary beamtime, and the USA
Federal Highway Administration for their help.
References
[1] C. Hall, P. Barnes, J.K. Cockcroft, S.D.M. Jacques, A.C. Jupe,
X. Turrillas, M. Hanfland, D. Hausermann, Rapid whole-rock
mineral analysis and composition mapping by synchrotron X-ray
diffraction, Anal Commun 33 (1996) 245± 248.
[2] H. He, P. Barnes, J. Munn, X. Turrillas, J. Klinowski, Autoclave
synthesis and thermal transformations of the aluminophosphate mole-
cular sieve VPI-5: An in-situ X-ray diffraction study, J Chem Phys
Lett 196 (1992) 267±273.
[3] S.M. Clark, A. Nield, T. Rathbone, J. Flaherty, C.C. Tang,
J.S.O. Evans, R.J. Francis, D. O'Hare, Development of large
volume reaction cells for kinetic studies using energy-dispersive
powder diffraction, Nucl Instrum Methods Phys Res, Sect B 97
(1995) 98±101.
[4] X. Turrillas, P. Barnes, D. Gascoigne, J.Z. Turner, S.L. Jones, C.J.
Pygall, C.F. Pygall, A.J. Dent, Synchrotron-related studies on the
dynamic and structural aspects of zirconia synthesis for ceramic and
catalytic applications, Radiat Phys Chem 45 (1995) 491±508.
[5] P. Barnes, X. Turrillas, A.C. Jupe, S.L. Colston, D. O'Connor, R.J.
Livesey, P. Livesey, C. Hall, D. Bates, R. Dennis, Applied crystal-
lography solutions to problems in industrial solid state chemistry: case
examples with ceramics, cements and zeolites, J Chem Soc, Faraday
Trans 92 (1996) 2187± 2196.
[6] S.L. Colston, S.D.M. Jacques, P. Barnes, A.C. Jupe, C. Hall, In-situ
hydration studies using multi-angle energy-dispersive diffraction, J
Synchrotron Radiat 5 (1998) 112± 117.
[7] L. Bailey, E. Boek, S. Jacques, T. Boassen, O. Selle, J.-F. Argillier, D.
Longeron, Particulate invasion from drilling fluids, Soc Pet Eng Paper
No. 54762, 1999, pp. 471±480.
[8] D. Hausermann, P. Barnes, Energy-dispersive diffraction with syn-
chrotron radiation: Optimisation of the technique for dynamic studies
of transformations, Phase Transitions 39 (1992) 99± 115.
[9] R.A. Livingston, M.H. Manghnani, B.A. Clark, E.-S. Ramadan, Mi-
crostructural characterization of ettringite-associated damage in con-
crete, Abstr Am Ceram 1999 Annu Meet (1999) 350.
[10] E. Grabowski, E. Czamecki, J.E. Gillott, C.R. Duggan, J.F. Scott,
Rapid test of concrete expansivity due to internal sulfate attack,
ACI Mater J 89 (1992) 469±480.
[11] A.O.A. Ramadan, Development of a modified expansion test method
for evaluating the potential for concrete DEF, PhD Thesis, Civil En-
gineering Department, University of Maryland, 1999, unpublished.
C. Hall et al. / Cement and Concrete Research 30 (2000) 491±495 495


![Gamma-Ray Emission Computed Tomographic Image ... · disposal [1]. The combination of Transmission Computed Tomography (TCT) with Emission Computed Tomography (ECT) is used in non-destructive](https://img.pdfslide.us/doc/110x75/5f3bcd0219f7ef6e106afdb8/gamma-ray-emission-computed-tomographic-image-disposal-1-the-combination.jpg)