Embed Size (px)
DESCRIPTION
1 Wilder, J. Welles (June 1978). New Concepts in Technical Trading Systems 2 See when there was no trend – 18 August 2010 Saeed Amen Figure 1: EURUSD Parabolic SAR 13 JULY 2011 This report can be accessed electronically via: www.nomura.com/research or on Bloomberg (NSI) With special thanks to Jordan Rochester for his considerable contribution to this report. Source: Nomura +44 20 7103 7119 See Disclosure Appendix A1 for the Analyst Certification and Other Important Disclosures 55D SMA 1.39
Citation preview
MGM Mirage Credit Research | United States FX Quant Insights FX Research and Strategy
Nomura International Plc.
See Disclosure Appendix A1 for the Analyst Certification and Other Important Disclosures
1 3 J U L Y 2 0 1 1
Contributing Research Analyst
Saeed Amen +44 20 7103 7119 [email protected]
This report can be accessed electronically via: www.nomura.com/research or on Bloomberg (NSI)
With special thanks to Jordan Rochester for his considerable contribution to this report.
SAR: Trading your Wilder side
In this article, we examine trading J. Welles Wilder’s Parabolic SAR indicator1 and
whether combining this with a trend indicator improves the results. We find this
approach is profitable overall when our trend following Gradient Model from
previous work2 and the Parabolic SAR are combined together. Our final model has
an information ratio of 1.00 with a return of 1.29% since 2002.
Introduction
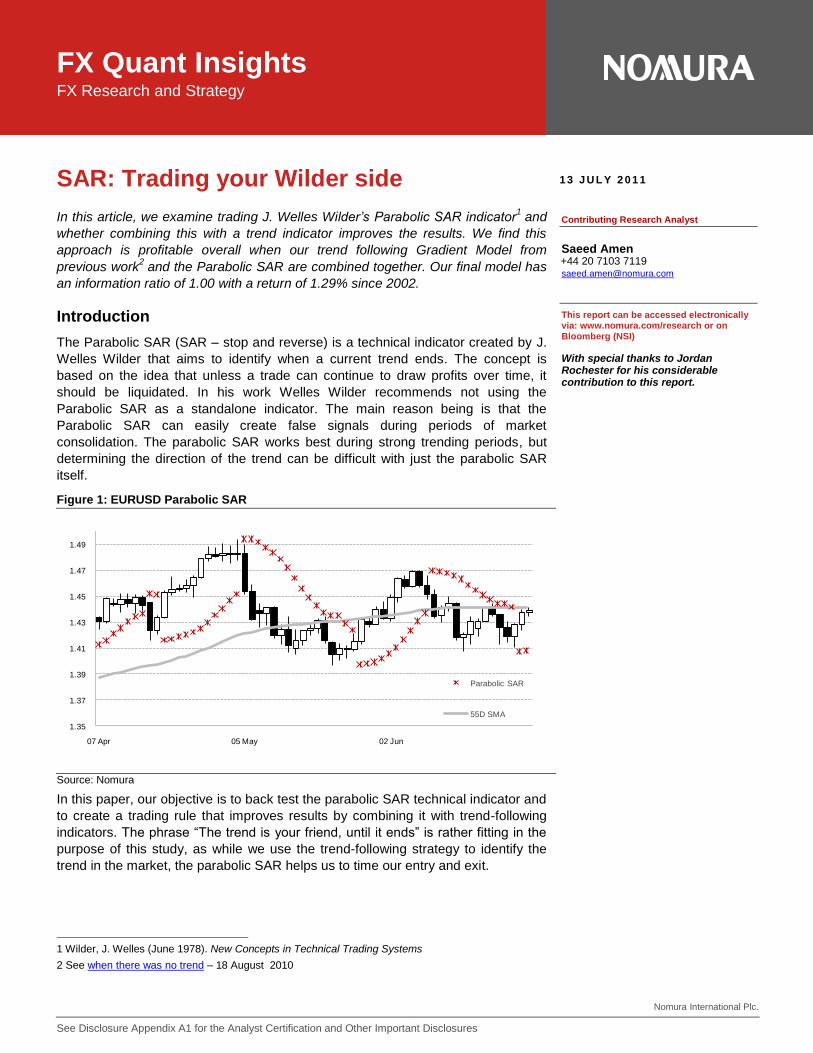
The Parabolic SAR (SAR – stop and reverse) is a technical indicator created by J.
Welles Wilder that aims to identify when a current trend ends. The concept is
based on the idea that unless a trade can continue to draw profits over time, it
should be liquidated. In his work Welles Wilder recommends not using the
Parabolic SAR as a standalone indicator. The main reason being is that the
Parabolic SAR can easily create false signals during periods of market
consolidation. The parabolic SAR works best during strong trending periods, but
determining the direction of the trend can be difficult with just the parabolic SAR
itself.
Figure 1: EURUSD Parabolic SAR
Source: Nomura
In this paper, our objective is to back test the parabolic SAR technical indicator and
to create a trading rule that improves results by combining it with trend-following
indicators. The phrase “The trend is your friend, until it ends” is rather fitting in the
purpose of this study, as while we use the trend-following strategy to identify the
trend in the market, the parabolic SAR helps us to time our entry and exit.
1 Wilder, J. Welles (June 1978). New Concepts in Technical Trading Systems
2 See when there was no trend – 18 August 2010
1.35
1.37
1.39
1.41
1.43
1.45
1.47
1.49
07 Apr 05 May 02 Jun
Parabolic SAR
55D SMA
Nomura | FX Quant Insights 13 July 2011
2
Figure 2: Parabolic SAR Formula
and represent the next and current period SAR values respectively Is the extreme point, it represents the highest level reached in the current uptrend or lowest level reached during the current down trend. is the acceleration factor, usually set to a value of 0.02 and increased by 0.02 each time a new EP is reached but capped at a maximum of 0.20
Source: Nomura
Original Parabolic SAR trading rule
The Parabolic SAR is a relatively straightforward trading rule, where you are long
or short, that is you are never out of the market:
Buy spot, when spot is above parabolic SAR
Sell spot, when spot is below parabolic SAR
The signal flips when the current period‟s high/low breaks above/below the
current value of SAR.
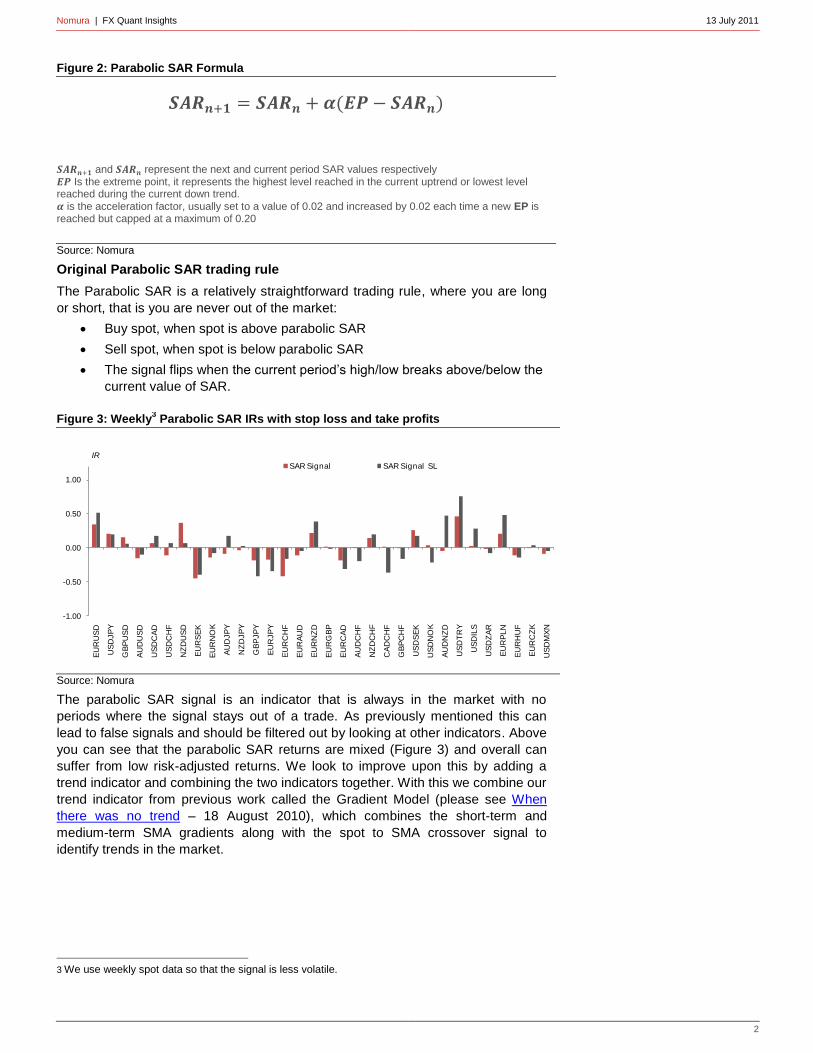
The parabolic SAR signal is an indicator that is always in the market with no
periods where the signal stays out of a trade. As previously mentioned this can
lead to false signals and should be filtered out by looking at other indicators. Above
you can see that the parabolic SAR returns are mixed (Figure 3) and overall can
suffer from low risk-adjusted returns. We look to improve upon this by adding a
trend indicator and combining the two indicators together. With this we combine our
trend indicator from previous work called the Gradient Model (please see When
there was no trend – 18 August 2010), which combines the short-term and
medium-term SMA gradients along with the spot to SMA crossover signal to
identify trends in the market.
3 We use weekly spot data so that the signal is less volatile.
Figure 3: Weekly3 Parabolic SAR IRs with stop loss and take profits
Source: Nomura
-1.00
-0.50
0.00
0.50
1.00
EU
RU
SD
US
DJP
Y
GB
PU
SD
AU
DU
SD
US
DC
AD
US
DC
HF
NZ
DU
SD
EU
RS
EK
EU
RN
OK
AU
DJP
Y
NZ
DJP
Y
GB
PJP
Y
EU
RJP
Y
EU
RC
HF
EU
RA
UD
EU
RN
ZD
EU
RG
BP
EU
RC
AD
AU
DC
HF
NZ
DC
HF
CA
DC
HF
GB
PC
HF
US
DS
EK
US
DN
OK
AU
DN
ZD
US
DT
RY
US
DIL
S
US
DZ
AR
EU
RP
LN
EU
RH
UF
EU
RC
ZK
US
DM
XN
SAR Signal SAR Signal SL
IR
Nomura | FX Quant Insights 13 July 2011
3
Gradient Model trading rule
The Gradient Model rule:
Buy spot when short-term and medium-term SMA gradients are sloping
upwards and spot is greater than medium-term SMA
Sell spot when short-term and medium-term SMA gradients are sloping
downwards and spot is less than medium-term SMA
Go flat when all three indicators are not aligned in the same direction.
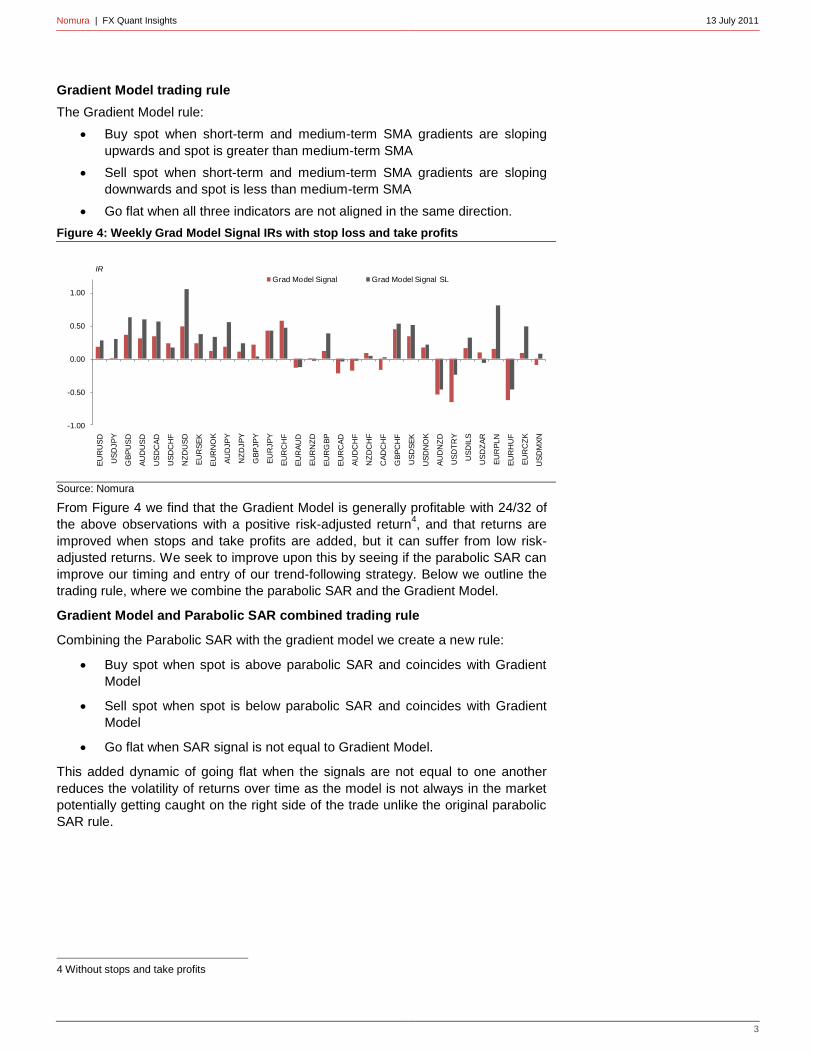
Figure 4: Weekly Grad Model Signal IRs with stop loss and take profits
Source: Nomura
From Figure 4 we find that the Gradient Model is generally profitable with 24/32 of
the above observations with a positive risk-adjusted return4, and that returns are
improved when stops and take profits are added, but it can suffer from low risk-
adjusted returns. We seek to improve upon this by seeing if the parabolic SAR can
improve our timing and entry of our trend-following strategy. Below we outline the
trading rule, where we combine the parabolic SAR and the Gradient Model.
Gradient Model and Parabolic SAR combined trading rule
Combining the Parabolic SAR with the gradient model we create a new rule:
Buy spot when spot is above parabolic SAR and coincides with Gradient
Model
Sell spot when spot is below parabolic SAR and coincides with Gradient
Model
Go flat when SAR signal is not equal to Gradient Model.
This added dynamic of going flat when the signals are not equal to one another
reduces the volatility of returns over time as the model is not always in the market
potentially getting caught on the right side of the trade unlike the original parabolic
SAR rule.
4 Without stops and take profits
-1.00
-0.50
0.00
0.50
1.00
EU
RU
SD
US
DJP
Y
GB
PU
SD
AU
DU
SD
US
DC
AD
US
DC
HF
NZ
DU
SD
EU
RS
EK
EU
RN
OK
AU
DJP
Y
NZ
DJP
Y
GB
PJP
Y
EU
RJP
Y
EU
RC
HF
EU
RA
UD
EU
RN
ZD
EU
RG
BP
EU
RC
AD
AU
DC
HF
NZ
DC
HF
CA
DC
HF
GB
PC
HF
US
DS
EK
US
DN
OK
AU
DN
ZD
US
DT
RY
US
DIL
S
US
DZ
AR
EU
RP
LN
EU
RH
UF
EU
RC
ZK
US
DM
XN
Grad Model Signal Grad Model Signal SL
IR
Nomura | FX Quant Insights 13 July 2011
4
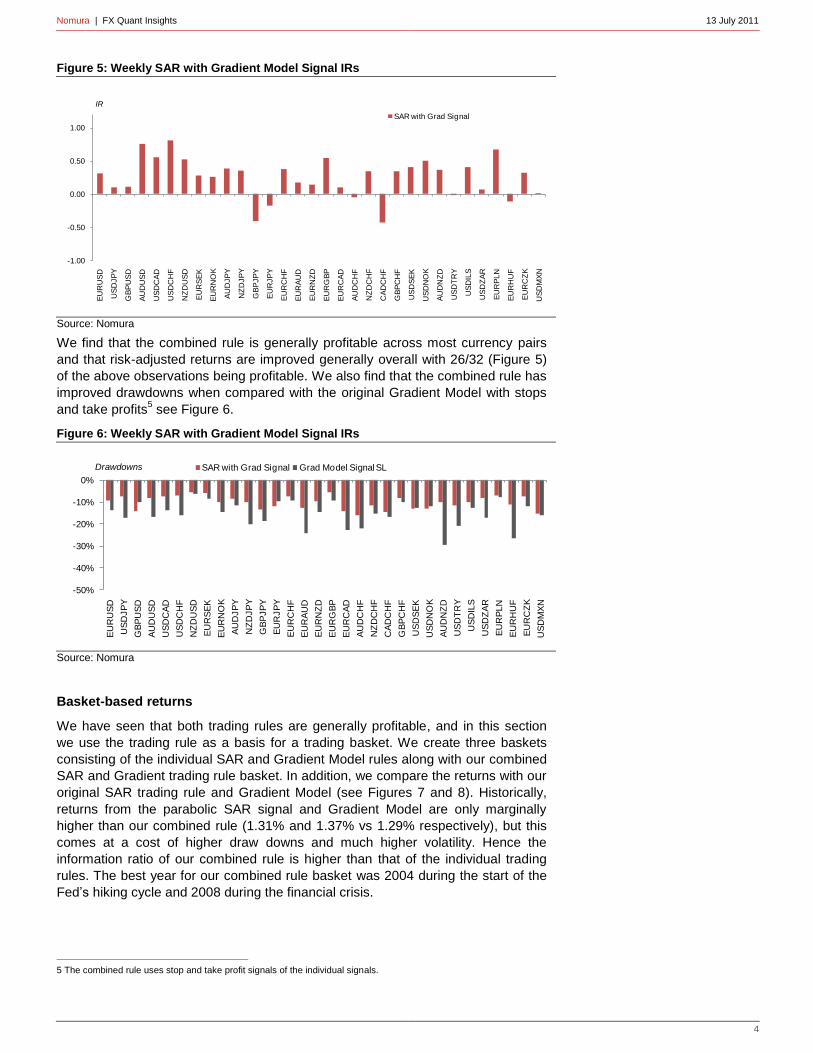
Figure 5: Weekly SAR with Gradient Model Signal IRs
Source: Nomura
We find that the combined rule is generally profitable across most currency pairs
and that risk-adjusted returns are improved generally overall with 26/32 (Figure 5)
of the above observations being profitable. We also find that the combined rule has
improved drawdowns when compared with the original Gradient Model with stops
and take profits5 see Figure 6.
Figure 6: Weekly SAR with Gradient Model Signal IRs
Source: Nomura
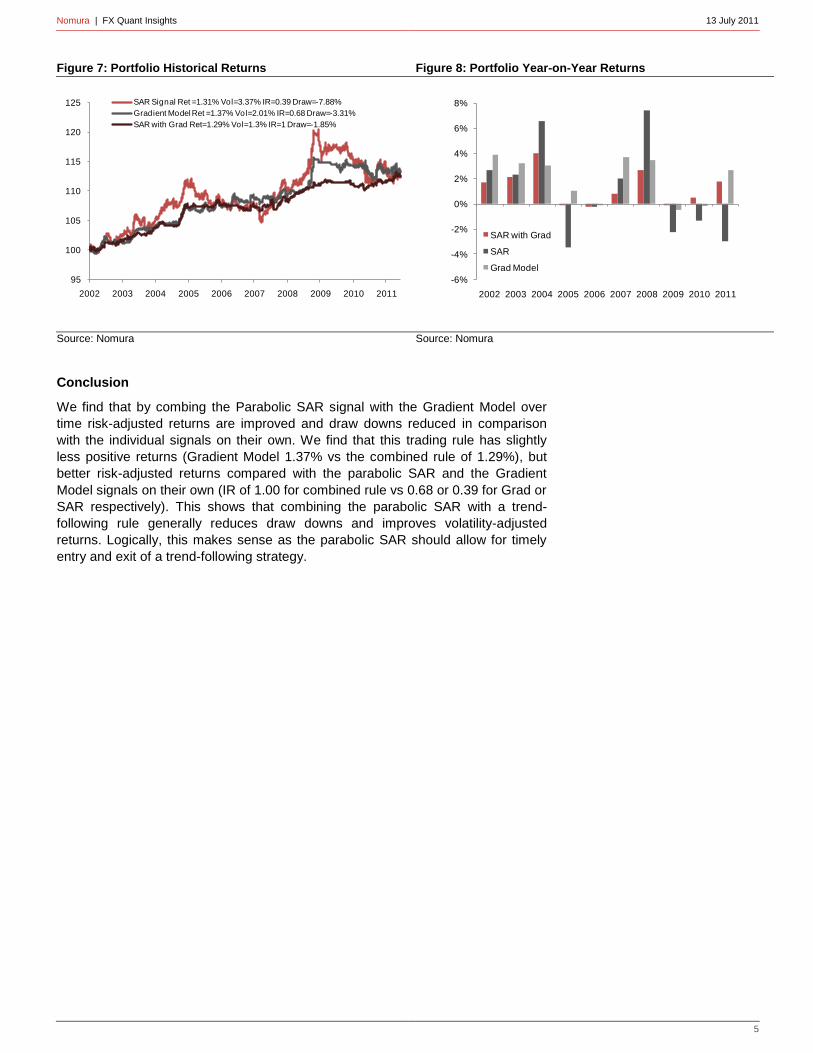
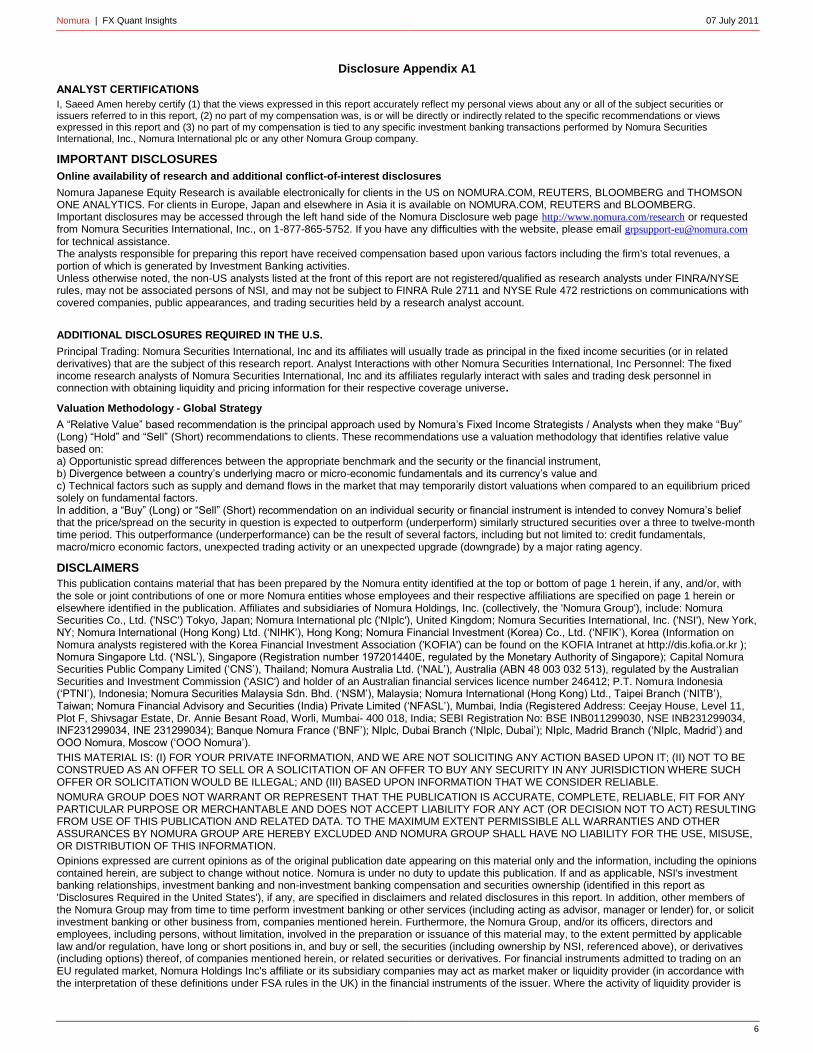
Basket-based returns
We have seen that both trading rules are generally profitable, and in this section
we use the trading rule as a basis for a trading basket. We create three baskets
consisting of the individual SAR and Gradient Model rules along with our combined
SAR and Gradient trading rule basket. In addition, we compare the returns with our
original SAR trading rule and Gradient Model (see Figures 7 and 8). Historically,
returns from the parabolic SAR signal and Gradient Model are only marginally
higher than our combined rule (1.31% and 1.37% vs 1.29% respectively), but this
comes at a cost of higher draw downs and much higher volatility. Hence the
information ratio of our combined rule is higher than that of the individual trading
rules. The best year for our combined rule basket was 2004 during the start of the
Fed‟s hiking cycle and 2008 during the financial crisis.
5 The combined rule uses stop and take profit signals of the individual signals.
-1.00
-0.50
0.00
0.50
1.00
EU
RU
SD
US
DJP
Y
GB
PU
SD
AU
DU
SD
US
DC
AD
US
DC
HF
NZ
DU
SD
EU
RS
EK
EU
RN
OK
AU
DJP
Y
NZ
DJP
Y
GB
PJP
Y
EU
RJP
Y
EU
RC
HF
EU
RA
UD
EU
RN
ZD
EU
RG
BP
EU
RC
AD
AU
DC
HF
NZ
DC
HF
CA
DC
HF
GB
PC
HF
US
DS
EK
US
DN
OK
AU
DN
ZD
US
DT
RY
US
DIL
S
US
DZ
AR
EU
RP
LN
EU
RH
UF
EU
RC
ZK
US
DM
XN
SAR with Grad Signal
IR
-50%
-40%
-30%
-20%
-10%
0%
EU
RU
SD
US
DJP
Y
GB
PU
SD
AU
DU
SD
US
DC
AD
US
DC
HF
NZ
DU
SD
EU
RS
EK
EU
RN
OK
AU
DJP
Y
NZ
DJP
Y
GB
PJP
Y
EU
RJP
Y
EU
RC
HF
EU
RA
UD
EU
RN
ZD
EU
RG
BP
EU
RC
AD
AU
DC
HF
NZ
DC
HF
CA
DC
HF
GB
PC
HF
US
DS
EK
US
DN
OK
AU
DN
ZD
US
DT
RY
US
DIL
S
US
DZ
AR
EU
RP
LN
EU
RH
UF
EU
RC
ZK
US
DM
XN
SAR with Grad Signal Grad Model Signal SLDrawdowns
Nomura | FX Quant Insights 13 July 2011
5
Figure 7: Portfolio Historical Returns Figure 8: Portfolio Year-on-Year Returns
Source: Nomura Source: Nomura
Conclusion
We find that by combing the Parabolic SAR signal with the Gradient Model over
time risk-adjusted returns are improved and draw downs reduced in comparison
with the individual signals on their own. We find that this trading rule has slightly
less positive returns (Gradient Model 1.37% vs the combined rule of 1.29%), but
better risk-adjusted returns compared with the parabolic SAR and the Gradient
Model signals on their own (IR of 1.00 for combined rule vs 0.68 or 0.39 for Grad or
SAR respectively). This shows that combining the parabolic SAR with a trend-
following rule generally reduces draw downs and improves volatility-adjusted
returns. Logically, this makes sense as the parabolic SAR should allow for timely
entry and exit of a trend-following strategy.
95
100
105
110
115
120
125
2002 2003 2004 2005 2006 2007 2008 2009 2010 2011
SAR Signal Ret =1.31% Vol=3.37% IR=0.39 Draw=-7.88%
Gradient Model Ret =1.37% Vol=2.01% IR=0.68 Draw=-3.31%
SAR with Grad Ret=1.29% Vol=1.3% IR=1 Draw=-1.85%
-6%
-4%
-2%
0%
2%
4%
6%
8%
2002 2003 2004 2005 2006 2007 2008 2009 2010 2011
SAR with Grad
SAR
Grad Model
Nomura | FX Quant Insights 07 July 2011
6
Disclosure Appendix A1
ANALYST CERTIFICATIONS
I, Saeed Amen hereby certify (1) that the views expressed in this report accurately reflect my personal views about any or all of the subject securities or issuers referred to in this report, (2) no part of my compensation was, is or will be directly or indirectly related to the specific recommendations or views expressed in this report and (3) no part of my compensation is tied to any specific investment banking transactions performed by Nomura Securities International, Inc., Nomura International plc or any other Nomura Group company.
IMPORTANT DISCLOSURES
Online availability of research and additional conflict-of-interest disclosures
Nomura Japanese Equity Research is available electronically for clients in the US on NOMURA.COM, REUTERS, BLOOMBERG and THOMSON ONE ANALYTICS. For clients in Europe, Japan and elsewhere in Asia it is available on NOMURA.COM, REUTERS and BLOOMBERG. Important disclosures may be accessed through the left hand side of the Nomura Disclosure web page http://www.nomura.com/research or requested from Nomura Securities International, Inc., on 1-877-865-5752. If you have any difficulties with the website, please email [email protected] for technical assistance. The analysts responsible for preparing this report have received compensation based upon various factors including the firm's total revenues, a portion of which is generated by Investment Banking activities. Unless otherwise noted, the non-US analysts listed at the front of this report are not registered/qualified as research analysts under FINRA/NYSE rules, may not be associated persons of NSI, and may not be subject to FINRA Rule 2711 and NYSE Rule 472 restrictions on communications with covered companies, public appearances, and trading securities held by a research analyst account.
ADDITIONAL DISCLOSURES REQUIRED IN THE U.S.
Principal Trading: Nomura Securities International, Inc and its affiliates will usually trade as principal in the fixed income securities (or in related derivatives) that are the subject of this research report. Analyst Interactions with other Nomura Securities International, Inc Personnel: The fixed income research analysts of Nomura Securities International, Inc and its affiliates regularly interact with sales and trading desk personnel in connection with obtaining liquidity and pricing information for their respective coverage universe.
Valuation Methodology - Global Strategy
A “Relative Value” based recommendation is the principal approach used by Nomura‟s Fixed Income Strategists / Analysts when they make “Buy” (Long) “Hold” and “Sell” (Short) recommendations to clients. These recommendations use a valuation methodology that identifies relative value based on: a) Opportunistic spread differences between the appropriate benchmark and the security or the financial instrument, b) Divergence between a country‟s underlying macro or micro-economic fundamentals and its currency‟s value and c) Technical factors such as supply and demand flows in the market that may temporarily distort valuations when compared to an equilibrium priced solely on fundamental factors. In addition, a “Buy” (Long) or “Sell” (Short) recommendation on an individual security or financial instrument is intended to convey Nomura‟s belief that the price/spread on the security in question is expected to outperform (underperform) similarly structured securities over a three to twelve-month time period. This outperformance (underperformance) can be the result of several factors, including but not limited to: credit fundamentals, macro/micro economic factors, unexpected trading activity or an unexpected upgrade (downgrade) by a major rating agency.
DISCLAIMERS
This publication contains material that has been prepared by the Nomura entity identified at the top or bottom of page 1 herein, if any, and/or, with the sole or joint contributions of one or more Nomura entities whose employees and their respective affiliations are specified on page 1 herein or elsewhere identified in the publication. Affiliates and subsidiaries of Nomura Holdings, Inc. (collectively, the 'Nomura Group'), include: Nomura Securities Co., Ltd. ('NSC') Tokyo, Japan; Nomura International plc ('NIplc'), United Kingdom; Nomura Securities International, Inc. ('NSI'), New York, NY; Nomura International (Hong Kong) Ltd. („NIHK‟), Hong Kong; Nomura Financial Investment (Korea) Co., Ltd. („NFIK‟), Korea (Information on Nomura analysts registered with the Korea Financial Investment Association ('KOFIA') can be found on the KOFIA Intranet at http://dis.kofia.or.kr ); Nomura Singapore Ltd. („NSL‟), Singapore (Registration number 197201440E, regulated by the Monetary Authority of Singapore); Capital Nomura Securities Public Company Limited („CNS‟), Thailand; Nomura Australia Ltd. („NAL‟), Australia (ABN 48 003 032 513), regulated by the Australian Securities and Investment Commission ('ASIC') and holder of an Australian financial services licence number 246412; P.T. Nomura Indonesia („PTNI‟), Indonesia; Nomura Securities Malaysia Sdn. Bhd. („NSM‟), Malaysia; Nomura International (Hong Kong) Ltd., Taipei Branch („NITB‟), Taiwan; Nomura Financial Advisory and Securities (India) Private Limited („NFASL‟), Mumbai, India (Registered Address: Ceejay House, Level 11, Plot F, Shivsagar Estate, Dr. Annie Besant Road, Worli, Mumbai- 400 018, India; SEBI Registration No: BSE INB011299030, NSE INB231299034, INF231299034, INE 231299034); Banque Nomura France („BNF‟); NIplc, Dubai Branch („NIplc, Dubai‟); NIplc, Madrid Branch („NIplc, Madrid‟) and OOO Nomura, Moscow („OOO Nomura‟).
THIS MATERIAL IS: (I) FOR YOUR PRIVATE INFORMATION, AND WE ARE NOT SOLICITING ANY ACTION BASED UPON IT; (II) NOT TO BE CONSTRUED AS AN OFFER TO SELL OR A SOLICITATION OF AN OFFER TO BUY ANY SECURITY IN ANY JURISDICTION WHERE SUCH OFFER OR SOLICITATION WOULD BE ILLEGAL; AND (III) BASED UPON INFORMATION THAT WE CONSIDER RELIABLE.
NOMURA GROUP DOES NOT WARRANT OR REPRESENT THAT THE PUBLICATION IS ACCURATE, COMPLETE, RELIABLE, FIT FOR ANY PARTICULAR PURPOSE OR MERCHANTABLE AND DOES NOT ACCEPT LIABILITY FOR ANY ACT (OR DECISION NOT TO ACT) RESULTING FROM USE OF THIS PUBLICATION AND RELATED DATA. TO THE MAXIMUM EXTENT PERMISSIBLE ALL WARRANTIES AND OTHER ASSURANCES BY NOMURA GROUP ARE HEREBY EXCLUDED AND NOMURA GROUP SHALL HAVE NO LIABILITY FOR THE USE, MISUSE, OR DISTRIBUTION OF THIS INFORMATION.
Opinions expressed are current opinions as of the original publication date appearing on this material only and the information, including the opinions contained herein, are subject to change without notice. Nomura is under no duty to update this publication. If and as applicable, NSI's investment banking relationships, investment banking and non-investment banking compensation and securities ownership (identified in this report as 'Disclosures Required in the United States'), if any, are specified in disclaimers and related disclosures in this report. In addition, other members of the Nomura Group may from time to time perform investment banking or other services (including acting as advisor, manager or lender) for, or solicit investment banking or other business from, companies mentioned herein. Furthermore, the Nomura Group, and/or its officers, directors and employees, including persons, without limitation, involved in the preparation or issuance of this material may, to the extent permitted by applicable law and/or regulation, have long or short positions in, and buy or sell, the securities (including ownership by NSI, referenced above), or derivatives (including options) thereof, of companies mentioned herein, or related securities or derivatives. For financial instruments admitted to trading on an EU regulated market, Nomura Holdings Inc's affiliate or its subsidiary companies may act as market maker or liquidity provider (in accordance with the interpretation of these definitions under FSA rules in the UK) in the financial instruments of the issuer. Where the activity of liquidity provider is
Nomura | FX Quant Insights 13 July 2011
7
carried out in accordance with the definition given to it by specific laws and regulations of other EU jurisdictions, this will be separately disclosed within this report. Furthermore, the Nomura Group may buy and sell certain of the securities of companies mentioned herein, as agent for its clients.
Investors should consider this report as only a single factor in making their investment decision and, as such, the report should not be viewed as identifying or suggesting all risks, direct or indirect, that may be associated with any investment decision. Please see the further disclaimers in the disclosure information on companies covered by Nomura analysts available at www.nomura.com/research under the 'Disclosure' tab. Nomura Group produces a number of different types of research product including, among others, fundamental analysis, quantitative analysis and short term trading ideas; recommendations contained in one type of research product may differ from recommendations contained in other types of research product, whether as a result of differing time horizons, methodologies or otherwise; it is possible that individual employees of Nomura may have different perspectives to this publication.
NSC and other non-US members of the Nomura Group (i.e. excluding NSI), their officers, directors and employees may, to the extent it relates to non-US issuers and is permitted by applicable law, have acted upon or used this material prior to, or immediately following, its publication.
Foreign-currency-denominated securities are subject to fluctuations in exchange rates that could have an adverse effect on the value or price of, or income derived from, the investment. In addition, investors in securities such as ADRs, the values of which are influenced by foreign currencies, effectively assume currency risk.
The securities described herein may not have been registered under the US Securities Act of 1933, and, in such case, may not be offered or sold in the United States or to US persons unless they have been registered under such Act, or except in compliance with an exemption from the registration requirements of such Act. Unless governing law permits otherwise, you must contact a Nomura entity in your home jurisdiction if you want to use our services in effecting a transaction in the securities mentioned in this material.
This publication has been approved for distribution in the United Kingdom and European Union as investment research by NIplc, which is authorized and regulated by the UK Financial Services Authority ('FSA') and is a member of the London Stock Exchange. It does not constitute a personal recommendation, as defined by the FSA, or take into account the particular investment objectives, financial situations, or needs of individual investors. It is intended only for investors who are 'eligible counterparties' or 'professional clients' as defined by the FSA, and may not, therefore, be redistributed to retail clients as defined by the FSA. This publication may be distributed in Germany via Nomura Bank (Deutschland) GmbH, which is authorized and regulated in Germany by the Federal Financial Supervisory Authority ('BaFin'). This publication has been approved by NIHK, which is regulated by the Hong Kong Securities and Futures Commission, for distribution in Hong Kong by NIHK. This publication has been approved for distribution in Australia by NAL, which is authorized and regulated in Australia by the ASIC. This publication has also been approved for distribution in Malaysia by NSM. In Singapore, this publication has been distributed by NSL. NSL accepts legal responsibility for the content of this publication, where it concerns securities, futures and foreign exchange, issued by their foreign affiliates in respect of recipients who are not accredited, expert or institutional investors as defined by the Securities and Futures Act (Chapter 289). Recipients of this publication should contact NSL in respect of matters arising from, or in connection with, this publication. Unless prohibited by the provisions of Regulation S of the U.S. Securities Act of 1933, this material is distributed in the United States, by NSI, a US-registered broker-dealer, which accepts responsibility for its contents in accordance with the provisions of Rule 15a-6, under the US Securities Exchange Act of 1934.
This publication has not been approved for distribution in the Kingdom of Saudi Arabia or to clients other than 'professional clients' in the United Arab Emirates by Nomura Saudi Arabia, NIplc or any other member of the Nomura Group, as the case may be. Neither this publication nor any copy thereof may be taken or transmitted or distributed, directly or indirectly, by any person other than those authorised to do so into the Kingdom of Saudi Arabia or in the United Arab Emirates or to any person located in the Kingdom of Saudi Arabia or to clients other than 'professional clients' in the United Arab Emirates. By accepting to receive this publication, you represent that you are not located in the Kingdom of Saudi Arabia or that you are a 'professional client' in the United Arab Emirates and agree to comply with these restrictions. Any failure to comply with these restrictions may constitute a violation of the laws of the Kingdom of Saudi Arabia or the United Arab Emirates.
No part of this material may be (i) copied, photocopied, or duplicated in any form, by any means; or (ii) redistributed without the prior written consent of the Nomura Group member identified in the banner on page 1 of this report. Further information on any of the securities mentioned herein may be obtained upon request. If this publication has been distributed by electronic transmission, such as e-mail, then such transmission cannot be guaranteed to be secure or error-free as information could be intercepted, corrupted, lost, destroyed, arrive late or incomplete, or contain viruses. The sender therefore does not accept liability for any errors or omissions in the contents of this publication, which may arise as a result of electronic transmission. If verification is required, please request a hard-copy version.
Additional information available upon request.
NIPlc and other Nomura Group entities manage conflicts identified through the following: their Chinese Wall, confidentiality and independence policies, maintenance of a Stop List and a Watch List, personal account dealing rules, policies and procedures for managing conflicts of interest arising from the allocation and pricing of securities and impartial investment research and disclosure to clients via client documentation.
Disclosure information is available at the Nomura Disclosure web page:
http://www.nomura.com/research/pages/disclosures/disclosures.aspx
Nomura International plc. Tel: +44 20 7102 1000
1 Angel Lane, London EC4R 3AB
Caring for the environment: to receive only the electronic versions of our research, please contact your sales representative.