Embed Size (px)
Citation preview

M F R PAPER 11 86
Nominal Catch-Per-Unit Effort of Albacore , Thunnus a/a/unga (Bonnaterre), Caught by U.S. Jig Vessels Durin g 1961-70
R. MICHAEL LAURS , HAROLD B . CLE MENS , and LARRY H. HREHA
ABSTRACT -Catch-per-unit effort data by time-area strata for the albacore , Thunnus alalunga (Bonnaterre). fishery off the west coast of North America are presented for the years 1961-70. Results indicate that while the fishery may range from central Baja California, Mexico, to British Columbia, Canada , it is usually not continuous over this range, but rather is centered in more restricted regions in a given fishing season . Marked annual latitudinal variations in the fishery were apparent with the fishery mainly located in " southern " waters from central Baja California to San Francisco during 1961 -65 and in " northern " waters off the Pacific Northwest during 1966-70. Very little variation among years in the offshore distribution of the fishery was indicated, and for the most part it was restricted to within 200-250 miles of the shore with highest catch rates frequently made within 1 00 miles of the coast. During "southern" fishery years, catch rates indicative of commercial concentrations of albacore were generally made 2-4 weeks earlier, during mid-June to early July, than during " northern " fishery years . Differences in the pattern of the seasonal distribution of the fishery were also apparent between "southern " and "northern" fishery years .
A twofold variation was observed in the estimates of annual catch-per-unit effort over the 10-year period; however, relatively high catch rates with little vanation were observed during the later years. 1967-70. During all of the years the concentration index was greater than 1.0, indicating that fishers tended to concentrate their effort in areas or periods where or when the average catch
per-unit effort was high .
INTRODUCTION
atch-per -uni t effort data by timearea strata are presented for the albacore, Thunnus alalunga (Bonneterre), fi shery off the west coast of
orth America. They were collected by individual State and then merged and standardi zed. The results are unique in that t hey make availab le. for the fir t time, estimates of standardized catch-per-unit effort for the ent ire range of the fi shery. This has been made po ible by the cooperation
R. Michael Laurs is with the Southwest Fisheries Center, National Marine Fisheries ServIce, NOAA. La Jolla. CA 92038. Harold B. Clemens is with the California Department of Fish and Game, Long Beach , CA 90802. Larry H. Hreha is with the FIsh Commission of Oregon, Astoria , OR 97103 .
of scient ist from the ational Oceanic a nd At mo pheric Admini t r atio n ;
ational Marine Fi herie Service; State of California Resources Agency, Department of Fish and Game; and Fi h Commission of Oregon I .
Many of the statistics for the U. S. albacore fi shery have been published separately by the individual States (C lemens. 1955 ; Ayre and Meehan, 1963; Cle men s a nd Cr aig. 1965; Meehan and Hreha. 1969; and Hreha, 1974). In t hi s paper, data coll ected by the States during t he year s 1961-70 have been combined and uniformly standardized to provide additional information about the entire range of the fi shery and to take into account any coast-wide variation in t he characteris-
'The Fi h Commis ion of Oregon has since been incorporated into t he Oregon Department of Fi h and WildliJe.
1
lies of t he fish ing vessels. of t he geographical and sea onal nature of the fishery. or of other factor which may inOu enc estimates of nominal fishin g effor t.
SO RCE OF INFORMATION
The information about catch locali lies and nominal fishing effort wa obtained from logbooks and from interviewing fis her on the waterfront. A vo lunlary logbook system has been used by the California Department of Fish and Game since 1954 (C raig, ] 963). and information from both logbooks and in terviews was available for alba ore landed in California. Infor mation for albacore landed in Oregon was availab le from interviews prior to 1967 and fro m interview and volun tary logbooks from 1967-70. The number of such record u ed for standardi zi ng the catch rates is sum marized by year and time period in Table 1. Only statist ics from albacore jig boats were dealt with because there were insufficient data from bait boat . Jig boats land approximately 75 per cent of t he annual U.S. commercial albacore catch (Clemens and Craig, ] 965). The total logged jig boat catch was roughly 30 to 40 percent of the total jig boat landings.
METHODS
Great care was taken by the individu al States to insure confidentiality of the record of individ ual fishing vessels. This was done by removing from the record the name of each vessel and any identification numbers which could be traced to it and by a igning a code number which wa kept con tant each year for a given boat.
The ba ic data included date , number of fi h caught. 10 quadrangle

Table 1.-Comblned number of logbooks and Interview records available from albacore Jig vessels for r;tandardiz d in t rms of effort of a determining standardized catch rates. 45 foot jig boat, whl h i approximal Iy
Year 1961 1962 1963
1-15 June 2 3 4 16-30 232 409 40
1-15 July 1.126 1.902 1.320 16-31 885 2.215 1,266
1-15 August 599 1,581 1,650 16-31 305 1,177 1,027
1-15 September 282 945 725 16-30 304 451 442
1-15 October 107 469 310 16-31 52 188 194
1-15 November 11 17 65 16-30 16
1-15 December 16-31
Year (season) total 3,905 9,357 7,059
within which ve sel operat d, b at lpngih. g ar typ. and often a <;urface temperatu re. ince the data were in everal form - magnetic tap , computer card , handwritten Ii ting . etc.-and in variou format. they were fir t put into a common format and on to magnetic tap . Data from individual tate wer then m rg d anrl checked by computer for duplication of record . The latter wa done by searching to c ermine if there wa more than one record , for the ame day at the arne location, of identical catches of albacore by boat of the ame length. If 0, which wa true in
only a mall number of ca e , dupli cate were omitted and a final ba ic data tape was prepared.
A modified version of the computer program FPOW (Berude and Abram-on, 1972) was used in th tandardi-
zation of the nominal fi hing effort within each year2 . The theor tical development and operating characteri tic of the FPOW program are described in Fox (1971). The ba ic model a sumed in the program i
where Gi.i is the catch of the ith [i hing treatment in thejth time-area tratum, qi is the catch ability coefficient of the ith treatment, Ii]' is the amoun t of
, tandardization procedures were carr ied out under the direction of William Fox with a si tance by T. Mulitauaopele and J . Zweifel. outhwe t f'isherie Center, ational Marine
Fisherie ervice, OAA, La Jolla, CA 9203 .
1964 1965 1966 1967 1968 1969 1970
48 3 3 16
1.328 459 226 100 2 207 274 2,075 1,303 688 811 1,260 1.646 891
1,415 1,184 760 777 1,156 1,723 1,407 867 1,001 478 751 1,131 1,171 1,049
647 871 321 487 610 556 652 754 309 278 659 656 625
462 506 246 74 495 304 381 303 386 96 78 307 381 194
197 191 33 8 41 238 91 47 29 6 8 137 28
66 4
8.041 6,684 3.166 3,367 5.669 7105 5.901
fi hing effort xp nd d by lh ith treatment in th }th tim ar a tratum, Pj i. the ave rag population iz in th j th time-ar a tratum, and eli i as umed to be a log-normally di tribut d random variabl . It i. a um d that: 1) effort i m a ur d u h that within each tr atment ql icon tanto 2) th unit of effort op rat indep ndently, and 3) ther no interaction b tween treatm nt. and tim oar a trata.
pr liminary analy i indicat d diff r nc in Ii hing power among 1) ve el length. 2) time fi hed dur ing th ea on, 3) geographic ar a of fi hing, and 4) year _ Although fi hing power in reality i probably a continuou function of ve el length, in order to e timate relative fi hing power. it i nece ary to group the data into trata uch that 1) within each clas t he
catchability may be a umed constant, 2) the probability of i olation will be minimized, and 3) ufficient data for analy i will be available in each group .
Following t hese cr iter ia, the fi hing ve el were a igned to length cia e , and a eparate cia wa e tabli hed for each 10-foot increment in length. For each ve sel length cia , catch and effor t data for each year were accumulated by 30 latitudelongit ude quadrangle and by 15-day period_ Fi hing power coefficient were t hen derived for each ve sel length cl a s_ Stati ti call y significant differences in fishing power were found among the several length classes and nominal fishing effort for all was
2
th(> m dian v . I I ngth f r the alba or jig n t.
In addili n. appar nl g ographical and asonal diff r nc s in fi<;hing pow r w r found. Paurily of lh dala n a coa. tWld ba i. pr rlud d rlgorou
stallstical analys How ver. ub j ctiv valuatIon of lh r. ull. indi rat d an apparent n d lo tralify lh fish ry in gf'ographlc ar a . 1) north and 2) Duth of lat. , o. (about an Franci co), and to lratlfy th fi hmg
a on mto 1) arly. a on on i ling of lh month Jun ,July. and Augu t, and 2) lat a on con i ting of the monlh pt mb r, Octob r, and
ov mb r. To minimiz th g ographi-al and a onal err ct in th calcula-
tion of the ov rail catch-p r-unit effort, four t of Ii hing power c fficient w r calculat d, i.e., early-north, arly - outh, lat -north, and lat - outh,
for ach ve I ize clas . The four t of f1 hing pow r co fficient for each v I ize clas ar given in Table. 2.
In ord r to xamme patial -temporal \'anation in th di tribution of th alba or fi h ry and to tudy fi h-ocean r lation hip. it wa de irabl to drive
timate of the catch -per-unit ffort n a 10 quadrangle ba i . E timate of
the mean catch-p r-unit effort were c mput d by a 15-day period and by a 10 quadrangle. applying the appropri -ate fi hing power co fficient a follow:
Wh r i = region (1 = north, 2 = outh)
j = ea on (1 = early. 2 = late)
k = ve I length cia (1 = 3D, 2 = 40 .... )
l = locality. 10 quare. Let !i.ik = fi hing power coefficient [or
kth ve el cia in ,ph t rat um Gi.ikl = catch of kth ve el clas In
l in ijth t ratum eijld = nominal effor t of kth ve el
cia in locali ty l in ijlh t ratum Cij· l = k Ci]'kl
Ei]'l = Ie ijkl Ii]'k .
Then the tandardized catch-per-unit effor t , in terms of a 45-foot jig boat for a 10 quadrangle l will be

and average catch-per-unit effort calculated from total catch and total effor t over all strata wi ll be
C/E = C .... /E. ... = Li Ij Lt Cji/ I L ;LjLlEji {'
while the average of all catch-per -unit effort for all ve el classes and timearea trata will be
C/E = L i Lj Lt Cjfl /Eiil / N,
whereN = number of trata.
The e timate of mean catch-per-unit effort by 15-day period and by 10
quadrangle are given in Figure 1 to 10. We empha ize that the catch rate pre ented in the figure are ba ed on data only from those vessels for which logbook or interview were available; howev r, we a ume they are repre-entative of the entire fleet of jig boats.
Further. we wi h to point out that 1) the catche were not evenly di -tributed within t he time period , and 2) the chool of albacore were not uniformly distributed throughout each 10 quadrangle.
RESULTS
Charts of catch-per-unit effort In
term of a 45-foot jig boat by 15-day period and 10 quadrangle are given in Figure 1-10. orne general comments will be made concerning the data given in the figure , including 1) the annual latitudinal variation in the distribution of the fishery, 2) the offshore di tribution of the fishery, and 3) the sea onal development of the fishery. A detailed analysis of the charts will not be given. Readers can draw their own conclusions depending on their In
tended use of the charts . Estimates of the mean standardized catch -per-unit effort and concentration index by years are al 0 presented .
Annual Lat it udinal Variation in the Distribut ion of the F ishery
Although the jig fishery for albacore ranged from central Baja California, Mexico, to Br itish Columbia, Canada, usua ll y it was not continuous or evenly distributed over t his area (Figs. 1-10). Instead, fishing was centered in relatively restricted regions which varied in location both wit hin and between
Table 2.- Fishing power coefficients for each vessel size class for early season north of lat. 38° N, late season north of lat.38° N, early season south of lat. 38°N, and late season south of lat. 38° N.
Vessel size class
Early Late Early Late north north south south
1961
1962
1963
1964
1965
25 35 45 55 65 75 85 95
105
25
0.572 0.622 1.000 1.000 1.000 1.000 0.574 1.891 0.986 0.733
0.807 0.695 1.078
35 0.718 1.520 0.864 0 .948 45 1 000 1.000 1.000 1.000 55 0.737 0.566 1.191 1.032 65 0.713 0.822 0.993 0.971 75 1.617 0.624 85 95
105 0.663
25 0.219 35 1.074 0.461 0.386 45 1.000 1.000 1.000 1.000 55 0.829 0.936 0.978 65 0.575 0.767 0.612 75 0.949 0.793 85 95
105 0.657 0.370
25 0.449 0.114 35 0.332 0.561 0.616 0.425 45 1.000 1.000 1.000 1.000 55 0.862 1.210 0.814 1.089 65 0.599 0.854 0.909 0.606 75 1.428 0.387 85 1.630 0 .21 7 95
105 0 .954 0.817 061 2
25 0.351 0.090 35 0.490 0.857 0.566 0.483 45 1.000 1 000 1.000 1000 55 0.667 1 243 1.032 0 .578 65 0.670 1.394 1 227 0906 75 1.001 85 95
105 0.731 2.638 0.597 0.798
sea ons. Marked annual latitudinal variation in the location of the center of the fi hery are al 0 clearly evident in t he figures . For example, during the period 1961-65 most fishing took place south of San Francisco. In t hese "southern" waters the geographic range of t he fis hery was greater and t he catch rates usually higher t han to t he north (Figs. 1-5). By 1966, however , a major part of t he fishery had shifted to "northern" waters above San Francisco, where the extent of t he fishery and the catch rates were much greater than to t he sout h-these conditions persisted t hrough 1970 (Figs. 6-10).
Annual variations in location of t he albacore fis hery have been observed over at least t he past t hree decades.
3
Vessel s ize class
Early Late Early Late north north south south
1966
1967
1968
1969
1970
25 35 45 55 65 75 85 95
105
25
0.773 1.000 0.929 1.242 1.098 0.612
0.430 0.241 0.743 0.650 1.000 1.000 1.000 1.095 0.701 1.328 0.717 1.193 0.957
0.091 0.711 0 .927
0.116 2.287
35 0.492 0.930 0.794 0.722 45 1.000 1.000 1.000 1.000 55 0.980 1.379 0.981 65 0.906 0.468 1.169 0.915 75 0.863 0.242 85 1.131 0.505 0.893 0.135 95
105
25 35 0.675 0.594 1.081 0.493 45 1.000 1.000 1.000 1.000 55 0.895 0.663 0.505 0.839 65 0.821 1.213 0.289 0.438 75 0.980 1.174 1.810 0.724 85 0.597 95 1.327
105 0.995 0.593 0.454
25 35 45 55 65 75 85 95
105
25
0.941 1.000 1.103 0.988 1.260 1.372
0.819
0.882 0.606 1.000 1.000 1.197 0.591 0.443 1 877 0.459
0.567
0.893 1.000 0.667 0.822 0.975
35 0.427 0.903 0.641 0.677 45 1.000 1.000 1.000 1.000 55 0.992 2.888 0.761 0.766 65 1.069 1.003 0.878 1.170 75 1.014 1.747 0.532 0.820 85 0.443 95
105 0.162 0.335 0.402 0.781
They are indicated in Figure 11 (from Laurs, 1971), which gives the percentage of the west coast albacore tuna catch taken north of San Francisco for the year 1938-70. According to Laurs et al. (1974) , based on unpublished work by James Renner3, these variations appear to be related to marine environmental conditions during spring months in the offs hore waters through which albacore presumably pass during their migration from the central Pacific into the west coast fishing grounds.
Variation in the location of the fishery has affected the amount of albacore landed in the individual Pacific
'Southwest fi sheries Ce oter. NMFS. NOAA. La Jolla, CA 92038. pers . commun .

Coa t tate. For example. during the 1961-65 "out hern" fi hery years. landing in California ranged from 23.22 to 48 .86 million p unds. while landings in Oregon ranged from 3.25 to 12.12 million pounds. However . during the 1966-70 "nort her n" fishe ry years. landi ng in California decre ased . ranging from 14.72 to 29.93 million pounds while landings in Oregon increa ed. ranging from 17.68 to 37.75 million pounds. Albacore landings in Wa hington also wer e highest when t he fi hery was centered to t he north (Table 3) .
The Offshore Di tribution of the Fishery
Little variation was apparent in the off hore di tribution of t he albacore fi hery (Figs. 1-10) . Most fishing occurred within 200-250 miles of shore.
r h the highest catch rate frequently made withi 100 miles of the coast. Howe\ er. there wa generally a strip of varying width along the coast which wa void of albacore catches. The \\.Idth of thl -trip wa often gr eate t off northern Cali fo rnia and Oregon where It ometimes extended 50 or more mile off hore.
According (Clemen. 19(; 1969: Flittner
to seve ral a u t hors Pearcy and Muller .
1970; Panshin. 1971 ; Laur .1973; and other ). albacore may avoid near hore waters off the coast of
orth America because water temperature there are below those con idered optimal for albacore (Laeva t u
and Ro a. 1963). The e cool coastal wat r _ re. ult from coa tal upwelling , mith. 1968) and the nearshore areas
\\ hich were devoid of albacore catche ext nded the farthe t off hore where upwelling ha been foun d to be stronge. t (Bakun, 1973).
~(>a onal D(>velopment of the Fi hery
,en ral information a bou t t he seasonal development of t he a lbacore fl hE:'r~ and it year-to-year variation l'an b obtain d [rom the chart of l'att'h per unit effort. However . ince t h 'r L a complicat(>d interplay of num rou factor (including availability of albacor, 0 io conomic. weather , (Ii' "Illographic condition. t.) that may innu nc l heat h rat , care hlluld b x rci d if the chart are
U l'd to l'\ aluat uch ent a t h
Table 3_-Amount of albacore landed by state (in millions of pounds)'.
Year
1961 1962 1963 1964 1965 1966 1967 1968 1969 1970
Calif. Oreg. Wash .
29.12 36.62 48.86 42.55 2322 1819 17.86 15.08 14.72 29.93
3.25 895
11 40 4.46
12.12 17.68 2924 37.75 29.83 21 .80
0.46 0.37 0.53 1.05 1.87 1.10 1.24 3.05 3.56 4.39
To tal
32.83 45.94 60.79 48.06 37 .21 36.97 48 .34 55.88 48.11 56.12
'Sources of information: Power (1963). Powell and Lyles (1964), Lyles (1965. 1966, 1967. 1968. 1969), U.S Department of Commerce (1971 ), and Wheeland (1972. 1973)
beginning or end of t he fishery for pecific years. within- eason vari
ations. etc . It can be een in Figures 1-10 t hat
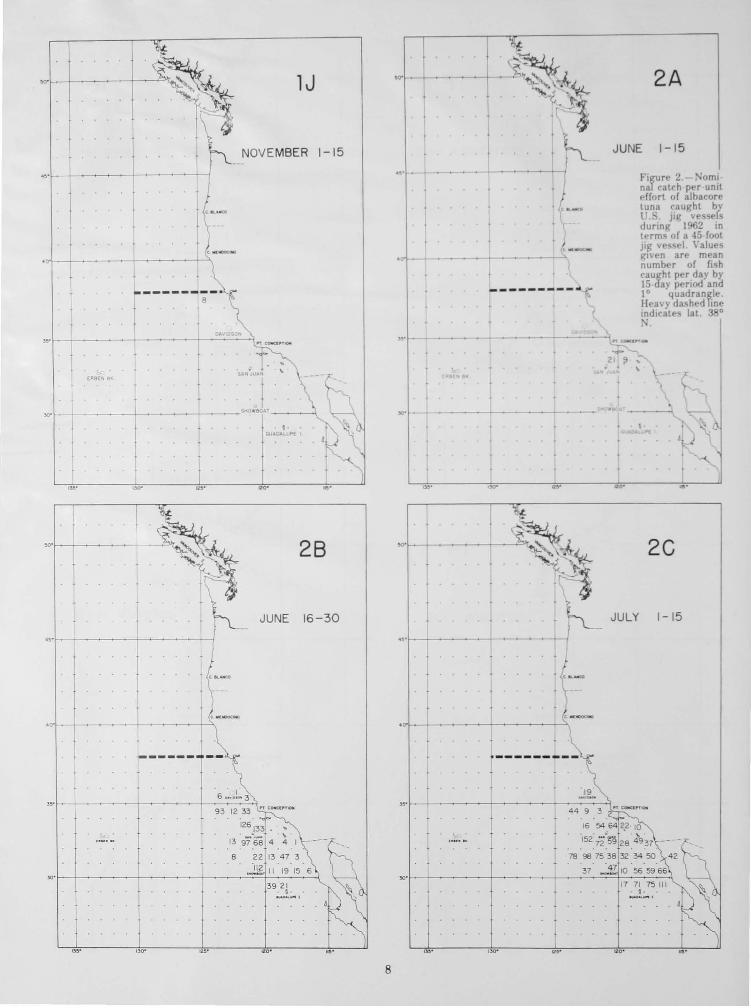
t he albacore jig fi hery is seasonal, generally lasting from July through October, alt hough orne catches were made as early as the first half of June (Fig . 2 and 3) and as late as midDecember (Fig . 10). During "southern" fi hery years , catches indicative of commercial concentrations (catch rates of about 100 fi h per day) were often made beginning in mid-June to early July (Figs. 1-5). This is about 2-4 weeks earlier than during the "northern" fi hery year when significant catches u ually were not made until after midJuly (Figs. 6-10).
There were al 0 differences in t he pat tern of t he sea onal di trib ution of t he fi hery between "southern" and "northern" fi he ry years. During most "sout hern " years a ingle fishing center was observed (Figs. 1-5). It expanded , generally moved northward, and then contracted during the fishing season. The fi shery usually began between northern Baja California and southern California, expanded northward up t he coa t during the late ummer and early fa ll month to northern Cali fornia or Oregon, and then receded out hward d uring the late fall to off central California where t he fishing season u ually ended . A different pattern was ob e r ve d during mo t "northe rn " Ii hery year (Fig. 6-10) when two widely eparated fi hing area prevai led from the beginning of the ea on t hrough the late ummer month . One of t he e area wa off the Pacific
or t hwe t and one off outhe rn Californi a. with the former occupyi ng a larger geographic area and having
4
generally higher catch rates than the latter . By early fall. the southern area had s hifted northward and the northern area sout hward. forming a single area off central California where t he fishing season usually ended in the late fall.
Annual Standardized Catch-Per-Unit Effort
Estimates of annual standardized catch-per -unit effort were derived to provide information on the trends in albacor e fi hing success. These estimates were based on data for the period 1 July to 31 October and were derived in two ways: 1) t he total catch divided by t he total standardized effort,
CPUEI = 'IC/ LI. (1)
and 2) the sum of the CPUE for each time-area stratum divided by the number of strata.
CPUE2 = ~ 'I CII (2)
where C denotes catch. I denotes nomina l standardized effor t. and n denote t he number of ti me-area strata .
E timate of t he annual standardized catch-per -unit effort based on Equations (1) and (2) above are given in Table 4 and Figure 12.
A two-fo ld vari ation in t he annual catch-per-effor t of a lbacore was observed during 1961 -70. The ratio of averages CPUE stat ist ic ranged from 69.24 to 136.99 fish per day. and the average of ratio CPUE tatistic ranged from 61.24 to 119.03 fi sh per day. Both estimates of catch-per-unit effort were relatively low in 1961 and 1964-66. and high in 1962-63 and 1967-70 (Fig. 12).
Annual Concentration Index
To obtain a measure of the extent to which the albacore jig neet has been ucce ful in concentrating nominal
effort in area where or when average catch-per-unit effor t has been high. computation were made for each year
f the concentrat ion index (G ulland, 1955). Thi index is t he ratio of the ratio of averages CPUE tati tic, Equation (1). to t he ave rage of ratios
PUE tati ti . Equation (2):

Table 4.-Annual values of standardized fishing effort , logged catch, catch-per-unit effort, and concentration index for the U.S. albacore jigfishery during 1961-70.
Concentration Year' Effort' Catch' 'CPUE, 'CPUE , index
1961 3,542.2 245,438 69.24 61 .24 1.13 1962 9,236.4 1,151 ,957 124.72 112.55 1.11 1963 5,797.7 772,474 133.24 119.03 1.12 1964 7,102.8 697,331 98.18 76.26 1.29 1965 6.042.5 547,063 90.54 63 .25 1.43 1966 3.0194 276,148 91.46 62.27 1.47 1967 3,249 9 411 ,046 12648 9014 1.40 1968 5,3227 729,165 136.99 93.97 1.46 1969 6,529.6 754 ,236 115.51 72.49 1.59 1970 5,3080 680,083 128.12 88.12 1.45
'For period 1 July to 31 October 'Standardized boat-day of logged effort 'Number of logged fish . • Ratio of averages CPUE derived uSing Equation (1) 'Average of ratios CPUE derived uSing Equat ion (2)
Ig = [IC/If] [l/nIC/f]-1. During each year the concentration
index (lg) was greater than 1.0, ranging from 1.11 to 1.59 (Table 3). The value of Jg fall into two categorie 1) one for the year of 1961-63 and 2) another for the years 1965-70. The value in the econdary category are higher than tho e in the fir t, and within each category the value are very table. These re ults indicate that 1) each year albacore fishers tended to concentrate their effort in area or period having a high average catchper-unit effort pre umably on relatively high densitie of available albacore, and 2) they were relatively more ucce sful in doing 0 during the years 1965-70 than during 1961-64.
LITERATURE CITED
mortality in commercial fi h populations. Fi h. Invest. Mini t. Agric. Fi h. Food (G.B.) er. II, 18(9). 46 p.
Hreha, L. H. 1974. Oregon albacore tuna fi hery stati tic, 1968·72. Fi h omm. Oreg .. Data Rep . 5, 120 p.
Laur., R. M. 1971. Temperate tuna forecast for 1971. Calif. Fi h Market N ws Monthly
ummary-Part 2-Fi hing Information, atl. Mar. Fi h. erv., La Jolla, Calif., May
1971, p. 1-10. _.....,..,,-,--.,.-. 1973. Requirements of fishery sci
enti ts for proce sed oceanographic mformation. Proceedings from WMO T ch. Conf., Tokyo, 2-7 October 1972. WMO 346:95-111.
Laurs, R. M., R. J . Lynn, and N. E . Clark. 1974 . Iba ore tuna foreca ling/ monitoring at the La Jolla Laboratory . Natl. Mar. Fish.
erv., Southwe t Fisheries Center, Admin. Rep . LJ -74-14, 35 p.
Laeva tu, T ., and H. Ro a , Jr . 1963. Di tribu -
lion and relative abundance of tu nas in relation to their environment. FAO Fish Rep . 6: 1835-1851.
Lyle , C. H. 1965. Fishery statistics of the United States , 1963. .S . Fi h Wildl. Serv., Stat. Dig 57, 522 p.
. 1966. Fishery statistics of the ~U;-n7:'it-ed"--;;-States, 1964. U.S. Fish Wild!. Ser v.,
Stat. Dig. 58, 541 p . ___ ...,.. 1967. Fishery statistics of t he
United States, 1965. U.S. Fish Wildl. Serv., Stat. Dig . 59, 756 p.
_-;-;--:-;--;- ' 1968. Fishery st1!tistic~ of the United States. 1966. U.S. Fish Wild!. Serv., Stat. Dig. 60, 679 p.
_-;:-:-.,.,-.,.-' 1969. Fishery statistics of the United State , 1967 . U.S. F ish Wild!. Serv., Stat. Dig. 61, 490 p.
Meehan, J. M., and L. H. Hreha . 1969. Oregon albacore tuna fi hery tatistics, 1961 -67 . Fish Comm. Oreg., Data Rep. I, 143 p.
Panshin, D. A. 1971. Albacore tuna catches in the northea t Pacific during summer 1969 as related to elected ocean condition. Ph.D. The is, Oreg. State Univ., Corvallis, 120p.
Pearcy, W. G., and J . L. Mueller. 1969. Upwelling, Colu mbia River plume and albacore tuna. Proc. ixth International Symposium on Remote Sensing of Environment, Univ. Mich .. Ann Arbor, p . 1101 -1113.
Power, E. A. 1963. Fishery tatistics of the United State, 1961. U .. Fi h Wild!. Serv., Stat. Dig . 54. 460 p.
Power, E. A., and C. H. Lyle. 1964. Fishery tati tic of the United States, 1962. U.S.
Fi h Wildl. erv., Stat. Dig. 56, 466 p. mith. R. L. 1968. Upwelling. Oceanogr . Mar . BIOI.. Annu . Rev . 6:11 -46.
U.S. Department of Commerce. 1971. Fishery tati tic of the nited State, 1968. Natl.
Mar. Fish . erv .. Stat . Dig. 62, 578 p. Wheeland, H. A. 1972. Fishery statistics of the
United States, 1969. Natl. Mar. Fish. Serv., tat . Dig. 63, 474p.
. 1973 . Fishery statistics of the --;'U'n'-;i:-te-cd"S"tates, 1970. Nat!. Mar. Fish . Serv.,
Stat. Dig. 64, 489 p.
lA
JUNE 16-30 Ayre, R. J .. and J. Meehan. 1963. Catch locality, fi hing effort, and length-frequency data for albacore tuna landea in Oregon, 1951 -60_ Fish Comm. Oreg. Invest. Rep . 2, 180 p.
"'I--+~~~~+~~---t--t Figure I.-Nominal catch-per-unit effort of albacore tuna caught by U.S. jig vessels during 1961 in terms of a 45 -foot ji!: vessel. Values given are mean number of fish caught per day by 15-day period and 10 quadrangle. Heavy dashed line indicates lat. 380
N.
Bakun, A. 1973. Coa tal upwelling indice , west coast of North Amenca, 1946-71. U .. Dep . Commer., NOAA Tech. Rep. NMFS
RF-671, 103 p. Berude, C. L .. and . J . Abramson. 1972.
Relati ve fi hing power, CDC 6600,FOR TRAN IV . Trans. Am. Fish. Soc. 101:133.
lemens, H. B. 1955. Catch localities for Pacific albacore (Thunnus germo) landed in California, 1951 through 1953. Calli. Dep. Fish Game, Fish Bull. 100, 28 p.
__ ...,..,..._. 1961. The migration, age , and growth of Pacific albacore (Thunnus germo), 1951-1958 . Calif. Dep. Fish Game, Fish Bull. ll 5, 128 p.
Clemen, H. B., and W. L . Craig. 1965. An analysis of California's albacore fishing . Calif. Dep. Fish Game, Fish Bull. 128, 301 p.
Craig, W. L. 1963. The California albacore fishery logbook system. FAO Fi h Rep . 6: 1217 ·1225.
Flittner, G. A. 1970 . Forecasting availability of albacore tuna in the eastern Pacific Ocean. In T. Laevastu and 1. Hela (editors), Fish · eries oceano~aphy, p. ll6-129. Fishing News (Books) Ltd" Lond .
Fox, W. W., Jr . 1971. User 's guide to FP£JN: A computer program for estimating relative fishing power and relative population denity by the method of ana lysis of variance.
Univ. Wash" Quant. Sci. Pap. 27, 6 p. Gulland, J. A. 1955. Estimation of growth and
5
I OAV!OSON
,,·1--+----+--~-+--'--'-'+-4
ERBEN el(
3
78946767
' 15 'ZPIl5 ' 71' "'.I--+ ____ + ____ + __ SHOW90AT ___ --\
. o· GUADALUPE.
,,,. ,zoo
18
JULY 1-15
.,.1--1------+------+-1
2 "'1--1 ______ +-_______ 4-_~o.~v~'~=·o~'~~ 92
56 101 76 83 50 77
i9i!;! 123'144 64 16 ~~-+----------+---------+------~==~~~~~ 7299
.... '30" ....
. t · (;UADAl..uPE
IZ.· MO ·
1D
AUGUST 1-15
., .. "--~----~----+---~-----~~
'" ... .-... 42 6
~.~-1-------t_------__ +_--~S=HO~W~.~o.~r-o~--------_4
,w ,... .... ,~.
6
JULY
.~.~-~----------+-------------~
t-------~~ 9091
12 49 48 ,yl--; __________ -+ __________ -r _____ --o~~3~
2 2866 7630 , .... "
58 .81.4~ 73 7 53 69 37 35
1C
16-31
~·~-+----------+----------+------~~~--2~0----~ . I·
2"
".. '30" ".. IZO·
AUGUST
6578
iI8~1·~1 4 ".r----i--------+--------4----.....!:~
7021 3
. 9 .... ..... '" .
3624
23
1E
16-31
~r-_+----------+_--------~------~==~------~
,,.. "'. IZO· 'OS·

IF
SEPTEMBER 1-15
"'f----I-~~---+_ ...... --~-+_I
.o'f-o---I'-----~+_---~-+_'\
13091
9554 90' 72'
16
OAVIDSON "'f-o---I------+_---~-+--~-_1
"CO ERBEN at<
8242
'SAN:,]
""f---I ______ +_---~-+----SHOweoAT----__\
I,.. 130' 12"
czs·
. I· GUADALUPE I.
I~ '
lH
OCTOBER 1- 15
e '
lG
SEPTEMBER 16-30
wf---;i-------t--------i--i
"
".i---I------+_---~-+----=~ 17 4288
1M' 1>0' ...
1 I
OCTOBER 16-31
"'1----1------+_-----+-1
wl--T----------+-~--~-~------~~
>o,i------------+--------~-------~~~-------4
DO'
7
lJ
NOVEMBER \-\5
"'I--t-~----+~-+-----j---j
• +
. t
.~'I--4-------t------~~
w~~---------+-------+-------~
ER8£N 81(
~~-----------t------+------
.... ozo'
28
JUNE \6-30
.,.I--t--------+--------...,..-I
• t
,..1--4-------+------+----....::...:,
,,.. 12"
93 12 33
~26 }3
13 9-;68 8 22
, 4 4
13 47 :3
...2ti; II 1915 6
3921 ~:""
ozo' '0'
8
.. ," .
"'.
• +
. . -f • .
I. ..
----------
... I--------------~---__1
. (c: -.....c:o
. j
".I--4------+------~----...:,
2A
JUNE \-\5
JULY
figurl' 2 . • 'oml naT ratrh pN unit effl)rt 1)[ albarQr!' tuna "aught by
• Jig v(' 'cis dunnK I. 2 in term 1)[ a 15 foot Jig yp ·1 \ alup j{IH'n an' mf'an numbt'r 1)[ fj~h raught p"r day by 15 day p(·nod and 10 quadrangle. Hea\ \ da hed Tine I~dlcate lat. 3 °
2C
\-\5
~.1--+----------+--------_+---~:3~7~~~~~~~
'3>' '30' ....
17 71 75 III -!;... ,
ozo · '0 '

.,-f---f--------+---+----+-J
. o-'~--f_-------+_-------~~
•• ..... 0)0055 ""I---I--I------+--------+-----""'=:-::i
53 194
.. ~ ...
,,,. '>0" ,.,-
'0-1--1--------+----''''<. ..
20
JULY 16-31
2F
AUGUST 16-31
.,-'t----f---------+_--+----~-J
~-f--T----------+_--~-----+------~~+-------_4 . ,. -_.
'''- '>0- "'- no -
9
~-'~--f_--------+_--~~~. 2E
AUGUST 1-15
.,-f_..--I__------+-------+-!
.~,~--f_-------+_---------~~
54 ""f_..-II--------+--------...L------=~
,,,. ,.,-
>0"1--1-------+----''''<. ..
109
, -_.
~o-
2G
SEPTEMBER 1- 15
.~.f_..--I__-------+---------+~
41 50
116 61 6946 30
192
~I--~--------------------------~~+-------~
"'-

2H
SEPTEMBER 16 -30
••. \----J.~--~-_+-<--~-+--+__f
26 4420
182 ,..\----J.-----_+~--~-+--__:_..;!!~
35 '47 wi--I ________ i-______ +-______ 'StiOWBOAT -----4
, " GUADALUPE
~ .. ~O·
2J
10 ·
OCTOBER 16-31
10
'o·I---l----~--~--.:.~ .. 21
OCTOBER 1-15
.,.\----1------+--<-----+-1
66
263 101 ~~ 4 166 ". 2 96 60 '" ,00;«",
~.~-L---------+--------+------~~1------~
.,.. .,.. ~,. 120·
~.~-+--------+---~~. 2K
NOVEMBER 1-15
.,.I--I-------!-------+..--/
".1---1-------1------+----..:::::.:.
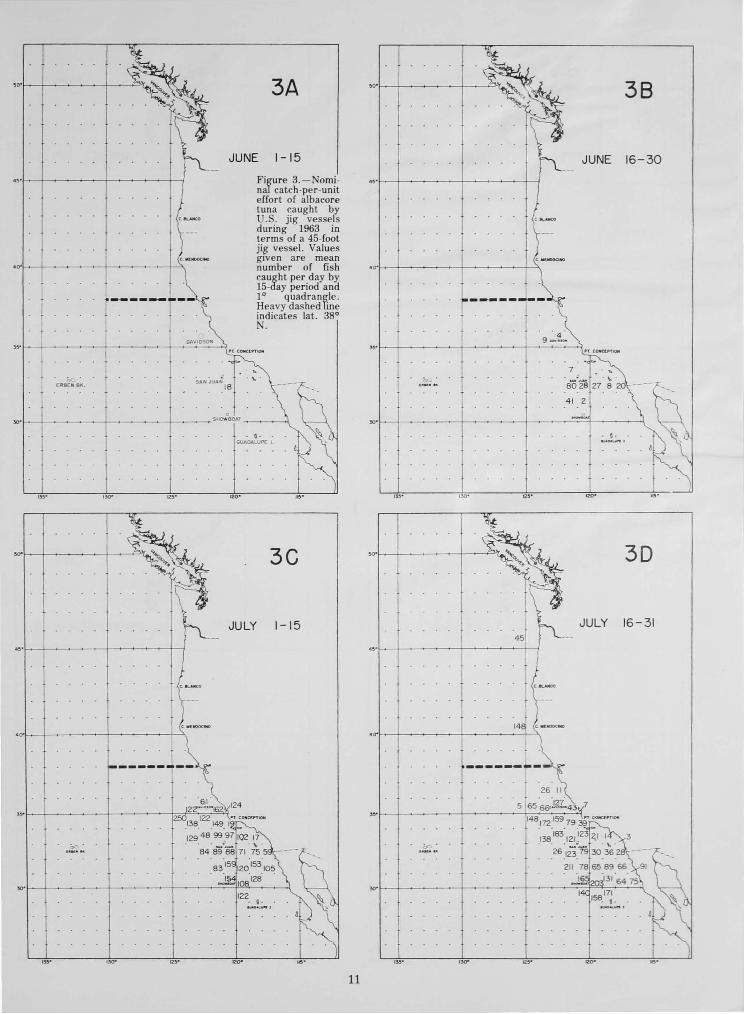
3A
JUNE 1- 15
.,. Fir;re 3.-Nomi -na catch-per-unit effort of albacore tuna caught by U.S. jig vessels during 1963 in terms of a 45-foot jii:' vesse l. Values given are mean
.0- number of fish cau~h t per day by 15- ay period and 10 quadran\1le . Heavy dashed ine indicates lat . 380
N. OJI,VIOSON ,..
"" . SAN juu~ . ~ .
f RBEN etc . IB
0
>0-SHOWBOAT
o· GUADALUPE I
'>0" .... ,~ .
3C
JU LY 1-15
11
3 8
JUNE 16 - 30
.,.
'0-
9~-,.. " COltCUllC*
7
v~ .:
41 2
0 -"'. . I· ..... -...... " 1
''''. .....
JULY
26 II
5 65 ·6&B.i.43 :7 ... f---+---~--f--~----+::-:===-'=-""-'l
W ' '>0" ....
3D
16 - 31

3E 'O'I---+_~_~_+-_ 3F
AUGUST 1-15 AUGUST 16-31
"'I-_+~--~--t-~-~---I-i
19ZtI45 .,_"" 159
21 '0'"
. .,. 14
~ ---------7
87
". ".
'" ROE , 54 210 2931
35 ~ 90122 ,.,. "'. " I "
I,., ,,.. ~O'
3G 3H
SEPTEMBER 1-15 SEPTEMBER 16- 30
100
17 ".
18416
' " .. ~ ... '"
JOe ..- _ "'. r--t--------+---~-~_+~---~~~~----_4
I,.. 1>0' I ~'
12

31
OCTOBER 1 - 15
-----i~~:1" 51
.100:~~33 OAV(J~oIN 76 9 4
85 11 5 52 CCHotUf
" fRBEN 8K 5A.N .JUAN 158 \, .
"'"f---+------f----~--+_--- SI-Iovt80.n ___ ~"'
,,,. '>0"
10 '104
. I · GUADALUPE I.
3K
,~ .
NOVEMBER 1-15
".1--+ _ ____ +_-~~-__+--·~·--.. ~~4-"8,., 48
. , .
,»" ''''. .... 'ZOO ,~ .
13
3J
OCTOBER 16 - 3 1
'>0" 125* ,,,.
3 L
NOVEMBER 16-30
0" ,..I----t------t---~--_t_---..=.,.,
"'.I--+------t----------+---~~+_------~
. o· -_.
.... ~O· ,e '

~ 4A
.'.I---+-~-~-+--+---+-~--t-t
"". . "'.
".I---+-~---+--+--+----+--f
.o·I---+-~---_l_-+-~---+-,\
JUNE 16-30
Figure 4.-Nominal catch-per-unit effort of albacore tuna caught by U. . jig ves els during 1964 in terms of a 45-foot jig vessel. Values gtven ar mean number of fish caught per day by I5-day period and 10 Quadrangle. Heavy dashed line indicates lat. 380
N.
'0·
4C
JULY 16-31
. . . .- . ~ .
17718218015559 32 1324
i84·151 ·58·36 17 ·34 ·39 45
·51 ·18~ 19 ·31 ·33 · 14 ~I---t--------+---~---+---~~+-~--~
.96.53 . o· .
161
.. w .... 14
w 48
JULY 1-15
.'.I---+---~-+-~-+----t-f
I ------j-- 12
69 3 10
16 ~I---+-------_l_------_+---~--~
10 25
9
....
77 8692 4248 . I· .
8 ~7~'fI
os·
40
AUGUST 1-15
981241
221

4E
AUGUST 16-31
"'f--t-~-~--t~---+-~-+---1 35
175
228 ,..I---t------+~-~-+-+----.2:~
23.22689 .108 .KJ? :'"" ..
37 .128.~30 10 b
43 636375 I I~ 12
140 5 115 68 58
G· 12370 -_.
,,,. '>0" ..,.. ,~ .
4G
SEPTEMBER 16-30
wl---+------t ...... - ..... -+-+-I
".1-+ __ ~~-t _____ t-___ -":""1139
230
~.I--+---------+---------1---------+------~
. G·
13'" '30" .... 15
4F
SEPTEMBER 1-15
389410244
~ - ~ -:;~ 3~ 109~7tf56 116 92 97:4~
. 151 5O •• !i.9~121 ".f--+--------t--------t--------'"
15 159 IEf COfll(:£l'flOfII
,,,. '30"
8482 . . .' SAN JUAN
7
4H
OCTOBER 1-15
".I---+-------t---~-"'O"::'+--O::':'_=_:_::'4
3
I.~IM .... :,... . 'b '
~.I--+-------+--------+----~--~-----~
. G·
'30" ...

41
OCTOBER 16 - 31
85 38 40
. [ReEN 811.
. .' . ~ .
SAN JUAN 24 26 5
~'r--r----------~~-------+------
~5'
~r--+----------+-
."r--j----------l---~----+__/
j
17 61
• G· GUADAlUPE
4K
NOVEMBER 16-30
". r---+------+-------+---=:..::.:.~~
16
4J
NOVEMBER 1- 15
.,'I----r---------+_------+-I
. o'f---I-----~--+--------+~
~,r--+---------+_-------_4------~==~------_4
13~' 12.5 0
.,'f----j----------+--------+--I
. o'f----j---------+---------+~
• G· ..... O .UI~ 1
JULY
... J" '~ \.
I~'
5A
1-15
Figure 5.-Nominal catch-per-unit effort of albacore tuna caught by U.S. jig vessels during 1965 in terms of a 45-foot jig- vesse l. Values given are mean number of fish caught per day by 15-day period and 10 quadrangle . Heavy dashed line indicates lat . 38 0
N.
2321644440407
666081 63 54
69)12513 ~'r_1-------~------~~----~~~~---4
233861 41 G·
-Q.O~_ I
13)0
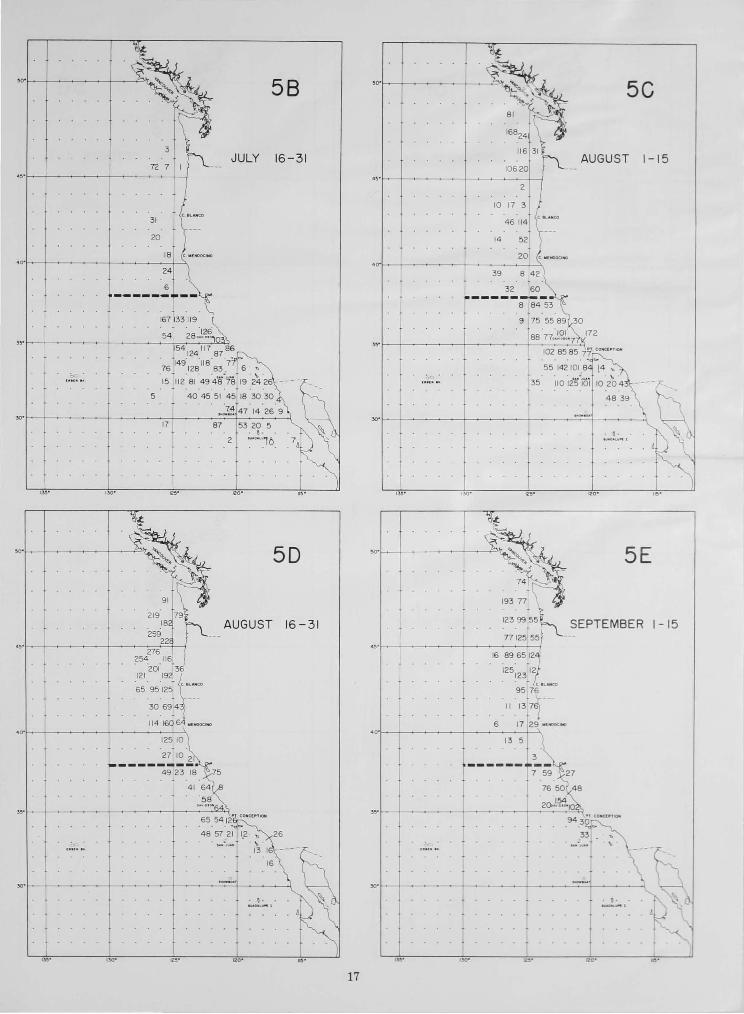
>o· I----+---~-_+--=r~ 58
JULY 16-31
".I--I------+->---~--+-I
.0·1--+-__ ~ _ _+->-----_+""""'"
54
;,c .
17
,,,. 125*
50
AUGUST 16-31
.0·1----+ _____ _+----~_+__>..
,.. 655412
co..c:(l'tlQOj
48 57 21 1.2 b 26 u . ...... . ~
13 I
16
"'. ~ .
,,,. '.10" ....
17
".I---+---~--I-------+-I
.~r--+-----_+----~_+~
8
9
5C
AUGUST 1-15
172
55 1421018
35 1I0125ioi
"'. r--+--------_+-----~_+----------_r------~
. I·
Il~ ' ''''.
'0·1--1-----_1_---='1.. 5E
SEPTEMBER 1- 15
.,.1--1-----_1_-----_+_1
II
6
.,.
"'.
,,,. ,.10" ..,. ,w

5F
SEPTEMBER 16 - 30
""
II
". .103.108.9Q ~o .. C["~
93 55 0< SAN JUAN
ERBEN e ...
f ,.,. SHOWBOAT
O· GUADALUPE I
..,'
5H
16-31
"'I---I---~~-1--+-~~--+-I
'''''~-I-----+---+---+----~-\
57 ........ 45 "' f--I---~~-1--~---+~~-..2:~
47 4B
'''''
5G
OCTOBER 1- 15
.,'.~-I-------+---<-~---+---j
. .,. 33
35 4 B II
56 27 .. · .. "'85
".
38,112 938~~OotCUT
IBB I n ...... .
""
''''
51
NOVEMBER 1-15
" 'I---I---~--+--~----~-I
18

... -----... --
I I
5J
NOVEMBER 16-30
i '~~-+-------~----------+--------4
~~--+-------~----------+-------==~-------4 . ,.
, . "'. <Zo·
68 I I
l.- ' I JULY 16-31
.,'
190 60 I
104
102
117 " .
6A
JUL I-I
... _____ -1 __ 1,.
"'"l --+-----
6C
AUGUST I-I
I
.1-
I.

60
AU GUST 16-31 17 5254
.,.I---+------~_~ _ __ _4
81
93 9533
76 8871
°IOS" 43'" ~c . L.t.HCO
8 1 103131
17510979103. ,,,,,,, .. . yl-----------~-~----~ 8391
. I 10 4
II
... ~-------+-------'-~--...:..:--4
20
S.o.fIIJU.o.fII 53 13 3
5 25
"'.I--_t-------+--- -----+--- - SHO .... SOAT-------l
120'
. t
.~"--' - .~
... ~ -77
6F '0·1--__ -----
SEPTEMBER 16- 30
., .I---:--------'-~-~~--_4
8 . . \' '''
53
125 144. 42\
. _____ !4.;:._~ 117 75 79
• T 1044 21
. 2~'~'?'"33
6E
1-15
so.· JU~_ 33 \, .
"'.I---+------+--------4----~==~------4
'0·1--I-~-----_t--='1.... 6G
OCTOBER 1-15
.,.I-_t--------+-;-~~--_+_f
.~,I---;--------+---------+~
".I---t---------+----~--+---....:::':.!j
"'.I---+--------+-------+----~==~------4
I'"~ !Z,. 120 '
20

5 21 I
23
6H
OCTOBER 16-31
21 ~?;1~17 ,..t--t---~--t--~---+---9-'-'-.'lltT COIOC[I' TI()foi
4 17 16
10 ' i'6-~'-, .
~-r--t------t------~---~~~------4
~ . .. a.(>.t.~ " .. t
13~ ' 130' 12>- 120'
'o-r----1r--------f----'=t .... 6J
NOVEMBER 16-30
. ,.
'0-
------6
". 14
.4_ ~
.... ..... ., .
~.
~ . ..... O·W .. 1
IlO' ~,. ~O '
6 1
NOVEMBER 1-15
wt--t-------t--+----+- ---+--1
·31).~. ". r--t------t--~---~~---==__1
37 II I"T COIIICt:""OIrI
I '~ " -, .
12$'
'o·t--t-------t----'=t .. 7A
JUNE 16-30
" . Fiyure 7.-Nomi-na catch-pe r -unit effort of albacore t una caught by U. . jig vessels during 1967 in terms of a 45-foot jilS vessel. Values
'0-given are mean number of fish cau5ht per day by 15- ay period and 10 quadranyie . Heavy dashed ine indicate lat. 38°
6 •.•.•• ~ ".
.. .. ......
~.
• G· --,
"'. ''''' 12>' ,,,.
21

,o·h--+~~---l--~:" 7B
JULY 1-15
.,·h--+~~-----;---~~rl
I ------i--
".h--+~~----j---~~.J--':;::::'~4
.~ .. • f ,ABEN 86 B3 27 15
I 196 143 16 88 36 85 )
t-. ---+---+-------
>O.'J-.--+~-~~- 7D
AUGUST 1-15
--~--+-I
".I_+--~~_t-~---I_--.....:..~
~.r--r-----r------+---==~--~~~ 3 3 . , ..
,,.,. ~5· ,~.
7G
JULY 16-31
---------~
7E
AUGUST 16 -31
".J-.--+~-----l---~~+-i
81 '~'I--+--~---l---~--~
".I--j--------l------.J---~~
486220 b
~ .. - \. . 13 7 17
~.r-_+----~--------+_---~~~------~ . , ..
,,,. ,,.,. a,· ~O· , ... 22

. o·\-+--t-~~~--t-~':=":~FT.::-::-' 1 43~
___ ~~6
14
13:1' 12"
7F
SEPTEMBER 1-15
~O'
7H
OCTOBER 1-15
7G .. I
66 I' --:..~ 301 '6"
65 13~ "l. SEPTEMBER 16- 30 113 ~51 .,.\-+--1..---__ - __
<i
33 2
11319, ------ .... --.r
21 72 24
52 38 8 55'
"'.1--+----+------+---...::...
I)". '
71
. ; , . OCTOBER 16-31
• ,.\-+--"---- -------'-.,
_______ ... _,.,J. !"'"
--- - ..

wl---+~_~ __ +-__ -P 7J
NOVEMBER 1-15
,..1--+-----+_------t------1
~.I---+------+--------+----
,zoo ,~ .
'O·I--+--~--+_---::»r.... 88
JULY 16 -31
,..1--+--~--+_-----t-~---1
s .. .. ~ .. 3 I~ 15
G·
24
'0·'1---4 ______ + __ -:<:.
.. --------
".1--_+------+_-------;------1
8
JULY
8A
1-15
Figure 8.- omi · nal catch·per·unit effort of albacore tuna caught by U. . jig ve sels during 1968 in term of a 45-foot ji~ ve eJ. Value given are mean number of fi h caught per day by 15-day period and 10 quadrangle . Heavy dashed line indicate lat. 3 0
N .
.... w· ....... \, 332792 ;--1-
15 2415 ).. -
~.~-+-------+_----_ _+----~==~-~3~0-1~8~
,,,. '30" ,.,.
j 2132251851351
~O·
3 I·
,,,.
8e
. 322 141 10~ . 22~ rL AUGUST 174 23CJ 202 -
1-15
.,.1--+--------1-------+--1
".
28 21
~.
• G· tuaO.L"'"
,,,. IlO· ,~.

169738330 Ie. I!Il.NCO
76105111 71 '(---
61 71 84 10~
153166 ad W( NOOCIIoIO
145
'120'
80
AUGUST 16 - 31
" '1---+ __ ~~-+~_~ __ +-~_··'_"'_··.:::3.:...:, ,20 2[' ~OHC[PTION
'.~ I: . \, .
2516 -
14 0
• G·
,~.
,0·"---1----~_+-~='(... 8F
SEPTEMBER 16 - 30
42
21
,,,. ..,.
'0·"---1-____ --+ __ ='(...· 8E
SEPTEMBER 1 -15
.,.I---+------+~e-+--+--_+__i
33
56
8G
OCTOBER 1-15
9318448 51
,'-'" .... ~O'
25
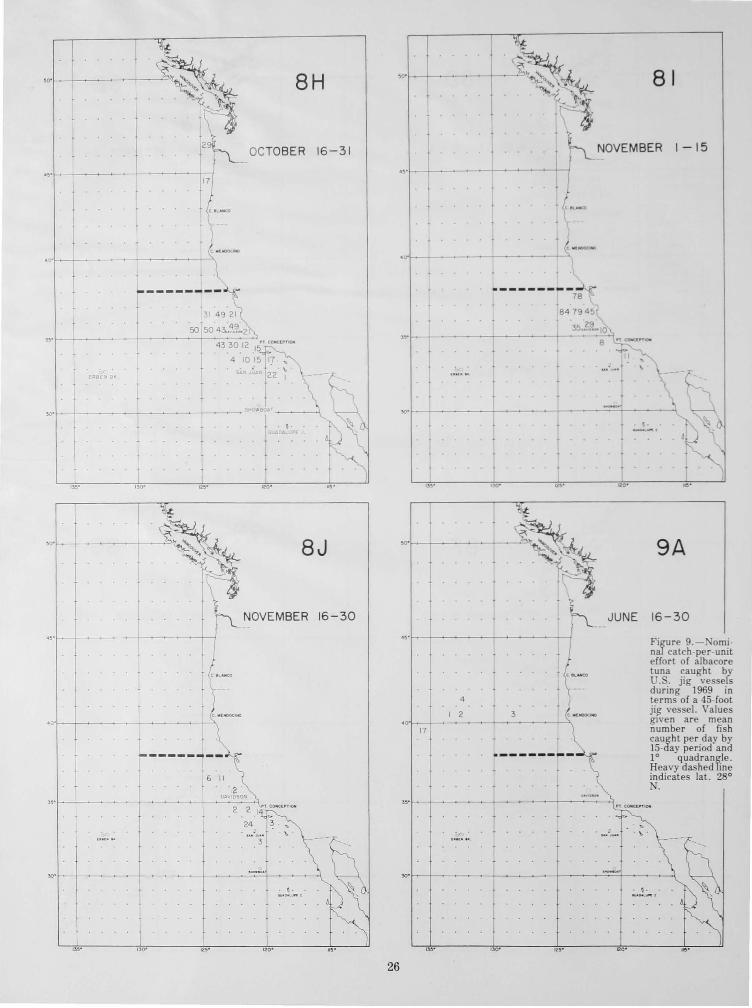
'0' 8H
OCTOBER 16 -31
os'
40·1---+------+-------+---'\ ., \
~--------
".1--------+------+---::-:-0 433012 15~f
4 10 15 ~'! ."'-• 22
"'.1---+-----+----+---
'S>' '}O· .... ~O ' ,~.
'0' t
8J t
16-30
"'1--+-----!-------i---1
40·I----i-------i------+--,-~
wf---j-------i-----+---':..:..;..--'\. 2 2 .1 1T:0ffC~'1OfI
24 ~ b
3
G· _O'O~\I .. I
,,,. 115·
~
00' f:~4 81 ~,.; • . "i'¢-
'Y; t3 :=t. NOVEMBER 1-15
I w
78
8479 4 5
?>5 PLIO ".1----'------------+ •
t •
"'.~-+-------+-----~---~~---~
26
'lD'
~
~ . h JUNE
I -i----;:..........--H1 --.'.r-
17
4
I 2 3
9A
16-30
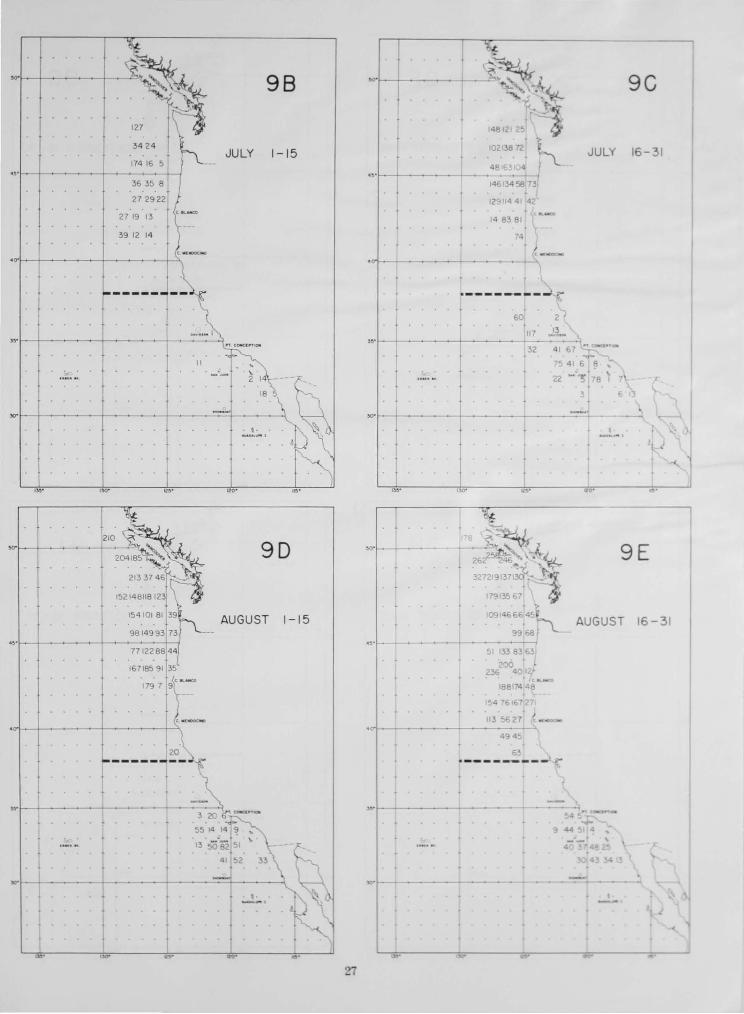
Figure 9.- omjnal catch-per-unit effort of albacore tuna caught by
. . jig ve el during 1969 in term of a 45-foot jilS ve el. alue gIVen are mean number of fi h caught per day by 15-day period and 10 quadrangle. Heavy dashed line indicate lat . 28 0
>0" 98
127
3424 JULY 1-15
".
2719 13
3912 14
,0-
-----
". t----+--------+----------t-----~...,
" ~ .
2 14
18 _ ... ~.~-+----------+---------~------~~~------~
• Q ••
..... '30" ,.. . ~O'
90
AUGUST 1- 15
••• ~_+------+_-+-----+__t__/
.O"t----+--------+---------~~
".t----+-------+--------~--------...,
~.~-+----------t---------_+------~~+_------~
27
..
14613458 73
• 12911441 42'
+ 48381
74
--------~ ¥'"
".1---+----------+-----------+----
9C
JULY 16-31
~t---r----------T_--------~------~~-
'>0" '0'
9 E
AUGUST 16 - 31
~ ... 1-------------........ -------
"'"~--+----

,O.i----I-...-----+2-~,~~1b.. _
'3105 r;- "
71 7526
9F
" 38\1~ SEPTEMBER 1-15
.,.1-.--+------+-------1 9264 12
4854 4
"" 11168103
1789323 , + r--- rooi9~-2
8 9 63'
3 .5, .)-. .... f--------+-------+------4
-f--~-------~-------~-----
""'.
~ +
9H ""}-O---J------
OCTOBER 1 -15
46 1927
28
, ..
. , . 6696
00
2
, 50602 7 ..
--'----- --+ " 77 89
5 6 --------- .: 2766098;; 8
2 3 2"
....
9G
16-30
T
91
OCTOBE R 16 - 31
... 1-.-+-------------------;
f
6
.~.~~----------------~. 6
~--------
".~ __ --------_i_-------!-------'l , r ~141 117,83,284"'
110480 70

~O'~-+---------+ __ ~~ 9J 9K
NOVEMBER 1-15 16-30
"o~_+----_+-----l--J .,01---+ ___ --1-------1
OO-f---!------!------!---"-.
wl--+---_+ ____ -!-__ --..!~
o • •
2 19 25
><>"f----l------!------l----= '-----
,w """ ".0
9L r ..
,O°f---!-____ -!-__ -""'{..
DECEMBER I - 15
~ -+---.~~
. K DECEMBER 16 - 3 1
9M '00 1----1--__
.'01---+-----+-----+-1 4'01---1-____ -1-------+-1
l---~-~~-- .-------- ...... ~
"o~-----_+----_r_----...:""_'i
,w
29

... +--+-----+--------
49
12
.~.~-+-------+----------+~
,y~----------+----------
30'
~~-+---------+----
29 74 16 61
.,.~_+-------i_-+------_+__1
.~.~-T------~+--------~~
lOA
JULY 1 - 15
Fil.{ure 10. - 0 mlnal caLch (l r unit effort of alba cor luna cau~hl by J •• jig V sseb during 1970 In L rm ' of :t ,15 fool ji~ e .• I. Valu ~ gwen (lr m nn numb r of /i~h caught p r day by 15 day p riod and 10 quadrangl II avy d ' h d lin tndicale laL. 3 0
10 C
AUGUST 1- 15
. i3513"! 323
-----~--t 5310495 42
50122 39 . .. .. . 74 27 10
18 20 ".I---+------+-------~-----...::
3
215~2;67 14 • • " 'to ' 2473314 524
315 . ~. . _~_ l
.... .". 30
",. .
. 1
248 J. ..
:n 43 2
~.~-+----~-~--~'
31
.,.I----!.-------i-........ --------1
"'.
13 129
33 15
82158
7016116<!l157-
131 16Ei!66
III
121
lOB
JULY 16 - 31
100
AUGUST 16 - 31
~~_+---------+_-------_+----~==~----~_4
1lO' '30' 020'

10E
SEPTEMBER 1-15
."f--l------+-o---~~_+_I
56
677777 74 74 "' I---+------+~-----+--~-..., 102 68 30 24 4 0 "t;:OIt(:[,,,o,.
. .... 7 ~
13~· ,,0- 12S"
'0'
."
.o,f_-+~-----_t_-----~~
--------103 1102 120 2
,1241057
10099 8
8
120 ·
lOG
OCTOBER
".f--+-------_+-----+-~---~ 98 5~ ~OIfC[".~
II
~,f__+------+------~-+---~~+_----_4
!ZO'
II~ ·
1-15
10F
SEPTEMBER 16-30
30
. O'I--t------+~----_t____\
26
"'f--t------+-----_t_:-::-----...., 143120 61 16" COItC[ .. ,~
10 4
,,,' '>0' ,2>' QO' ,~ ,
>0'
~ 10 H
OCTOBER 16- 31
.,'
"'I---t------_t_-------"7----:-__ "i
>o,f_-+-------T-------T-------~7-----4
31

o· 10 I
NOVEMBER 1 - 15
'W ~,.
10 K
DECEMBER 1-15
-------,--
,,. -
32
10J
NOVEMBER 16 - 30
D.:l/IDSON 5
~·~-+-----------t----~-----r-----------r~----~4
>z w U 0:: W a.
130·
Figure 12. - Nominal catch -perunit effort for albacore tuna caught by U .. jigboats.
1970
YEAR
Figure ll.-Percentage of the west coast albacore tuna catch taken north of San Franci co (iat. 38° ) for years 1938·1970 .
020
CPU( I RATIO OF AVERAGES---o
CPLE:z AVERAGE OF RATIOS----.ll
"'" TEAR 096' ' ... 1971
MFR Paper 1186 From Marine Fisheries Review Vol 38, No 5, May 1976 Copies of this paper, In limited numbers , are available from 0825 , Techmcal Informa tion DiviSion , Envlfonmental SCience Information Center NOAA Washing ton , DC 20235 Copies of Marine Fisheries Review are available from the Superin tendent of Documents, U S Gov· ernment Pnntlng Ofbce , Washington , DC 20402 for $1. 10 each