Embed Size (px)
Citation preview

Mr. Kim Gran
President and CEO
Nokian Tyres plc
Nokian Tyres:
The strongest tyre manufacturer
in Russia Helsinki 21 September 2011
ABG Sundal Collier
“Spotlight on Finland” seminar

2
1. General overview & financial performance
2. Russia
3. Nokian Tyres going forward
4. Appendixes
INDEX
Nokian Tyres – new world record on ice 2011

Truck Tyres; 3.8% (3.2%)
Heavy Tyres; 8.4% (7.5%)
Vianor; 18.0% (24.5%)
Car Tyres; 69.8% (64.7%)
STRONG H1 RESULTS – GOOD VISIBILITY IN 2011 Strong order book and high demand continue
Net sales 628.0 m€; +41.4%
Passenger Car Tyres
Net sales: 468.5 m€; +47.0%
EBIT 168.0 m€; +93.3%
EBIT margin: 35.9% (27.3%)
Key products: studded and
non-studded winter tyres,
high-speed summer tyres
Heavy Tyres
Net sales: 56.7 m€; +52.8%
EBIT: 10.0 m€; +29.6%
EBIT margin: 17.7% (20.8%)
Key products: tyres for
forestry, industrial and
agricultural machinery
Vianor
Net sales: 120.6 m€; -0.2%
EBIT: -7.2 m€; -43.2%
EBIT margin: -6.0% (-4.2%)
820 stores in 22 countries in
Nokian Tyres’ core markets
Truck Tyres
Net sales: 25.8 m€; +62,1%
Key products: truck tyres
and retreading materials
EBIT 165.6 m€; +101.9%
3

4
FINANCIAL PERFORMANCE Group operating result per quarter 2007-2011
1-6/2011
Net sales 628.0 m€
(444.2 m€), +41.4%
EBIT 165.6 m€
(82.0 m€), +101.9%
Cumulative operating result per quarter (m€)
Group operating result per quarter (m€) 4-6/2011
Net sales 338.8 m€
(260.4 m€), +30.1%
EBIT 93.3 m€
(60.9 m€), +53.3%
Profitability supported by:
Improved cost structure, higher sales volume, better mix and ASP
Increasing share of Russian production productivity up
Year 2011 estimates:
The company is positioned to provide
strong sales growth and to improve
operating profit clearly compared to 2010
5
GROUP
Sales development in euros
Nordic countries +22.6%
Russia and CIS +102.0%
Central and Eastern Europe +36.4%
North America +13.7%
FINANCIAL PERFORMANCE Gross sales by market area 1-6/2011
Growth targeted in Russia&CIS and Central Europe
Sales of Manufacturing Units: 597.4 m€, +49.1% Sales of Nokian Tyres Group: 663.4 m€, +41.1%
MANUFACTURING
Sales development in euros
Nordic countries +32.8%
Russia and CIS +102.1%
Central and Eastern Europe +36.9%
North America +23.3%
Nokian Tyres is the price and market leader in Nordic region and Russia&CIS

FINANCIAL PERFORMANCE Raw material cost development
Value of raw material consumption (%) Raw material cost development index 2000-E2011
Raw material cost increased by
32.0% in Q2/2011 vs. Q2/2010
35.8% in H1/2011 vs. H1/2010
7.5% in Q2/2011 vs. Q1/2011
Raw material cost is estimated to increase by
6% in Q3/2011 vs. Q2/2011
27% in H2/2011 vs. H2/2010
30% in 2011 vs. 2010
Nokian Tyres raw material cost (€/kg)
6
100105
97 99
104
112
137133
147
134
141
167
179
190
183
80
100
120
140
160
180
200
2000 2001 2002 2003 2004 2005 2006 2007 2008 2009 2010 Q1/2011 Q2/2011 LEQ3/2011 LE2011
In order to maintain material margin +9% in ASP required in 2011 vs. 2010
Good pricing discipline in tyre business continue. Nokian price increases stick as planned.

7
STATE-OF-THE-ART PRODUCTION Full utilization - Capacity increases continue
Nokia, Finland R&D, administration and marketing Development of key processes Prototype production batches Special car tyres Heavy tyres, retreading materials Export to western markets 2010: Car tyres to 6-day shift system Heavy tyres to 7-day full capacity utilisation
2011:
Car tyres to 7-day shift system in August Investments for increasing productivity
through automation Approx. 150 new employees
Vsevolozhsk, Russia Production of the whole car tyre range State-of-the-Art production technology Low production costs Tax relieves Inside the duty borders of Russia and CIS Export to all markets Possibility to expand in current premises & land area 2010: Lines 7 and 8 were taken into use Approx. 200 new employees
2011:
Lines 9 and 10 & new technology into use Approx. 200 new employees
New factory next to the current one in 2012-2014: 5-6 million tyres annual capacity, a new agreement for tax relieves and incentives succesfully completed.

8 8
Vianor – 820 stores in 22 countries 28 new stores in Q2/2011, +49 in H1/2011
173 equity-owned, 647 franchising/partners
Largest tyre chain in Nordic and Baltic countries:
236 stores (+3 in Q2/2011)
Largest tyre chain in Russia and CIS:
450 stores (+12) in 277 cities
Expansion to Central Europe gained momentum:
121 stores (+10)
Vianor stores by segment: Car tyres: over 800 stores
Heavy tyres: nearly 200 stores
Truck tyres: over 240 stores
Vianor highlights in Q2/2011:
New countries: Italy & Azerbaijan
Partner network started in USA
Master franchising agreement signed in Romania
Target 2011 over 900 Vianor stores
Vianor – Distribution spearhead for all product groups
EXPANDING DISTRIBUTION
Vianor 1-6/2011: Foothold on core markets strengthening

9
INVESTMENTS Significant investments in 2011 to secure strong profitable growth
Nokian Tyres Capital expenditures (m€)
Investments in 1-6/2011
52.6 m€ (27.6 m€)
Russia
Capacity ramp-up and investments
Lines 9 in production
Line 10 start-up in Q3/2011
New plant under construction, production starts by summer 2012
Estimated investments for 2011
Approximately 140 m€
Investments to Russia incl. the start of new plant construction 75 m€
Nokian plant and processes 25 m€
Moulds for new products 26 m€
Vianor chain including aquisitions 14 m€

10
1. General overview & Financial performance
2. Russia
3. Nokian Tyres going forward
4. Appendixes
INDEX

11
RUSSIA Strong sales growth – potential to exceed pre-crisis sales in 2011
Sales and demand recovering trailing improving car sales, growing replacement
sales of tyres and low inventories of distributors
Sales in Russia in 1-6/2011 grew by 110.7% to 192.8 m€ (91.5 m€)
Sales in CIS (excluding Russia) were 12.0 m€ (9.9 m€)
Nokian Tyres is clear # 1 in premium tyres in Russia and CIS countries

RUSSIA
Russia’s economy clearly recovering
12 12
12
Russia’s GDP growth Major trends and expectations
Consumer confidence in Russia
Source: Rosstat, EIU and Nokian Tyres estimates
CAGR 09 – 15: 13.9% Mean 09 – 15: 4.3%
Russia’s economy has continued to recover from the
severe crisis of 2008 - 2009
In 2009, economy fell into recession with an annual
decrease in GDP of 7.9%, but in 2010 it grew by
estimated 4.0%
Recovery is expected to keep momentum in 2011,
backed by high oil and commodity prices
estimated annual real GDP growth in
H1/2011 is 4% vs. H1/2010
Overall growth trend will continue: average GDP
growth for 2010-2015 is estimated at >4% a year.
Faster growth is possible, but restricted by
unbalanced structure of the economy; weak
investment and the election cycle
Domestic demand revival gradually started due to
increased disposable incomes
Ruble exchange rate fluctuated in 2010 with year-
average clearly stronger against major currencies vs.
2009; in 2011 it is expected to remain stable or
strengthen further
-600 -400 -200
0 200 400 600 800
1 000 1 200 1 400 1 600 1 800 2 000
'05 '06 '07 '08 '09 '10 '11 '12 '13 '14 '15
No
min
al G
DP
(E
UR
bn
) x
-8.0%
-6.0%
-4.0%
-2.0%
0.0%
2.0%
4.0%
6.0%
8.0%
10.0%
Rea
l GD
P g
row
th (%
) x
Nominal GDP (B EUR) Real GDP growth (%)

13 13
13
RUSSIA
Car sales back on a growth track
Car market summary Russian car sales forecast – basic scenario
Source: AEB; IHS Global Insight; MinPromTorg; Nokian Tyres estimates
Monthly car sales
Sales of new cars and LCVs in Russia increased by 30% in 2010 vs. 2009 and by 48% in 1-8/2011 vs. 1-8/2010
Growth is expected to continue the whole year, but the rate is likely to slow down
Government scrappage scheme brought very positive results, albeit supporting mostly cheap brands and models
The program, which has positively affected the whole year’s car sales, has been fulfilled in mid 2011
Due to rapid recovery of demand the lack of cars continues, as manufacturers have limited quotas for Russia
Long lead times remain for many popular brands and models (up to a year)
This deferred demand will continue to positively affect sales in 2011 and to some extent in 2012
The car market is forecasted to reach 2.5 million cars and LCVs in 2011, showing a 30% growth
Financing of car purchases revived in 2010, with share of sales financed by banks and car manufacturers reaching pre-crisis levels
Government implemented own car loan support program, with 355 thousand applications and 166 thousand loans granted in 2010
The program continues in 2011 with the participation of 117 banks
0
1 000
2 000
3 000
4 000
5 000
6 000
'04 '05 '06 '07 '08 '09 10 '11f 12f 13f 14f 15f 16f
Ru
ss
ian
ca
r s
ale
s (
'00
0)
x
Local Brands Western Brands - Used Western Brands - New

14
0
250
500
750
1 000
1 250
1 500
1 750
2 000
2 250
2 500
2 750
3 000
3 250
3 500
3 750
4 000
4 250
'05 '06 '07 '08 '09 '10 '11f'12f'13f'14f'15f'16f
Valu
e (
m€)
x
14
RUSSIA
Tyre market expected to reach pre-crisis level in 2011
Car and van tyre replacement market (volume) Car and van tyre replacement market (value)
Note
Source :
Nokian Tyres estimates
+24.1%
+4.4%
+30.6% +22.9%
CAGR
10 - 16
Traditional segments / price positioning: index 100 = market leader; A: > 80; B: 60 – 80; C: <60
A
C
0
5
10
15
20
25
30
35
40
45
50
55
60
65
'05 '06 '07 '08 '09 '10 '11f '12f '13f '14f '15f '16f
Vo
lum
e (
millio
n t
yre
s)
x
+8.5%
CAGR
10 - 16
+17.0%
+13.3%
0.5%
A
C
B
B
Nokian Tyres is the market leader in A-segment (Nokian Hakkapeliitta) & B-segment (Nokian Nordman)

15
RUSSIA
Nokian Tyres is the strongest player in Russia
Nokian Tyres market position in Russia
Only global tyre company with a state-of-the-art and efficient factory in Russia
- Close access to markets
- Within customs zone (duty 20% for import)
Clear market and price leader in core product categories
Widely recognised and strong brand – both company (Nokian Tyres) and products (Hakkapeliitta)
Strong distribution chain covering all of Russia – based on long-term and close customer relationships
Only global producer with a controlled tyre distribution network – 450 Vianor stores in Russia and CIS
Nokian Tyres to further strengthen its market leader position in Russia
Nokian Tyres’ factory in Russia
9 production lines operating
Line 10 to be commenced by the end of of Q3/2011 – annual capacity to increase to 11 million tyres
New plant construction started; annual capacity increase of 5-6 million tyres during 2012-2014
State-of-the art machinery, high European quality standards
Vsevolozhsk factory exports approximately 50% of its production to 35 countries: Biggest consumer goods
exporter in Russia
Housing project, Hakkapeliitta Village – phase I completed, phase II in 2011-2012
Number of personnel on 30 June 2011: 965 (691)

16
RUSSIA
Overview of the Vsevolozhsk plant
Construction work started
Production start up in
summer 2012
Gradual build-up to full
capacity 2012-2014
Expansion 4 11 million tyres completed 2011 (blue colour)
Construction work completed
Production lines 1-9 fully operational, line 10 installed in Q3/2011
Potential on existing site 20 million tyres
Expansion 1117 million tyres (green colour)
Tax reliefs and incentive
agreements signed to
continue another 5-10 years

TOTAL (n=754)
CITY:
Which passenger car winter tyre brands do you remember by name? - Top of mind
0% 5% 10% 15% 20% 25% 30% 35% 40%
Nokian/ HakkapeliittaMichelin
BridgestoneGoodyear
GislavedYokohama
Continental
PirelliDunlop
KamaHankook
KumhoCordiant
AmtelMatador
Belaya/Tserkov/RosaBelsinaKleber
NordmanTaganka
OtherDk
TOTAL (n=754) Moscow (n=286) ST. Petersburg (n=159) Other (n=308)
RUSSIA
Winter tyre brands survey – Top of mind
Nokian Tyres is the strongest winter brand and market leader 17

18
Growth via partner & franchising concept, 450 stores in 277
cities at the end of Q2/2011
Limited investment in equity owned shops
Loyalty requirement for Nokian sales
Fast fit and service as part of concept
Central marketing
Training, ICT, dealer councils
RUSSIA & CIS Vianor concept – tailor-made distribution in seasonal market
Vianor Volga region

19
RUSSIA & CIS: Vianor stores on 30 June 2011
450 stores in 277 cities; + 49 stores in H1/2011
Kamen-na-Obi
Tver
Vorkuta
Khabarovsk Novokuznetsk
Volgodonsk
Noyabrsk
Miass
Belgorod
Pskov
Stavropol Astrakhan

RUSSIA
Hakka-Invest – Support for retaining expansion
Scheme:
Own Partner’s outlet
Hakka-Invest
New Partner’s outlet
Property
Financing
Investing
20

21
3 new houses (phase II)
2012-2013
Existing 4 houses
167 apartments
11 000 m2 and 173 apartments
RUSSIA Hakkapeliitta Village:
Own flats and financing for personnel
Personnel retention tool

22
INDEX
1. General overview & financial performance
2. Russia
3. Nokian Tyres going forward
4. Appendixes

23
Assumptions
Growing core market: Nordic countries, Russia & CIS
GDP growth 3-5%
New car sales improving
Russian economy growing, strong consumer confidence
Currencies on Nokian core markets expected to be stable
Further ASP improvement to offset higher raw material cost (€/kg)
Cost up by 35.8% in H1/2011 vs. H1/2010
Cost estimated to increase by 6% in Q3/2011 vs. Q2/2011
Cost estimated to increase by 30% in 2011 vs. 2010
Passenger car tyre operation environment
Demand strong in core markets
Low carry-over distributor inventories offer growth opportunities
Demand improving for winter tyres, legislation in Europe
Receivable risks are back to normal
Heavy tyre market demand
OE markets for heavy tyres continue to grow
Aftermarket demand continues to grow
Nokian Tyres financial position remains solid
No major loans due for payment in 2011
Equity ratio 70.2%
Undrawn facilities available
NOKIAN TYRES GOING FORWARD Outlook for 2011: Sales to improve backed by increasing capacity
Outlook: Profitable growth
Strong demand and order book good visibility in 2011
Raw material cost gradually levelling off but it is estimated to
go up 30% in 2011 vs. 2010
Capacity increasing:
Line 9 in Russia commenced, ramp-up ongoing
Line 10 in Russia start-up in Q3/2011
Plant in Nokia back in 7 d/week full capacity in Aug 2011
Building of new plant in Russia commenced,
production by summer 2012
Profitability supported by:
Improved cost structure, higher sales volume,
better mix and ASP
Increasing share of Russian production productivity up
Year 2011 estimates:
The company is positioned to provide strong sales growth
and to improve operating profit clearly compared to 2010

NEW PRODUCTS New Nokian Hakka Blue – Wet Performer
Nokian Hakka Blue
The environmentally
positioned Nokian Hakka
Green started the
launches of the second
generation of Hakka
summer tyres last fall
The new Nokian Hakka
Blue is developed to excel
in demanding wet
conditions
Nokian Hakka Blue
replaces mainly Nokian
Hakka V
24

NOKIAN HAKKAPELIITTA The first and fastest winter tyre
25

26
INDEX
1. General overview
2. Nokian Tyres financial performance
3. Russia
4. Nokian Tyres going forward
5. Appendixes
Production
Sales companies
Strategy
Shareholders
Share price development
Competitor comparison 1998-2011E
Magazine test results
Examples of new products and innovations
Personnel
Investments
Financing: Loans and net Financial Expenses
Tables of financial figures

27
Nokia, Finland
Vsevolozhsk, Russia
Findlay, Ohio, USA
APPENDIX
Production; Own & contract manufacturing
Own factory
Contract manufacturing
Jakarta, Indonesia
Hefei, China
Tokyo, Japan Bilbao, Spain
Bhiwadi, India

28
Nokia, Finland Vsevolozhsk, Russia
Nashville, USA
Colchester, USA Almaty, Kazakhstan
Moscow, Russia
Lilleström, Norway
Kiev, Ukraine
Stockholm, Sweden
Prague, Chezh Republic
Dietlikon, Switzerland
Nürnberg, Deutschland
APPENDIX
Sales companies
Own sales companies in 12 countries
Vianor tyre chain: 820 stores in 22 countries
Minsk, Belarus
Shanghai, China

29
APPENDIX
Strategy: Focusing as a cornerstone
Nordic conditions
Winter & Forest
High growth potential – in product segments and market areas
Russia and CIS, Eastern Europe, Nordic countries and North America
Narrow product segments
Special competence that gives added value to customers
Winter tyres
Light truck & SUV tyres
Forestry, harbour and mining machinery tyres
Replacement markets
Practically no sales to car manufacturers
Sales mainly through specialised tyre dealers & outlets, car dealers etc.

30
Investments in R&D, production, distribution and logistics
Philosophy of sustainable safety
Own production concentrates on high-margin key products
New products make at least 25% of net sales annually
Continuous improvement of processes, quality, productivity and logistics
Corporate culture
Open and participatory culture, “Hakkapeliitta Spirit”
Continuous personnel development
Highly motivated working community
Success of individuals and the company
APPENDIX
Strategy: Supporting elements
”The original winter tyre”
31
1. Market leadership in the Nordic countries
2. Market leadership in premium tyres in Russia and CIS
3. Globally strong position in key products
4. Growth through a continuously improved product range
5. Profit growth through high productivity and the best customer processes in the industry
6. Profit growth through skilled, inspired personnel with entrepreneurial spirit
APPENDIX
Strategy: Key objectives into 2016

APPENDIX Major shareholders as of 30 June, 2011
Total number of shares: 129 475 844
Number of Share of Change from
Major Domestic Shareholders Shares Capital (%) previous month
1 Varma Mutual Pension Insurance Company 8 502 839 6,57 02 Ilmarinen Mutual Pension Insurance Company 5 440 313 4,2 2010003 Nordea 1 335 625 1,03 332294 OP Investment Funds 1 283 000 0,99 05 The State Pension Fund 1 189 530 0,92 06 Tapiola Mutual Pension Insurance Company 1 150 000 0,89 07 Gyllenberg Investment Funds 652 500 0,5 -144008 Folketrygdfondet 630 883 0,49 09 Etera Mutual Pension Insurance Company 589 953 0,46 -50000
10 Nordea Nordenfonden 569 060 0,44 30500Major Domestic Shareholders total 21 343 703 16,49
Foreign Shareholders 1)
81 311 580 62.8%
Bridgestone Europe NV/SA 2)
20 000 000 15.5%
32

33
APPENDIX
Comparing share price development to main indexes 1/2003 - 8/2011
Source: Reuters, as of 31 Aug 2011.
1) The composite consists of an
indexed average values of the
main peers of Nokian Tyres.
OMX Hel Cappi, +42%
Competitors, +64% 1)
RTS, +374%
Nokian Tyres, +659%
Nokian Tyres
by Aug-31-2011 Last 8 years Last 3 years Last 2 years LTM L6M L3M Last month
High 36,85 36,85 36,85 36,85 36,85 36,85 31,40
Average 17,25 19,83 23,73 28,94 31,39 30,91 25,32
Low 4,94 7,23 14,54 22,42 22,42 22,42 22,42

34
APPENDIX: Competitor comparison 1998-2011E:
Nokian Tyres the most profitable tyre producer
Nokian Tyres’ operational performance (growth and profitability) has been clearly better than that of the main peers during the past 10 years. The clearly better profitability protects the company profits during recessions and potential downturns.
Net sales change
CAGR 2007 – 2011E
Nokian 8.8%
Michelin 5.4%
Bridgestone -1.7%
Continental n.m. 1)
Net income 2007 – 2011E
CAGR Margin2011E
Nokian 15.5% 20.9%
Michelin 12.7% 6.0%
Bridgestone -4.8% 3.4%
Continental n.m. 4.8% Source: Results 1998-2010 (company websites) and 2011 consensus estimates for the peers as per Reuters 28 July 2011.
Note: “n.m.” means that the results would be non-meaningful or that the calculation is not possible due to negative results.
1) Continental sales for 2008 not comparable due to VDO acquisition.
PLEASE NOTE: ESTIMATE 2011 IS BASED ON CONSENSUS ESTIMATES, NOT NOKIAN TYRES GUIDANCE.
35
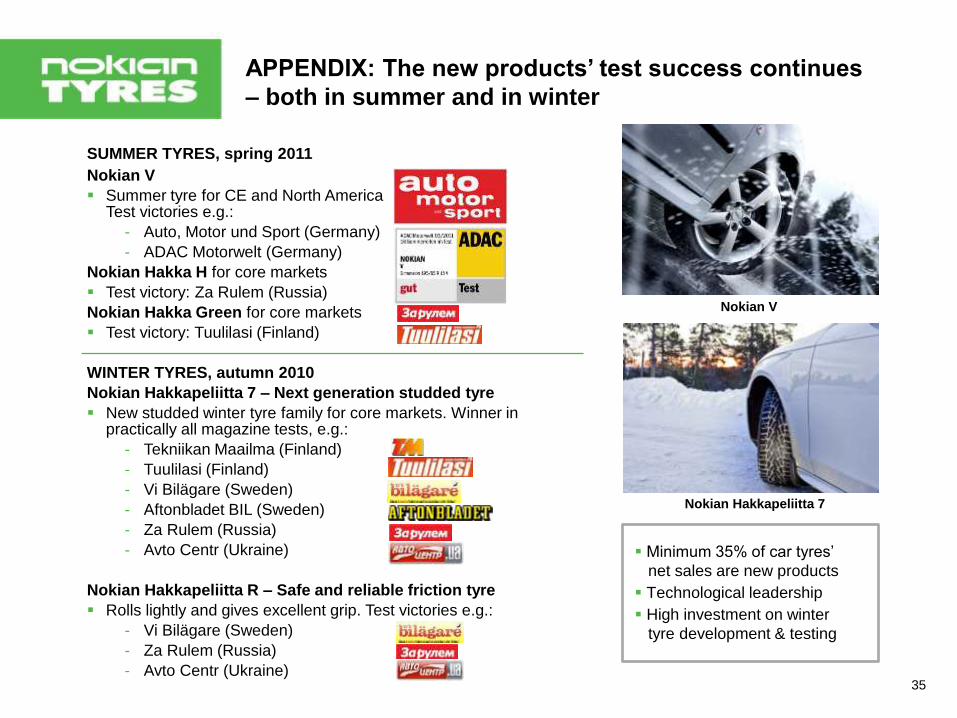
APPENDIX: The new products’ test success continues
– both in summer and in winter
SUMMER TYRES, spring 2011
Nokian V
Summer tyre for CE and North America Test victories e.g.:
- Auto, Motor und Sport (Germany)
- ADAC Motorwelt (Germany)
Nokian Hakka H for core markets
Test victory: Za Rulem (Russia)
Nokian Hakka Green for core markets
Test victory: Tuulilasi (Finland)
WINTER TYRES, autumn 2010
Nokian Hakkapeliitta 7 – Next generation studded tyre
New studded winter tyre family for core markets. Winner in practically all magazine tests, e.g.:
- Tekniikan Maailma (Finland)
- Tuulilasi (Finland)
- Vi Bilägare (Sweden)
- Aftonbladet BIL (Sweden)
- Za Rulem (Russia)
- Avto Centr (Ukraine)
Nokian Hakkapeliitta R – Safe and reliable friction tyre
Rolls lightly and gives excellent grip. Test victories e.g.:
- Vi Bilägare (Sweden)
- Za Rulem (Russia)
- Avto Centr (Ukraine)
Nokian Hakkapeliitta 7
Nokian V
Minimum 35% of car tyres’
net sales are new products
Technological leadership
High investment on winter
tyre development & testing

36
APPENDIX Examples of new products and innovations
Beyond All-Steel Radial – Challenging All-Steel special
tyres Revolutionary technology of the future, used in harbour, mining
and earthmoving machinery tyres
Unique technical solution combining a multi-layer textile
structure with a modern radial structure
Better stability, longer life time, enhanced safety
First top product: the Nokian HTS Straddle harbour tyre
Nokian Hakka Green – Summer tyre for core markets Environmentally friendly novelty, extremely low rolling resistance
Fuel savings and less carbon dioxide emissions
Superior grip and driving response
If all Finnish car drivers would use use Nokian Hakka Green
tyres, annual fuel savings would be over 114 million litres, which
corresponds to 2,077 trailer loads. Carbon dioxide emissions would
decrease by some 296,000 tonnes
Nokian WR – Winter tyre for Central Europe Advanced new-generation tyre family for any winter weather
Environmentally friendly premium products feature nanotechnology,
canola oil and the solid winter expertise of Nokian Tyres
Nokian WR D3 for the economic driver (smaller sizes)
Nokian WR A3 for sporty use (bigger sizes)

37
APPENDIX Winter tyre legislation in Europe
Au
str
ia
Bo
sn
ia H
erz
eg
ovin
a
Cro
ati
a
Czech
Rep
ub
lic
Esto
nia
Fin
lan
d
Fra
nce
Germ
an
y
Latv
ia
Lit
hu
an
ia
No
rway
Ro
man
ia *
Serb
ia *
Slo
vakia
Slo
ven
ia
Sp
ain
Sw
ed
en
Sw
itzerl
an
d
Winter tyres are legally
mandatory ● ● ● ● ● ● ● ● ●Winter tyres are
mandatory if weather
conditions so require● ● ● ● ●
Winter tyres are
mandatory only if there
is a specific road sign● ● ● ●
* Starting 2011

38
Personnel at the end of the review period: 3,786 (3,264)
Equity-owned Vianor: 1,317 (1,349)
Russia: 965 (691)
APPENDIX
Personnel 30 June, 2011

APPENDIX Financing: Loans on 30 June, 2011
39

APPENDIX
Financing: Net Financial Expense
Net Financial Expense 1-6/2011: 10.3 m€ (1-6/2010: -0.8 m€)
40

APPENDIX CONSOLIDATED INCOME STATEMENT
41
CONSOLIDATED INCOME STATEMENT 4-6/11 4-6/10 1-6/11 1-6/10 Last 12 1-12/10 Change
Million euros months %
Net sales 338,8 260,4 628,0 444,2 1 241,9 1 058,1 41,4
Cost of sales -181,1 -145,6 -336,7 -254,2 -686,5 -604,0 -32,5
Gross profit 157,7 114,8 291,2 190,0 555,4 454,1 53,3
Other operating income 0,5 1,9 1,2 2,8 2,7 4,3
Selling and marketing expenses -51,8 -45,8 -103,3 -90,4 -205,7 -192,9 -14,2
Administration expenses -8,3 -6,5 -14,5 -12,5 -29,6 -27,6 -15,8
Other operating expenses -4,8 -3,5 -9,0 -7,8 -17,0 -15,8 -15,9
Operating profit 93,3 60,9 165,6 82,0 305,7 222,2 101,9
Financial income 15,0 16,7 49,6 46,0 99,9 96,3 7,8
Financial expenses -23,0 -17,0 -59,9 -45,2 -124,3 -109,7 -32,4
Result before tax 85,4 60,6 155,3 82,8 281,3 208,8 87,5
Tax expense (1 -11,2 -8,0 -18,7 -10,2 -47,7 -39,1 -83,7
Profit for the period 74,2 52,6 136,6 72,6 233,7 169,7 88,1
Attributable to:
Equity holders of the parent 74,2 52,6 136,6 72,6 233,7 169,7
Non-controlling interest 0,0 0,0 0,0 0,0 0,0 0,0
Earnings per share from the profit
attributable to equity holders of the
parent
basic, euros 0,57 0,42 1,06 0,58 1,34 84,5
diluted, euros 0,57 0,41 1,05 0,57 1,32 83,8
1)Tax expense in the consolidated income statement is based on the taxable
result for the period.

42
APPENDIX CONSOLIDATED OTHER COMPREHENSIVE INCOME
CONSOLIDATED OTHER COMPREHENSIVE
INCOME 4-6/11 4-6/10 1-6/11 1-6/10 1-12/10
Million euros
Result for the period 74,2 52,6 136,6 72,6 169,7
Other comprehensive income,
net of tax:
Gains/Losses from hedge of net
investments in foreign operations 0,4 -4,3 0,6 -20,4 -17,9
Cash flow hedges -0,9 -0,2 0,7 -0,8 -0,6
Translation differences
on foreign operations -1,8 25,2 4,4 69,1 37,0
Total other comprehensive income
for the period, net of tax -2,2 20,6 5,7 48,0 18,5
Total comprehensive income
for the period 71,9 73,2 142,3 120,7 188,2
Total comprehensive income
attributable to:
Equity holders of the parent 71,9 73,2 142,3 120,7 188,2

43
APPENDIX KEY RATIOS
KEY RATIOS 30.6.11 30.6.10 31.12.10 Change
%
Equity ratio, % 70,2 60,9 68,4
Gearing, % 20,0 37,3 0,1
Equity per share, euro 7,92 6,74 7,34 17,6
Interest-bearing net debt,
mill. euros 205,0 319,6 0,7
Capital expenditure,
mill. euros 52,6 27,6 50,5
Depreciation, mill. euros 35,4 34,6 69,4
Personnel, average 3 727 3 221 3 338
Number of shares (million units)
at the end of period 129,48 127,19 127,70
in average 128,68 126,25 126,75
in average, diluted 135,90 132,16 132,96

44
APPENDIX: CONSOLIDATED STATEMENT OF FINANCIAL POSITION CONSOLIDATED STATEMENT OF
FINANCIAL POSITION 30.6.2011 30.6.2010 31.12.10
Million euros
Non-current assets
Property, plant and equipment 503,6 524,9 483,6
Goodwill 60,1 57,4 58,8
Other intangible assets 19,8 18,1 19,7
Investments in associates 0,1 0,1 0,1
Available-for-sale
financial assets 0,3 0,3 0,3
Other receivables 21,4 11,8 20,6
Deferred tax assets 19,2 36,2 22,3
Total non-current assets 624,5 648,6 605,2
Current assets
Inventories 310,3 231,0 210,6
Trade receivables 419,8 369,8 258,9
Other receivables 84,9 106,5 80,4
Cash and cash equivalents 22,4 51,4 216,6
Total current assets 837,4 758,7 766,3
Equity
Share capital 25,4 25,4 25,4
Share premium 181,4 181,4 181,4
Translation reserve -66,0 -41,4 -71,1
Fair value and hedging reserves 0,1 -0,8 -0,6
Paid-up unrestricted equity reserve 34,4 0,0 8,0
Retained earnings 850,7 692,5 793,9
Non-controlling interest 0,0 0,0 0,0
Total equity 1 026,0 857,1 937,2
Non-current liabilities
Deferred tax liabilities 30,3 30,4 39,3
Provisions 0,1 1,4 0,1
Financial liabilities 203,2 203,5 204,2
Other liabilities 1,4 2,9 1,9
Total non-current liabilities 234,9 238,2 245,5
Current liabilities
Trade payables 86,7 60,5 81,0
Other current payables 87,8 83,1 92,7
Provisions 2,2 0,7 2,2
Short-term financial liabilities 24,2 167,6 13,0
Total current liabilities 201,0 311,9 189,0
Total assets 1 461,9 1 407,3 0,0 1 371,6

45
APPENDIX CONSOLIDATED STATEMENT OF CASH FLOWS
CONSOLIDATED STATEMENT OF CASH FLOWS 1-6/11 1-6/10 1-12/10
Million euros
Cash flows from operating activities:
Cash generated from
operations -64,2 56,0 372,7
Financial items and taxes -26,3 -56,3 -45,4
Net cash from operating
activities -90,5 -0,3 327,2
Cash flows from investing activities:
Net cash used in investing
activities -53,5 -24,1 -33,7
Cash flows from financing activities:
Proceeds from issue of share
capital 26,4 26,6 34,7
Change in current financial
receivables and debt 11,1 125,6 -29,8
Change in non-current financial
receivables and debt -4,3 -90,2 -95,2
Dividends paid -83,7 -50,7 -50,7
Net cash from financing
activities -50,5 11,4 -141,0
Net change in cash and cash
equivalents -194,5 -13,1 152,6
Cash and cash equivalents at
the beginning of the period 216,6 62,5 62,5
Effect of exchange rate changes 0,3 1,9 1,5
Cash and cash equivalents at
the end of the period 22,4 51,4 216,6
-194,5 -13,1 152,6

APPENDIX CONSOLIDATED STATEMENT OF CHANGES IN EQUITY
A = Share capital, B = Share premium, C = Translation reserve
D = Paid-up unrestricted equity reserve, E = Fair value and hedging reserves
F = Retained earnings, G = Non-controlling interest, H = Total equity
46
Equity attributable to equity holders of the parent
Million euros A B C D E F G H
Equity, Jan 1st 2010 25,0 155,2 -90,2 0,0 0,0 667,6 0,0 757,6
Profit for the period 72,6 72,6
Other comprehensive income,
net of tax:
Cash flow hedges -0,8 -0,8
Net investment hedge -20,4 -20,4
Translation differences 69,1 69,1
Total comprehensive
income for the period 48,8 -0,8 72,6 120,7
Dividends paid -50,7 -50,7
Exercised warrants 0,5 26,1 26,6
Share-based payments 2,9 2,9
Total transactions with owners
for the period 0,5 26,1 -47,8 -21,1
Equity, Jun 30th 2010 25,4 181,4 -41,4 -0,8 0,0 692,5 0,0 857,1
Equity, Jan 1st 2011 25,4 181,4 -71,1 -0,6 8,0 793,9 0,0 937,2
Profit for the period 136,6 136,6
Other comprehensive income,
net of tax:
Cash flow hedges 0,7 0,7
Net investment hedge 0,6 0,6
Translation differences 4,4 4,4
Total comprehensive
income for the period 5,0 0,7 136,6 142,3
Exercised warrants 26,4 26,4
Share-based payments 3,8 3,8
Total transactions with owners
for the period 26,4 -79,9 -53,5
Equity, Jun 30th 2011 25,4 181,4 -66,0 0,1 34,4 850,7 0,0 1 026,0

47
APPENDIX SEGMENT INFORMATION
SEGMENT INFORMATION
Million euros 4-6/11 4-6/10 1-6/11 1-6/10 1-12/10 Change
%
Net sales
Passenger car tyres 238,8 179,5 468,5 318,7 714,7 47,0
Heavy tyres 28,3 20,3 56,7 37,1 81,0 52,8
Vianor 78,7 78,7 120,6 120,9 307,9 -0,2
Other operations 19,3 10,1 32,1 16,1 41,6 99,1
Eliminations -26,2 -28,1 -49,9 -48,6 -87,2 -2,8
Total 338,8 260,4 628,0 444,2 1 058,1 41,4
Operating result
Passenger car tyres 83,9 51,5 168,0 86,9 205,5 93,3
Heavy tyres 4,6 3,9 10,0 7,7 13,7 29,6
Vianor 5,9 6,8 -7,2 -5,1 4,0 -43,2
Other operations -1,2 0,9 -0,7 -0,5 -1,6 -35,2
Eliminations 0,0 -2,2 -4,5 -7,0 0,6 36,1
Total 93,3 60,9 165,6 82,0 222,2 101,9
Operating result, % of net sales
Passenger car tyres 35,2 28,7 35,9 27,3 28,8
Heavy tyres 16,2 19,3 17,7 20,8 16,9
Vianor 7,5 8,6 -6,0 -4,2 1,3
Total 27,5 23,4 26,4 18,5 21,0
Cash Flow II
Passenger car tyres -22,6 -2,0 -36,7 -10,5 291,2 -250,3
Heavy tyres -5,3 2,0 -13,1 -1,3 8,5 -903,0
Vianor -7,9 0,0 -20,1 -9,1 12,4 -119,7
Total -49,9 -2,5 -102,3 -27,3 318,8 -274,4

48
APPENDIX CONTINGENT LIABILITIES
CONTINGENT LIABILITIES 30.6.11 30.6.10 31.12.10
Million euros
FOR OWN DEBT
Mortgages 1,0 0,9 1,1
Pledged assets 0,0 0,0 0,0
OTHER OWN COMMITMENTS
Guarantees 6,1 5,7 6,2
Leasing and rent commitments 97,2 98,7 102,1
Purchase commitments 1,7 3,4 2,2
DERIVATIVE FINANCIAL INSTRUMENTS 30.6.11 30.6.10 31.12.10
Million euros
INTEREST RATE DERIVATIVES
Interest rate swaps
Notional amount 59,9 61,2 30,7
Fair value -0,7 -1,6 -1,3
FOREIGN CURRENCY DERIVATIVES
Currency forwards
Notional amount 412,7 371,5 563,2
Fair value -0,8 -8,1 -3,3
Currency options, purchased
Notional amount 64,6 31,6 0,0
Fair value 0,9 0,6 0,0
Currency options, written
Notional amount 113,1 71,9 0,0
Fair value -0,9 -0,6 0,0
ELECTRICITY DERIVATIVES
Electricity forwards
Notional amount 16,3 - -
Fair value 0,5 - -

49
APPENDIX DEFINITIONS OF CONSOLIDATED KEY FINANCIAL
INDICATORS
Earnings per share, euro:
Result for the period attributable to the equity holders of the parent / Average adjusted number of shares
during the period
Earnings per share (diluted), euro:
Result for the period attributable to the equity holders of the parent / Average adjusted and diluted number
of shares during the period - The share options affect the dilution as the average share market
price for the period exceeds the defined subscription price.
Equity ratio, %:
Total equity x 100 / (Total assets - advances received)
Gearing, %:
Interest-bearing net debt x 100 / Total equity
Equity per share, euro:
Equity attributable to equity holders of the parent / Adjusted number of shares on the reporting date
Operating margin:
Operating result, % of net sales
50
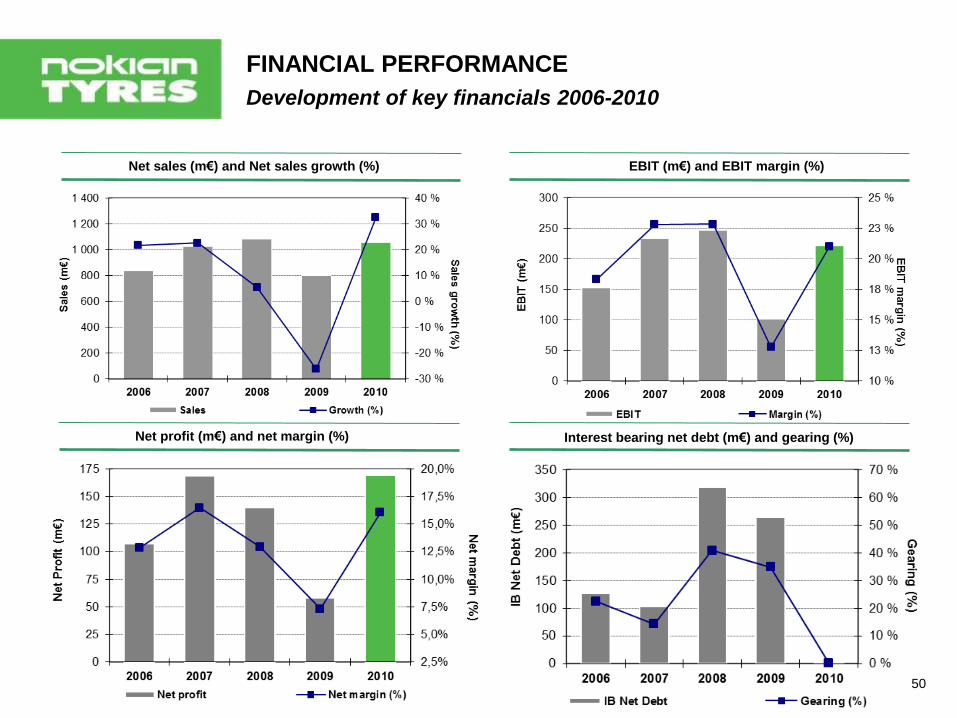
EBIT (m€) and EBIT margin (%) Net sales (m€) and Net sales growth (%)
Net profit (m€) and net margin (%) Interest bearing net debt (m€) and gearing (%)
FINANCIAL PERFORMANCE
Development of key financials 2006-2010

51
FINANCIAL PERFORMANCE
RONA (%) and net operating performance (EVA) 1) 2006-2010
1) EVA is calculated based on 12% interest on capital employed.
Manufacturing EVA (m€) and RONA (%) Group EVA (m€) and RONA (%)
Car and Van Tyres EVA (m€) and RONA (%) Heavy Tyres EVA (m€) and RONA (%)

52
FINANCIAL PERFORMANCE
Group Operating Cash Flow and Free Cash Flow 2006-2010
Group Cash flow from operations and Free Cash flow
Manufacturing Cash flow from operations Vianor Cash flow from operations
Both the Cash flow from operations and the
Free cash flow all-time high in 2010
Cash flow from operations: 318.8 m€ in 2010
Inventories’ and Trade receivables rotation days improved
Russian receivables 24% (23%) of total at year end

53