Embed Size (px)
Citation preview
GREENHOUSE GAS ASSESSMENT OF NOKIAN TYRES
Noora Markkanen
Bachelor’s thesis February 2012 Degree Programme in Environmental Engineering

ABSTRACT
Tampereen ammattikorkeakoulu Tampere University of Applied Sciences Degree Programme in Environmental Engineering MARKKANEN, NOORA Greenhouse Gas Assessment of Nokian Tyres Bachelor's thesis 60 pages, appendices 11 pages February 2013
This thesis was done for Nokian Tyres Plc in order to define the greenhouse gas emis-sions of Nokia factory. The study was carried out as a greenhouse gas assessment with “cradle-to-gate” framing by following PAS 2050 guidelines. The work included data collection and emission calculations. In addition to the assessment, the thesis work in-cluded creating a tool that could be used for calculating emission on a yearly level. The calculator was done by using Microsoft Excel -software. In 2011, the total greenhouse gas emissions of Nokia factory were 3 582 kilograms of carbon dioxide equivalents per tonne of tyres produced. 81% of the emissions were formed by raw material acquisition, 18% by production process at the factory, from which purchased energy composes 17%, and less than one per cent by offices and work trips. Since most of the emissions are caused by raw material acquisition and are there-fore difficult to control, the focus should be put on developing the procedure into more energy efficient. The results of the study cannot be directly compared to other assessments without famil-iarising oneself with the used methods. The reliability of the comparison is dependent on the chosen standard because there are differences in the defining methods between standards. Some problems were also encountered when determining the emission fac-tors and therefore their accuracy should be taken with reserve. The background data about raw materials is not published in the thesis. Also the calculator and its calculation sheets for partial processes will remain confidential. Thus, appendices 2-5 are not pub-lished.
Key words: greenhouse gas assessment, greenhouse gas, CO2e, PAS 2050
3
TIIVISTELMÄ
Tampereen ammattikorkeakoulu Tampere University of Applied Sciences Degree Programme in Environmental Engineering MARKKANEN, NOORA Selvitys Nokian Renkaiden kasvihuonekaasujen päästöistä Opinnäytetyö 60 sivua, joista liitteitä 11 sivua Helmikuu 2013
Tämä opinnäytetyö on tehty Nokian Renkaat Oyj:n toimeksiannosta Nokian tehtaan kasvihuonekaasupäästöjen määrittämiseksi. Tutkimus on tehty noudattaen PAS 2050 ohjeistusta, jonka perusteella kasvihuonekaasupäästöselvitys on rajattu koskemaan ”kehdosta portille” -rajaukseen kuuluvia prosesseja. Työ piti sisällään tiedon keräämistä sekä hiilidioksidilaskelmien tekoa. Kasvihuonekaasupäästöselvityksen lisäksi tavoittee-na oli luoda laskuri, jolla kasvihuonekaasupäästöt voitaisiin laskea vuosittain. Päästö-laskuri tehtiin Microsoft Excel -ohjelmaa käyttäen. Vuonna 2011 Nokian tehtaan kasvihuonekaasupäästöt olivat yhteensä 3 582 kilogram-maa hiilidioksidiekvivalenttia yhtä tuotettua rengastonnia kohden. Kokonaispäästöistä 81 % koostui raaka-aineiden hankinnasta, 18 % tehtaan tuotantoprosesseista, joista jopa 17 % oli ostetun energian aiheuttamia, ja alle yksi prosentti oli toimistoista ja työmat-koista aiheutuneita päästöjä. Raaka-aineiden hankinnasta aiheutuneiden kasvihuonekaa-supäästöjen pienentäminen on vaikeaa, koska valtaosa päästöistä on raaka-ainetuottajien omista prosesseista johtuvia. Näin ollen huomio tulisikin keskittää ostetun energian päästöihin energiatehokkuutta parantamalla. Kasvihuonekaasupäästöselvityksen tuloksia ei tulisi suoraan verrata muihin selvityksiin tutustumatta niiden käyttämiin ohjeistuksiin. Koska ohjeistukset eroavat toisistaan jois-sakin yksityiskohdissa, eri perustein lasketut kasvihuonekaasupäästöt eivät ole luotetta-vasti verrattavissa keskenään. Päästökertoimia on jouduttu määrittämään eri lähteitä käyttäen ja näin ollen myös niiden verrattavuuteen tulisi suhtautua varauksella. Opin-näytetyössä käytetty tausta-aineisto sekä muodostettu laskuri jäävät luottamukselliseksi. Täten liitteitä 2-5 ei ole julkaistu opinnäytetyössä.
Asiasanat: kasvihuonekaasupäästöselvitys, kasvihuonekaasu, CO2e, PAS 2050
4
CONTENTS
1 INTRODUCTION ....................................................................................................... 7
2 NOKIAN TYRES ........................................................................................................ 8
2.1 Company Basics .................................................................................................. 8
2.2 Part of Rubber Industry ........................................................................................ 9
2.3 Certificates of Nokian Tyres ................................................................................ 9
2.4 Environmental Communications of Nokian Tyres ............................................ 10
3 GREENHOUSE GAS ASSESSMENT ..................................................................... 12
3.1 Greenhouse Gases .............................................................................................. 12
3.2 Meaning of GHG Assessment ........................................................................... 12
3.3 Different Standards ............................................................................................ 13
3.3.1 ISO Standards ......................................................................................... 14
3.3.2 PAS 2050 ................................................................................................ 14
3.3.3 GHG Protocol ......................................................................................... 14
4 MAKING THE GREENHOUSE GAS ASSESSMENT OF NOKIAN TYRES ...... 16
4.1 Definitions ......................................................................................................... 16
4.1.1 Functional Unit ....................................................................................... 16
4.1.2 System Boundary .................................................................................... 16
4.1.3 Allocation ................................................................................................ 18
4.1.4 Data Collection........................................................................................ 18
4.1.5 Calculation Methods ............................................................................... 19
4.2 Raw Material Production and Transportation .................................................... 20
4.2.1 Raw Materials ......................................................................................... 21
4.2.2 Transportation Summary ......................................................................... 23
4.3 Operations of Nokian Tyres ............................................................................... 24
4.3.1 Production Process .................................................................................. 25
4.3.2 Energy ..................................................................................................... 27
4.3.3 Water Usage ............................................................................................ 29
4.3.4 Wastes ..................................................................................................... 30
4.3.5 VOC Emissions ....................................................................................... 31
4.3.6 Offices ..................................................................................................... 32
4.3.7 Work Trips .............................................................................................. 33
5 CREATING THE CALCULATOR .......................................................................... 36
6 GREENHOUSE GAS EMISSIONS OF NOKIAN TYRES ..................................... 38
6.1 Total GHG Emissions ........................................................................................ 38
6.2 Raw Material Emissions .................................................................................... 39
6.3 Waste Emissions ................................................................................................ 40
5
6.4 GHG Emissions of Energy, Water Usage and Work Trips ............................... 41
7 DISCUSSION ........................................................................................................... 43
REFERENCES ................................................................................................................ 46
APPENDICES ................................................................................................................ 50
Appendix 1. List of greenhouse gases including their lifetimes, radiative efficiencies and global warming potentials relative to CO2 (Forster et al. 2007, 158) .......................................................................................................... 50
Appendix 2. Calculations for determining production emissions and general emission factors for each raw material .............. Error! Bookmark not defined.
Appendix 3. Raw Material Information .................... Error! Bookmark not defined. Appendix 4. Main page of the GHG emission calculatorError! Bookmark not defined. Appendix 5. Partial process sheets of the calculator . Error! Bookmark not defined.
6
ABBREVIATIONS AND TERMS
CO2e carbon dioxide equivalent
ETRMA European Tyre & Rubber Manufacturers’ Association
EU the European Union
GHG greenhouse gas, a gas that absorbs and emits infrared radia-
tion in the atmosphere
GRG general rubber goods
GWh gigawatt hour
IPCC International Panel on Climate Change
ISO International Organization for Standardization
ISO 14 040 standard for life cycle assessment; Principles and Framework
ISO 14 044 standard for life cycle assessment; Requirements and Guide-
lines
ISO 14 067 standard for carbon footprint of products; Requirements and
Guidelines for Quantification and Communication
LCA Life Cycle Assessment
LCI Life Cycle Inventory
LCIA Life Cycle Impact Assessment
LIPASTO a calculation system covering emissions and energy con-
sumption of all traffic modes in Finland
PAS 2050 greenhouse gas assessment method
pkm passenger kilometre
TEU twenty-foot equivalent unit, a ship size definer
VOC volatile organic compound
VTT Technical Research Centre of Finland

7
1 INTRODUCTION
Nokian Tyres Plc (later Nokian Tyres) is a Finnish tyre manufacturer operating mostly
in Europe, Russia and North America. As sustainability and environmental friendliness
are important parts of research and development section, Nokian Tyres wanted to carry
out a greenhouse gas assessment in order to determine its own greenhouse gas (GHG)
emissions. The aim of this thesis is to carry out a study where the greenhouse gas emis-
sions of Nokian Tyres plant in Nokia are assessed and calculated. Even though, Nokian
Tyres has two factories, one at Nokia and the other one at Russia, Vsevolozhsk, this
greenhouse gas assessment is done for Nokia plant.
The assessment is done by following the instructions given by PAS 2050 Standard,
which is a method for assessing the life cycle greenhouse gas emissions of goods and
services (British Standards Institution 2011, 1). The system boundary is set to be “cra-
dle-to-gate”, which means that assessment includes emissions that are emitted before
leaving the company property. Thus, raw material production and transportation, proce-
dure at Nokia, purchased energy and work transportation are included into assessment.
Greenhouse gas assessment should not be regarded as total “cradle-to-grave assess-
ment” because it does not include retail, usage or neither final disposal. However, in this
case “cradle-to-gate” is more appropriate in order to define the GHG emissions of
Nokian Tyres factory itself.
Another part of the work process consists of creating a tool for calculating GHG emis-
sions on a yearly level. The calculator is created by using Microsoft Excel software. In
the future, emissions can be calculated by entering production data of a certain year into
the calculator.
8
2 NOKIAN TYRES
2.1 Company Basics
Nokian Tyres was founded in 1988 and went public in 1995. However, Nokian Tyres
has its history in Suomen Gummitehdas Oy that was founded already in 1898. Nokian
Tyres manufactures passenger car tyres and heavy tyres that are used in trucks and har-
bour, forest and mine vehicles. Besides tyre production, Nokian Tyres manufactures
also truck tyre treads that enable reuse of tyres. (Nokian Tyres 2011a.)
As mentioned earlier, Nokian Tyres has two factories that are at Nokia, Finland and
Vsevolozhsk, Russia. Some of the products (approximately 5%) are however made in
other contract factories that meet the quality requirements of Nokian Tyres. The compa-
ny has sales offices in Sweden, Norway, Germany, Switzerland, Russia, Ukraine, Ka-
zakhstan, Czech Republic, the United States and Belarus. In other countries, the sales
are taken care of by importers. Tyre chain Vianor is a member of Nokian Tyres group
and operates as a wholesaler and a retailer in the core market of Nokian Tyres. (Nokian
Tyres 2011a.)
According to Nokian Tyres Annual Report, (Will to win 2011) in year 2011, the net
sales were 1 456,8 million Euros and average number of personnel was 3 866. Annual
production capacity was approximately five million passenger car tyres and 15 thousand
tonnes of heavy tyres at Nokia factory whereas at Vsevolozhsk, there were 11 million
passenger car tyres produced. As much as 80% of passenger car tyre net sales are
formed by winter tyre sales. Winter tyres, most precisely Nokian Hakkapeliitta, are the
key products of Nokian Tyres. For example, in the autumn 2012, Nokian Hakkapeliitta
was chosen to be the winner in winter tyre tests of several car magazines, such as Finn-
ish Tuulilasi (13/2012), Swedish Vi Bilägare (14/2012) and Norwegian Motor (7/2012).
In order to ensure the high quality of tyres, Nokian Tyres puts effort on research and
development. As an example, Nokian Tyres has a test centre in Ivalo, Lapland, where
tyres can be tested in extreme winter conditions.

9
2.2 Part of Rubber Industry
Tyre production is only a part of rubber industry. According to Kumiteollisuus Oy
(Kumiteollisuus Oy, 2013), rubber products are divided into three categories in Finland:
tyres, technical rubber products and rubber boots. However, ETRMA (European Tyre &
Rubber Manufacturers’ Association) classifies rubber industry into two sections that are
tyres and general rubber goods (GRG) (ETRMA, 2011a).
General rubber goods consist of many different rubber applications. However, as much
as 65% of GRG is covered by automotive area. The automotive products are different
parts and components, such as window seals and fan belts. The rest of GRG consists of
pharmaceutical and mining products that are for example medical probes and mining
components. (ETRMA, 2011a.)
Tyre production has many operators but the biggest tyre companies are Bridgestone,
Continental, Goodyear, Michelin and Pirelli. Even though Nokian Tyres is well-known
in Finland, it is a minor manufacturer in global markets. Nokian Tyres is a member of
Kumiteollisuus Oy, which is a coalition of rubber manufacturers in Finland. Moreover,
Nokian Tyres is a member of ETRMA, which represents the rubber industry of the Eu-
ropean Union (EU) district in Brussels and controls international and EU level projects.
(Kumiteollisuus Oy, 2013; ETRMA, 2011a.)
2.3 Certificates of Nokian Tyres
Nokian Tyres has several certificates that are supposed to guarantee the high level of
performance. Environmental certificate ISO 14 001 and quality certificate ISO 9 001 are
given to both factories and also to the Swedish sales company Nokian Däck. Further-
more, Nokia plant has also EMAS (the Eco-Management and Audit Scheme) regulation,
which consists of environmental report and environmental management system that is in
accordance with ISO 14 001 standard. Through EMAS regulation, Nokian Tyres is ob-
ligated to report about its actions. (Responsible Development 2010, 14.)
10
2.4 Environmental Communications of Nokian Tyres
Environmental communications is essential for showing your products or functions to
be environmentally friendly. It is almost impossible to see environmental actions
straight from the product. Therefore, also Nokian Tyres is paying attention to environ-
mental communications, which is supposed to inform about all environmental issues
and also about environmental risks and responsibilities.
According to Kärkkäinen (2006, 23), environmental communications of companies and
organisations can be divided into five sections, which are environmental reporting, envi-
ronmental communication, environmental information, environmental marketing and
investor information (Lovio 2004). The environmental reporting of Nokian Tyres con-
sists of environmental reports, society responsibility reports and special processes, such
as greenhouse gas assessments. Nokian Tyres has published many environmental re-
ports during past years – wider EMAS (The Eco-Management and Audit Scheme) re-
ports every three years and smaller EMAS reports in all other years (Nokian Tyres,
2011b).
Environmental communication includes presenting environmental issues in company’s
internal and external magazines without forgetting the participation in public discus-
sions (Kärkkäinen 2006, 23, according to Lovio 2004, 351). Nokian Tyres has an inter-
nal communication tools, such as internal magazine and info-TV, in Nokia factory.
Nokian Tyres is also taking part of public conversation via its decisions on using non-
hazardous substances. In fact, Nokian Tyres is the first tyre manufacturer that discontin-
ued using high-aromatic oils in rubber compounds in 2005. By that decision, Nokian
Tyres put pressure on other tyre producers in Europe, which lead into prohibition of
importing and selling high-aromatic tyres inside the European Union in 2010. (Will to
Win 2011.)
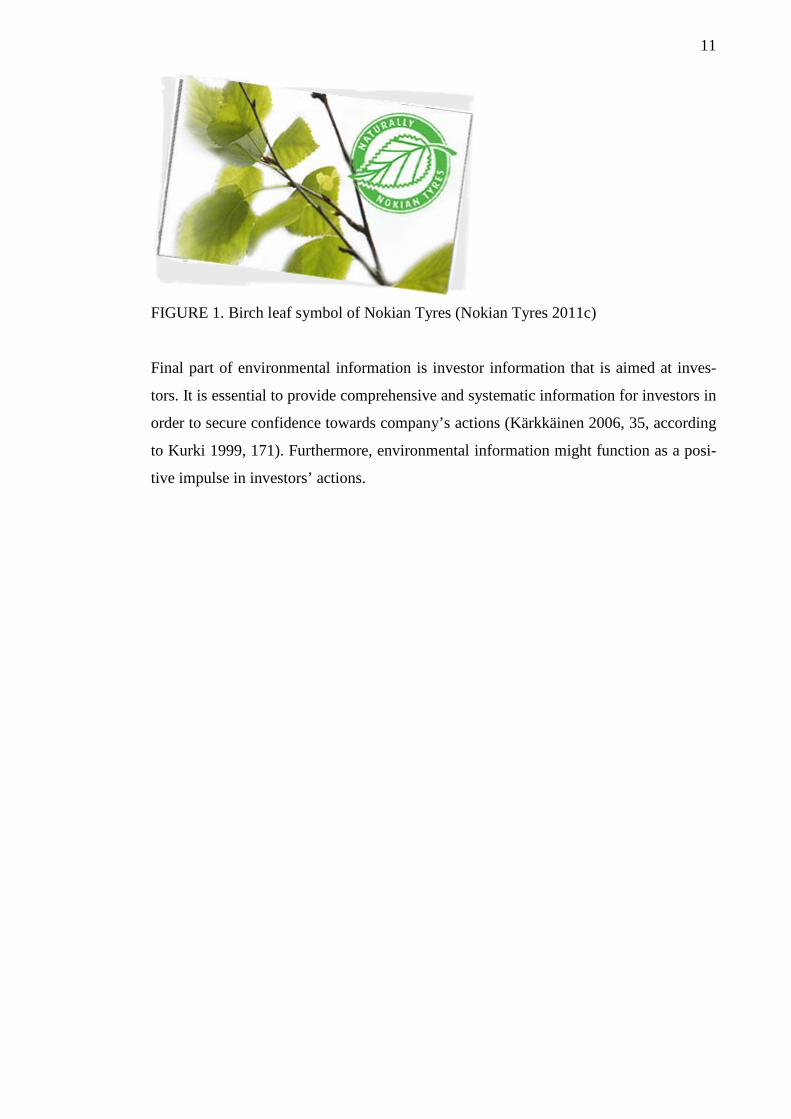
Nokian Tyres advertises its products as green (figure 1) and emphasises product devel-
opment as a key for more environmentally friendly tyres (Nokian Tyres 2011c). For
example, via product development Nokian Tyres has invented new techniques for pro-
ducing more silent tyres, which again decreases environmental noise.
11
FIGURE 1. Birch leaf symbol of Nokian Tyres (Nokian Tyres 2011c)
Final part of environmental information is investor information that is aimed at inves-
tors. It is essential to provide comprehensive and systematic information for investors in
order to secure confidence towards company’s actions (Kärkkäinen 2006, 35, according
to Kurki 1999, 171). Furthermore, environmental information might function as a posi-
tive impulse in investors’ actions.
12
3 GREENHOUSE GAS ASSESSMENT
3.1 Greenhouse Gases
Greenhouse gases (GHGs) are gaseous constituents in the atmosphere that are released
either by natural or anthropogenic sources. Greenhouse gases emit and absorb radiation
at specific wavelengths within the thermal infrared range. This property causes the
greenhouse effect, which means that the temperature is rising on the surface level be-
cause of radiation.
According to IPCC, there are 63 greenhouse gases determined (Forster et al. 2007, 211),
which are also presented in appendix 1. The most common ones are carbon dioxide,
nitrous oxide, methane, perfluorocarbons, hydrofluorocarbons and sulphur hexafluoride.
Water vapour and ozone are not included in the GHG list of IPCC, because they are
indirect pollutants. Moreover, water vapour is mostly not human-made gas and there-
fore categorised differently. (Forster et al. 2007, 152.)
Due to the impact that greenhouse gases have on the climate, several actions have been
made in order to decrease the amount of released GHGs. In 1992, United Nations (UN)
signed an international treaty, the United Nations Framework Convention on Climate
Change, in order to settle the greenhouse gases on the level, which is not hazardous on
the environment. In 1997, the treaty was expanded with Kyoto Protocol, which is legal-
ly binding the parties to reduce their emissions. Kyoto Protocol for example defines
discharge limits that cannot be exceeded for the countries. (Kokko 2012, 12.)
3.2 Meaning of GHG Assessment
Greenhouse gas assessment is a method for assessing the greenhouse gas emissions of a
product or service. GHG assessment includes only greenhouse gases, not any other air
pollutants. GHG assessment is a part of life cycle assessment (LCA), which takes into
account all environmental effects within a life cycle. GHG assessment is done by using
some of the work phases of LCA, such as life cycle inventory (LCI), which is the data
13
collection phase and life cycle impact assessment (LCIA), which means calculating
emissions in order to determine environmental impacts. (Kokko 2012, 16-19.)
Greenhouse gas emissions can also be referred to carbon footprint. The meaning of
GHG assessment is to find out the hotspots of the process in order to develop them into
a more efficient direction. At the same time, processes have to be monitored, which
helps common reporting and measuring progress and capacity in the long run. (Kokko
2012, 11.)
GHG emissions have a meaning for external relations, as well. While people’s interest
and awareness towards environmental issues has risen, the amount of emissions is more
often a reason behind a decision. Policymakers are often validating their decisions based
on environmental friendliness. Therefore, low-emission products get a competitive ad-
vantage. The same happens with consumers – greener products are preferred when
choosing from two equal items. Thus, representing GHG emissions of a product gives
an opportunity to influence the purchasing behaviour of people. (Kokko 2012, 11.)
Emission accounting is still quite new branch of science and therefore there are some
problems involved. Assessments are incomparable and reporting is inadequate. There
are several guidelines and standards that are used for making GHG assessments. Thus,
results may not be comparable between two assessments if they are done by using dif-
ferent guidelines. For example, determining system boundary differently will result in
incomparable results. However, development has been made for harmonising instruc-
tions by creating international standards for LCA, such as ISO 14 040, ISO 14 044, PAS
2050 and GHG Protocol. In addition to these standards, ISO 14 067 for carbon footprint
accounting is under development. (Kokko 2012, 11-12.)
3.3 Different Standards
As mentioned earlier, there are different standards used in the field of environmental
assessments. Many of the standards are applicable for several fields and therefore they
give non-specific instructions, which leads into incomparable results. However, some of
the standards utilise Product Category Rules (PGRs), which help to take account all
relevant matters. On the other hand, the usage of PGRs is questionable because the rules
14
are created by different countries and by different methods. Due to the high number of
standards, this report is representing the four standards mentioned earlier. (Kokko 2012,
22.)
3.3.1 ISO Standards
ISO (International Organization for Standardization) published the very first standards
for LCA in 1997, which were ISO 14 040 and ISO 14 044. Both standards have been
updated later. ISO 14 040 represents the principles and framework of life cycle analysis
whereas ISO 14 044 determines the requirements and guidelines. (Kokko 2012, 22-23.)
The standard for making a carbon footprint of products (ISO 14 067) is under develop-
ment. According to ISO, the purpose of ISO 14 067 is to “provide requirements for the
quantification and communication of greenhouse gases (GHGs) associated with prod-
ucts” (ISO, 2009). The first part of standard quantifies the carbon footprint, whereas the
second part is used for guiding the communication. ISO 14 067 will take account land-
use changes and usage of renewable energy as PAS 2050 does already. (ISO 2009;
Kokko 2012, 23.)
3.3.2 PAS 2050
PAS 2050 was introduced in 2008 by the British Standards Institution (BSI). The stand-
ard was mainly funded by Carbontrust, which is an English non-profit organisation and
by UK government department DEFRA (Department for Environment, Food and Rural
Affairs). PAS 2050 was the first international standard for quantifying a carbon foot-
print and it has been used as a basis for developing other carbon footprint standards.
(Kokko 2012, 23; GHG Protocol 2012c.)
3.3.3 GHG Protocol
The Greenhouse Gas Protocol (GHG Protocol) is a collaboration of the World Re-
sources Institute (WRI) and the World Business Council for Sustainable Development
15
(WBCSD). GHG Protocol provides instructions for governments and organisations in
order to understand, quantify and control their GHG emissions. GHG Protocol was
founded in 1998. (Kokko 2012, 24.)
GHG Protocol has published calculation tools for different fields of industries, which
are either general or concentrate on a specific process. Sector specific tools are available
for some industry sectors, such as aluminium, pulp and paper, lime, iron and steel. In
addition to calculation tools, GHG Protocol has released standards for quantifying GHG
emissions. Standards are divided into two main groups, from which the first one is di-
rected to companies and organisations and the second group for climate change mitiga-
tion projects. GHG Protocol Product Standard was released in 2011 for quantifying the
GHG emissions. In addition to requirements for determining emissions, it also includes
requirements for public reporting. (GHG Protocol 2012a; GHG Protocol 2012b; GHG
Protocol 2012c; Kokko 2012, 24.)
16
4 MAKING THE GREENHOUSE GAS ASSESSMENT OF NOKIAN TYRES
4.1 Definitions
As mentioned earlier, this GHG assessment includes only Nokia factory and from now
on Nokian Tyres is referring to Nokian Tyres Nokia plant. The assessment is done by
using PAS 2050 method (British Standards Institution 2011). According to PAS 2050,
all the 63 greenhouse gases listed by IPCC (International Panel on Climate Change)
have to be taken account (appendixes 1). However, most emission factors used in this
assessment only include carbon dioxide, methane, nitrous oxide and different fluorocar-
bons. Even though water vapour has a remarkable effect on climate change, IPCC does
not include it to the greenhouse gas list, because water vapour is mostly non-human-
made gas (Forster et al. 2007, 152). Therefore, it is also excluded from the greenhouse
gas assessment.
4.1.1 Functional Unit
According to PAS 2050 (British Standards Institution 2011, 5-6), GHG assessment
needs to have a functional unit as a reference, to which all other inputs and outputs are
related. Functional unit helps to ensure that all flows are consistent and comparable with
each other.
Before determining the functional unit of Nokian Tyres, other tyre companies and their
reports were studied. For example, Michelin reports its emissions as tonne of tyre pro-
duced (Michelin 2012, 61). Therefore, the functional unit in this assessment was set to
be “one tonne (1000 kg) of tyre produced” in order to ease comparability.
4.1.2 System Boundary
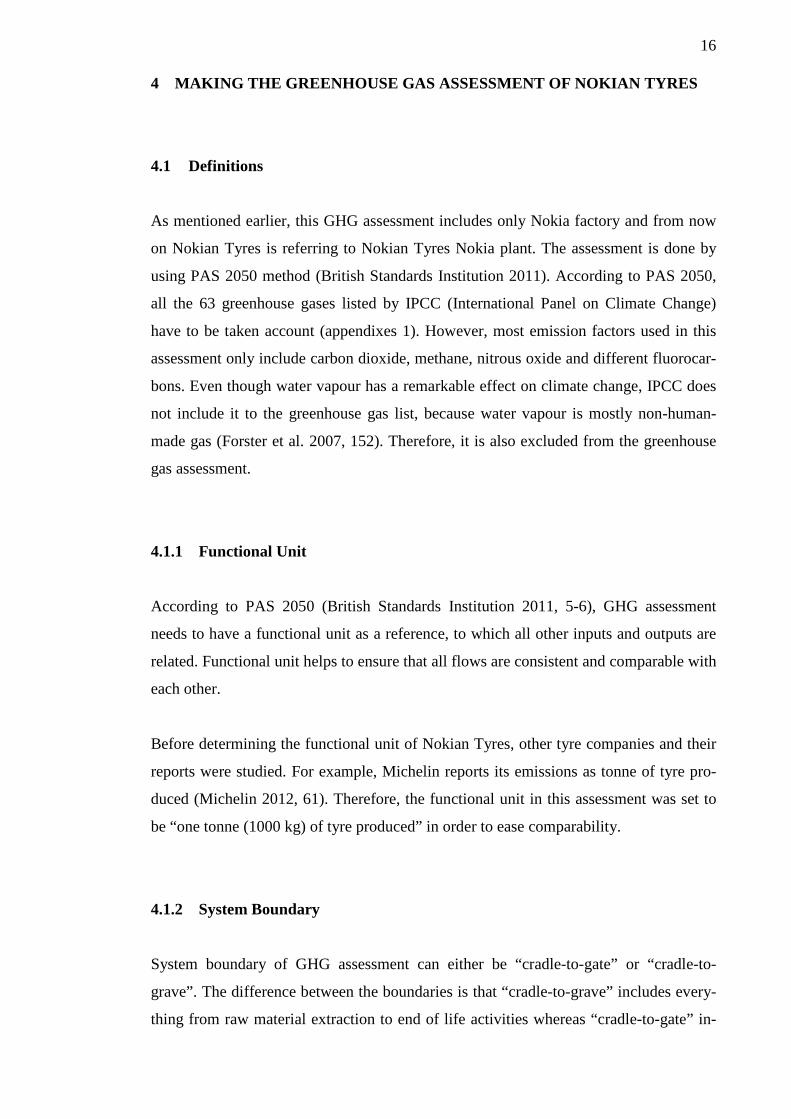
System boundary of GHG assessment can either be “cradle-to-gate” or “cradle-to-
grave”. The difference between the boundaries is that “cradle-to-grave” includes every-
thing from raw material extraction to end of life activities whereas “cradle-to-gate” in-
17
cludes all emissions up to the gate of the organisation undertaking the assessment.
Therefore, “cradle-to-gate” is more appropriate framing for the GHG assessment of
Nokian Tyres (figure 2). According to PAS 2050, also raw material acquisition is in-
cluded into calculations. However, society infrastructure, such as using roads, and land
usage are excluded. (British Standards Institution 2011, 9-10, 35.)
According to PAS 2050, capital goods like machines and buildings having lifespan over
one year should be excluded. Therefore, office furniture and work clothes are also ex-
cluded from the assessment. However, consumables having lifespan less than one year
should be taken account. Therefore, for example printing paper is included in the GHG
assessment. Moreover, the basic rule for excluding is that “components or materials
contributing less than 1 per cent of the dry mass of a product can be excluded, as they
are likely to be immaterial” (British Standards Institution 2011, 10). Thus, minor factors
can be left out at the same time ensuring that at least 95% of emissions are taken into
account. (British Standards Institution 2011, 10-11.)
FIGURE 2. System boundaries for Nokian Tyres. Cradle to gate framing used in this
assessment presented with green colour.
18
4.1.3 Allocation
Some processes generate more than one useful output. In that case, PAS 2050 guides to
divide, or in other words to allocate, input and output flows between the product and co-
products. In this assessment, no allocation has been made because resources are given
as a total. In addition, the aim is to define the greenhouse gases for the whole factory,
not only to some production line of it. Therefore, all inputs and outputs refer to deter-
mined functional unit, tonne of tyres produced, and no allocation is needed. (British
Standards Institution 2011, 27.)
4.1.4 Data Collection
In order to make the assessment variety of information is needed and collected from
different sources. Primary data is provided by Nokian Tyres and it includes for example
energy usage and production information. It is either collected by Nokian Tyres or by its
suppliers. By following the guidelines of PAS 2050, resource flows were gathered to-
gether into an Excel sheet based on the partial processes. Then flows were balanced to
reflect the functional unit, which enabled further calculations. The balancing was done
by following three golden rules of PAS 2050 (British Standards Institution 2011, 24),
which are
• “always consider waste in the process
• make calculations as transparent as possible, so they can be traced backwards
• record all assumptions and data concerns”.
Secondary data is mostly used either for filling gaps in primary activity date or for de-
fining emission factors for different products or processes. Secondary data can be divid-
ed into two categories, which are “aggregated” and “disaggregated”. By aggregated data
is meant previously calculated emission factors that can be found from technical reports
and other studies. Disaggregated data mean details about specific raw materials and
individual emissions that are mostly found in life-cycle inventory (LCI) databases.
(British Standards Institution 2011, 16.)
19
Most of the secondary data used in this assessment is aggregated. The challenge of us-
ing aggregated data is to make sure that emission factors are consistent with PAS 2050.
Problems can arise if the system boundaries are set differently or the emission factor
should be location-specific (British Standards Institution 2011, 17). For example, grid
electricity manufacture differs significantly between countries and therefore an emission
factor determined in Russia is not valid in Finland. Also, exhaust gases of cars differ
between countries. A newer car pool has more and better catalytic converters than an
older car pool. Therefore, an emission factor determined for a new car should not be
regarded as valid in Eastern Europe.
4.1.5 Calculation Methods
GHG emissions can be calculated by two ways, which are using either an emission fac-
tor or global warming potential (GWP). The usage of an emission factor enables calcu-
lating GHG emissions for a function or a material (formula 1). Emission factor means a
measure of a pollutant discharged into atmosphere. Emission factor is announced as
carbon dioxide equivalent kilograms (kg CO2e) per a certain unit.
𝐴 × 𝐸 = 𝐺𝐻𝐺 𝐸𝑚𝑖𝑠𝑠𝑖𝑜𝑛𝑠 (FORMULA 1)
A = activity data (kg/litres/kWh/tkm etc.)
E = emission factor (kg CO2e per kg/litres/kWh/tkm etc.)
GHG Emissions = kg CO2e
Global warming potential is defined as “the time integrated commitment to climate forc-
ing from the instantaneous release of 1 kg of a trace gas expressed relative to that from
1 kg of carbon dioxide” (Shine, Derwent, Wuebbles & Morcrette, 1990, 58). In other
words, GWP states the ratio of warming potential relative to carbon dioxide and consid-
ered time period. Thus, other greenhouse gases can be converted to be consistent with
carbon dioxide, which helps calculation and comparing. GWP can be used when calcu-
lating direct emissions of a certain gas (formula 2) (British Standards Institution 2011,
27.) Direct emissions of individual gases can then be combined in order to get total
emissions of a certain source. Hence, GWP can be used when handling disaggregated
data.
20
𝑀 × 𝐺𝑊𝑃 = 𝐺𝐻𝐺 𝐸𝑚𝑖𝑠𝑠𝑖𝑜𝑛𝑠 (FORMULA 2)
M = mass of GHG
GWP = global warming potential
GHG Emissions = kg CO2e
GHG emissions are calculated individually for each emission source and then combined
based on the division of partial processes. In the end, all the emissions are calculated
together in order to get the total number of GHG emissions.
4.2 Raw Material Production and Transportation
According to PAS 2050, GHG assessment includes raw materials that form over one per
cent of tyre composition (British Standards Institution 2011, 10). However, some other
materials forming less than one per cent are also included when information available.
Due to a tight schedule, no questionnaires were sent to raw material producers for get-
ting information for calculating their emissions. Instead, emissions for raw material
production are determined by using an earlier research report of WSP (Tiri, Anton &
Käpynen, 2011), from which original emission factors for the production of raw materi-
als can be solved (appendix 2).
GHG emissions of raw material acquisition are calculated by adding transportation
emissions to production emissions. In order to calculate them, the tyre composition has
to be known as well as the production locations of different raw materials. Also, trans-
portation type is needed for calculating the transportation emissions that are included in
raw material acquisition. Tyre composition, production location and transportation types
are provided by Nokian Tyres (appendix 3).
Whereas GHG emissions for raw material production are calculated by using emission
factors defined based on WSP report, transportation emissions are calculated by using
transportation type together with the distance between origin and destination. Some
simplifying assumptions are made when determining distances and choosing right emis-
sion classes for transportation types. Also, some grouping is done according PAS 2050
21
for certain raw materials, such as “protective agents”, in order to simplify the calcula-
tion process (British Standards Institution 2011, 27).
4.2.1 Raw Materials
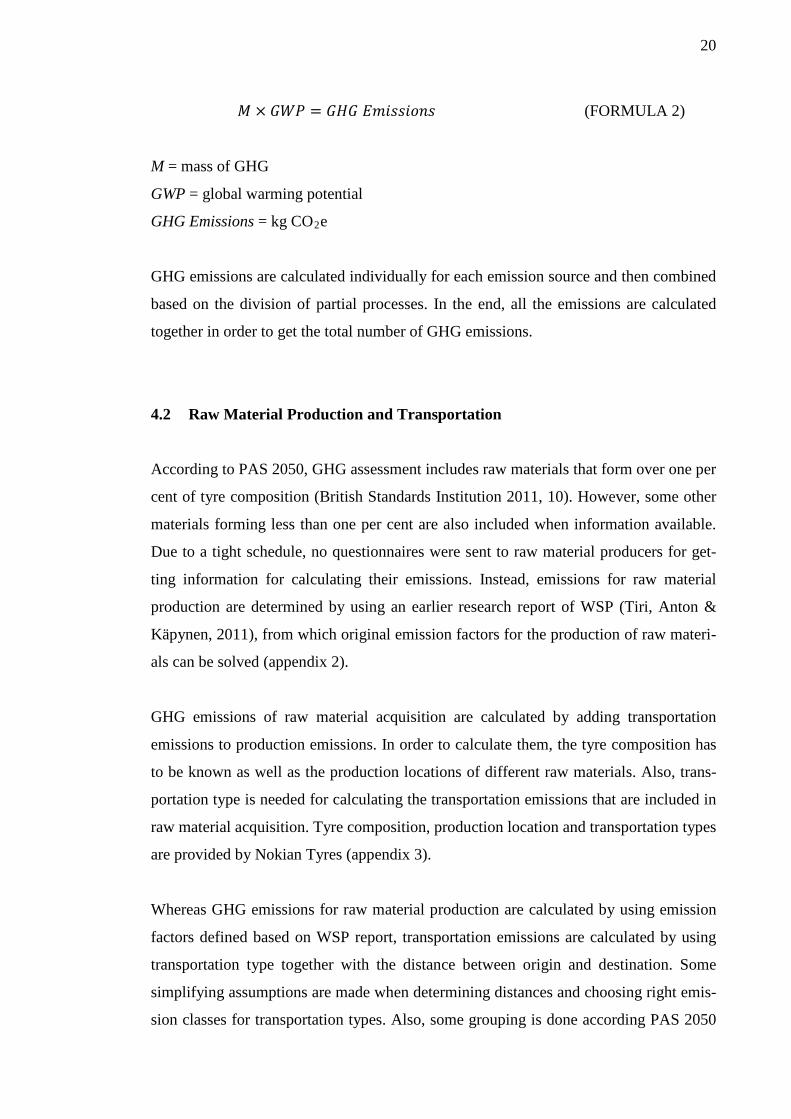
A tyre consists of many different materials. In addition to rubber compound, it also has
steel and textiles as reinforcing materials. The composition of rubber compounds can be
seen from figure 3 (Nokian Tyres 2011d). Approximately, 40% of tyre is composed of
carbon black and natural rubber, which are the main components of tyre. Other two ma-
terial groups having a higher content in tyre are synthetic rubber and steel plies and
wire. These four materials are further explained in the following sections. Other materi-
al groups in tyre are protective agents, booster chemicals that are also known as activa-
tors, vulcanising agents and plasticisers (appendix 3). (Nokian Tyres 2011d.)
FIGURE 3. The raw material composition of rubber compounds used at Nokian Tyres
(Nokian Tyres 2011d)
Carbon Black
Carbon black is made by burning hydrocarbons in a limited air. Burning process forms
black smoke, which contains small particles that can be separated in order to get carbon
black powder, which is also known as carbon black. Approximately 70% of all carbon
black is used as a reinforcing agent in tyre manufacturing. Other usages are industrial
rubber products, paints, paper, plastics, ceramics and other automotive parts, such as
belts. (Crump 2000, 1-2.) Further information about the origin and the amount of carbon
black used at Nokian Tyres is provided in appendix 3.
22
Natural Rubber
Natural rubber is made from the latex of rubber trees that are grown in warm areas, such
as South-East Asia, Middle and South America and Africa. Most of natural rubber is
used for car tyres but some technical rubber products, such as seals, are also produced.
Natural rubber production forms roughly 40% of all rubber raw materials. The benefi-
cial characteristics of natural rubber are high wear resistance and cold tolerance. How-
ever, in hot conditions it has weaker properties than synthetic rubbers. (Kumiteollisuus
Oy, 2013.) The origin of natural rubber used at Nokian Tyres and its amount are pre-
sented in appendix 3.
Synthetic Rubber
Synthetic rubber is produced by mixing butadiene and styrene in a reactor that contains
soapsuds. As a result, liquid latex is formed for further processing. There are several
different synthetic rubbers produced, which all have different characteristics. For exam-
ple, other synthetic rubbers have a high wear resistance whereas others have a high elas-
ticity. Based on the properties, synthetic rubbers can be used for different purposes.
(ETRMA, 2011b.) Even though tyres contain many different synthetic rubbers, this as-
sessment concentrates on the four biggest that are presented more precisely in appendix
3. Also, production locations and percentage amounts per production tonne are provided
in appendix 3.
Steel Plies and Wire
Steel plies and wire are used in tyre as reinforcing materials. Approximately 70% of
used steel material is formed by steel ply and 30% by steel wire. Steel plies and wire are
produced in different countries, as can be seen from appendix 3. The total amount of
steel materials in production tonne is presented in appendix 2.
Other Raw Materials and Chemicals
According to PAS 2050, materials forming at minimum one per cent of production
tonne have to be included (British Standards Institution 2011, 10). However, due to con-
fidentiality agreement, rest of the raw materials are discussed in appendix 2 and 3.
23
4.2.2 Transportation Summary
There are 19 raw materials (appendix 2) taken account when calculating emissions from
raw material acquisition. Based on those 19 materials, 17 raw material groups are creat-
ed in order to simplify calculations when similar materials in question (British Stand-
ards Institution 2011, 27). Closest material comes from Finland whereas the furthest
material is transported from Indonesia. Transportation type and route are chosen based
on the place of departure. Transportation of raw materials can be summarised in the
following way
• Raw materials produced in Central Europe are transported by truck first to Ros-
tock, from which freighted to Helsinki with ocean freight ship. Third part of
transportation consists of freight truck from Helsinki to Nokia.
• Raw materials from England are shipped by oceanic freight ship to Helsinki. In
addition to ship transport, materials are transported by truck to Nokia. Due to
short distances inside England, the transportation from production sites to har-
bour is excluded.
• Raw materials produced in Russia are transported by truck to Nokia.
• Raw materials from Asia are shipped by transoceanic freight ship to Helsinki,
from which onwards to Nokia by truck. Due the long distance from Asia, the
transportation to harbour in departure country is excluded.
Transportation emissions are calculated by using a calculation system called LIPASTO,
which is created by VTT (Technical Research Centre of Finland) for calculating emis-
sions and energy consumption of all traffic modes in Finland. Transportation emissions
include only direct emissions. Therefore infrastructure and for example road abrasion
are left out from the emission calculations. (LIPASTO 2012.)
Road Transportation
In this assessment, the truck used for calculations is supposed to be a semi trailer com-
bination. The carrying capacity is 25 tonnes and the route is supposed to contain only
highway driving. Naturally, there is also urban driving involved but the calculation pro-
cess is simplified by using only highway emission information. Emissions are calculat-
ed for a full load (25 tonnes) by using tonne-kilometres, which refers to transporting one
tonne of material for a distance of 1 kilometre. Instead of determining a specific emis-
24
sion standard, by which are meant EURO emission classes determined by EU, the aver-
age is used in order to enable using the same emission information also for transporta-
tion abroad. Average classification is chosen because there is no reliable information
available for determining country-specific truck emissions. (British Standards Institu-
tion 2011, 38; LIPASTO 2012.)
Oceanic Freight Ship Transportation
Freight ships are divided based on their size and purpose. Ocean freight ship used in the
assessment is container ship 1 TEU, which means a twenty-foot equivalent unit contain-
er. LIPASTO supposes the load to be 65% of the maximum. Emissions are calculated
by using tonne-kilometres presented by LIPASTO. Ocean freight ship is used for Baltic
Sea shipping. (LIPASTO 2012.)
Transoceanic Freight Ship Transportation
As explained earlier, TEU means a twenty-foot equivalent unit. Therefore, transoceanic
freight ship 2 TEU used in the assessment refers to a 40 feet equivalent unit container.
Also, for transoceanic freight ship the load is set to be 65% of maximum and the emis-
sions are calculated by using tonne-kilometres. (LIPASTO 2012.) Transoceanic freight
ship is used for global shipping. Even though 2 TEU ships do not operate in the Baltic
Sea, the same emission factor is used for the whole distance instead of using 2 TEU
until Rotterdam and then adding shipping with 1 TEU from there to Finland.
4.3 Operations of Nokian Tyres
In addition to raw material acquisition, this GHG assessment also includes operations
that are related to Nokia factory property. Those elements are the production process
itself, offices, purchased energy, water usage and created wastes. According to PAS
2050, also work trips are included when differing from the normal trip between home
and workplace (British Standards Institution 2011, 11).
There are three main production lines in Nokia factory – passenger car tyres (PC1),
heavy tyres (PC2) and re-treading (PC4). In addition to these production lines, rubber
adhesives are also produced, from which a portion is sold forward. (Ympäristö-
lupapäätös 2007, 3.) Information given about energy usage and other figures is not di-
25
vided between different processes. Therefore, for example the amount of waste is not
divided between production, offices and cafeterias. That is why also results about GHG
emissions are given as a total for the whole Nokian Tyres plant. Emissions are calculat-
ed based on the functional unit, one tonne of tyre produced. According to PAS 2050,
social structure of resources, for example electrical network, is left out of the assess-
ment (British Standards Institution 2011, 11). Some simplifying assumptions are made
when needed.
4.3.1 Production Process
There are six main phases in tyre manufacturing process, which are presented in figure
4. First step is to receive raw materials. As mentioned earlier, the raw materials used at
Nokian Tyres are non-toxic. Before taking into use, every batch of raw material is tested
in a laboratory in order to ensure the required quality. After passing laboratory test, raw
materials are used for different rubber compounds. Mixing department produces com-
pounds according to precise recipes. The recipe depends on the needed characteristics of
the tyre. Main components are carbon black, natural rubber, synthetic rubber and oil.
Finished rubber compounds are then used in component manufacturing. (Ympäristö-
lupapäätös 2007, 4; Responsible Development 2010, 11.)
FIGURE 4. Process chart of Nokian Tyres
26
Third phase of tyre manufacturing is component manufacture (figure 4), which means
producing several tread components from rubber compounds, textile materials and met-
al cords. Treads include for example body plies, inner linings, beads, cores, sidewalls,
sidewall wedge inserts, triangular fillers and steel belts. One tyre consists of 10-30
components, from which most are reinforcing elements. (Responsible Development
2010, 11.)
Fourth phase in manufacturing process is assembly, as presented in figure 4. Tyre-
building machine combines components together in order to create a so called “green
tyre”. In passenger car tyre line, there are two main parts in the machine, body side and
belt side. Body side runs inners and sidewalls together with a suitable amount of rein-
forcing materials while belt side forms a tread package that consists of steel belts and
surface rubber. Then machine adds cables, turns sidewalls and rolls the tread package
on. Heavy tyres, however, are assembled in a different way. Rubber and reinforcing
materials are assembled on preform. This operation needs adhesives and solvents in
order to increase the adherence of components. (Ympäristölupapäätös 2007, 5; Respon-
sible Development 2010, 11.)
Green tyres are soft and malleable. Therefore, the next phase in manufacturing process
is vulcanisation (figure 4). Before vulcanisation inner surface of preform tyre is treated
with chemical liquid in order to avoid curing cushion to adhere tyre. Then green tyre is
vulcanised in a curing press under right temperature and pressure in order to make it
solid and flexible. Also tyre’s final shape, tread pattern and sidewall markings are given
in the curing press. Curing time depends on tyre; passenger car tyres are cured for 7-15
minutes, whereas heavy tyres for 35 minutes up to 5 and half hours. (Ympäristö-
lupapäätös 2007, 5.)
After vulcanisation, every tyre is inspected both visually and manually (figure 4). Visu-
al inspection concentrates on appearance, whereas mechanical inspection measures
roundness, force difference and radial throw. Then tyres are labelled, packed and trans-
ported to logistics centre, from which they are sent forward to retailers. Based on the
chosen system boundary, the logistics centre is excluded from the assessment because it
is located outside the factory property. Therefore, also transportation between the facto-
ry and the logistics centre is left out. (Responsible Development 2010, 11; British
Standards Institution 2011, 9.)

27
In addition to passenger car tyre and heavy tyre production, there is also re-treading
production line (PC4). Tread manufacturing processes are extrusion, pre-vulcanising
and roughening of surface. Then bottom is treated with rubber adhesive. The main dif-
ference compared to tyre production is the high amount of solvents used, which is sup-
posed to ensure the adherence of components. Finished treads are used in tyre re-
treading sites. (Ympäristölupapäätös 2007, 5.)
4.3.2 Energy
Energy used at Nokian Tyres is either steam, industrial water (heat) or electricity
(Ympäristölupapäätös 2007, 12). In 2011, the total amount of used energy was 187 693
MWh. As can be seen from table 1, almost half (47%) of the total energy was electricity
(87 595 MWh) and the rest 32% steam (60 397 MWh) and 21% heat (39 701MWh).
TABLE 1. Energy usage at Nokian Tyres in 2011
Electricity Steam Heat Total
Total (MWh/year) 87 595 60 397 39 701 187 693
kWh/production tonne 1,22 0,84 0,55 2,62
% 47 32 21 100
Electricity
According to electricity supplier of Nokian Tyres, the electricity production is based on
Nord Pool Spot power market, which is the leading power market in Europe having 370
companies from 20 different countries trading (Nord Pool Spot 2013). Nord Pool Spot
releases a report yearly about the distribution of power production types. Since report
discusses fossil fuels as a one category, fossil fuels are further divided by using a divi-
sion graph released by Finnish Energy Industries, which is an industrial policy and la-
bour market policy association of electricity and district heating industry (Finnish Ener-
gy Industries, 2012).
After clarifying the division of different electricity types, the amounts of certain elec-
tricity used can be calculated. For example, the amount of hydropower is announced to
be 0,7% of the total, which gives 613 MWh (87 595*0,007=613). When electricity
28
sources are known, GHG emissions for electricity types can be calculated with formula
1 by using emission factors determined by International Panel for Climate Change
(Garg et al. 2006, 23-24). Since nuclear power, wind power and hydropower are so
called green energy, their emission factor is zero.
Steam and Heat
Steam and heat (industrial water) are used for production and heating. They are pur-
chased from Nokian Lämpövoima Oy, which uses natural gas as fuel. GHG emissions
are calculated by using the environmental report of Nokian Lämpövoima Oy (Lu-
papäätös 2007, 6, 10) together with production information of Nokian Tyres.
Emission factors for steam and heat are calculated by using table 2. It combines produc-
tion information and emission information of Nokian Lämpövoima Oy during years
2004-2006 (Lupapäätös 2007, 6, 10). Since information is for earlier years, instead of
using the base year 2011, following calculations are done by using the information of
year 2006 because it is the latest year presented.
TABLE 2. Production and emission information of Nokian Lämpövoima Oy during
years 2004-2006
Production Information 2004-2006
Production, GWh/a
Electricity Steam Heat Emission Information 2006
2004 365 273 95
CO2 emissions (tonnes)
2005 303 259 91 Total Electricity Steam Heat
2006 388 266 101 218 589 112334,5 77012,81 29241,71
2006 % 51,39 % 35,23 % 13,38 % 2006 % 51,39 % 35,23 % 13,38 %
According to Nokian Tyres, in 2006 there were approximately 65 GWh of steam and 43
GWh of heat used. Thus, the percentage value of Nokian Tyres from total Nokian
Lämpövoima production can be calculated by using table 2. For steam it is approxi-
mately 24% and for heat 43%. Since it is known that Nokian Tyres uses 24% of all pro-
duced steam, it is assumed that also 24% of carbon dioxide emissions of heat are caused
by Nokian Tyres. Based on the initial emissions announced in table 2, carbon dioxide is
calculated to be 18 483 tonnes. Then CO2 emissions are divided by the used amount of
29
heat in order to define the emission factor of heat production. The same calculation pro-
cess is conducted for determining the emission factor for steam production.
4.3.3 Water Usage
Water usage consists of both water intake and wastewater. The water supplies of Nokian
Tyres are municipal water system and river Nokianvirta. Tap water is used for drinking
and cooking whereas river water is used as cooling water in the production process.
Nokian Tyres has its own water plant next to Nokianvirta, through which the river water
is taken and treated. Cooling water is circulated in a way that it does not have a contact
with chemicals. Therefore, it stays clean and can be lead back to Nokianvirta. However,
0,1% of taken river water is used at washers of mixing machines. Washing water is cir-
culated few times in the washers before it is lead to sewer network. (Ympäristö-
lupapäätös 2007, 11-12.)
In 2011, total water usage was 8 121 771m3, from which 99% was river water and 1%
municipal water. However, since the operations of the water plant are included in ener-
gy data, there are no separate emissions calculated for river water. Thus, this assessment
focuses on municipal water in more detail. Clean water emission factor includes water
production and water system, whereas wastewater emission factor includes sewer net-
work and wastewater treatment.
Since there are no emission factors available for clean water and wastewater, they are
determined by few calculations. In order to get the emission factor for input water,
emission factors for water production and water system have to be determined. The
same holds true with output water: the emission factor is defined based on the emission
factors of wastewater treatment and sewer network.
By using table 3, which is formed based on the information provided by Seppälä &
Vilkas (2008, 5) and Aamulehti (Tampereen Vesi: Asiakkaat ovat tyytyväisiä 2012,
Pirkanmaa), the emission factors for each water phase can be calculated. The amounts
of carbon dioxide equivalent tonnes are divided by the amount of cubic meters in order
to define the emission factors. Then water production and water system factors are
combined together, which results the clean water emission factor to be 8,34. The same
30
way sewer network and wastewater treatment factors are unified in order to define the
wastewater emission factor, which is 11,89. These emission factors are used when de-
termining the GHG emissions of water usage.
TABLE 3. Water figures of water supply service in 2007
GWh t CO2e mill. m3 kg CO2e / m3 kg CO2e / m3
Water Production 240 77311 10 7,73 8,34 Water System 19 6 120 10 0,61
Sewer Network 25 8850 10 0,89 11,89 Wastewater Treatment 340 110000 10 11,00
Total 624 202281 20 20,23 20,23
4.3.4 Wastes
In 2011, the total waste amount produced by Nokian Tyres was 8 190 tonnes of kilo-
grams. As can be seen from figure 5, largest waste types based on the weight were un-
vulcanised rubber waste, waste tyres and wood. Section “landfill” includes both mixed
waste and hazardous waste, whereas “other recyclables” means plastics, energy waste,
iron and steel, paper, cardboard, waste oil, biowaste and class.
FIGURE 5. Distribution of waste types in year 2011
According to PAS 2050, emissions of recycled waste that is used as a raw material for
some new product should be excluded from the assessment (British Standards Institu-
tion 2011, 39). Therefore, emission factors for each waste type are determined in a way
6
17
44
22
11
Waste Types in %
landfill
waste tyres
unvulcanised rubber waste
wood
other recyclables
31
that only waste treatment is included and further processing into new material is left out
and allocated to new product. As an example, recycling of paper produces 1050 kg CO2
equivalents per paper tonne, from which waste disposal of paper forms 10 kg CO2
equivalents and utilisation as a raw material creates 1040 kg CO2 equivalents. By fol-
lowing the guidelines of PAS 2050, only waste treatment is taken account and thus, the
emission factor for paper recycling is 10 kg CO2 equivalents per waste tonne. The recy-
cling rate of Nokian Tyres is quite high and therefore, also the waste emissions are ra-
ther low (appendix 4).
Emission factors for waste types are determined by using several different sources be-
cause there is no compatible document with PAS 2050 available, which would combine
emission factors for all needed waste types. Some of the factors that are used in this
assessment are redefined by calculating only waste transportation emissions. The reason
for that procedure is that factors initially included also the processing into new raw ma-
terial, which is incompatible with PAS 2050 regulations. This calculation method is
however only used, when no comparable information is available in order to ensure that
waste emissions are equal. Otherwise, the transportation of wastes is included in waste
treatment emission factors.
4.3.5 VOC Emissions
Volatile organic compounds (VOCs) are released into atmosphere by natural and an-
thropogenic sources. VOCs have relatively short atmospheric lifetime and small direct
effect on radiative forcing. In fact, the indirect influence on climate is formed when
VOCs produce organic aerosols and ozone in the presence of nitrous oxides and sun-
light. The largest source of VOC emissions is natural and caused by vegetation. Anthro-
pogenic sources of VOCs are mostly transportation and industrial emissions, more pre-
cisely emissions caused by the usage of solvents. (Ehhalt & Prather 2001, 257.)
It is controversial whether VOCs are seen as greenhouse gases. IPPC does not include
VOCs into the list of 63 greenhouse gases (appendix 1) because VOCs are indirect
GHGs. Despite of PAS 2050 guidelines, VOCs are discussed in this assessment because
the role of VOCs is altogether remarkable from Nokian Tyres point of view (British
Standards Institution 2011, 7). Controlling VOC emissions is an important part of the
32
environmental actions taken by Nokian Tyres and therefore also VOCs were decided to
be included in this assessment.
As explained earlier, the production processes of Nokian Tyres require using some sol-
vents. Most of the solvents are used in re-treating line (PC4) for cluing and increasing
the adherence of components. Also heavy tyre production (PC2) and adhesive produc-
tion use solvents. Adhesive production, however, is a closed process and therefore it
does not create any VOC emissions. VOCs released at PC4 are lead into combustion
plant, which is on the roof of the factory. In addition to those emissions, there are also
spread emissions in the factory. For example, vulcanisation fumes contain VOC emis-
sions and different work phases in heavy tyre production are connected to solvent us-
age. (Ympäristölupapäätös 2007, 16-17.)
There are two main solvents that are used at Nokian Tyres. Those solvents are used for
calculating the VOC emissions of Nokian Tyres. As can be seen from appendix 5, the
calculation is carried out by using the 100-years GWP (greenhouse warming potential)
for non-methane volatile organic compounds (NMVOCs) determined by IPCC (Ilmas-
to.org, according to IPCC 2001).
4.3.6 Offices
Since Nokian Tyres has its headquarters at Nokia, there are many offices in the build-
ing. As PAS 2050 states, emissions related to the production of capital goods should be
excluded from the assessment. Thus, offices themselves are not included but the con-
sumables used in those offices are taken into account. However, not all of the consuma-
bles are included in the assessment according to PAS 2050 regulation. As mentioned
earlier, consumables having a lifespan less than a year should be included, whereas
goods with a lifespan more than a year should be excluded. (British Standards Institu-
tion 2011, 11.) As an example, office furniture is left out because it lasts more than a
year, whereas copying paper is included because the lifespan is supposedly less than
year.
Emission factors for office-related goods are provided by WWF in co-operation with
Eco-support Activity –project (WWF 2011). Even though WWF gives emission factors

33
for many equipments and consumables, only printing paper, copying paper and letter
carriage are covered in the end. The reason for it is that for example emissions of elec-
tronic devices should be included only to acquisition or waste disposal in order to avoid
double-counting. Since waste data does not analyse data types so clearly, it is simpler to
allocate the emissions from electronic devices directly to waste disposal.
There is one exception in office emission counting. Even though lamps are consumables
having a lifespan less than a year, the emissions that should be taken account are con-
sidered in energy and waste data. According to Oksanen (Oksanen 2009, 9-10), lamp
production and waste disposal forms only a minor part of lamp’s carbon footprint. Al-
most all emissions are caused by the usage and therefore included in energy figures.
4.3.7 Work Trips
According to PAS 2050, travelling to normal work place is not included in the assess-
ment (British Standards Institution 2011, 11). However, work trips to other locations
should be included. Work trips can be divided into three categories; flying, driving and
train travelling. Travelling distances are gathered from transportation companies and
driving compensation expenses and calculated together. In 2011, the workers of Nokian
Tyres flew 13 985 640 kilometres, drove 734 227 kilometres and used train for 466 772
kilometres (figure 6).
FIGURE 6. Work trip transportation in passenger kilometres according to transportation
types
10000
100000
1000000
10000000
100000000
Flying Driving Train travelling
Number of Passenger Kilometres
Number of passengerkilometres
34
Work trips are presented in passenger kilometres (pkm), which is a measure of transpor-
tation informing the distance travelled by a person in a vehicle. Emission factors for
driving and train travelling are defined by using the LIPASTO calculation system.
Flight emissions are calculated by using the information given by Defra (Department
for Environment, Food and Rural Affairs).
Driving
Emission factor for driving is defined by using an average passenger car with 1,7 per-
sons load. Instead of choosing a specific EURO emission class, the average class is used
in order to simplify the calculation method. The emission factor is chosen based on the
assumption that 35% of the journey is composed of street driving and the rest 65% of
highway driving. (LIPASTO 2012.) The driving emission factor is then used together
with the gathered kilometre number in order to calculate the driving emissions of work
trips (appendix 5).
Train Travelling
Train emissions are calculated based on the emission factors defined by LIPASTO and
personal notification given by VR’s employee Markku Markkanen (LIPASTO 2012;
Markkanen 2012). LIPASTO provides emission information about the following train
types: Pendolino, InterCity, commuter railway and rail bus. Since the transportation
data is not categorised based on the train type, the emissions have to be calculated by
using an average value. However, LIPASTO does not have any average values for train
emissions unlike it has for other vehicles. Thus, the average emission factor is calculat-
ed based on the personal notification of Markku Markkanen about the average distribu-
tion of used train types and their fuel type. When it is known, how many percentages
each train types compose, the average emission factor can be calculated. Then the factor
is further used for calculating the train travelling emissions (appendix 5).
Flying
In order to calculate flight emissions, flight data have to be transformed into passenger
kilometres because many companies present the work trip information in distances. For
example, three roundtrips between Helsinki and London forms 10 938 passenger kilo-
metres, (3 x 2 x 1 823), whereas the initial information is presented to be 1 823 kilome-
tres. Many airlines also present their own information about GHG emissions. However,
35
in order to ensure the comparability of results, the GHG emissions are calculated sepa-
rately for all journeys of each airline.
Defra provides information about flying emission factors (Defra 2011, 57). Domestic
flights, short-haul flights and long-haul flights have different emission factors. Since the
information provided by the airlines does not inform about the percentage values of
different flight types, the emission factor for flying is supposed to be the average value
of given emission factors. That emission factor is then used for calculating the emis-
sions of work trips comprised of flying (appendix 5).
36
5 CREATING THE CALCULATOR
As explained earlier, another part of the thesis process is to create a GHG emission cal-
culator for Nokian Tyres. The calculator is done by using Microsoft Excel software. The
aim of the calculator is to provide a tool, which can be used for calculating the GHG
emissions also in coming years. The calculator is built in a way that by filling out new
information, it gives the total amount of produced GHG emissions in carbon dioxide
equivalents (CO2e).
The calculator (appendix 4) consists of 11 different sections, which are general infor-
mation, summary and procedure information including all nine partial processes ex-
plained earlier. There is a blank column in the main page that is reserved for filling in
the quantities of procedure information. Also, the section “general information” has
blank cells, to which the production information is entered. By filling in the information
about production and different procedures, the calculator gives the total GHG emission
amounts to each partial process as well as combines all those totals into a summary. The
summary presents the totals of each partial process and also the total of all GHG emis-
sions of Nokian Tyres.
In addition to the main page, there are several sheets that are used for calculating the
emissions (appendix 5). The sheets are named after each partial process and for example
“work trips” sheet includes information about driving, flying and train travelling. There
are several columns including data about the transportation type in question. By using
the references from the main page, the cells can calculate the quantity per production
tonne, which is then multiplied with the emission factor in order to get the GHG emis-
sions. The cell giving the answer is then used as a reference to the main page, which
enables presenting the amount of GHG emissions of that certain transportation type on
the main page.
All the sheets have a same function, which ensures that the only updating procedure
needed in the future is to fill in the production and partial process information into the
main page. The emission factors stay the same and the quantities per production tonne
are automatically updated by the calculator when new production information is filled
in. The quantities of partial processes and production information are easily gathered
37
from internal sources annually. However, the only information that should be edited
before entering is the amount of used fossil fuels. The reason behind is that the Nord
Pool Spot presents the fossil fuels as a one category without further dividing it into dif-
ferent energy sources, as explained in the section 4.3.2 Energy. In order to have reliable
GHG emissions, it is preferred to calculate the emissions by using emission factors of
precise energy sources. Therefore, the fossil fuels are further divided into natural gas,
coal, oil and peat according to Finnish Energy Industries (2012).
38
6 GREENHOUSE GAS EMISSIONS OF NOKIAN TYRES
6.1 Total GHG Emissions
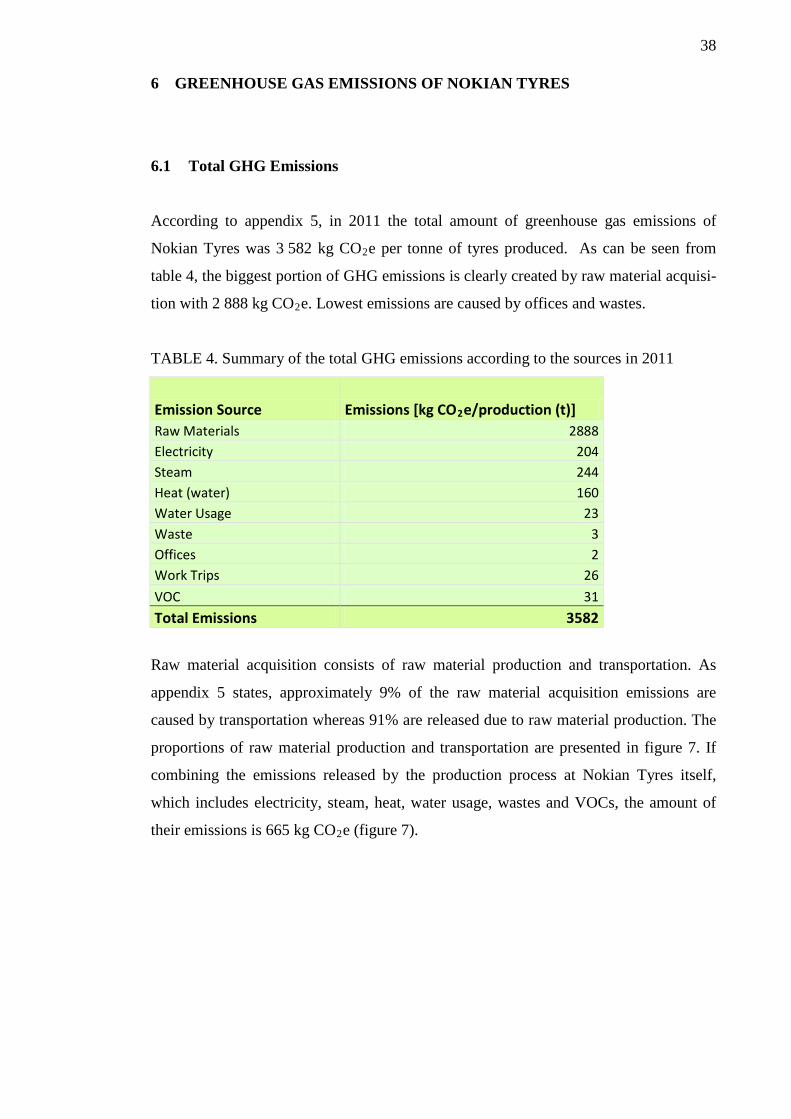
According to appendix 5, in 2011 the total amount of greenhouse gas emissions of
Nokian Tyres was 3 582 kg CO2e per tonne of tyres produced. As can be seen from
table 4, the biggest portion of GHG emissions is clearly created by raw material acquisi-
tion with 2 888 kg CO2e. Lowest emissions are caused by offices and wastes.
TABLE 4. Summary of the total GHG emissions according to the sources in 2011
Emission Source Emissions [kg CO2e/production (t)] Raw Materials 2888 Electricity 204 Steam 244 Heat (water) 160 Water Usage 23 Waste 3 Offices 2 Work Trips 26 VOC 31 Total Emissions 3582
Raw material acquisition consists of raw material production and transportation. As
appendix 5 states, approximately 9% of the raw material acquisition emissions are
caused by transportation whereas 91% are released due to raw material production. The
proportions of raw material production and transportation are presented in figure 7. If
combining the emissions released by the production process at Nokian Tyres itself,
which includes electricity, steam, heat, water usage, wastes and VOCs, the amount of
their emissions is 665 kg CO2e (figure 7).
39
FIGURE 7. Greenhouse gas emissions of partial processes, from which production pro-
cess includes energy, water usage, wastes and VOC emissions
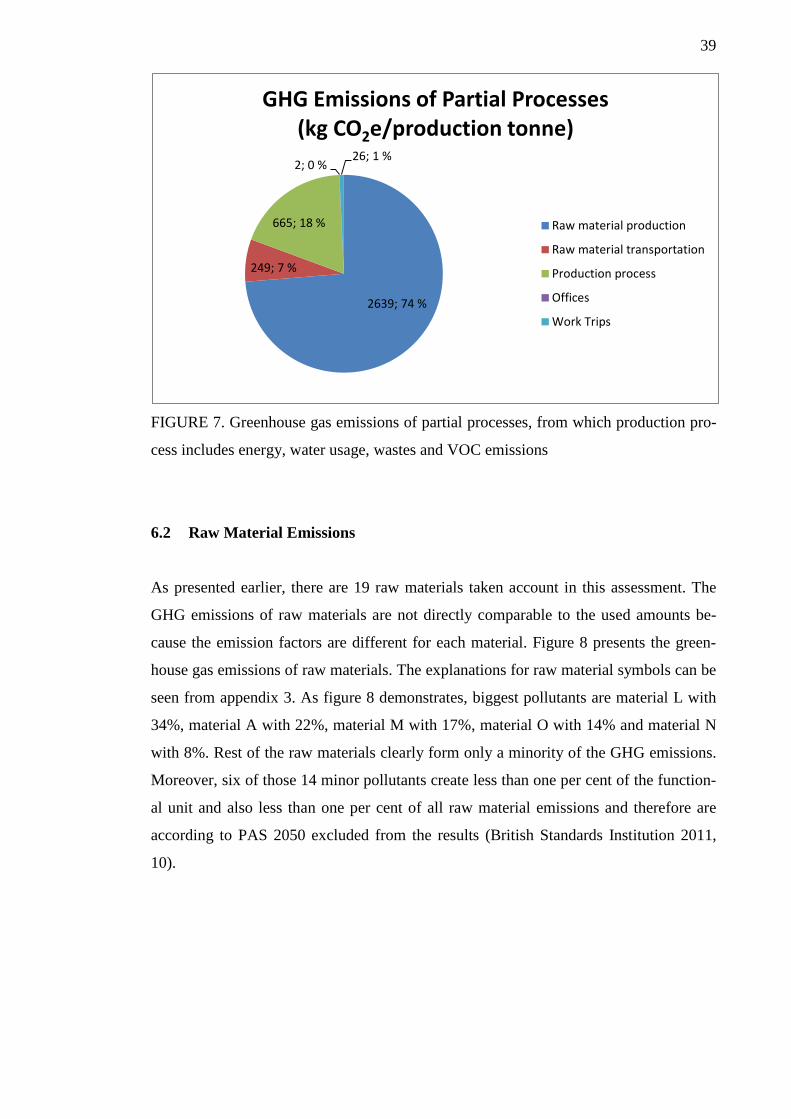
6.2 Raw Material Emissions
As presented earlier, there are 19 raw materials taken account in this assessment. The
GHG emissions of raw materials are not directly comparable to the used amounts be-
cause the emission factors are different for each material. Figure 8 presents the green-
house gas emissions of raw materials. The explanations for raw material symbols can be
seen from appendix 3. As figure 8 demonstrates, biggest pollutants are material L with
34%, material A with 22%, material M with 17%, material O with 14% and material N
with 8%. Rest of the raw materials clearly form only a minority of the GHG emissions.
Moreover, six of those 14 minor pollutants create less than one per cent of the function-
al unit and also less than one per cent of all raw material emissions and therefore are
according to PAS 2050 excluded from the results (British Standards Institution 2011,
10).
2639; 74 %
249; 7 %
665; 18 %
2; 0 % 26; 1 %
GHG Emissions of Partial Processes (kg CO2e/production tonne)
Raw material production
Raw material transportation
Production process
Offices
Work Trips

40
FIGURE 8. Greenhouse gas emissions of each raw material type
6.3 Waste Emissions
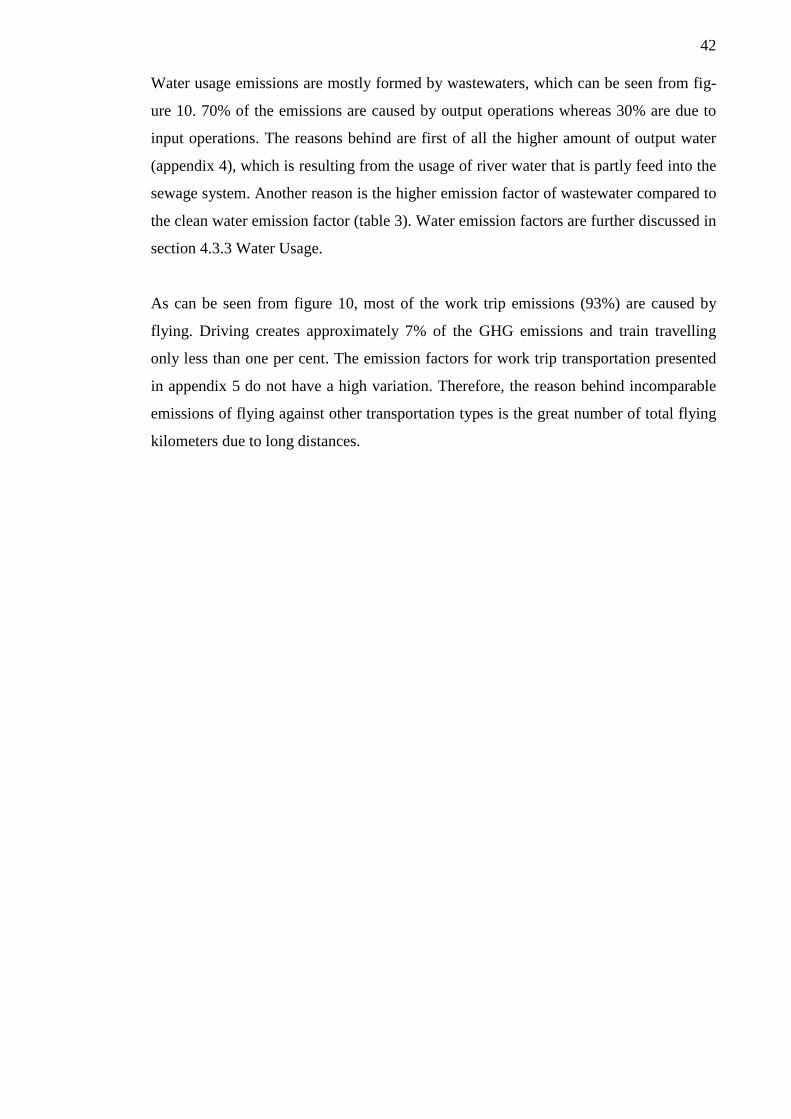
Greenhouse gas emissions of wastes are extremely low. As can be seen from table 4,
waste emissions are 3 kg CO2e per production tonne forming only 0,008% of the total
GHG emissions. The reason behind is supposedly the high recycling rate of Nokian
Tyres. Figure 9 presents the emission percentages of each waste type. As can be seen
from the figure, most of the waste emissions are caused by so called unrecyclable waste
that includes mixed waste (34%) and hazardous waste (48%). Rest of the emissions are
formed by recyclable wastes. Zero percentages in the figure 9 refer to emissions being
below 1%. Wood is left out from the figure because the GHG emissions of wood are
defined to be zero due to renewability.
21,71 % 0,18 %
0,38 %
0,33 % 1,39 %
2,10 %
1,96 %
33,73 %
16,78 %
7,93 %
13,53 %
GHG Emissions of Raw Material Types ABCD <1%EF <1%GHIJ <1%K <1%LMNOP <1%Q <1%
41
FIGURE 9. Greenhouse gas emissions of waste types in percentages
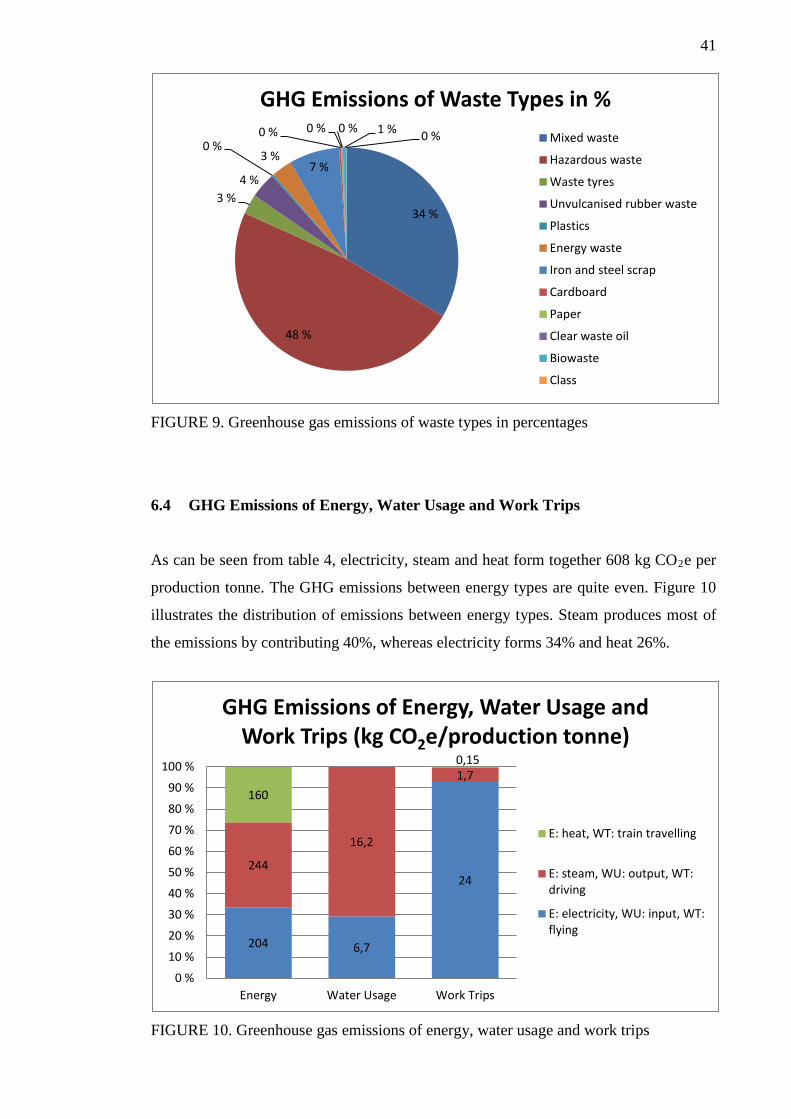
6.4 GHG Emissions of Energy, Water Usage and Work Trips
As can be seen from table 4, electricity, steam and heat form together 608 kg CO2e per
production tonne. The GHG emissions between energy types are quite even. Figure 10
illustrates the distribution of emissions between energy types. Steam produces most of
the emissions by contributing 40%, whereas electricity forms 34% and heat 26%.
FIGURE 10. Greenhouse gas emissions of energy, water usage and work trips
34 %
48 %
3 % 4 %
0 % 3 %
7 %
0 % 0 % 0 % 1 % 0 %
GHG Emissions of Waste Types in % Mixed waste
Hazardous waste
Waste tyres
Unvulcanised rubber waste
Plastics
Energy waste
Iron and steel scrap
Cardboard
Paper
Clear waste oil
Biowaste
Class
204 6,7
24 244
16,2
1,7 160
0,15
0 %
10 %
20 %
30 %
40 %
50 %
60 %
70 %
80 %
90 %
100 %
Energy Water Usage Work Trips
GHG Emissions of Energy, Water Usage and Work Trips (kg CO2e/production tonne)
E: heat, WT: train travelling
E: steam, WU: output, WT:driving
E: electricity, WU: input, WT:flying
42
Water usage emissions are mostly formed by wastewaters, which can be seen from fig-
ure 10. 70% of the emissions are caused by output operations whereas 30% are due to
input operations. The reasons behind are first of all the higher amount of output water
(appendix 4), which is resulting from the usage of river water that is partly feed into the
sewage system. Another reason is the higher emission factor of wastewater compared to
the clean water emission factor (table 3). Water emission factors are further discussed in
section 4.3.3 Water Usage.
As can be seen from figure 10, most of the work trip emissions (93%) are caused by
flying. Driving creates approximately 7% of the GHG emissions and train travelling
only less than one per cent. The emission factors for work trip transportation presented
in appendix 5 do not have a high variation. Therefore, the reason behind incomparable
emissions of flying against other transportation types is the great number of total flying
kilometers due to long distances.

43
7 DISCUSSION
The aim of the thesis was to carry out a greenhouse gas assessment of Nokian Tyres and
create a calculator for further emission counting. The GHG assessment was done by
following the guidelines of PAS 2050 (British Standards Institution 2011) and thus the
results should be in accordance with the given instructions. However, it has to be stated
that there might be some deviation involved.
First of all, choosing the standard was quite complicated and done by acquainting my-
self with different guidelines, such as ISO standards, GHG Protocol and PAS 2050.
Even though the purpose of the standards is to harmonise the GHG assessment proce-
dure, there are differences between different standards. Therefore, standards are not
functional indicators for ensuring the comparability of the results. PAS 2050 was cho-
sen because it has clear instructions for reporting.
The second problem concerns of defining the system boundary. Even though PAS 2050
gives instructions for choosing the right boundary, which in this case is “cradle-to-
gate”, there are still decisions to be made. For example, the logistics centre of Nokian
Tyres was left out because it is located elsewhere and therefore is not a part of the facto-
ry property. Thus, also the transportation to the logistics centre is excluded. The deci-
sion is in accordance with PAS 2050 regulation, which states that the system boundary
can vary depending on the location of the gate (British Standards Institution 2011, 9).
Despite the accordance, the comparability of the results towards other assessments can
decrease because of the decided system boundary.
The biggest challenge on making the assessment relates to emission factors. It was ex-
tremely difficult to find emission factors, since there were no functional databases
available. As an example, free ELCD (European Reference Life Cycle Data System) is
a core database, which would need LCA software in order to be useful. Therefore the
emission factors were gathered from different sources, such as reports and researches.
Thus, all the emission factors may not be defined in a same way, which affects on the
reliability of the results. In order to avoid underestimations in the results, the emission
factors were defined in a way, that if choosing between two factors, the factor stating
higher emissions was chosen.
44
As mentioned already in the results, the waste emissions are extremely low. High recy-
cling rate has influence on the results but also the emission factors have an important
role. As explained, the emission factors do not include further processing into new raw
materials, which decreases the emission factors evidently. Therefore, also the calculated
GHG emissions are really low. Some questioning arises about the waste emission fac-
tors in general: are other assessments done by using waste factors, which include also
further processing? This kind of differences in GHG assessment guidelines can produce
results that are not comparable. As an example, the carbon footprint calculated for WR
205 tyre (Tiri et al. 2011) gives a lot higher waste emissions than this assessment. The
only reasonable explanation is that the waste emissions are calculated by using higher
emission factors that include also processing. Consequently, the waste emission results
of this assessment should not be considered to be comparable with other assessments
without verifying the method used for defining the emission factors. The same holds
true also with other partial process emissions and the total emissions of the factory.
Moreover, it is quite challenging to compare these results to the results of other tyre
manufacturers because only Michelin presents some figures about its greenhouse gas
emissions, which were 1210 kilograms of CO2 per production tonne in year 2011
(Michelin 2012, 61). However, the methods used are not provided and therefore the
emissions should not be compared directly to the emissions of Nokian Tyres.
As figure 7 illustrates, raw material acquisition causes most of the GHG emissions
(81%) of Nokian Tyres. In order to decrease the emissions, attention should theoretical-
ly be paid on raw material production and their transportation. In reality, managing
emissions that are released by some other authors is rather difficult. The emissions of
raw material production can be tried to be decreased by making supply contracts with
sustainability requirements and choosing new suppliers based on the sustainability of
their operations. Transportation emissions can be affected most efficiently by using
closer suppliers. However, some raw materials, such as natural rubber, are only pro-
duced in distant lands and thus their transportation emissions are impossible to control.
Also, the biggest pollutant, material L, is already produced quite near but the reason for
high emissions is the production process itself (appendix 3). One method for decreasing
raw material emissions could be a new innovation for tyre recipe produced by research
and development department, which could enable using more sustainable materials for
tyres. For example, creating a tyre recipe with less material L would result in lower
emissions.
45
Since the development of raw material acquisition is quite challenging, the attention
should be put into energy efficiency. At the moment, energy forms second-largest part
of the GHG emissions with 17%. Decreasing the emissions of energy production and
distribution is almost impossible - if not taking account changing energy into renewable
energy, such as hydropower - and therefore the solution is to highlight energy efficien-
cy. Energy savings have to be made in all actions, which is possible by training employ-
ees and investing into more energy efficient machines. Employee training can develop
the attitudes towards energy issues to be more positive and thus help to make energy
savings for example via switching off lights. Also water usage can be decreased by
changing the attitudes.
Another way to decrease energy usage is to invest on new machines that consume less
energy. In addition to bigger machines, also smaller investments are important. Nokian
Tyres has already for example lamps that are automatically switched off when nobody
is moving on the area. One possible improvement could be done in the switching off the
machines. When shifts are changing, there is a period of time, when nobody is using the
machines but they still are running. It should be studied, whether it is worthwhile to put
the machines onto standby state or stop them during the sift change. In order to clarify
that issue and other possible energy improvement targets, another study would have to
be made about the function of the process chain as well as about determining the possi-
ble causes of energy losses.
The calculator was done in order to estimate the greenhouse gas emissions on a yearly
level. The function of the calculator is designed to be as simple as possible. By filling
out little information, it calculates the emissions of a certain procedure. In the end, it
combines all the partial process emissions together in order to define the total emissions
of the year. Another design criterion was to keep the information as transparent as pos-
sible. Therefore, the calculation sheets (appendix 5) of the calculator are done by fol-
lowing the same pattern, which has several calculation phases. However, it would have
been better to have also sources presented for each emission factor on those calculation
sheets. Thus, the calculator would have been even more transparent, which would have
helped the people who are using the calculator in the future. Despite that fact, the calcu-
lator should work well for the purpose of Nokian Tyres because all needed information
already exists on their internal database.
46
REFERENCES
A Vision of Sustainable Mobility. Michelin. 2011 Annual and Sustainable Development Report. 2012. Chirat: Michelin. Read 16.01.2013. http://www.michelin.com/corporate/EN/group/radd-2011/download British Standards Institution. 2011. The Guide to PAS 2050 : 2011 How to carbon foot-print your products, identify hotspots and reduce emissions in your supply chain. Lon-don: Department for Business, Innovation and Skills (BIS). Crump, E. 2000. Economic Impact Analysis for the Proposed Carbon Black Manufac-turing NESHAP. U.S. Environmental Protection Agency. Office of Air Quality Plan-ning and Standards. Innovative Strategies and Economics Group. Durham: U.S. Envi-ronmental Protection Agency (EPA). Defra (Department for Environment, Food and Rural Affairs). 2011. 2011 Guidelines to Defra. DECC’s GHG Conversion Factors for Company Reporting: Methodology Paper for Emission Factors. London: the Department for Environment, Food and Rural Af-fairs. Read 31.01.2013. http://www.defra.gov.uk/publications/files/pb13625-emission-factor-methodology-paper-110905.pdf Ehhalt, D. & Prather, M. 2001. Atmospheric Chemistry and Greenhouse Gases. In re-port: Houghton, J., Ding, Y., Griggs, D., Noguer, M., van der Linden, P., Dai, X., Maskell, K. & Johnson J. (eds.). Climate Change 2001: The Scientific Basis. Contribu-tion of Working Group I to the Third Assessment Report of the Intergovernmental Panel on Climate Change. Cambridge: Cambridge University Press on behalf of IPPC. http://www.ipcc.ch/ipccreports/tar/wg1/140.htm ETRMA (European Tyre & Rubber Manufacturers’ Association). 2011a. Read 09.01.2013. http://www.etrma.org/ ETRMA (European Tyre & Rubber Manufacturers’ Association). 2011b. Rubber Goods. Read 23.01.2013. http://www.etrma.org/rubber-goods Finnish Energy Industries. 2012. Energy and Environment. Electricity Generation. Read 24.01.2013. http://energia.fi/energia-ja-ymparisto/sahkontuotanto Forster, P., Ramaswamy, V., Artaxo, P., Berntsen, T., Betts, R., Fahey, D., Haywood, J., Lean J., Lowe, D., Myhre G., Nganga J., Prinn R., Raga G., Schulz M. & Van Dor-land R. 2007. Changes in Atmospheric Constituents and in Radiative Forcing. In report: Solomon, S., Qin, D., Manning, M., Chen, Z., Marquis, M., Averyt, K., Tignor, M. & Miller, H. (eds.). Climate Change 2007: The Physical Science Basis. Contribution of Working Group I to the Fourth Assessment Report of the Intergovernmental Panel on Climate. Cambridge: Cambridge University Press. 152.
47
Garg, A., Kazunari, K. & Pulles, T. 2006. Volume 2 Energy. In report: Eggleston, H., Buendia L., Miwa K., Ngara T. & Tanabe K. (eds.). 2006 IPCC Guidelines for National Greenhouse Gas Inventories. Japan: IGES (Institute for Global Environmental Strate-gies) on behalf of IPCC. Read 24.01.2013. http://www.ipcc-nggip.iges.or.jp/public/2006gl/pdf/2_Volume2/V2_1_Ch1_Introduction.pdf GHG Protocol (The Greenhouse Gas Protocol). 2012a. Calculation Tools. Read 11.01.2013. http://www.ghgprotocol.org/calculation-tools GHG Protocol (The Greenhouse Gas Protocol). 2012b. Standards. Read 11.01.2013. http://www.ghgprotocol.org/standards GHG Protocol (The Greenhouse Gas Protocol). 2012c. Quantifying the Greenhouse Gas Emissions of Products. PAS 2050 & the GHG Protocol Product Standard. A short guide to their purpose, similarities and differences. Read 11.01.2013. http://www.ghgprotocol.org/files/ghgp/public/GHG%20Protocol%20PAS%202050%20Factsheet.pdf Ilmasto.org. Ilmastonmuutos. Epäsuorasti vaikuttavat kaasut. Read 31.01.2013. http://ilmasto.org/ilmastonmuutos/perusteet/kasvihuonekaasut/epasuorasti-vaikuttavat-kaasut#Haihtuvat_orgaaniset_yhdisteet_VOC ISO (International Organization of Standardization). 2009. Environmental Management. The ISO 14000 Family of International Standards. Geneve. Read 10.01.2013. http://www.iso.org/iso/theiso14000family_2009.pdf Kokko, J. 2012. Hiilijalanjälkiselvitys ja siihen käytettävän ohjelmiston valinta. Oulu University of Applied Sciences. Degree Programme in Mechanical and Production En-gineering, Energy Technology. Bachelor’s thesis. Korsvoll, R. & Anttila, J. 2012. Vinterdekktest 2012. Motor 7/2012. Kumiteollisuus Oy. 2013. Read 09.01.2013. http://www.kumiteollisuus.fi/fin/etusivu/ Kurki, H. 1999. Ympäristöraportointi ja ekotase – terävyyttä raportointiin. Helsinki 1999. Oy Edita Ab, 171. Kärkkäinen, J. 2006. Ympäristöraportointimallin kehittäminen vesihuoltolaitokselle. Lappeenranta University of Technology. Faculty of Energy and Environmental Tech-nology. Master’s thesis. LIPASTO. 2012. A calculation system for traffic exhaust emissions and energy con-sumption in Finland. Technical Research Centre of Finland. Read 23.01.2013. http://lipasto.vtt.fi/indexe.htm Lovio, R. 2004. Ympäristöraportointi sisäisen organisaatiokulttuurin muuttamisen sekä ulkoisen viestinnän välineenä. In book: Heiskanen, Eva (edit.). Ympäristö ja liiketoiminta: arkiset käytännöt ja kriittiset kysymykset. Helsinki 2004: Gaudeamus, 351.
48
Lupapäätös. 2007. LSY-2004-Y-384. Helsinki: Länsi-Suomen Ympäristölupavirasto. Read 24.01.2013. http://www.environment.fi/download.asp?contentid=76897&lan=fi Markkanen, M. 2012. Personal notification. Discussion about statistical data of VR con-cerning different train types. Nokian Tyres. 2011a. Company and Investor Information. Company. Basic Infor-mation. Read 03.12.2011. http://www.nokiantyres.com/company Nokian Tyres. 2011b. Company and Investor Information. Publications. Sertificates, Reports and Awards. Read 05.12.2011. http://www.nokiantyres.com/environmental-reports Nokian Tyres. 2011c. Products. Environment. What Nokian Tyres Does? Read 06.01.2013. http://www.nokiantyres.com/what-nokian-tyres-does Nokian Tyres. 2011d. Company and Investor Information. Corporate Responsibility. Tyre Life Cycle. Raw Materials. Read 23.01.2013. http://www.nokiantyres.com/raw-materials Nord Pool Spot. 2013. Read 24.01.2013. http://www.nordpoolspot.com/ Oksanen, P. 2009. Hiilidioksidipäästöjen muodostuminen valaistusprosessissa. Helsinki Metropolia University of Applied Sciences. Degree Programme in Global ICT-business. Bachelor’s Thesis. Responsible Development. 2010. Environmental Report 2009. Nokia: Nokian Tyres plc. Read 17.01.2013. http://www.nokiantyres.com/files/nokiantyres/Ymparist_turvallisuus_eng/Nokian_Tyres_Environmental_report_2009.pdf Seppälä, J. & Vilpas, R. 2008. Vesihuollon mahdollisuudet ilmastonmuutoksen hillin-nässä. Presentation. Vesihuoltopäivät 4.-5.6.2008. Kuopio. Read 24.01.2013. http://www.vvy.fi/files/42/seppala_jyri.pdf Shine, K., Derwent, R., Wuebbles, D. & Morcrette, J-J. 1990. Radiative Forcing of Climate. In report: Houghton, J., Jenkins, G. & Ephraums, J. (eds.). Climate Change: The IPPC Scientific Assessment. Report Prepared for Intergovernmental Panel on Cli-mate Change by Working Group 1. Cambridge: Cambridge University Press. 58. Tampereen Vesi: Asiakkaat ovat tyytyväisiä. 11.07.2012. Pirkanmaa. Aamulehti. Read 24.01.2013. http://www.aamulehti.fi/Pirkanmaa/1194753520818/artikkeli/tampereen+vesi+asiakkaat+ovat+tyytyvaisia.html Tiri, Anton, Käpynen. 2011. WR 205 – Renkaan Hiilijalanjälki. Tampere: WSP.
49
Tuulilasi. 2012. Nastarenkaat vertailutestissä. Tuulilasi 13/2012. Vi Bilägare. 2012. Stort test av dubbdäck. Vi Bilägare 14/2012. Will to Win. Annual Report. 2011. Nokia: Nokian Tyres. Read 08.01.2013. http://www.nokiantyres.com/files/nokiantyres/Vuosikertomukset_eng/Nokian_Tyres_Annual_Report_2011_EN_lowres.pdf WWF. 2011. Ilmastolaskuri. Ilmastolaskurissa käytetyt päästökertoimet ja oletusarvot. Read 31.01.2013. http://www.ilmastolaskuri.fi/web/storage/files/IL_kertoimet_ja_oletusarvot_10012011.pdf Ympäristölupapäätös. 2007. 1998Y0179-111. Tampere: Pirkanmaan Ympäristökeskus. Valvonta- ja ympäristölupaosasto. Read 24.01.2013. http://www.ymparisto.fi/download.asp?contentid=64133&lan=FI
50
APPENDICES
Appendix 1. List of greenhouse gases including their lifetimes, radiative efficiencies
and global warming potentials relative to CO2 (Forster et al. 2007, 158)
(1/2)
51
(2/2)