Embed Size (px)
Citation preview

1(24)
Nokian Tyres plc Stock Exchange Release 8 August 2012, 8 a.m.
Nokian Tyres plc Interim Report January-June 2012: Strong results, improving market position
Nokian Tyres group’s net sales increased by 27.1% to EUR 798.0 million (EUR 628.0 million in 1-6/2011). Operating profit grew to EUR 217.7 million (EUR 165.6 million). Earnings per share increased to EUR 1.40 (EUR 1.06).
Outlook: The order book for Nokian car tyres remains good despite a more challenging market. The company has further improved its position by winning market shares in all targeted markets in Russia and Northern Europe. The growing production capacity offers further growth potential and productivity gains, and a declining Fixed cost ratio supports profitability. Successful winter tyre pre-deliveries in Russia in H1 and the uncertainty in Europe may shift sales from Q3 to Q4, closer to the consumer winter tyre season. Nokian Heavy Tyres’ sales in 2012 are estimated to decrease compared to 2011 due to a softer demand.
Financial guidance (unchanged): In 2012, the company is positioned to improve Net sales and Operating profit compared to 2011.
Key figures, EUR million: 4-6/12 4-6/11
Change% 1-6/12 1-6/11 Change% 2011
Net sales 413.8 338.8 22.1 798.0 628.0 27.1 1,456.8Operating profit 112.7 93.3 20.8 217.7 165.6 31.5 380.1Profit before tax 108.0 85.4 26.5 210.3 155.3 35.4 359.2Profit for the period 95.4 74.2 28.6 182.9 136.6 34.0 308.9Earnings per share, EUR 0.73 0.57 26.7 1.40 1.06 32.2 2.39Equity ratio, % 62.8 70.2 63.2Cash flow from operations -42.5 -49.9 14.8 -163.9 -102.3 -60.3 114.1RONA,% (roll. 12 months) 26.4 24.1 27.0Gearing, % 25.9 20.0 -0.3
2(24)
Kim Gran, President and CEO: “We continued to show strong progress and good results in the first semester of 2012. Our strategy of focusing on value added growth, replacement and consumer business - primarily winter, SUV and premium summer tyres - high productivity and a tight ship continues to pay off. Car tyre sales improved in Q2 in the wake of our strong growth in Russia and market share improvement in Northern Europe. Improved productivity, successful cost control, as well as higher ASP, were the main factors for profit growth. We managed to increase sales, improve market shares and expand distribution in all of our targeted markets. Our sales mix improved and ASP was up with an increasing share of Nordic winter tyres, SUV tyres and Russian sales. The successful launch of new premium summer tyres combined with several test wins supported our price increases and an improving price position in Central Europe. Our growth in CE and especially Germany despite a challenging market situation was encouraging. One of the cornerstones for our growth is a continuous expansion of a committed distribution with a strong consumer focus. During H1 our Vianor chain opened 51 new stores, now totalling 961 stores in 24 countries. Our target of exceeding 1,000 stores by the end of 2012 seems quite realistic.
Increasing production in our Russian factory improved productivity and boosted production output (tons) by 27% versus H1/2011. The new plant, wall to wall with the existing Russian factory, produced its first tyres in June. The ramp-up of capacity in the new plant continues as the second line comes on stream during end Q4/2012. Production in Nokia, Finland has been cut and moved to Russia to further improve productivity in H2. There have been dark clouds in the market horizon for some time as global growth has been slowing down and distribution customers in all markets are limiting risks by carrying low stock. Our market geography in Russia and Northern Europe offer however good potential and is still comparatively healthy.
We are positioned to improve operations in our core markets in 2012 and confident that we are able to rapidly react to any changes. Our car tyre order book is good and production grows according to plan. The successful H1 pre-deliveries in Russia and the tendency to delay deliveries due to carry-over stocks in Central Europe may shift sales from Q3 to Q4, closer to the consumer winter tyre season.”

3(24)
Market situation
Financial market and sovereign stress in the Euro area periphery is casting a shadow onto the global recovery, which was not strong to start with. European and US debt problems remain unresolved and now the growth in the emerging economies is slowing. Based on economic data the Euro area has practically been in a recession since spring 2011 and the growth for full year 2012 is expected to be negative. The development is however very uneven across the region. The global GDP is projected to grow at 2.5% in 2012 with the developed economies growing at only 1% and emerging market growth slowing down to less than 6%.
Growth in Nokian Tyres core markets, Nordic countries and Russia, continue to show comparatively positive development. Annual GDP growth estimates in the review period averaged 4% in Russia and 1% in the Nordic countries. The new car sales in 1-6/2012 in Russia were up by 14% year-over-year, with western brands growing 24%. In Russia the new car sales is estimated to grow by 10-15% in full year 2012. In the Nordic countries the new car sales decreased by approximately 6% year-over-year.
The sell-in sales volume for replacement market car tyres in the Nordic countries in 1-6/2012 shows a decrease of 1% year-over-year, whereas in Europe the market declined by 13%. The full year estimated sell-out to consumers for car tyres in Europe is estimated to be down approximately 5% versus previous year. In Russia tyre industry deliveries to distributors increased by approximately 20% trailing the improving economy and continued growth in new car sales.
At the end of the review period by June 2012 the car tyre distributors especially in Central Europe had some carry-over stocks of both winter and summer tyres, which is expected to shift manufacturers’ winter tyre sales closer to the consumer season in Q4. Tyre supply and demand for passenger car tyres seem to be balanced for premium tyres whereas there is an overcapacity for economy tyres. The pricing discipline has continued to be good for premium tyres in all regions. However, no significant price increases are expected by industry due to challenging market situation and lower raw material costs.
The demand for agricultural tyres is below previous year but has improved slightly trailing the positive turn in food raw material prices. Metal prices stopped falling at the end of Q2, supporting demand for tyres in the mining industry which is still good. The demand for forestry tyres has been weaker than a year before, and the downturn in the price of pulp at the end of Q2 is a negative signal for future months.
The demand for premium truck tyres and retreads has fallen by 30% in Europe. The Nordic countries have suffered the least with 2% decrease in truck tyre demand. In Russia the drop in demand for premium truck tyres has been approximately 20% whereas demand for cheaper radial tyres is increasing.
Raw material prices dropped at the end of 2011 and availability came back to normal. Prices and tyre industry raw material cost decreased in Q2/2012 compared to Q1/2012. In H1/2012 the cost was still higher than in H1/2011. The raw material cost is expected to go down in H2/2012 versus H1/2012 and H2/2011. For the full year 2012 the material cost for the tyre industry is estimated to be flat compared to 2011.

4(24)
April-June 2012
Nokian Tyres Group recorded Net sales of EUR 413.8 million (338.8), showing an increase of 22.1% compared with Q2/2011. In the Nordic countries sales was at the same level than in the corresponding period a year earlier. Sales in Russia increased by 73.7%. Russia and CIS consolidated sales grew by 67.8%. In Central and Eastern Europe sales were up by 12.7% year-over-year. In North America sales increased by 17.9%.
Raw material cost (EUR/kg) in manufacturing increased in the second quarter by 2.9% year-over-year but decreased by 4.3% versus the first quarter of 2012. Fixed costs amounted to EUR 94.3 million (84.6), accounting for 22.8% (25.0%) of net sales.
Nokian Tyres Group's Operating profit amounted to EUR 112.7 million (93.3). The Operating profit was negatively affected by expensed credit losses and provisions of EUR 1.4 million (0.3).
Net financial expenses were EUR 4.7 million (7.9). Net interest expenses were EUR 3.8 million (4.1) including EUR 2.2 million (2.1) in non-cash expenses related to convertible bonds. Net financial expenses include EUR 0.9 million (3.8) of exchange rate differences.
Profit before tax was EUR 108.0 million (85.4). Profit for the period amounted to EUR 95.4 million (74.2), and EPS were EUR 0.73 (EUR 0.57).
Income financing after the change in working capital, investments and the disposal of fixed assets (Cash flow from operations) was EUR -42.5 million (-49.9).
January-June 2012
Nokian Tyres Group recorded Net sales of EUR 798.0 million (628.0), showing an increase of 27.1% compared with 1-6/2011. In the Nordic countries sales increased by 4.6% representing 29.3% (36.0%) of the group’s total sales. Sales in Russia increased by 70.1%. Russia and CIS consolidated sales grew by 67.0% and formed 40.1% (30.9%) of the group’s total sales. In Central and Eastern Europe sales were up by 15.4% year-over-year representing 22.8% (25.4%) of the group’s total sales. In North America sales increased by 27.8% and were 7.2% (7.3%) of the group’s total sales.
Sales of passenger car tyres were up by 35.1% representing 75.2% (69.8%) of the group’s total sales. Heavy tyres’ sales decreased by 5.5% and were 6.4% (8.4%) of the group’s total sales. Vianor’s sales increased by 7.3% forming 15.4% (18.0%) of the group’s total sales. The sales of Other operations were down by 2.0% representing 3.0% (3.8%) of the group’s total sales.
Raw material cost (EUR/kg) in manufacturing increased by 9.1% year-over-year. Fixed costs amounted to EUR 187.0 million (165.9), accounting for 23.4% (26.4%) of net sales. Total salaries and wages were EUR 98.3 million (87.2).
Nokian Tyres Group's Operating profit amounted to EUR 217.7 million (165.6). The Operating profit was negatively affected by the IFRS 2 -compliant option scheme write-off of EUR 5.2 million (3.8) and expensed credit losses and provisions of EUR 4.9 million (0.8).
Net financial expenses were EUR 7.4 million (10.3). Net interest expenses were EUR 6.5 million (6.5) including EUR 4.4 million (4.1) in non-cash expenses related to convertible bonds. Net financial expenses include EUR 1.0 million (3.8) of exchange rate differences.
Profit before tax was EUR 210.3 million (155.3). Profit for the period amounted to EUR 182.9 million (136.6), and EPS were EUR 1.40 (EUR 1.06).
Return on net assets (RONA, rolling 12 months) was 26.4% (24.1%). Income financing after the change in working capital, investments and the disposal of fixed assets (Cash flow from operations) was EUR -163.9 million (-102.3).
The Group employed an average of 4,078 (3,727) people, and 4,155 (3,786) at the end of the period. The equity-owned Vianor tyre chain employed 1,413 (1,317) people and Russian operations 1,187 (965) people at the end of the period.
5(24)
Financial position on 30 June 2012
Gearing ratio was 25.9% (20.0%). Interest-bearing net debt amounted to EUR 329.3 million (205.0). Equity ratio was 62.8% (70.2%).
Nokian Tyres plc issued an EUR 150 million five-year Eurobond under EUR 500 million Euro Domestic Note Issuance Program on 12th June 2012. The Bond carries an annual coupon of 3.25%. The Bond will be used for general corporate and refinancing purposes.
The Group’s Interest-bearing liabilities totalled EUR 530.6 million (227.4) of which Current interest-bearing liabilities amounted to EUR 194.6 million (24.2). The Average interest rate of interest-bearing liabilities was 3.5% (5.2%). The Average interest rate of interest-bearing liabilities was 1.0% (1.5%) with calculatory non-cash expenses related to the convertible bond eliminated. Cash and cash equivalents amounted to EUR 201.4 million (22.4).
At the end of the review period the company had unused credit limits amounting to EUR 490.4 million (495.2) of which EUR 306.0 million (205.9) were committed. The current credit limits and the commercial paper program are used to finance inventories, trade receivables, subsidiaries in distribution chains and thus control the typical seasonality in the Group’s cash flow due to changes in the working capital.
Tax rate
In the review period the Group’s Tax rate was 13.0% (12.1%). In full year 2011 the Tax rate was 14.0%. The Tax rate is affected by tax relieves in Russia based on present investments and further investment-related incentive agreements. A new agreement has been completed with authorities in Russia concerning additional investment in the existing factory and building the new factory. The agreement will prolong the tax benefits and incentives until approximately 2020. The estimated Tax rate for 2012 is 15% and for the following 5 years 17%.

6(24)
PASSENGER CAR TYRES
The Net sales of Nokian Passenger Car Tyres totalled EUR 633.0 million (468.5), up by 35.1% from the corresponding period a year earlier. Operating profit increased to EUR 228.7 million (168.0). Operating profit percentage improved to 36.1% (35.9%).
Nokian car tyres’ sales showed growth in all market areas. The bulk of the total sales growth came from Russia where especially winter tyre sales grew significantly, but good progress was recorded also in Germany and Czech Republic. Winter tyres represented 65% (62%) of the total sales volume. Sales of both winter and summer SUV tyres continued to increase, which improved sales mix.
Nokian car tyres’ market share improved in Russia, Central Europe and in the Nordic Countries as a result of an expanding distribution and the success of newly launched products.
The new summer tyre range with the spearhead products Nokian Hakka Blue and Nokian Z G2 won several car magazines’ tests in the core markets and in Central Europe.
A good sales mix combined with successful price increases during 2011 raised the Average Selling Price year-over-year, thus compensating for the raw material cost (€/kg) increase of 9% versus the first half of 2011.
Fixed costs increased moderately compared to sales growth, which helped to improve profits. Inventories and receivables grew along with increased sales.
Production output (pcs) grew by 29% compared to the corresponding period in the previous year, boosted by the increasing capacity in Russia. Productivity improved along with high utilization and the capacity increases. The shift pattern of the car tyre production in Nokia, Finland was cut from 7 days/week to a 5 days/week production by end June. Simultaneously the production in Russia has been increased. Construction of the new plant and warehouse next to the current ones in Russia has proceeded on schedule. The first line in the new plant has commenced production in June, and the second line is estimated to become on stream in late 2012. Capacity will increase further with two more lines being added during 2013-2014. The planned combined output of the Nokia and Vsevolozhsk plants in 2012 is 16.5 million tyres.
At the end of the review period the order book for 2012 was good. The successful H1 pre-deliveries in Russia and the uncertainty in Europe may shift sales from Q3 to Q4, closer to the consumer winter tyre season. The focus for the rest of this year will be on optimizing the tyre supply capacity and the logistics for growing deliveries as well as on controlling the inventories and trade receivables.
4-6/12 4-6/11 Change% 1-6/12 1-6/11 Change% 2011
Net sales, m€ 317.1 238.8 32.8 633.0 468.5 35.1 1,071.1
Operating profit, m€ 110.0 83.9 31.1 228.7 168.0 36.2 365.1
Operating profit, % 34.7 35.2 36.1 35.9 34.1
RONA,% (roll.12 m.) 38.2 33.0 38.3

7(24)
HEAVY TYRES
The Net sales of Nokian Heavy Tyres totalled EUR 53.6 million (56.7), down by 5.5% year-over-year. Operating profit was EUR 6.3 million (10.0), and the Operating profit percentage 11.9% (17.7%). Nokian Heavy Tyres’ sales decreased due to weaker forestry tyre demand and sales compared to first half of 2011. Sales of mining and radial tyres showed growth especially in North America and Russia but did not fully compensate for the decline in the forestry sector. The order book going forward is stable and on the same level as by end of Q1/2012. ASP improved due to an improved sales mix with higher sales to the replacement market and price increases which compensated the increased raw material costs. The production volume (tons) decreased by 15% year-over-year. During the first half of the year the production was optimized to match a lower demand from OE customers and to reduce the inventory level. The utilization rate of the capacity was not satisfactory and utilization rate going forward in 2012 is targeted to improve from the first half of the year. Investments are being made to modernize the factory, to open bottlenecks in production and to increase radial capacity. The upgrade of the factory will be completed in 2013. The focus for H2/2012 is to increase sales in the radial tyre segments and to improve productivity. In 2012 Nokian Heavy Tyres’ sales and Operating profit are expected to be below previous year.
4-6/12 4-6/11 Change% 1-6/12 1-6/11 Change% 2011
Net sales, m€ 26.5 28.3 -6.1 53.6 56.7 -5.5 112.8
Operating profit, m€ 2.6 4.6 -44.3 6.3 10.0 -36.6 17.2
Operating profit, % 9.6 16.2 11.9 17.7 15.3
RONA,% (roll.12 m.) 15.2 22.2 20.5

8(24)
VIANOR
Equity-owned operations
At the end of the review period Vianor had 180 (173) equity-owned stores in Finland, Sweden, Norway, USA, Switzerland and Russia. Vianor’s Net sales amounted to EUR 129.4 million (120.6), up by 7.3% compared with 1-6/2011. Operating result was EUR -7.2 million (-7.2) and the Operating result percentage was -5.5% (-6.0%). Operating result was negative due to normal seasonality and is expected to turn positive in H2 due to sales and profit generation during the winter tyre season.
Sales in tyre retail and service showed growth whereas gross and fleet business decreased in line with market. The gradual change of operating model from tyre sales to full car service in the stores continues with investments and local acquisition of car service shops. In the review period a total of 19 car service operations were acquired and integrated to existing Vianor stores.
In 2012 the focus will be on improving sales and market shares further, developing the car services business and improving cost efficiency.
Franchising and partner operations
Vianor expanded the network on Nokian Tyres’ key markets by 51 stores during H1/2012. At the end of the review period, the global Vianor network comprised of 961 stores of which 781 were partners. Vianor operates in 24 countries; most extensively in the Nordic countries, Russia and Ukraine. During the first half of the year Serbia joined as a new country in the network. Nokian Tyres’ market shares improved as a result of the expansion.
Expanding the partner franchise network will continue according to plans; the target is to have more than 1,000 stores by the end of 2012.
OTHER OPERATIONS
Truck Tyres
The Net sales of Nokian Truck Tyres were EUR 25.3 million (25.8), down by 2.0% compared to 1-6/2011. The demand in Central Europe declined rapidly during the first quarter, but started to recover slowly in the second quarter. Nokian truck tyres’ market share increased in the Nordic countries as well as in Central and Eastern Europe due to an improved product range in both premium and standard tyres. Sales and profitability were supported by an increasing share of Hakkapeliitta truck tyre sales and improving market position of Noktop retreading materials.
In 2012 the focus will be on increasing sales, improving market share as well as on controlling the tyre inventory and trade receivables. The expansion to Russia, CIS and Eastern Europe utilizing the “Vianor Truck” service concept will continue.
4-6/12 4-6/11 Change% 1-6/12 1-6/11 Change% 2011
Net sales, m€ 79.4 78.7 0.9 129.4 120.6 7.3 298.4
Operating result, m€ 3.2 5.9 -45.3 -7.2 -7.2 1.0 2.3
Operating result, % 4.0 7.5 -5.5 -6.0 0.8
RONA,% (roll.12 m.) 1.4 -1.6 1.4

9(24)
RUSSIA AND THE CIS COUNTRIES
Nokian Tyres’ sales in Russia increased year-over-year by 70.1% to EUR 327.9 million (192.8). Sales in CIS countries (excluding Russia) were EUR 14.1 million (12.0). Consolidated sales in Russia and CIS increased by 67.0% to EUR 342.0 million (204.8).
Sales in Russia grew significantly prompted by a good economic situation and continued growth in new car sales along with improved production and supply capacity of Nokian Tyres. Winter tyre sales increased significantly, both in premium and mid-price segments. Nokian Tyres improved further its market shares and the market leader position in Russia.
The distribution network was extended by signing additional distribution agreements and expanding the Vianor network. There were a total of 505 Vianor stores in 297 cities in Russia and CIS countries at the end of the review period. Nokian Tyres’ e-commerce development proceeded according to plans.
In the beginning of 2012 the annual capacity in the Russian factory was approximately 11 million tyres. The company has commissioned a new plant next to the current one, which will increase the annual car tyre capacity further by 5-6 million tyres. The first line in the new plant has commenced production in June, and the second line is estimated to become on stream in late 2012. Capacity will increase further with two more lines being added during 2013-2014.
The Russian economy grew at an estimated real GDP growth of over 4% in H1/2012 versus H1/2011. Consumer confidence was strong and purchasing power improved. Russia is expected to show a healthy GDP growth of approximately 4% in 2012.
New car sales, the main driver for premium tyres, increased by 14% with western brands growing by 24% in the first half-year compared to H1/2011. The new car sales were supported by the moderate credit rates offered by banks (including loans subsidized by car manufacturers). The car sales annual growth in 2012 is forecasted to be in the range of 10-15% with a return to 2008 volume. The sales of used cars are also strong with demand exceeding supply. Western cars that were acquired in large volumes before 2010 are now in need of both summer and winter replacement tyres.
The market potential with strong underlying consumer demand in Russia is evident with strong growth in car and tyre sales. Tyre industry deliveries to distributors increased by 20% in H1/2012 year-over-year. The market is expected to show healthy growth throughout 2012, although the successful H1 pre-deliveries in Russia may shift sales from Q3 to Q4, closer to the consumer winter tyre season.
The Nokian Tyres plant located in Russia inside the customs borders (duty 20% for imported tyres) combined with an expanding Vianor chain provides a significant competitive edge on the market. By Russia joining WTO, the tyre duties will go down gradually; duty of car and van tyres will decrease from 20% to 10% in 5 years.
INVESTMENTS
Investments in January-June amounted to EUR 109.8 million (52.6). This comprises of production investments in the Russian and Finnish factories, moulds for new products and the Vianor expansion projects.

10(24)
OTHER MATTERS
1. Stock options on the NASDAQ OMX Helsinki Stock Exchange
The total number of stock options 2010A is 1,320,000. Each stock option 2010A entitles its holder to subscribe for one Nokian Tyres plc share. The shares can be subscribed with the stock options 2010A during 1 May 2012 - 31 May 2014. In the aggregate, the stock options 2010A entitle their holders to subscribe for 1,320,000 shares. The present share subscription price with stock options 2010A is EUR 16.29/share. The dividends payable annually shall be deducted from the share subscription price.
The total number of stock options 2007C is 2,250,000. Each stock option 2007C entitles its holder to subscribe for one Nokian Tyres plc share. The shares can be subscribed with the stock options 2007C during 1 March 2011 - 31 March 2013. In the aggregate, the stock options 2007C entitle their holders to subscribe for 2,250,000 shares. The present share subscription price with stock options 2007C is EUR 6.39/share. The dividends payable annually shall be deducted from the share subscription price.
2. Shares subscribed with option rights
After 14 December 2011 registered new shares a total of 761,322 Nokian Tyres plc's shares have been subscribed with the 2007B option rights and 125,233 with the 2007C option rights. These option rights are attached to the Nokian Tyres plc's Option Programs of 2007. New shares have been registered into the Trade Register on 21 February 2012. After the subscription the number of Nokian Tyres plc shares increased to 130,496,395 shares.
After 21 February 2012 registered new shares a total of 1,041,159 Nokian Tyres plc's shares have been subscribed with the 2007B option rights and 325,172 with the 2007C option rights. These option rights are attached to the Nokian Tyres plc's Option Programs of 2007. New shares have been registered into the Trade Register on 22 May 2012. As a result of the share subscriptions, the number of Nokian Tyres plc shares will increase to 131,862,726 shares.
3. Share price development
The Nokian Tyres’ share price was EUR 29.86 (EUR 34.60) at the end of the review period. The volume weighted average share price during the period was EUR 32.19 (EUR 30.69), the highest EUR 38.20 (EUR 35.45) and the lowest EUR 24.84 (EUR 26.07). A total of 107,451,845 shares were traded during the period (79,232,991), representing 81% (61%) of the company's overall share capital. The company’s market value at the end of the period amounted EUR 3.937 billion (EUR 4.480 billion).The company’s percentage of Finnish shareholders was 36.4% (37.2) and 63.6 % (62.8) were foreign shareholders registered in the nominee register. This figure includes Bridgestone's ownership of approximately 15.2%.
4. Decisions made at the Annual General Meeting
On 12 April 2012, Nokian Tyres Annual General Meeting accepted the financial statements for 2011 and discharged the Board of Directors and the President and CEO from liability.
The meeting decided that a dividend of EUR 1.20 per share shall be paid for the period ending on 31 December, 2011. The dividend was decided to be paid to shareholders included in the shareholder list maintained by Euroclear Finland Ltd on the record date of 17 April 2012. The proposed dividend payment date was decided to be 3 May 2012. 4.1. Members of the Board of Directors and Auditor
The meeting decided that the Board of Directors has seven members. Kim Gran, Hille Korhonen, Hannu Penttilä, Benoît Raulin, Aleksey Vlasov and Petteri Walldén will continue in the Nokian Tyres’ Board of Directors. Risto Murto was elected as a new member of the Board. Authorised public accountants KPMG Oy Ab continue as auditors.

11(24)
4.2. Remuneration of the Members of the Board of Directors
The meeting decided that the fee paid to the Chairman of the Board is EUR 80,000 per year, while that paid to Board members is set at EUR 40,000 per year. With the exception of the President and CEO, members of the Board and the Nomination and Remuneration Committee are also granted an attendance fee of EUR 600 per meeting.
In addition, 50% of the annual fee be paid in cash and 50% in company shares, such that in the period from 12 April to 30 April 2012, EUR 40,000 worth of Nokian Tyres plc shares will be purchased at the stock exchange on behalf of the Chairman of the Board and EUR 20,000 worth of shares on behalf of each Board member. This means that the final remuneration paid to Board members is tied to the company’s share performance. No separate compensation will be paid to the President and CEO for Board work.
4.3. Authorization for a share issue
The Annual General Meeting authorized the Board of Directors to make a decision to offer no more than 25,000,000 shares through a share issue, or by granting special rights under chapter 10 section 1 of the Finnish Companies Act that entitle to shares (including convertible bonds) on one or more occasions. The Board may decide to issue new shares or shares held by the company. The maximum number of shares included in the authorization accounts for approximately 19% of the company’s entire share capital.
The authorization includes the right to issue shares or special rights through private offering, in other words to deviate from the shareholders’ pre-emptive right subject to provisions of the law.
Under the authorization, the Board of Directors will be entitled to decide on the terms and conditions of a share issue, or the granting of special rights under chapter 10, section 1 of the Finnish Companies Act, including the recipients of shares or special rights entitling to shares, and the compensation to be paid. This authorization was given to be exercised for purposes determined by the Board of Directors.
The subscription price of new shares shall be recognized under unrestricted equity reserve. The consideration payable for Company’s own shares shall be recognized under unrestricted equity reserve.
The authorization will be effective for five years from the decision made at the Annual General Meeting. This authorization invalidates all other Board authorizations regarding share issues and convertible bonds.
5. Changes in ownership
Nokian Tyres received a notification from JPMorgan Chase & Co on 12 April 2012, according to which the total ownership of J.P. Morgan Securities Ltd, JPMorgan Asset Management (UK) Limited, JPMorgan Asset Management (Taiwan) Limited, JP Morgan Chase Bank National Association and J.P. Morgan Investment Management Inc. rose to 5.26% of the share capital in Nokian Tyres plc as a result of a share transaction concluded on 11 April 2012.
Nokian Tyres received a notification from JPMorgan Chase & Co on 18 April 2012, according to which the total holding of J.P. Morgan Securities Ltd, JPMorgan Asset Management (UK) Limited, JPMorgan Asset Management (Taiwan) Limited, JP Morgan Chase Bank National Association and J.P. Morgan Investment Management Inc. in Nokian Tyres plc fell below 5% as a result of a share transaction concluded on 17 April 2012.
6. Events after the reporting period
Nokian Tyres received a notification from Capital Research and Management Company (CRMC) on 12 July 2012, according to which the total holding of CRMC in Nokian Tyres plc exceeded 5% as a result of a share transaction concluded on 11 July 2012.
12(24)
RISKS, UNCERTAINTY AND DISPUTES IN THE NEAR FUTURE
Based on economic data the Euro area has practically been in a recession since spring 2011 and the growth for full year 2012 is expected to be negative. The development is however very uneven across the region. European and U.S. debt problems remain unresolved and the emerging economies’ growth is slowing down. These uncertainties may weaken future demand for tyres. However, Nokian Tyres’ core markets, the Nordic countries and Russia, have relatively healthy economies.
The company’s receivables have increased in H1/2012 in line with the increased sales and business model. Tyre inventories are on a planned level. The company follows the development of NWC very closely. At the end of the review period Russian trade receivables accounted for 44% of the Groups total trade receivables.
Around 36% of the Group’s Net sales in 2012 are estimated to be generated from Euro-denominated sales. The most important sales currencies in addition to the Euro are the Russian Rouble, the Swedish and Norwegian Krona, the US Dollar and the Ukrainian Hryvnia.
Nokian Tyres’ other risks and uncertainty factors relate to the prices of raw materials. The maintaining of profitability in case of rising raw material prices depends on the company’s ability to raise tyre prices in line with the increasing raw material cost. An efficient ramp-up of new production lines in Russia will depend on the success of recruiting and retaining work force in a tightening labour market.
Nokian Tyres group has no pending disputes or litigations expected to have material effect on the performance or future outlook of the group.
13(24)
OUTLOOK FOR 2012 The order book for Nokian car tyres remains good despite a more challenging market. The company has further improved its position by winning market shares on all targeted markets in Russia and Northern Europe. Timing of sales in Russia, distributors’ carry-over stocks and the uncertainty in Europe may shift sales from Q3 to Q4, closer to the consumer winter tyre season.
In 2012 the car tyre demand is expected to continue to grow globally at a rate of 2-4% driven by growth in emerging markets. Europe is expected to show negative growth with northern countries performing comparatively well. Demand in Russia is forecasted to continue to show healthy growth on the back of growth in GDP, car sales and an expanding replacement market.
The growing production capacity offers further growth potential and productivity gains, and a declining fixed cost ratio supports profitability. Capacity in Nokia, Finland has been cut for H2/2012 to support growth of production in Russia. In the beginning of 2012 the annual capacity in the Russian factory was approximately 11 million tyres. The company has commissioned a new plant next to the current one, which will increase the annual car tyre capacity further by 5-6 million tyres. The first line in the new plant has commenced production in June, and the second line is estimated to become on stream in late 2012. Capacity will increase further with two more lines being added during 2013-2014. The company and Russian authorities have signed agreements which will prolong incentives and tax relieves until approximately 2020.
Nokian Heavy Tyres’ sales in 2012 are estimated to decrease compared to 2011 due to a softer demand.
Nokian Tyres’ raw material cost (EUR/kg) has been levelling off and for full year 2012 it is estimated to be the same as in 2011.
A healthy order book in the core markets, an expanding distribution channel, fluent seasonal logistics, an improved cost structure with majority of production inside duty borders of Russia and CIS as well as new test winner products will give Nokian Tyres a good chance to strengthen its market leadership in the core markets and to continue strong profitable growth even in the more challenging environment.
Financial guidance (unchanged): In 2012, the company is positioned to improve Net sales and Operating profit compared to 2011.
INVESTMENTS IN 2012
Nokian Tyres’ budget for total investments in 2012 is EUR 210 million (161.7). EUR 150 million will be invested in Russia, including the start of the new production facilities. The balance comprises of investments in Nokia plant (automation, moulds, ICT, R&D) EUR 32 million, Heavy tyres EUR 15 million and sales companies including Vianor chain with its acquisitions EUR 13 million.
Nokia, 8 August 2012
Nokian Tyres plc
Board of Directors
***
The above-said information contains forward-looking statements relating to future events or future financial performance of the company. In some cases, such forward-looking statements can be identified by terminology such as ”may”, ”will”, ”could”, ”expect”, ”anticipate”, ”believe” ”estimate”, ”predict”, or other comparable terminology. Such statements are based on the current expectations, known factors, decisions and plans of the management of Nokian Tyres. Forward-looking statements involve always risks and uncertainties, because they relate to events and depend on circumstances that may or may not occur in the future. Future results may thus vary even significantly from the results expressed in, or implied by, the forward-looking statements.
***

14(24)
This Interim Report has been prepared in accordance with IAS 34 Interim Reports standard. The company has adopted certain new or revised IFRS standards and IFRIC interpretations at the beginning of the financial period as described in the Financial Statements 2011. However, the adaption of these new or amended standards has not yet had an effect on the reported figures in practice. On the other respects, the same accounting policies have been followed as in the Financial Statements 2011. The interim report figures are unaudited.
NOKIAN TYRES CONSOLIDATED INCOME STATEMENT 4-6/12 4-6/11 1-6/12 1-6/11 Last 12 1-12/11 ChangeMillion euros months %
Net sales 413.8 338.8 798.0 628.0 1,626.9 1,456.8 27.1Cost of sales -228.2 -181.1 -435.5 -336.7 -904.5 -805.8 -29.3Gross profit 185.5 157.7 362.5 291.2 722.3 651.0 24.5Other operating income 0.4 0.5 0.8 1.2 1.4 1.8Selling and marketing expenses -57.3 -51.8 -112.3 -103.3 -225.6 -216.5 -8.7Administration expenses -8.6 -8.3 -16.9 -14.5 -31.8 -29.4 -16.6Other operating expenses -7.3 -4.8 -16.4 -9.0 -34.2 -26.8 -82.0Operating profit 112.7 93.3 217.7 165.6 432.2 380.1 31.5Financial income 26.9 15.0 64.0 49.6 105.2 90.9 28.9Financial expenses -31.5 -23.0 -71.4 -59.9 -123.3 -111.8 -19.2Profit before tax 108.0 85.4 210.3 155.3 414.1 359.2 35.4Tax expense (1 -12.7 -11.2 -27.3 -18.7 -58.9 -50.3 -45.9Profit for the period 95.4 74.2 182.9 136.6 355.3 308.9 34.0
Attributable to: Equity holders of the parent 95.4 74.2 182.9 136.6 355.3 308.9Non-controlling interest 0.0 0.0 0.0 0.0 0.0 0.0
Earnings per share from the profit attributable to equity holders of the parent Basic, euros 0.73 0.57 1.40 1.06 2.39 32.2Diluted, euros 0.71 0.57 1.36 1.05 2.32 29.4

15(24)
CONSOLIDATED OTHER COMPREHENSIVE INCOME 4-6/12 4-6/11 1-6/12 1-6/11 1-12/11Million euros
Profit for the period 95.4 74.2 182.9 136.6 308.9Other comprehensive income, net of tax: Gains/Losses from hedge of net investments in foreign operations 0.9 0.4 -8.5 0.6 -2.9Cash flow hedges 0.0 -0.9 0.2 0.7 -1.4Translation differences on foreign operations -25.8 -1.8 19.6 4.4 -7.6Total other comprehensive income for the period, net of tax -24.9 -2.2 11.3 5.7 -11.9Total comprehensive income for the period 70.5 71.9 194.3 142.5 297.0
Total comprehensive income attributable to: Equity holders of the parent 70.5 71.9 194.3 142.5 297.0Non-controlling interest 0.0 0.0 0.0 0.0 0.0
1)Tax expense in the consolidated income statement is based on the taxable result for the period.
KEY RATIOS 30.6.12 30.6.11 31.12.11 Change %
Equity ratio, % 62.8 70.2 63.2Gearing, % 25.9 20.0 -0.3Equity per share, euro 9.65 7.92 9.15 21.7 Interest-bearing net debt. mill. euros 329.3 205.0 -3.6Capital expenditure, mill. euros 109.8 52.6 161.7Depreciation, mill. euros 39.6 35.4 71.6Personnel, average 4,078 3,727 3,866
Number of shares (million units) at the end of period 131.86 129.48 129.61in average 130.55 128.68 129.12in average, diluted 137.07 135.90 135.70

16(24)
CONSOLIDATED STATEMENT OF FINANCIAL POSITION 30.6.12 30.6.11 31.12.11Million euros
Non-current assets Property, plant and equipment 629.5 503.6 560.4Goodwill 65.7 60.1 63.8Other intangible assets 24.6 19.8 22.6Investments in associates 0.1 0.1 0.1Available-for-sale financial assets 0.3 0.3 0.3Other receivables 19.5 21.4 17.9Deferred tax assets 6.9 19.2 5.4Total non-current assets 746.6 624.5 670.4
Current assets Inventories 378.4 310.3 324.0Trade receivables 609.0 419.8 335.3Other receivables 94.5 84.9 81.6Cash and cash equivalents 201.4 22.4 464.5Total current assets 1,283.2 837.4 1,205.5
Equity Share capital 25.4 25.4 25.4Share premium 181.4 181.4 181.4Translation reserve -70.4 -66.0 -81.5Fair value and hedging reserves -1.8 0.1 -2.0Paid-up unrestricted equity reserve 78.7 34.4 35.4
Retained earnings 1,058.7 850.7 1,027.2Non-controlling interest 0.3 0.0 0.3Total equity 1,272.3 1,026.0 1,186.1
Non-current liabilities Deferred tax liabilities 26.5 30.3 31.2Provisions 0.1 0.1 0.0Interest bearing financial liabilities 336.0 203.2 207.6Other liabilities 3.0 1.4 2.5Total non-current liabilities 365.6 234.9 241.2
Current liabilities Trade payables 78.1 86.7 88.4Other current payables 117.7 87.8 104.9Provisions 1.4 2.2 1.8Interest-bearing financial liabilities 194.6 24.2 253.4Total current liabilities 391.9 201.0 448.5
Total assets 2,029.8 1,461.9 1,875.9
17(24)
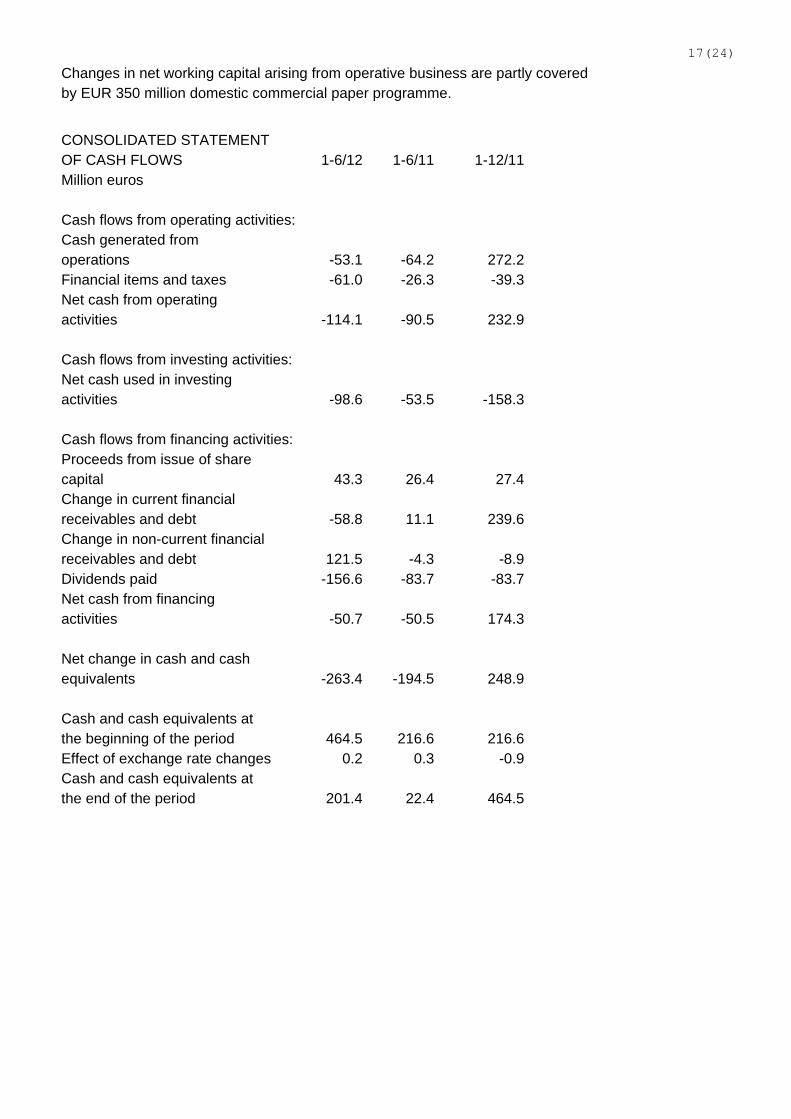
Changes in net working capital arising from operative business are partly covered by EUR 350 million domestic commercial paper programme.
CONSOLIDATED STATEMENT OF CASH FLOWS 1-6/12 1-6/11 1-12/11Million euros
Cash flows from operating activities: Cash generated from operations -53.1 -64.2 272.2Financial items and taxes -61.0 -26.3 -39.3Net cash from operating activities -114.1 -90.5 232.9
Cash flows from investing activities: Net cash used in investing activities -98.6 -53.5 -158.3
Cash flows from financing activities: Proceeds from issue of share capital 43.3 26.4 27.4Change in current financial receivables and debt -58.8 11.1 239.6Change in non-current financial receivables and debt 121.5 -4.3 -8.9Dividends paid -156.6 -83.7 -83.7Net cash from financing activities -50.7 -50.5 174.3
Net change in cash and cash equivalents -263.4 -194.5 248.9
Cash and cash equivalents at the beginning of the period 464.5 216.6 216.6Effect of exchange rate changes 0.2 0.3 -0.9Cash and cash equivalents at the end of the period 201.4 22.4 464.5

18(24)
CONSOLIDATED STATEMENT OF CHANGES IN EQUITY
A = Share capital B = Share premium C = Translation reserve D = Fair value and hedging reserves E = Paid-up unrestricted equity reserve F = Retained earnings G = Non-controlling interest H = Total equity
Equity attributable to equity holders of the parentMillion euros A B C D E F G H Equity, Jan 1st 2011 25.4 181.4 -71.1 -0.6 8.0 793.9 0.0 937.2 Profit for the period 136.6 136.6 Other comprehensive income, net of tax: Cash flow hedges 0.7 0.7 Net investment hedge 0.6 0.6 Translation differences 4.4 4.4 Total comprehensive income for the period 5.0 0.7 136.6 142.3 Dividends paid -83.7 -83.7 Exercised warrants 26.4 26.4 Share-based payments 3.8 3.8 Total transactions with owners for the period 26.4 -79.9 -53.5 Equity, Jun 30th 2011 25.4 181.4 -66.0 0.1 34.4 850.6 0.0 1,026.0
Equity, Jan 1st 2012 25.4 181.4 -81.5 -2.0 35.4 1,027.2 0.3 1,186.1 Profit for the period 182.9 0.0 182.9 Other comprehensive income, net of tax: Cash flow hedges 0.2 0.2 Net investment hedge -8.5 -8.5 Translation differences 19.6 0.0 19.6 Total comprehensive income for the period 11.1 0.2 182.9 0.0 194.3 Dividends paid -156.6 -156.6 Exercised warrants 43.3 43.3 Share-based payments 5.2 5.2 Total transactions with owners for the period 43.3 -151.4 -108.1 Equity, Jun 30th 2012 25.4 181.4 -70.4 -1.8 78.7 1,058.7 0.3 1,272.3

19(24)
SEGMENT INFORMATION
Million euros 4-6/12 4-6/11 1-6/12 1-6/11 1-12/11 Change%
Net sales Passenger car tyres 317.1 238.8 633.0 468.5 1,071.1 35.1Heavy tyres 26.5 28.3 53.6 56.7 112.8 -5.5Vianor 79.4 78.7 129.4 120.6 298.4 7.3Other operations 16.4 19.3 31.3 32.1 73.8 -2.7Eliminations -25.7 -26.2 -49.2 -49.9 -99.3 1.4Total 413.8 338.8 798.0 628.0 1,456.8 27.1
Operating result Passenger car tyres 110.0 83.9 228.7 168.0 365.1 36.2Heavy tyres 2.6 4.6 6.3 10.0 17.2 -36.6Vianor 3.2 5.9 -7.2 -7.2 2.3 1.0Other operations 0.1 -1.2 -3.0 -0.7 -1.1 -345.7Eliminations -3.1 0.0 -7.2 -4.5 -3.4 -59.4Total 112.7 93.3 217.7 165.6 380.1 31.5
Operating result, % of net sales Passenger car tyres 34.7 35.2 36.1 35.9 34.1Heavy tyres 9.6 16.2 11.9 17.7 15.3Vianor 4.0 7.5 -5.5 -6.0 0.8Total 27.2 27.5 27.3 26.4 26.1
Cash Flow II Passenger car tyres -33.0 -22.6 -122.4 -36.7 151.9 -233.8Heavy tyres -2.1 -5.3 -11.5 -13.1 5.2 12.0Vianor -3.0 -7.9 -8.5 -20.1 -23.3 57.8Total -42.5 -49.9 -163.9 -102.3 114.1 -60.3

20(24)
CHANGES IN PROPERTY, PLANT AND EQUIPMENT
Million euros 30.6.12 30.6.11 31.12.11
Opening balance 560.4 483.6 483.6 Capital expenditure 106.4 52.5 159.7 Decrease -3.0 -2.5 -8.7 Depreciation for the period -36.6 -32.8 -66.2 Exchange differences 2.2 2.8 -7.9 Closing balance 629.5 503.6 560.4
CONTINGENT LIABILITIES 30.6.12 30.6.11 31.12.11 Million euros
FOR OWN DEBT Mortgages 1.1 1.0 1.1 Pledged assets 0.1 0.0 0.1
OTHER OWN COMMITMENTS Guarantees 3.3 6.1 3.3 Leasing and rent commitments 89.5 97.2 99.2 Purchase commitments 3.0 1.7 2.8
DERIVATIVE FINANCIAL INSTRUMENTS 30.6.12 30.6.11 31.12.11 Million euros
INTEREST RATE DERIVATIVES Interest rate swaps Notional amount 70.7 59.9 41.3 Fair value -1.6 -0.7 -1.4
FOREIGN CURRENCY DERIVATIVES Currency forwards Notional amount 655.7 412.7 651.0 Fair value 9.2 -0.8 -10.7 Currency options, purchased Notional amount 47.8 64.6 - Fair value 0.6 0.9 - Currency options, written Notional amount 96.1 113.1 - Fair value -1.1 -0.9 -
ELECTRICITY DERIVATIVES Electricity forwards Notional amount 15.2 16.3 16.5 Fair value -2.2 0.5 -1.9

21(24)
RELATED PARTY TRANSACTIONS The Group has related party relationships with members of the Board of Directors, the President, other key management personnel, and close members of their families, and Bridgestone Group with significant influence through share ownership.
Transactions and outstanding balances with parties having significant influence
Shareholders Bridgestone Group 1-6/12 1-6/11 1-12/11
Sales of goods 23.3 13.9 14.1 Purchases of goods 28.8 17.3 30.4
30.6.12 30.6.11 31.12.11 Trade and other receivables 9.5 4.4 1.7 Trade and other payables 8.4 6.7 1.4
Key management personnel 1-6/12 1-6/11 1-12/11 Total employee benefit expenses 3.4 2.9 6.8 Of which share-based payments 1.5 1.4 2.9
During 1 January and 30 June 2012 the President and other key management personnel were granted a total of 375,040 share options (during 1 January and 30 June 2011 410,000 share options). The share option plan terms for the key management personnel are equal to the share options directed at other personnel. On 30 June 2012 the key management personnel held 1,123,040 share options, with 377,000 exercisable (on 30 June 2011 1,345,655 share options, with 505,655 exercisable ). No share options have been granted to the other members of the Board of Directors.
22(24)
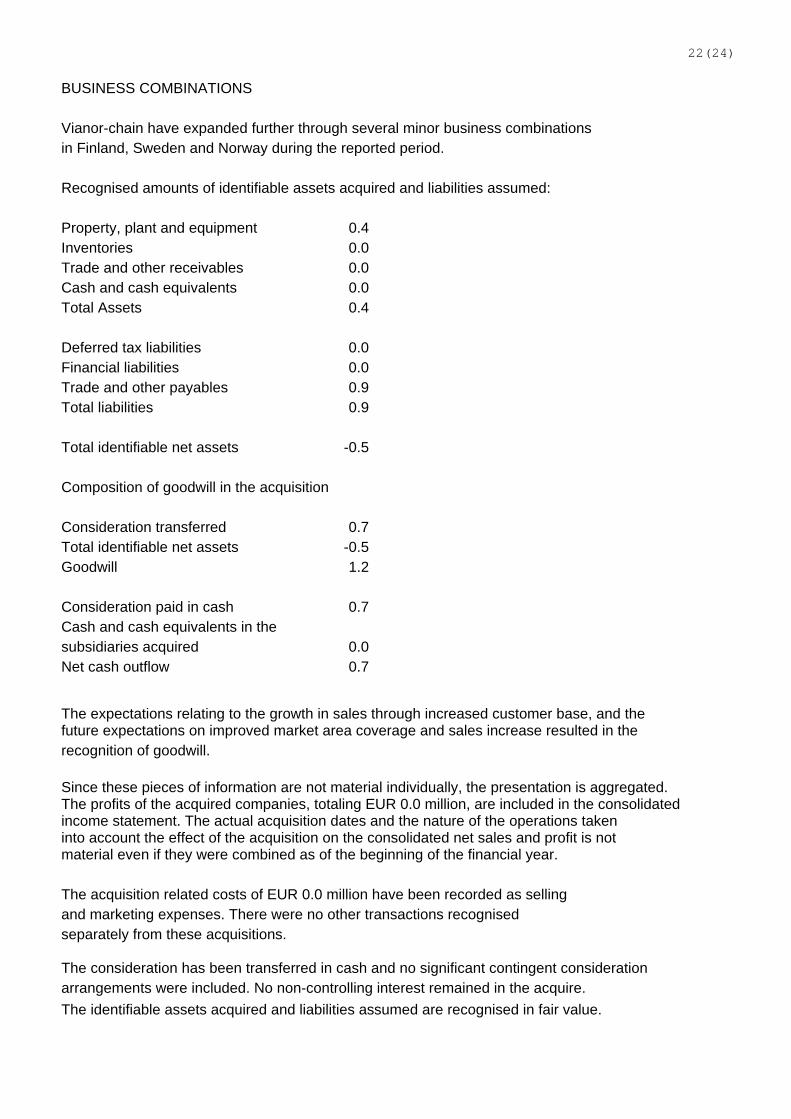
BUSINESS COMBINATIONS
Vianor-chain have expanded further through several minor business combinations in Finland, Sweden and Norway during the reported period.
Recognised amounts of identifiable assets acquired and liabilities assumed:
Property, plant and equipment 0.4Inventories 0.0Trade and other receivables 0.0Cash and cash equivalents 0.0Total Assets 0.4
Deferred tax liabilities 0.0Financial liabilities 0.0Trade and other payables 0.9Total liabilities 0.9
Total identifiable net assets -0.5
Composition of goodwill in the acquisition
Consideration transferred 0.7Total identifiable net assets -0.5Goodwill 1.2
Consideration paid in cash 0.7Cash and cash equivalents in the subsidiaries acquired 0.0Net cash outflow 0.7 The expectations relating to the growth in sales through increased customer base, and the future expectations on improved market area coverage and sales increase resulted in the recognition of goodwill.
Since these pieces of information are not material individually, the presentation is aggregated. The profits of the acquired companies, totaling EUR 0.0 million, are included in the consolidatedincome statement. The actual acquisition dates and the nature of the operations taken into account the effect of the acquisition on the consolidated net sales and profit is not material even if they were combined as of the beginning of the financial year.
The acquisition related costs of EUR 0.0 million have been recorded as selling and marketing expenses. There were no other transactions recognised separately from these acquisitions. The consideration has been transferred in cash and no significant contingent consideration arrangements were included. No non-controlling interest remained in the acquire.
The identifiable assets acquired and liabilities assumed are recognised in fair value.

23(24)
Goodwill is measured as the excess of the consideration transferred over the total identifiable net assets. None of the goodwill recognised is deductible for income tax purposes. DEFINITIONS OF CONSOLIDATED KEY FINANCIAL INDICATORS
Earnings per share, euro: Profit for the period attributable to the equity holders of the parent / Average adjusted number of shares during the period
Earnings per share (diluted), euro: Profit for the period attributable to the equity holders of the parent / Average adjusted and diluted number of shares during the period
The share options affect the dilution as the average share market price for the period exceeds the defined subscription price.
Equity ratio, %: Total equity x 100 / (Total assets - advances received)
Gearing, %: Interest-bearing net debt x 100 / Total equity
Equity per share, euro: Equity attributable to equity holders of the parent / Adjusted number of shares on the reporting date

24(24)
DEFINITIONS OF SALES AREAS
Nordic countries: Finland, Norway, Sweden.
Russia and CIS:
Russia, Armenia, Belarus, Georgia, Kazakhstan, Moldova, Ukraine.
Central and Eastern Europe:
Albania, Austria, Belgium, Bulgaria, Croatia, Czech Republic, Denmark, Estonia, France, Germany, Greece, Hungary, Iceland, Ireland, Italy, Latvia, Lithuania, The Former Yugoslav Republic of Macedonia, Montenegro, Netherlands, Poland, Portugal, Romania, Serbia, Slovakia, Slovenia, Spain, Switzerland, Turkey, United Kingdom.
North America: Canada, USA.
Core markets: Nordic countries, Russia and CIS.
*****
Nokian Tyres plc
Antti-Jussi Tähtinen, Vice President, Marketing and Communications
Further information: Mr. Kim Gran, President and CEO, tel: +358 10 401 7336
Distribution: NASDAQ OMX, media, www.nokiantyres.com
*****
Nokian Tyres Interim Report January-June was published on Wednesday 8 August, 2012 at 8.00 a.m. Finnish time.
The result presentation to analysts and media will be held in Hotel Kämp in Helsinki at 10.00 a.m. Finnish time. The presentation can be listened through audiocast via internet at http://www.nokiantyres.com/resultinfoq22012
To be able to ask questions during the event you can participate in the conference call. Please dial in 5-10 minutes before the beginning of the event: +358 (0)9 2313 9202 (Finland) or +44 (0)207 1620 177 (UK). Password: 920299.
Stock exchange release and presentation material will be available before the event from http://www.nokiantyres.com/ir-calendar
After the event the audio recording can be downloaded from the same page.
Nokian Tyres interim report January-September will be published on Tuesday 30 October, 2012. Releases and company information will be found from http://www.nokiantyres.com