Embed Size (px)
Citation preview
Nokia sustainability report2009
The navigation of the report is interactive, enabling you to jump to any section at any time.
We therefore encourage you to consider the environment before printing this document.
1.0 CEO’s Message 3
2.0 Nokia in 2009 6
3.0 About the report 93.1 Introduction to reporting principles 10 3.1.1 GRI 12 3.1.2 Global Compact 13 3.1.3 Sustainability governance 14 3.1.4 Regulatory Compliance 15 3.1.5 Sustainability opportunities and risks 163.2 Stakeholder Engagement 19 3.2.1 External Recognition and Awards 22 3.2.2 Accessibility 243.3 Health and safety of product use 253.4 Customer satisfaction 26 3.4.1 Trade customers 26 3.4.2 Operators 27 3.4.3 Consumers 273.5 Privacy and security 28
4. Employees 294.1 Employment practices 30 4.1.1 Consultation and communication 30 4.1.2 Employee forums and collective 31
bargaining 4.1.3 Employee survey 324.2 Nokia Way 33 4.2.1 The Nokia Way and Values 33 4.2.2 Defining our values 34 4.2.3 Labor practices and employment 35
guidelines 4.2.4 Labor conditions standard 36 4.2.5 External temporary labor in production 37 4.2.6 Factory assessments 38 4.2.7 Employment breakdown 394.3 Diversity 404.4 Talent development 42 4.4.1 Education policy 42 4.4.2 Training and development 434.5 Performance management 44 4.5.1 Performance evaluation 44 4.5.2 Leadership 454.6 Performance-based rewarding 46 4.6.1 Incentives 474.7 Reorganization and restructuring 48
4.8 Health, safety and wellbeing 49 4.8.1 Management practices 49 4.8.2 Health and safety performance 50 4.8.3 Employee wellbeing 514.9 Working together, making a difference 524.10 Code of Conduct 53
5.0 Supply chain 545.1 Supplier requirements 555.2 Supplier performance 56 5.2.1 Supplier self-assessments 57 5.2.2 Supplier on-site assessments 585.3 Supplier performance metrics 59
and targets 5.4 Training and building capability 605.5 Sourcing materials 61 5.5.1 Origin of raw materials 625.6 Industry collaboration 63
6.0 Corporate social investment 646.1 Corporate social investment strategy 656.2 The development of our corporate social 66
investment programming 6.2.1 Mobile technology for development 67 6.2.2 Youth development 696.3 Disaster relief 706.4 Employee volunteering 70
7.0. Environment 717.1 Environmental strategy 72 7.1.1 Minimizing our environmental 73
footprint 7.1.2 Key focus areas 74 7.1.3 Climate strategy 757.2 Environmental management at Nokia 77 7.2.1 Environmental Management Systems 78 7.2.2 Participation in external initiatives 79 7.2.3 Environmental stakeholder 80
engagement 7.2.4 Training and development 817.3 ICT as an enabler 827.4 Environment and our products 83 7.4.1 Rolling out eco improvements across 84
the product portfolio 7.4.2 Environmental impact of our products 85 7.4.3 Materials and substance management 86
7.4.4 Product energy efficiency 87 7.4.5 Packaging 887.5 Promoting sustainability through Nokia 89
services 7.6 Take-back and recycling 2009 90 7.6.1 Our long-term commitment to partner 91
networks – the story of China Green Box 7.6.2 Expansion to new regions – 92
Middle East and Africa 7.6.3 Cooperating with the Finnish Post 93
Office on take-back 7.6.4 Take-back campaigns in South 94
East Asia Pacific (SEAP) in 2009 7.6.5 USA goes to the movies 95 7.6.6 Latin America collection network 96 7.6.7 Indian take-back campaign kick 97
off and expansion 7.6.8 Europe – producer associations 98
8.0 Operations 998.1 Facility energy consumption, 100
emissions and water use 8.2 Factory initiatives 101 8.2.1 Dongguan, China 101 8.2.2 Chennai, India 101 8.2.3 Salo, Finland 102 8.2.4 Masan, South Korea 102 8.2.5 Other plants 1028.3 Energy efficiency 1038.4 Factory energy efficiency projects 1048.5 Renewable energy 1058.6 Green buildings 1068.7 Other sustainability projects 1088.8 Green logistics 1098.9 Travel and commuting 1108.10 Other environmental impacts 111
9.0 Key data 2009 113
10.0 Independent Assurance 133
11.0 GRI index 2009 138
Contents
Page 2Nokia sustainability report2009
Navigation bar
Contents 21.0 CEO’s Message 3 2.0 Nokia in 2009 63.0 About the report 94.0 Employees 29 5.0 Supply chain 54 6.0 Corporate social investment 64 7.0 Environment 718.0 Operation 999.0 Key data 2009 11310.0 Independent Assurance 13311.0 Global Reporting Initiative Index 2009 138
Contents
Navigation bar
Contents1.0 CEO’s Message 3 2.0 Nokia in 2009 63.0 About the report 94.0 Employees 29 5.0 Supply chain 54 6.0 Corporate social investment 64 7.0 Environment 718.0 Operation 999.0 Key data 2009 11310.0 Independent Assurance 13311.0 GRI Index 2009 138
Nokia sustainability report2009
Navigation bar
Contents 21.0 CEO’s Message 3 2.0 Nokia in 2009 63.0 About the report 94.0 Employees 29 5.0 Supply chain 54 6.0 Corporate social investment 64 7.0 Environment 718.0 Operation 999.0 Key data 2009 11310.0 Independent Assurance 13311.0 Global Reporting Initiative Index 2009 138
Page 3
1. 0CEO’s Message
1.0 CEO’s Message 4
1.0CEO’s Message
At Nokia we strive to lead in sustainability by taking it into account in everything we do. While it is a key part of our business strategy, we also look beyond our own operations to how the more than 1.2 billion people who use a Nokia phone can use mobility to embrace a more sustainable lifestyle every day.
In this report, we present a wide range of examples of how and where our work enhances sustainability. There are sections on improved accessibility, education, data gathering, materials management, product energy efficiency and the various environmental services available through mobile devices. We also look at improvements in our own operations, such as packaging, logistics and supply chain management. We believe that better use of information and communication technologies can contribute in a big way to economic growth while offering considerable opportunities to cut greenhouse gas emissions and address global warming. That said, the full potential of mobility to help drive sustainability has yet to be realised.
Last year had its challenges brought about by the global recession and changes in the mobile industry. Nokia is responding to the increasing consumer interest in features that are driven by innovations in software. As a result, we have been working hard to rebuild our R&D organization and define new ways of working. In early 2009, we announced voluntary measures aimed at reducing personnel-related costs and the need for involuntary layoffs. Thanks to cooperation with our employees, our programs were successful and of the reductions that we made in 2009, less than 25 percent were involuntary.
On a more positive note, after several years favorable rating by the widely recognized Dow Jones Sustainability Indexes, this year Nokia was chosen as the “World Technology Supersector Leader.” This honor means Nokia was ranked No. 1 in sustainability across the entire global technology sector on the basis of a detailed corporate sustainability analysis.
Nokia has a long track record of taking sustainability into account in the way we do business every day. For example, we regularly evaluate the use of water and materials, as well as our carbon dioxide emissions, across our supply chain. We have further broadened our environmental focus areas, with water and biodiversity issues growing in importance. In 2009, we continued to look at reducing the environmental impact of our devices and operations. For example, over the last decade, we have reduced the average no-load energy consumption of our chargers by more than 80 percent. In our best chargers, the reduction has been more than 95 percent.
Page 4Nokia sustainability report2009
1.0CEO’s Message
Navigation bar
Contents 21.0 CEO’s Message 3 2.0 Nokia in 2009 63.0 About the report 94.0 Employees 29 5.0 Supply chain 54 6.0 Corporate social investment 64 7.0 Environment 718.0 Operation 999.0 Key data 2009 11310.0 Independent Assurance 13311.0 Global Reporting Initiative Index 2009 138
continued...
1.0 CEO’s Message 4
Since we created our climate strategy in 2006, we have looked at how our products, services, operations, facilities and the ways we work can contribute to a reduction in our CO2 emissions. In 2009, we reduced our facilities’ CO2 emissions by 12 percent, compared with levels in 2006. During the same year, we also reached the energy savings target we had set to reach by 2012. We also made progress in waste utilization and in our efforts to reduce water use and air travel. These achievements were mainly due to various reduction programs, but the slowdown in business activities in 2009 also had an impact.
We also have been looking at increasing purchases of electricity from renewable sources in those countries where we manufacture our products. Unfortunately, we have found the availability of renewable electricity in our key countries to be limited and expanding more slowly than we had anticipated.
In the process of developing this report, we have referred to the guidance and requirements of the Global Reporting Initiative (GRI) and UN Global Compact reporting guidelines. We would welcome your views on our sustainability performance and this report.
Please send your comments to [email protected]
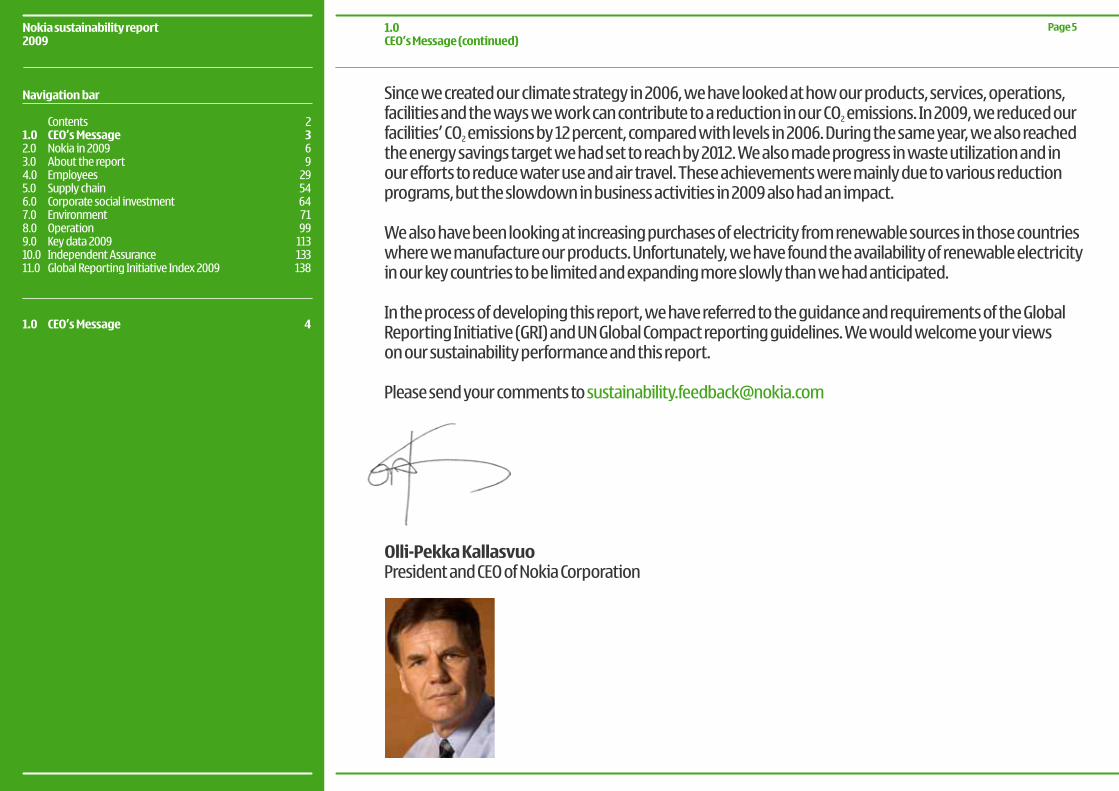
Olli-Pekka KallasvuoPresident and CEO of Nokia Corporation
Page 5Nokia sustainability report2009
1.0CEO’s Message (continued)
Navigation bar
Contents 21.0 CEO’s Message 3 2.0 Nokia in 2009 63.0 About the report 94.0 Employees 29 5.0 Supply chain 54 6.0 Corporate social investment 64 7.0 Environment 718.0 Operation 999.0 Key data 2009 11310.0 Independent Assurance 13311.0 Global Reporting Initiative Index 2009 138
1.0 CEO’s Message 4
Page 6Nokia sustainability report2009
Navigation bar
Contents 21.0 CEO’s Message 3 2.0 Nokia in 2009 63.0 About the report 94.0 Employees 29 5.0 Supply chain 54 6.0 Corporate social investment 64 7.0 Environment 718.0 Operation 999.0 Key data 2009 11310.0 Independent Assurance 13311.0 Global Reporting Initiative Index 2009 138
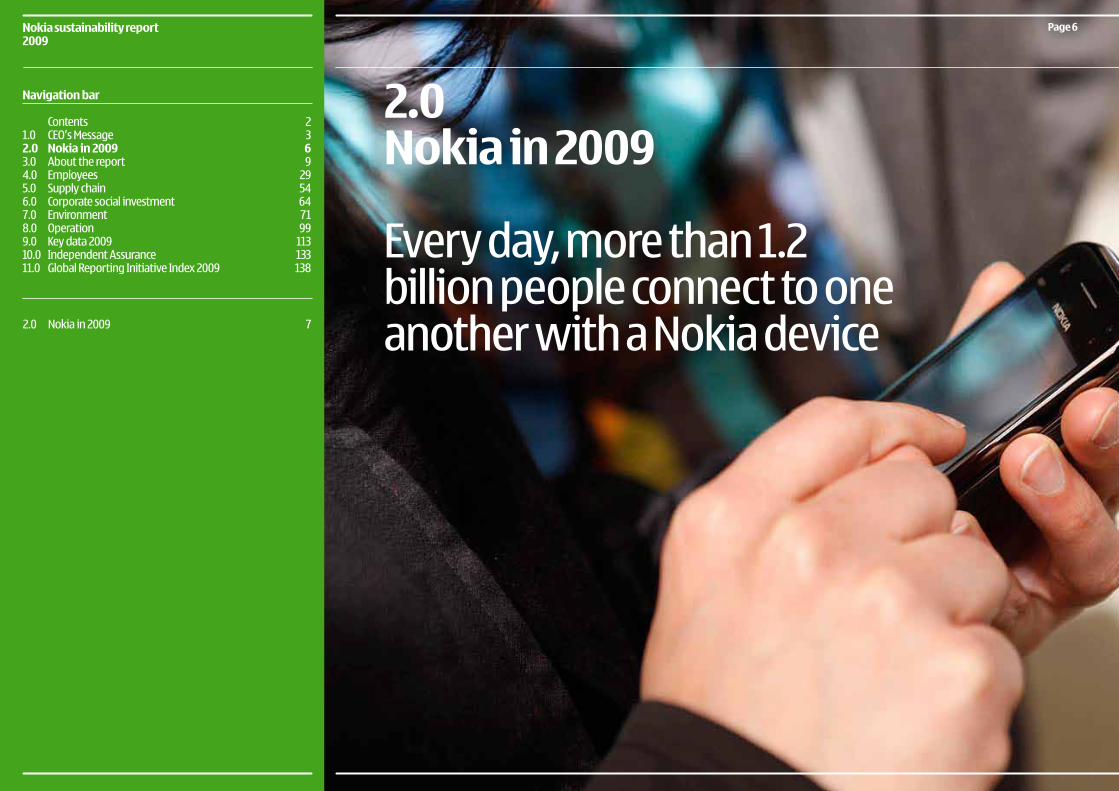
2.0Nokia in 2009
Every day, more than 1.2 billion people connect to one another with a Nokia device 2.0 Nokia in 2009 7
2.0 Nokia in 2009
At Nokia, we are committed to connecting people. We combine advanced technology with personalized services that enable people to stay close to what matters to them. Every day, more than 1.2 billion people connect to one another with a Nokia device – from mobile phones to advanced smartphones and high-performance mobile computers. Today, Nokia is integrating its devices with innovative services through Ovi (www.ovi.com), including music, maps, apps, email and more. Nokia’s NAVTEQ is a leader in comprehensive digital mapping and navigation services, while Nokia Siemens Networks provides equipment, services and solutions for communications networks globally.
2009 facts and figures•HeadofficeinFinland;R&D,production,sales,marketingactivitiesaroundtheworld•World’snumber1manufacturerofmobiledevices•Mobiledevicevolumes432millionunits•ReportednetsalesEUR41.0billion•ReportedoperatingprofitEUR1.2billion•123,553employeesatyearend(includingNokiaSiemensNetworks)•StrongR&Dpresencein16countries•R&DinvestmentEUR5.9billion•37,020employeesinR&D(approximately30%ofworkforce,includingNokiaSiemensNetworks)•Salesinover160countries
More information about our organization and other key corporate information is available at Nokia’s Form 20-F Annual Report 2009.
Page 7Nokia sustainability report2009
2.0 Nokia in 2009
Navigation bar
Contents 21.0 CEO’s Message 3 2.0 Nokia in 2009 63.0 About the report 94.0 Employees 29 5.0 Supply chain 54 6.0 Corporate social investment 64 7.0 Environment 718.0 Operation 999.0 Key data 2009 11310.0 Independent Assurance 13311.0 Global Reporting Initiative Index 2009 138
2.0 Nokia in 2009 7 Nokia organization in 2009 8
continued...
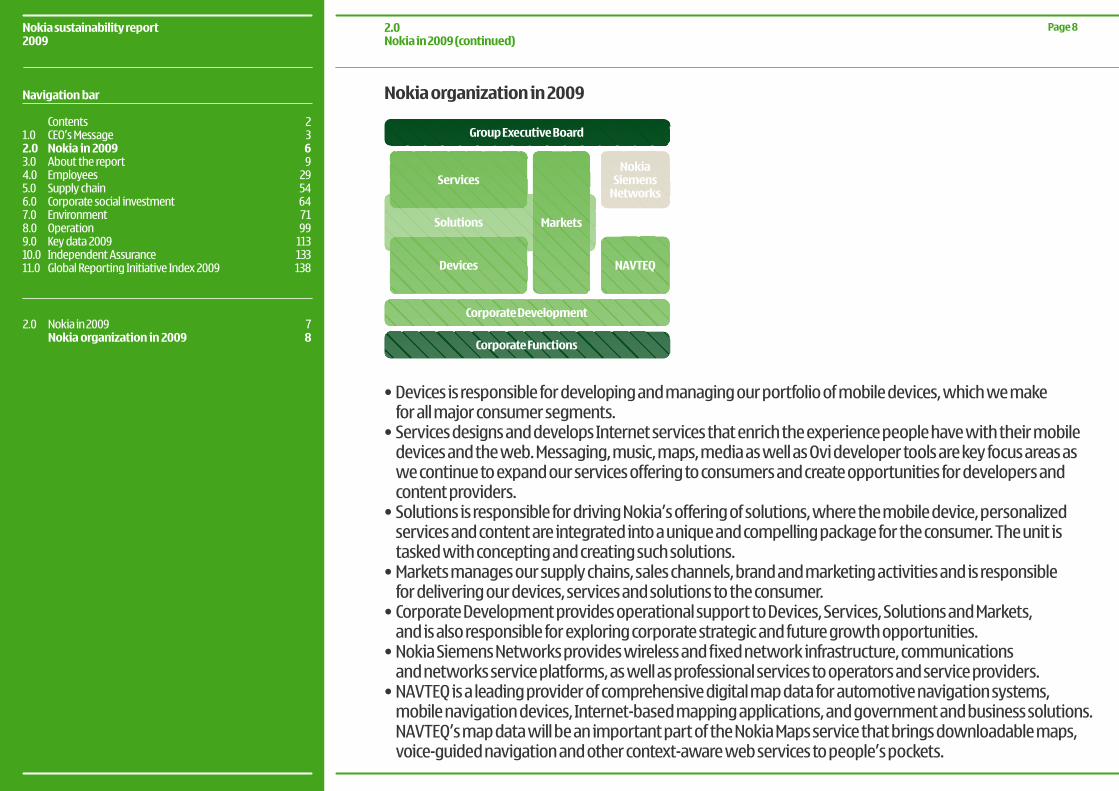
Nokia organization in 2009
•Devicesisresponsiblefordevelopingandmanagingourportfolioofmobiledevices,whichwemake for all major consumer segments.
•ServicesdesignsanddevelopsInternetservicesthatenrichtheexperiencepeoplehavewiththeirmobiledevices and the web. Messaging, music, maps, media as well as Ovi developer tools are key focus areas as we continue to expand our services offering to consumers and create opportunities for developers and content providers.
•SolutionsisresponsiblefordrivingNokia’sofferingofsolutions,wherethemobiledevice,personalizedservices and content are integrated into a unique and compelling package for the consumer. The unit is tasked with concepting and creating such solutions.
•Marketsmanagesoursupplychains,saleschannels,brandandmarketingactivitiesandisresponsible for delivering our devices, services and solutions to the consumer.
•CorporateDevelopmentprovidesoperationalsupporttoDevices,Services,SolutionsandMarkets, and is also responsible for exploring corporate strategic and future growth opportunities.
•NokiaSiemensNetworksprovideswirelessandfixednetworkinfrastructure,communications and networks service platforms, as well as professional services to operators and service providers.
•NAVTEQisaleadingproviderofcomprehensivedigitalmapdataforautomotivenavigationsystems,mobile navigation devices, Internet-based mapping applications, and government and business solutions. NAVTEQ’s map data will be an important part of the Nokia Maps service that brings downloadable maps, voice-guided navigation and other context-aware web services to people’s pockets.
Group Executive Board
Corporate Development
Corporate Functions
Services
Devices NAVTEQ
NokiaSiemens
Networks
MarketsSolutions
Page 8Nokia sustainability report2009
2.0 Nokia in 2009 (continued)
Navigation bar
Contents 21.0 CEO’s Message 3 2.0 Nokia in 2009 63.0 About the report 94.0 Employees 29 5.0 Supply chain 54 6.0 Corporate social investment 64 7.0 Environment 718.0 Operation 999.0 Key data 2009 11310.0 Independent Assurance 13311.0 Global Reporting Initiative Index 2009 138
2.0 Nokia in 2009 7 Nokia organization in 2009 8
Page 9Nokia sustainability report2009
Navigation bar
Contents 21.0 CEO’s Message 3 2.0 Nokia in 2009 63.0 About the report 94.0 Employees 29 5.0 Supply chain 54 6.0 Corporate social investment 64 7.0 Environment 718.0 Operation 999.0 Key data 2009 11310.0 Independent Assurance 13311.0 Global Reporting Initiative Index 2009 138
3.0About the report
3.0About the report
3.1 Introduction to reporting principles 10 3.1.1 GRI 12 3.1.2 Global Compact 13 3.1.3 Sustainability governance 14 3.1.4 Regulatory Compliance 15 3.1.5 Sustainability opportunities and risks 163.2 Stakeholder Engagement 19 3.2.1 External Recognition and Awards 22 3.2.2 Accessibility 243.3 Health and safety of product use 253.4 Customer satisfaction 26 3.4.1 Trade customers 26 3.4.2 Operators 27 3.4.3 Consumers 273.5 Privacy and security 28
3.1Introduction to reporting principles
Nokia has published corporate responsibility reports since 2002 and we have reported our environmental activities continually since 1999. Sustainability means balancing economic, environmental and social priorities so that the needs of the present do not compromise the needs of the future. For Nokia this means taking environmental and social considerations into account in managing our operations, and developing mobile solutions that make a positive impact.
The report highlights our performance in the areas where business practices most affect society and the environment. It covers the key ethical, socio-economic and environmental areas we believe are most relevant to our business and our stakeholders.
By identifying the most relevant sustainability issues to our business we can prioritize our activities and so manage them most effectively. We identify these issues by:
•engagingwithstakeholderstoidentifytheissuesthataremostimportanttothem (see stakeholder engagement for more information)
•trackingpublicdebateandmediainterestinsustainabilityissues•assessingtheissues’materialityfromaNokiaandstakeholderpointofviewusingtheGlobalReporting
Initiative (GRI) guidelines as a basis and then adding issues that are relevant to Nokia and our industry (see our GRI index)
•assessingpotentialopportunitiesandrisksforourbusiness(seeopportunitiesandrisksformoreinformation)
This report covers Nokia group’s operations globally. However, Nokia Siemens Networks (NSN) – a company owned approximately 50 percent by each of Nokia and Siemens AG – is excluded unless otherwise indicated. NSN publishes its own detailed corporate responsibility report which can be found at www.nokiasiemensnetworks.com/about-us/corporate-responsibility/corporate-responsibility-report-2009. In addition to the Nokia and NSN reports, and our separate data tables, we have consolidated some key data from both companies in one data table which can be found from the Key Data section of this report.
Page 10Nokia sustainability report2009
3.1Introduction to reporting principles
3.0About the report
Navigation bar
Contents 21.0 CEO’s Message 3 2.0 Nokia in 2009 63.0 About the report 94.0 Employees 29 5.0 Supply chain 54 6.0 Corporate social investment 64 7.0 Environment 718.0 Operation 999.0 Key data 2009 11310.0 Independent Assurance 13311.0 Global Reporting Initiative Index 2009 138
3.1 Introduction to reporting principles 10 3.1.1 GRI 12 3.1.2 Global Compact 13 3.1.3 Sustainability governance 14 3.1.4 Regulatory Compliance 15 3.1.5 Sustainability opportunities and risks 163.2 Stakeholder Engagement 19 3.2.1 External Recognition and Awards 22 3.2.2 Accessibility 243.3 Health and safety of product use 253.4 Customer satisfaction 26 3.4.1 Trade customers 26 3.4.2 Operators 27 3.4.3 Consumers 273.5 Privacy and security 28
continued...
As corporate responsibility matters are not separate from other key corporate information, we have integrated key sustainability related data also to our annual report on Form 20-F for 2009, which has been filed with the United States Securities and Exchange Commission. Details on our financial performance are published in quarterly results releases, in our Form 20-F, and Nokia’s Annual Accounts, which are available at www.nokia.com/financials
This report is available online and will also be downloadable as a PDF. Our website also provides more day-to-day information about our activities.
Selected key corporate responsibility indicators in this report have been assured by an independent third party, PricewaterhouseCoopers Oy (Nokia’s statutory auditor). Their assurance statement can be foundon page 134.
For quick reference, we have listed below some other key sources of Nokia sustainability information:
•theNokiaForm20-F2009•thethirdpartyassurancereportbyPricewaterhouseCoopersOy•GlobalReportingInitiative(GRI)guidelineswithreferencestoNokia’ssustainabilityreporttoease
compatibility with other organizations •NokiaSiemensNetworks’corporateresponsibilityreport
We welcome your views on our activities and our performance. Please contact the Nokia sustainability team at [email protected].
Page 11Nokia sustainability report2009
3.1Introduction to reporting principles (continued)
3.0About the report
Navigation bar
Contents 21.0 CEO’s Message 3 2.0 Nokia in 2009 63.0 About the report 94.0 Employees 29 5.0 Supply chain 54 6.0 Corporate social investment 64 7.0 Environment 718.0 Operation 999.0 Key data 2009 11310.0 Independent Assurance 13311.0 Global Reporting Initiative Index 2009 138
3.1 Introduction to reporting principles 10 3.1.1 GRI 12 3.1.2 Global Compact 13 3.1.3 Sustainability governance 14 3.1.4 Regulatory Compliance 15 3.1.5 Sustainability opportunities and risks 163.2 Stakeholder Engagement 19 3.2.1 External Recognition and Awards 22 3.2.2 Accessibility 243.3 Health and safety of product use 253.4 Customer satisfaction 26 3.4.1 Trade customers 26 3.4.2 Operators 27 3.4.3 Consumers 273.5 Privacy and security 28
3.1.1GRI
The Global Reporting Initiative (GRI) is a network-based organization that has pioneered the development of the world’s most widely used sustainability reporting framework and is committed to its continuous improvement and application worldwide. In compiling the 2009 sustainability report, Nokia used the Global Reporting Initiatives (GRI) G3 Sustainability Reporting Guidelines. The GRI index in pages 138 – 158 shows how and where the GRI standard disclosures are addressed. We have disclosed all mandatory indicators as well as additional indicators relevant to Nokia.
A third-party GRI Application Level check conducted by a corporate responsibility specialist, Tofuture Oy has confirmed Nokia’s self-declaration that the Report meets the requirements for GRI’s Application Level A+.
Page 12Nokia sustainability report2009
3.1.1GRI
3.0About the report
Navigation bar
Contents 21.0 CEO’s Message 3 2.0 Nokia in 2009 63.0 About the report 94.0 Employees 29 5.0 Supply chain 54 6.0 Corporate social investment 64 7.0 Environment 718.0 Operation 999.0 Key data 2009 11310.0 Independent Assurance 13311.0 Global Reporting Initiative Index 2009 138
3.1 Introduction to reporting principles 10 3.1.1 GRI 12 3.1.2 Global Compact 13 3.1.3 Sustainability governance 14 3.1.4 Regulatory Compliance 15 3.1.5 Sustainability opportunities and risks 163.2 Stakeholder Engagement 19 3.2.1 External Recognition and Awards 22 3.2.2 Accessibility 243.3 Health and safety of product use 253.4 Customer satisfaction 26 3.4.1 Trade customers 26 3.4.2 Operators 27 3.4.3 Consumers 273.5 Privacy and security 28
3.1.2Global Compact
Nokia is committed to the principles of the United Nations Global Compact and has been a signatory and active member since The Global Compact’s inception. The Global Compact provides a framework of responsible business practices relating to labor, human rights, anti-corruption and environmental issues. The Global Compact is the world’s largest corporate citizenship initiative, with over 4,300 companies belonging to the network.
In our 2009 annual report on Form 20-F and in this corporate responsibility report, we have sought to review progress on our activities and programs that support the ten principles of the Compact in the area of human rights, labor standards, the environment, and working against corruption.
Global Compact – 10 principles:
Human rights•Businessesshouldsupportandrespecttheprotectionofinternationallyproclaimedhumanrights• Businessesshouldmakesurethattheyarenotcomplicitinhumanrightsabuses
Labor standards•Businessesshouldupholdthefreedomofassociationandtheeffectiverecognitionoftherighttocollective
bargaining •Businessesshouldupholdtheeliminationofallformsofforcedandcompulsorylabor•Businessesshouldupholdtheeffectiveabolitionofchildlabor•Businessesshouldupholdtheeliminationofdiscriminationinrespectofemploymentandoccupation
Environment•Businessesshouldsupportaprecautionaryapproachtoenvironmentalchallenges•Businessesshouldundertakeinitiativestopromotegreaterenvironmentalresponsibility•Businessesshouldencouragethedevelopmentanddiffusionofenvironmentallyfriendlytechnologies
Anti-corruption•Businessesshouldworkagainstcorruptioninallitsforms,includingextortionandbribery
Page 13Nokia sustainability report2009
3.1.2 Global Compact
3 .0About the report
Navigation bar
Contents 21.0 CEO’s Message 3 2.0 Nokia in 2009 63.0 About the report 94.0 Employees 29 5.0 Supply chain 54 6.0 Corporate social investment 64 7.0 Environment 718.0 Operation 999.0 Key data 2009 11310.0 Independent Assurance 13311.0 Global Reporting Initiative Index 2009 138
3.1 Introduction to reporting principles 10 3.1.1 GRI 12 3.1.2 Global Compact 13 3.1.3 Sustainability governance 14 3.1.4 Regulatory Compliance 15 3.1.5 Sustainability opportunities and risks 163.2 Stakeholder Engagement 19 3.2.1 External Recognition and Awards 22 3.2.2 Accessibility 243.3 Health and safety of product use 253.4 Customer satisfaction 26 3.4.1 Trade customers 26 3.4.2 Operators 27 3.4.3 Consumers 273.5 Privacy and security 28
3.1.3 Sustainability governance
All shareholders have the right to submit to the agenda items or proposals to the agenda of a general meeting, provided that the item or proposal belongs to the scope of the general meeting of the shareholders (AGM) and the request is made to the Board in writing well in advance to be included in the notice of the meeting. All the directors attended Nokia’s Annual General Meeting held on April 23, 2009. The Finnish Corporate Governance Code recommends attendance by the Board Chairman and a sufficient number of directors to allow the shareholders to exercise their right to present questions to the Board and management. In recent years our CEO has addressed sustainability issues in his AGM speech and sustainability related questions have also been discussed in AGM. During 2009 our Board of Directors reviewed sustainability and related topics in their meetings.
Nokia Group’s Executive Board approves sustainability activities and related Key Performance Indicators as part of our strategic planning process. Esko Aho, Executive Vice President, Corporate Relations and Responsibility, leads our sustainability activities at the Executive Board level. He oversees the work of the Corporate Responsibility Steering Group, which is responsible for supporting sustainability initiatives across the business and encouraging open communication and cooperation, both internally and externally. If needed major issues are escalated to the Executive Board.
The Corporate Responsibility Steering Group is made up of top managers of business units and corporate functions. It supports our corporate structures in helping to integrate sustainability into our core business, for instance, through approving the work of the Nokia Sustainability Management Team (NSMT). The NSMT represents all relevant Nokia units, develops and agrees the group-wide sustainability framework containing strategy, targets and priorities.
Our sustainability network acts as a virtual team across the organization and is led by Kirsi Sormunen,Vice President, Head of Sustainability Operations. Our sustainability teams drive sustainability initiatives within the business and monitor performance across our operations. Each of the key business functions have people responsible for building and implementing processes to achieve our environmental and social targets. Our sustainability framework provides guidelines on embedding sustainability strategy within our operational planning across the business.
Page 14Nokia sustainability report2009
3.1.3 Sustainability governance
3.0About the report
Navigation bar
Contents 21.0 CEO’s Message 3 2.0 Nokia in 2009 63.0 About the report 94.0 Employees 29 5.0 Supply chain 54 6.0 Corporate social investment 64 7.0 Environment 718.0 Operation 999.0 Key data 2009 11310.0 Independent Assurance 13311.0 Global Reporting Initiative Index 2009 138
3.1 Introduction to reporting principles 10 3.1.1 GRI 12 3.1.2 Global Compact 13 3.1.3 Sustainability governance 14 3.1.4 Regulatory Compliance 15 3.1.5 Sustainability opportunities and risks 163.2 Stakeholder Engagement 19 3.2.1 External Recognition and Awards 22 3.2.2 Accessibility 243.3 Health and safety of product use 253.4 Customer satisfaction 26 3.4.1 Trade customers 26 3.4.2 Operators 27 3.4.3 Consumers 273.5 Privacy and security 28
3.1.4 Regulatory Compliance
Nokia complies with the laws and regulations set by each market’s individual regulatory bodies. Typically, our requirements meet or go beyond the mandatory stipulations set by the applicable regulations and are rooted in our global standards and requirements. Against this baseline, it is not surprising that, for example, our environmental targets are set beyond regulatory compliance.
There were no significant fines or non-monetary sanctions for non-compliance with laws and regulations during 2009.
There were no legal actions against Nokia for anti-competitive behavior, anti-trust or monopoly practicesin 2009. Nokia does not contribute to political parties or politicians.
Page 15Nokia sustainability report2009
3.1.4 Regulatory Compliance
3.0About the report
Navigation bar
Contents 21.0 CEO’s Message 3 2.0 Nokia in 2009 63.0 About the report 94.0 Employees 29 5.0 Supply chain 54 6.0 Corporate social investment 64 7.0 Environment 718.0 Operation 999.0 Key data 2009 11310.0 Independent Assurance 13311.0 Global Reporting Initiative Index 2009 138
3.1 Introduction to reporting principles 10 3.1.1 GRI 12 3.1.2 Global Compact 13 3.1.3 Sustainability governance 14 3.1.4 Regulatory Compliance 15 3.1.5 Sustainability opportunities and risks 163.2 Stakeholder Engagement 19 3.2.1 External Recognition and Awards 22 3.2.2 Accessibility 243.3 Health and safety of product use 253.4 Customer satisfaction 26 3.4.1 Trade customers 26 3.4.2 Operators 27 3.4.3 Consumers 273.5 Privacy and security 28
3.1.5Sustainability opportunities and risks
OpportunitiesOur innovations hold the potential for changing the way we live, from improving livelihoods to embracing more sustainable lifestyles. More than a billion people use Nokia mobile devices, and we believe that even small changes can make a big difference, for example in the protection of our environment. Our vision is to further realise the potential of mobility by extending access to mobile communications.
Sustainability is part of our business strategy and we systematically analyze sustainability related opportunities. In this report we present a wide range of examples where our work is enhancing accessibility, education delivery, data gathering, materials and substances, and the energy efficiency of products, as well as of various environmental services we offer customers through mobile devices. We also cover our improvements in our own operations such as packaging, logistics and supply chain and our ways of working. Nokia Siemens Networks’ corporate responsibility report has more examples of how mobile technology can make a difference.
One widely discussed topic is the role of information and communications technology (ICT) in the fight against climate change. There is good evidence that ICT makes a major contribution to GDP growth while also helping to reduce energy use in various industries, slowing down global warming. ICT-based services and working methods such as remote working and video conferencing can result in lower overall CO2 emissions. In addition, the environmental gains from substituting a service for hard product, also known as dematerialization, can be significant. Convergence, or incorporating the functionalities of several products into one, can further contribute to dematerialization and energy efficiency.
As well as exploring direct business opportunities, we have started research to help us better understand and make the most of the impacts of mobility. There is plenty of macroeconomic data, anecdotal evidence and common sense to suggest that mobility benefits societies in many ways. Mobility also has benefits that are over and above the generic benefits of ICT. Yet the full consequences of mobility are yet to be discovered. Political, social and business processes, for instance, are rapidly changing because of the increased mobility of communication. When 4.5 billion people use mobile phones every day, the sheer magnitude of this phenomenon must profoundly change the fabric of society.
Page 16Nokia sustainability report2009
3.1.5Sustainability opportunitiesand risks
3.0About the report
Navigation bar
Contents 21.0 CEO’s Message 3 2.0 Nokia in 2009 63.0 About the report 94.0 Employees 29 5.0 Supply chain 54 6.0 Corporate social investment 64 7.0 Environment 718.0 Operation 999.0 Key data 2009 11310.0 Independent Assurance 13311.0 Global Reporting Initiative Index 2009 138
3.1 Introduction to reporting principles 10 3.1.1 GRI 12 3.1.2 Global Compact 13 3.1.3 Sustainability governance 14 3.1.4 Regulatory Compliance 15 3.1.5 Sustainability opportunities and risks 163.2 Stakeholder Engagement 19 3.2.1 External Recognition and Awards 22 3.2.2 Accessibility 243.3 Health and safety of product use 253.4 Customer satisfaction 26 3.4.1 Trade customers 26 3.4.2 Operators 27 3.4.3 Consumers 273.5 Privacy and security 28
continued...
Emerging market ServicesDuring 2009 we launched several services that hold potential for livelihood improvements for the people in the emerging markets.
Nokia MoneyIn Global financial services initiative in partnership with YES BANK, we have started a commercial pilot of the global mobile financial services initiative in Pune, one of the largest metropolitan areas in India. The service in Pune, called Mobile Money Services by YES BANK, brings financial services to the consumers’ mobile devices.
The Nokia Money initiative based on Obopay’s platform is initially targeted at growth markets and designed to work in partnership with multiple network operators and banks, involving distributors and merchants in a dynamic open ecosystem to seamlessly provide the new services. In the initial phase: consumers will be able to transfer money to another person just by using the person’s mobile phone number, pay utility bills as well as recharge their prepaid SIM cards (SIM top-up). Later on, the consumers will also be able to pay merchants for goods and services.
Nokia Life Tools Nokia Life Tools provides consumers in rural and sub-urban communities with livelihood and life improvement services, including healthcare, agriculture and education services. Subscribers primarily depend on the agriculture trade and live around the poverty threshold - which makes parting with one or two dollars each month for a mobile service a substantial investment. Since its commercial launch in mid-2009, more than 1.5 million people have already used the service. Nokia Life Tools is available currently in India, Indonesia and China, and is planned to roll out to more markets in the future.
Ovi MailThere are roughly 4 billion people mostly in developing countries without access to a PC, and Ovi Mail offers them a digital identity. Ovi Mail is an email account specifically designed for on-device account creation, so people can get their first email address and create and manage their accounts – no PC needed. With over 8 million accounts activated in just over one year, Ovi Mail has established itself as the email account for the developing world. Ovi Mail supports over 25 languages, and the email account can be accessed on almost 200 Nokia devices, in virtually every country in the world.
Page 17Nokia sustainability report2009
3.1.5Sustainability opportunitiesand risks (continued)
3.0About the report
Navigation bar
Contents 21.0 CEO’s Message 3 2.0 Nokia in 2009 63.0 About the report 94.0 Employees 29 5.0 Supply chain 54 6.0 Corporate social investment 64 7.0 Environment 718.0 Operation 999.0 Key data 2009 11310.0 Independent Assurance 13311.0 Global Reporting Initiative Index 2009 138
3.1 Introduction to reporting principles 10 3.1.1 GRI 12 3.1.2 Global Compact 13 3.1.3 Sustainability governance 14 3.1.4 Regulatory Compliance 15 3.1.5 Sustainability opportunities and risks 163.2 Stakeholder Engagement 19 3.2.1 External Recognition and Awards 22 3.2.2 Accessibility 243.3 Health and safety of product use 253.4 Customer satisfaction 26 3.4.1 Trade customers 26 3.4.2 Operators 27 3.4.3 Consumers 273.5 Privacy and security 28
continued...
RisksOur overall risk management concept is based on visibility of the key risks preventing us from reaching our business objectives. This covers all risk areas: strategic, operational, financial and hazard risks. Political, social, human rights, and environmental risks are considered within these categories of risk, rather than as a separate strand.
The principles set out in our Risk Policy and accepted by the Board’s Audit Committee, require risk management and its elements to be integrated into business processes. One of the main principles is that the business, function or category owner, rather than risk specialists, is also the risk owner. However, it is everyone’s responsibility at Nokia to identify risks. Risk analysis covers both probability and impact of the risks as well as the ways of mitigating the risks. In the area of corporate responsibility, we follow the precautionary principle, especially in the areas involving environmental risks.
Sustainability-related risks in areas such as products, supply chain and climate change are all analyzed with our risk management process. Related activities are monitored at least twice a year by our sustainability management team and escalated further if necessary.
The most material risk factors as well as the principal factors and trends affecting our results of operations are discussed in our annual report on Form 20-F, which is publicly available.
Page 18Nokia sustainability report2009
3.1.5Sustainability opportunitiesand risks (continued)
3.0About the report
Navigation bar
Contents 21.0 CEO’s Message 3 2.0 Nokia in 2009 63.0 About the report 94.0 Employees 29 5.0 Supply chain 54 6.0 Corporate social investment 64 7.0 Environment 718.0 Operation 999.0 Key data 2009 11310.0 Independent Assurance 13311.0 Global Reporting Initiative Index 2009 138
3.1 Introduction to reporting principles 10 3.1.1 GRI 12 3.1.2 Global Compact 13 3.1.3 Sustainability governance 14 3.1.4 Regulatory Compliance 15 3.1.5 Sustainability opportunities and risks 163.2 Stakeholder Engagement 19 3.2.1 External Recognition and Awards 22 3.2.2 Accessibility 243.3 Health and safety of product use 253.4 Customer satisfaction 26 3.4.1 Trade customers 26 3.4.2 Operators 27 3.4.3 Consumers 273.5 Privacy and security 28
3.2Stakeholder Engagement
We pride ourselves in our straightforward and open handling of relationships, which we characterize as the Nokia Way which in turn defines our four key values. From this perspective we recognize that understanding what stakeholders expect from us as a company is just as important as understanding our customers’ expectations of our products. Listening to employees and external parties and translating their expectations into business value is an important Nokia process.
We consider our most important stakeholder groups are employees, customers, and our shareholders. We also cherish and rely on good relationships with our supply chain and sector partners, governments, NGOs and the wider community. Much of this engagement takes place as part of normal business practice. We cover specific stakeholder activities that occurred in 2009 in relevant parts of this report. Dialogue with our external and internal stakeholders improves our understanding of how our activities are perceived, helps us evaluate stakeholder satisfaction, strengthens our social investment programs, and allows us to identify important issues to address.
In this report we show how we live our values in relation with our stakeholders. Our ‘Engaging you’ value defines what we stand for in the world and predisposes our business approach to be transparent and stakeholder focussed. Coupled with our ‘Achieving together’ value, which point us towards trusting and collaborative business approaches, our many case studies demonstrate how important stakeholder relationships truly are to us.
The feedback from stakeholder engagement activities and our success in various external recognition arenas (see our Recognition and Awards section) indicates that our stakeholders believe we have made progress in many areas of sustainability. In the future, our stakeholders are looking to us to provide more data and metrics to support our sustainability activities, such as in reporting emissions, and increasing the number of recycled devices. We are also expected to anticipate trends and continue to play a leading role in addressing emerging sustainability issues such as biodiversity and environmental impact of the whole supply chain.
Page 19Nokia sustainability report2009
3.2Stakeholder Engagement
3.0About the report
Navigation bar
Contents 21.0 CEO’s Message 3 2.0 Nokia in 2009 63.0 About the report 94.0 Employees 29 5.0 Supply chain 54 6.0 Corporate social investment 64 7.0 Environment 718.0 Operation 999.0 Key data 2009 11310.0 Independent Assurance 13311.0 Global Reporting Initiative Index 2009 138
3.1 Introduction to reporting principles 10 3.1.1 GRI 12 3.1.2 Global Compact 13 3.1.3 Sustainability governance 14 3.1.4 Regulatory Compliance 15 3.1.5 Sustainability opportunities and risks 163.2 Stakeholder Engagement 19 3.2.1 External Recognition and Awards 22 3.2.2 Accessibility 243.3 Health and safety of product use 253.4 Customer satisfaction 26 3.4.1 Trade customers 26 3.4.2 Operators 27 3.4.3 Consumers 273.5 Privacy and security 28
continued...
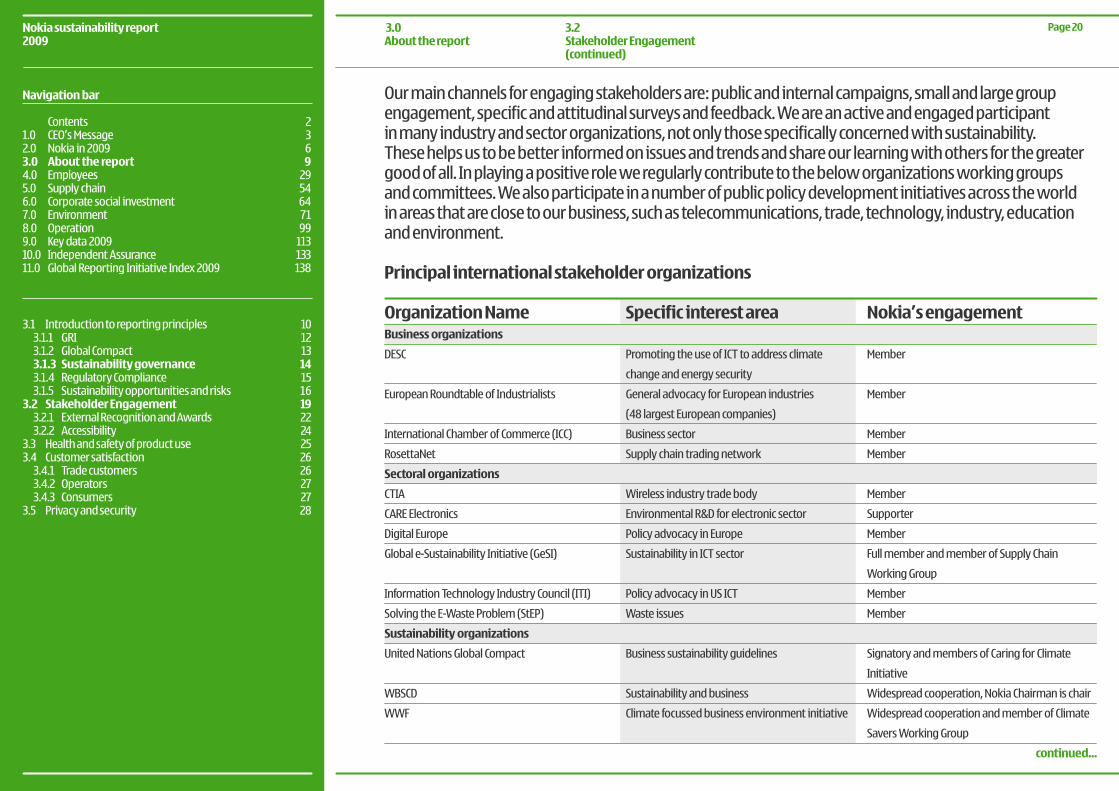
Our main channels for engaging stakeholders are: public and internal campaigns, small and large group engagement, specific and attitudinal surveys and feedback. We are an active and engaged participant in many industry and sector organizations, not only those specifically concerned with sustainability. These helps us to be better informed on issues and trends and share our learning with others for the greater good of all. In playing a positive role we regularly contribute to the below organizations working groups and committees. We also participate in a number of public policy development initiatives across the world in areas that are close to our business, such as telecommunications, trade, technology, industry, education and environment.
Principal international stakeholder organizations
Specific interest area
Promoting the use of ICT to address climate
change and energy security
General advocacy for European industries
(48 largest European companies)
Business sector
Supply chain trading network
Wireless industry trade body
Environmental R&D for electronic sector
Policy advocacy in Europe
Sustainability in ICT sector
Policy advocacy in US ICT
Waste issues
Business sustainability guidelines
Sustainability and business
Climate focussed business environment initiative
Nokia’s engagement
Member
Member
Member
Member
Member
Supporter
Member
Full member and member of Supply Chain
Working Group
Member
Member
Signatory and members of Caring for Climate
Initiative
Widespread cooperation, Nokia Chairman is chair
Widespread cooperation and member of Climate
Savers Working Group
Organization NameBusiness organizations
DESC
European Roundtable of Industrialists
International Chamber of Commerce (ICC)
RosettaNet
Sectoral organizations
CTIA
CARE Electronics
Digital Europe
Global e-Sustainability Initiative (GeSI)
Information Technology Industry Council (ITI)
Solving the E-Waste Problem (StEP)
Sustainability organizations
United Nations Global Compact
WBSCD
WWF
Page 20Nokia sustainability report2009
3.2Stakeholder Engagement (continued)
3.0About the report
Navigation bar
Contents 21.0 CEO’s Message 3 2.0 Nokia in 2009 63.0 About the report 94.0 Employees 29 5.0 Supply chain 54 6.0 Corporate social investment 64 7.0 Environment 718.0 Operation 999.0 Key data 2009 11310.0 Independent Assurance 13311.0 Global Reporting Initiative Index 2009 138
3.1 Introduction to reporting principles 10 3.1.1 GRI 12 3.1.2 Global Compact 13 3.1.3 Sustainability governance 14 3.1.4 Regulatory Compliance 15 3.1.5 Sustainability opportunities and risks 163.2 Stakeholder Engagement 19 3.2.1 External Recognition and Awards 22 3.2.2 Accessibility 243.3 Health and safety of product use 253.4 Customer satisfaction 26 3.4.1 Trade customers 26 3.4.2 Operators 27 3.4.3 Consumers 273.5 Privacy and security 28
continued...

We constantly strive to activate new channels concerning the ways in which we meet our existing expectations, while at the same time we continue to identify new trends down the road. This window into the future is an important part of our ongoing success as it allows us to understand where systematic improvements can be made.
During 2009, Nokia received some funding from governmental organizations e.g. research and development financing from Tekes, the Finnish Funding Agency for Technology and Innovation (Finland).
Page 21Nokia sustainability report2009
3.2Stakeholder Engagement (continued)
3.0About the report
Navigation bar
Contents 21.0 CEO’s Message 3 2.0 Nokia in 2009 63.0 About the report 94.0 Employees 29 5.0 Supply chain 54 6.0 Corporate social investment 64 7.0 Environment 718.0 Operation 999.0 Key data 2009 11310.0 Independent Assurance 13311.0 Global Reporting Initiative Index 2009 138
3.1 Introduction to reporting principles 10 3.1.1 GRI 12 3.1.2 Global Compact 13 3.1.3 Sustainability governance 14 3.1.4 Regulatory Compliance 15 3.1.5 Sustainability opportunities and risks 163.2 Stakeholder Engagement 19 3.2.1 External Recognition and Awards 22 3.2.2 Accessibility 243.3 Health and safety of product use 253.4 Customer satisfaction 26 3.4.1 Trade customers 26 3.4.2 Operators 27 3.4.3 Consumers 273.5 Privacy and security 28
3.2.1External Recognition and Awards
During year 2009 our extensive work in sustainability was recognized in several forums.
Nokia’s long-standing commitment to environmental action was recognized at the Mobile World Congress in Barcelona in February 2009 where the company received the GSMA’s first CEO Award for Outstanding Environmental Contribution. The Environmental Award was given to our CEO, Olli-Pekka Kallasvuo. The award is designed to recognize outstanding environmental performance through innovative, sustainable business practices on a significant scale. It honours personal or organization–wide achievement in the area of environmental responsibility, notably tangible progress by organizations within the mobile industry and the innovative use of the mobile platform to tackle climate change challenges on a global basis. This discretionary award is a personal honour for the recipient who is chosen solely by GSMA’s CEO. Nokia’s global environmental program was chosen as the best in the industry due to its global scale and commitment.
Nokia is the world’s most sustainable technology company according to the 2009-10 edition of the prestigious Dow Jones Sustainability Indexes. Already rated for several years as the leader within the Europe and Communications categories, this year Nokia was also chosen as “World Technology Supersector Leader” making it number one across the entire global technology sector. The Dow Jones Indexes are globally respected rankings of how well the world’s leading corporations are integrating sustainability into their businesses. Selecting components from 2,500 companies in over 50 countries, the indexes are relied upon by leading institutional investors.
In August Nokia India was awarded double accolades during the V&D 100 Awards, which is the most comprehensive annual survey of the Indian telecom services and equipment industries. Nokia was chosen as the Top Mobile Handset Company of the year as well as the Green Company of the Year. The V&D 100 ranking is the most trusted and widely used survey for those seeking statistics on Indian telecommunications. The 2008-2009 Indian Telecom Industry survey covered over 650 equipment and services companies. For the last six consecutive years Nokia India has been winning the No 1 Telecom and Equipment vendor but what makes the award special this year is the recognition for its take back campaign.
Page 22Nokia sustainability report2009
3.2.1External Recognition and Awards
3.0About the report
Navigation bar
Contents 21.0 CEO’s Message 3 2.0 Nokia in 2009 63.0 About the report 94.0 Employees 29 5.0 Supply chain 54 6.0 Corporate social investment 64 7.0 Environment 718.0 Operation 999.0 Key data 2009 11310.0 Independent Assurance 13311.0 Global Reporting Initiative Index 2009 138
3.1 Introduction to reporting principles 10 3.1.1 GRI 12 3.1.2 Global Compact 13 3.1.3 Sustainability governance 14 3.1.4 Regulatory Compliance 15 3.1.5 Sustainability opportunities and risks 163.2 Stakeholder Engagement 19 3.2.1 External Recognition and Awards 22 3.2.2 Accessibility 243.3 Health and safety of product use 253.4 Customer satisfaction 26 3.4.1 Trade customers 26 3.4.2 Operators 27 3.4.3 Consumers 273.5 Privacy and security 28
continued...
Nokia was one of the companies included in the group of 12 best performing companies in Carbon Disclosure Project performance rating which assesses actions taken by 500 major multinationals to respond to, and reduce their contribution to, climate change. Nokia was also one of the six disclosure score leaders in Carbon Disclosure Project with fifth highest scores among 111 information technology companies.
Nokia was also included in the FSTE4Good index.
During 2009 Nokia came top in every time in Greenpeace’s quarterly greener electronics ranking.
Page 23Nokia sustainability report2009
3.2.1External Recognition and Awards (continued)
3.0About the report
Navigation bar
Contents 21.0 CEO’s Message 3 2.0 Nokia in 2009 63.0 About the report 94.0 Employees 29 5.0 Supply chain 54 6.0 Corporate social investment 64 7.0 Environment 718.0 Operation 999.0 Key data 2009 11310.0 Independent Assurance 13311.0 Global Reporting Initiative Index 2009 138
3.1 Introduction to reporting principles 10 3.1.1 GRI 12 3.1.2 Global Compact 13 3.1.3 Sustainability governance 14 3.1.4 Regulatory Compliance 15 3.1.5 Sustainability opportunities and risks 163.2 Stakeholder Engagement 19 3.2.1 External Recognition and Awards 22 3.2.2 Accessibility 243.3 Health and safety of product use 253.4 Customer satisfaction 26 3.4.1 Trade customers 26 3.4.2 Operators 27 3.4.3 Consumers 273.5 Privacy and security 28
3.2.2Accessibility
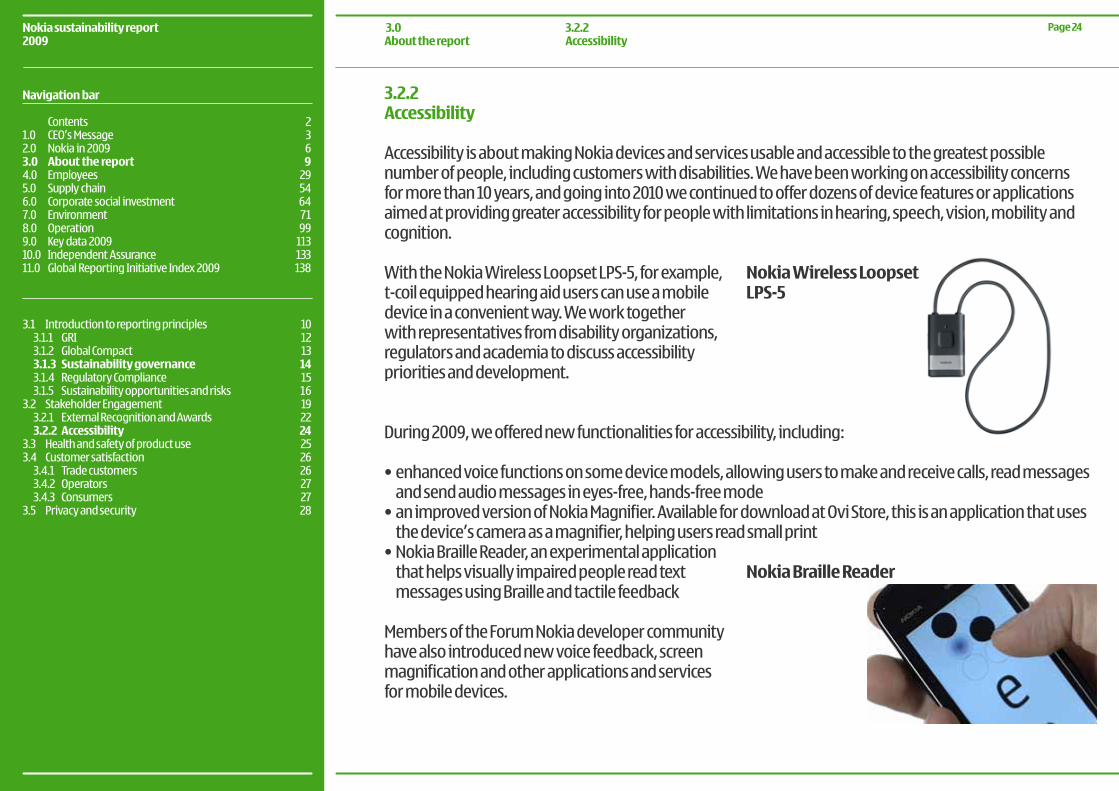
Accessibility is about making Nokia devices and services usable and accessible to the greatest possible number of people, including customers with disabilities. We have been working on accessibility concerns for more than 10 years, and going into 2010 we continued to offer dozens of device features or applications aimed at providing greater accessibility for people with limitations in hearing, speech, vision, mobility and cognition.
During 2009, we offered new functionalities for accessibility, including:
•enhancedvoicefunctionsonsomedevicemodels,allowinguserstomakeandreceivecalls,readmessagesand send audio messages in eyes-free, hands-free mode
•animprovedversionofNokiaMagnifier.AvailablefordownloadatOviStore,thisisanapplicationthatusesthe device’s camera as a magnifier, helping users read small print
•NokiaBrailleReader,anexperimentalapplication that helps visually impaired people read text messages using Braille and tactile feedback
Members of the Forum Nokia developer community have also introduced new voice feedback, screen magnification and other applications and services for mobile devices.
Nokia Wireless LoopsetLPS-5
With the Nokia Wireless Loopset LPS-5, for example, t-coil equipped hearing aid users can use a mobile device in a convenient way. We work together with representatives from disability organizations, regulators and academia to discuss accessibility priorities and development.
Nokia Braille Reader
Page 24Nokia sustainability report2009
3.2.2Accessibility
3.0About the report
Navigation bar
Contents 21.0 CEO’s Message 3 2.0 Nokia in 2009 63.0 About the report 94.0 Employees 29 5.0 Supply chain 54 6.0 Corporate social investment 64 7.0 Environment 718.0 Operation 999.0 Key data 2009 11310.0 Independent Assurance 13311.0 Global Reporting Initiative Index 2009 138
3.1 Introduction to reporting principles 10 3.1.1 GRI 12 3.1.2 Global Compact 13 3.1.3 Sustainability governance 14 3.1.4 Regulatory Compliance 15 3.1.5 Sustainability opportunities and risks 163.2 Stakeholder Engagement 19 3.2.1 External Recognition and Awards 22 3.2.2 Accessibility 243.3 Health and safety of product use 253.4 Customer satisfaction 26 3.4.1 Trade customers 26 3.4.2 Operators 27 3.4.3 Consumers 273.5 Privacy and security 28
3.3Health and safety of product use
Electromagnetic fieldsAll Nokia products, including mobile devices and base stations, operate below relevant international exposure guidelines and the limits that are set by public health authorities, such as the International Commission on Non-Ionizing Protection (ICNIRP). Nokia is committed to making information, such as device Specific Absorption Rate (SAR) values, available for consumers. Our website, www.nokia.com/emf, has more information and links to other sources.
Nokia is also a member of Mobile Manufacturers Forum (MMF), an international association of telecommunications equipment manufacturers with an interest in mobile and wireless communications. The MMF was formed in 1998 to facilitate joint funding of key research projects and cooperation on standards, regulatory issues and communications concerning the safety of wireless technology, accessibility and environmental issues. More information about MMF activities can be found at www.mmfai.org/public
Page 25Nokia sustainability report2009
3.3Health and safety of product use
3.0About the report
Navigation bar
Contents 21.0 CEO’s Message 3 2.0 Nokia in 2009 63.0 About the report 94.0 Employees 29 5.0 Supply chain 54 6.0 Corporate social investment 64 7.0 Environment 718.0 Operation 999.0 Key data 2009 11310.0 Independent Assurance 13311.0 Global Reporting Initiative Index 2009 138
3.1 Introduction to reporting principles 10 3.1.1 GRI 12 3.1.2 Global Compact 13 3.1.3 Sustainability governance 14 3.1.4 Regulatory Compliance 15 3.1.5 Sustainability opportunities and risks 163.2 Stakeholder Engagement 19 3.2.1 External Recognition and Awards 22 3.2.2 Accessibility 243.3 Health and safety of product use 253.4 Customer satisfaction 26 3.4.1 Trade customers 26 3.4.2 Operators 27 3.4.3 Consumers 273.5 Privacy and security 28
3.4Customer satisfaction
Nokia aims to provide products and services that meet the needs of trade customers and consumers. We research the views of both groups to understand where we are succeeding and how we can do better.
3.4.1Trade customers
We research trade customers’ views on Nokia through the Listening to Trade customer survey. An independent research company carries out the survey every year. It reaches executive and operational contacts in a sample of customers that accounts for around 80 percent of Nokia’s revenue each year. In 2009, about 500 contacts from 200 customer companies in 70 countries took part. The responses showed satisfaction with Nokia had remained very high, although marginally declined. Comparison with others in our industry placed us strongly ahead of traditional telecoms competitors and marginally ahead of other more recent competitors.
The research revealed that the following Nokia strengths drive customer satisfaction:
•durabilityanddiversityofproductrangetomeetlocalneeds•easeofuseofproducts•relationshipswithouraccountteams•high-performinglogisticsservices
We use the consolidated feedback to understand where we can make systematic improvements.
Our account managers discuss initial survey results with their teams and prepare actions relevant to individual accounts. We inform customers of the key local actions planned for their account and send them a response letter highlighting the survey’s overall findings and the key improvements. We welcome customer feedback on our plans.
Page 26Nokia sustainability report2009
3.4Customer satisfaction
3.4.1Trade customers
3.0About the report
Navigation bar
Contents 21.0 CEO’s Message 3 2.0 Nokia in 2009 63.0 About the report 94.0 Employees 29 5.0 Supply chain 54 6.0 Corporate social investment 64 7.0 Environment 718.0 Operation 999.0 Key data 2009 11310.0 Independent Assurance 13311.0 Global Reporting Initiative Index 2009 138
3.1 Introduction to reporting principles 10 3.1.1 GRI 12 3.1.2 Global Compact 13 3.1.3 Sustainability governance 14 3.1.4 Regulatory Compliance 15 3.1.5 Sustainability opportunities and risks 163.2 Stakeholder Engagement 19 3.2.1 External Recognition and Awards 22 3.2.2 Accessibility 243.3 Health and safety of product use 253.4 Customer satisfaction 26 3.4.1 Trade customers 26 3.4.2 Operators 27 3.4.3 Consumers 273.5 Privacy and security 28
3.4.2Operators
Nokia continues to receive enquiries and assessment requests about social and environmental performance from our operator customers. We respond to those requests through our normal customer account management interface.
3.4.3 Consumers
Nokia Care provides support services to consumers through online, email and call centre services, supported by a network of authorized service centers. The support includes basic product information, guides and demonstrations, discussion boards, software updates, advice on specific issues, and warranty repairs. It also helps consumers to find out where to recycle their old products.
We aim to get a wide picture of consumer experience by using different consumer feedback channels and respond with targeted improvement actions. The main feedback channels include consumer satisfaction surveys, feedback through independent market research companies and Nokia Care contacts.
Page 27Nokia sustainability report2009
3.4.2Operators
3.4.3 Consumer
3.0About the report
Navigation bar
Contents 21.0 CEO’s Message 3 2.0 Nokia in 2009 63.0 About the report 94.0 Employees 29 5.0 Supply chain 54 6.0 Corporate social investment 64 7.0 Environment 718.0 Operation 999.0 Key data 2009 11310.0 Independent Assurance 13311.0 Global Reporting Initiative Index 2009 138
3.1 Introduction to reporting principles 10 3.1.1 GRI 12 3.1.2 Global Compact 13 3.1.3 Sustainability governance 14 3.1.4 Regulatory Compliance 15 3.1.5 Sustainability opportunities and risks 163.2 Stakeholder Engagement 19 3.2.1 External Recognition and Awards 22 3.2.2 Accessibility 243.3 Health and safety of product use 253.4 Customer satisfaction 26 3.4.1 Trade customers 26 3.4.2 Operators 27 3.4.3 Consumers 273.5 Privacy and security 28
3.5Privacy and security
Respect for privacy is part of our commitment to observing high standards of integrity and ethical conduct in all our operations. We aim to adhere to strict privacy standards when we store or process personal data, and when we develop new products and services.
User privacy has become more important for Nokia as we have developed new services to take advantage of the convergence of internet and mobile technologies. Our goal is to develop services users want in ways that ensure their privacy, minimize the amount of sensitive information that is handled and, when sensitive information is shared, that it is treated appropriately.
Personal dataWe aim to store and process personal data (including photographs and voice recordings) in ways that protect people’s private lives by:
•informingusersclearlyonprivacyanddataissuesandthechoicesopentothem•gettingtheconsentofthedatasubjectinadvance•collectingandkeepingonlyrelevantdata•ensuringappropriatesecurityoffiles•takingspecialcarewhentransferringdatatothirdpartiesoracrossborders•respectingtherighttooptoutofhavingpersonaldatausedinmarketingcommunications• whereapplicable,complyingwiththelegalrequirementsofsomecountriesforindividualconsenttothe
use of personal data in unsolicited communications
Page 28Nokia sustainability report2009
3.0About the report
3.5Privacy and security
Navigation bar
Contents 21.0 CEO’s Message 3 2.0 Nokia in 2009 63.0 About the report 94.0 Employees 29 5.0 Supply chain 54 6.0 Corporate social investment 64 7.0 Environment 718.0 Operation 999.0 Key data 2009 11310.0 Independent Assurance 13311.0 Global Reporting Initiative Index 2009 138
3.1 Introduction to reporting principles 10 3.1.1 GRI 12 3.1.2 Global Compact 13 3.1.3 Sustainability governance 14 3.1.4 Regulatory Compliance 15 3.1.5 Sustainability opportunities and risks 163.2 Stakeholder Engagement 19 3.2.1 External Recognition and Awards 22 3.2.2 Accessibility 243.3 Health and safety of product use 253.4 Customer satisfaction 26 3.4.1 Trade customers 26 3.4.2 Operators 27 3.4.3 Consumers 273.5 Privacy and security 28
Page 29Nokia sustainability report2009
Navigation bar
Contents 21.0 CEO’s Message 3 2.0 Nokia in 2009 63.0 About the report 94.0 Employees 29 5.0 Supply chain 54 6.0 Corporate social investment 64 7.0 Environment 718.0 Operation 999.0 Key data 2009 11310.0 Independent Assurance 13311.0 Global Reporting Initiative Index 2009 138
4.0 Employees
4.1 Employment practices 30 4.1.1 Consultation and communication 30 4.1.2 Employee forums and collective bargaining 31 4.1.3 Employee survey 324.2 Nokia Way 33 4.2.1 The Nokia Way and Values 33 4.2.2 Defining our values 34 4.2.3 Labor practices and employment guidelines 35 4.2.4 Labor conditions standard 36 4.2.5 External temporary labor in production 37 4.2.6 Factory assessments 38 4.2.7 Employment breakdown 394.3 Diversity 404.4 Talent development 42 4.4.1 Education policy 42 4.4.2 Training and development 434.5 Performance management 44 4.5.1 Performance evaluation 44 4.5.2 Leadership 454.6 Performance-based rewarding 46 4.6.1 Incentives 474.7 Reorganization and restructuring 484.8 Health, safety and wellbeing 49 4.8.1 Management practices 49 4.8.2 Health and safety performance 50 4.8.3 Employee wellbeing 514.9 Working together, making a difference 524.10 Code of Conduct 53
4.1Employment practices
Our success depends on the talent and commitment of all of our employees. We strive to create an inclusive workplace that welcomes men and women of different cultural or ethnic backgrounds, skills and abilities, lifestyles, generations and perspectives. We provide excellent opportunities for career development, and are strongly committed to the highest standards of ethical conduct towards everyone who works with us. This has helped us to build the diverse and robust community that is Nokia today.
4.1.1Consultation and communication
Employees are a vital stakeholder group. We value their feedback on how we run our business. It is equally important that we keep them informed and consult them about changes that affect them.
Page 30Nokia sustainability report2009
4.1Employment practices
4.1.1Consultation and communication
4.0Employees
Navigation bar
Contents 21.0 CEO’s Message 3 2.0 Nokia in 2009 63.0 About the report 94.0 Employees 29 5.0 Supply chain 54 6.0 Corporate social investment 64 7.0 Environment 718.0 Operation 999.0 Key data 2009 11310.0 Independent Assurance 13311.0 Global Reporting Initiative Index 2009 138
4.1 Employment practices 30 4.1.1 Consultation and communication 30 4.1.2 Employee forums and collective bargaining 31 4.1.3 Employee survey 324.2 Nokia Way 33 4.2.1 The Nokia Way and Values 33 4.2.2 Defining our values 34 4.2.3 Labor practices and employment guidelines 35 4.2.4 Labor conditions standard 36 4.2.5 External temporary labor in production 37 4.2.6 Factory assessments 38 4.2.7 Employment breakdown 394.3 Diversity 404.4 Talent development 42 4.4.1 Education policy 42 4.4.2 Training and development 434.5 Performance management 44 4.5.1 Performance evaluation 44 4.5.2 Leadership 454.6 Performance-based rewarding 46 4.6.1 Incentives 474.7 Reorganization and restructuring 484.8 Health, safety and wellbeing 49 4.8.1 Management practices 49 4.8.2 Health and safety performance 50 4.8.3 Employee wellbeing 514.9 Working together, making a difference 524.10 Code of Conduct 53
4.1.2Employee forums and collective bargaining
Nokia recognizes the right of employees to join unions and enter collective bargaining agreements. Almost all of our manufacturing facilities have collective agreements in place with one or more labor union, however practicalities vary according to country laws and practices. Employees in our largest factory in India are in the progress of organizing themselves and negotiating. A collective agreement will start immediately once thisis complete.
In Finland, legislation stipulates issues on which employees or employee representatives must be informed or consulted. To fulfil the specifics of the legislation we operate several different employee representative bodies. The Nokia EuroForum aims to strengthen dialogue with European employees. Employee representatives typically meet with management twice a year through the Forum to discuss business issues affecting employees. For example, in the meeting on May 6 and 7, 2009 there were 27 employee representatives from eight different countries, including two countries new to the Forum: Romania and Norway. In this meeting, the discussion centered on Nokia’s strategy and business updates as wellas employee engagement and wellbeing.
Page 31Nokia sustainability report2009
4.1.2Employee forums and collective bargaining
4.0Employees
Navigation bar
Contents 21.0 CEO’s Message 3 2.0 Nokia in 2009 63.0 About the report 94.0 Employees 29 5.0 Supply chain 54 6.0 Corporate social investment 64 7.0 Environment 718.0 Operation 999.0 Key data 2009 11310.0 Independent Assurance 13311.0 Global Reporting Initiative Index 2009 138
4.1 Employment practices 30 4.1.1 Consultation and communication 30 4.1.2 Employee forums and collective bargaining 31 4.1.3 Employee survey 324.2 Nokia Way 33 4.2.1 The Nokia Way and Values 33 4.2.2 Defining our values 34 4.2.3 Labor practices and employment guidelines 35 4.2.4 Labor conditions standard 36 4.2.5 External temporary labor in production 37 4.2.6 Factory assessments 38 4.2.7 Employment breakdown 394.3 Diversity 404.4 Talent development 42 4.4.1 Education policy 42 4.4.2 Training and development 434.5 Performance management 44 4.5.1 Performance evaluation 44 4.5.2 Leadership 454.6 Performance-based rewarding 46 4.6.1 Incentives 474.7 Reorganization and restructuring 484.8 Health, safety and wellbeing 49 4.8.1 Management practices 49 4.8.2 Health and safety performance 50 4.8.3 Employee wellbeing 514.9 Working together, making a difference 524.10 Code of Conduct 53
4.1.3Employee survey
In 2009, 88 percent of our employees in more than 50 countries participated in Listening to You, our annual employee survey. This was our highest ever survey response (85 percent in 2008). The results showed that employees are generally enthusiastic and engaged in the company.
Of the respondents, 68 percent said they are proud to work for Nokia. Some 79 percent of employees see a clear link between their work and Nokia’s objectives, and 66 percent enjoy their day-to-day tasks. Around 58 percent of employees surveyed say that Nokia’s corporate responsibility activities have increased their overall employment satisfaction. The survey provides feedback from our employees on a range of important issues. We use this feedback when designing our people policies and practices. This report includes a selection of employee responses to questions about specific CR issues, such as inclusion and development opportunities.
Employees can also ask questions about our business, anonymously if they wish, through the company intranet and receive a prompt and openly published response.
Page 32Nokia sustainability report2009
4.1.3Employee survey
4.0Employees
Navigation bar
Contents 21.0 CEO’s Message 3 2.0 Nokia in 2009 63.0 About the report 94.0 Employees 29 5.0 Supply chain 54 6.0 Corporate social investment 64 7.0 Environment 718.0 Operation 999.0 Key data 2009 11310.0 Independent Assurance 13311.0 Global Reporting Initiative Index 2009 138
4.1 Employment practices 30 4.1.1 Consultation and communication 30 4.1.2 Employee forums and collective bargaining 31 4.1.3 Employee survey 324.2 Nokia Way 33 4.2.1 The Nokia Way and Values 33 4.2.2 Defining our values 34 4.2.3 Labor practices and employment guidelines 35 4.2.4 Labor conditions standard 36 4.2.5 External temporary labor in production 37 4.2.6 Factory assessments 38 4.2.7 Employment breakdown 394.3 Diversity 404.4 Talent development 42 4.4.1 Education policy 42 4.4.2 Training and development 434.5 Performance management 44 4.5.1 Performance evaluation 44 4.5.2 Leadership 454.6 Performance-based rewarding 46 4.6.1 Incentives 474.7 Reorganization and restructuring 484.8 Health, safety and wellbeing 49 4.8.1 Management practices 49 4.8.2 Health and safety performance 50 4.8.3 Employee wellbeing 514.9 Working together, making a difference 524.10 Code of Conduct 53
4.2Nokia Way
4.2.1The Nokia Way and Values
A flat, networked organization with speed and flexibility in decision-making characterize the Nokia Way of working. Equal opportunities and openness towards people and new ideas are also key elements we want to nourish. Nokia is straightforward when dealing with customers and suppliers, and we always look for innovative ways of creating and introducing products and solutions to the market. We provide individuals with a platform for personal growth in a challenging environment with a clear vision, goals and shared management principles – the Nokia Way. The Nokia Way brings together talented individuals who share these principles, and therefore share success.
Page 33Nokia sustainability report2009
4.2Nokia Way
4.2.1The Nokia Way and Values
4.0Employees
Navigation bar
Contents 21.0 CEO’s Message 3 2.0 Nokia in 2009 63.0 About the report 94.0 Employees 29 5.0 Supply chain 54 6.0 Corporate social investment 64 7.0 Environment 718.0 Operation 999.0 Key data 2009 11310.0 Independent Assurance 13311.0 Global Reporting Initiative Index 2009 138
4.1 Employment practices 30 4.1.1 Consultation and communication 30 4.1.2 Employee forums and collective bargaining 31 4.1.3 Employee survey 324.2 Nokia Way 33 4.2.1 The Nokia Way and Values 33 4.2.2 Defining our values 34 4.2.3 Labor practices and employment guidelines 35 4.2.4 Labor conditions standard 36 4.2.5 External temporary labor in production 37 4.2.6 Factory assessments 38 4.2.7 Employment breakdown 394.3 Diversity 404.4 Talent development 42 4.4.1 Education policy 42 4.4.2 Training and development 434.5 Performance management 44 4.5.1 Performance evaluation 44 4.5.2 Leadership 454.6 Performance-based rewarding 46 4.6.1 Incentives 474.7 Reorganization and restructuring 484.8 Health, safety and wellbeing 49 4.8.1 Management practices 49 4.8.2 Health and safety performance 50 4.8.3 Employee wellbeing 514.9 Working together, making a difference 524.10 Code of Conduct 53
4.2.2Defining our values
The Nokia Way defines our core values. We reviewed and refined these values in 2007 to engage employees and reflect changes to our business and the way we work. We asked employees to explain what was most important to them to help us create a new set of values that define our company. More than 500 employees from around the world took part in 16 regional events to help us come up with the key themes for our new values. Involving employees at every stage of the process helped us embed a strong values culture throughout the business. The new values are an evolution of the previous Nokia values.
The four values (see below) of our company make us different. They provide a sense of direction for consistent behavior as employees and citizens of the world, and in our quest to become more of an internet company. They act as a foundation for our evolving culture and are the basis of our operational mode. Living up to our values every day is our shared philosophy.
Engaging youFor us, “Engaging you” incorporates the “customer satisfaction” ethic and deals with engaging all our stakeholders, including employees, in what Nokia stands for in the world.
Achieving together“Achieving together” is more than collaboration and partnership. As well as trust, it involves sharing, having the right mind-set and working in formal and informal networks.
Passion for innovation“Passion for innovation” is based on a desire we have to live our dreams, to find courage and make the leap into the future through innovation in technology, ways of working and through understanding the world around us.
Very humanBeing “Very human” encompasses what we offer customers, how we do business and the impact of our actions and behavior on people and the environment. It is about being very human in the world – making things simple, respecting and caring. In short, our desire is to be a very human company.
For more about the Nokia Way and Nokia Values, visit the careers section in our website. www.nokia.com/careers/nokia-as-an-employer
Page 34Nokia sustainability report2009
4.2.2Defining our values
4.0Employees
Navigation bar
Contents 21.0 CEO’s Message 3 2.0 Nokia in 2009 63.0 About the report 94.0 Employees 29 5.0 Supply chain 54 6.0 Corporate social investment 64 7.0 Environment 718.0 Operation 999.0 Key data 2009 11310.0 Independent Assurance 13311.0 Global Reporting Initiative Index 2009 138
4.1 Employment practices 30 4.1.1 Consultation and communication 30 4.1.2 Employee forums and collective bargaining 31 4.1.3 Employee survey 324.2 Nokia Way 33 4.2.1 The Nokia Way and Values 33 4.2.2 Defining our values 34 4.2.3 Labor practices and employment guidelines 35 4.2.4 Labor conditions standard 36 4.2.5 External temporary labor in production 37 4.2.6 Factory assessments 38 4.2.7 Employment breakdown 394.3 Diversity 404.4 Talent development 42 4.4.1 Education policy 42 4.4.2 Training and development 434.5 Performance management 44 4.5.1 Performance evaluation 44 4.5.2 Leadership 454.6 Performance-based rewarding 46 4.6.1 Incentives 474.7 Reorganization and restructuring 484.8 Health, safety and wellbeing 49 4.8.1 Management practices 49 4.8.2 Health and safety performance 50 4.8.3 Employee wellbeing 514.9 Working together, making a difference 524.10 Code of Conduct 53
4.2.3Labor practices and employment guidelines
It is extremely important to Nokia that labor conditions at all our production sites meet recognized international standards. Each of our sites must comply with our global employment guidelines. We assess their performance regularly as well as those of our suppliers. Our global employment guidelines determine how we handle employment issues at each site. They cover:
•compensation•workingtimeandlocation•employeewellbeing•equalopportunities•confidentialityandprivacyissues•guidanceonexternalassignments•conflictsofinterest•efficientcommunications•freedomofassociation,includingcollectivebargainingrights
As part of the human right impact assessments we follow up and take action on operations identified as having risks related to freedom of association, child labor, forced and compulsory labor as well as businesses units at risk from corruption. We monitor actions and the number of incidents of discrimination and corruption in our internal grievance mechanisms and assessment processes.
When making operational changes, we always follow local legislation. In cases of multi-country changes we always take the longest required notice period to inform our employees.
Page 35Nokia sustainability report2009
4.2.3Labor practices and employment guidelines
4.0Employees
Navigation bar
Contents 21.0 CEO’s Message 3 2.0 Nokia in 2009 63.0 About the report 94.0 Employees 29 5.0 Supply chain 54 6.0 Corporate social investment 64 7.0 Environment 718.0 Operation 999.0 Key data 2009 11310.0 Independent Assurance 13311.0 Global Reporting Initiative Index 2009 138
4.1 Employment practices 30 4.1.1 Consultation and communication 30 4.1.2 Employee forums and collective bargaining 31 4.1.3 Employee survey 324.2 Nokia Way 33 4.2.1 The Nokia Way and Values 33 4.2.2 Defining our values 34 4.2.3 Labor practices and employment guidelines 35 4.2.4 Labor conditions standard 36 4.2.5 External temporary labor in production 37 4.2.6 Factory assessments 38 4.2.7 Employment breakdown 394.3 Diversity 404.4 Talent development 42 4.4.1 Education policy 42 4.4.2 Training and development 434.5 Performance management 44 4.5.1 Performance evaluation 44 4.5.2 Leadership 454.6 Performance-based rewarding 46 4.6.1 Incentives 474.7 Reorganization and restructuring 484.8 Health, safety and wellbeing 49 4.8.1 Management practices 49 4.8.2 Health and safety performance 50 4.8.3 Employee wellbeing 514.9 Working together, making a difference 524.10 Code of Conduct 53
4.2.4Labor conditions standard
In 2006, on top of our global employment guidelines and to improve the management of working conditions at factories, we developed the Nokia labor conditions standard. It is based on International Labour Organization and UN Human Rights conventions, and has been benchmarked against international labor laws and standards. The standard provides information and guidelines on how to address the following issues:
•discrimination•forcedlabor•childlabor•freedomofassociation•occupationalsafety•occupationalhealth•disciplinarypractices•workinghours•compensation•managementsystems
This standard provides a framework to monitor and assess labor conditions in a consistent manner across the business, and improves our communication with external stakeholders on these issues. It makes it easier to follow up after assessments to ensure factory managers implement recommendations in line with the standard. Implementation of it began in 2007 and was completed at all Nokia factories in 2008. We have developed a classroom-based interactive training package to improve awareness of the labor conditions standard among our factory employees. Training is also available online for employees at other sites.
Page 36Nokia sustainability report2009
4.2.4Labor conditions standard
4.0Employees
Navigation bar
Contents 21.0 CEO’s Message 3 2.0 Nokia in 2009 63.0 About the report 94.0 Employees 29 5.0 Supply chain 54 6.0 Corporate social investment 64 7.0 Environment 718.0 Operation 999.0 Key data 2009 11310.0 Independent Assurance 13311.0 Global Reporting Initiative Index 2009 138
4.1 Employment practices 30 4.1.1 Consultation and communication 30 4.1.2 Employee forums and collective bargaining 31 4.1.3 Employee survey 324.2 Nokia Way 33 4.2.1 The Nokia Way and Values 33 4.2.2 Defining our values 34 4.2.3 Labor practices and employment guidelines 35 4.2.4 Labor conditions standard 36 4.2.5 External temporary labor in production 37 4.2.6 Factory assessments 38 4.2.7 Employment breakdown 394.3 Diversity 404.4 Talent development 42 4.4.1 Education policy 42 4.4.2 Training and development 434.5 Performance management 44 4.5.1 Performance evaluation 44 4.5.2 Leadership 454.6 Performance-based rewarding 46 4.6.1 Incentives 474.7 Reorganization and restructuring 484.8 Health, safety and wellbeing 49 4.8.1 Management practices 49 4.8.2 Health and safety performance 50 4.8.3 Employee wellbeing 514.9 Working together, making a difference 524.10 Code of Conduct 53
4.2.5External temporary labor in production
The percentage of external temporary labor in our total production workforce fluctuates throughout the year. These workers help us meet demand in peak production periods and provide cover when our permanent employees are absent. Our global policy on direct external labor in factories determines how our sites manage external staff. External temporary labor is hired through agencies for a maximum time period, normally 12 months. When selecting agencies, we ensure they have complied with all applicable labor practices.
Page 37Nokia sustainability report2009
4.2.5External temporary laborin production
4.0Employees
Navigation bar
Contents 21.0 CEO’s Message 3 2.0 Nokia in 2009 63.0 About the report 94.0 Employees 29 5.0 Supply chain 54 6.0 Corporate social investment 64 7.0 Environment 718.0 Operation 999.0 Key data 2009 11310.0 Independent Assurance 13311.0 Global Reporting Initiative Index 2009 138
4.1 Employment practices 30 4.1.1 Consultation and communication 30 4.1.2 Employee forums and collective bargaining 31 4.1.3 Employee survey 324.2 Nokia Way 33 4.2.1 The Nokia Way and Values 33 4.2.2 Defining our values 34 4.2.3 Labor practices and employment guidelines 35 4.2.4 Labor conditions standard 36 4.2.5 External temporary labor in production 37 4.2.6 Factory assessments 38 4.2.7 Employment breakdown 394.3 Diversity 404.4 Talent development 42 4.4.1 Education policy 42 4.4.2 Training and development 434.5 Performance management 44 4.5.1 Performance evaluation 44 4.5.2 Leadership 454.6 Performance-based rewarding 46 4.6.1 Incentives 474.7 Reorganization and restructuring 484.8 Health, safety and wellbeing 49 4.8.1 Management practices 49 4.8.2 Health and safety performance 50 4.8.3 Employee wellbeing 514.9 Working together, making a difference 524.10 Code of Conduct 53
4.2.6Factory assessments
We monitor labor conditions in all our factories to check they comply with our employment guidelines and labor conditions standard. Sites are assessed regularly and plans are developed to address any issues identified. The implementation of these changes is checked through site self-assessment. Labor condition assessments are conducted every second year at all production sites. The most recent assessments took place in 2008.
In 2008, all nine of our main device manufacturing facilities were assessed by a professional external assessment company (STR-CSCC) against our assessment framework. The results showed that the factories had successfully implemented the framework into employment processes. Areas for improvement were overtime control and occupational safety, mainly related to fire safety. We took corrective action where necessary and these facilities received a reassessment in 2009 to ensure full compliance with the framework. To support the framework implementation, all manufacturing facility employees undertake training on the framework principles as part of their induction.
Page 38Nokia sustainability report2009
4.2.6Factory assessments
4.0Employees
Navigation bar
Contents 21.0 CEO’s Message 3 2.0 Nokia in 2009 63.0 About the report 94.0 Employees 29 5.0 Supply chain 54 6.0 Corporate social investment 64 7.0 Environment 718.0 Operation 999.0 Key data 2009 11310.0 Independent Assurance 13311.0 Global Reporting Initiative Index 2009 138
4.1 Employment practices 30 4.1.1 Consultation and communication 30 4.1.2 Employee forums and collective bargaining 31 4.1.3 Employee survey 324.2 Nokia Way 33 4.2.1 The Nokia Way and Values 33 4.2.2 Defining our values 34 4.2.3 Labor practices and employment guidelines 35 4.2.4 Labor conditions standard 36 4.2.5 External temporary labor in production 37 4.2.6 Factory assessments 38 4.2.7 Employment breakdown 394.3 Diversity 404.4 Talent development 42 4.4.1 Education policy 42 4.4.2 Training and development 434.5 Performance management 44 4.5.1 Performance evaluation 44 4.5.2 Leadership 454.6 Performance-based rewarding 46 4.6.1 Incentives 474.7 Reorganization and restructuring 484.8 Health, safety and wellbeing 49 4.8.1 Management practices 49 4.8.2 Health and safety performance 50 4.8.3 Employee wellbeing 514.9 Working together, making a difference 524.10 Code of Conduct 53
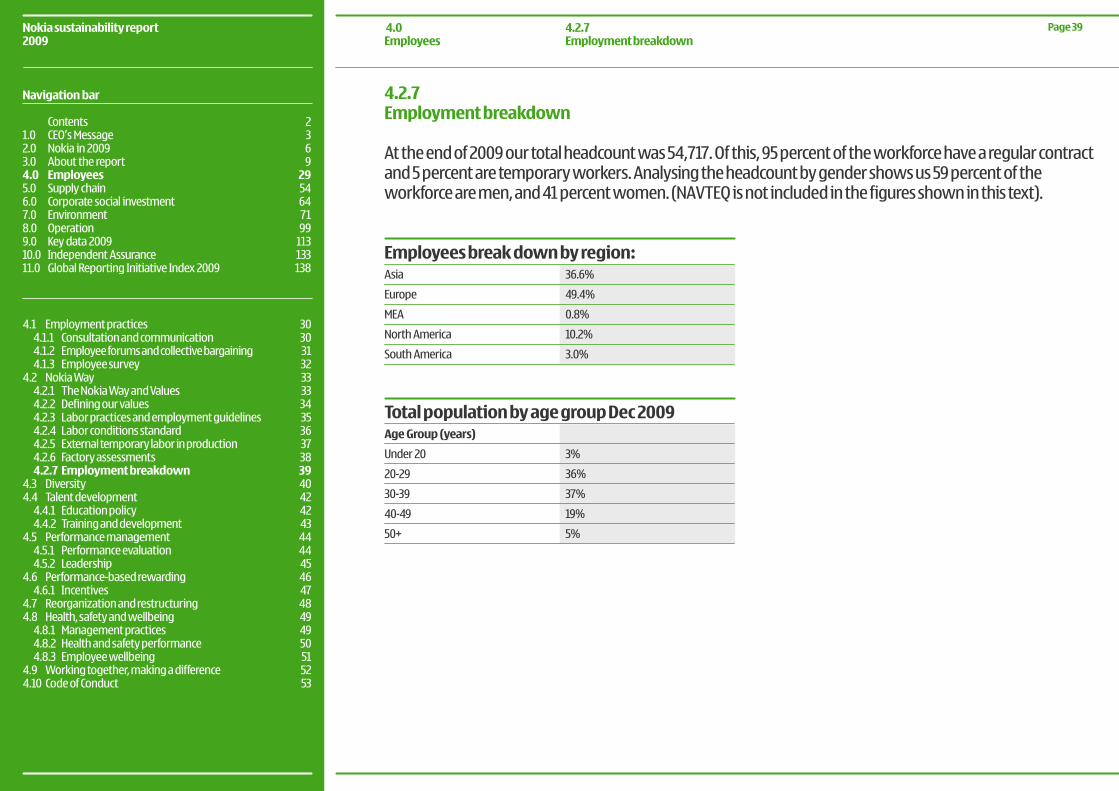
4.2.7Employment breakdown
At the end of 2009 our total headcount was 54,717. Of this, 95 percent of the workforce have a regular contract and 5 percent are temporary workers. Analysing the headcount by gender shows us 59 percent of the workforce are men, and 41 percent women. (NAVTEQ is not included in the figures shown in this text).
Employees break down by region: Asia
Europe
MEA
North America
South America
36.6%
49.4%
0.8%
10.2%
3.0%
Total population by age group Dec 2009 Age Group (years)
Under 20
20-29
30-39
40-49
50+
3%
36%
37%
19%
5%
Page 39Nokia sustainability report2009
4.2.7Employment breakdown
4.0Employees
Navigation bar
Contents 21.0 CEO’s Message 3 2.0 Nokia in 2009 63.0 About the report 94.0 Employees 29 5.0 Supply chain 54 6.0 Corporate social investment 64 7.0 Environment 718.0 Operation 999.0 Key data 2009 11310.0 Independent Assurance 13311.0 Global Reporting Initiative Index 2009 138
4.1 Employment practices 30 4.1.1 Consultation and communication 30 4.1.2 Employee forums and collective bargaining 31 4.1.3 Employee survey 324.2 Nokia Way 33 4.2.1 The Nokia Way and Values 33 4.2.2 Defining our values 34 4.2.3 Labor practices and employment guidelines 35 4.2.4 Labor conditions standard 36 4.2.5 External temporary labor in production 37 4.2.6 Factory assessments 38 4.2.7 Employment breakdown 394.3 Diversity 404.4 Talent development 42 4.4.1 Education policy 42 4.4.2 Training and development 434.5 Performance management 44 4.5.1 Performance evaluation 44 4.5.2 Leadership 454.6 Performance-based rewarding 46 4.6.1 Incentives 474.7 Reorganization and restructuring 484.8 Health, safety and wellbeing 49 4.8.1 Management practices 49 4.8.2 Health and safety performance 50 4.8.3 Employee wellbeing 514.9 Working together, making a difference 524.10 Code of Conduct 53
4.3Diversity
InclusionWe believe that diversity and inclusion in the workplace bring competitive advantage. Employees from diverse cultures and backgrounds bring insights into our customer base around the world, adding value to our business. Nokia is committed to equal opportunities and does not condone discrimination of any kind. This commitment is embedded in our Code of Conduct. Having a plan for actively managing equality and diversityhasshownusthatemployeesstaylongerinthecompany;theyhavebettercompanyloyaltyandhave higher levels of satisfaction toward their work in general. To further educate our workforce on the benefits of being a more diverse company we have developed and begun deployment of the Nokia Cultural Connections Game.
Being a global company with teams all over the world brings challenges as well as benefits. Studies have shown the biggest challenges facing diverse virtual teams are language difficulties and feelings of loneliness when a team member is working remotely from other team members. We have recognized this challenge and are working on enhancing employees’ ability to work in these teams.
The benefits that effective diverse team-working can bring are remarkable. They include complex problem solving, creative thinking, system flexibility and cost savings, to name just a few. Leading a diverse team can also be a challenge. As wellbeing-at-work studies have shown, taking care of every team member by making them feel part of the team is extremely important and can increase both the wellbeing of an individual as well as company performance. We offer a range of options that promote flexible working to help employees balance the demands of work and home life.
We are integrating diversity targets into our global people management processes. For example, we ask our leaders how they create an inclusive environment as part of their general performance self-assessment questionnaire. Their responses are used to identify areas for improvement and share best practice across the business.
Page 40Nokia sustainability report2009
4.3Diversity
4.0Employees
Navigation bar
Contents 21.0 CEO’s Message 3 2.0 Nokia in 2009 63.0 About the report 94.0 Employees 29 5.0 Supply chain 54 6.0 Corporate social investment 64 7.0 Environment 718.0 Operation 999.0 Key data 2009 11310.0 Independent Assurance 13311.0 Global Reporting Initiative Index 2009 138
continued...
4.1 Employment practices 30 4.1.1 Consultation and communication 30 4.1.2 Employee forums and collective bargaining 31 4.1.3 Employee survey 324.2 Nokia Way 33 4.2.1 The Nokia Way and Values 33 4.2.2 Defining our values 34 4.2.3 Labor practices and employment guidelines 35 4.2.4 Labor conditions standard 36 4.2.5 External temporary labor in production 37 4.2.6 Factory assessments 38 4.2.7 Employment breakdown 394.3 Diversity 404.4 Talent development 42 4.4.1 Education policy 42 4.4.2 Training and development 434.5 Performance management 44 4.5.1 Performance evaluation 44 4.5.2 Leadership 454.6 Performance-based rewarding 46 4.6.1 Incentives 474.7 Reorganization and restructuring 484.8 Health, safety and wellbeing 49 4.8.1 Management practices 49 4.8.2 Health and safety performance 50 4.8.3 Employee wellbeing 514.9 Working together, making a difference 524.10 Code of Conduct 53
We are tracking our progress in this area using qualitative and quantitative targets. In 2009, 69 percent of employees, participating in our annual employee survey, felt that all our employees are treated as individuals regardless of age, race, gender or physical capabilities. In 2009, 13.8 percent of senior managers were women, up from 13.7 percent in 2008. Additionally in 2009, 50.7 percent of the senior managers were non-Finnish, an increase from 47.4 percent in 2008. Our policy is to employ local people wherever we work. Around 115 different nationalities work at Nokia. The way we calculate the non-Finnish and women figures was changed to the year-end figure for the 2009 report to enable direct comparison with NSN data. Previously we used figures based on averages across the whole year. (NAVTEQ is not included in the figures).
Cross-unit solutions teamsLike many companies, we tend to work structurally across our units. However, we believe the future is about everybody working more collaboratively. To best meet the needs of consumers, we need to move away from working in technology silos to working in teams spanning all our areas of work, from services to markets and product offerings.
Because change often happens informally and from the ground up, at Nokia we need to have teams that start to change things for themselves. Diversity, inclusion and gender balance will play a very important part in this transformation.
Our head of HR in Finland recently highlighted the following key points about the importance of diversity:•IncreasingdiversityhasbeenanimportantfocusareainNokiaformanyyears.Workinginaglobalmarket
requires a diversity of employees to match. We monitor the percentage of women in our top management positions.
•Astheservicecomponentofourbusinessofferinghasbecomemoreimportant,ourunderstanding of the similarities and differences in the standpoints of both women and men has increased.
•Wehaverecentlytriedtobetterunderstandthespecificchallengesourbusinessunitsfaceinincreasingdiversity.
•Wehaveimprovedbutwecoulddomoretostrengthenourdiversityprograms(seebelow).
Page 41Nokia sustainability report2009
4.3Diversity (continued)
4.0Employees
Navigation bar
Contents 21.0 CEO’s Message 3 2.0 Nokia in 2009 63.0 About the report 94.0 Employees 29 5.0 Supply chain 54 6.0 Corporate social investment 64 7.0 Environment 718.0 Operation 999.0 Key data 2009 11310.0 Independent Assurance 13311.0 Global Reporting Initiative Index 2009 138
4.1 Employment practices 30 4.1.1 Consultation and communication 30 4.1.2 Employee forums and collective bargaining 31 4.1.3 Employee survey 324.2 Nokia Way 33 4.2.1 The Nokia Way and Values 33 4.2.2 Defining our values 34 4.2.3 Labor practices and employment guidelines 35 4.2.4 Labor conditions standard 36 4.2.5 External temporary labor in production 37 4.2.6 Factory assessments 38 4.2.7 Employment breakdown 394.3 Diversity 404.4 Talent development 42 4.4.1 Education policy 42 4.4.2 Training and development 434.5 Performance management 44 4.5.1 Performance evaluation 44 4.5.2 Leadership 454.6 Performance-based rewarding 46 4.6.1 Incentives 474.7 Reorganization and restructuring 484.8 Health, safety and wellbeing 49 4.8.1 Management practices 49 4.8.2 Health and safety performance 50 4.8.3 Employee wellbeing 514.9 Working together, making a difference 524.10 Code of Conduct 53
4.4Talent development
4.4.1Education policy
In a knowledge-based economy, education is key to providing younger generations and adults with the required skills and competences to manage their lives. It also helps provide the talented new recruits companies need.
Our Education Policy team talks with governments and educational institutions to help them shape and modernise education systems and syllabuses to better reflect the needs of global competition and the ICT revolution. The team also has a role in communicating with our business units to identify their long-term competence requirements and help them find partners in the training and education of personnel.
Raising the profile of ICT among girls In 2007, to raise the profile of technology companies as interesting, international and human places to work, Nokia joined an EU-wide effort to promote careers in ICT among girls. Set up by EU commissioner Viviane Reding, the industry-wide program encourages schoolgirls to shadow female engineers during a typical working day. We are pleased to be able to support the program, which offers us an insight into the consumer habits of teenagers while giving girls the chance to find out that studying maths, sciences and technology can be fun, inspiring and can lead to international careers in ICT.
For many years we have also sponsored the Finnish website www.techgirls.fi
Ensuring Asian experience in future managementOur Asian Talent Pipeline (ATP) is a long-term global umbrella for multiple initiatives that the organization has been steadily investing in and working upon over the past two years. Its aim is to build a significant proportion of leaders in global management teams that have Asian experience and that can lead and deliver on the strategic business vision that we have for these markets in the future.
Through the ATP initiatives, we have successfully identified and provided training opportunities for more than 100 senior leaders across our Asian operations. We have also maintained a skills databank used for job rotation, decision-making, mentoring, short-term assignments, and cross-cultural competence development.
Page 42Nokia sustainability report2009
4.4Talent development
4.4.1Education policy
4.0Employees
Navigation bar
Contents 21.0 CEO’s Message 3 2.0 Nokia in 2009 63.0 About the report 94.0 Employees 29 5.0 Supply chain 54 6.0 Corporate social investment 64 7.0 Environment 718.0 Operation 999.0 Key data 2009 11310.0 Independent Assurance 13311.0 Global Reporting Initiative Index 2009 138
4.1 Employment practices 30 4.1.1 Consultation and communication 30 4.1.2 Employee forums and collective bargaining 31 4.1.3 Employee survey 324.2 Nokia Way 33 4.2.1 The Nokia Way and Values 33 4.2.2 Defining our values 34 4.2.3 Labor practices and employment guidelines 35 4.2.4 Labor conditions standard 36 4.2.5 External temporary labor in production 37 4.2.6 Factory assessments 38 4.2.7 Employment breakdown 394.3 Diversity 404.4 Talent development 42 4.4.1 Education policy 42 4.4.2 Training and development 434.5 Performance management 44 4.5.1 Performance evaluation 44 4.5.2 Leadership 454.6 Performance-based rewarding 46 4.6.1 Incentives 474.7 Reorganization and restructuring 484.8 Health, safety and wellbeing 49 4.8.1 Management practices 49 4.8.2 Health and safety performance 50 4.8.3 Employee wellbeing 514.9 Working together, making a difference 524.10 Code of Conduct 53
4.4.2Training and development
We fully believe in training and want employees to be able to develop with us, both personally and professionally. To achieve this we offer an integrated package of classroom training, on-the-job learning, individual coaching, and mentoring. We encourage people to learn through active participation by trying new roles.
We provide a variety of mandatory and voluntary training opportunities for our employees to help them develop a broad range of skills for the workplace, as well as the competencies specific to their role. We offer thousands of internal training options, as well as many external training opportunities. To match local needs, training may be tailored and may also be available in local languages. We operate the 70-20-10 approach to training, where 70 percent of training is on-the-job learning (projects, assignments, and international transfers). Mentoring and coaching accounts for 20 percent, while only 10 percent of employee learning and development comes from traditional classroom training or e-learning. We encourage e-learning opportunities where possible as these are environmentally preferable and cost efficient.
We do not track training hours, only the costs of training. During 2009, we spent EUR 25 million on training for employees working in areas other than production (NAVTEQ is not included in the figures). This equates to EUR 748 for each employee.
Page 43Nokia sustainability report2009
4.4.2Training and development
4.0About the report
Navigation bar
Contents 21.0 CEO’s Message 3 2.0 Nokia in 2009 63.0 About the report 94.0 Employees 29 5.0 Supply chain 54 6.0 Corporate social investment 64 7.0 Environment 718.0 Operation 999.0 Key data 2009 11310.0 Independent Assurance 13311.0 Global Reporting Initiative Index 2009 138
4.1 Employment practices 30 4.1.1 Consultation and communication 30 4.1.2 Employee forums and collective bargaining 31 4.1.3 Employee survey 324.2 Nokia Way 33 4.2.1 The Nokia Way and Values 33 4.2.2 Defining our values 34 4.2.3 Labor practices and employment guidelines 35 4.2.4 Labor conditions standard 36 4.2.5 External temporary labor in production 37 4.2.6 Factory assessments 38 4.2.7 Employment breakdown 394.3 Diversity 404.4 Talent development 42 4.4.1 Education policy 42 4.4.2 Training and development 434.5 Performance management 44 4.5.1 Performance evaluation 44 4.5.2 Leadership 454.6 Performance-based rewarding 46 4.6.1 Incentives 474.7 Reorganization and restructuring 484.8 Health, safety and wellbeing 49 4.8.1 Management practices 49 4.8.2 Health and safety performance 50 4.8.3 Employee wellbeing 514.9 Working together, making a difference 524.10 Code of Conduct 53
4.5Performance management
4.5.1Performance evaluation
Open dialogue about performance and opportunities for development helps to motivate our employees. We encourage managers to coach employees continually as well as having at least one formal personal development discussion every year.
Our 2009 employee survey showed that 71 percent of those surveyed felt that their manager helped them know what is expected of them, 61 percent said that they received regular feedback from their manager to improve their performance and 62 percent indicated they understand how their performance is evaluated. We understand that praise is an important motivator and want to create a culture where team members recognize achievement and help each other perform well.
Page 44Nokia sustainability report2009
4.5Performance management
4.5.1Performance evaluation
4.0About the report
Navigation bar
Contents 21.0 CEO’s Message 3 2.0 Nokia in 2009 63.0 About the report 94.0 Employees 29 5.0 Supply chain 54 6.0 Corporate social investment 64 7.0 Environment 718.0 Operation 999.0 Key data 2009 11310.0 Independent Assurance 13311.0 Global Reporting Initiative Index 2009 138
4.1 Employment practices 30 4.1.1 Consultation and communication 30 4.1.2 Employee forums and collective bargaining 31 4.1.3 Employee survey 324.2 Nokia Way 33 4.2.1 The Nokia Way and Values 33 4.2.2 Defining our values 34 4.2.3 Labor practices and employment guidelines 35 4.2.4 Labor conditions standard 36 4.2.5 External temporary labor in production 37 4.2.6 Factory assessments 38 4.2.7 Employment breakdown 394.3 Diversity 404.4 Talent development 42 4.4.1 Education policy 42 4.4.2 Training and development 434.5 Performance management 44 4.5.1 Performance evaluation 44 4.5.2 Leadership 454.6 Performance-based rewarding 46 4.6.1 Incentives 474.7 Reorganization and restructuring 484.8 Health, safety and wellbeing 49 4.8.1 Management practices 49 4.8.2 Health and safety performance 50 4.8.3 Employee wellbeing 514.9 Working together, making a difference 524.10 Code of Conduct 53
4.5.2Leadership
Strong leadership is vital for the continued success of our company. In 2007, we launched a new leadership model – True Nokia Leader – alongside our new strategy and values. The True Nokia Leader must bring our values to life, consistently ensuring that they form relationships based on trust and deliver extraordinary achievement, growth and development for individuals, teams and our business. The model will guide our leadership development activities and the performance evaluations of managers and leaders.
In the same year we were named number one company in Europe and number three in the world in a Top Companies for Leaders study conducted by human resources company Hewitt Associates, in partnership with Fortune magazine. The study examines how organizations identify and develop future leadership capability and analyzes the links between leadership practices and organizational performance.
Our annual all-employee survey showed that there was a growing gap between our most and least engaging leaders. To address this, we are launching a program called Leaders Coaching Leaders, in which recognized top managers take a coaching role to inspire other managers to improve. Good leadership and the engagement of employees are especially crucial in this time of transformation.
Page 45Nokia sustainability report2009
4.5.2Leadership
4.0About the report
Navigation bar
Contents 21.0 CEO’s Message 3 2.0 Nokia in 2009 63.0 About the report 94.0 Employees 29 5.0 Supply chain 54 6.0 Corporate social investment 64 7.0 Environment 718.0 Operation 999.0 Key data 2009 11310.0 Independent Assurance 13311.0 Global Reporting Initiative Index 2009 138
4.1 Employment practices 30 4.1.1 Consultation and communication 30 4.1.2 Employee forums and collective bargaining 31 4.1.3 Employee survey 324.2 Nokia Way 33 4.2.1 The Nokia Way and Values 33 4.2.2 Defining our values 34 4.2.3 Labor practices and employment guidelines 35 4.2.4 Labor conditions standard 36 4.2.5 External temporary labor in production 37 4.2.6 Factory assessments 38 4.2.7 Employment breakdown 394.3 Diversity 404.4 Talent development 42 4.4.1 Education policy 42 4.4.2 Training and development 434.5 Performance management 44 4.5.1 Performance evaluation 44 4.5.2 Leadership 454.6 Performance-based rewarding 46 4.6.1 Incentives 474.7 Reorganization and restructuring 484.8 Health, safety and wellbeing 49 4.8.1 Management practices 49 4.8.2 Health and safety performance 50 4.8.3 Employee wellbeing 514.9 Working together, making a difference 524.10 Code of Conduct 53
4.6Performance-based rewarding
Nokia rewards employees competitively through a global reward framework designed to recognize individual contribution and achievement. Levels of compensation are determined by local labor markets and take into account both individual and company performance.
In 2009, 28 percent of those participating in our annual employee survey felt their pay was competitive. This was a decrease from the previous year and is partially due to the economic crisis, which led us to initiate a cost savings program. On top of this, bonus payouts were significantly lower than previous years as these are directly linked to the key company financial performance.
In response to this, we have launched a new program called Kudos. Kudos are given by a manager to thank and recognize an employee for demonstrating the Nokia values in the way they do their job, or delivering something special and being an exceptional team member.
Gender demographics vary greatly both between the many countries where we operate and employee categories. For our indirect (non-production staff) we use a global framework to set salary bands which are applied to people regardless of gender/age, etc. We also regularly benchmark with other companies in the industry to ensure we are paying competitively. For our production staff, we have agreements which specify the salary for each role and experience level. These are applied consistently irrespective of gender.
Page 46Nokia sustainability report2009
4.6Performance-based rewarding
4.0About the report
Navigation bar
Contents 21.0 CEO’s Message 3 2.0 Nokia in 2009 63.0 About the report 94.0 Employees 29 5.0 Supply chain 54 6.0 Corporate social investment 64 7.0 Environment 718.0 Operation 999.0 Key data 2009 11310.0 Independent Assurance 13311.0 Global Reporting Initiative Index 2009 138
4.1 Employment practices 30 4.1.1 Consultation and communication 30 4.1.2 Employee forums and collective bargaining 31 4.1.3 Employee survey 324.2 Nokia Way 33 4.2.1 The Nokia Way and Values 33 4.2.2 Defining our values 34 4.2.3 Labor practices and employment guidelines 35 4.2.4 Labor conditions standard 36 4.2.5 External temporary labor in production 37 4.2.6 Factory assessments 38 4.2.7 Employment breakdown 394.3 Diversity 404.4 Talent development 42 4.4.1 Education policy 42 4.4.2 Training and development 434.5 Performance management 44 4.5.1 Performance evaluation 44 4.5.2 Leadership 454.6 Performance-based rewarding 46 4.6.1 Incentives 474.7 Reorganization and restructuring 484.8 Health, safety and wellbeing 49 4.8.1 Management practices 49 4.8.2 Health and safety performance 50 4.8.3 Employee wellbeing 514.9 Working together, making a difference 524.10 Code of Conduct 53
4.6.1Incentives
Our reward programs – including bonuses – recognize performance based on individual, team and company results. A wide number of employees are eligible to join our equity programs, based on rewarding performance and retaining top employees. Our broad-based equity compensation programs include stock options, performance shares and restricted shares. Performance shares are the main element of the company’s broad-based equity compensation program to further emphasize the performance element in employees’ long-term incentives. Our compensation programs promote long-term value sustainability of the company and ensure that remuneration is based on performance. The rationale for using both performance shares and stock options for employees in higher job grades is to build an optimal and balanced combination of long-term equity-based incentives. The equity-based compensation programs intend to align the potential value received by participants directly with the performance of Nokia. We also have granted restricted shares to a small selected number of key employees each year. The equity-based incentive grants are generally conditioned upon continued employment with Nokia, as well as the fulfillment of performance and other conditions, as determined in the relevant plan rules.
Someofthehighlightsofourvariousincentiveprogramsoperatingin2009include;cashincentive/bonusplans(100percentofournon-productionemployeesparticipateinshort-termincentive);R&Dincentive;sales incentive and short-term bonus plans.
We communicate with employees about the effect of business results on their incentives after each quarterly announcement through articles and video messages on our intranet news channel, the News Hub. We also communicate through quarterly letters, blogs, webcasts and face-to-face meetings. Information is also available on the Know Your Business section of our intranet.
Page 47Nokia sustainability report2009
4.6.1Incentives
4.0About the report
Navigation bar
Contents 21.0 CEO’s Message 3 2.0 Nokia in 2009 63.0 About the report 94.0 Employees 29 5.0 Supply chain 54 6.0 Corporate social investment 64 7.0 Environment 718.0 Operation 999.0 Key data 2009 11310.0 Independent Assurance 13311.0 Global Reporting Initiative Index 2009 138
4.1 Employment practices 30 4.1.1 Consultation and communication 30 4.1.2 Employee forums and collective bargaining 31 4.1.3 Employee survey 324.2 Nokia Way 33 4.2.1 The Nokia Way and Values 33 4.2.2 Defining our values 34 4.2.3 Labor practices and employment guidelines 35 4.2.4 Labor conditions standard 36 4.2.5 External temporary labor in production 37 4.2.6 Factory assessments 38 4.2.7 Employment breakdown 394.3 Diversity 404.4 Talent development 42 4.4.1 Education policy 42 4.4.2 Training and development 434.5 Performance management 44 4.5.1 Performance evaluation 44 4.5.2 Leadership 454.6 Performance-based rewarding 46 4.6.1 Incentives 474.7 Reorganization and restructuring 484.8 Health, safety and wellbeing 49 4.8.1 Management practices 49 4.8.2 Health and safety performance 50 4.8.3 Employee wellbeing 514.9 Working together, making a difference 524.10 Code of Conduct 53
4.7Reorganization and restructuring
We had several restructuring events within Nokia in 2009. One was an announcement that our R&D group would reorganize. The goal was to ensure R&D adds maximum value to our competitiveness by better understanding our consumers, bringing new experiences and creating devices people truly desire - while increasing productivity. After several months of rebuilding and defining new ways of working, day one for the new R&D organization, and its more than 12,000 employees was, 1 July 2009.
Another key event was an announcement in early 2009 of plans to increase cost-efficiency and adapt to the challenging market environment. Specific financial targets were given to the financial and investor community, which have been actively followed. While there were significant savings from various programs, ultimately we realised the need to reduce the employee base to match the new market conditions. In line with our values, in February 2009 we announced new voluntary measures aimed at reducing personnel-related costs while reducing the need for involuntary redundancies. The initiatives included the global voluntary resignation package and the wider use of short-term unpaid leave and sabbaticals. Employees and their representatives also proposed many ideas to help reduce personnel-related costs. For example, employees based in Finland were encouraged to take their “holiday bonus” as time off instead of taking cash compensation.
Thanks to these programs we were successful in reducing the need for involuntary redundancies. Of the total reductions that we made in 2009, less than 25 percent were involuntary. During 2009, the rate of voluntary attrition at Nokia was 12.8 percent. This is a significantly higher figure than in previous years (9.3 percent in 2008) and is directly related to the cost saving programs announced in early 2009.
Page 48Nokia sustainability report2009
4.7Reorganization and restructuring
4.0About the report
Navigation bar
Contents 21.0 CEO’s Message 3 2.0 Nokia in 2009 63.0 About the report 94.0 Employees 29 5.0 Supply chain 54 6.0 Corporate social investment 64 7.0 Environment 718.0 Operation 999.0 Key data 2009 11310.0 Independent Assurance 13311.0 Global Reporting Initiative Index 2009 138
4.1 Employment practices 30 4.1.1 Consultation and communication 30 4.1.2 Employee forums and collective bargaining 31 4.1.3 Employee survey 324.2 Nokia Way 33 4.2.1 The Nokia Way and Values 33 4.2.2 Defining our values 34 4.2.3 Labor practices and employment guidelines 35 4.2.4 Labor conditions standard 36 4.2.5 External temporary labor in production 37 4.2.6 Factory assessments 38 4.2.7 Employment breakdown 394.3 Diversity 404.4 Talent development 42 4.4.1 Education policy 42 4.4.2 Training and development 434.5 Performance management 44 4.5.1 Performance evaluation 44 4.5.2 Leadership 454.6 Performance-based rewarding 46 4.6.1 Incentives 474.7 Reorganization and restructuring 484.8 Health, safety and wellbeing 49 4.8.1 Management practices 49 4.8.2 Health and safety performance 50 4.8.3 Employee wellbeing 514.9 Working together, making a difference 524.10 Code of Conduct 53
4.8Health, safety and wellbeing
4.8.1 Management practices
The health, safety and wellbeing of our employees is vital to the success of our business. Our Occupational Health and Safety (OHS) Policy sets out our commitment to provide safe and healthy working conditions for all our employees and promote wellbeing at work. We work with our contractors, suppliers and customersto continuously monitor health and safety issues and meet our commitments.
As a global company we have selected the Occupational Safety & Health Administration (OSHA) guidelines for accident and illness reporting. OSHA has issued specific guidelines and reporting instructions (documented in part 1904: Recording and Reporting Occupational Injuries and Illness) that we use for all global reporting. If we need to report locally, we refer to the appropriate local standards. Local reporting of these figures is not within the scope for Form 20-F, corporate responsibility reporting or assurance procedures. Read the OSHA regulations www.osha.gov
Health and safety is managed by the global OHS unit, part of our human resources department. The unit is responsible for developing our health and safety strategy, and annual action plans. The global OHS team coordinates and facilitates health and safety arrangements in individual countries, each of which have their own health and safety services. The team also develops standard operating procedures to help us standardize procedures for hazard identification, risk assessment and incident reporting across our global operations. We run a range of campaigns and training programs to raise awareness about health and safety issues.
Page 49Nokia sustainability report2009
4.8Health, safety and wellbeing
4.8.1 Management practices
4.0About the report
Navigation bar
Contents 21.0 CEO’s Message 3 2.0 Nokia in 2009 63.0 About the report 94.0 Employees 29 5.0 Supply chain 54 6.0 Corporate social investment 64 7.0 Environment 718.0 Operation 999.0 Key data 2009 11310.0 Independent Assurance 13311.0 Global Reporting Initiative Index 2009 138
4.1 Employment practices 30 4.1.1 Consultation and communication 30 4.1.2 Employee forums and collective bargaining 31 4.1.3 Employee survey 324.2 Nokia Way 33 4.2.1 The Nokia Way and Values 33 4.2.2 Defining our values 34 4.2.3 Labor practices and employment guidelines 35 4.2.4 Labor conditions standard 36 4.2.5 External temporary labor in production 37 4.2.6 Factory assessments 38 4.2.7 Employment breakdown 394.3 Diversity 404.4 Talent development 42 4.4.1 Education policy 42 4.4.2 Training and development 434.5 Performance management 44 4.5.1 Performance evaluation 44 4.5.2 Leadership 454.6 Performance-based rewarding 46 4.6.1 Incentives 474.7 Reorganization and restructuring 484.8 Health, safety and wellbeing 49 4.8.1 Management practices 49 4.8.2 Health and safety performance 50 4.8.3 Employee wellbeing 514.9 Working together, making a difference 524.10 Code of Conduct 53
4.8.2 Health and safety performance
As of December 31, 2009, we had 22,935 employees working directly in production, including manufacturing, packaging and shipping, at our 10 mobile device manufacturing facilities. During 2009, the injury and illness rate among all our employees at our nine major production facilities was 0.49 (a decrease from 0.6 in 2008). Work related absences are included in the calculation, however general absences (e.g. someone getting the flu) are not included. In 2009, Nokia’s global injury and illness rate was 0.49, continuing a three-year downward trend (it was 0.82 in 2006). There were no fatal injuries. There is no global industry average to compare against, but as an example of the range, our injury and illness rate in 2009 was lower than the United States Bureau of Labor Statistics’ injury and illness rate, which was 1.8 for computer and electronic product manufacturing in 2008. The USBLS numbers for 2009 are not yet available. (NAVTEQ is not included in the figures mentioned above).During 2009, a comprehensive program was developed and deployed at all our sites in response to the H1N1 virus pandemic. This included education about the virus, advice on methods to control the spread and additional hygiene supplies in cafeterias and bathrooms. Where possible, the vaccine was offered to employees and contingency plans were developed in case large numbers of employees became sick.
Page 50Nokia sustainability report2009
4.8.2 Health and safety performance
4.0About the report
Navigation bar
Contents 21.0 CEO’s Message 3 2.0 Nokia in 2009 63.0 About the report 94.0 Employees 29 5.0 Supply chain 54 6.0 Corporate social investment 64 7.0 Environment 718.0 Operation 999.0 Key data 2009 11310.0 Independent Assurance 13311.0 Global Reporting Initiative Index 2009 138
4.1 Employment practices 30 4.1.1 Consultation and communication 30 4.1.2 Employee forums and collective bargaining 31 4.1.3 Employee survey 324.2 Nokia Way 33 4.2.1 The Nokia Way and Values 33 4.2.2 Defining our values 34 4.2.3 Labor practices and employment guidelines 35 4.2.4 Labor conditions standard 36 4.2.5 External temporary labor in production 37 4.2.6 Factory assessments 38 4.2.7 Employment breakdown 394.3 Diversity 404.4 Talent development 42 4.4.1 Education policy 42 4.4.2 Training and development 434.5 Performance management 44 4.5.1 Performance evaluation 44 4.5.2 Leadership 454.6 Performance-based rewarding 46 4.6.1 Incentives 474.7 Reorganization and restructuring 484.8 Health, safety and wellbeing 49 4.8.1 Management practices 49 4.8.2 Health and safety performance 50 4.8.3 Employee wellbeing 514.9 Working together, making a difference 524.10 Code of Conduct 53
4.8.3Employee wellbeing
The general wellbeing of employees makes a big difference to their engagement and productivity at work. In the 2009 employee survey, 61 percent of the respondents felt that their manager supports them in their efforts to maintain a work/life balance. Over the past three years, there has been a steady increase in the proportion of positive responses on wellbeing, indicating an improvement in awareness and attitudes among our managers. We created a global Wellbeing Policy as part of our HR strategy in 2008. The policyis based on our existing wellbeing-at-work model and guidance from our wellbeing working group, which includes employees.
We are pleased that the majority of employees feel supported but recognize there is still room for improvement. We are encouraging managers to discuss with employees how work affects wellbeing andto set wellbeing targets. We encourage our employees to make use of our products to increase their mobility and work from home where possible in accordance to practices and rules. We held a summit for employeesto discuss new ways of working this year. We do not discriminate against existing or potential employees with chronic health conditions that do not prevent them from working. However, where applicable, new recruits may be asked to complete a medical evaluation to ensure they are fit enough to do their work safely.
Our increasing focus on employee wellbeing and physical fitness has sparked new initiatives. In 2009, we organized a first global fitness event - a five kilometre running/walking event at over 60 Nokia sites. Before and during the events we offered information on health promoting exercise and also introduced our thinking on the importance of employee wellbeing, as outlined in the People Strategy. Besides increasing the attention on physical fitness, the target is to make the events fun and inspiring, thus also increasing the Nokia spirit and feeling of togetherness.
In 2009 we developed an internal Wellbeing Survey in cooperation with researchers from Helsinki University of Technology (now known as Aalto University of Science and Technology) and Stanford University. The survey includes elements such as health and habits, job satisfaction, organizational resources, personal resources, life balance and recovery and stress management. The survey can be used to get an understanding on the wellbeing level of both teams and individuals and it provides information on the areas where actions to promote wellbeing are needed the most. The survey was piloted on a limited scale in 2009 and will be launched globally in 2010.
Page 51Nokia sustainability report2009
4.8.3Employee wellbeing
4.0About the report
Navigation bar
Contents 21.0 CEO’s Message 3 2.0 Nokia in 2009 63.0 About the report 94.0 Employees 29 5.0 Supply chain 54 6.0 Corporate social investment 64 7.0 Environment 718.0 Operation 999.0 Key data 2009 11310.0 Independent Assurance 13311.0 Global Reporting Initiative Index 2009 138
4.1 Employment practices 30 4.1.1 Consultation and communication 30 4.1.2 Employee forums and collective bargaining 31 4.1.3 Employee survey 324.2 Nokia Way 33 4.2.1 The Nokia Way and Values 33 4.2.2 Defining our values 34 4.2.3 Labor practices and employment guidelines 35 4.2.4 Labor conditions standard 36 4.2.5 External temporary labor in production 37 4.2.6 Factory assessments 38 4.2.7 Employment breakdown 394.3 Diversity 404.4 Talent development 42 4.4.1 Education policy 42 4.4.2 Training and development 434.5 Performance management 44 4.5.1 Performance evaluation 44 4.5.2 Leadership 454.6 Performance-based rewarding 46 4.6.1 Incentives 474.7 Reorganization and restructuring 484.8 Health, safety and wellbeing 49 4.8.1 Management practices 49 4.8.2 Health and safety performance 50 4.8.3 Employee wellbeing 514.9 Working together, making a difference 524.10 Code of Conduct 53
4.9Working together, making a difference
Our mission is to make meaningful contributions to communities in the countries where we operate. However, we do not have a global one-size-fits-all volunteering policy. Instead, our program is an umbrella for locally relevant volunteering activities.
Volunteering is an important part of our global corporate responsibility approach. Thousands of our employees contribute their time and effort to worthy causes in their communities. The program revolves around connecting people. We aim to engage our employees as well as influence our corporate culture in a sustainable way.
Through volunteering we are able to learn new skills and gain new perspectives. Volunteering also helps to create a balance between our personal convictions and professional lives.
It is important to encourage and support employees who want to contribute. In recognition of this, employees can take one to two working days per year as a Nokia Helping Hands day. Through this, employees can go out into the community and contribute to a good cause.
Page 52Nokia sustainability report2009
4.9Working together, makinga difference
4.0About the report
Navigation bar
Contents 21.0 CEO’s Message 3 2.0 Nokia in 2009 63.0 About the report 94.0 Employees 29 5.0 Supply chain 54 6.0 Corporate social investment 64 7.0 Environment 718.0 Operation 999.0 Key data 2009 11310.0 Independent Assurance 13311.0 Global Reporting Initiative Index 2009 138
4.1 Employment practices 30 4.1.1 Consultation and communication 30 4.1.2 Employee forums and collective bargaining 31 4.1.3 Employee survey 324.2 Nokia Way 33 4.2.1 The Nokia Way and Values 33 4.2.2 Defining our values 34 4.2.3 Labor practices and employment guidelines 35 4.2.4 Labor conditions standard 36 4.2.5 External temporary labor in production 37 4.2.6 Factory assessments 38 4.2.7 Employment breakdown 394.3 Diversity 404.4 Talent development 42 4.4.1 Education policy 42 4.4.2 Training and development 434.5 Performance management 44 4.5.1 Performance evaluation 44 4.5.2 Leadership 454.6 Performance-based rewarding 46 4.6.1 Incentives 474.7 Reorganization and restructuring 484.8 Health, safety and wellbeing 49 4.8.1 Management practices 49 4.8.2 Health and safety performance 50 4.8.3 Employee wellbeing 514.9 Working together, making a difference 524.10 Code of Conduct 53
4.10Code of Conduct
Nokia’s Code of Conduct is based on the highest ethical standards. It defines the context of our ethical and sustainable business practices. The Code was introduced in 1997 and its last revision was January 1, 2009 following Group Executive Board approval. The revision has expanded sections on areas such as environmental and privacy issues with continued emphasis on ethical, responsible and sustainable business conduct. It has been translated into the 34 most widely spoken languages in the company.
A company-wide training program on the new code began in the spring of 2009, with the aim of raising employee awareness of the way we conduct business. The training additionally covers topics such as bribery and corruption, and labor conditions. By the end of the year, 85 percent of all Nokia employees had taken the associated e-learning or classroom training. The training module is offered in 11 languages. The training program was also launched at NAVTEQ and Nokia Siemens Networks. Further training continues during 2010 withthegoalofreaching100%ofemployees.
Page 53Nokia sustainability report2009
4.10Code of Conduct
4.0About the report
Navigation bar
Contents 21.0 CEO’s Message 3 2.0 Nokia in 2009 63.0 About the report 94.0 Employees 29 5.0 Supply chain 54 6.0 Corporate social investment 64 7.0 Environment 718.0 Operation 999.0 Key data 2009 11310.0 Independent Assurance 13311.0 Global Reporting Initiative Index 2009 138
4.1 Employment practices 30 4.1.1 Consultation and communication 30 4.1.2 Employee forums and collective bargaining 31 4.1.3 Employee survey 324.2 Nokia Way 33 4.2.1 The Nokia Way and Values 33 4.2.2 Defining our values 34 4.2.3 Labor practices and employment guidelines 35 4.2.4 Labor conditions standard 36 4.2.5 External temporary labor in production 37 4.2.6 Factory assessments 38 4.2.7 Employment breakdown 394.3 Diversity 404.4 Talent development 42 4.4.1 Education policy 42 4.4.2 Training and development 434.5 Performance management 44 4.5.1 Performance evaluation 44 4.5.2 Leadership 454.6 Performance-based rewarding 46 4.6.1 Incentives 474.7 Reorganization and restructuring 484.8 Health, safety and wellbeing 49 4.8.1 Management practices 49 4.8.2 Health and safety performance 50 4.8.3 Employee wellbeing 514.9 Working together, making a difference 524.10 Code of Conduct 53
Page 54Nokia sustainability report2009
Navigation bar
Contents 21.0 CEO’s Message 3 2.0 Nokia in 2009 63.0 About the report 94.0 Employees 29 5.0 Supply chain 54 6.0 Corporate social investment 64 7.0 Environment 718.0 Operation 999.0 Key data 2009 11310.0 Independent Assurance 13311.0 Global Reporting Initiative Index 2009 138
5.0Supply chain
5.1 Supplier requirements 555.2 Supplier performance 56 5.2.1 Supplier self-assessments 57 5.2.2 Supplier on-site assessments 585.3 Supplier performance metrics and targets 595.4 Training and building capability 605.5 Sourcing materials 61 5.5.1 Origin of raw materials 625.6 Industry collaboration 63
5.1Supplier requirements
An essential part of our work is to define clear expectations for our suppliers wherever they are located. We have developed a comprehensive set of global Nokia Supplier Requirements (NSR), which include environmental and social requirements based on international standards: ISO 14001, SA 8000, OHSAS18001, PCMM and ILO, and UN conventions. Our list of environmental and social supplier requirements can be found from our webiste www.nokia.com/corporate-responsibility/supply-chain/nokia-supplier-requirements (NAVTEQ has its own approach to supply management which are not included in the figures shown here).
One NSR-defined supplier requirement is having a company level code of conduct in place. Codes of conduct are specified as covering topics such as corruption, general business routines, health and safety, human rights, working conditions, social rights and environmental standards. We surveyed our suppliers’ code of conduct implementation and found that 92 percent met our requirements. We have asked those suppliers that have not met our expectations to take corrective action.
From an environmental perspective we require all suppliers to have an environmental management system in place. Certain suppliers are required to have certified EMS (for example, ISO 14001). At December 31, 2009, 92 percent of our direct suppliers’ sites were certified to ISO 14001. These certified suppliers accounted for more than 98 percent of our hardware purchasing expenditure during the year.
We source components, materials and services from suppliers all over the world and continually strive to improve our way of working as we learn how to be more effective and efficient.
Page 55Nokia sustainability report2009
5.1Supplier requirements
5.0Supply chain
Navigation bar
Contents 21.0 CEO’s Message 3 2.0 Nokia in 2009 63.0 About the report 94.0 Employees 29 5.0 Supply chain 54 6.0 Corporate social investment 64 7.0 Environment 718.0 Operation 999.0 Key data 2009 11310.0 Independent Assurance 13311.0 Global Reporting Initiative Index 2009 138
5.1 Supplier requirements 555.2 Supplier performance 56 5.2.1 Supplier self-assessments 57 5.2.2 Supplier on-site assessments 585.3 Supplier performance metrics and targets 595.4 Training and building capability 605.5 Sourcing materials 61 5.5.1 Origin of raw materials 625.6 Industry collaboration 63
5.2Supplier performance
Openness and trust are important aspects when working together with suppliers and driving compliance and performance improvements. We find that some suppliers have well-developed corporate responsibility programs, while others need more support. We use supplier assessments (self and on-site) to understand individual supplier performance level and compliance to our requirements. We also conduct supplier satisfaction surveys to get feedback on our approach.
The results of the supplier satisfaction survey reflect how we perform on topics such as planning, relationship management and whether other business expectations force suppliers to compromise on their environmental and ethical level of compliance.
In 2009, on average, the respondents of the supplier satisfaction survey gave an overall rating for doing business with Nokia as 79 percent on a scale where zero percent represents an unacceptable level and 100 percent an excellent level. Furthermore, on average the respondents rated the overall level of Nokia’s approach to corporate responsibility as 91 percent.
Page 56Nokia sustainability report2009
5.2Supplier performance
5.0Supply chain
Navigation bar
Contents 21.0 CEO’s Message 3 2.0 Nokia in 2009 63.0 About the report 94.0 Employees 29 5.0 Supply chain 54 6.0 Corporate social investment 64 7.0 Environment 718.0 Operation 999.0 Key data 2009 11310.0 Independent Assurance 13311.0 Global Reporting Initiative Index 2009 138
5.1 Supplier requirements 555.2 Supplier performance 56 5.2.1 Supplier self-assessments 57 5.2.2 Supplier on-site assessments 585.3 Supplier performance metrics and targets 595.4 Training and building capability 605.5 Sourcing materials 61 5.5.1 Origin of raw materials 625.6 Industry collaboration 63
5.2.1 Supplier self-assessments
In July 2009 we started to replace our previous SER self-assessments with the self-assessment questionnaire (SAQ) delivered through the online Electronic Tool for Accountable Supply Chains (E-TASC). E-TASC is a joint effort of the Global e-Sustainability Initiative (GeSi) and the Electronic Industry Citizenship Coalition (EICC). It is a web-based information management system to help companies collect, manage, and analyze social and environmental responsibility data provided voluntarily by their suppliers.
By the end of 2009, 14 Nokia suppliers had completed a total of 59 E-TASC SAQs. Of these, 12 were corporate-level (covering overall company performance on environmental and social criteria) and 47 were facility-level (covering performance at the production, administrative and service unit level). The average corporate SAQ score was 89.5 percent and the facility score was 87.4 percent. A higher score indicates a lower risk that the supplier’s labor, health and safety, ethics and environmental practices and processes are falling short of expectations.
Page 57Nokia sustainability report2009
5.2.1Supplier self-assessments
5.0Supply chain
Navigation bar
Contents 21.0 CEO’s Message 3 2.0 Nokia in 2009 63.0 About the report 94.0 Employees 29 5.0 Supply chain 54 6.0 Corporate social investment 64 7.0 Environment 718.0 Operation 999.0 Key data 2009 11310.0 Independent Assurance 13311.0 Global Reporting Initiative Index 2009 138
5.1 Supplier requirements 555.2 Supplier performance 56 5.2.1 Supplier self-assessments 57 5.2.2 Supplier on-site assessments 585.3 Supplier performance metrics and targets 595.4 Training and building capability 605.5 Sourcing materials 61 5.5.1 Origin of raw materials 625.6 Industry collaboration 63
5.2.2 Supplier on-site assessments
Although every Nokia employee has the opportunity to spot issues of environmental and social responsibility concern when visiting a supplier facility, officially we have two types of on-site assessments: system and in-depth assessments.
We monitor compliance with the Nokia supplier requirements (NSR) through regular system assessments. These involve a review of the supplier’s complete processes and management system against NSR. All new suppliers must undergo a system assessment, together with suppliers who have undergone significant organizational changes and those considered to be at highest risk of non-compliance or with a strong need for development.Key suppliers are generally assessed every two years. During 2009, we conducted 58 system assessments.
Read more about system assessments www.nokia.com/corporate-responsibility/supply-chain/supplier-performance
The second type of on-site assessment is called an in-depth assessment. These provide an opportunity for more insight into how a supplier is managing and performing against the ethics, environment, labor and health and safety requirements defined in NSR. Suppliers undergo in-depth assessments for a variety of reasons. These include if they are:
•newandstrategicallyimportant•identifiedashavingsignificantorpotentialrisks(fromriskassessments,systemassessments,feedback
from sourcing personnel or third parties) •locatedinanewcountrywherewehavelittleknowledgeofpotentialissuesofconcern
In 2009 we conducted five in-depth labor, health and safety and environmental assessments. Read more about in-depth assessmentswww.nokia.com/corporate-responsibility/supply-chain/supplier-performance
Assessments are useful because they highlight a supplier’s best practices as well as risks and opportunities for improvement. However, they typically provide a snap shot of a situation and, used alone, they do not always provide the right solution. To drive sustainable change we often need to combine assessments with other tools and approaches including face-to-face meetings, performance metrics and targets, development programs, trainings and supplier-focused events.
Page 58Nokia sustainability report2009
5.2.2 Supplier on-site assessments
5.0Supply chain
Navigation bar
Contents 21.0 CEO’s Message 3 2.0 Nokia in 2009 63.0 About the report 94.0 Employees 29 5.0 Supply chain 54 6.0 Corporate social investment 64 7.0 Environment 718.0 Operation 999.0 Key data 2009 11310.0 Independent Assurance 13311.0 Global Reporting Initiative Index 2009 138
5.1 Supplier requirements 555.2 Supplier performance 56 5.2.1 Supplier self-assessments 57 5.2.2 Supplier on-site assessments 585.3 Supplier performance metrics and targets 595.4 Training and building capability 605.5 Sourcing materials 61 5.5.1 Origin of raw materials 625.6 Industry collaboration 63
5.3Supplier performance metrics and targets
A Nokia product has environmental impacts at each stage of its life cycle, from raw material extraction through to end-of-life disposal. In sourcing, our aim is to reduce the environmental impact of the supply chain part of the life cycle. As well as driving performance improvements through our requirements and assessments, we also work to drive improvements through environmental performance metrics and target setting.
In 2009, we further increased the visibility of our suppliers’ environmental performance and target setting, concentrating on four key areas: energy consumption, carbon dioxide (equivalent) emissions, water use and waste generation. Looking at the suppliers of commodities (representing 70 percent of our overall expenditure on hardware), which have the highest impact from a life cycle analysis perspective, 93 percent have company level reduction targets for energy, carbon dioxide (equivalent), water and waste in place and monitored. In 2010, we plan to extend this scope further as part of continuous improvement.
Page 59Nokia sustainability report2009
5.3Supplier performance metrics and targets
5.0Supply chain
Navigation bar
Contents 21.0 CEO’s Message 3 2.0 Nokia in 2009 63.0 About the report 94.0 Employees 29 5.0 Supply chain 54 6.0 Corporate social investment 64 7.0 Environment 718.0 Operation 999.0 Key data 2009 11310.0 Independent Assurance 13311.0 Global Reporting Initiative Index 2009 138
5.1 Supplier requirements 555.2 Supplier performance 56 5.2.1 Supplier self-assessments 57 5.2.2 Supplier on-site assessments 585.3 Supplier performance metrics and targets 595.4 Training and building capability 605.5 Sourcing materials 61 5.5.1 Origin of raw materials 625.6 Industry collaboration 63
5.4Training and building capability
Building capabilities within our suppliers’ and our own organization is important for sustainable improvements. Before our suppliers can be expected to meet our requirements, it is first important thatour own sourcing personnel are familiar with our requirements and commitments so that they can support implementation and talk to suppliers in a consistent way. During 2009, sourcing personnel received the following:
•trainingonNokia’sCodeofConduct•in-depthlabor,healthandsafetyandenvironmentalassessortraining•NokiaSubstanceListv2010training•NokiaapproachtoREACHinfo-sessions
In 2009, to help suppliers understand our expectations and so they can implement requirementsand support continuous improvement, we provided them with training on:
•theNokiaSubstanceListv2010•theNokiaapproachtoREACH•Nokiaenvironmentalproductrequirements
We also continued development programs with key suppliers.
Page 60Nokia sustainability report2009
5.4Training and building capability
5.0Supply chain
Navigation bar
Contents 21.0 CEO’s Message 3 2.0 Nokia in 2009 63.0 About the report 94.0 Employees 29 5.0 Supply chain 54 6.0 Corporate social investment 64 7.0 Environment 718.0 Operation 999.0 Key data 2009 11310.0 Independent Assurance 13311.0 Global Reporting Initiative Index 2009 138
5.1 Supplier requirements 555.2 Supplier performance 56 5.2.1 Supplier self-assessments 57 5.2.2 Supplier on-site assessments 585.3 Supplier performance metrics and targets 595.4 Training and building capability 605.5 Sourcing materials 61 5.5.1 Origin of raw materials 625.6 Industry collaboration 63
5.5 Sourcing materials
In addition to our suppliers’ operations we also need to consider the materials they provide.Our main objective is that we know all the materials in our products, not just those that raise concerns, and that they are safe for people and the environment when used properly. Our sourcing organization and suppliers play a key role in ensuring our components and parts are safe and compliant with the Nokia Substance List (NSL).
In June 2007, the EU regulations on the Registration, Evaluation, Authorisation and Restriction of Chemicals (REACH) came into force. According to this regulation, companies have obligations to ensure that the chemical substances they manufacture, import or are found in their products that are considered as “substances of very high concern” are registered, authorized or notified according to legal requirements. During 2009, we continued to monitor the candidate list of “substances of very high concern” and to compare it against our material content data that we collect from suppliers, to identify potential risks and necessary actions.
Page 61Nokia sustainability report2009
5.5 Sourcing materials
5.0Supply chain
Navigation bar
Contents 21.0 CEO’s Message 3 2.0 Nokia in 2009 63.0 About the report 94.0 Employees 29 5.0 Supply chain 54 6.0 Corporate social investment 64 7.0 Environment 718.0 Operation 999.0 Key data 2009 11310.0 Independent Assurance 13311.0 Global Reporting Initiative Index 2009 138
5.1 Supplier requirements 555.2 Supplier performance 56 5.2.1 Supplier self-assessments 57 5.2.2 Supplier on-site assessments 585.3 Supplier performance metrics and targets 595.4 Training and building capability 605.5 Sourcing materials 61 5.5.1 Origin of raw materials 625.6 Industry collaboration 63
5.5.1Origin of raw materials
Even though we do not source or buy metals directly, we are very concerned about poor practices at some mine operations around the world. We require high ethical standards in our own operations and our supply chain. Mining activities that fuel conflict or benefit militant groups are unacceptable.
We became aware of the potential link between the mining of coltan and the financing of the conflict in the Democratic Republic of Congo (DRC) in 2001 and took action immediately. Coltan is an ore that contains tantalum, which is a material used in many consumer electronics products.
Our Nokia Substance List 2010 requirements, backed up by written statements from our suppliers, are aimed at ensuring that our products do not include tantalum derived from illegally mined coltan.
Despite the complexity and the fact that there are typically four to eight supplier layers between Nokia and any mining activities, we are actively working to tackle these issues. This work involves increasing the transparency of the supply chains of these materials, understanding the commitments of each tier, working at an industry level (through the Global e-Sustainability Initiative and the Electronics Industry Citizenship Coalition extractives working group) and with stakeholders. We are also working with suppliers of other minerals, such as cobalt and tin, to improve transparency in our supply chain and understand how we can promote standards and use alternative new substances, such as biomaterials.
Read more about raw materials from our websitewww.nokia.com/corporate-responsibility/supply-chain/substance-management
Page 62Nokia sustainability report2009
5.5.1Origin of raw materials
5.0Supply chain
Navigation bar
Contents 21.0 CEO’s Message 3 2.0 Nokia in 2009 63.0 About the report 94.0 Employees 29 5.0 Supply chain 54 6.0 Corporate social investment 64 7.0 Environment 718.0 Operation 999.0 Key data 2009 11310.0 Independent Assurance 13311.0 Global Reporting Initiative Index 2009 138
5.1 Supplier requirements 555.2 Supplier performance 56 5.2.1 Supplier self-assessments 57 5.2.2 Supplier on-site assessments 585.3 Supplier performance metrics and targets 595.4 Training and building capability 605.5 Sourcing materials 61 5.5.1 Origin of raw materials 625.6 Industry collaboration 63
5.6 Industry collaboration
We have been a full member of the Global e-Sustainability Initiative (GeSI) since 2007 and a member of the GeSI Supply Chain Working Group (SCWG) since 2004. This group works closely with the Electronics Industry Citizenship Coalition (EICC).
The main aims of this collaborative effort are to promote good conduct and to develop and deploy a consistent set of tools and processes to measure, monitor and improve CR performance across the ICT sector supply chain. As part of our membership of the GeSI SCWG, we continue to actively participate in the Learning and Capability Building, Validated Audit Programme and Extractives working groups’ collaboration with EICC.
Page 63Nokia sustainability report2009
5.6 Industry collaboration
5.0Supply chain
Navigation bar
Contents 21.0 CEO’s Message 3 2.0 Nokia in 2009 63.0 About the report 94.0 Employees 29 5.0 Supply chain 54 6.0 Corporate social investment 64 7.0 Environment 718.0 Operation 999.0 Key data 2009 11310.0 Independent Assurance 13311.0 Global Reporting Initiative Index 2009 138
5.1 Supplier requirements 555.2 Supplier performance 56 5.2.1 Supplier self-assessments 57 5.2.2 Supplier on-site assessments 585.3 Supplier performance metrics and targets 595.4 Training and building capability 605.5 Sourcing materials 61 5.5.1 Origin of raw materials 625.6 Industry collaboration 63
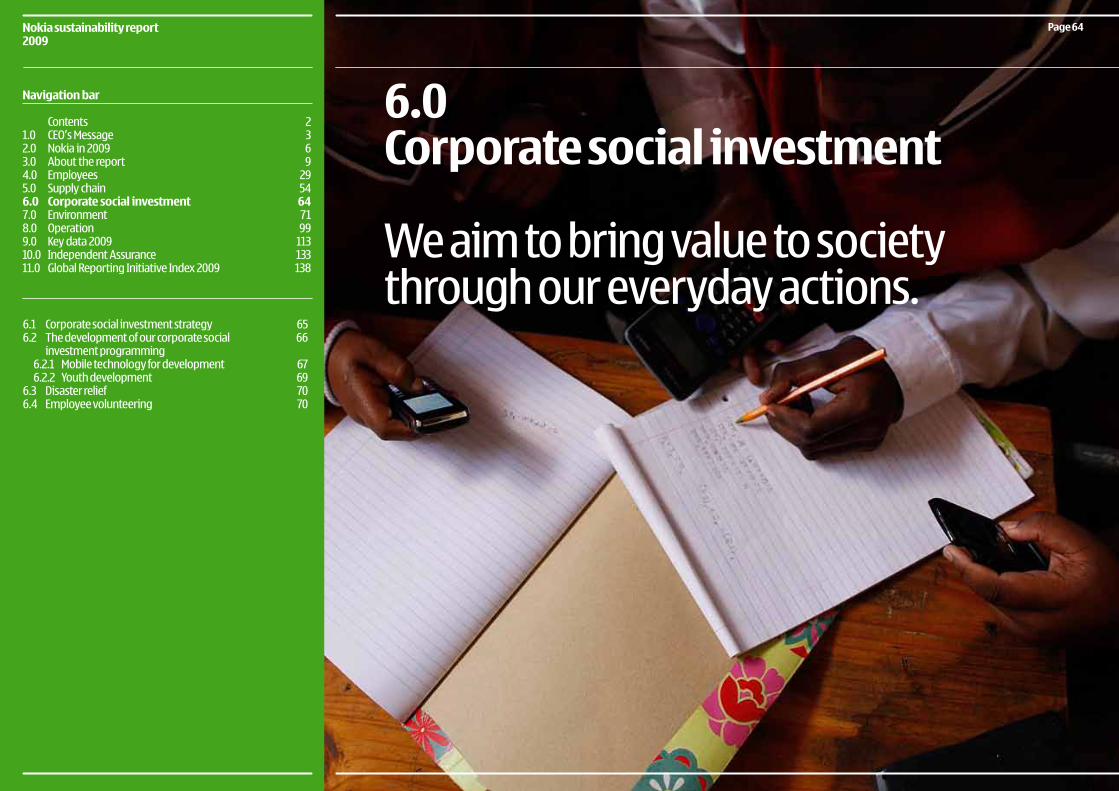
Page 64Nokia sustainability report2009
Navigation bar
Contents 21.0 CEO’s Message 3 2.0 Nokia in 2009 63.0 About the report 94.0 Employees 29 5.0 Supply chain 54 6.0 Corporate social investment 64 7.0 Environment 718.0 Operation 999.0 Key data 2009 11310.0 Independent Assurance 13311.0 Global Reporting Initiative Index 2009 138
6.0Corporate social investment
We aim to bring value to society through our everyday actions.
6.1 Corporate social investment strategy 656.2 The development of our corporate social 66
investment programming 6.2.1 Mobile technology for development 67 6.2.2 Youth development 696.3 Disaster relief 706.4 Employee volunteering 70
6.1Corporate social investment strategy
We aim to bring value to society through our everyday actions. This means recognizing that mobile phones have become important tools for social development. Many governments, UN agencies and non-profit organizations have also recognized the potential for mobile communications to transform the delivery of essential services to people of all income levels. With our devices in the hands of about one billion people around the world, the challenge for us is how to fulfil our potential.
Against this backdrop, Nokia reshaped its corporate social investment focus in late 2009. We looked at where we felt we could make the largest impact and how we could align our goals with priorities established by credible, independent agencies. As a result, our aim will be to use mobile technology to help achieve education for all – that is, to use our products, services and technology to help achieve the United Nations’ UNESCO’s Education for All objectives. We have aligned our plans with the program’s 2015 timeframe andwe will report against its objectives in future years.
Our shift is due to two main factors: a marked reduction in the cost of mobile phones and the significant expansion of mobile networks. As a society, we have barely scratched the surface of what mobile communications can achieve. We expect to see significant change by 2015, especially if the affordability of mobile data services can be improved. This change does not mean an end to more traditional philanthropy. We will, for example, continue to invest resources in disaster relief and the specific activities of non-profit organizations around the world.
Page 65Nokia sustainability report2009
6.0Supply chain
6.1Corporate social investment strategy
Navigation bar
Contents 21.0 CEO’s Message 3 2.0 Nokia in 2009 63.0 About the report 94.0 Employees 29 5.0 Supply chain 54 6.0 Corporate social investment 64 7.0 Environment 718.0 Operation 999.0 Key data 2009 11310.0 Independent Assurance 13311.0 Global Reporting Initiative Index 2009 138
6.1 Corporate social investment strategy 656.2 The development of our corporate social 66
investment programming 6.2.1 Mobile technology for development 67 6.2.2 Youth development 696.3 Disaster relief 706.4 Employee volunteering 70
6.2The development of our corporate social investment programming
In the 1860s, our founders paid for the schooling of employees’ children. In 2009, we continued to build on this 140 year-old legacy of youth development with projects tailored to local needs. The vast majority of our multi-year projects from 2008 continued in 2009. These ranged from youth employability projects in ten Latin American countries to youth volunteering projects in central Europe. Our work in 2009 focused on two main areas: youth development and mobile communications for development.
Page 66Nokia sustainability report2009
6.0Supply chain
6.2The development of our corporate social investment programming
Navigation bar
Contents 21.0 CEO’s Message 3 2.0 Nokia in 2009 63.0 About the report 94.0 Employees 29 5.0 Supply chain 54 6.0 Corporate social investment 64 7.0 Environment 718.0 Operation 999.0 Key data 2009 11310.0 Independent Assurance 13311.0 Global Reporting Initiative Index 2009 138
6.1 Corporate social investment strategy 656.2 The development of our corporate social 66
investment programming 6.2.1 Mobile technology for development 67 6.2.2 Youth development 696.3 Disaster relief 706.4 Employee volunteering 70
6.2.1Mobile technology for development
Data gatheringNokia Data Gathering software continued to be taken up by government and non-profit clients. With this system, organizations can replace traditional data-gathering methods (such as paper questionnaires) with mobile phones. By transmitting data in real time rather than relying on carrying paper around, this system saves organizations a great deal of time. It also saves money because it removes the need to duplicate data entries from form to form. Most importantly, it improves outcomes.
In 2008, we reported the first case of Nokia Data Gathering used to manage a dengue fever outbreak in the Amazon. In 2009, the number of cases of dengue fever fell by 90 percent. This result was due to a concerted effort by local authorities, and we believe the software played an important role in helping to identify the precise location of dengue larvae and enabling faster response times. We cannot claim that the software was responsible for this great result, however, because speed is so important to identifying and eradicating dengue larvae, being able to transmit GPS-precise data in real-time made a big difference.
This software was also adopted by the Liberian government for use in a birth and death registration system. Liberia has re-emerged as a vibrant, independent country after its civil conflict. By properly recognizing and identifying its citizens, such a system will help Liberia establish and protect important rights, such as eligibility for pensions and ownership of property. In addition to these cases in Liberia and Brazil, we have seen uptake of the software by others across a wide variety of organizations, geographies and sectors. We aim to share the details of these projects in future at www.nokia.com
Education deliveryThe Nokia Education Delivery is a software set-up that allows high-quality education materials to be delivered to schools over mobile networks. This system expanded in 2009, due to the growth of mobile networks across the world. Following the success of the project in the Philippines, where it has improved access to materials for one million children, we donated software licenses to build a similar project in Tanzania. Led by the Tanzanian Ministry of Education and Vocational Training, the project has already reached tens of thousands of children. It succeeds largely due to the unique partnership structure, drawing on the strengths of organizations like the Pearson Foundation, Vodacom, USAID and the International Youth Foundation. We are expecting Latin America to take up the system in 2010.
Page 67Nokia sustainability report2009
6.0Supply chain
6.2.1Mobile technology for development
Navigation bar
Contents 21.0 CEO’s Message 3 2.0 Nokia in 2009 63.0 About the report 94.0 Employees 29 5.0 Supply chain 54 6.0 Corporate social investment 64 7.0 Environment 718.0 Operation 999.0 Key data 2009 11310.0 Independent Assurance 13311.0 Global Reporting Initiative Index 2009 138
continued...
6.1 Corporate social investment strategy 656.2 The development of our corporate social 66
investment programming 6.2.1 Mobile technology for development 67 6.2.2 Youth development 696.3 Disaster relief 706.4 Employee volunteering 70
Nokia Education Delivery relies on the use of one phone per classroom. However, in 2009, we also worked with the South African Ministry of Education to prepare a proof-of-concept for individualised mobile learning. The concept is based on the social media application Mxit, which is already used by 18 million youths in South Africa. The project covered eight schools and 280 students across the country, with encouraging results. As a result, we aim to extend the concept to 30 schools and 3,000 students in 2010. We also plan to test the same concept in Finland in 2010, with a view to rolling it out elsewhere.
Another educational program we funded is the mobilisation of our Ekapeli software. This software, created originally for PCs used by the University of Jyväskylä, helps students with dyslexia learn by taking part in a game. Students playing the game on the phone saw greater improvement than students using the same game on a PC – a surprising result, because it had been assumed that the smaller screen would be less engaging. It has been suggested that the benefit of playing the game on a phone is that it allows shorterbut more frequent interactions.
Page 68Nokia sustainability report2009
6.0Supply chain
6.2.1Mobile technology for development (continued)
Navigation bar
Contents 21.0 CEO’s Message 3 2.0 Nokia in 2009 63.0 About the report 94.0 Employees 29 5.0 Supply chain 54 6.0 Corporate social investment 64 7.0 Environment 718.0 Operation 999.0 Key data 2009 11310.0 Independent Assurance 13311.0 Global Reporting Initiative Index 2009 138
6.1 Corporate social investment strategy 656.2 The development of our corporate social 66
investment programming 6.2.1 Mobile technology for development 67 6.2.2 Youth development 696.3 Disaster relief 706.4 Employee volunteering 70
6.2.2Youth development
In 2009, we continued to support a diverse range of youth development projects across the world, all aimed at addressing needs identified by local partners. Nokia’s youth life skills initiative with the International Youth Foundation continued to deliver benefits to youth and communities in more than 20 countries. This included an expansion of our commitment to the Inter-American Development Bank’s Entra 21 (employability) program in Latin America. Nokia’s participation in Entra 21 is now entering its fifth year and has opened doors for thousands of disadvantaged young people.
Across Africa, we continued to support the work of Plan in projects designed to improve awareness of child rights. These projects, spanning 15 countries, highlight the different needs across regions and within them. While not drawing on mobile communications in their program design, we are currently reviewing whether similarly modelled projects can be enhanced through the introduction of readily available and affordable technology.
The evolution of our approach towards UNESCO’s Education for All goals will result in further investment in youth programs, as educational projects tend to skew towards younger audiences. It will also see a search for concepts that we can scale up without a linear increase in cost. This is important because we want to have a positive impact on a global scale. The changes we plan for 2010-2015 mean stronger participation in achieving communities’ educational goals.
Page 69Nokia sustainability report2009
6.0Supply chain
6.2.2Youth development
Navigation bar
Contents 21.0 CEO’s Message 3 2.0 Nokia in 2009 63.0 About the report 94.0 Employees 29 5.0 Supply chain 54 6.0 Corporate social investment 64 7.0 Environment 718.0 Operation 999.0 Key data 2009 11310.0 Independent Assurance 13311.0 Global Reporting Initiative Index 2009 138
6.1 Corporate social investment strategy 656.2 The development of our corporate social 66
investment programming 6.2.1 Mobile technology for development 67 6.2.2 Youth development 696.3 Disaster relief 706.4 Employee volunteering 70
6.3Disaster relief
We try to respond to disaster crises appropriately, working together with our non-profit partners around the world. Our response depends on the severity of the situation, our presence and ability to make a meaningful contribution. In 2009, we gave financial or in-kind support in several locations, including Chile, the Philippines and Indonesia.
In 2010, we are focussing more on disaster preparedness including the development of mobile based tools and applications. We believe there are ways that mobile technology can greatly improve the ability of organizations to respond more quickly and effectively. Furthermore we intend to explore ways to deployour knowledge and skills for the benefit of disaster relief efforts.
6.4Employee volunteering
Employee volunteering is an important part of Nokia’s global corporate responsibility approach. Every year, thousands of our employees contribute their time and effort to worthy causes in their communities.For more about employee volunteering, see Working together, making a difference.
6.4Employee volunteering
Page 70Nokia sustainability report2009
6.3Disaster relief
6.0Supply chain
Navigation bar
Contents 21.0 CEO’s Message 3 2.0 Nokia in 2009 63.0 About the report 94.0 Employees 29 5.0 Supply chain 54 6.0 Corporate social investment 64 7.0 Environment 718.0 Operation 999.0 Key data 2009 11310.0 Independent Assurance 13311.0 Global Reporting Initiative Index 2009 138
6.1 Corporate social investment strategy 656.2 The development of our corporate social 66
investment programming 6.2.1 Mobile technology for development 67 6.2.2 Youth development 696.3 Disaster relief 706.4 Employee volunteering 70
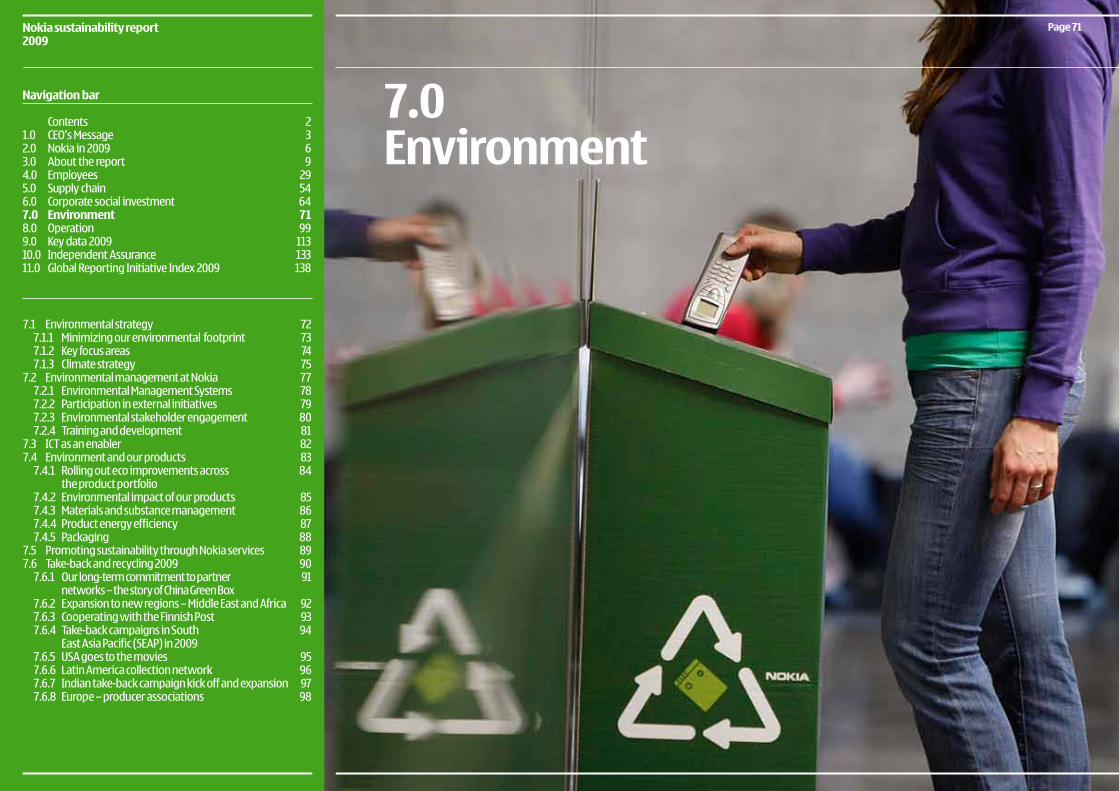
Page 71Nokia sustainability report2009
Navigation bar
Contents 21.0 CEO’s Message 3 2.0 Nokia in 2009 63.0 About the report 94.0 Employees 29 5.0 Supply chain 54 6.0 Corporate social investment 64 7.0 Environment 718.0 Operation 999.0 Key data 2009 11310.0 Independent Assurance 13311.0 Global Reporting Initiative Index 2009 138
7.0Environment
7.1 Environmental strategy 72 7.1.1 Minimizing our environmental footprint 73 7.1.2 Key focus areas 74 7.1.3 Climate strategy 757.2 Environmental management at Nokia 77 7.2.1 Environmental Management Systems 78 7.2.2 Participation in external initiatives 79 7.2.3 Environmental stakeholder engagement 80 7.2.4 Training and development 817.3 ICT as an enabler 827.4 Environment and our products 83 7.4.1 Rolling out eco improvements across 84
the product portfolio 7.4.2 Environmental impact of our products 85 7.4.3 Materials and substance management 86 7.4.4 Product energy efficiency 87 7.4.5 Packaging 887.5 Promoting sustainability through Nokia services 897.6 Take-back and recycling 2009 90 7.6.1 Our long-term commitment to partner 91
networks – the story of China Green Box 7.6.2 Expansion to new regions – Middle East and Africa 92 7.6.3 Cooperating with the Finnish Post 93 7.6.4 Take-back campaigns in South 94
East Asia Pacific (SEAP) in 2009 7.6.5 USA goes to the movies 95 7.6.6 Latin America collection network 96 7.6.7 Indian take-back campaign kick off and expansion 97 7.6.8 Europe – producer associations 98
7.1Environmental strategy
Nokia aims to be a leading company in environmental performance. Our vision is a world where everyone is connected and contributing to sustainable development. We want to shape our industry and drive best practices in this area.
We recognize the importance of evaluating our value chain’s use of ecosystem elements like water and fibre as well as our emissions to the environment. We have started to study this more closely using different analytical methods.
In 2009, we continued to look for possibilities to reduce the environmental impact of our devices and operations. The areas we looked at included our use of materials, energy efficiency, our take-back of used products and the eco services we provide with our phones to help people make sustainable choices and consider the environment in their everyday lives. More than one billion people use a Nokia phone, so we have a unique opportunity to make an impact that goes beyond our own activities.
Page 72Nokia sustainability report2009
7.1Environmental strategy
7.0Environment
Navigation bar
Contents 21.0 CEO’s Message 3 2.0 Nokia in 2009 63.0 About the report 94.0 Employees 29 5.0 Supply chain 54 6.0 Corporate social investment 64 7.0 Environment 718.0 Operation 999.0 Key data 2009 11310.0 Independent Assurance 13311.0 Global Reporting Initiative Index 2009 138
7.1 Environmental strategy 72 7.1.1 Minimizing our environmental footprint 73 7.1.2 Key focus areas 74 7.1.3 Climate strategy 757.2 Environmental management at Nokia 77 7.2.1 Environmental Management Systems 78 7.2.2 Participation in external initiatives 79 7.2.3 Environmental stakeholder engagement 80 7.2.4 Training and development 817.3 ICT as an enabler 827.4 Environment and our products 83 7.4.1 Rolling out eco improvements across 84
the product portfolio 7.4.2 Environmental impact of our products 85 7.4.3 Materials and substance management 86 7.4.4 Product energy efficiency 87 7.4.5 Packaging 887.5 Promoting sustainability through Nokia services 897.6 Take-back and recycling 2009 90 7.6.1 Our long-term commitment to partner 91
networks – the story of China Green Box 7.6.2 Expansion to new regions – Middle East and Africa 92 7.6.3 Cooperating with the Finnish Post 93 7.6.4 Take-back campaigns in South 94
East Asia Pacific (SEAP) in 2009 7.6.5 USA goes to the movies 95 7.6.6 Latin America collection network 96 7.6.7 Indian take-back campaign kick off and expansion 97 7.6.8 Europe – producer associations 98
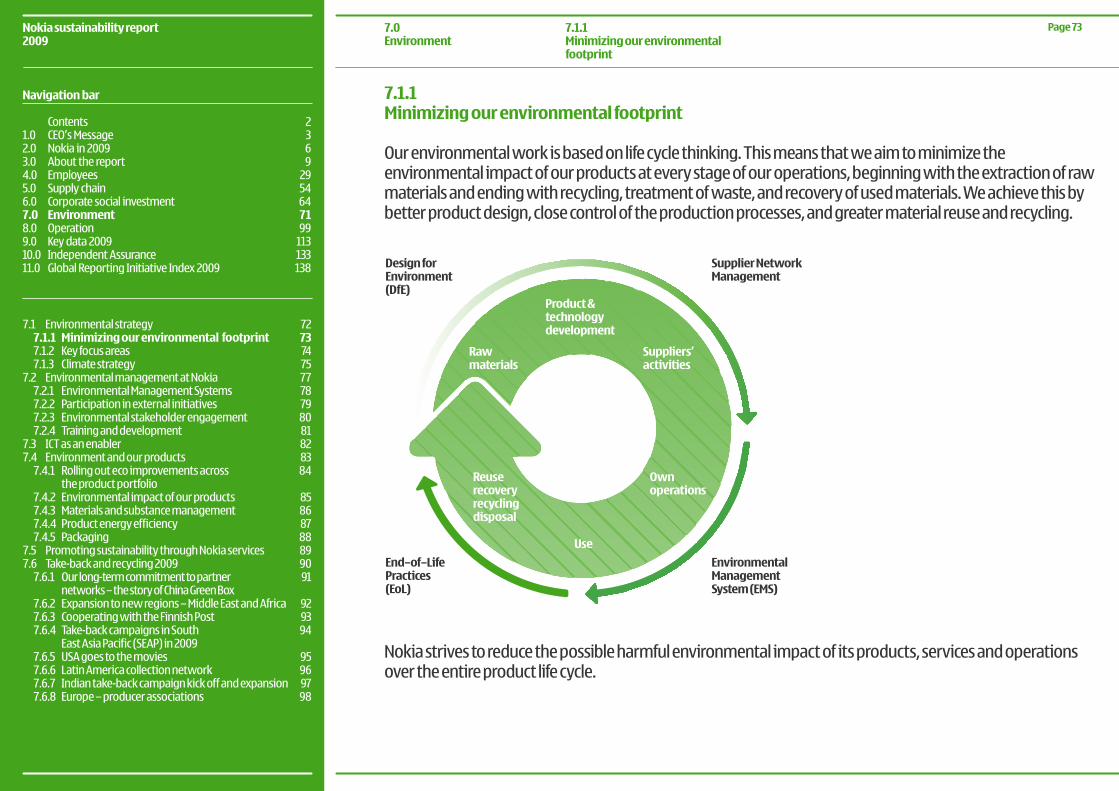
7.1.1Minimizing our environmental footprint
Our environmental work is based on life cycle thinking. This means that we aim to minimize the environmental impact of our products at every stage of our operations, beginning with the extraction of raw materials and ending with recycling, treatment of waste, and recovery of used materials. We achieve this by better product design, close control of the production processes, and greater material reuse and recycling.
Nokia strives to reduce the possible harmful environmental impact of its products, services and operations over the entire product life cycle.
Page 73Nokia sustainability report2009
7.1.1Minimizing our environmental footprint
7.0Environment
Design forEnvironment(DfE)
Supplier NetworkManagement
EnvironmentalManagementSystem (EMS)
Use
Product & technologydevelopment
Suppliers’activities
Ownoperations
Rawmaterials
Reuserecoveryrecyclingdisposal
End–of–LifePractices(EoL)
Navigation bar
Contents 21.0 CEO’s Message 3 2.0 Nokia in 2009 63.0 About the report 94.0 Employees 29 5.0 Supply chain 54 6.0 Corporate social investment 64 7.0 Environment 718.0 Operation 999.0 Key data 2009 11310.0 Independent Assurance 13311.0 Global Reporting Initiative Index 2009 138
7.1 Environmental strategy 72 7.1.1 Minimizing our environmental footprint 73 7.1.2 Key focus areas 74 7.1.3 Climate strategy 757.2 Environmental management at Nokia 77 7.2.1 Environmental Management Systems 78 7.2.2 Participation in external initiatives 79 7.2.3 Environmental stakeholder engagement 80 7.2.4 Training and development 817.3 ICT as an enabler 827.4 Environment and our products 83 7.4.1 Rolling out eco improvements across 84
the product portfolio 7.4.2 Environmental impact of our products 85 7.4.3 Materials and substance management 86 7.4.4 Product energy efficiency 87 7.4.5 Packaging 887.5 Promoting sustainability through Nokia services 897.6 Take-back and recycling 2009 90 7.6.1 Our long-term commitment to partner 91
networks – the story of China Green Box 7.6.2 Expansion to new regions – Middle East and Africa 92 7.6.3 Cooperating with the Finnish Post 93 7.6.4 Take-back campaigns in South 94
East Asia Pacific (SEAP) in 2009 7.6.5 USA goes to the movies 95 7.6.6 Latin America collection network 96 7.6.7 Indian take-back campaign kick off and expansion 97 7.6.8 Europe – producer associations 98
7.1.2Key focus areas
Our environmental efforts focus on four issues: Substance management. We work closely with our suppliers and require full declaration of the substances we use in our devices. Our work is based on the precautionary principle and we aim to continuously reduce the amount of substances of concern. We also explore opportunities for using new, more environmentally friendly materials.
Energy efficiency:Over the last decade, we have reduced the average no-load energy consumption of our chargers (the amount of energy the charger continues to consume after the phone has already charged) by over 80 percent, and our best-in-class chargers by over 95 percent. We also work to reduce the energy consumption of our own operations, as well as contributing generally to reducing energy by the nature of the products and services we make – for instance, through dematerialization (removing the need for a hard product by introducing an equivalent internet service).
Take-back and recycling:We take part in collective recycling schemes with other equipment manufacturers in Europe and Australia and have our own 5,000 collection points for recycling used mobile devices and accessories in around 85 countries. We also engage in local recycling awareness with retailers, operators, other manufacturers and authorities around the world. We work with qualified recyclers to ensure that obsolete devices are treated and disposed of properly at the end of their lives.
Promoting sustainability through services and software:We have developed eco services for our phones to help people to make sustainable choices and consider the environment in their everyday lives. A variety of eco services are freely downloadable in Nokia devices and Ovi Store.
Page 74Nokia sustainability report2009
7.1.2Key focus areas
7.0Environment
Navigation bar
Contents 21.0 CEO’s Message 3 2.0 Nokia in 2009 63.0 About the report 94.0 Employees 29 5.0 Supply chain 54 6.0 Corporate social investment 64 7.0 Environment 718.0 Operation 999.0 Key data 2009 11310.0 Independent Assurance 13311.0 Global Reporting Initiative Index 2009 138
7.1 Environmental strategy 72 7.1.1 Minimizing our environmental footprint 73 7.1.2 Key focus areas 74 7.1.3 Climate strategy 757.2 Environmental management at Nokia 77 7.2.1 Environmental Management Systems 78 7.2.2 Participation in external initiatives 79 7.2.3 Environmental stakeholder engagement 80 7.2.4 Training and development 817.3 ICT as an enabler 827.4 Environment and our products 83 7.4.1 Rolling out eco improvements across 84
the product portfolio 7.4.2 Environmental impact of our products 85 7.4.3 Materials and substance management 86 7.4.4 Product energy efficiency 87 7.4.5 Packaging 887.5 Promoting sustainability through Nokia services 897.6 Take-back and recycling 2009 90 7.6.1 Our long-term commitment to partner 91
networks – the story of China Green Box 7.6.2 Expansion to new regions – Middle East and Africa 92 7.6.3 Cooperating with the Finnish Post 93 7.6.4 Take-back campaigns in South 94
East Asia Pacific (SEAP) in 2009 7.6.5 USA goes to the movies 95 7.6.6 Latin America collection network 96 7.6.7 Indian take-back campaign kick off and expansion 97 7.6.8 Europe – producer associations 98
7.1.3Climate strategy
Nokia’s climate strategy includes specific targets covering areas that contribute to our direct and indirect CO2 emissions. In 2009, the four main areas continued to be:
•ourproductsandservices•ouroperations•ourfacilities•makingthemostofmobileandvirtualtoolsinourwayofworkingandmanagementpractices
GoalsWe created a climate strategy in 2006. The strategy includes a range of targets (below) marked [V] and our performance in meeting these targets is externally verified. The statement of the latest verification round (June 2010) can be found from our website www.nokia.com/environment
Products and services•Reducetheaveragecharger’sno-loadpowerconsumptionfrom2006levelby50percentbytheend
of 2010 (V). •Continuetostudynewtechnologiesthatuserenewableenergyresources,suchassolarpanelsand
kinetic energy. •Continuetolookatwaystoreducedatacenters’energyconsumption.
Operations (including suppliers and service providers)•Ensurethatimprovementsinenergyefficiencymeetandexceedthegeneralefficiencytargetsperunits
manufactured. •EnsurethatallourkeysupplierssetenergyefficiencyandCO2 reduction targets. •ReduceCO2 emissions associated with logistics by 20 percent below 2008 level by 2012.
Page 75Nokia sustainability report2009
7.1.3Climate strategy
7.0Environment
Navigation bar
Contents 21.0 CEO’s Message 3 2.0 Nokia in 2009 63.0 About the report 94.0 Employees 29 5.0 Supply chain 54 6.0 Corporate social investment 64 7.0 Environment 718.0 Operation 999.0 Key data 2009 11310.0 Independent Assurance 13311.0 Global Reporting Initiative Index 2009 138
continued...
7.1 Environmental strategy 72 7.1.1 Minimizing our environmental footprint 73 7.1.2 Key focus areas 74 7.1.3 Climate strategy 757.2 Environmental management at Nokia 77 7.2.1 Environmental Management Systems 78 7.2.2 Participation in external initiatives 79 7.2.3 Environmental stakeholder engagement 80 7.2.4 Training and development 817.3 ICT as an enabler 827.4 Environment and our products 83 7.4.1 Rolling out eco improvements across 84
the product portfolio 7.4.2 Environmental impact of our products 85 7.4.3 Materials and substance management 86 7.4.4 Product energy efficiency 87 7.4.5 Packaging 887.5 Promoting sustainability through Nokia services 897.6 Take-back and recycling 2009 90 7.6.1 Our long-term commitment to partner 91
networks – the story of China Green Box 7.6.2 Expansion to new regions – Middle East and Africa 92 7.6.3 Cooperating with the Finnish Post 93 7.6.4 Take-back campaigns in South 94
East Asia Pacific (SEAP) in 2009 7.6.5 USA goes to the movies 95 7.6.6 Latin America collection network 96 7.6.7 Indian take-back campaign kick off and expansion 97 7.6.8 Europe – producer associations 98
Facilities•Create6percentofnewenergysavingsintechnicalbuildingmaintenancesystemsbetween2007
and 2012 compared to the baseline year 2006, in addition to the savings of 3.5 percent achieved already in 2003–2006.
•In2009–2010,begindeployinggreenelectricitypurchasestothosecountrieswhereweoperateandwherebuying green electricity makes the most impact on CO2 savings. This will depend on how carbon intensive the local power generation industry is and where green electricity purchases are available.
•ReduceCO2 emissions through these measures by a minimum of 10 percent in 2009 and by a minimumof 18 percent in 2010, compared to a 2006 base year.
Work and management practices •Reducework-relatedtravelandcommutingbyincreasingremoteworkandremoteworkingpossibilities
and reduce office space to gain savings in energy consumption and CO2 emissions. •OfferemployeesthepossibilitytooffsettheirCO2 emissions from air travel. •Useenergy-savingtechnologiesinofficesandinofficeequipment/hardware.
Page 76Nokia sustainability report2009
7.1.3Climate strategy (continued)
7.0Environment
Navigation bar
Contents 21.0 CEO’s Message 3 2.0 Nokia in 2009 63.0 About the report 94.0 Employees 29 5.0 Supply chain 54 6.0 Corporate social investment 64 7.0 Environment 718.0 Operation 999.0 Key data 2009 11310.0 Independent Assurance 13311.0 Global Reporting Initiative Index 2009 138
7.1 Environmental strategy 72 7.1.1 Minimizing our environmental footprint 73 7.1.2 Key focus areas 74 7.1.3 Climate strategy 757.2 Environmental management at Nokia 77 7.2.1 Environmental Management Systems 78 7.2.2 Participation in external initiatives 79 7.2.3 Environmental stakeholder engagement 80 7.2.4 Training and development 817.3 ICT as an enabler 827.4 Environment and our products 83 7.4.1 Rolling out eco improvements across 84
the product portfolio 7.4.2 Environmental impact of our products 85 7.4.3 Materials and substance management 86 7.4.4 Product energy efficiency 87 7.4.5 Packaging 887.5 Promoting sustainability through Nokia services 897.6 Take-back and recycling 2009 90 7.6.1 Our long-term commitment to partner 91
networks – the story of China Green Box 7.6.2 Expansion to new regions – Middle East and Africa 92 7.6.3 Cooperating with the Finnish Post 93 7.6.4 Take-back campaigns in South 94
East Asia Pacific (SEAP) in 2009 7.6.5 USA goes to the movies 95 7.6.6 Latin America collection network 96 7.6.7 Indian take-back campaign kick off and expansion 97 7.6.8 Europe – producer associations 98
7.2Environmental management at Nokia
Our environmental work is based on global principles and standards. Our targets are not driven by mere regulatory compliance but are set clearly beyond mandatory legal requirements. Environmental issues are fully integrated in our business activities and are the responsibility of everyone at Nokia.
Environmental issues are part of the responsibility of The Corporate Responsibility Steering Group. This Group is made up of top managers of business units and corporate functions. It supports our corporate structures in helping to integrate sustainability into our core business for instance through approving the work of the Nokia Sustainability Management Team (NSMT). The NSMT represents all relevant Nokia units, develops and agrees the group-wide sustainability framework containing strategy, targets and priorities.
Our sustainability network acts as a virtual team across the organization and is led by Vice President, Head of Sustainability Operations. Our sustainability teams drive both sustainability initiatives within the business, and monitoring performance across our operations. Each of our key business functions has people responsible for building and implementing processes to achieve our environmental and social targets. Our sustainability framework provides guidelines on embedding our sustainability strategy within our operational planning across the business.
Page 77Nokia sustainability report2009
7.2Environmental managementat Nokia
7.0Environment
Navigation bar
Contents 21.0 CEO’s Message 3 2.0 Nokia in 2009 63.0 About the report 94.0 Employees 29 5.0 Supply chain 54 6.0 Corporate social investment 64 7.0 Environment 718.0 Operation 999.0 Key data 2009 11310.0 Independent Assurance 13311.0 Global Reporting Initiative Index 2009 138
7.1 Environmental strategy 72 7.1.1 Minimizing our environmental footprint 73 7.1.2 Key focus areas 74 7.1.3 Climate strategy 757.2 Environmental management at Nokia 77 7.2.1 Environmental Management Systems 78 7.2.2 Participation in external initiatives 79 7.2.3 Environmental stakeholder engagement 80 7.2.4 Training and development 817.3 ICT as an enabler 827.4 Environment and our products 83 7.4.1 Rolling out eco improvements across 84
the product portfolio 7.4.2 Environmental impact of our products 85 7.4.3 Materials and substance management 86 7.4.4 Product energy efficiency 87 7.4.5 Packaging 887.5 Promoting sustainability through Nokia services 897.6 Take-back and recycling 2009 90 7.6.1 Our long-term commitment to partner 91
networks – the story of China Green Box 7.6.2 Expansion to new regions – Middle East and Africa 92 7.6.3 Cooperating with the Finnish Post 93 7.6.4 Take-back campaigns in South 94
East Asia Pacific (SEAP) in 2009 7.6.5 USA goes to the movies 95 7.6.6 Latin America collection network 96 7.6.7 Indian take-back campaign kick off and expansion 97 7.6.8 Europe – producer associations 98
7.2.1Environmental Management Systems
We use environmental management systems (EMS) and the ISO 14001 standard to control and manage the environmental aspects of our production sites and large offices. Nokia has a corporate level ISO 14001 certificate in place for all production sites. We also require this of our contract manufacturers, and an EMS is one of our supplier requirements. We have also implemented an internally verified EMS in our large offices and R&D sites.
Our environmental management system consists of:•ourEnvironmentalPolicy•identificationofenvironmentalaspects,andevaluationoftheirsignificance•objectivesandprogramsforachievingenvironmentaltargets•compliancewithlegalandotherregulatoryrequirements•audits,assessments,managementreviewsandcontinuousimprovement•operationalmanagement(dataandprocesses)forenergyandwateruse,wasteandwasteutilizationetc
The goal of the Nokia EMS is to improve our environmental performance, focussing on:•energyconsumption(increasetheenergyefficiencyofourproductionprocessesaswellassites)•wastemanagement(avoidgeneratingwaste,increasewasteutilization)•wateruse•airemissions(avoidVOCemissions)•ozone-depletingsubstances
Our environmental management system is integrated with the quality management system and we are using the overall management processes to drive both issues in our production. We have set global guidance and reporting to follow up the agreed activities.
We make sure that we continuously improve and maintain the EMS through updated ISO 14001 audits by external auditing organizations, as well as internal assessments. In the cases where the internal and external audits raise an issue or highlight an action point, we follow it up, correct it and monitor it until it is resolved.
Page 78Nokia sustainability report2009
7.2.1Environmental Management Systems
7.0Environment
Navigation bar
Contents 21.0 CEO’s Message 3 2.0 Nokia in 2009 63.0 About the report 94.0 Employees 29 5.0 Supply chain 54 6.0 Corporate social investment 64 7.0 Environment 718.0 Operation 999.0 Key data 2009 11310.0 Independent Assurance 13311.0 Global Reporting Initiative Index 2009 138
7.1 Environmental strategy 72 7.1.1 Minimizing our environmental footprint 73 7.1.2 Key focus areas 74 7.1.3 Climate strategy 757.2 Environmental management at Nokia 77 7.2.1 Environmental Management Systems 78 7.2.2 Participation in external initiatives 79 7.2.3 Environmental stakeholder engagement 80 7.2.4 Training and development 817.3 ICT as an enabler 827.4 Environment and our products 83 7.4.1 Rolling out eco improvements across 84
the product portfolio 7.4.2 Environmental impact of our products 85 7.4.3 Materials and substance management 86 7.4.4 Product energy efficiency 87 7.4.5 Packaging 887.5 Promoting sustainability through Nokia services 897.6 Take-back and recycling 2009 90 7.6.1 Our long-term commitment to partner 91
networks – the story of China Green Box 7.6.2 Expansion to new regions – Middle East and Africa 92 7.6.3 Cooperating with the Finnish Post 93 7.6.4 Take-back campaigns in South 94
East Asia Pacific (SEAP) in 2009 7.6.5 USA goes to the movies 95 7.6.6 Latin America collection network 96 7.6.7 Indian take-back campaign kick off and expansion 97 7.6.8 Europe – producer associations 98
7.2.2Participation in external initiatives
We continue to investigate opportunities to join further voluntary initiatives to promote energy efficiency across the industry. One way we achieve these is by providing solutions and influencing policy makers to realise the role and potential of ICT in reducing economies’ overall energy consumption when addressing climate change policies.
Since January 2008, we have been a member of WWF’s Climate Savers, a program where WWF and businesses collaborate to address climate change. Being a member of this program reinforces our commitment to energy saving in our operations, ways of working and products.
In 2009, Nokia joined the UN Global Compact’s Caring for Climate initiative, and took part in WWF’sEarth Hour globally.
Page 79Nokia sustainability report2009
7.2.2Participation in external initiatives
7.0Environment
Navigation bar
Contents 21.0 CEO’s Message 3 2.0 Nokia in 2009 63.0 About the report 94.0 Employees 29 5.0 Supply chain 54 6.0 Corporate social investment 64 7.0 Environment 718.0 Operation 999.0 Key data 2009 11310.0 Independent Assurance 13311.0 Global Reporting Initiative Index 2009 138
7.1 Environmental strategy 72 7.1.1 Minimizing our environmental footprint 73 7.1.2 Key focus areas 74 7.1.3 Climate strategy 757.2 Environmental management at Nokia 77 7.2.1 Environmental Management Systems 78 7.2.2 Participation in external initiatives 79 7.2.3 Environmental stakeholder engagement 80 7.2.4 Training and development 817.3 ICT as an enabler 827.4 Environment and our products 83 7.4.1 Rolling out eco improvements across 84
the product portfolio 7.4.2 Environmental impact of our products 85 7.4.3 Materials and substance management 86 7.4.4 Product energy efficiency 87 7.4.5 Packaging 887.5 Promoting sustainability through Nokia services 897.6 Take-back and recycling 2009 90 7.6.1 Our long-term commitment to partner 91
networks – the story of China Green Box 7.6.2 Expansion to new regions – Middle East and Africa 92 7.6.3 Cooperating with the Finnish Post 93 7.6.4 Take-back campaigns in South 94
East Asia Pacific (SEAP) in 2009 7.6.5 USA goes to the movies 95 7.6.6 Latin America collection network 96 7.6.7 Indian take-back campaign kick off and expansion 97 7.6.8 Europe – producer associations 98
7.2.3 Environmental stakeholder engagement
We believe we can maximize our environmental contribution by working with others in our industry and beyond. In 2009, we continued our global cooperation with WWF by focusing on raising environmental awareness among our employees. WWF provided environmental training material for our employee training modules, and employees took part in WWF’s One Planet Leaders training.
WWF representatives attended and presented at various Nokia events, such as virtual info sessions and sustainability forums. WWF has also worked with us on bio-regional environmental impact assessmentsin some of our sites, as well as providing content for the mobile sustainability services we offer through Ovi.Together with WWF and the International Union for the Conservation of Nature (IUCN), we continued to develop connect2earth.org, an online green community. The service was launched in early 2008 as a wayfor young people to share their ideas about the environment through images, videos and writing. During 2009 we provided expert points of view on topics such as climate change, renewable energy and natural habitats and encouraged participants to discuss and share ideas.
Active contributors from the community were rewarded with a trip to Copenhagen to take part in WWFand IUCN activities during the climate change negotiations in December 2009.
Nokia also continued supporting several environmental initiatives all over the world, as covered in other sections of this report.
Page 80Nokia sustainability report2009
7.2.3 Environmental stakeholder engagement
7.0Environment
Navigation bar
Contents 21.0 CEO’s Message 3 2.0 Nokia in 2009 63.0 About the report 94.0 Employees 29 5.0 Supply chain 54 6.0 Corporate social investment 64 7.0 Environment 718.0 Operation 999.0 Key data 2009 11310.0 Independent Assurance 13311.0 Global Reporting Initiative Index 2009 138
7.1 Environmental strategy 72 7.1.1 Minimizing our environmental footprint 73 7.1.2 Key focus areas 74 7.1.3 Climate strategy 757.2 Environmental management at Nokia 77 7.2.1 Environmental Management Systems 78 7.2.2 Participation in external initiatives 79 7.2.3 Environmental stakeholder engagement 80 7.2.4 Training and development 817.3 ICT as an enabler 827.4 Environment and our products 83 7.4.1 Rolling out eco improvements across 84
the product portfolio 7.4.2 Environmental impact of our products 85 7.4.3 Materials and substance management 86 7.4.4 Product energy efficiency 87 7.4.5 Packaging 887.5 Promoting sustainability through Nokia services 897.6 Take-back and recycling 2009 90 7.6.1 Our long-term commitment to partner 91
networks – the story of China Green Box 7.6.2 Expansion to new regions – Middle East and Africa 92 7.6.3 Cooperating with the Finnish Post 93 7.6.4 Take-back campaigns in South 94
East Asia Pacific (SEAP) in 2009 7.6.5 USA goes to the movies 95 7.6.6 Latin America collection network 96 7.6.7 Indian take-back campaign kick off and expansion 97 7.6.8 Europe – producer associations 98
7.2.4 Training and development
Our employees can take part in a wide range of internal events and training that help raise awareness and develop understanding of environmental issues, both inside and outside the company.
We hold global sustainability forums (previously known as eco-forums) twice a year. These bring together senior management and employees to engage in open dialogue around our environmental strategic directions and activities. They are supported by area forums, which focus on environmental issues from a regional perspective.
We regularly run a series of environmental virtual information sessions covering a wide range of topics related to our environmental work. Presented by both internal and external experts, these sessions are held as online teleconferences, which makes it possible to join from anywhere in the word. Fourteen environmental virtual information sessions were held in 2009.
Environmental road shows are held regularly at our offices and production sites throughout all regions. Helping to increase environmental awareness, the road shows focus on environmental issues at both a Nokia-level as well as a site specific-level, while also providing tips about how to make sustainable choices in everyday life.
In 2009, we continued to offer a platform for We:champions, an internal volunteer program for people who are interested in environmental matters and want to play an active role in driving internal environmental improvements even further. We highlight our strategic environmental focus areas in our internal employee engagement activities and in 2009 we ran internal energy-saving campaigns at our sites.
Page 81Nokia sustainability report2009
7.2.4 Training and development
7.0Environment
Navigation bar
Contents 21.0 CEO’s Message 3 2.0 Nokia in 2009 63.0 About the report 94.0 Employees 29 5.0 Supply chain 54 6.0 Corporate social investment 64 7.0 Environment 718.0 Operation 999.0 Key data 2009 11310.0 Independent Assurance 13311.0 Global Reporting Initiative Index 2009 138
7.1 Environmental strategy 72 7.1.1 Minimizing our environmental footprint 73 7.1.2 Key focus areas 74 7.1.3 Climate strategy 757.2 Environmental management at Nokia 77 7.2.1 Environmental Management Systems 78 7.2.2 Participation in external initiatives 79 7.2.3 Environmental stakeholder engagement 80 7.2.4 Training and development 817.3 ICT as an enabler 827.4 Environment and our products 83 7.4.1 Rolling out eco improvements across 84
the product portfolio 7.4.2 Environmental impact of our products 85 7.4.3 Materials and substance management 86 7.4.4 Product energy efficiency 87 7.4.5 Packaging 887.5 Promoting sustainability through Nokia services 897.6 Take-back and recycling 2009 90 7.6.1 Our long-term commitment to partner 91
networks – the story of China Green Box 7.6.2 Expansion to new regions – Middle East and Africa 92 7.6.3 Cooperating with the Finnish Post 93 7.6.4 Take-back campaigns in South 94
East Asia Pacific (SEAP) in 2009 7.6.5 USA goes to the movies 95 7.6.6 Latin America collection network 96 7.6.7 Indian take-back campaign kick off and expansion 97 7.6.8 Europe – producer associations 98
7.3ICT as an enabler
There is good evidence that information and communications technology (ICT) makes a major contribution to GDP growth while at the same time reducing general energy use. ICT-based services and working methods such as remote working and video conferencing can also result in lower overall CO2 emissions.The environmental gains from using an ICT service rather than a product, known as dematerialization, can be significant. Convergence, or incorporating the functions of several products into one product, can further contribute to dematerialization and energy efficiency.
In 2009, we continued to collect and communicate cases where mobile technology has led to a reduction in energy consumption and CO2 emissions. The views of Nokia CEO, Olli-Pekka Kallasvuo on climate change have been covered in several international newspapers and magazines
Page 82Nokia sustainability report2009
7.3ICT as an enabler
7.0Environment
Navigation bar
Contents 21.0 CEO’s Message 3 2.0 Nokia in 2009 63.0 About the report 94.0 Employees 29 5.0 Supply chain 54 6.0 Corporate social investment 64 7.0 Environment 718.0 Operation 999.0 Key data 2009 11310.0 Independent Assurance 13311.0 Global Reporting Initiative Index 2009 138
7.1 Environmental strategy 72 7.1.1 Minimizing our environmental footprint 73 7.1.2 Key focus areas 74 7.1.3 Climate strategy 757.2 Environmental management at Nokia 77 7.2.1 Environmental Management Systems 78 7.2.2 Participation in external initiatives 79 7.2.3 Environmental stakeholder engagement 80 7.2.4 Training and development 817.3 ICT as an enabler 827.4 Environment and our products 83 7.4.1 Rolling out eco improvements across 84
the product portfolio 7.4.2 Environmental impact of our products 85 7.4.3 Materials and substance management 86 7.4.4 Product energy efficiency 87 7.4.5 Packaging 887.5 Promoting sustainability through Nokia services 897.6 Take-back and recycling 2009 90 7.6.1 Our long-term commitment to partner 91
networks – the story of China Green Box 7.6.2 Expansion to new regions – Middle East and Africa 92 7.6.3 Cooperating with the Finnish Post 93 7.6.4 Take-back campaigns in South 94
East Asia Pacific (SEAP) in 2009 7.6.5 USA goes to the movies 95 7.6.6 Latin America collection network 96 7.6.7 Indian take-back campaign kick off and expansion 97 7.6.8 Europe – producer associations 98
7.4Environment and our products At Nokia, we take the impact of our activities on the environment seriously. The way we make productsis guided by life cycle thinking, where we aim to minimize the environmental impacts of a product at every stage of its life, from manufacture through to use and disposal.
Life cycle assessments help us identify and focus on the areas where we can make the biggest contribution to reducing impacts. Our approach is to continuously improve the environmental sustainability of all our products.
During a product’s creation we focus on energy efficiency, sustainable use of materials and smart, sustainable packaging. We choose the materials for our products and packaging with the environment in mind.
We have also improved the energy efficiency of our products when they are in use. For example, we have developed a feature in our devices that reminds you to unplug your charger when the battery is full. With over a billion people using Nokia phones around the world, small steps like these make a big difference.
By providing tutorials, green pages in our products’ user guides, eco applications and services, we increase awareness of environmental choices and promote a sustainable way of living for our customers. At the endof a product’s life, we have effective practices such as take-back schemes www.nokia.com/environmentthat put energy and valuable materials back into circulation, starting the life cycle process again.
Page 83Nokia sustainability report2009
7.4Environment and our products
7.0Environment
Navigation bar
Contents 21.0 CEO’s Message 3 2.0 Nokia in 2009 63.0 About the report 94.0 Employees 29 5.0 Supply chain 54 6.0 Corporate social investment 64 7.0 Environment 718.0 Operation 999.0 Key data 2009 11310.0 Independent Assurance 13311.0 Global Reporting Initiative Index 2009 138
7.1 Environmental strategy 72 7.1.1 Minimizing our environmental footprint 73 7.1.2 Key focus areas 74 7.1.3 Climate strategy 757.2 Environmental management at Nokia 77 7.2.1 Environmental Management Systems 78 7.2.2 Participation in external initiatives 79 7.2.3 Environmental stakeholder engagement 80 7.2.4 Training and development 817.3 ICT as an enabler 827.4 Environment and our products 83 7.4.1 Rolling out eco improvements across 84
the product portfolio 7.4.2 Environmental impact of our products 85 7.4.3 Materials and substance management 86 7.4.4 Product energy efficiency 87 7.4.5 Packaging 887.5 Promoting sustainability through Nokia services 897.6 Take-back and recycling 2009 90 7.6.1 Our long-term commitment to partner 91
networks – the story of China Green Box 7.6.2 Expansion to new regions – Middle East and Africa 92 7.6.3 Cooperating with the Finnish Post 93 7.6.4 Take-back campaigns in South 94
East Asia Pacific (SEAP) in 2009 7.6.5 USA goes to the movies 95 7.6.6 Latin America collection network 96 7.6.7 Indian take-back campaign kick off and expansion 97 7.6.8 Europe – producer associations 98
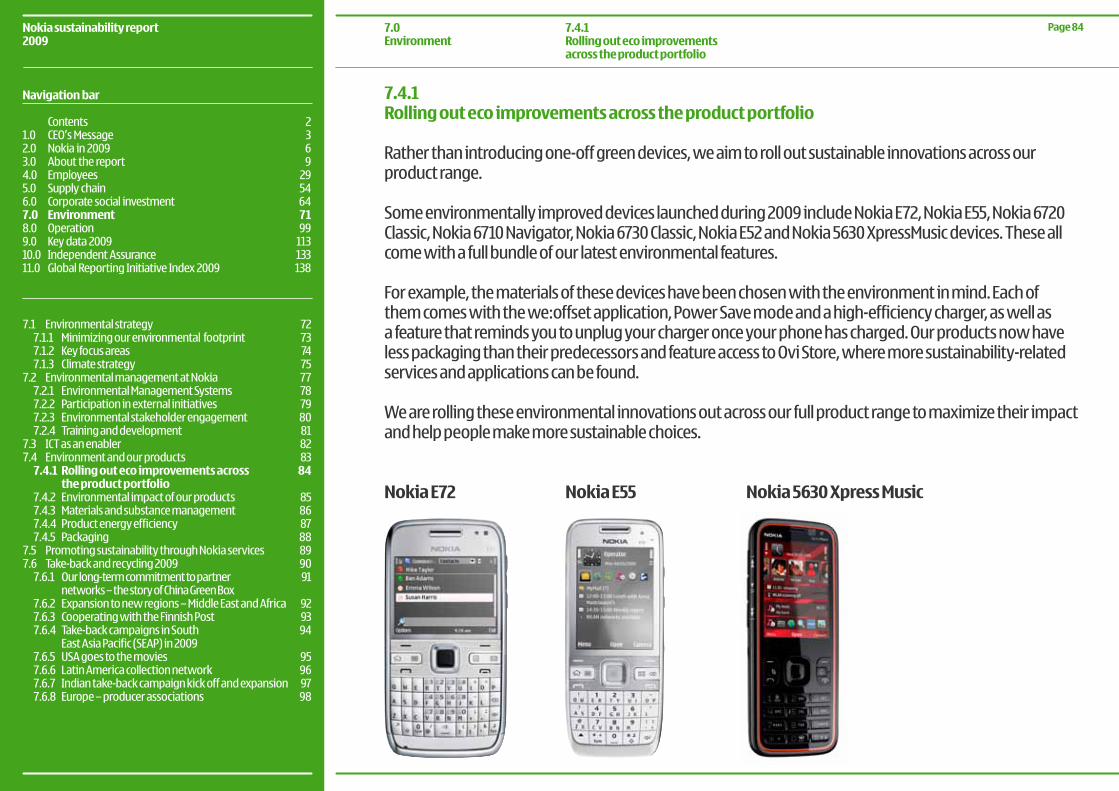
7.4.1Rolling out eco improvements across the product portfolio
Rather than introducing one-off green devices, we aim to roll out sustainable innovations across our product range.
Some environmentally improved devices launched during 2009 include Nokia E72, Nokia E55, Nokia 6720 Classic, Nokia 6710 Navigator, Nokia 6730 Classic, Nokia E52 and Nokia 5630 XpressMusic devices. These all come with a full bundle of our latest environmental features.
For example, the materials of these devices have been chosen with the environment in mind. Each of them comes with the we:offset application, Power Save mode and a high-efficiency charger, as well as a feature that reminds you to unplug your charger once your phone has charged. Our products now have less packaging than their predecessors and feature access to Ovi Store, where more sustainability-related services and applications can be found.
We are rolling these environmental innovations out across our full product range to maximize their impact and help people make more sustainable choices.
Nokia E55 Nokia 5630 Xpress MusicNokia E72
Page 84Nokia sustainability report2009
7.4.1Rolling out eco improvements across the product portfolio
7.0Environment
Navigation bar
Contents 21.0 CEO’s Message 3 2.0 Nokia in 2009 63.0 About the report 94.0 Employees 29 5.0 Supply chain 54 6.0 Corporate social investment 64 7.0 Environment 718.0 Operation 999.0 Key data 2009 11310.0 Independent Assurance 13311.0 Global Reporting Initiative Index 2009 138
7.1 Environmental strategy 72 7.1.1 Minimizing our environmental footprint 73 7.1.2 Key focus areas 74 7.1.3 Climate strategy 757.2 Environmental management at Nokia 77 7.2.1 Environmental Management Systems 78 7.2.2 Participation in external initiatives 79 7.2.3 Environmental stakeholder engagement 80 7.2.4 Training and development 817.3 ICT as an enabler 827.4 Environment and our products 83 7.4.1 Rolling out eco improvements across 84
the product portfolio 7.4.2 Environmental impact of our products 85 7.4.3 Materials and substance management 86 7.4.4 Product energy efficiency 87 7.4.5 Packaging 887.5 Promoting sustainability through Nokia services 897.6 Take-back and recycling 2009 90 7.6.1 Our long-term commitment to partner 91
networks – the story of China Green Box 7.6.2 Expansion to new regions – Middle East and Africa 92 7.6.3 Cooperating with the Finnish Post 93 7.6.4 Take-back campaigns in South 94
East Asia Pacific (SEAP) in 2009 7.6.5 USA goes to the movies 95 7.6.6 Latin America collection network 96 7.6.7 Indian take-back campaign kick off and expansion 97 7.6.8 Europe – producer associations 98
7.4.2Environmental impact of our products
During 2009, we published the results of a life cycle assessment made of a typical Nokia mobile device. This assessment measured the energy consumed across the entire life cycle of the device, from the acquisition of raw materials and the production of the device to using it and, ultimately, recycling it when it reaches the end of its life.
The amount of energy consumed during the entire life cycle is around 270 megajoules (MJ), of which roughly half is consumed during the acquisition of raw materials and the manufacturing of components. Our mobile device production facilities account for three percent of our total energy consumption, transportation is 18 percent, device usage 30 percent, and recycling one percent. Read more from our webiste www.nokia.com/lca
Page 85Nokia sustainability report2009
7.4.2Environmental impact of our products
7.0Environment
Navigation bar
Contents 21.0 CEO’s Message 3 2.0 Nokia in 2009 63.0 About the report 94.0 Employees 29 5.0 Supply chain 54 6.0 Corporate social investment 64 7.0 Environment 718.0 Operation 999.0 Key data 2009 11310.0 Independent Assurance 13311.0 Global Reporting Initiative Index 2009 138
7.1 Environmental strategy 72 7.1.1 Minimizing our environmental footprint 73 7.1.2 Key focus areas 74 7.1.3 Climate strategy 757.2 Environmental management at Nokia 77 7.2.1 Environmental Management Systems 78 7.2.2 Participation in external initiatives 79 7.2.3 Environmental stakeholder engagement 80 7.2.4 Training and development 817.3 ICT as an enabler 827.4 Environment and our products 83 7.4.1 Rolling out eco improvements across 84
the product portfolio 7.4.2 Environmental impact of our products 85 7.4.3 Materials and substance management 86 7.4.4 Product energy efficiency 87 7.4.5 Packaging 887.5 Promoting sustainability through Nokia services 897.6 Take-back and recycling 2009 90 7.6.1 Our long-term commitment to partner 91
networks – the story of China Green Box 7.6.2 Expansion to new regions – Middle East and Africa 92 7.6.3 Cooperating with the Finnish Post 93 7.6.4 Take-back campaigns in South 94
East Asia Pacific (SEAP) in 2009 7.6.5 USA goes to the movies 95 7.6.6 Latin America collection network 96 7.6.7 Indian take-back campaign kick off and expansion 97 7.6.8 Europe – producer associations 98
7.4.3Materials and substance management
Our main objective is that we know all the substances in our products, not just those that raise concerns, and that they are safe for people and the environment when used in the proper way. All our mobile devices worldwide are fully compliant with the EU Directive on the Restriction of the Use of Certain Hazardous Substances in Electrical and Electronic Equipment (EU RoHS).
We have also voluntarily phased out PVC from all mobile devices and enhancements since 2006. We are voluntarily phasing out the use of brominated and chlorinated compounds and antimony trioxide in our new models. At the end of 2009, 25 new Nokia models were already free of these substances.
Nokia in close cooperation with suppliers is the first mobile phone manufacturer to have full material declaration for all its mobile devices. Our devices and accessories do not contain substances included in the current EU candidate list of Substances of Very High Concern, which the EU REACH legislation requires to be reported. We voluntarily give full information on our substance management in the Nokia Substance List www.nokia.com/substances
Since the introduction of the Nokia 3110 Evolve in 2007, we have continued to research and implement bio-based materials in selected parts of our products.
Page 86Nokia sustainability report2009
7.4.3Materials and substance management
7.0Environment
Navigation bar
Contents 21.0 CEO’s Message 3 2.0 Nokia in 2009 63.0 About the report 94.0 Employees 29 5.0 Supply chain 54 6.0 Corporate social investment 64 7.0 Environment 718.0 Operation 999.0 Key data 2009 11310.0 Independent Assurance 13311.0 Global Reporting Initiative Index 2009 138
7.1 Environmental strategy 72 7.1.1 Minimizing our environmental footprint 73 7.1.2 Key focus areas 74 7.1.3 Climate strategy 757.2 Environmental management at Nokia 77 7.2.1 Environmental Management Systems 78 7.2.2 Participation in external initiatives 79 7.2.3 Environmental stakeholder engagement 80 7.2.4 Training and development 817.3 ICT as an enabler 827.4 Environment and our products 83 7.4.1 Rolling out eco improvements across 84
the product portfolio 7.4.2 Environmental impact of our products 85 7.4.3 Materials and substance management 86 7.4.4 Product energy efficiency 87 7.4.5 Packaging 887.5 Promoting sustainability through Nokia services 897.6 Take-back and recycling 2009 90 7.6.1 Our long-term commitment to partner 91
networks – the story of China Green Box 7.6.2 Expansion to new regions – Middle East and Africa 92 7.6.3 Cooperating with the Finnish Post 93 7.6.4 Take-back campaigns in South 94
East Asia Pacific (SEAP) in 2009 7.6.5 USA goes to the movies 95 7.6.6 Latin America collection network 96 7.6.7 Indian take-back campaign kick off and expansion 97 7.6.8 Europe – producer associations 98
7.4.4Product energy efficiency
We focus on introducing energy saving features throughout our product portfolio, including energy efficient chargers. Over the last decade, we have reduced the average no-load energy consumption of our chargers (in other words, the amount of energy the charger continues to consume if you forget to unplug it from the mains after the phone is fully charged) by over 80 percent, and our best-in-class chargers by over 95 percent. We are well on track to reach our target of reducing no-load power used by our chargers by 50 percent from 2006 to 2010.
We have introduced two new energy efficient chargers during 2009: the Nokia High-Efficiency Charger AC-10 and the Compact Travel Charger AC-15. They consume just 0.03W in no-load mode. This is 90-95 percent less than the amount typical chargers can waste.
The AC-15 features the standard Nokia 2mm charging plug, while the AC-10 provides an energy-efficient option for micro-USB charging. The addition of these to our portfolio of chargers means that, today, most Nokia chargers meet the strictest, five-star charger energy rating criteria. In 2009, most of our new models were shipped with our five-star chargers.
Based on the EU pilot project on Integrated Product Policy, (EU IPP) voluntary agreement, Nokia together with other manufacturers created and began using a Mobile Device Charger Energy Rating at the end of 2008. The star rating is based on the charger’s no-load power consumption. It is shown as a specific label that raises awareness and encourages the use of more energy efficient chargers. All new Nokia chargers are specified to meet the criteria of voluntary agreements such as the EU Code of Conduct and US Environmental Protection Agency’s Energy Star as well as the highest four and five star criteria of EU IPP. Nokia was the first mobile manufacturer to put alerts into mobile devices reminding people to unplug their chargers once they are fully charged. Such alerts are incorporated across our mobile devices range.
All Nokia devices come with energy-saving settings like display time-outs and radio and volume controls.Our mobile devices have also started to feature power save mode and energy-efficient OLED displays.Nokia mobile devices are aligned with EU Directive 2005/32/EC (EuP) and 2009/125/EC (ErP). For mobile devices, Commission Regulation (EC) No 278/2009 of 6 April 2009 is overruling Commission Regulation (EC) No 1275/2008 and therefore Nokia Mobile devices comply with both regulations. Compliance is part of CE marking.
Page 87Nokia sustainability report2009
7.4.4Product energy efficiency
7.0Environment
Navigation bar
Contents 21.0 CEO’s Message 3 2.0 Nokia in 2009 63.0 About the report 94.0 Employees 29 5.0 Supply chain 54 6.0 Corporate social investment 64 7.0 Environment 718.0 Operation 999.0 Key data 2009 11310.0 Independent Assurance 13311.0 Global Reporting Initiative Index 2009 138
7.1 Environmental strategy 72 7.1.1 Minimizing our environmental footprint 73 7.1.2 Key focus areas 74 7.1.3 Climate strategy 757.2 Environmental management at Nokia 77 7.2.1 Environmental Management Systems 78 7.2.2 Participation in external initiatives 79 7.2.3 Environmental stakeholder engagement 80 7.2.4 Training and development 817.3 ICT as an enabler 827.4 Environment and our products 83 7.4.1 Rolling out eco improvements across 84
the product portfolio 7.4.2 Environmental impact of our products 85 7.4.3 Materials and substance management 86 7.4.4 Product energy efficiency 87 7.4.5 Packaging 887.5 Promoting sustainability through Nokia services 897.6 Take-back and recycling 2009 90 7.6.1 Our long-term commitment to partner 91
networks – the story of China Green Box 7.6.2 Expansion to new regions – Middle East and Africa 92 7.6.3 Cooperating with the Finnish Post 93 7.6.4 Take-back campaigns in South 94
East Asia Pacific (SEAP) in 2009 7.6.5 USA goes to the movies 95 7.6.6 Latin America collection network 96 7.6.7 Indian take-back campaign kick off and expansion 97 7.6.8 Europe – producer associations 98
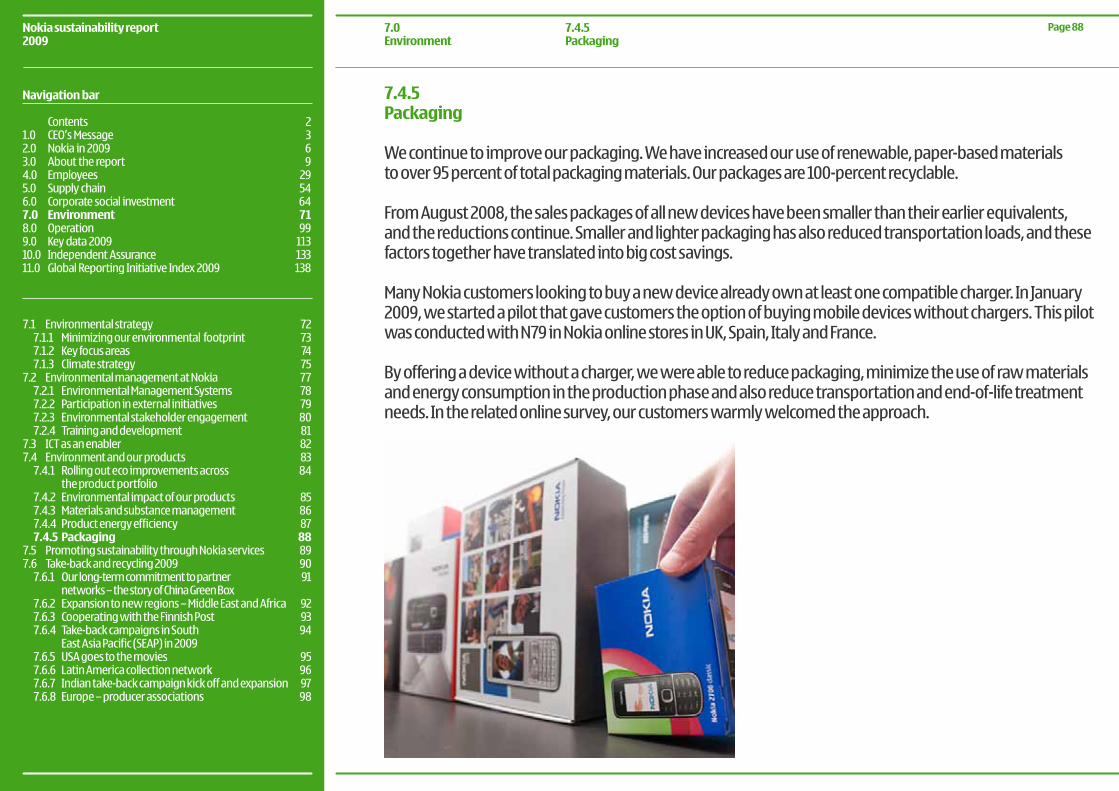
7.4.5Packaging
We continue to improve our packaging. We have increased our use of renewable, paper-based materialsto over 95 percent of total packaging materials. Our packages are 100-percent recyclable.
From August 2008, the sales packages of all new devices have been smaller than their earlier equivalents, and the reductions continue. Smaller and lighter packaging has also reduced transportation loads, and these factors together have translated into big cost savings.
Many Nokia customers looking to buy a new device already own at least one compatible charger. In January 2009, we started a pilot that gave customers the option of buying mobile devices without chargers. This pilot was conducted with N79 in Nokia online stores in UK, Spain, Italy and France.
By offering a device without a charger, we were able to reduce packaging, minimize the use of raw materials and energy consumption in the production phase and also reduce transportation and end-of-life treatment needs. In the related online survey, our customers warmly welcomed the approach.
Page 88Nokia sustainability report2009
7.4.5Packaging
7.0Environment
Navigation bar
Contents 21.0 CEO’s Message 3 2.0 Nokia in 2009 63.0 About the report 94.0 Employees 29 5.0 Supply chain 54 6.0 Corporate social investment 64 7.0 Environment 718.0 Operation 999.0 Key data 2009 11310.0 Independent Assurance 13311.0 Global Reporting Initiative Index 2009 138
7.1 Environmental strategy 72 7.1.1 Minimizing our environmental footprint 73 7.1.2 Key focus areas 74 7.1.3 Climate strategy 757.2 Environmental management at Nokia 77 7.2.1 Environmental Management Systems 78 7.2.2 Participation in external initiatives 79 7.2.3 Environmental stakeholder engagement 80 7.2.4 Training and development 817.3 ICT as an enabler 827.4 Environment and our products 83 7.4.1 Rolling out eco improvements across 84
the product portfolio 7.4.2 Environmental impact of our products 85 7.4.3 Materials and substance management 86 7.4.4 Product energy efficiency 87 7.4.5 Packaging 887.5 Promoting sustainability through Nokia services 897.6 Take-back and recycling 2009 90 7.6.1 Our long-term commitment to partner 91
networks – the story of China Green Box 7.6.2 Expansion to new regions – Middle East and Africa 92 7.6.3 Cooperating with the Finnish Post 93 7.6.4 Take-back campaigns in South 94
East Asia Pacific (SEAP) in 2009 7.6.5 USA goes to the movies 95 7.6.6 Latin America collection network 96 7.6.7 Indian take-back campaign kick off and expansion 97 7.6.8 Europe – producer associations 98
7.5Promoting sustainability through Nokia services
We have developed services to help people make sustainable choices and to consider environment in everyday life. A range of eco services is freely available to download to Nokia devices from Ovi Store.
Green ExplorerThe beta-version of Green Explorer, introduced in December 2008, was developed further in 2009. Green Explorer is a free service designed to promote sustainable travel and local living by offering a combination of high-quality travel guide information and tips about sustainable travel and living shared by users themselves. Green Explorer is compatible with all PCs and mobile devices with a browser. We have also developed a widget that allows users to access their favourite Green Explorer information offline.
WWF has provided much of the content for Green Explorer’s information about local living in different destinations. Following our global partnership agreement with UNESCO begun in 2009, we can also provide all UNESCO’s World Heritage Sites in Nokia Maps through Green Explorer. The service is available at www.greenexplorer.ovi.com
Nokia Eco zoneWith Nokia Eco zone, owners of Nokia devices can view and download a range of eco content varying from wallpapers and applications to links. This service can be used with 200 million Nokia devices, and already has around 300,000 monthly downloads. Continuing the developments of we:offset, the world’s first CO2 emission offsetting tool for mobile devices, we launched S40, touch and Maemo versions of the tool during 2009. Eco zone is now available in Ovi Store.
Climate MissionDuring 2009 we developed our Climate Mission game, launched at the beginning of 2010. Climate Mission is a game that makes users think about climate change and topical issues in a fun and playful way. It consists of four different mini games and is available free from Ovi Store.
Page 89Nokia sustainability report2009
7.5Promoting sustainability through Nokia services
7.0Environment
Navigation bar
Contents 21.0 CEO’s Message 3 2.0 Nokia in 2009 63.0 About the report 94.0 Employees 29 5.0 Supply chain 54 6.0 Corporate social investment 64 7.0 Environment 718.0 Operation 999.0 Key data 2009 11310.0 Independent Assurance 13311.0 Global Reporting Initiative Index 2009 138
7.1 Environmental strategy 72 7.1.1 Minimizing our environmental footprint 73 7.1.2 Key focus areas 74 7.1.3 Climate strategy 757.2 Environmental management at Nokia 77 7.2.1 Environmental Management Systems 78 7.2.2 Participation in external initiatives 79 7.2.3 Environmental stakeholder engagement 80 7.2.4 Training and development 817.3 ICT as an enabler 827.4 Environment and our products 83 7.4.1 Rolling out eco improvements across 84
the product portfolio 7.4.2 Environmental impact of our products 85 7.4.3 Materials and substance management 86 7.4.4 Product energy efficiency 87 7.4.5 Packaging 887.5 Promoting sustainability through Nokia services 897.6 Take-back and recycling 2009 90 7.6.1 Our long-term commitment to partner 91
networks – the story of China Green Box 7.6.2 Expansion to new regions – Middle East and Africa 92 7.6.3 Cooperating with the Finnish Post 93 7.6.4 Take-back campaigns in South 94
East Asia Pacific (SEAP) in 2009 7.6.5 USA goes to the movies 95 7.6.6 Latin America collection network 96 7.6.7 Indian take-back campaign kick off and expansion 97 7.6.8 Europe – producer associations 98
7.6Take-back and recycling 2009
Our 2008 consumer study showed us that the main obstacle to recycling is the lack of awareness. Three out of four respondents said that they do not consider recycling their phones. Nearly half were not even aware of the possibility, despite the fact that an average household has around five unused phones.
In 2009 we have worked to raise consumers’ awareness globally on the potential for mobile phones to be recycled. We encourage consumers first of all to pass them on to their family and friends for further use. Our recycling programs only target the removal of unusable products from domestic waste, to avoid them ending up in landfill or incineration. We aim to build up and widen our collection and recycling infrastructure for old phones and we have expanded this service to many new markets during 2009.
We are continuously studying the most efficient and easy ways for consumers to return their phones and how to best motivate people to act, so that we can put best practices to global use. We are using different types of incentives in the markets where consumers need encouragement: for example by partnering with non-government organizations, donations, access to events, giveaways, and free services. Results have been positive and we are seeing the slow development of a recycling culture with the increased awareness, developing infrastructure and ease of recycling leading to slowly increasing collection volumes.
Across the world during 2009 we collected and recycled a total of 373 tonnes of e-waste including 4.7 million mobile phones. This included products returned by consumers and from our service network.
Following are examples of our recycling activities in various markets.
Page 90Nokia sustainability report2009
7.6Take-back and recycling 2009
7.0Environment
Navigation bar
Contents 21.0 CEO’s Message 3 2.0 Nokia in 2009 63.0 About the report 94.0 Employees 29 5.0 Supply chain 54 6.0 Corporate social investment 64 7.0 Environment 718.0 Operation 999.0 Key data 2009 11310.0 Independent Assurance 13311.0 Global Reporting Initiative Index 2009 138
7.1 Environmental strategy 72 7.1.1 Minimizing our environmental footprint 73 7.1.2 Key focus areas 74 7.1.3 Climate strategy 757.2 Environmental management at Nokia 77 7.2.1 Environmental Management Systems 78 7.2.2 Participation in external initiatives 79 7.2.3 Environmental stakeholder engagement 80 7.2.4 Training and development 817.3 ICT as an enabler 827.4 Environment and our products 83 7.4.1 Rolling out eco improvements across 84
the product portfolio 7.4.2 Environmental impact of our products 85 7.4.3 Materials and substance management 86 7.4.4 Product energy efficiency 87 7.4.5 Packaging 887.5 Promoting sustainability through Nokia services 897.6 Take-back and recycling 2009 90 7.6.1 Our long-term commitment to partner 91
networks – the story of China Green Box 7.6.2 Expansion to new regions – Middle East and Africa 92 7.6.3 Cooperating with the Finnish Post 93 7.6.4 Take-back campaigns in South 94
East Asia Pacific (SEAP) in 2009 7.6.5 USA goes to the movies 95 7.6.6 Latin America collection network 96 7.6.7 Indian take-back campaign kick off and expansion 97 7.6.8 Europe – producer associations 98
7.6.1Our long-term commitment to partner networks – the story of China Green Box
The China Green Box Project is a partnership between Nokia, telecommunication operator China Mobile and other mobile phone manufacturers to encourage people to recycle their old phones.
The program started in 2005 with 1,500 recycling bins installed in retail shops and repair centers in 40 large Chinese cities. In the first year, six tonnes of devices and accessories were collected. In 2007 the program expanded to 700 Nokia Care Points. In 2009, more than 20 tonnes of e-waste were collected, of which 3.5 tonnes originated with Nokia.
China Mobile and Nokia have used different incentives to encourage consumers to take part in the scheme – for example, by giving away prepaid cards and environmentally friendly bags. The impact of the incentives can be seen in the amounts of the products being recycled. When incentives were not given, the amount of recycled material dropped.
As Green Box was the first take-back scheme launched in China it has provided a useful take-back model for the industry. Our experience of running the Green Box program has also been invaluable for building up larger waste infrastructures in China, particularly since China’s waste electrical and electronic equipment (WEEE) regulations will start at the beginning of 2011.
Page 91Nokia sustainability report2009
7.6.1Our long-term commitment to partner networks – the story of China Green Box
7.0Environment
Navigation bar
Contents 21.0 CEO’s Message 3 2.0 Nokia in 2009 63.0 About the report 94.0 Employees 29 5.0 Supply chain 54 6.0 Corporate social investment 64 7.0 Environment 718.0 Operation 999.0 Key data 2009 11310.0 Independent Assurance 13311.0 Global Reporting Initiative Index 2009 138
7.1 Environmental strategy 72 7.1.1 Minimizing our environmental footprint 73 7.1.2 Key focus areas 74 7.1.3 Climate strategy 757.2 Environmental management at Nokia 77 7.2.1 Environmental Management Systems 78 7.2.2 Participation in external initiatives 79 7.2.3 Environmental stakeholder engagement 80 7.2.4 Training and development 817.3 ICT as an enabler 827.4 Environment and our products 83 7.4.1 Rolling out eco improvements across 84
the product portfolio 7.4.2 Environmental impact of our products 85 7.4.3 Materials and substance management 86 7.4.4 Product energy efficiency 87 7.4.5 Packaging 887.5 Promoting sustainability through Nokia services 897.6 Take-back and recycling 2009 90 7.6.1 Our long-term commitment to partner 91
networks – the story of China Green Box 7.6.2 Expansion to new regions – Middle East and Africa 92 7.6.3 Cooperating with the Finnish Post 93 7.6.4 Take-back campaigns in South 94
East Asia Pacific (SEAP) in 2009 7.6.5 USA goes to the movies 95 7.6.6 Latin America collection network 96 7.6.7 Indian take-back campaign kick off and expansion 97 7.6.8 Europe – producer associations 98
7.6.2Expansion to new regions – Middle East and Africa
During 2009 we offered a take-back service in seven countries in the Middle East and Africa region, including the first-ever take-back campaigns in Nigeria, Ghana, Lebanon and Egypt. In the take-back campaigns Nokia installed recycling bins in Care Centers and used the local media to raise awareness about recycling.
We launched our South African take-back campaign in 2008. The following year’s campaign used roundtable discussions, interviews and radio promotion to show people how they can make a difference. The campaign also encouraged consumers to return their old phones to big shopping malls for collection. In 2009, collection amounts were up by four times on the previous year in some of the malls.
This year we also worked with the South African NGO Food Gardens Foundation to link our campaign with a project to create a food garden at an under-privileged school in Johannesburg. By supporting the food garden project we are now helping to provide sustainable food for the 360 children who attend the school.
In the United Arab Emirates we ran a Borrow a Bin take-back campaign in 2009 at 10 schools and five companies in Dubai. The idea was to run short, focussed campaigns in the organizations to raise awareness around a borrowed recycling bin through promotional material on take-back, lectures on e-waste and by providing incentives. The incentives included music vouchers, eco pencil cases, organic food vouchers and our Wild Ocean DVD. We managed to collect between 25 and 120 phones per school and up to 25 per company.
Internal awareness-raising continues to be an important issue for us as well. Our Dubai office collected 600 items for recycling.
Page 92Nokia sustainability report2009
7.6.2Expansion to new regions – Middle East and Africa
7.0Environment
Navigation bar
Contents 21.0 CEO’s Message 3 2.0 Nokia in 2009 63.0 About the report 94.0 Employees 29 5.0 Supply chain 54 6.0 Corporate social investment 64 7.0 Environment 718.0 Operation 999.0 Key data 2009 11310.0 Independent Assurance 13311.0 Global Reporting Initiative Index 2009 138
7.1 Environmental strategy 72 7.1.1 Minimizing our environmental footprint 73 7.1.2 Key focus areas 74 7.1.3 Climate strategy 757.2 Environmental management at Nokia 77 7.2.1 Environmental Management Systems 78 7.2.2 Participation in external initiatives 79 7.2.3 Environmental stakeholder engagement 80 7.2.4 Training and development 817.3 ICT as an enabler 827.4 Environment and our products 83 7.4.1 Rolling out eco improvements across 84
the product portfolio 7.4.2 Environmental impact of our products 85 7.4.3 Materials and substance management 86 7.4.4 Product energy efficiency 87 7.4.5 Packaging 887.5 Promoting sustainability through Nokia services 897.6 Take-back and recycling 2009 90 7.6.1 Our long-term commitment to partner 91
networks – the story of China Green Box 7.6.2 Expansion to new regions – Middle East and Africa 92 7.6.3 Cooperating with the Finnish Post 93 7.6.4 Take-back campaigns in South 94
East Asia Pacific (SEAP) in 2009 7.6.5 USA goes to the movies 95 7.6.6 Latin America collection network 96 7.6.7 Indian take-back campaign kick off and expansion 97 7.6.8 Europe – producer associations 98
7.6.3Cooperating with the Finnish Post Office on take-back
In 2009 in Finland, we started a joint campaign in cooperation with the Finnish Post Office, Itella, to encourage consumers to send us their old mobile phones in pre-paid envelopes for recycling. In return, they received a free voucher to try one of our three service options: a seven-day navigation license, an N-Gage game or one song of their choice from the music store.
Altogether, 150 post offices in Finland distributed the envelopes, which could also be downloaded from the internet. The download option proved to be a simple, effective way to return devices, so it was left up and running after the campaign.
We collected 17,000 phones during the two-month campaign. Sixteen percent of consumers recycled without any incentive at all.
Page 93Nokia sustainability report2009
7.6.3Cooperating with the Finnish Post Office on take-back
7.0Environment
Navigation bar
Contents 21.0 CEO’s Message 3 2.0 Nokia in 2009 63.0 About the report 94.0 Employees 29 5.0 Supply chain 54 6.0 Corporate social investment 64 7.0 Environment 718.0 Operation 999.0 Key data 2009 11310.0 Independent Assurance 13311.0 Global Reporting Initiative Index 2009 138
7.1 Environmental strategy 72 7.1.1 Minimizing our environmental footprint 73 7.1.2 Key focus areas 74 7.1.3 Climate strategy 757.2 Environmental management at Nokia 77 7.2.1 Environmental Management Systems 78 7.2.2 Participation in external initiatives 79 7.2.3 Environmental stakeholder engagement 80 7.2.4 Training and development 817.3 ICT as an enabler 827.4 Environment and our products 83 7.4.1 Rolling out eco improvements across 84
the product portfolio 7.4.2 Environmental impact of our products 85 7.4.3 Materials and substance management 86 7.4.4 Product energy efficiency 87 7.4.5 Packaging 887.5 Promoting sustainability through Nokia services 897.6 Take-back and recycling 2009 90 7.6.1 Our long-term commitment to partner 91
networks – the story of China Green Box 7.6.2 Expansion to new regions – Middle East and Africa 92 7.6.3 Cooperating with the Finnish Post 93 7.6.4 Take-back campaigns in South 94
East Asia Pacific (SEAP) in 2009 7.6.5 USA goes to the movies 95 7.6.6 Latin America collection network 96 7.6.7 Indian take-back campaign kick off and expansion 97 7.6.8 Europe – producer associations 98
7.6.4Take-back campaigns in South East Asia Pacific (SEAP) in 2009
In our SEAP region we continued our take-back projects and ran a number of successful events throughout 2009 with our NGO partners as an incentive for consumers to recycle their old phones. The campaigns successfully engaged consumers and we donated money to many important charity programs.
In the Philippines we invited people to donate an old phone for recycling in exchange for entry into a charity run. We collected over 18,000 pieces of equipment and made a donation for each kilo we received. The donation went towards a project to rehabilitate the La Mesa Watershed outside Manila, which is a source of water for over 12 million people.
In another take-back project in Vietnam, we donated money for each phone recycled to the Vietnamese Ministry of Natural Resources and Environment to purchase 120 rubbish bins, which will be placed throughout Ho Chi Minh City and Hanoi. The Vietnam project collected 18,000 phones.
In Indonesia we collected more than 10,000 phones and sponsored WWF Indonesia in planting 4,000 trees in the Jakarta Ciliwung river area.
In Malaysia and Singapore we continued using our automated phone-recycling kiosk. In return for a phone the kiosk gives a code for a webpage where the consumer can see the tree that has been planted by WWF in his or her name. Trees are donated to the Indonesia Re-forestation Project with WWF Indonesia, with which we are in the second of three years of sponsorship.
In Thailand we partnered with WWF’s Thailand Elephant Protection Program at Kuibury National Park. The Nokia Loves Earth campaign collected 15,000 phones and accessories in 2.5 months. Many schools, universities and other cooperational events joined the campaign during the year, allowing us to reach a big audience with a recycling message. Participating organizations included Nanyang Technological University Green Awareness Campaign with 32,000 students, Republic Polytechnic with 15,000 students and KK Women and Children Hospital with nearly 5,000 employees and visitors.
In Australia we continued to participate in the MobileMuster project, which has been running since 1998. At the beginning the collection amounts for mobile phones were around 250,000 units while last year a record 800,000 units were collected.
Page 94Nokia sustainability report2009
7.6.4Take-back campaigns in South East Asia Pacific (SEAP) in 2009
7.0Environment
Navigation bar
Contents 21.0 CEO’s Message 3 2.0 Nokia in 2009 63.0 About the report 94.0 Employees 29 5.0 Supply chain 54 6.0 Corporate social investment 64 7.0 Environment 718.0 Operation 999.0 Key data 2009 11310.0 Independent Assurance 13311.0 Global Reporting Initiative Index 2009 138
7.1 Environmental strategy 72 7.1.1 Minimizing our environmental footprint 73 7.1.2 Key focus areas 74 7.1.3 Climate strategy 757.2 Environmental management at Nokia 77 7.2.1 Environmental Management Systems 78 7.2.2 Participation in external initiatives 79 7.2.3 Environmental stakeholder engagement 80 7.2.4 Training and development 817.3 ICT as an enabler 827.4 Environment and our products 83 7.4.1 Rolling out eco improvements across 84
the product portfolio 7.4.2 Environmental impact of our products 85 7.4.3 Materials and substance management 86 7.4.4 Product energy efficiency 87 7.4.5 Packaging 887.5 Promoting sustainability through Nokia services 897.6 Take-back and recycling 2009 90 7.6.1 Our long-term commitment to partner 91
networks – the story of China Green Box 7.6.2 Expansion to new regions – Middle East and Africa 92 7.6.3 Cooperating with the Finnish Post 93 7.6.4 Take-back campaigns in South 94
East Asia Pacific (SEAP) in 2009 7.6.5 USA goes to the movies 95 7.6.6 Latin America collection network 96 7.6.7 Indian take-back campaign kick off and expansion 97 7.6.8 Europe – producer associations 98
7.6.5USA goes to the movies
In 2009 we launched a new take-back and recycling program in the United States. As well as offering free and easy take-back and recycling solutions, our aim was to make people more aware of recycling opportunities. For example, recycling messages were a part of our sponsorship of the Giant Screen Imax film, Wild Ocean, shown at museum venues including the Smithsonian National Museum of Natural History and the Fernbank Museum in Atlanta. Eighteen million visitors saw our recycling message via display stands and kiosks, and two million more saw our public service announcement and call to action.
During the campaign, consumers and visitors to our flagship stores were offered a free ticket to Wild Ocean in exchange for a recycled phone. Prompted by the campaign, nearly 5,000 consumers recycled unwanted devices. Earth Day was also celebrated by several recycling events throughout the US.
Our USA mail back program collected 11,300 phones during the 2009 and 4,000 phones were returned by using envelopes distributed in sales packs during 2007. A similar phenomenon has been seen in Finland, where envelopes keep coming back years after the actual campaign has finished.
Page 95Nokia sustainability report2009
7.6.5USA goes to the movies
7.0Environment
Navigation bar
Contents 21.0 CEO’s Message 3 2.0 Nokia in 2009 63.0 About the report 94.0 Employees 29 5.0 Supply chain 54 6.0 Corporate social investment 64 7.0 Environment 718.0 Operation 999.0 Key data 2009 11310.0 Independent Assurance 13311.0 Global Reporting Initiative Index 2009 138
7.1 Environmental strategy 72 7.1.1 Minimizing our environmental footprint 73 7.1.2 Key focus areas 74 7.1.3 Climate strategy 757.2 Environmental management at Nokia 77 7.2.1 Environmental Management Systems 78 7.2.2 Participation in external initiatives 79 7.2.3 Environmental stakeholder engagement 80 7.2.4 Training and development 817.3 ICT as an enabler 827.4 Environment and our products 83 7.4.1 Rolling out eco improvements across 84
the product portfolio 7.4.2 Environmental impact of our products 85 7.4.3 Materials and substance management 86 7.4.4 Product energy efficiency 87 7.4.5 Packaging 887.5 Promoting sustainability through Nokia services 897.6 Take-back and recycling 2009 90 7.6.1 Our long-term commitment to partner 91
networks – the story of China Green Box 7.6.2 Expansion to new regions – Middle East and Africa 92 7.6.3 Cooperating with the Finnish Post 93 7.6.4 Take-back campaigns in South 94
East Asia Pacific (SEAP) in 2009 7.6.5 USA goes to the movies 95 7.6.6 Latin America collection network 96 7.6.7 Indian take-back campaign kick off and expansion 97 7.6.8 Europe – producer associations 98
7.6.6Latin America collection network
We held awareness-raising events in Chile, Ecuador, Colombia, Argentina and Mexico. Mexico’s take-back program has been running since 2007 and here we also saw an increase in the number of consumers returning old products for recycling. The network operator Movistar added another 58 collection pointsto its original number of 102, including points at schools and universities.
The campaign resulted in 105,000 phones collected by Moviestar, with 70,400 at the schools. Seven tonnes of batteries and 200,000 accessories were also collected. In Argentina, 10 new operator collection points were added. Altogether more than 80 kilos of phones and accessories were collected.
Page 96Nokia sustainability report2009
7.6.6Latin America collection network
7.0Environment
Navigation bar
Contents 21.0 CEO’s Message 3 2.0 Nokia in 2009 63.0 About the report 94.0 Employees 29 5.0 Supply chain 54 6.0 Corporate social investment 64 7.0 Environment 718.0 Operation 999.0 Key data 2009 11310.0 Independent Assurance 13311.0 Global Reporting Initiative Index 2009 138
7.1 Environmental strategy 72 7.1.1 Minimizing our environmental footprint 73 7.1.2 Key focus areas 74 7.1.3 Climate strategy 757.2 Environmental management at Nokia 77 7.2.1 Environmental Management Systems 78 7.2.2 Participation in external initiatives 79 7.2.3 Environmental stakeholder engagement 80 7.2.4 Training and development 817.3 ICT as an enabler 827.4 Environment and our products 83 7.4.1 Rolling out eco improvements across 84
the product portfolio 7.4.2 Environmental impact of our products 85 7.4.3 Materials and substance management 86 7.4.4 Product energy efficiency 87 7.4.5 Packaging 887.5 Promoting sustainability through Nokia services 897.6 Take-back and recycling 2009 90 7.6.1 Our long-term commitment to partner 91
networks – the story of China Green Box 7.6.2 Expansion to new regions – Middle East and Africa 92 7.6.3 Cooperating with the Finnish Post 93 7.6.4 Take-back campaigns in South 94
East Asia Pacific (SEAP) in 2009 7.6.5 USA goes to the movies 95 7.6.6 Latin America collection network 96 7.6.7 Indian take-back campaign kick off and expansion 97 7.6.8 Europe – producer associations 98
7.6.7Indian take-back campaign kick off and expansion
Our Indian take-back campaign pilot was launched in Delhi, Gurgaon, Ludhiana and Bangalore in early 2009. Prior to the campaign, 1,400 recycling bins were placed at Nokia priority dealers and Nokia Care centers.We also installed recycling bins in shopping and residential areas, and used different media such as outdoor advertising, print, radio and TV to promote recycling. The 45 day pilot phase resulted in the collection of 68,000 phones and accessories and raised the awareness of recycling significantly.
In the second phase, the campaign was expanded to cover all Nokia priority dealers, care centers and concept stores in nearly 30 cities. Care and retail activities were supported by an extensive media campaign. Recycling drives were also organized in 175 corporate offices of 21 companies. The campaign was carried out in partnership with the charity, TERI. As part of TERI’s Light a Billion Lives Initiative Nokia is sponsoring the lighting of three Indian villages.
To encourage consumers to participate, incentives such as music vouchers, discount coupons and tree planting were offered in exchange for the phone recycling. We also launched the ‘Planet Ke Rakhwale’ community web portal, which contains more information about recycling, compares different recycling points and allows visitors to pass the recycling message on to friends. The campaign has so far reached around 145 million consumers and we have collected 16 tonnes or almost 500,000 phones and accessories and the figure keeps on rising.
Page 97Nokia sustainability report2009
7.6.7Indian take-back campaign kick off and expansion
7.0Environment
Navigation bar
Contents 21.0 CEO’s Message 3 2.0 Nokia in 2009 63.0 About the report 94.0 Employees 29 5.0 Supply chain 54 6.0 Corporate social investment 64 7.0 Environment 718.0 Operation 999.0 Key data 2009 11310.0 Independent Assurance 13311.0 Global Reporting Initiative Index 2009 138
7.1 Environmental strategy 72 7.1.1 Minimizing our environmental footprint 73 7.1.2 Key focus areas 74 7.1.3 Climate strategy 757.2 Environmental management at Nokia 77 7.2.1 Environmental Management Systems 78 7.2.2 Participation in external initiatives 79 7.2.3 Environmental stakeholder engagement 80 7.2.4 Training and development 817.3 ICT as an enabler 827.4 Environment and our products 83 7.4.1 Rolling out eco improvements across 84
the product portfolio 7.4.2 Environmental impact of our products 85 7.4.3 Materials and substance management 86 7.4.4 Product energy efficiency 87 7.4.5 Packaging 887.5 Promoting sustainability through Nokia services 897.6 Take-back and recycling 2009 90 7.6.1 Our long-term commitment to partner 91
networks – the story of China Green Box 7.6.2 Expansion to new regions – Middle East and Africa 92 7.6.3 Cooperating with the Finnish Post 93 7.6.4 Take-back campaigns in South 94
East Asia Pacific (SEAP) in 2009 7.6.5 USA goes to the movies 95 7.6.6 Latin America collection network 96 7.6.7 Indian take-back campaign kick off and expansion 97 7.6.8 Europe – producer associations 98
7.6.8Europe – producer associations
Since 2005 it has been mandatory for all EU member states to operate specific collection and recycling schemes for all household waste, electrical and electronic equipment. This has ensured that all consumers, all over the EU, are able to recycle and return used waste equipment in an easy and responsible way. The various collection and recycling schemes are operated and financed by the equipment producers, while municipal collections, waste management sites and shops selling equipment are the main collection channels.
The level of public awareness and the scale of publicity campaigns about this area of waste management varies across the EU and there is still a lack of consumer awareness in many EU countries. A target of collecting four kilos per inhabitant per year has been set, but there are huge variations in the success rates achieved between countries.
The legal basis for the schemes- the WEEE Directive- is presently undergoing revision. One of the main problems to be tackled is the so-called ‘leakage’ of waste equipment. Leakage is waste equipment that is not monitored by existing national collection channels. It occurs because a lot of household electronics’ waste still has a residual value at disposal and is sold for second-hand use (often abroad) or for recycling of its materials content.
Page 98Nokia sustainability report2009
7.6.8Europe – producer associations
7.0Environment
Navigation bar
Contents 21.0 CEO’s Message 3 2.0 Nokia in 2009 63.0 About the report 94.0 Employees 29 5.0 Supply chain 54 6.0 Corporate social investment 64 7.0 Environment 718.0 Operation 999.0 Key data 2009 11310.0 Independent Assurance 13311.0 Global Reporting Initiative Index 2009 138
7.1 Environmental strategy 72 7.1.1 Minimizing our environmental footprint 73 7.1.2 Key focus areas 74 7.1.3 Climate strategy 757.2 Environmental management at Nokia 77 7.2.1 Environmental Management Systems 78 7.2.2 Participation in external initiatives 79 7.2.3 Environmental stakeholder engagement 80 7.2.4 Training and development 817.3 ICT as an enabler 827.4 Environment and our products 83 7.4.1 Rolling out eco improvements across 84
the product portfolio 7.4.2 Environmental impact of our products 85 7.4.3 Materials and substance management 86 7.4.4 Product energy efficiency 87 7.4.5 Packaging 887.5 Promoting sustainability through Nokia services 897.6 Take-back and recycling 2009 90 7.6.1 Our long-term commitment to partner 91
networks – the story of China Green Box 7.6.2 Expansion to new regions – Middle East and Africa 92 7.6.3 Cooperating with the Finnish Post 93 7.6.4 Take-back campaigns in South 94
East Asia Pacific (SEAP) in 2009 7.6.5 USA goes to the movies 95 7.6.6 Latin America collection network 96 7.6.7 Indian take-back campaign kick off and expansion 97 7.6.8 Europe – producer associations 98
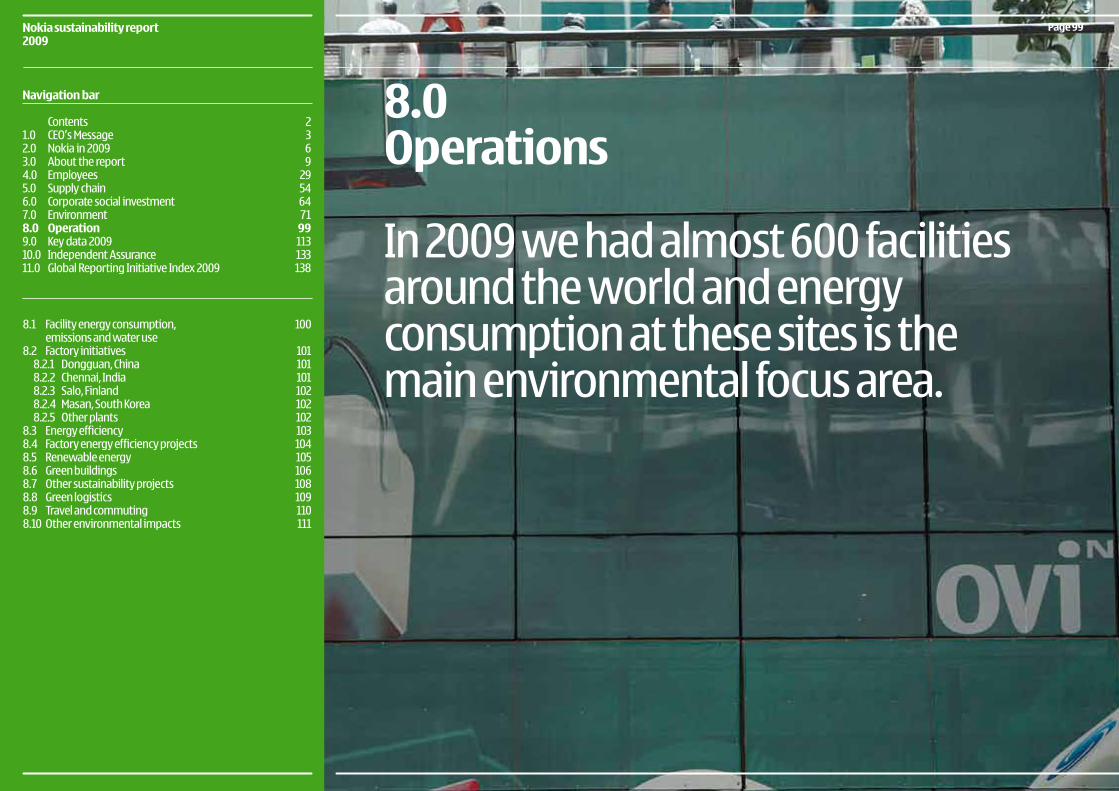
Page 99Nokia sustainability report2009
Navigation bar
Contents 21.0 CEO’s Message 3 2.0 Nokia in 2009 63.0 About the report 94.0 Employees 29 5.0 Supply chain 54 6.0 Corporate social investment 64 7.0 Environment 718.0 Operation 999.0 Key data 2009 11310.0 Independent Assurance 13311.0 Global Reporting Initiative Index 2009 138
8.0Operations
In 2009 we had almost 600 facilities around the world and energy consumption at these sites is the main environmental focus area.
8.1 Facility energy consumption, 100 emissions and water use
8.2 Factory initiatives 101 8.2.1 Dongguan, China 101 8.2.2 Chennai, India 101 8.2.3 Salo, Finland 102 8.2.4 Masan, South Korea 102 8.2.5 Other plants 1028.3 Energy efficiency 1038.4 Factory energy efficiency projects 1048.5 Renewable energy 1058.6 Green buildings 1068.7 Other sustainability projects 1088.8 Green logistics 1098.9 Travel and commuting 1108.10 Other environmental impacts 111
8.1Facility energy consumption, emissions and water use
In 2009 we had almost 600 facilities around the world, including 10 production sites and around 40 Nokia and Vertu retail sites. Compared to 2008, the number of small offices increased by around 200 with the inclusion of NAVTEQ facilities in our reporting scope. Energy consumption at these sites is the main environmental focus area. These locations, with a total surface of 1,300,000 square meters, collectively consumed 77 GWh of direct and 595 GWh of indirect energy in 2009. This energy consumption caused 16,000 tonnes of direct and 211,100 tonnes of indirect greenhouse gas (CO2e) emissions. Direct energy means our use of gas and oil while indirect energy refers to our use of electricity, district heating and district cooling. In addition to CO2e emissions caused by energy usage, direct greenhouse gas emissions include greenhouse gas warming potential caused by HFC- refrigerants. Without our purchase of certified green energy the (above mentioned) indirect emissions would have been greater by 69,500 tonnes.
Nokia consumed 1,367,000 m3 water in our facilities in 2009.
Our activities in our facilities do not cause significant impacts on biodiversity.
Page 100Nokia sustainability report2009
8.1Facility energy consumption,emissions and water use
8.0Operations
Navigation bar
Contents 21.0 CEO’s Message 3 2.0 Nokia in 2009 63.0 About the report 94.0 Employees 29 5.0 Supply chain 54 6.0 Corporate social investment 64 7.0 Environment 718.0 Operation 999.0 Key data 2009 11310.0 Independent Assurance 13311.0 Global Reporting Initiative Index 2009 138
8.1 Facility energy consumption, 100 emissions and water use
8.2 Factory initiatives 101 8.2.1 Dongguan, China 101 8.2.2 Chennai, India 101 8.2.3 Salo, Finland 102 8.2.4 Masan, South Korea 102 8.2.5 Other plants 1028.3 Energy efficiency 1038.4 Factory energy efficiency projects 1048.5 Renewable energy 1058.6 Green buildings 1068.7 Other sustainability projects 1088.8 Green logistics 1098.9 Travel and commuting 1108.10 Other environmental impacts 111
8.2Factory initiatives
8.2.1Dongguan, China
At our Dongguan factory in Guangdong Province, China, several energy-saving projects took place during 2009 resulting in over 6,000 MWh saved annually. The factory installed timers on integrated ventilation/heating and air filtration units, drinking water units and canteen lighting to allow for different energy needs at different times of day. Heating and chilling machinery was also upgraded, with an air-source heat pump helping to cut canteen energy bills.
Waste was another feature of the environmental campaigns at Dongguan. The factory replaced the cardboard boxes used for the user guide, chargers and cables with reusable plastic containers. These environmental initiatives and others led to the facility being awarded as a Clean Production Companyby Guangdong Province and Dongguan City.
8.2.2Chennai, India
Simple changes to the way we make packaging have brought about significant environmental improvements at our Chennai factory in India. Concerted efforts to optimize labels, sticky tape, and corrugated card packaging has saved significant amounts of materials, as well as saving the company more than EUR 1.5 million in costs per year. Energy use has also been cut through more effective vacuum pumps, and the factory has raised internal environmental awareness through its participation in Earth Hour 2009.
Page 101Nokia sustainability report2009
8.2Factory initiatives
8.0Operations
Navigation bar
Contents 21.0 CEO’s Message 3 2.0 Nokia in 2009 63.0 About the report 94.0 Employees 29 5.0 Supply chain 54 6.0 Corporate social investment 64 7.0 Environment 718.0 Operation 999.0 Key data 2009 11310.0 Independent Assurance 13311.0 Global Reporting Initiative Index 2009 138
continued...
8.1 Facility energy consumption, 100 emissions and water use
8.2 Factory initiatives 101 8.2.1 Dongguan, China 101 8.2.2 Chennai, India 101 8.2.3 Salo, Finland 102 8.2.4 Masan, South Korea 102 8.2.5 Other plants 1028.3 Energy efficiency 1038.4 Factory energy efficiency projects 1048.5 Renewable energy 1058.6 Green buildings 1068.7 Other sustainability projects 1088.8 Green logistics 1098.9 Travel and commuting 1108.10 Other environmental impacts 111
8.2.3Salo, Finland
Reducing unnecessary lighting in offices and the production area led to a significant 19 percent fall in Salo’s electricity use during 2009. Centralising waste handling in the factory pushed waste purity to 98 percent from 74 percent over the year. It also resulted in fewer waste bins and reduced the amount of waste going to landfill from1.8%to1.4%.
8.2.4Masan, South Korea
Waste issues have been at the forefront of our Masan factory’s environmental programs in 2009. Better waste sorting and the separation of fluorescent and battery waste has increased the recycling rate by 19 percent compared to 2008. One area where the plant has been particularly successful is in reducing the waste food from the canteens by 33 percent.
8.2.5Other plants
At our Cluj factory in Romania, reduced ventilation, heating and cooling outside of production hours and other programs together resulted in an 11 percent reduction of electrical energy and a 21 percent reduction in heating energy. Similar power-downs out of production time and better office air-conditioning management at our Beijing plant also saved on energy. Over 1,300 MWh were saved at our Mexican plant in Reynosa during 2009 by following similar initiatives.
Page 102Nokia sustainability report2009
8.2Factory initiatives (continued)
8.0Operations
Navigation bar
Contents 21.0 CEO’s Message 3 2.0 Nokia in 2009 63.0 About the report 94.0 Employees 29 5.0 Supply chain 54 6.0 Corporate social investment 64 7.0 Environment 718.0 Operation 999.0 Key data 2009 11310.0 Independent Assurance 13311.0 Global Reporting Initiative Index 2009 138
8.1 Facility energy consumption, 100 emissions and water use
8.2 Factory initiatives 101 8.2.1 Dongguan, China 101 8.2.2 Chennai, India 101 8.2.3 Salo, Finland 102 8.2.4 Masan, South Korea 102 8.2.5 Other plants 1028.3 Energy efficiency 1038.4 Factory energy efficiency projects 1048.5 Renewable energy 1058.6 Green buildings 1068.7 Other sustainability projects 1088.8 Green logistics 1098.9 Travel and commuting 1108.10 Other environmental impacts 111
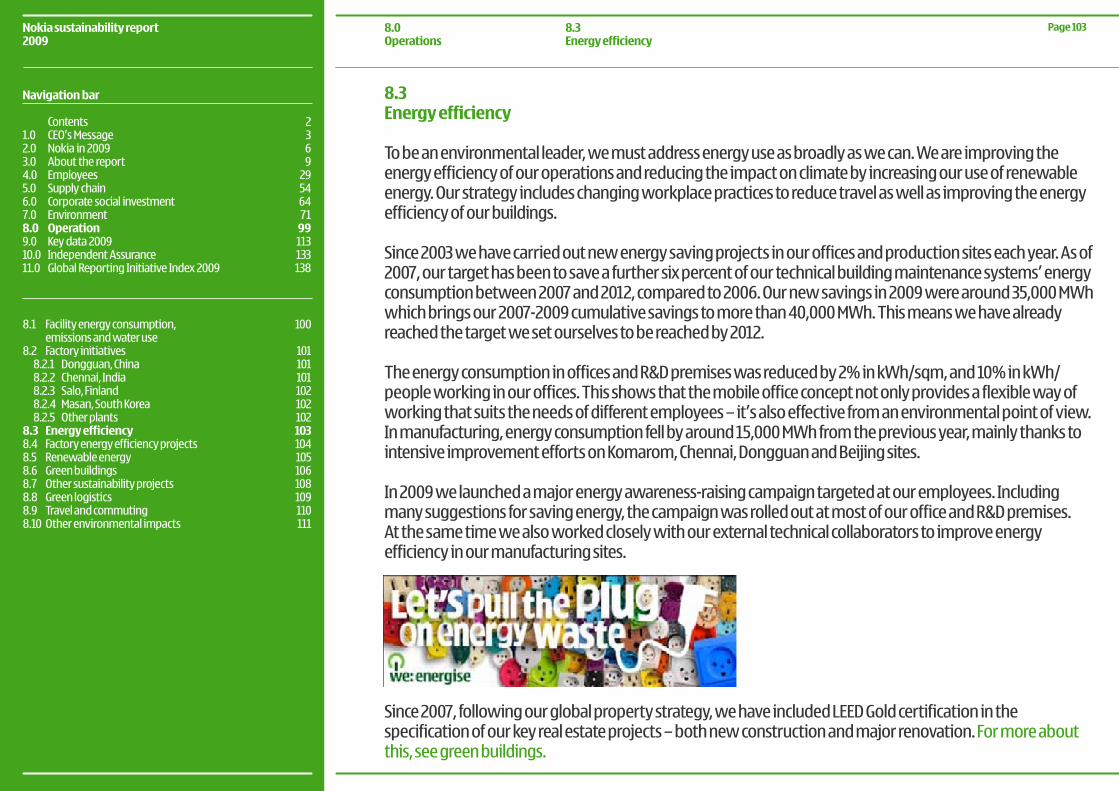
8.3Energy efficiency
To be an environmental leader, we must address energy use as broadly as we can. We are improving the energy efficiency of our operations and reducing the impact on climate by increasing our use of renewable energy. Our strategy includes changing workplace practices to reduce travel as well as improving the energy efficiency of our buildings.
Since 2003 we have carried out new energy saving projects in our offices and production sites each year. As of 2007, our target has been to save a further six percent of our technical building maintenance systems’ energy consumption between 2007 and 2012, compared to 2006. Our new savings in 2009 were around 35,000 MWh which brings our 2007-2009 cumulative savings to more than 40,000 MWh. This means we have already reached the target we set ourselves to be reached by 2012.
TheenergyconsumptioninofficesandR&Dpremiseswasreducedby2%inkWh/sqm,and10%inkWh/people working in our offices. This shows that the mobile office concept not only provides a flexible way of working that suits the needs of different employees – it’s also effective from an environmental point of view.In manufacturing, energy consumption fell by around 15,000 MWh from the previous year, mainly thanks to intensive improvement efforts on Komarom, Chennai, Dongguan and Beijing sites.
In 2009 we launched a major energy awareness-raising campaign targeted at our employees. Including many suggestions for saving energy, the campaign was rolled out at most of our office and R&D premises. At the same time we also worked closely with our external technical collaborators to improve energy efficiency in our manufacturing sites.
Since 2007, following our global property strategy, we have included LEED Gold certification in the specification of our key real estate projects – both new construction and major renovation. For more about this, see green buildings.
Page 103Nokia sustainability report2009
8.3Energy efficiency
8.0Operations
Navigation bar
Contents 21.0 CEO’s Message 3 2.0 Nokia in 2009 63.0 About the report 94.0 Employees 29 5.0 Supply chain 54 6.0 Corporate social investment 64 7.0 Environment 718.0 Operation 999.0 Key data 2009 11310.0 Independent Assurance 13311.0 Global Reporting Initiative Index 2009 138
8.1 Facility energy consumption, 100 emissions and water use
8.2 Factory initiatives 101 8.2.1 Dongguan, China 101 8.2.2 Chennai, India 101 8.2.3 Salo, Finland 102 8.2.4 Masan, South Korea 102 8.2.5 Other plants 1028.3 Energy efficiency 1038.4 Factory energy efficiency projects 1048.5 Renewable energy 1058.6 Green buildings 1068.7 Other sustainability projects 1088.8 Green logistics 1098.9 Travel and commuting 1108.10 Other environmental impacts 111
8.4Factory energy efficiency projects
Following the 2007-2008 energy audits of our factories, various energy efficiency improvements took place in our Komarom, Chennai, Dongguan and Beijing factories. The resulting factory-level savings ranged from7.5 to 27 percent (altogether 23,800 MWh), against the target saving level of 10 percent.
The savings are the result of a range of measures, including refrigeration efficiency improvements, line voltage reductions, light-fitting changes and compressed air leakage investigations and subsequent adjustments. Altogether these measures saved around 19,000 tonnes of CO2, equivalent to the emissions from a petrol-driven car driven more than 2,700 times round the globe.
During 2009, we also began metering improvements in these factories to verify the energy savings and improve energy efficiency target setting. Full implementation of these improvements will be completed in 2010.
Manufacturing improvement projects will expand in 2010 and 2011 to all Nokia factories. We hope to match the energy savings achieved in 2009 (around 24,000 MWh). The project is part of an holistic approach to optimize not only energy consumption, but also maintenance costs and risks.
Page 104Nokia sustainability report2009
8.4Factory energy efficiency projects
8.0Operations
Navigation bar
Contents 21.0 CEO’s Message 3 2.0 Nokia in 2009 63.0 About the report 94.0 Employees 29 5.0 Supply chain 54 6.0 Corporate social investment 64 7.0 Environment 718.0 Operation 999.0 Key data 2009 11310.0 Independent Assurance 13311.0 Global Reporting Initiative Index 2009 138
8.1 Facility energy consumption, 100 emissions and water use
8.2 Factory initiatives 101 8.2.1 Dongguan, China 101 8.2.2 Chennai, India 101 8.2.3 Salo, Finland 102 8.2.4 Masan, South Korea 102 8.2.5 Other plants 1028.3 Energy efficiency 1038.4 Factory energy efficiency projects 1048.5 Renewable energy 1058.6 Green buildings 1068.7 Other sustainability projects 1088.8 Green logistics 1098.9 Travel and commuting 1108.10 Other environmental impacts 111
8.5Renewable energy
Our global renewable electricity ambition has been to focus renewable energy purchases in countries where our energy consumption and the emission factors of energy production are both high. We have found that the availability of renewable electricity in our key countries is very limited and expanding more slowly than expected. There is also a growing discussion about the “additionality” effect of green energy certificates,and whether they will be an adequate replacement for fossil fuel production, especially when nations already have binding targets for the renewable energy share of their national electricity production portfolio.
Nevertheless, in 2009 we were able to reduce our CO2 emissions by 12 percent (16 percent when excluding NAVTEQ, which was not part of Nokia when the targets were set) through renewable energy purchases and energy efficiency measures, compared with the 2006 level. In order to reach our target of reducing CO2 emissions by 18 percent in 2010, compared with the 2006 level, we will expand our strategic choices to compensate for the CO2 emissions which we cannot cover with the current means, especially as no major changes in the renewable electricity markets are expected. As part of our 2010 Climate Change strategy update we are extending the strategy for future facilities’ CO2 emissions management, including a set of different Key Performance Indicators.
In 2009 we covered 35 percent (37 percent excluding NAVTEQ) of our electricity with renewables by buying renewable electricity certificates for 100 percent of our consumption in Finland (RES-E Guarantee of Origin), North America (Green-e wind) and France (RECS). In addition we purchased smaller scale certificates for our Australia office. Altogether, the purchased 188,600 MWh of renewable energy certificates reduced our CO2 emissions by 69,500 tonnes.
See performance for full details of our energy use. See Key Data 2009 for full details of our energy use.
Page 105Nokia sustainability report2009
8.5Renewable energy
8.0Operations
Navigation bar
Contents 21.0 CEO’s Message 3 2.0 Nokia in 2009 63.0 About the report 94.0 Employees 29 5.0 Supply chain 54 6.0 Corporate social investment 64 7.0 Environment 718.0 Operation 999.0 Key data 2009 11310.0 Independent Assurance 13311.0 Global Reporting Initiative Index 2009 138
8.1 Facility energy consumption, 100 emissions and water use
8.2 Factory initiatives 101 8.2.1 Dongguan, China 101 8.2.2 Chennai, India 101 8.2.3 Salo, Finland 102 8.2.4 Masan, South Korea 102 8.2.5 Other plants 1028.3 Energy efficiency 1038.4 Factory energy efficiency projects 1048.5 Renewable energy 1058.6 Green buildings 1068.7 Other sustainability projects 1088.8 Green logistics 1098.9 Travel and commuting 1108.10 Other environmental impacts 111
8.6Green buildings
Since 2007, following our global property strategy, we have included Leadership in Energy and Environmental Design (LEED) Gold certification in the specification of our key real estate projects, both new construction and major renovation. In 2009 we achieved a LEED Gold certification for our most recent factory construction project in Jucu, Romania, as well as for the office refurbishment in Gurgaon, India.
Some concrete examples of the sustainable features implemented in Jucu include:
•variousenergysavingfeatures,includingathermalenvelopearoundthecoreofthebuilding;highefficiencyglazing;reducedlightingpowerdensity,andoccupancysensorstomanageheatandlighting.These systems enable the building to use over 50 percent less heating energy and 26 percent less electricity than a standard building.
•water-savingdevicesandsystemssuchasflowlimitersthatsave30percentofwatercomparedwithanordinary factory
•consideringrecyclinginbothduringtheconstructionandinoperations.Around30percentofthematerialsused to construct the factory were made from recycled materials and additional ones sourced locally. Around half of the construction waste was reclaimed and recycled. The factory has a best practice waste management system, including dedicated recycling of materials such as cardboard, paper, plastic, glass, and metals.
•sustainabletransportalternativesforfactoryemployeesincludingashuttleservicetoreducepersonalcaruse, 18 preferential parking places for low-emitting vehicles, and provisions for bicycle storage and cyclist showers
Page 106Nokia sustainability report2009
8.6Green buildings
8.0Operations
Navigation bar
Contents 21.0 CEO’s Message 3 2.0 Nokia in 2009 63.0 About the report 94.0 Employees 29 5.0 Supply chain 54 6.0 Corporate social investment 64 7.0 Environment 718.0 Operation 999.0 Key data 2009 11310.0 Independent Assurance 13311.0 Global Reporting Initiative Index 2009 138
continued...
8.1 Facility energy consumption, 100 emissions and water use
8.2 Factory initiatives 101 8.2.1 Dongguan, China 101 8.2.2 Chennai, India 101 8.2.3 Salo, Finland 102 8.2.4 Masan, South Korea 102 8.2.5 Other plants 1028.3 Energy efficiency 1038.4 Factory energy efficiency projects 1048.5 Renewable energy 1058.6 Green buildings 1068.7 Other sustainability projects 1088.8 Green logistics 1098.9 Travel and commuting 1108.10 Other environmental impacts 111
The sustainability features of our LEED Gold Commercial Interiors-certified office in Gurgaon include:
•arangeofenergy-savingfeaturesincludinghigh-efficiencychillersandasmartlightingsystem, high-performance double-glazing, and a heat recovery system to pre-cool the fresh air ventilating the building. Thanks to these features, the building consumes 33 percent less energy than a standard office building
•energyefficientITequipmentandappliancesinthestaffcanteen,85percentofwhichareEnergyStarratedto further reduce the building’s energy consumption
•water-savingdevicesandsystemssuchasflowlimitersandsensor-basedequipment,whichtogetherresult in 44 percent less water consumed than in a comparable building
•treatingandrecyclingwastewateron-site,andusingthereclaimedwaterforirrigatingthegrounds• renewableandrecycledmaterialsusedwhereverpossibleintheofficeinteriors.Thisincludesitemssuch
as green guard certified furniture and carpets made from 100 percent recycled materials. Additionally, only paints and adhesives with low levels of VOCs (volatile organic compounds) were used
•anonlineCO2 monitoring system and a ventilation system that provides 30 percent more fresh air as well as maintaining an automatic temperature control in the building
•minibusesthatprovidetransportforemployeestoandfromtheoffice
The LEED commercial interiors projects in Southwood, UK and Paris, France were completed in the first quarter of 2010. Both projects earned Gold level certification.
Page 107Nokia sustainability report2009
8.6Green buildings (continued)
8.0Operations
Navigation bar
Contents 21.0 CEO’s Message 3 2.0 Nokia in 2009 63.0 About the report 94.0 Employees 29 5.0 Supply chain 54 6.0 Corporate social investment 64 7.0 Environment 718.0 Operation 999.0 Key data 2009 11310.0 Independent Assurance 13311.0 Global Reporting Initiative Index 2009 138
8.1 Facility energy consumption, 100 emissions and water use
8.2 Factory initiatives 101 8.2.1 Dongguan, China 101 8.2.2 Chennai, India 101 8.2.3 Salo, Finland 102 8.2.4 Masan, South Korea 102 8.2.5 Other plants 1028.3 Energy efficiency 1038.4 Factory energy efficiency projects 1048.5 Renewable energy 1058.6 Green buildings 1068.7 Other sustainability projects 1088.8 Green logistics 1098.9 Travel and commuting 1108.10 Other environmental impacts 111
8.7Other sustainability projects
One Planet Business project: Singapore. In 2009 we continued using WWF’s One Planet Business concept and carried out an ecological footprinting study of our Singapore office. The June 2009 study looked at data collected over the previous two years period and assessed the physical set-up of the office. The results shows Nokia Singapore is already performing well in some areas, such as minimizing waste generation, has good local transportation with shuttle buses and low water use. The office was also recommended to reduce its impact, better understand its energy consumption, use more recycled materials and implement a waste audit to further reduce waste.
Our plan is to continue with local One Planet Business studies to identify local priorities and to raise employees’ environmental awareness by engaging them in the project. We have two new projects coming up in 2010 and are planning follow-up footprinting studies.
Mobile officesThe improved office space efficiency that resulted from our head office’s change to mobility is paying off.In the first completed building (out of three) around 1,500 m2 of office space has been saved. This meansa reduction of around 42 tonnes of CO2 emissions annually.
CanteensWe have set global requirements related to energy and water efficiency, waste, bottled water, materials, chemicals, ethical and organic food for our canteen and cafeteria services.
Nokia owned storesNokia Retail further updated its sustainability guidelines in 2009. In the latest concept for owned stores, carefulattentionhasbeenpaidonimprovingbuildingsustainabilityforexample;onlightingandAV-equipment energy efficiency and on the environmental and health aspects of all materials. Internal audits have been carried out against these criteria to ensure operational performance after the design phase.
Employee PCsWe continue to improve the environmental performance of employee PCs by standardizing our Green PC concept. Due to the better energy efficiency of our new PC and monitor models, we estimate that we reduced energy consumption by 2,500,000 kWh or seven percent during 2008-2010, resulting in energy cost savings and a reduction of 1,300 tonnes in CO2 emissions.
Page 108Nokia sustainability report2009
8.7Other sustainability projects
8.0Operations
Navigation bar
Contents 21.0 CEO’s Message 3 2.0 Nokia in 2009 63.0 About the report 94.0 Employees 29 5.0 Supply chain 54 6.0 Corporate social investment 64 7.0 Environment 718.0 Operation 999.0 Key data 2009 11310.0 Independent Assurance 13311.0 Global Reporting Initiative Index 2009 138
8.1 Facility energy consumption, 100 emissions and water use
8.2 Factory initiatives 101 8.2.1 Dongguan, China 101 8.2.2 Chennai, India 101 8.2.3 Salo, Finland 102 8.2.4 Masan, South Korea 102 8.2.5 Other plants 1028.3 Energy efficiency 1038.4 Factory energy efficiency projects 1048.5 Renewable energy 1058.6 Green buildings 1068.7 Other sustainability projects 1088.8 Green logistics 1098.9 Travel and commuting 1108.10 Other environmental impacts 111
8.8Green logistic
Nokia logistics covers the transportation of components from suppliers to Nokia manufacturing sites and transportation of finished goods from Nokia sites to the customers. We also have Care logistics, which covers transportation related to recycling and reuse of materials.
Our transportation is done by external logistic service providers. Consequently, emissions associated with logistics belong to GHG Protocol, Scope 3. However, we do have a target to reduce the CO2 emissions associated with logistics by 20 percent below 2008 level by 2012.
We calculate CO2 emissions from logistics from data received mainly from our logistics service providers. Currently we are recalculating these figures, and the baseline, based on new GHG Protocol Scope 3 standardization work. The baseline and the figure for 2009 will be published in August 2010. Figuresfor Care logistics are also in progress.
Nokia continuously takes actions to reduce CO2 emissions from transportation. Actions taken so far include smaller sales packages, improved packaging efficiency during transportation and use of alternative modes of transportation.
Page 109Nokia sustainability report2009
8.8Green logistics
8.0Operations
Navigation bar
Contents 21.0 CEO’s Message 3 2.0 Nokia in 2009 63.0 About the report 94.0 Employees 29 5.0 Supply chain 54 6.0 Corporate social investment 64 7.0 Environment 718.0 Operation 999.0 Key data 2009 11310.0 Independent Assurance 13311.0 Global Reporting Initiative Index 2009 138
8.1 Facility energy consumption, 100 emissions and water use
8.2 Factory initiatives 101 8.2.1 Dongguan, China 101 8.2.2 Chennai, India 101 8.2.3 Salo, Finland 102 8.2.4 Masan, South Korea 102 8.2.5 Other plants 1028.3 Energy efficiency 1038.4 Factory energy efficiency projects 1048.5 Renewable energy 1058.6 Green buildings 1068.7 Other sustainability projects 1088.8 Green logistics 1098.9 Travel and commuting 1108.10 Other environmental impacts 111
8.9Travel and commuting
We have made various efforts to reduce energy use and CO2 emissions related to the daily working of employees. The 2009 highlights and results include:
Air travelDuring 2009 we made various efforts to further reduce unnecessary business travel following our travel awareness campaigns held at the end of 2008. These included a stricter approach for business travel approvals together with the availability of 33 customised Halo suites and 178 high quality video conferencing facilities globally (at the end of 2009). This has helped to reduce the annual air travel related CO2 emissions by 41 percent from the 2008 level i.e. from 125,853 tonnes to 73,811 tonnes.
The figure covers more than 90 percent of Nokia’s (excluding NAVTEQ) air travel with a conservative interpretation applied to GHG Protocol emission factors.
We also continued a voluntary carbon offset scheme for flights on Nokia business. After a trip, the traveller can pay to offset the associated CO2 emissions and we will reimburse the cost. The payments will help to fund a balanced portfolio of projects around the world that focus on renewable energy and energy efficiency.
Leasing cars and employee commutingNokia Finland introduced a new environmentally friendly leasing car policy in January 2008. The policy promotes cars with CO2 emissions of less than 180g/km. At implementation, 55 percent of Nokia Finland’s cars met the emissions criteria. This increased to over 95 percent during 2009. The average of the whole fleet was about 159 g/km as compared to 180 g/km before the new policy implementation.
Nokia Finland supports public transportation for employee commuting. Approximately 1,000 employees were using the benefit during 2009.
Page 110Nokia sustainability report2009
8.9Travel and commuting
8.0Operations
Navigation bar
Contents 21.0 CEO’s Message 3 2.0 Nokia in 2009 63.0 About the report 94.0 Employees 29 5.0 Supply chain 54 6.0 Corporate social investment 64 7.0 Environment 718.0 Operation 999.0 Key data 2009 11310.0 Independent Assurance 13311.0 Global Reporting Initiative Index 2009 138
8.1 Facility energy consumption, 100 emissions and water use
8.2 Factory initiatives 101 8.2.1 Dongguan, China 101 8.2.2 Chennai, India 101 8.2.3 Salo, Finland 102 8.2.4 Masan, South Korea 102 8.2.5 Other plants 1028.3 Energy efficiency 1038.4 Factory energy efficiency projects 1048.5 Renewable energy 1058.6 Green buildings 1068.7 Other sustainability projects 1088.8 Green logistics 1098.9 Travel and commuting 1108.10 Other environmental impacts 111
8.10Other environmental impacts While energy efficiency is the most significant area where we can improve the environmental performance of our operations, we also continue to manage other important issues. Our performance in these areas is shown in Key Data 2009.
Water useWater at Nokia facilities is mainly used for sanitary and catering purposes, and to a smaller extent in gardening and facilities management, such as cooling towers. Production processes do not consume water.
VOCsVolatile organic compounds (VOC) arise from the use of solvents in the soldering and cleaning processes.
Ozone depleting substances (ODS)Ozone depleting substances are not used in our products or production. The reported ODS figures are due to refrigerants (HFC and HCFC types) contained in the cooling systems in facilities. According to our latest data, no CFC is used.
WasteOur goal is to reduce all waste to a minimum, especially the waste destined to end up untreated in landfills and, as much as possible, to find uses for the waste we do produce.
All factories have extensive recycling programs and the unrecycled items typically come from our factories’ support functions, for example canteens. Our total waste amount increased by four percent between 2008 and 2009, but this is mainly due to the increased reporting of reused packaging materials in factories. For instance together with suppliers we reuse the same component trays many times. This increasing of the reuse figure decreases the non-utilized waste while also increasing our total waste volumes. We managed to increase the waste utilization rates for the whole company, including offices, from 84 percent to 91 percent. This includes solid waste that is reused directly, recycled into materials, or used as a source of energy.
Page 111Nokia sustainability report2009
8.10Other environmental impacts
8.0Operations
Navigation bar
Contents 21.0 CEO’s Message 3 2.0 Nokia in 2009 63.0 About the report 94.0 Employees 29 5.0 Supply chain 54 6.0 Corporate social investment 64 7.0 Environment 718.0 Operation 999.0 Key data 2009 11310.0 Independent Assurance 13311.0 Global Reporting Initiative Index 2009 138
continued...
8.1 Facility energy consumption, 100 emissions and water use
8.2 Factory initiatives 101 8.2.1 Dongguan, China 101 8.2.2 Chennai, India 101 8.2.3 Salo, Finland 102 8.2.4 Masan, South Korea 102 8.2.5 Other plants 1028.3 Energy efficiency 1038.4 Factory energy efficiency projects 1048.5 Renewable energy 1058.6 Green buildings 1068.7 Other sustainability projects 1088.8 Green logistics 1098.9 Travel and commuting 1108.10 Other environmental impacts 111
We do not transport hazardous waste across borders. Our waste batteries and products do not fall under the hazardous waste classification in most countries/regions when transported after pre-treatment. There are minor amounts of common hazardous waste, like fluorescent lights, solvents and oil coming from factories and offices. We use approved recycling sub-contractors for our waste handling. These companies receive our waste flows locally. Recyclers have their own downstream supply chain that sometimes include trans-boundary waste shipments, when suitable treatment facilities, like metal refineries do not exist locally.
SpillsThere were no significant spills from Nokia facilities in 2009.
Assessments related to new factory constructionsIn all cases of new factory construction Nokia always requires an Environmental Impact Assessment (EIA) of the site prior to development. The objective of an EIA is to analyze to what extent the physical, biological and built environment will be affected by the construction, operation and maintenance of the facilities(e.g. factory, industrial park). Actions identified in the EIA are managed through management systems. Human rights, impact assessments have also been used to assess and manage the social impacts of operations on communities, including entering, operating, and exiting.
BiodiversityOur leased San Diego office in the USA is located next to a local wildlife protection area. Our owned factory in Manaus, Brazil is located close to a non-protected, albeit high biodiversity area. We are following local requirements closely and taking voluntary action to avoid negative impacts on local biodiversity.
Page 112Nokia sustainability report2009
8.0Operations
8.10Other environmental impacts (continued)
Navigation bar
Contents 21.0 CEO’s Message 3 2.0 Nokia in 2009 63.0 About the report 94.0 Employees 29 5.0 Supply chain 54 6.0 Corporate social investment 64 7.0 Environment 718.0 Operation 999.0 Key data 2009 11310.0 Independent Assurance 13311.0 Global Reporting Initiative Index 2009 138
8.1 Facility energy consumption, 100 emissions and water use
8.2 Factory initiatives 101 8.2.1 Dongguan, China 101 8.2.2 Chennai, India 101 8.2.3 Salo, Finland 102 8.2.4 Masan, South Korea 102 8.2.5 Other plants 1028.3 Energy efficiency 1038.4 Factory energy efficiency projects 1048.5 Renewable energy 1058.6 Green buildings 1068.7 Other sustainability projects 1088.8 Green logistics 1098.9 Travel and commuting 1108.10 Other environmental impacts 111
Page 113Nokia sustainability report2009
Navigation bar
Contents 21.0 CEO’s Message 3 2.0 Nokia in 2009 63.0 About the report 94.0 Employees 29 5.0 Supply chain 54 6.0 Corporate social investment 64 7.0 Environment 718.0 Operation 999.0 Key data 2009 11310.0 Independent Assurance 13311.0 Global Reporting Initiative Index 2009 138
9.0Key data 2009
9.1 Energy Consumption 1149.2 Facility Greenhouse Gas Emissions 1159.3 Nokia Air Travel Related Emissions 1169.4 Water use 1179.5 Waste utilization 118 9.6 No-load power consumption of 119 Nokia’s chargers 9.7 Life cycle assessment of energy use and GHG 120 emission of our products and processes9.8 Nokia key data 121 Notes 125
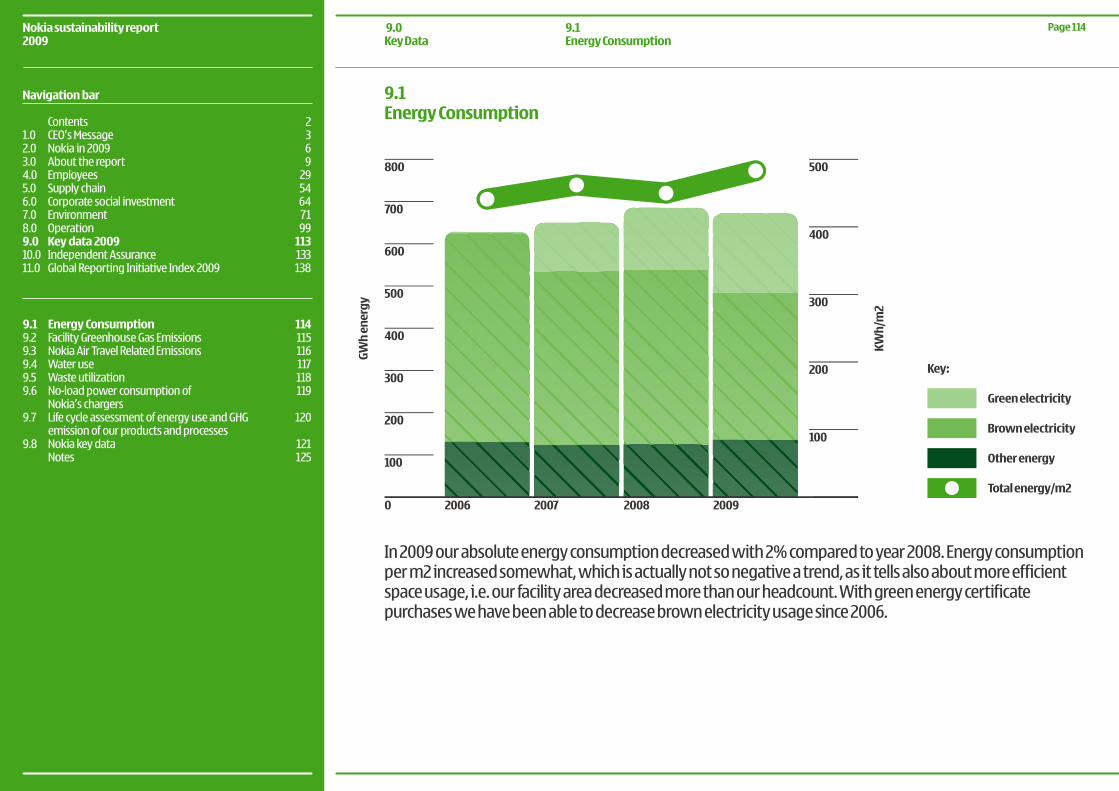
9.1Energy Consumption
In2009ourabsoluteenergyconsumptiondecreasedwith2%comparedtoyear2008.Energyconsumptionper m2 increased somewhat, which is actually not so negative a trend, as it tells also about more efficient space usage, i.e. our facility area decreased more than our headcount. With green energy certificate purchases we have been able to decrease brown electricity usage since 2006.
800 500
400
300
200
100
Total energy/m2
Other energy
Brown electricity
GWh
ener
gy
KWh/
m2
Green electricity
Key:
700
600
500
400
300
200
100
0 2006 2007 2008 2009
Page 114Nokia sustainability report2009
9.0Key Data
9.1Energy Consumption
Navigation bar
Contents 21.0 CEO’s Message 3 2.0 Nokia in 2009 63.0 About the report 94.0 Employees 29 5.0 Supply chain 54 6.0 Corporate social investment 64 7.0 Environment 718.0 Operation 999.0 Key data 2009 11310.0 Independent Assurance 13311.0 Global Reporting Initiative Index 2009 138
9.1 Energy Consumption 1149.2 Facility Greenhouse Gas Emissions 1159.3 Nokia Air Travel Related Emissions 1169.4 Water use 1179.5 Waste utilization 118 9.6 No-load power consumption of 119 Nokia’s chargers 9.7 Life cycle assessment of energy use and GHG 120 emission of our products and processes9.8 Nokia key data 121 Notes 125
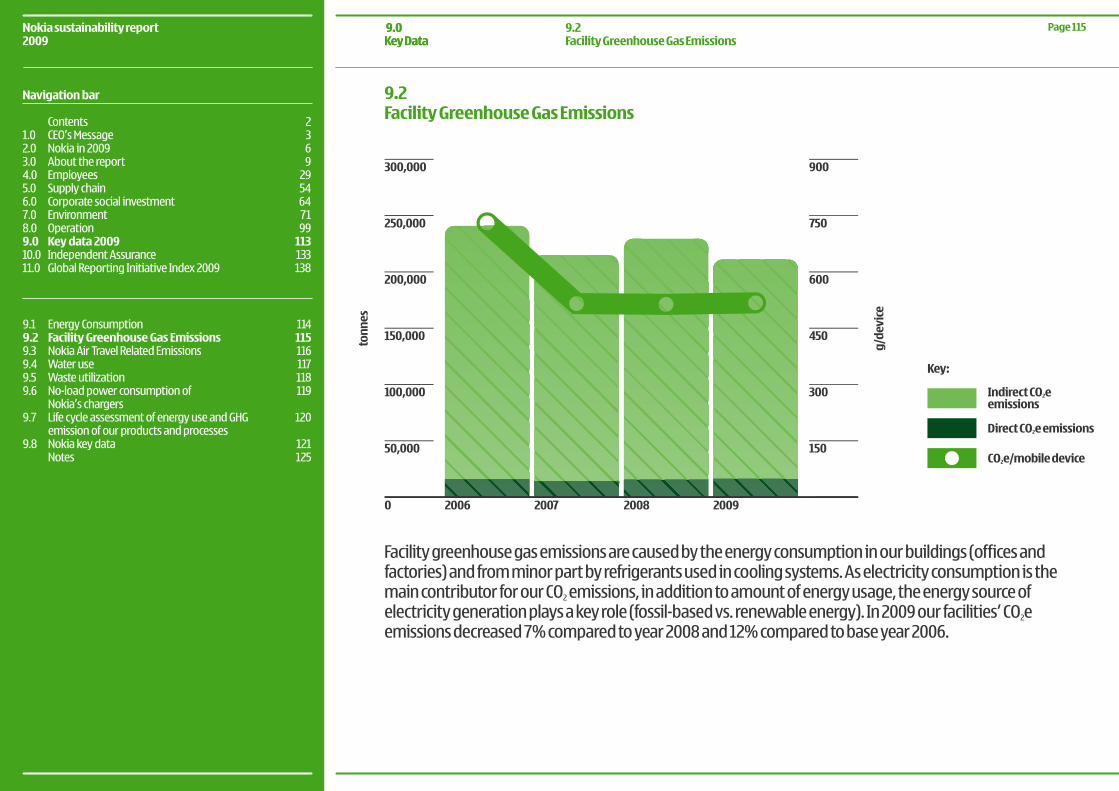
9.2Facility Greenhouse Gas Emissions
9.0Key Data
9.2Facility Greenhouse Gas Emissions
300,000
250,000
200,000
150,000
100,000
50,000
0 2006 2007 2008 2009
900
750
600
300
450
150CO2e/mobile device
Direct CO2e emissions
Indirect CO2eemissions
tonn
es
g/de
vice
Key:
Facility greenhouse gas emissions are caused by the energy consumption in our buildings (offices and factories) and from minor part by refrigerants used in cooling systems. As electricity consumption is the main contributor for our CO2 emissions, in addition to amount of energy usage, the energy source of electricity generation plays a key role (fossil-based vs. renewable energy). In 2009 our facilities’ CO2e emissionsdecreased7%comparedtoyear2008and12%comparedtobaseyear2006.
Page 115Nokia sustainability report2009
9.0Key Data
Navigation bar
Contents 21.0 CEO’s Message 3 2.0 Nokia in 2009 63.0 About the report 94.0 Employees 29 5.0 Supply chain 54 6.0 Corporate social investment 64 7.0 Environment 718.0 Operation 999.0 Key data 2009 11310.0 Independent Assurance 13311.0 Global Reporting Initiative Index 2009 138
9.1 Energy Consumption 1149.2 Facility Greenhouse Gas Emissions 1159.3 Nokia Air Travel Related Emissions 1169.4 Water use 1179.5 Waste utilization 118 9.6 No-load power consumption of 119 Nokia’s chargers 9.7 Life cycle assessment of energy use and GHG 120 emission of our products and processes9.8 Nokia key data 121 Notes 125
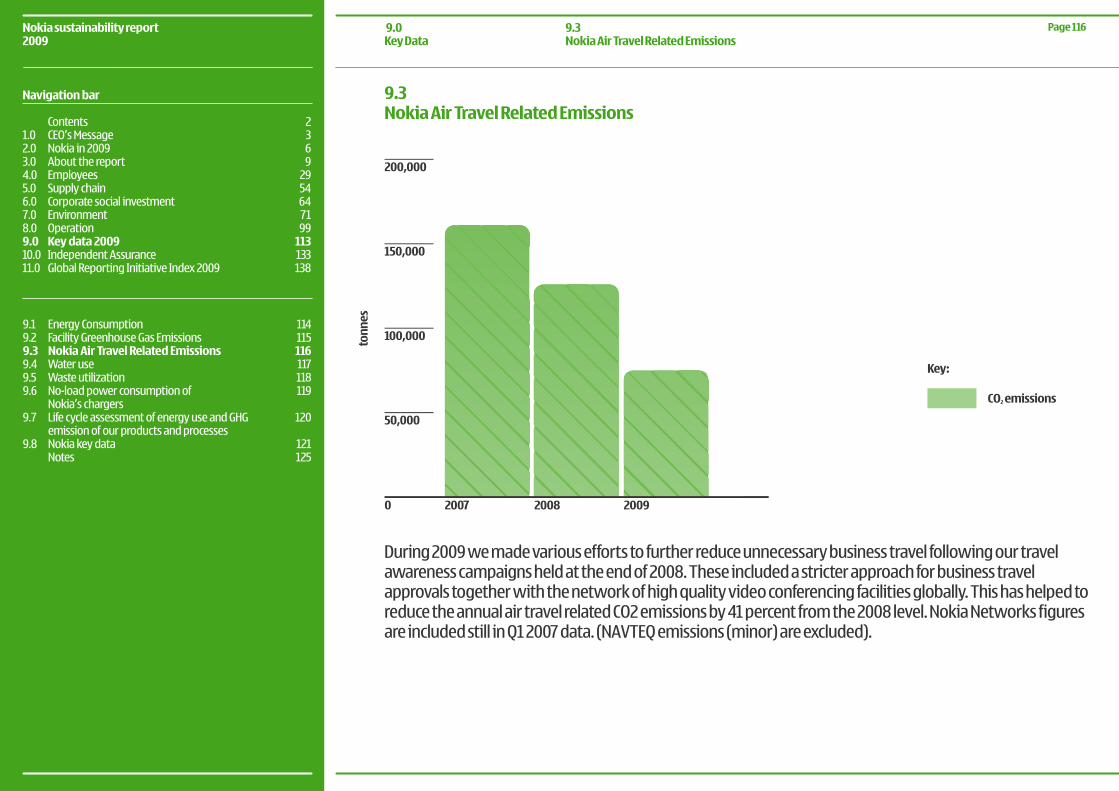
9.3Nokia Air Travel Related Emissions
200,000
150,000
100,000
50,000
0 2007 2008 2009
tonn
es
CO2 emissions
Key:
During 2009 we made various efforts to further reduce unnecessary business travel following our travel awareness campaigns held at the end of 2008. These included a stricter approach for business travel approvals together with the network of high quality video conferencing facilities globally. This has helped to reduce the annual air travel related CO2 emissions by 41 percent from the 2008 level. Nokia Networks figures are included still in Q1 2007 data. (NAVTEQ emissions (minor) are excluded).
Page 116Nokia sustainability report2009
9.3Nokia Air Travel Related Emissions
9.0Key Data
Navigation bar
Contents 21.0 CEO’s Message 3 2.0 Nokia in 2009 63.0 About the report 94.0 Employees 29 5.0 Supply chain 54 6.0 Corporate social investment 64 7.0 Environment 718.0 Operation 999.0 Key data 2009 11310.0 Independent Assurance 13311.0 Global Reporting Initiative Index 2009 138
9.1 Energy Consumption 1149.2 Facility Greenhouse Gas Emissions 1159.3 Nokia Air Travel Related Emissions 1169.4 Water use 1179.5 Waste utilization 118 9.6 No-load power consumption of 119 Nokia’s chargers 9.7 Life cycle assessment of energy use and GHG 120 emission of our products and processes9.8 Nokia key data 121 Notes 125
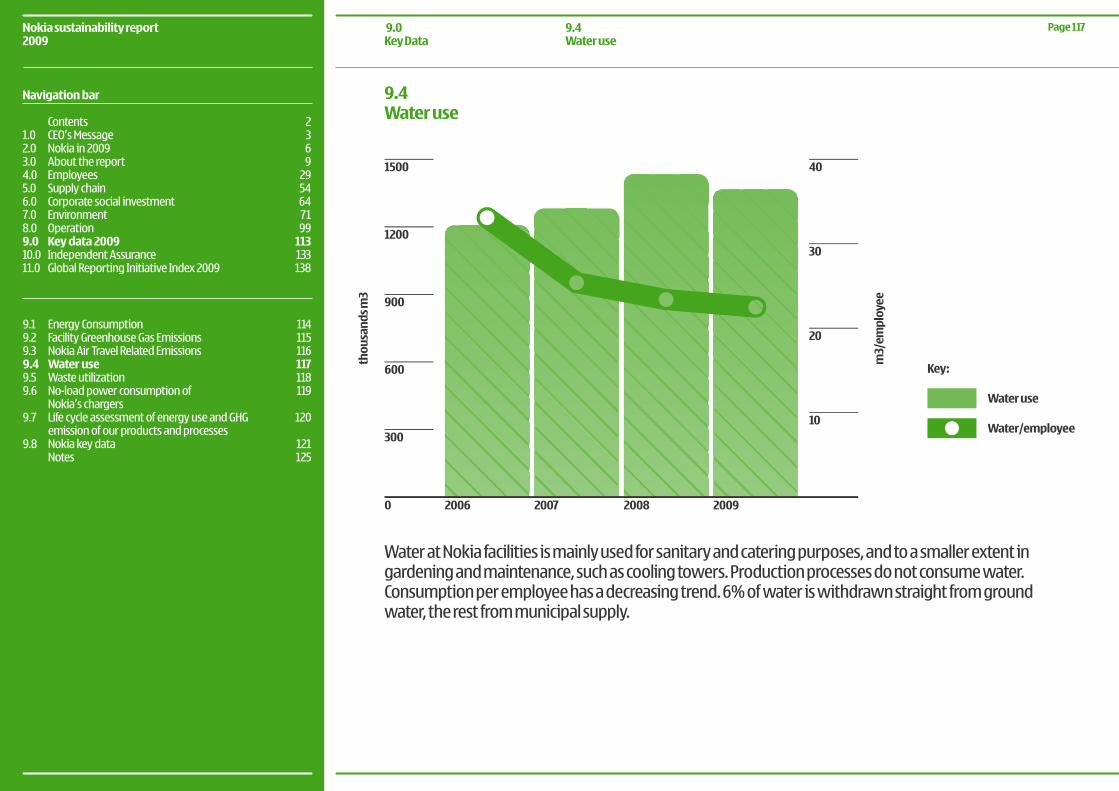
9.4Water use
Water/employee
Water use
Key:
Water at Nokia facilities is mainly used for sanitary and catering purposes, and to a smaller extent in gardening and maintenance, such as cooling towers. Production processes do not consume water.Consumptionperemployeehasadecreasingtrend.6%ofwateriswithdrawnstraightfromground water, the rest from municipal supply.
1500
1200
900
600
300
0 2006 2007 2008 2009
30
40
20
10
thou
sand
s m3
m3/
empl
oyee
Page 117Nokia sustainability report2009
9.4Water use
9.0Key Data
Navigation bar
Contents 21.0 CEO’s Message 3 2.0 Nokia in 2009 63.0 About the report 94.0 Employees 29 5.0 Supply chain 54 6.0 Corporate social investment 64 7.0 Environment 718.0 Operation 999.0 Key data 2009 11310.0 Independent Assurance 13311.0 Global Reporting Initiative Index 2009 138
9.1 Energy Consumption 1149.2 Facility Greenhouse Gas Emissions 1159.3 Nokia Air Travel Related Emissions 1169.4 Water use 1179.5 Waste utilization 118 9.6 No-load power consumption of 119 Nokia’s chargers 9.7 Life cycle assessment of energy use and GHG 120 emission of our products and processes9.8 Nokia key data 121 Notes 125
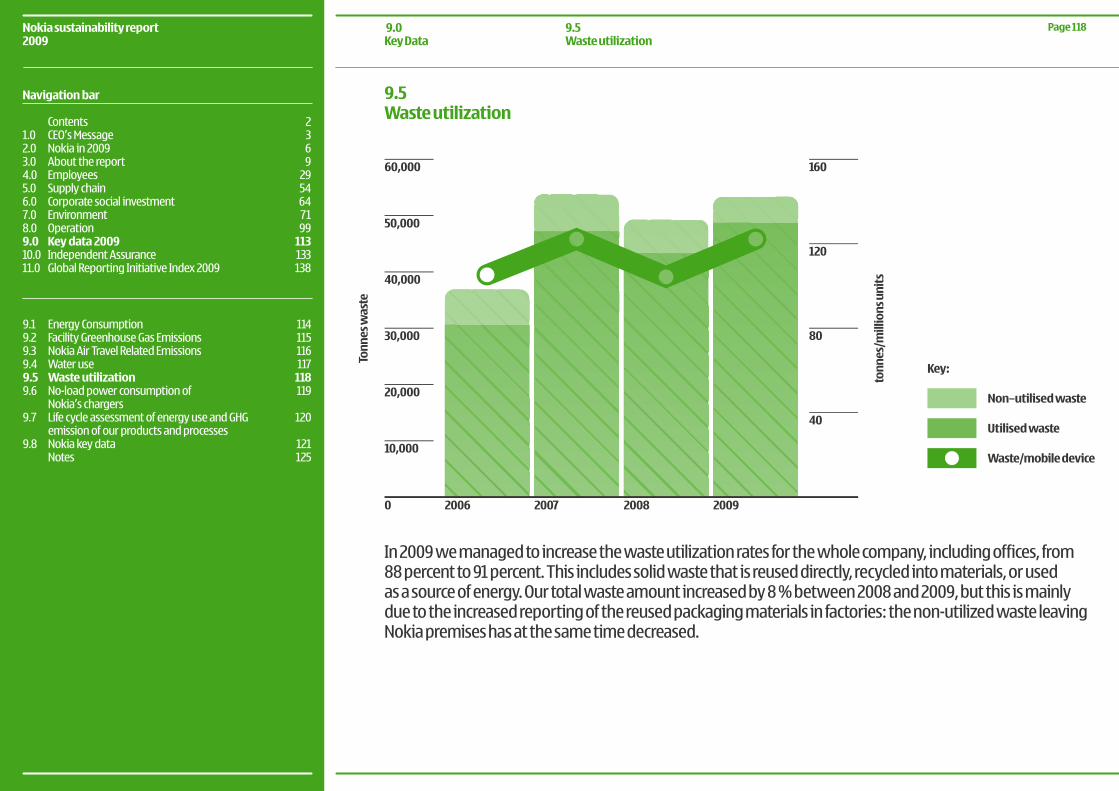
9.5 Waste utilization
In 2009 we managed to increase the waste utilization rates for the whole company, including offices, from 88 percent to 91 percent. This includes solid waste that is reused directly, recycled into materials, or usedasasourceofenergy.Ourtotalwasteamountincreasedby8%between2008and2009,butthisismainlydue to the increased reporting of the reused packaging materials in factories: the non-utilized waste leaving Nokia premises has at the same time decreased.
Waste/mobile device
Utilised waste
Non–utilised waste
Key:
60,000
50,000
40,000
30,000
20,000
10,000
0 2006 2007 2008 2009
160
120
80
40
Tonn
es w
aste
tonn
es/m
illio
ns u
nits
Page 118Nokia sustainability report2009
9.0Key Data
9.5Waste utilization
Navigation bar
Contents 21.0 CEO’s Message 3 2.0 Nokia in 2009 63.0 About the report 94.0 Employees 29 5.0 Supply chain 54 6.0 Corporate social investment 64 7.0 Environment 718.0 Operation 999.0 Key data 2009 11310.0 Independent Assurance 13311.0 Global Reporting Initiative Index 2009 138
9.1 Energy Consumption 1149.2 Facility Greenhouse Gas Emissions 1159.3 Nokia Air Travel Related Emissions 1169.4 Water use 1179.5 Waste utilization 118 9.6 No-load power consumption of 119 Nokia’s chargers 9.7 Life cycle assessment of energy use and GHG 120 emission of our products and processes9.8 Nokia key data 121 Notes 125
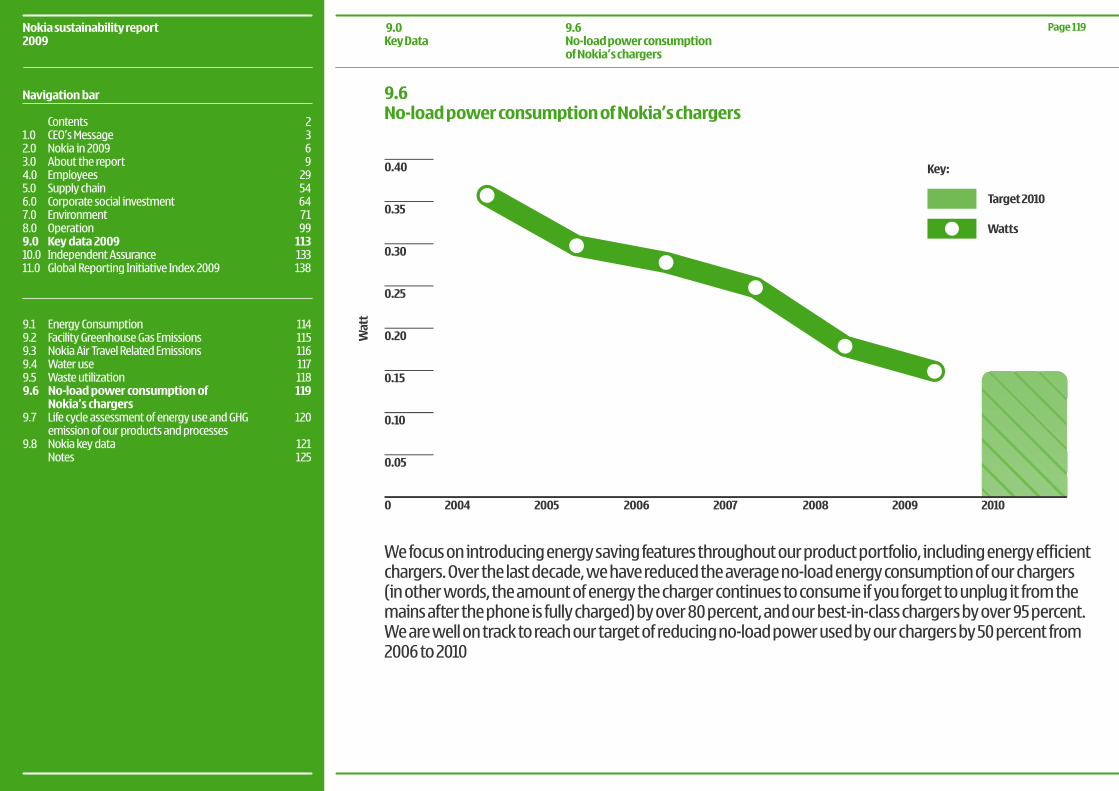
We focus on introducing energy saving features throughout our product portfolio, including energy efficient chargers. Over the last decade, we have reduced the average no-load energy consumption of our chargers (in other words, the amount of energy the charger continues to consume if you forget to unplug it from the mains after the phone is fully charged) by over 80 percent, and our best-in-class chargers by over 95 percent. We are well on track to reach our target of reducing no-load power used by our chargers by 50 percent from 2006 to 2010
9.6No-load power consumption of Nokia’s chargers
9.6No-load power consumption of Nokia’s chargers
0.10
0.15
0.20
0.25
0.30
0.35
0.40
0.05
0 2004 2005 2006 2007 2008 2009 2010
Watts
Target 2010
Key:
Wat
t
Page 119Nokia sustainability report2009
9.0Key Data
Navigation bar
Contents 21.0 CEO’s Message 3 2.0 Nokia in 2009 63.0 About the report 94.0 Employees 29 5.0 Supply chain 54 6.0 Corporate social investment 64 7.0 Environment 718.0 Operation 999.0 Key data 2009 11310.0 Independent Assurance 13311.0 Global Reporting Initiative Index 2009 138
9.1 Energy Consumption 1149.2 Facility Greenhouse Gas Emissions 1159.3 Nokia Air Travel Related Emissions 1169.4 Water use 1179.5 Waste utilization 118 9.6 No-load power consumption of 119 Nokia’s chargers 9.7 Life cycle assessment of energy use and GHG 120 emission of our products and processes9.8 Nokia key data 121 Notes 125
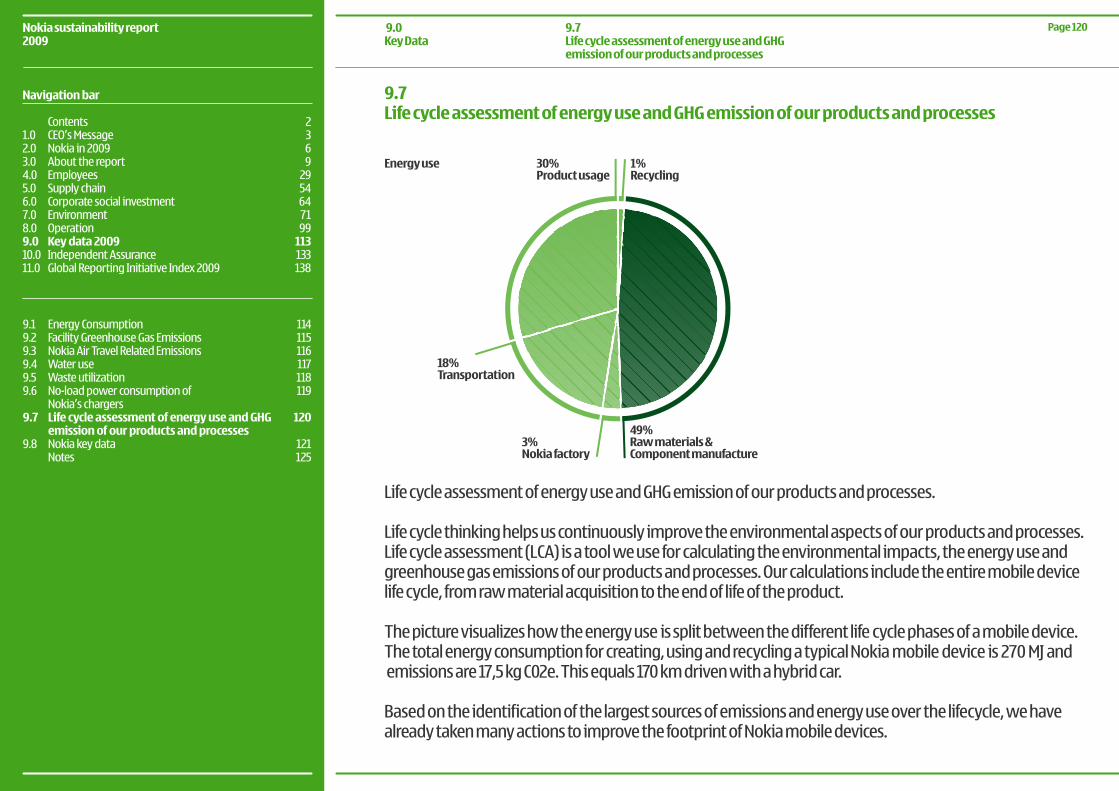
Life cycle assessment of energy use and GHG emission of our products and processes.
Life cycle thinking helps us continuously improve the environmental aspects of our products and processes. Life cycle assessment (LCA) is a tool we use for calculating the environmental impacts, the energy use and greenhouse gas emissions of our products and processes. Our calculations include the entire mobile device life cycle, from raw material acquisition to the end of life of the product.
The picture visualizes how the energy use is split between the different life cycle phases of a mobile device. The total energy consumption for creating, using and recycling a typical Nokia mobile device is 270 MJ and emissions are 17,5 kg C02e. This equals 170 km driven with a hybrid car.
Based on the identification of the largest sources of emissions and energy use over the lifecycle, we have already taken many actions to improve the footprint of Nokia mobile devices.
9.7Life cycle assessment of energy use and GHG emission of our products and processes
9.7Life cycle assessment of energy use and GHG emission of our products and processes
Page 120Nokia sustainability report2009
9.0Key Data
1%Recycling
30%Product usage
Energy use
49%Raw materials &Component manufacture
3%Nokia factory
18%Transportation
Navigation bar
Contents 21.0 CEO’s Message 3 2.0 Nokia in 2009 63.0 About the report 94.0 Employees 29 5.0 Supply chain 54 6.0 Corporate social investment 64 7.0 Environment 718.0 Operation 999.0 Key data 2009 11310.0 Independent Assurance 13311.0 Global Reporting Initiative Index 2009 138
9.1 Energy Consumption 1149.2 Facility Greenhouse Gas Emissions 1159.3 Nokia Air Travel Related Emissions 1169.4 Water use 1179.5 Waste utilization 118 9.6 No-load power consumption of 119 Nokia’s chargers 9.7 Life cycle assessment of energy use and GHG 120 emission of our products and processes9.8 Nokia key data 121 Notes 125
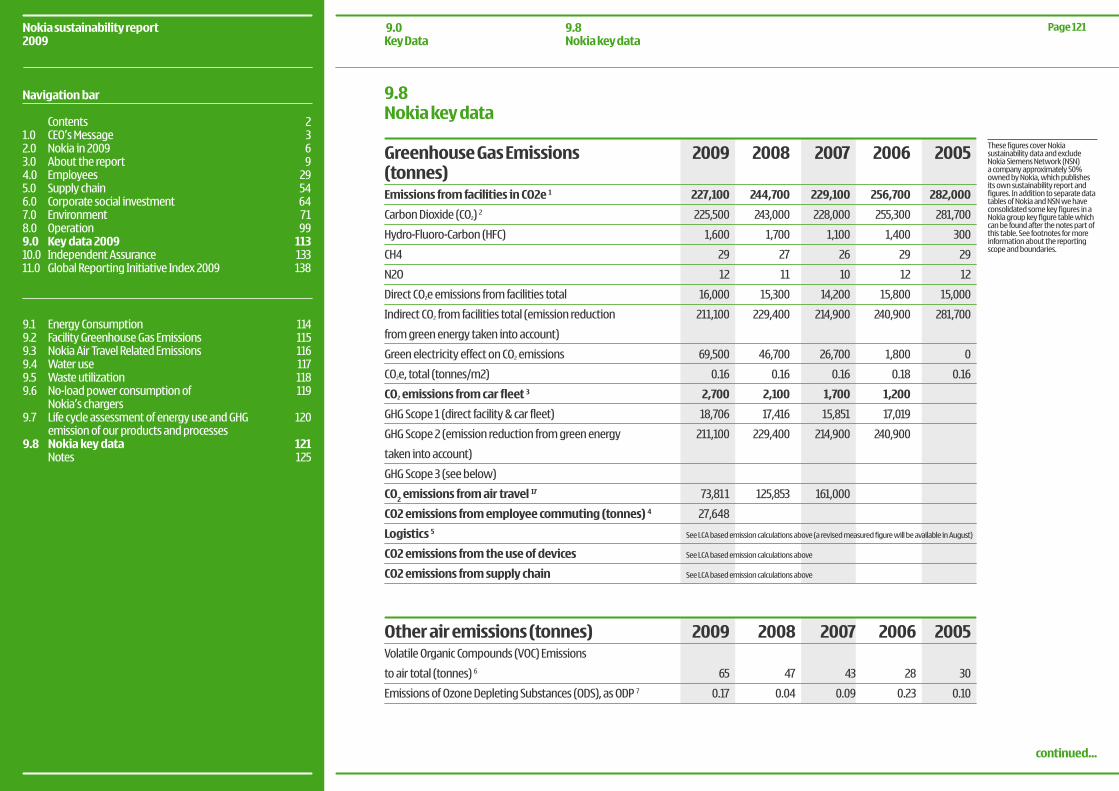
Greenhouse Gas Emissions (tonnes)Emissions from facilities in CO2e 1
Carbon Dioxide (CO2) 2
Hydro-Fluoro-Carbon (HFC)
CH4
N2O
Direct CO2e emissions from facilities total
Indirect CO2 from facilities total (emission reduction
from green energy taken into account)
Green electricity effect on CO2 emissions
CO2e, total (tonnes/m2)
CO2 emissions from car fleet 3
GHG Scope 1 (direct facility & car fleet)
GHG Scope 2 (emission reduction from green energy
taken into account)
GHG Scope 3 (see below)
CO2 emissions from air travel 17
CO2 emissions from employee commuting (tonnes) 4
Logistics 5
CO2 emissions from the use of devices
CO2 emissions from supply chain
Other air emissions (tonnes)Volatile Organic Compounds (VOC) Emissions
to air total (tonnes) 6
Emissions of Ozone Depleting Substances (ODS), as ODP 7
9.8 Nokia key data
These figures cover Nokia sustainability data and exclude Nokia Siemens Network (NSN) acompanyapproximately50%owned by Nokia, which publishes its own sustainability report and figures. In addition to separate data tables of Nokia and NSN we have consolidated some key figures in a Nokia group key figure table which can be found after the notes part of this table. See footnotes for more information about the reporting scope and boundaries.
2009
227,100
225,500
1,600
29
12
16,000
211,100
69,500
0.16
2,700
18,706
211,100
73,811
27,648
2009
65
0.17
2008
47
0.04
2007
43
0.09
2006
28
0.23
2005
30
0.10
2008
244,700
243,000
1,700
27
11
15,300
229,400
46,700
0.16
2,100
17,416
229,400
125,853
2007
229,100
228,000
1,100
26
10
14,200
214,900
26,700
0.16
1,700
15,851
214,900
161,000
2006
256,700
255,300
1,400
29
12
15,800
240,900
1,800
0.18
1,200
17,019
240,900
2005
282,000
281,700
300
29
12
15,000
281,700
0
0.16
See LCA based emission calculations above (a revised measured figure will be available in August)
See LCA based emission calculations above
See LCA based emission calculations above
Page 121Nokia sustainability report2009
9.8Nokia key data
9.0Key Data
Navigation bar
Contents 21.0 CEO’s Message 3 2.0 Nokia in 2009 63.0 About the report 94.0 Employees 29 5.0 Supply chain 54 6.0 Corporate social investment 64 7.0 Environment 718.0 Operation 999.0 Key data 2009 11310.0 Independent Assurance 13311.0 Global Reporting Initiative Index 2009 138
continued...
9.1 Energy Consumption 1149.2 Facility Greenhouse Gas Emissions 1159.3 Nokia Air Travel Related Emissions 1169.4 Water use 1179.5 Waste utilization 118 9.6 No-load power consumption of 119 Nokia’s chargers 9.7 Life cycle assessment of energy use and GHG 120 emission of our products and processes9.8 Nokia key data 121 Notes 125
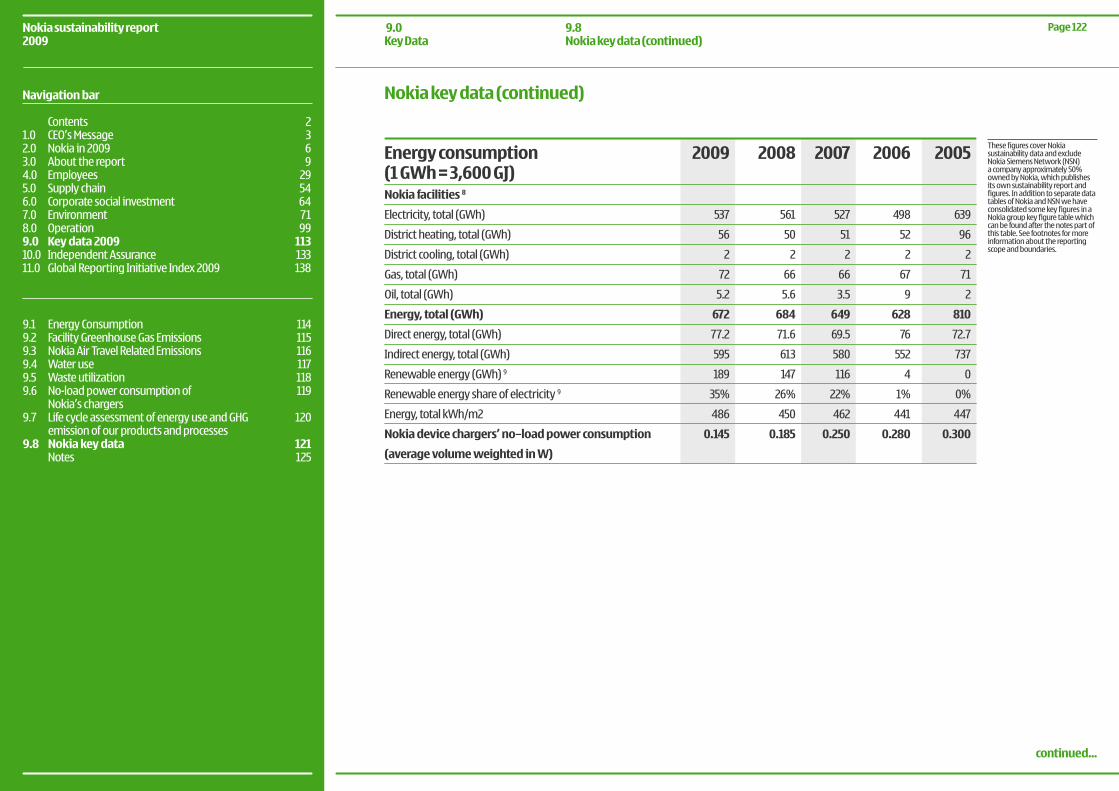
Energy consumption (1 GWh = 3,600 GJ) Nokia facilities 8
Electricity, total (GWh)
District heating, total (GWh)
District cooling, total (GWh)
Gas, total (GWh)
Oil, total (GWh)
Energy, total (GWh)
Direct energy, total (GWh)
Indirect energy, total (GWh)
Renewable energy (GWh) 9
Renewable energy share of electricity 9
Energy, total kWh/m2
Nokia device chargers’ no–load power consumption
(average volume weighted in W)
These figures cover Nokia sustainability data and exclude Nokia Siemens Network (NSN) acompanyapproximately50%owned by Nokia, which publishes its own sustainability report and figures. In addition to separate data tables of Nokia and NSN we have consolidated some key figures in a Nokia group key figure table which can be found after the notes part of this table. See footnotes for more information about the reporting scope and boundaries.
2009
537
56
2
72
5.2
672
77.2
595
189
35%
486
0.145
2008
561
50
2
66
5.6
684
71.6
613
147
26%
450
0.185
2007
527
51
2
66
3.5
649
69.5
580
116
22%
462
0.250
2006
498
52
2
67
9
628
76
552
4
1%
441
0.280
2005
639
96
2
71
2
810
72.7
737
0
0%
447
0.300
Nokia key data (continued)
Page 122Nokia sustainability report2009
9.8Nokia key data (continued)
9.0Key Data
Navigation bar
Contents 21.0 CEO’s Message 3 2.0 Nokia in 2009 63.0 About the report 94.0 Employees 29 5.0 Supply chain 54 6.0 Corporate social investment 64 7.0 Environment 718.0 Operation 999.0 Key data 2009 11310.0 Independent Assurance 13311.0 Global Reporting Initiative Index 2009 138
continued...
9.1 Energy Consumption 1149.2 Facility Greenhouse Gas Emissions 1159.3 Nokia Air Travel Related Emissions 1169.4 Water use 1179.5 Waste utilization 118 9.6 No-load power consumption of 119 Nokia’s chargers 9.7 Life cycle assessment of energy use and GHG 120 emission of our products and processes9.8 Nokia key data 121 Notes 125
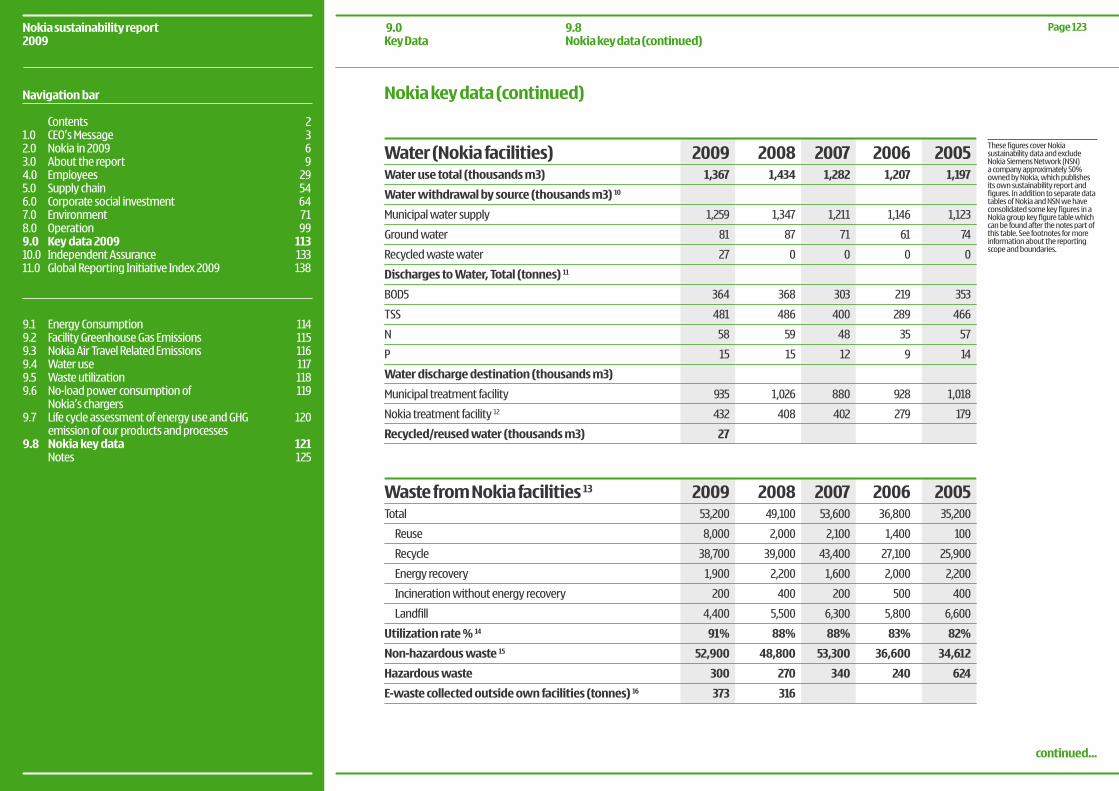
Water (Nokia facilities) Water use total (thousands m3)
Water withdrawal by source (thousands m3) 10
Municipal water supply
Ground water
Recycled waste water
Discharges to Water, Total (tonnes) 11
BOD5
TSS
N
P
Water discharge destination (thousands m3)
Municipal treatment facility
Nokia treatment facility 12
Recycled/reused water (thousands m3)
Waste from Nokia facilities 13 Total
Reuse
Recycle
Energy recovery
Incineration without energy recovery
Landfill
Utilization rate % 14
Non-hazardous waste 15
Hazardous waste
E-waste collected outside own facilities (tonnes) 16
These figures cover Nokia sustainability data and exclude Nokia Siemens Network (NSN) acompanyapproximately50%owned by Nokia, which publishes its own sustainability report and figures. In addition to separate data tables of Nokia and NSN we have consolidated some key figures in a Nokia group key figure table which can be found after the notes part of this table. See footnotes for more information about the reporting scope and boundaries.
20091,367
1,259
81
27
364
481
58
15
935
432
27
200953,200
8,000
38,700
1,900
200
4,400
91%
52,900
300
373
20081,434
1,347
87
0
368
486
59
15
1,026
408
200849,100
2,000
39,000
2,200
400
5,500
88%
48,800
270
316
20071,282
1,211
71
0
303
400
48
12
880
402
200753,600
2,100
43,400
1,600
200
6,300
88%
53,300
340
20061,207
1,146
61
0
219
289
35
9
928
279
200636,800
1,400
27,100
2,000
500
5,800
83%
36,600
240
20051,197
1,123
74
0
353
466
57
14
1,018
179
200535,200
100
25,900
2,200
400
6,600
82%
34,612
624
Nokia key data (continued)
Page 123Nokia sustainability report2009
9.8Nokia key data (continued)
9.0Key Data
Navigation bar
Contents 21.0 CEO’s Message 3 2.0 Nokia in 2009 63.0 About the report 94.0 Employees 29 5.0 Supply chain 54 6.0 Corporate social investment 64 7.0 Environment 718.0 Operation 999.0 Key data 2009 11310.0 Independent Assurance 13311.0 Global Reporting Initiative Index 2009 138
continued...
9.1 Energy Consumption 1149.2 Facility Greenhouse Gas Emissions 1159.3 Nokia Air Travel Related Emissions 1169.4 Water use 1179.5 Waste utilization 118 9.6 No-load power consumption of 119 Nokia’s chargers 9.7 Life cycle assessment of energy use and GHG 120 emission of our products and processes9.8 Nokia key data 121 Notes 125
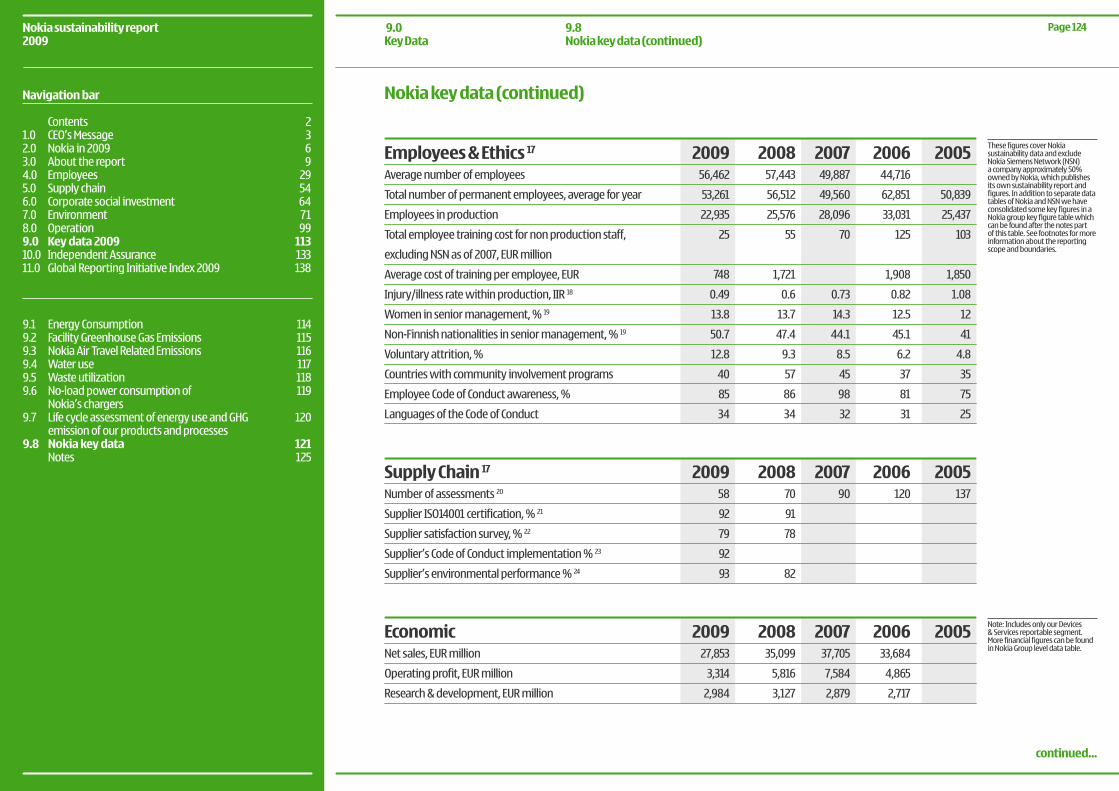
Employees & Ethics 17 Average number of employees
Total number of permanent employees, average for year
Employees in production
Total employee training cost for non production staff,
excluding NSN as of 2007, EUR million
Average cost of training per employee, EUR
Injury/illness rate within production, IIR 18
Womeninseniormanagement,%19
Non-Finnishnationalitiesinseniormanagement,%19
Voluntaryattrition,%
Countries with community involvement programs
EmployeeCodeofConductawareness,%
Languages of the Code of Conduct
Supply Chain 17 Number of assessments 20
SupplierISO14001certification,%21
Suppliersatisfactionsurvey,%22
Supplier’sCodeofConductimplementation%23
Supplier’senvironmentalperformance%24
Economic Net sales, EUR million
Operating profit, EUR million
Research & development, EUR million
These figures cover Nokia sustainability data and exclude Nokia Siemens Network (NSN) acompanyapproximately50%owned by Nokia, which publishes its own sustainability report and figures. In addition to separate data tables of Nokia and NSN we have consolidated some key figures in a Nokia group key figure table which can be found after the notes part of this table. See footnotes for more information about the reporting scope and boundaries.
Note: Includes only our Devices & Services reportable segment. More financial figures can be found in Nokia Group level data table.
200956,462
53,261
22,935
25
748
0.49
13.8
50.7
12.8
40
85
34
200958
92
79
92
93
200927,853
3,314
2,984
200857,443
56,512
25,576
55
1,721
0.6
13.7
47.4
9.3
57
86
34
200870
91
78
82
200835,099
5,816
3,127
200749,887
49,560
28,096
70
0.73
14.3
44.1
8.5
45
98
32
200790
200737,705
7,584
2,879
200644,716
62,851
33,031
125
1,908
0.82
12.5
45.1
6.2
37
81
31
2006120
200633,684
4,865
2,717
2005
50,839
25,437
103
1,850
1.08
12
41
4.8
35
75
25
2005137
2005
Nokia key data (continued)
Page 124Nokia sustainability report2009
9.8Nokia key data (continued)
9.0Key Data
Navigation bar
Contents 21.0 CEO’s Message 3 2.0 Nokia in 2009 63.0 About the report 94.0 Employees 29 5.0 Supply chain 54 6.0 Corporate social investment 64 7.0 Environment 718.0 Operation 999.0 Key data 2009 11310.0 Independent Assurance 13311.0 Global Reporting Initiative Index 2009 138
continued...
9.1 Energy Consumption 1149.2 Facility Greenhouse Gas Emissions 1159.3 Nokia Air Travel Related Emissions 1169.4 Water use 1179.5 Waste utilization 118 9.6 No-load power consumption of 119 Nokia’s chargers 9.7 Life cycle assessment of energy use and GHG 120 emission of our products and processes9.8 Nokia key data 121 Notes 125
Notes
The following scope has been used for facility related data (energy, emission from facilities, other air emissions, waste and water) in the above table: NAVTEQ figures have been included in year 2009 report, which is the first full year for NAVTEQ being part of Nokia Group. NAVTEQ increased Nokia consumption values witharound5%.AlthoughNAVTEQhasbeenpartofNokiaGrouponlyfrommid2008onwards,NAVTEQdatahas been included also for 2007 and 2006 according to WRI/WBCSD Greenhouse Gas Protocol requirements to recalculate acquisition’s effect until base year, which is 2006 in case of Nokia. Nokia’s former Networks business group and functions supporting Networks have been excluded from year 2006 and 2007 figures. Datacovers100%ofsquaremetersmanagedbyNokiain2006-2009;datacollectioncoveragehasbeen90-92%ofallsquaremeters,includingallproductionsitesandothersitesgreaterthan3000sqm.Datafromsmaller than 3000 sqm sites has been estimated based on Nokia averages.
Due to above explained scope definitions year 2006-2009 data in the above table are comparable between each other but differ from figures published in previous reports. Year 2005 figures have not been recalculated and hence are not directly comparable with the rest of the data.
1) Our approach to measuring greenhouse gas emissions follows the Greenhouse Gas (GHG) Protocol (www.ghgprotocol.org) developed by the World Resources Institute (WRI) and the World Business Council for Sustainable Development (WBCSD). The GHG Protocol defines three scopes of CO2 emissions: Scope 1 - direct emissions, from sources owned or controlled by the company Scope 2 - indirect emissions, from the consumption of purchased electricity, heat, and/or steam Scope 3 - indirect emissions, as a consequence of the activities of the company, but from sources not owned
or controlled by the company.
Organizational boundaries We use the “operational control” approach (instead of equity share approach) , which means we include entities based on whether we can introduce and implement operating policies rather than on the basis of financial control. Thus, Nokia Siemens Networks’ energy consumption and emissions are included in Nokia Group’s performance and shown in summary tables. As Nokia Siemens Networks’ daily operations are separate, detailed data management and reporting are done separately.
Our GHG measurements have been verified by third party since 2003 and verifications will continueon an annual basis. Read the assurance report.
Page 125Nokia sustainability report2009
9.8Nokia key data (continued)
9.0Key Data
Navigation bar
Contents 21.0 CEO’s Message 3 2.0 Nokia in 2009 63.0 About the report 94.0 Employees 29 5.0 Supply chain 54 6.0 Corporate social investment 64 7.0 Environment 718.0 Operation 999.0 Key data 2009 11310.0 Independent Assurance 13311.0 Global Reporting Initiative Index 2009 138
continued...
9.1 Energy Consumption 1149.2 Facility Greenhouse Gas Emissions 1159.3 Nokia Air Travel Related Emissions 1169.4 Water use 1179.5 Waste utilization 118 9.6 No-load power consumption of 119 Nokia’s chargers 9.7 Life cycle assessment of energy use and GHG 120 emission of our products and processes9.8 Nokia key data 121 Notes 125
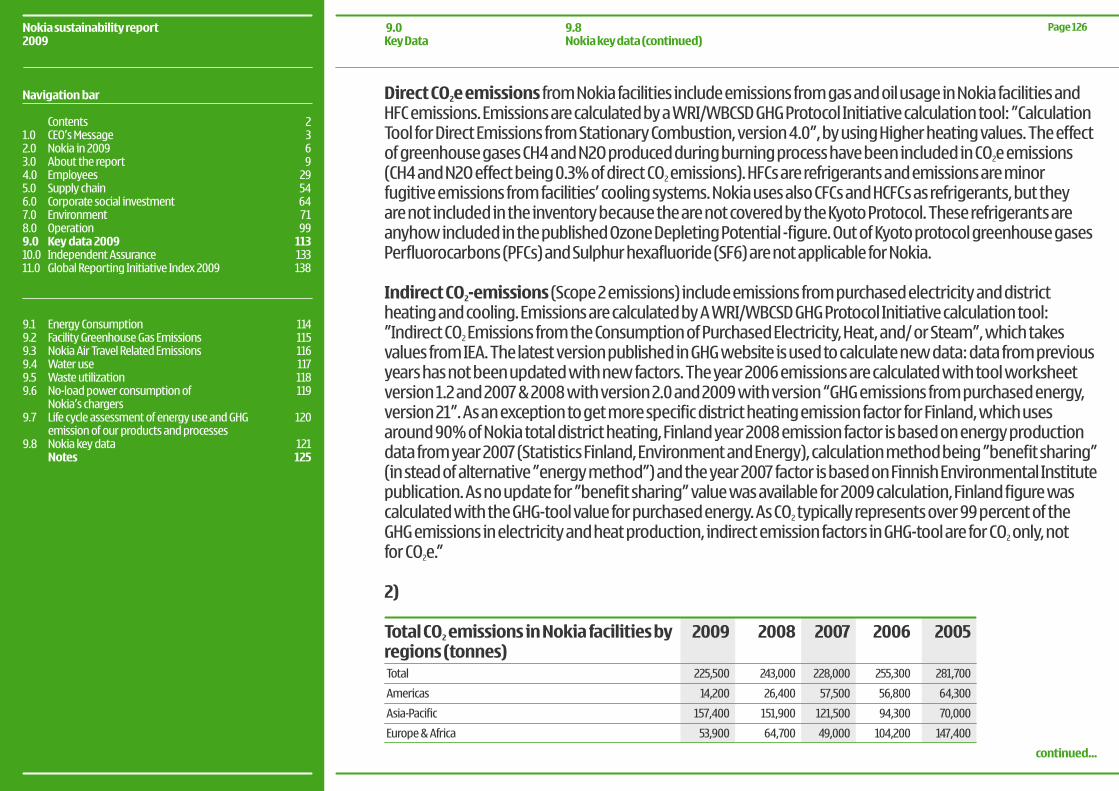
Direct CO2e emissions from Nokia facilities include emissions from gas and oil usage in Nokia facilities and HFC emissions. Emissions are calculated by a WRI/WBCSD GHG Protocol Initiative calculation tool: ”Calculation Tool for Direct Emissions from Stationary Combustion, version 4.0”, by using Higher heating values. The effect of greenhouse gases CH4 and N2O produced during burning process have been included in CO2e emissions (CH4andN2Oeffectbeing0.3%ofdirectCO2 emissions). HFCs are refrigerants and emissions are minor fugitive emissions from facilities’ cooling systems. Nokia uses also CFCs and HCFCs as refrigerants, but they are not included in the inventory because the are not covered by the Kyoto Protocol. These refrigerants are anyhow included in the published Ozone Depleting Potential -figure. Out of Kyoto protocol greenhouse gases Perfluorocarbons (PFCs) and Sulphur hexafluoride (SF6) are not applicable for Nokia.
Indirect CO2-emissions (Scope 2 emissions) include emissions from purchased electricity and district heating and cooling. Emissions are calculated by A WRI/WBCSD GHG Protocol Initiative calculation tool: ”Indirect CO2 Emissions from the Consumption of Purchased Electricity, Heat, and/ or Steam”, which takes values from IEA. The latest version published in GHG website is used to calculate new data: data from previous years has not been updated with new factors. The year 2006 emissions are calculated with tool worksheet version 1.2 and 2007 & 2008 with version 2.0 and 2009 with version “GHG emissions from purchased energy, version 21”. As an exception to get more specific district heating emission factor for Finland, which uses around90%ofNokiatotaldistrictheating,Finlandyear2008emissionfactorisbasedonenergyproductiondata from year 2007 (Statistics Finland, Environment and Energy), calculation method being ”benefit sharing” (in stead of alternative ”energy method”) and the year 2007 factor is based on Finnish Environmental Institute publication. As no update for ”benefit sharing” value was available for 2009 calculation, Finland figure was calculated with the GHG-tool value for purchased energy. As CO2 typically represents over 99 percent of the GHG emissions in electricity and heat production, indirect emission factors in GHG-tool are for CO2 only, not for CO2e.”
2)
Total CO2 emissions in Nokia facilities by regions (tonnes) Total
Americas
Asia-Pacific
Europe & Africa
2009
225,500
14,200
157,400
53,900
2008
243,000
26,400
151,900
64,700
2007
228,000
57,500
121,500
49,000
2006
255,300
56,800
94,300
104,200
2005
281,700
64,300
70,000
147,400
Page 126Nokia sustainability report2009
9.8Nokia key data (continued)
9.0Key Data
Navigation bar
Contents 21.0 CEO’s Message 3 2.0 Nokia in 2009 63.0 About the report 94.0 Employees 29 5.0 Supply chain 54 6.0 Corporate social investment 64 7.0 Environment 718.0 Operation 999.0 Key data 2009 11310.0 Independent Assurance 13311.0 Global Reporting Initiative Index 2009 138
continued...
9.1 Energy Consumption 1149.2 Facility Greenhouse Gas Emissions 1159.3 Nokia Air Travel Related Emissions 1169.4 Water use 1179.5 Waste utilization 118 9.6 No-load power consumption of 119 Nokia’s chargers 9.7 Life cycle assessment of energy use and GHG 120 emission of our products and processes9.8 Nokia key data 121 Notes 125
3) Car fleet emissions include NAVTEQ fleet used in Digital Mapping Operations. Sources of carbon conversion factors (i.e. for converting distance driven to kg of CO2) are following:
Europe: Guidelines to Defra / DECC’s GHG Conversion Factors for Company Reporting. Factors based on an equal split between medium sized petrol and medium .
North America: Calculated with data from www.Fueleconomy.gov and based on the composition of NAVTEQ car fleet.
Rest of the World: DECC’s GHG Conversion Factors for Company Reporting. Factors based on medium sized petrol cars only.
In 2008 and 2009 actual driving activities included through Q3, and Q4 estimated.”
4) CO2 emissions from employee commuting is calculated based on figures and estimates available on Nokia employee number, mode of transport, emissions from the cars used by employees, commuting distance and frequency.
5) These figures are being recalculated based on the new GHG Protocol Scope 3 standardization work.The updated figures will be published in August 2010.
6) Volatile organic compounds (VOC) arise from the use of solvents in the soldering and cleaning process. Consumption has increased due to more accurate reporting and changes in the production process, but in general, consumption is still on a low level.
7) Nokia uses no Ozone Depleting Substances (ODS) in its products or production. The reported ODS figures are due to minor leakage of ODS contained in cooling systems in facilities. Annual emissions vary due to changing annual maintenance needs. ODP (Ozone Depleting Potential) = emission in kg of CFC-11 equivalent.
Page 127Nokia sustainability report2009
9.8Nokia key data (continued)
9.0Key Data
Navigation bar
Contents 21.0 CEO’s Message 3 2.0 Nokia in 2009 63.0 About the report 94.0 Employees 29 5.0 Supply chain 54 6.0 Corporate social investment 64 7.0 Environment 718.0 Operation 999.0 Key data 2009 11310.0 Independent Assurance 13311.0 Global Reporting Initiative Index 2009 138
continued...
9.1 Energy Consumption 1149.2 Facility Greenhouse Gas Emissions 1159.3 Nokia Air Travel Related Emissions 1169.4 Water use 1179.5 Waste utilization 118 9.6 No-load power consumption of 119 Nokia’s chargers 9.7 Life cycle assessment of energy use and GHG 120 emission of our products and processes9.8 Nokia key data 121 Notes 125
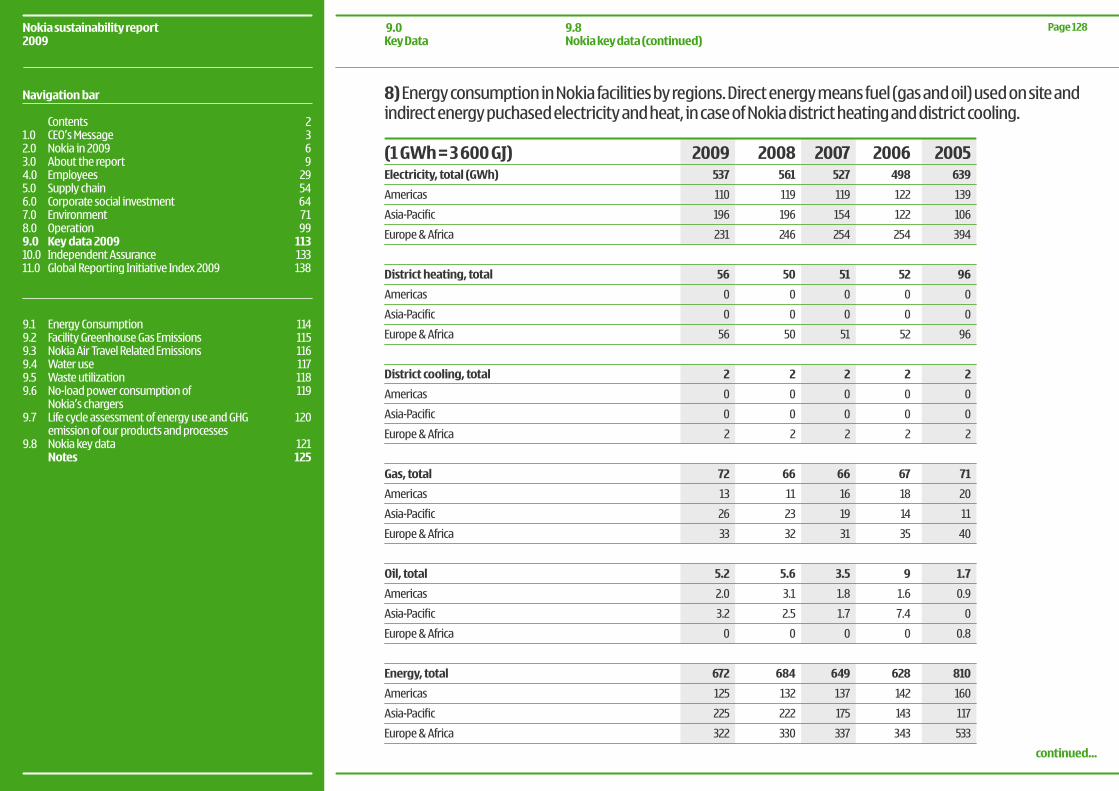
8) Energy consumption in Nokia facilities by regions. Direct energy means fuel (gas and oil) used on site and indirect energy puchased electricity and heat, in case of Nokia district heating and district cooling.
(1 GWh = 3 600 GJ)Electricity, total (GWh)
Americas
Asia-Pacific
Europe & Africa
District heating, total
Americas
Asia-Pacific
Europe & Africa
District cooling, total
Americas
Asia-Pacific
Europe & Africa
Gas, total
Americas
Asia-Pacific
Europe & Africa
Oil, total
Americas
Asia-Pacific
Europe & Africa
Energy, total
Americas
Asia-Pacific
Europe & Africa
2009537
110
196
231
56
0
0
56
2
0
0
2
72
13
26
33
5.2
2.0
3.2
0
672
125
225
322
2008561
119
196
246
50
0
0
50
2
0
0
2
66
11
23
32
5.6
3.1
2.5
0
684
132
222
330
2007527
119
154
254
51
0
0
51
2
0
0
2
66
16
19
31
3.5
1.8
1.7
0
649
137
175
337
2006498
122
122
254
52
0
0
52
2
0
0
2
67
18
14
35
9
1.6
7.4
0
628
142
143
343
2005639
139
106
394
96
0
0
96
2
0
0
2
71
20
11
40
1.7
0.9
0
0.8
810
160
117
533
Page 128Nokia sustainability report2009
9.8Nokia key data (continued)
9.0Key Data
Navigation bar
Contents 21.0 CEO’s Message 3 2.0 Nokia in 2009 63.0 About the report 94.0 Employees 29 5.0 Supply chain 54 6.0 Corporate social investment 64 7.0 Environment 718.0 Operation 999.0 Key data 2009 11310.0 Independent Assurance 13311.0 Global Reporting Initiative Index 2009 138
continued...
9.1 Energy Consumption 1149.2 Facility Greenhouse Gas Emissions 1159.3 Nokia Air Travel Related Emissions 1169.4 Water use 1179.5 Waste utilization 118 9.6 No-load power consumption of 119 Nokia’s chargers 9.7 Life cycle assessment of energy use and GHG 120 emission of our products and processes9.8 Nokia key data 121 Notes 125
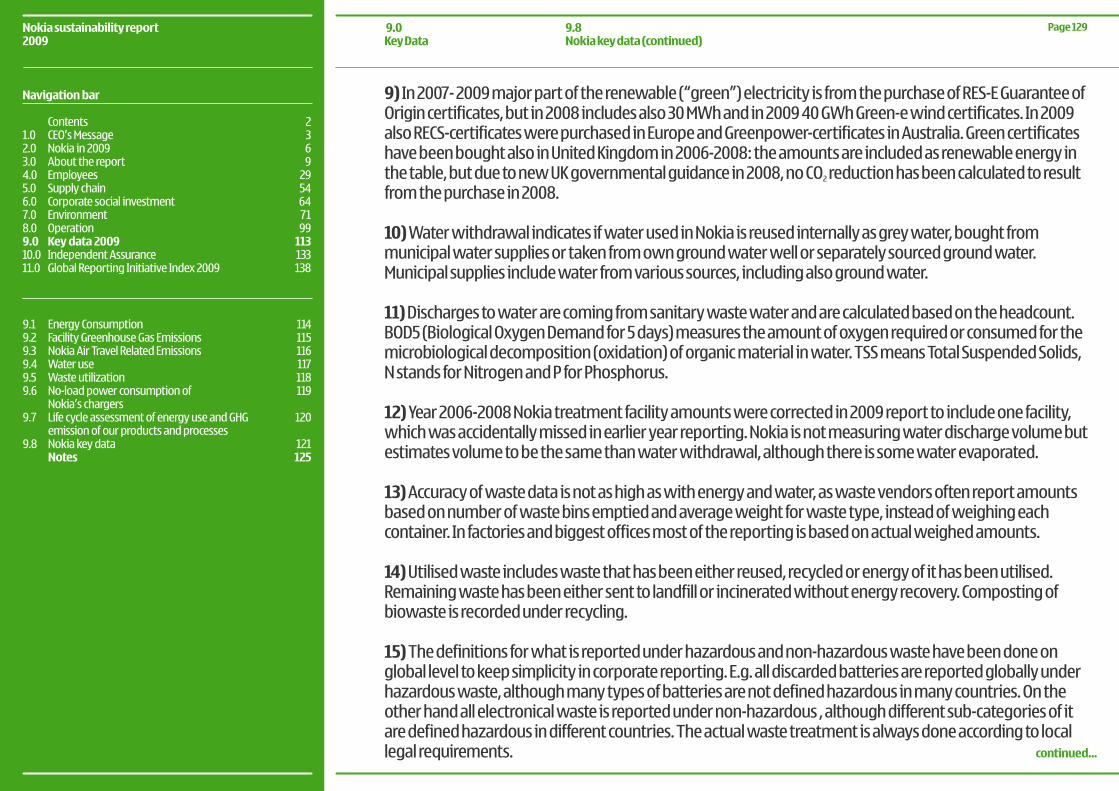
9) In 2007- 2009 major part of the renewable (“green”) electricity is from the purchase of RES-E Guarantee of Origin certificates, but in 2008 includes also 30 MWh and in 2009 40 GWh Green-e wind certificates. In 2009 also RECS-certificates were purchased in Europe and Greenpower-certificates in Australia. Green certificates have been bought also in United Kingdom in 2006-2008: the amounts are included as renewable energy in the table, but due to new UK governmental guidance in 2008, no CO2 reduction has been calculated to result from the purchase in 2008. 10) Water withdrawal indicates if water used in Nokia is reused internally as grey water, bought from municipal water supplies or taken from own ground water well or separately sourced ground water. Municipal supplies include water from various sources, including also ground water. 11) Discharges to water are coming from sanitary waste water and are calculated based on the headcount. BOD5 (Biological Oxygen Demand for 5 days) measures the amount of oxygen required or consumed for the microbiological decomposition (oxidation) of organic material in water. TSS means Total Suspended Solids, N stands for Nitrogen and P for Phosphorus. 12) Year 2006-2008 Nokia treatment facility amounts were corrected in 2009 report to include one facility, which was accidentally missed in earlier year reporting. Nokia is not measuring water discharge volume but estimates volume to be the same than water withdrawal, although there is some water evaporated.
13) Accuracy of waste data is not as high as with energy and water, as waste vendors often report amounts based on number of waste bins emptied and average weight for waste type, instead of weighing each container. In factories and biggest offices most of the reporting is based on actual weighed amounts. 14) Utilised waste includes waste that has been either reused, recycled or energy of it has been utilised. Remaining waste has been either sent to landfill or incinerated without energy recovery. Composting of biowaste is recorded under recycling. 15) The definitions for what is reported under hazardous and non-hazardous waste have been done on global level to keep simplicity in corporate reporting. E.g. all discarded batteries are reported globally under hazardous waste, although many types of batteries are not defined hazardous in many countries. On the other hand all electronical waste is reported under non-hazardous , although different sub-categories of it are defined hazardous in different countries. The actual waste treatment is always done according to local legal requirements.
Page 129Nokia sustainability report2009
9.8Nokia key data (continued)
9.0Key Data
Navigation bar
Contents 21.0 CEO’s Message 3 2.0 Nokia in 2009 63.0 About the report 94.0 Employees 29 5.0 Supply chain 54 6.0 Corporate social investment 64 7.0 Environment 718.0 Operation 999.0 Key data 2009 11310.0 Independent Assurance 13311.0 Global Reporting Initiative Index 2009 138
continued...
9.1 Energy Consumption 1149.2 Facility Greenhouse Gas Emissions 1159.3 Nokia Air Travel Related Emissions 1169.4 Water use 1179.5 Waste utilization 118 9.6 No-load power consumption of 119 Nokia’s chargers 9.7 Life cycle assessment of energy use and GHG 120 emission of our products and processes9.8 Nokia key data 121 Notes 125
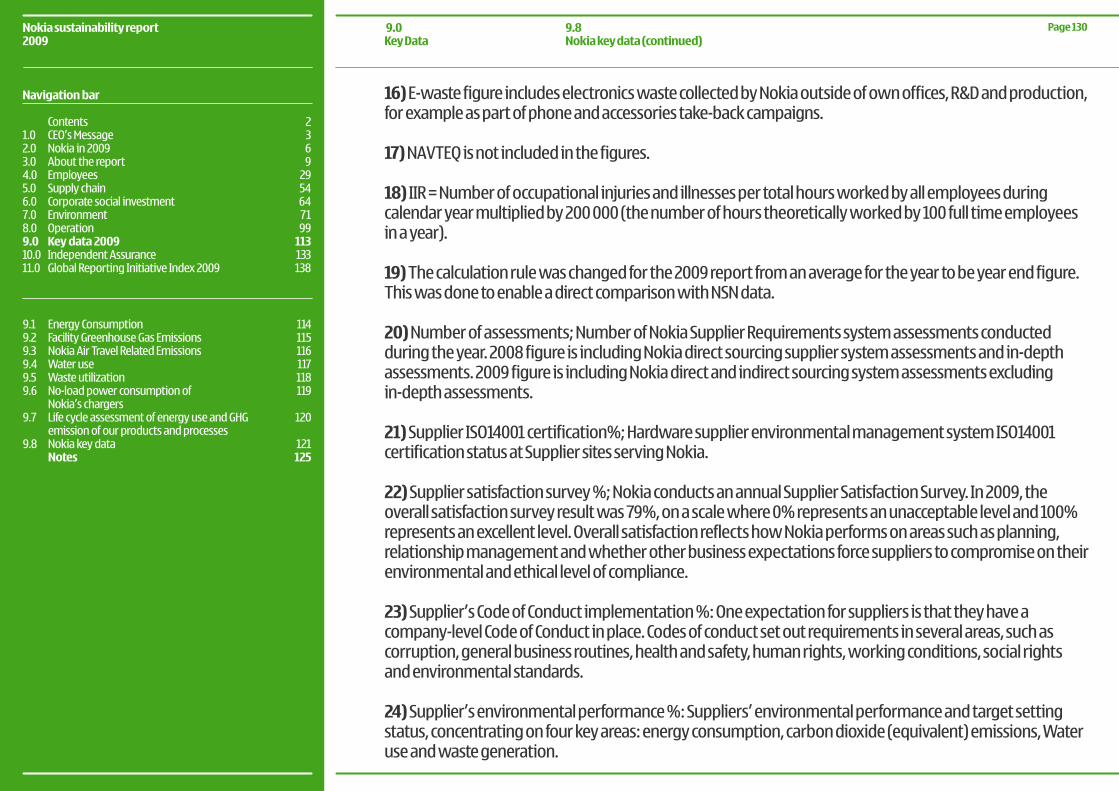
16) E-waste figure includes electronics waste collected by Nokia outside of own offices, R&D and production, for example as part of phone and accessories take-back campaigns. 17) NAVTEQ is not included in the figures. 18) IIR = Number of occupational injuries and illnesses per total hours worked by all employees during calendar year multiplied by 200 000 (the number of hours theoretically worked by 100 full time employees in a year). 19) The calculation rule was changed for the 2009 report from an average for the year to be year end figure. This was done to enable a direct comparison with NSN data. 20)Numberofassessments;NumberofNokiaSupplierRequirementssystemassessmentsconductedduring the year. 2008 figure is including Nokia direct sourcing supplier system assessments and in-depth assessments. 2009 figure is including Nokia direct and indirect sourcing system assessments excluding in-depth assessments.
21)SupplierISO14001certification%;HardwaresupplierenvironmentalmanagementsystemISO14001certification status at Supplier sites serving Nokia. 22)Suppliersatisfactionsurvey%;NokiaconductsanannualSupplierSatisfactionSurvey.In2009,theoverallsatisfactionsurveyresultwas79%,onascalewhere0%representsanunacceptableleveland100%represents an excellent level. Overall satisfaction reflects how Nokia performs on areas such as planning, relationship management and whether other business expectations force suppliers to compromise on their environmental and ethical level of compliance. 23)Supplier’sCodeofConductimplementation%:Oneexpectationforsuppliersisthattheyhaveacompany-level Code of Conduct in place. Codes of conduct set out requirements in several areas, such as corruption, general business routines, health and safety, human rights, working conditions, social rights and environmental standards. 24)Supplier’senvironmentalperformance%:Suppliers’environmentalperformanceandtargetsettingstatus, concentrating on four key areas: energy consumption, carbon dioxide (equivalent) emissions, Water use and waste generation.
Page 130Nokia sustainability report2009
9.8Nokia key data (continued)
9.0Key Data
Navigation bar
Contents 21.0 CEO’s Message 3 2.0 Nokia in 2009 63.0 About the report 94.0 Employees 29 5.0 Supply chain 54 6.0 Corporate social investment 64 7.0 Environment 718.0 Operation 999.0 Key data 2009 11310.0 Independent Assurance 13311.0 Global Reporting Initiative Index 2009 138
9.1 Energy Consumption 1149.2 Facility Greenhouse Gas Emissions 1159.3 Nokia Air Travel Related Emissions 1169.4 Water use 1179.5 Waste utilization 118 9.6 No-load power consumption of 119 Nokia’s chargers 9.7 Life cycle assessment of energy use and GHG 120 emission of our products and processes9.8 Nokia key data 121 Notes 125
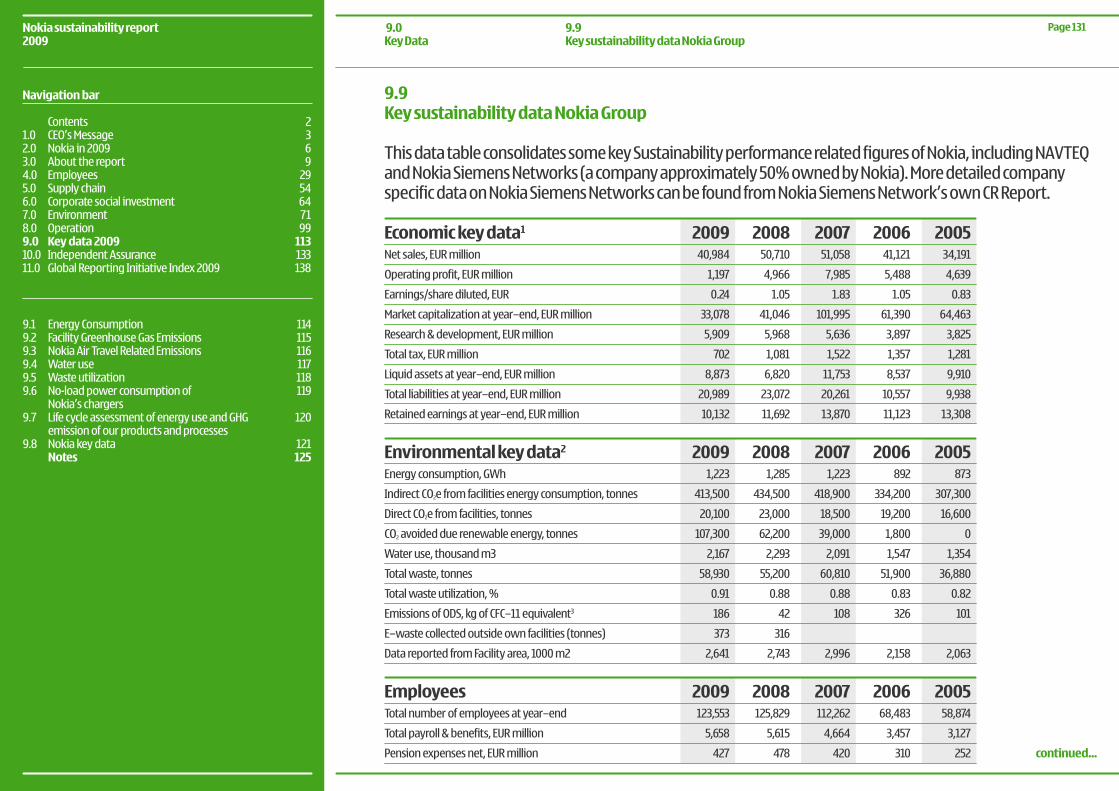
9.9 Key sustainability data Nokia Group
This data table consolidates some key Sustainability performance related figures of Nokia, including NAVTEQ andNokiaSiemensNetworks(acompanyapproximately50%ownedbyNokia).Moredetailedcompanyspecific data on Nokia Siemens Networks can be found from Nokia Siemens Network’s own CR Report.
Economic key data1
Net sales, EUR million
Operating profit, EUR million
Earnings/share diluted, EUR
Market capitalization at year–end, EUR million
Research & development, EUR million
Total tax, EUR million
Liquid assets at year–end, EUR million
Total liabilities at year–end, EUR million
Retained earnings at year–end, EUR million
Environmental key data2
Energy consumption, GWh
Indirect CO2e from facilities energy consumption, tonnes
Direct CO2e from facilities, tonnes
CO2 avoided due renewable energy, tonnes
Water use, thousand m3
Total waste, tonnes
Totalwasteutilization,%
Emissions of ODS, kg of CFC–11 equivalent3
E–waste collected outside own facilities (tonnes)
Data reported from Facility area, 1000 m2
2009 1,223
413,500
20,100
107,300
2,167
58,930
0.91
186
373
2,641
2008 1,285
434,500
23,000
62,200
2,293
55,200
0.88
42
316
2,743
2007 1,223
418,900
18,500
39,000
2,091
60,810
0.88
108
2,996
2006 892
334,200
19,200
1,800
1,547
51,900
0.83
326
2,158
2009 40,984
1,197
0.24
33,078
5,909
702
8,873
20,989
10,132
2008 50,710
4,966
1.05
41,046
5,968
1,081
6,820
23,072
11,692
2007 51,058
7,985
1.83
101,995
5,636
1,522
11,753
20,261
13,870
2006 41,121
5,488
1.05
61,390
3,897
1,357
8,537
10,557
11,123
2005 34,191
4,639
0.83
64,463
3,825
1,281
9,910
9,938
13,308
2005 873
307,300
16,600
0
1,354
36,880
0.82
101
2,063
EmployeesTotal number of employees at year–end
Total payroll & benefits, EUR million
Pension expenses net, EUR million
2009 123,553
5,658
427
2008 125,829
5,615
478
2007 112,262
4,664
420
2006 68,483
3,457
310
2005 58,874
3,127
252
Page 131Nokia sustainability report2009
9.9Key sustainability data Nokia Group
9.0Key Data
Navigation bar
Contents 21.0 CEO’s Message 3 2.0 Nokia in 2009 63.0 About the report 94.0 Employees 29 5.0 Supply chain 54 6.0 Corporate social investment 64 7.0 Environment 718.0 Operation 999.0 Key data 2009 11310.0 Independent Assurance 13311.0 Global Reporting Initiative Index 2009 138
continued...
9.1 Energy Consumption 1149.2 Facility Greenhouse Gas Emissions 1159.3 Nokia Air Travel Related Emissions 1169.4 Water use 1179.5 Waste utilization 118 9.6 No-load power consumption of 119 Nokia’s chargers 9.7 Life cycle assessment of energy use and GHG 120 emission of our products and processes9.8 Nokia key data 121 Notes 125
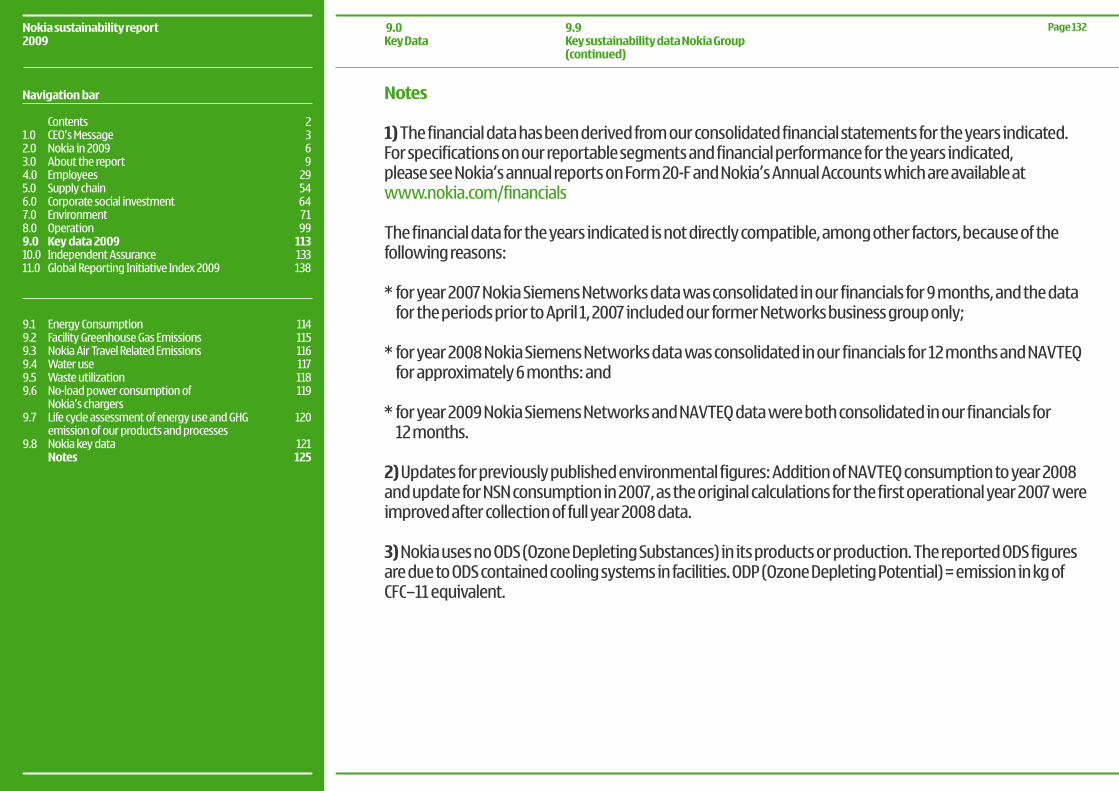
Notes
1) The financial data has been derived from our consolidated financial statements for the years indicated. For specifications on our reportable segments and financial performance for the years indicated, please see Nokia’s annual reports on Form 20-F and Nokia’s Annual Accounts which are available at www.nokia.com/financials
The financial data for the years indicated is not directly compatible, among other factors, because of the following reasons:
* for year 2007 Nokia Siemens Networks data was consolidated in our financials for 9 months, and the data fortheperiodspriortoApril1,2007includedourformerNetworksbusinessgrouponly;
* for year 2008 Nokia Siemens Networks data was consolidated in our financials for 12 months and NAVTEQ for approximately 6 months: and
* for year 2009 Nokia Siemens Networks and NAVTEQ data were both consolidated in our financials for 12 months.
2) Updates for previously published environmental figures: Addition of NAVTEQ consumption to year 2008 and update for NSN consumption in 2007, as the original calculations for the first operational year 2007 were improved after collection of full year 2008 data.
3) Nokia uses no ODS (Ozone Depleting Substances) in its products or production. The reported ODS figures are due to ODS contained cooling systems in facilities. ODP (Ozone Depleting Potential) = emission in kg ofCFC–11 equivalent.
Page 132Nokia sustainability report2009
9.9Key sustainability data Nokia Group (continued)
9.0Key Data
Navigation bar
Contents 21.0 CEO’s Message 3 2.0 Nokia in 2009 63.0 About the report 94.0 Employees 29 5.0 Supply chain 54 6.0 Corporate social investment 64 7.0 Environment 718.0 Operation 999.0 Key data 2009 11310.0 Independent Assurance 13311.0 Global Reporting Initiative Index 2009 138
9.1 Energy Consumption 1149.2 Facility Greenhouse Gas Emissions 1159.3 Nokia Air Travel Related Emissions 1169.4 Water use 1179.5 Waste utilization 118 9.6 No-load power consumption of 119 Nokia’s chargers 9.7 Life cycle assessment of energy use and GHG 120 emission of our products and processes9.8 Nokia key data 121 Notes 125
10.1 Independent assurance report 134
Page 133Nokia sustainability report2009
Navigation bar
Contents 21.0 CEO’s Message 3 2.0 Nokia in 2009 63.0 About the report 94.0 Employees 29 5.0 Supply chain 54 6.0 Corporate social investment 64 7.0 Environment 718.0 Operation 999.0 Key data 2009 11310.0 Independent Assurance 13311.0 Global Reporting Initiative Index 2009 138
10.0Independent assurance
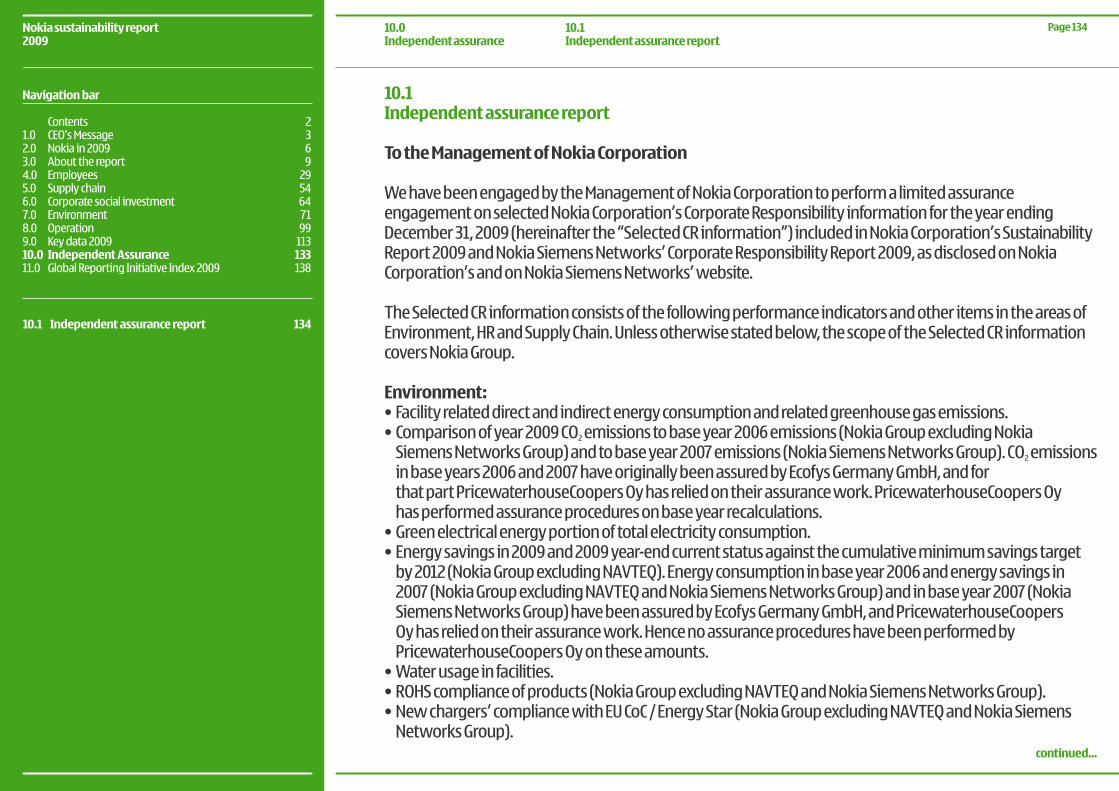
10.1 Independent assurance report
To the Management of Nokia Corporation
We have been engaged by the Management of Nokia Corporation to perform a limited assurance engagement on selected Nokia Corporation’s Corporate Responsibility information for the year ending December 31, 2009 (hereinafter the “Selected CR information”) included in Nokia Corporation’s Sustainability Report 2009 and Nokia Siemens Networks’ Corporate Responsibility Report 2009, as disclosed on Nokia Corporation’s and on Nokia Siemens Networks’ website.
The Selected CR information consists of the following performance indicators and other items in the areas of Environment, HR and Supply Chain. Unless otherwise stated below, the scope of the Selected CR information covers Nokia Group.
Environment:•Facilityrelateddirectandindirectenergyconsumptionandrelatedgreenhousegasemissions.• Comparisonofyear2009CO2 emissions to base year 2006 emissions (Nokia Group excluding Nokia
Siemens Networks Group) and to base year 2007 emissions (Nokia Siemens Networks Group). CO2 emissions in base years 2006 and 2007 have originally been assured by Ecofys Germany GmbH, and for that part PricewaterhouseCoopers Oy has relied on their assurance work. PricewaterhouseCoopers Oy has performed assurance procedures on base year recalculations.
•Greenelectricalenergyportionoftotalelectricityconsumption.•Energysavingsin2009and2009year-endcurrentstatusagainstthecumulativeminimumsavingstarget
by 2012 (Nokia Group excluding NAVTEQ). Energy consumption in base year 2006 and energy savings in 2007 (Nokia Group excluding NAVTEQ and Nokia Siemens Networks Group) and in base year 2007 (Nokia Siemens Networks Group) have been assured by Ecofys Germany GmbH, and PricewaterhouseCoopers Oy has relied on their assurance work. Hence no assurance procedures have been performed by PricewaterhouseCoopers Oy on these amounts.
•Waterusageinfacilities.•ROHScomplianceofproducts(NokiaGroupexcludingNAVTEQandNokiaSiemensNetworksGroup).• Newchargers’compliancewithEUCoC/EnergyStar(NokiaGroupexcludingNAVTEQandNokiaSiemens
Networks Group).
10.1 Independent assurance report 134
Page 134Nokia sustainability report2009
10.0 Independent assurance
10.1 Independent assurance report
Navigation bar
Contents 21.0 CEO’s Message 3 2.0 Nokia in 2009 63.0 About the report 94.0 Employees 29 5.0 Supply chain 54 6.0 Corporate social investment 64 7.0 Environment 718.0 Operation 999.0 Key data 2009 11310.0 Independent Assurance 13311.0 Global Reporting Initiative Index 2009 138
continued...
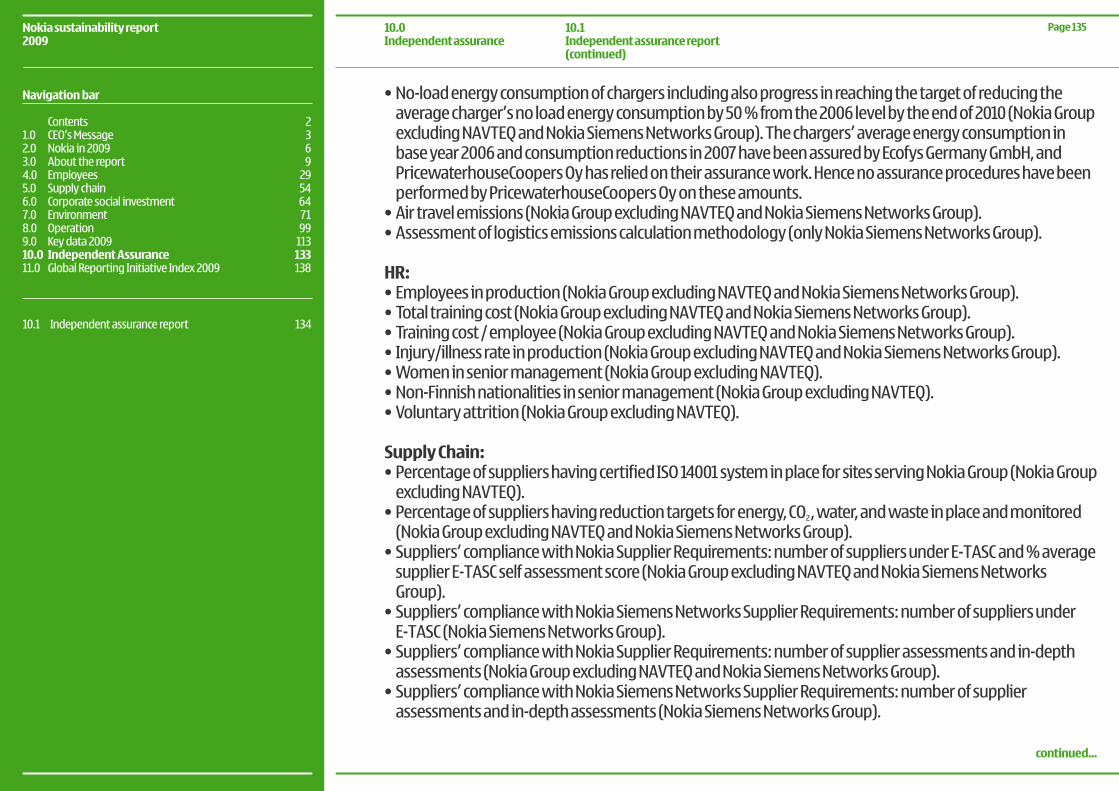
•No-loadenergyconsumptionofchargersincludingalsoprogressinreachingthetargetofreducingtheaveragecharger’snoloadenergyconsumptionby50%fromthe2006levelbytheendof2010(NokiaGroupexcluding NAVTEQ and Nokia Siemens Networks Group). The chargers’ average energy consumption in base year 2006 and consumption reductions in 2007 have been assured by Ecofys Germany GmbH, and PricewaterhouseCoopers Oy has relied on their assurance work. Hence no assurance procedures have been performed by PricewaterhouseCoopers Oy on these amounts.
•Airtravelemissions(NokiaGroupexcludingNAVTEQandNokiaSiemensNetworksGroup).•Assessmentoflogisticsemissionscalculationmethodology(onlyNokiaSiemensNetworksGroup).
HR: •Employeesinproduction(NokiaGroupexcludingNAVTEQandNokiaSiemensNetworksGroup).•Totaltrainingcost(NokiaGroupexcludingNAVTEQandNokiaSiemensNetworksGroup).•Trainingcost/employee(NokiaGroupexcludingNAVTEQandNokiaSiemensNetworksGroup).• Injury/illnessrateinproduction(NokiaGroupexcludingNAVTEQandNokiaSiemensNetworksGroup).•Womeninseniormanagement(NokiaGroupexcludingNAVTEQ).•Non-Finnishnationalitiesinseniormanagement(NokiaGroupexcludingNAVTEQ).•Voluntaryattrition(NokiaGroupexcludingNAVTEQ).
Supply Chain:•PercentageofsuppliershavingcertifiedISO14001systeminplaceforsitesservingNokiaGroup(NokiaGroup
excluding NAVTEQ).•Percentageofsuppliershavingreductiontargetsforenergy,CO2 , water, and waste in place and monitored
(Nokia Group excluding NAVTEQ and Nokia Siemens Networks Group). •Suppliers’compliancewithNokiaSupplierRequirements:numberofsuppliersunderE-TASCand%average
supplier E-TASC self assessment score (Nokia Group excluding NAVTEQ and Nokia Siemens Networks Group).
•Suppliers’compliancewithNokiaSiemensNetworksSupplierRequirements:numberofsuppliersunderE-TASC (Nokia Siemens Networks Group).
•Suppliers’compliancewithNokiaSupplierRequirements:numberofsupplierassessmentsandin-depthassessments (Nokia Group excluding NAVTEQ and Nokia Siemens Networks Group).
•Suppliers’compliancewithNokiaSiemensNetworksSupplierRequirements:numberofsupplierassessments and in-depth assessments (Nokia Siemens Networks Group).
10.1 Independent assurance report 134
Page 135Nokia sustainability report2009
10.0 Independent assurance
10.1 Independent assurance report (continued)
Navigation bar
Contents 21.0 CEO’s Message 3 2.0 Nokia in 2009 63.0 About the report 94.0 Employees 29 5.0 Supply chain 54 6.0 Corporate social investment 64 7.0 Environment 718.0 Operation 999.0 Key data 2009 11310.0 Independent Assurance 13311.0 Global Reporting Initiative Index 2009 138
continued...
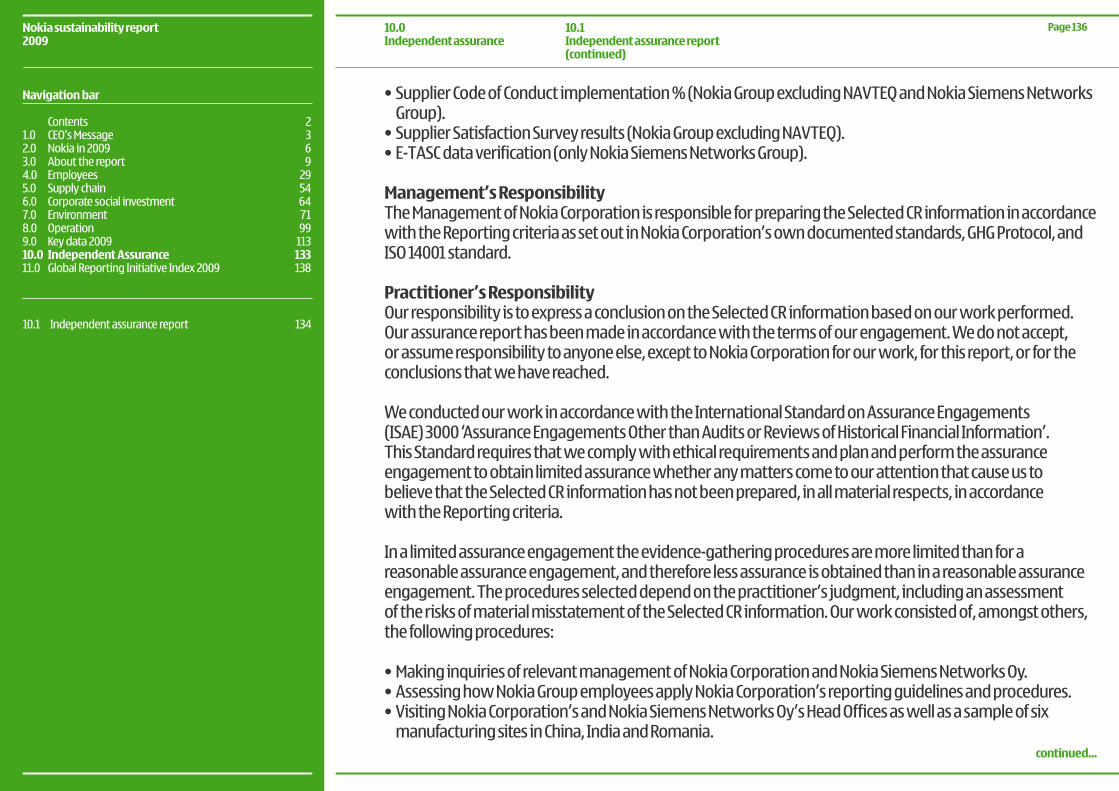
•SupplierCodeofConductimplementation%(NokiaGroupexcludingNAVTEQandNokiaSiemensNetworksGroup).
•SupplierSatisfactionSurveyresults(NokiaGroupexcludingNAVTEQ).•E-TASCdataverification(onlyNokiaSiemensNetworksGroup).
Management’s Responsibility The Management of Nokia Corporation is responsible for preparing the Selected CR information in accordance with the Reporting criteria as set out in Nokia Corporation’s own documented standards, GHG Protocol, and ISO 14001 standard.
Practitioner’s ResponsibilityOur responsibility is to express a conclusion on the Selected CR information based on our work performed. Our assurance report has been made in accordance with the terms of our engagement. We do not accept, or assume responsibility to anyone else, except to Nokia Corporation for our work, for this report, or for the conclusions that we have reached.
We conducted our work in accordance with the International Standard on Assurance Engagements (ISAE) 3000 ‘Assurance Engagements Other than Audits or Reviews of Historical Financial Information’. This Standard requires that we comply with ethical requirements and plan and perform the assurance engagement to obtain limited assurance whether any matters come to our attention that cause us to believe that the Selected CR information has not been prepared, in all material respects, in accordance with the Reporting criteria.
In a limited assurance engagement the evidence-gathering procedures are more limited than for a reasonable assurance engagement, and therefore less assurance is obtained than in a reasonable assurance engagement. The procedures selected depend on the practitioner’s judgment, including an assessment of the risks of material misstatement of the Selected CR information. Our work consisted of, amongst others, the following procedures:
•MakinginquiriesofrelevantmanagementofNokiaCorporationandNokiaSiemensNetworksOy.•AssessinghowNokiaGroupemployeesapplyNokiaCorporation’sreportingguidelinesandprocedures.• VisitingNokiaCorporation’sandNokiaSiemensNetworksOy’sHeadOfficesaswellasasampleofsix
manufacturing sites in China, India and Romania.
10.1 Independent assurance report 134
Page 136Nokia sustainability report2009
Navigation bar
Contents 21.0 CEO’s Message 3 2.0 Nokia in 2009 63.0 About the report 94.0 Employees 29 5.0 Supply chain 54 6.0 Corporate social investment 64 7.0 Environment 718.0 Operation 999.0 Key data 2009 11310.0 Independent Assurance 13311.0 Global Reporting Initiative Index 2009 138
continued...
10.0 Independent assurance
10.1 Independent assurance report (continued)
•InterviewingemployeesresponsibleforcollectionandreportingoftheSelectedCRinformationatNokiaGroup and at Nokia Siemens Networks Group level and at the different manufacturing sites where our visits took place.
•Inspectionofrelevantdocumentsandsystemsforgathering,analyzingandaggregatingtheSelected CR information as well as tests on a sample basis.
•AssessingthedataconsolidationprocessoftheSelectedCRinformationatNokiaGrouplevelandatNokiaSiemens Networks Group level.
ConclusionBased on our limited assurance engagement, nothing has come to our attention that cause us to believe that the Selected CR information has not been prepared, in all material respects, in accordance with the Reporting criteria. Our assurance report should be read in conjunction with the inherent limitations of accuracy and completeness for corporate responsibility information. This independent assurance report should not be used on its own as a basis for interpreting Nokia Corporation’s performance in relation to its principles of corporate responsibility.
Helsinki, June 3rd, 2010
PricewaterhouseCoopers Oy
Merja Lindh Sirpa JuutinenAuthorized Public Accountant Director, Sustainable Business Solutions
10.1 Independent assurance report 134
Page 137Nokia sustainability report2009
Navigation bar
Contents 21.0 CEO’s Message 3 2.0 Nokia in 2009 63.0 About the report 94.0 Employees 29 5.0 Supply chain 54 6.0 Corporate social investment 64 7.0 Environment 718.0 Operation 999.0 Key data 2009 11310.0 Independent Assurance 13311.0 Global Reporting Initiative Index 2009 138
10.0 Independent assurance
10.1 Independent assurance report (continued)
11.1 Global Reporting Initiative Index 139 for Sustainability report 2009
Page 138Nokia sustainability report2009
Navigation bar
Contents 21.0 CEO’s Message 3 2.0 Nokia in 2009 63.0 About the report 94.0 Employees 29 5.0 Supply chain 54 6.0 Corporate social investment 64 7.0 Environment 718.0 Operation 999.0 Key data 2009 11310.0 Independent Assurance 13311.0 Global Reporting Initiative Index 2009 138
11.0Global Reporting Initiative Index 2009
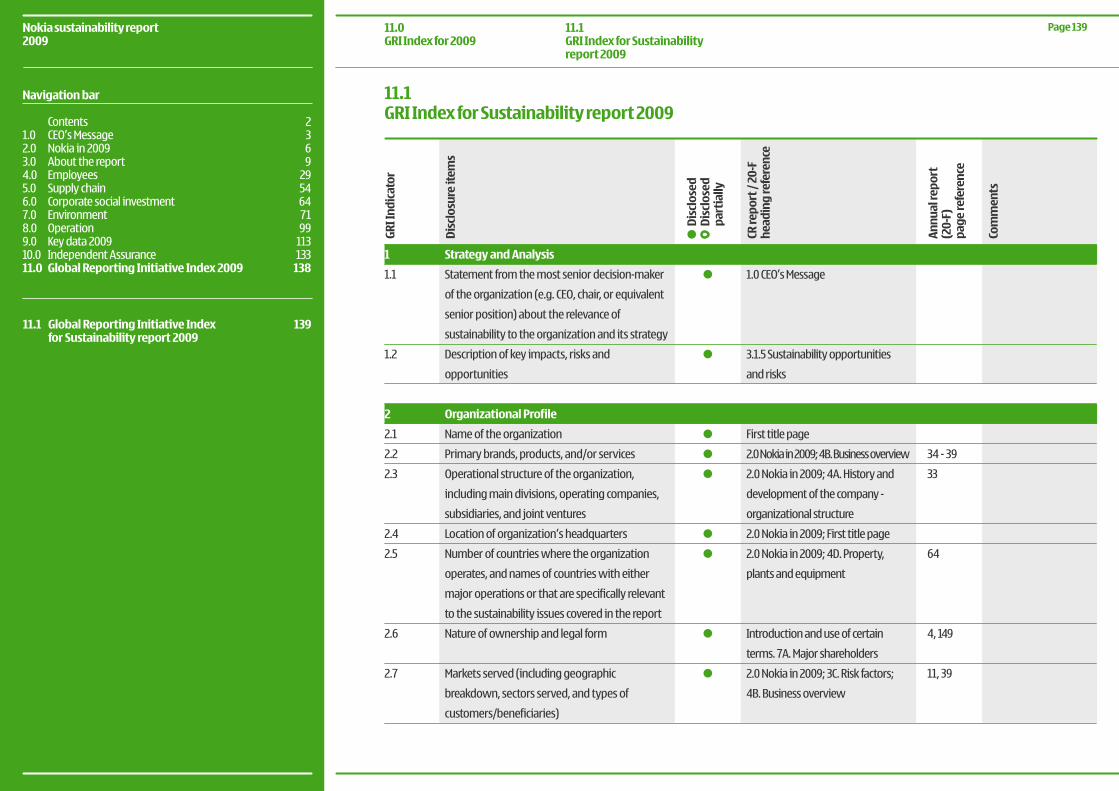
34 - 39
33
64
4, 149
11, 39
11.1GRI Index for Sustainability report 2009
CR re
port
/ 20
-F
head
ing
refe
renc
e
Annu
al re
port
(2
0-F)
pa
ge re
fere
nce
Com
men
ts
Dis
clos
ed
Dis
clos
ed
part
ially
Dis
clos
ure
item
s
GRI I
ndic
ator
1
1.1
1.2
2
2.1
2.2
2.3
2.4
2.5
2.6
2.7
Strategy and Analysis
Statement from the most senior decision-maker
of the organization (e.g. CEO, chair, or equivalent
senior position) about the relevance of
sustainability to the organization and its strategy
Description of key impacts, risks and
opportunities
Organizational Profile
Name of the organization
Primary brands, products, and/or services
Operational structure of the organization,
including main divisions, operating companies,
subsidiaries, and joint ventures
Location of organization’s headquarters
Number of countries where the organization
operates, and names of countries with either
major operations or that are specifically relevant
to the sustainability issues covered in the report
Nature of ownership and legal form
Markets served (including geographic
breakdown, sectors served, and types of
customers/beneficiaries)
1.0 CEO’s Message
3.1.5 Sustainability opportunities
and risks
First title page
2.0Nokiain2009;4B.Businessoverview
2.0Nokiain2009;4A.Historyand
development of the company -
organizational structure
2.0Nokiain2009;Firsttitlepage
2.0Nokiain2009;4D.Property,
plants and equipment
Introduction and use of certain
terms. 7A. Major shareholders
2.0Nokiain2009;3C.Riskfactors;
4B. Business overview
11.1 Global Reporting Initiative Index 139 for Sustainability report 2009
Page 139Nokia sustainability report2009
Navigation bar
Contents 21.0 CEO’s Message 3 2.0 Nokia in 2009 63.0 About the report 94.0 Employees 29 5.0 Supply chain 54 6.0 Corporate social investment 64 7.0 Environment 718.0 Operation 999.0 Key data 2009 11310.0 Independent Assurance 13311.0 Global Reporting Initiative Index 2009 138
11.0GRI Index for 2009
11.1GRI Index for Sustainability report 2009
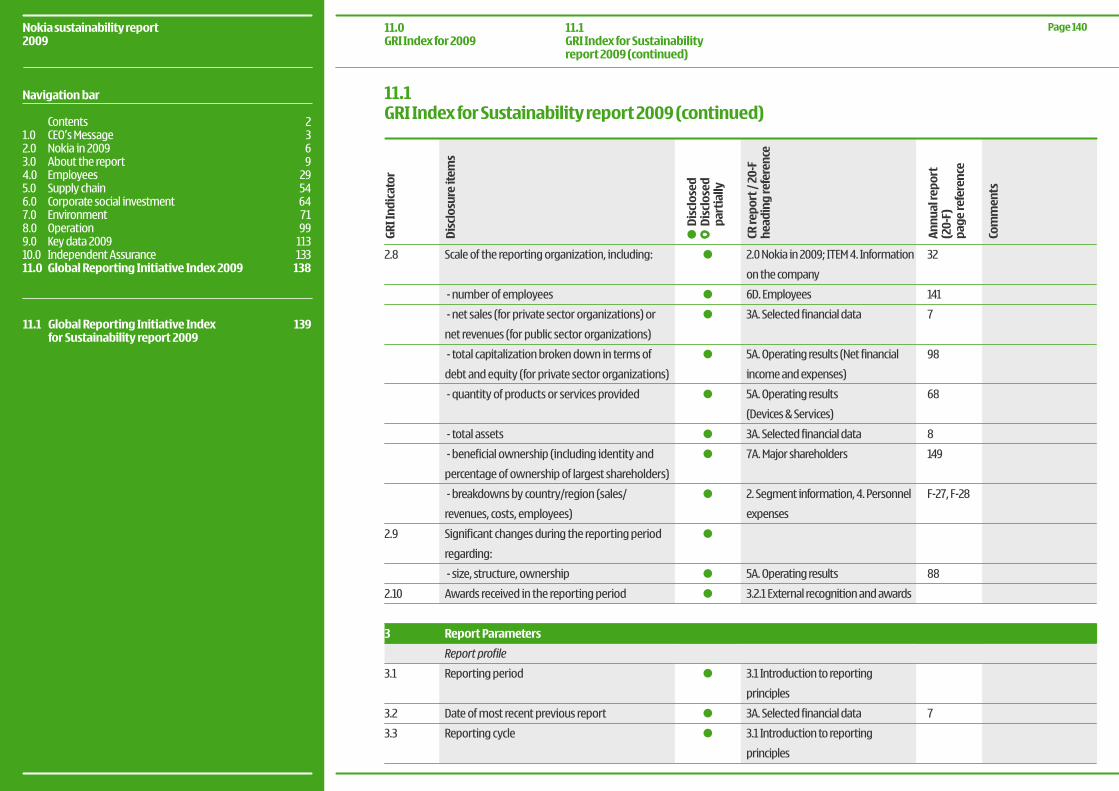
32
141
7
98
68
8
149
F-27, F-28
88
7
11.1GRI Index for Sustainability report 2009 (continued)
CR re
port
/ 20
-F
head
ing
refe
renc
e
Annu
al re
port
(2
0-F)
pa
ge re
fere
nce
Com
men
ts
Dis
clos
ure
item
s
GRI I
ndic
ator
Dis
clos
ed
Dis
clos
ed
part
ially
2.0Nokiain2009;ITEM4.Information
on the company
6D. Employees
3A. Selected financial data
5A. Operating results (Net financial
income and expenses)
5A. Operating results
(Devices & Services)
3A. Selected financial data
7A. Major shareholders
2. Segment information, 4. Personnel
expenses
5A. Operating results
3.2.1 External recognition and awards
3.1 Introduction to reporting
principles
3A. Selected financial data
3.1 Introduction to reporting
principles
Scale of the reporting organization, including:
- number of employees
- net sales (for private sector organizations) or
net revenues (for public sector organizations)
- total capitalization broken down in terms of
debt and equity (for private sector organizations)
- quantity of products or services provided
- total assets
- beneficial ownership (including identity and
percentage of ownership of largest shareholders)
- breakdowns by country/region (sales/
revenues, costs, employees)
Significant changes during the reporting period
regarding:
- size, structure, ownership
Awards received in the reporting period
Report Parameters
Report profile
Reporting period
Date of most recent previous report
Reporting cycle
2.8
2.9
2.10
3
3.1
3.2
3.3
11.1 Global Reporting Initiative Index 139 for Sustainability report 2009
Page 140Nokia sustainability report2009
Navigation bar
Contents 21.0 CEO’s Message 3 2.0 Nokia in 2009 63.0 About the report 94.0 Employees 29 5.0 Supply chain 54 6.0 Corporate social investment 64 7.0 Environment 718.0 Operation 999.0 Key data 2009 11310.0 Independent Assurance 13311.0 Global Reporting Initiative Index 2009 138
11.0GRI Index for 2009
11.1GRI Index for Sustainability report 2009 (continued)
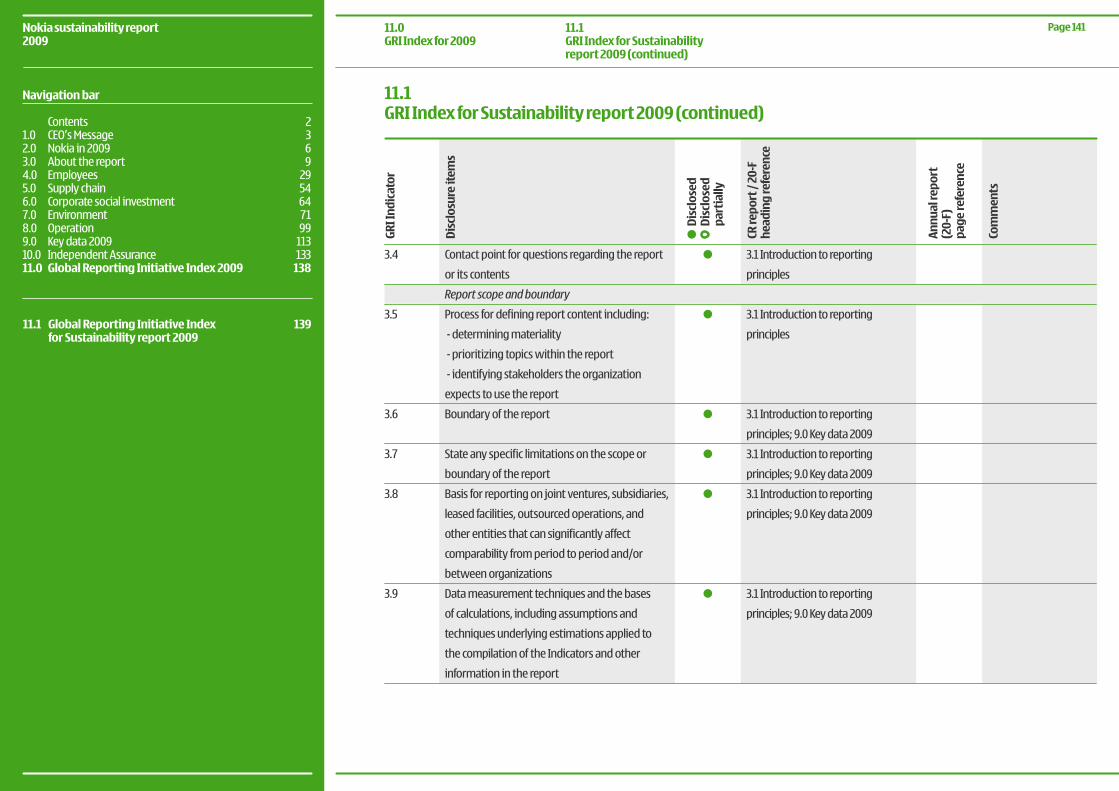
3.4
3.5
3.6
3.7
3.8
3.9
Contact point for questions regarding the report
or its contents
Report scope and boundary
Process for defining report content including:
- determining materiality
- prioritizing topics within the report
- identifying stakeholders the organization
expects to use the report
Boundary of the report
State any specific limitations on the scope or
boundary of the report
Basis for reporting on joint ventures, subsidiaries,
leased facilities, outsourced operations, and
other entities that can significantly affect
comparability from period to period and/or
between organizations
Data measurement techniques and the bases
of calculations, including assumptions and
techniques underlying estimations applied to
the compilation of the Indicators and other
information in the report
3.1 Introduction to reporting
principles
3.1 Introduction to reporting
principles
3.1 Introduction to reporting
principles;9.0Keydata2009
3.1 Introduction to reporting
principles;9.0Keydata2009
3.1 Introduction to reporting
principles;9.0Keydata2009
3.1 Introduction to reporting
principles;9.0Keydata2009
11.1GRI Index for Sustainability report 2009 (continued)
CR re
port
/ 20
-F
head
ing
refe
renc
e
Annu
al re
port
(2
0-F)
pa
ge re
fere
nce
Com
men
ts
Dis
clos
ure
item
s
GRI I
ndic
ator
Dis
clos
ed
Dis
clos
ed
part
ially
11.1 Global Reporting Initiative Index 139 for Sustainability report 2009
Page 141Nokia sustainability report2009
Navigation bar
Contents 21.0 CEO’s Message 3 2.0 Nokia in 2009 63.0 About the report 94.0 Employees 29 5.0 Supply chain 54 6.0 Corporate social investment 64 7.0 Environment 718.0 Operation 999.0 Key data 2009 11310.0 Independent Assurance 13311.0 Global Reporting Initiative Index 2009 138
11.0GRI Index for 2009
11.1GRI Index for Sustainability report 2009 (continued)
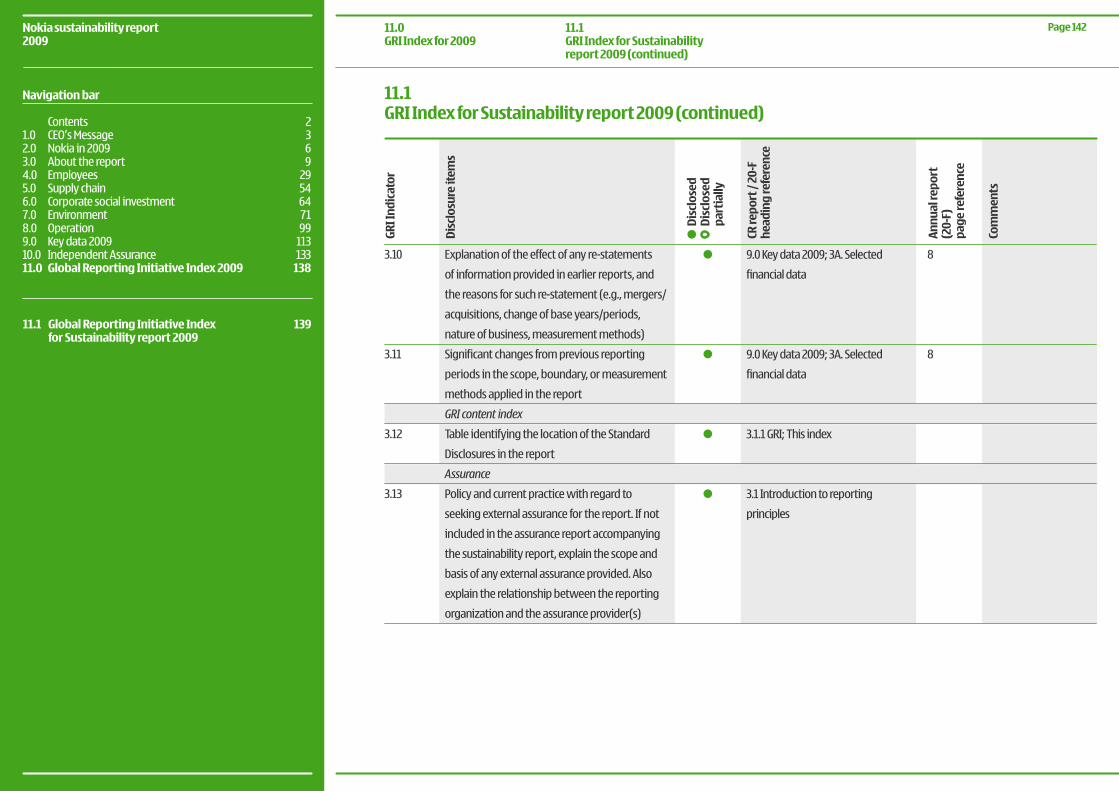
3.10
3.11
3.12
3.13
8
8
Explanation of the effect of any re-statements
of information provided in earlier reports, and
the reasons for such re-statement (e.g., mergers/
acquisitions, change of base years/periods,
nature of business, measurement methods)
Significant changes from previous reporting
periods in the scope, boundary, or measurement
methods applied in the report
GRI content index
Table identifying the location of the Standard
Disclosures in the report
Assurance
Policy and current practice with regard to
seeking external assurance for the report. If not
included in the assurance report accompanying
the sustainability report, explain the scope and
basis of any external assurance provided. Also
explain the relationship between the reporting
organization and the assurance provider(s)
9.0Keydata2009;3A.Selected
financial data
9.0Keydata2009;3A.Selected
financial data
3.1.1GRI;Thisindex
3.1 Introduction to reporting
principles
11.1GRI Index for Sustainability report 2009 (continued)
CR re
port
/ 20
-F
head
ing
refe
renc
e
Annu
al re
port
(2
0-F)
pa
ge re
fere
nce
Com
men
ts
Dis
clos
ure
item
s
GRI I
ndic
ator
Dis
clos
ed
Dis
clos
ed
part
ially
11.1 Global Reporting Initiative Index 139 for Sustainability report 2009
Page 142Nokia sustainability report2009
Navigation bar
Contents 21.0 CEO’s Message 3 2.0 Nokia in 2009 63.0 About the report 94.0 Employees 29 5.0 Supply chain 54 6.0 Corporate social investment 64 7.0 Environment 718.0 Operation 999.0 Key data 2009 11310.0 Independent Assurance 13311.0 Global Reporting Initiative Index 2009 138
11.0GRI Index for 2009
11.1GRI Index for Sustainability report 2009 (continued)
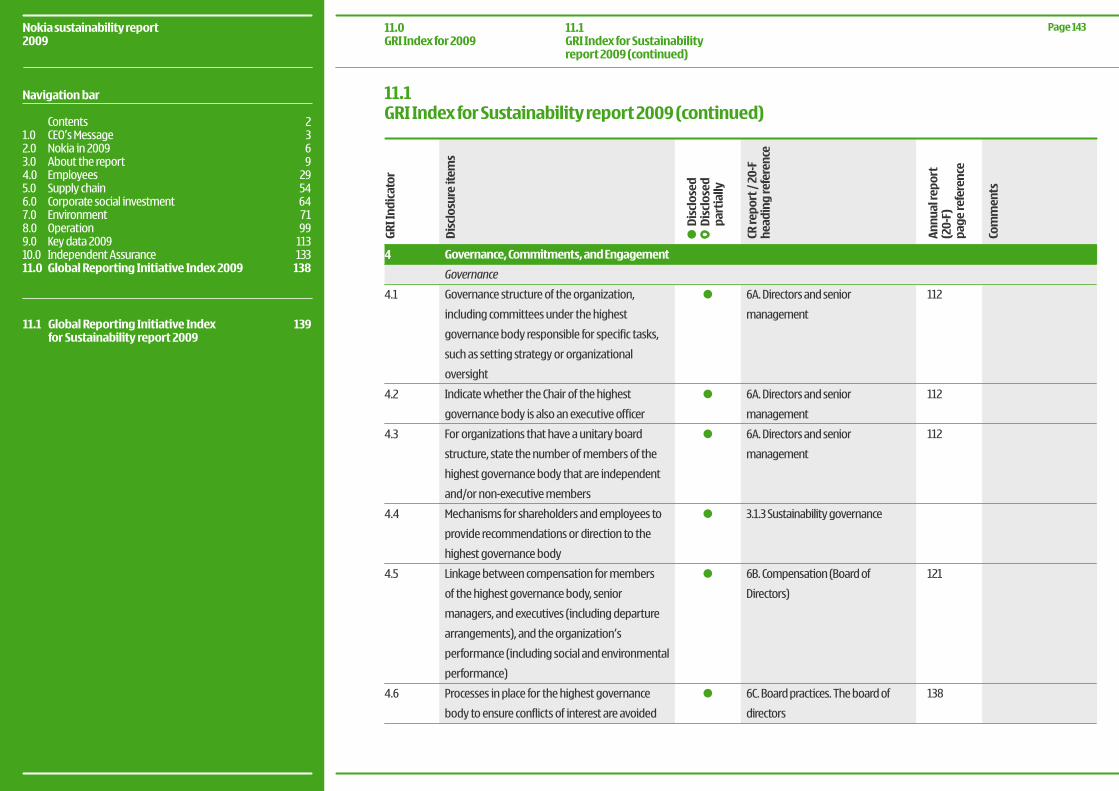
112
112
112
121
138
CR re
port
/ 20
-F
head
ing
refe
renc
e
Annu
al re
port
(2
0-F)
pa
ge re
fere
nce
Com
men
ts
Dis
clos
ure
item
s
GRI I
ndic
ator
Dis
clos
ed
Dis
clos
ed
part
ially
Governance, Commitments, and Engagement
Governance
Governance structure of the organization,
including committees under the highest
governance body responsible for specific tasks,
such as setting strategy or organizational
oversight
Indicate whether the Chair of the highest
governance body is also an executive officer
For organizations that have a unitary board
structure, state the number of members of the
highest governance body that are independent
and/or non-executive members
Mechanisms for shareholders and employees to
provide recommendations or direction to the
highest governance body
Linkage between compensation for members
of the highest governance body, senior
managers, and executives (including departure
arrangements), and the organization’s
performance (including social and environmental
performance)
Processes in place for the highest governance
body to ensure conflicts of interest are avoided
4
4.1
4.2
4.3
4.4
4.5
4.6
6A. Directors and senior
management
6A. Directors and senior
management
6A. Directors and senior
management
3.1.3 Sustainability governance
6B. Compensation (Board of
Directors)
6C. Board practices. The board of
directors
11.1GRI Index for Sustainability report 2009 (continued)
11.1 Global Reporting Initiative Index 139 for Sustainability report 2009
Page 143Nokia sustainability report2009
Navigation bar
Contents 21.0 CEO’s Message 3 2.0 Nokia in 2009 63.0 About the report 94.0 Employees 29 5.0 Supply chain 54 6.0 Corporate social investment 64 7.0 Environment 718.0 Operation 999.0 Key data 2009 11310.0 Independent Assurance 13311.0 Global Reporting Initiative Index 2009 138
11.0GRI Index for 2009
11.1GRI Index for Sustainability report 2009 (continued)
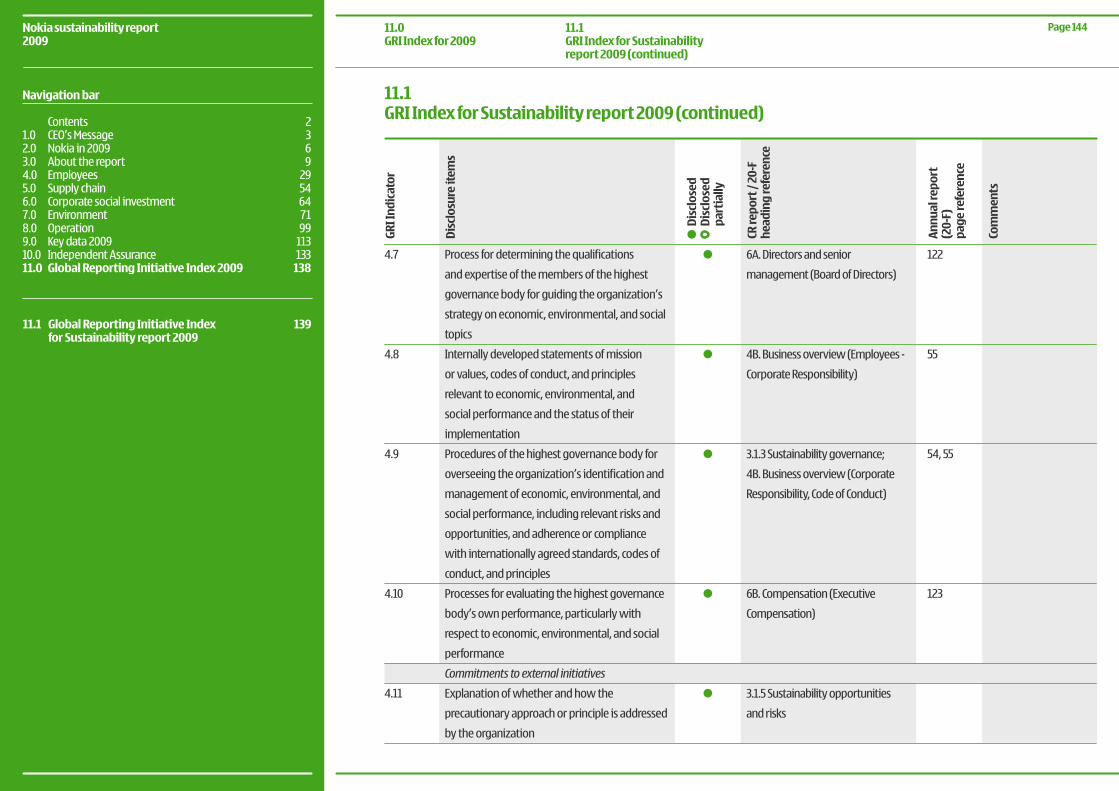
4.7
4.8
4.9
4.10
4.11
122
55
54, 55
123
Process for determining the qualifications
and expertise of the members of the highest
governance body for guiding the organization’s
strategy on economic, environmental, and social
topics
Internally developed statements of mission
or values, codes of conduct, and principles
relevant to economic, environmental, and
social performance and the status of their
implementation
Procedures of the highest governance body for
overseeing the organization’s identification and
management of economic, environmental, and
social performance, including relevant risks and
opportunities, and adherence or compliance
with internationally agreed standards, codes of
conduct, and principles
Processes for evaluating the highest governance
body’s own performance, particularly with
respect to economic, environmental, and social
performance
Commitments to external initiatives
Explanation of whether and how the
precautionary approach or principle is addressed
by the organization
6A. Directors and senior
management (Board of Directors)
4B. Business overview (Employees -
Corporate Responsibility)
3.1.3Sustainabilitygovernance;
4B. Business overview (Corporate
Responsibility, Code of Conduct)
6B. Compensation (Executive
Compensation)
3.1.5 Sustainability opportunities
and risks
CR re
port
/ 20
-F
head
ing
refe
renc
e
Annu
al re
port
(2
0-F)
pa
ge re
fere
nce
Com
men
ts
Dis
clos
ure
item
s
GRI I
ndic
ator
Dis
clos
ed
Dis
clos
ed
part
ially
11.1GRI Index for Sustainability report 2009 (continued)
11.1 Global Reporting Initiative Index 139 for Sustainability report 2009
Page 144Nokia sustainability report2009
Navigation bar
Contents 21.0 CEO’s Message 3 2.0 Nokia in 2009 63.0 About the report 94.0 Employees 29 5.0 Supply chain 54 6.0 Corporate social investment 64 7.0 Environment 718.0 Operation 999.0 Key data 2009 11310.0 Independent Assurance 13311.0 Global Reporting Initiative Index 2009 138
11.0GRI Index for 2009
11.1GRI Index for Sustainability report 2009 (continued)
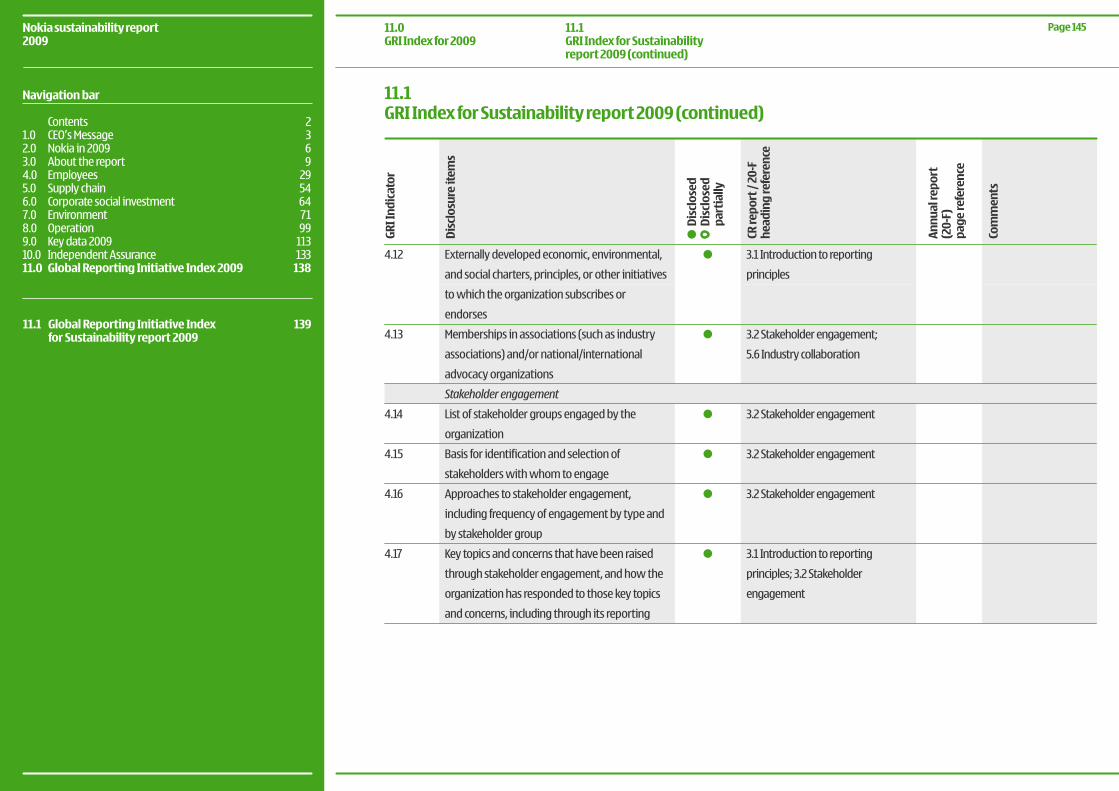
4.12
4.13
4.14
4.15
4.16
4.17
Externally developed economic, environmental,
and social charters, principles, or other initiatives
to which the organization subscribes or
endorses
Memberships in associations (such as industry
associations) and/or national/international
advocacy organizations
Stakeholder engagement
List of stakeholder groups engaged by the
organization
Basis for identification and selection of
stakeholders with whom to engage
Approaches to stakeholder engagement,
including frequency of engagement by type and
by stakeholder group
Key topics and concerns that have been raised
through stakeholder engagement, and how the
organization has responded to those key topics
and concerns, including through its reporting
3.1 Introduction to reporting
principles
3.2Stakeholderengagement;
5.6 Industry collaboration
3.2 Stakeholder engagement
3.2 Stakeholder engagement
3.2 Stakeholder engagement
3.1 Introduction to reporting
principles;3.2Stakeholder
engagement
CR re
port
/ 20
-F
head
ing
refe
renc
e
Annu
al re
port
(2
0-F)
pa
ge re
fere
nce
Com
men
ts
Dis
clos
ure
item
s
GRI I
ndic
ator
Dis
clos
ed
Dis
clos
ed
part
ially
11.1GRI Index for Sustainability report 2009 (continued)
11.1 Global Reporting Initiative Index 139 for Sustainability report 2009
Page 145Nokia sustainability report2009
Navigation bar
Contents 21.0 CEO’s Message 3 2.0 Nokia in 2009 63.0 About the report 94.0 Employees 29 5.0 Supply chain 54 6.0 Corporate social investment 64 7.0 Environment 718.0 Operation 999.0 Key data 2009 11310.0 Independent Assurance 13311.0 Global Reporting Initiative Index 2009 138
11.0GRI Index for 2009
11.1GRI Index for Sustainability report 2009 (continued)
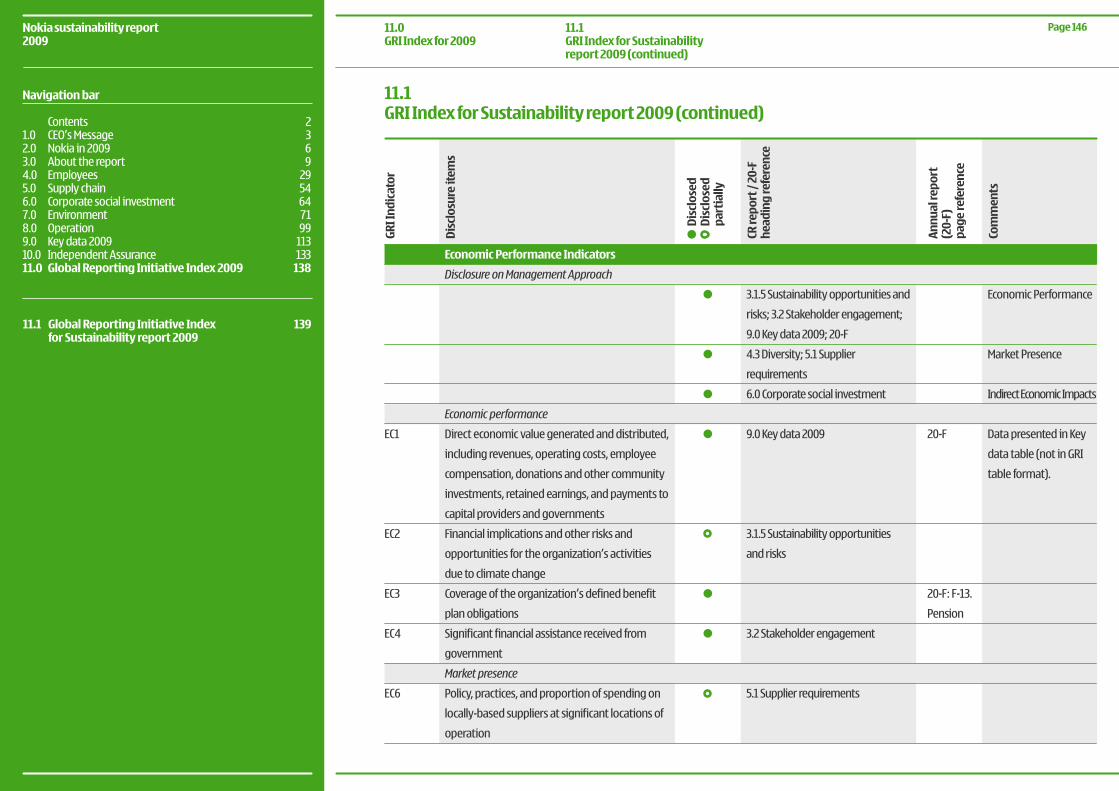
EC1
EC2
EC3
EC4
EC6
20-F
20-F: F-13.
Pension
3.1.5 Sustainability opportunities and
risks;3.2Stakeholderengagement;
9.0Keydata2009;20-F
4.3Diversity;5.1Supplier
requirements
6.0 Corporate social investment
9.0 Key data 2009
3.1.5 Sustainability opportunities
and risks
3.2 Stakeholder engagement
5.1 Supplier requirements
Economic Performance
Market Presence
Indirect Economic Impacts
Data presented in Key
data table (not in GRI
table format).
CR re
port
/ 20
-F
head
ing
refe
renc
e
Annu
al re
port
(2
0-F)
pa
ge re
fere
nce
Com
men
ts
Dis
clos
ure
item
s
GRI I
ndic
ator
Dis
clos
ed
Dis
clos
ed
part
ially
Economic Performance Indicators
Disclosure on Management Approach
Economic performance
Direct economic value generated and distributed,
including revenues, operating costs, employee
compensation, donations and other community
investments, retained earnings, and payments to
capital providers and governments
Financial implications and other risks and
opportunities for the organization’s activities
due to climate change
Coverage of the organization’s defined benefit
plan obligations
Significant financial assistance received from
government
Market presence
Policy, practices, and proportion of spending on
locally-based suppliers at significant locations of
operation
11.1GRI Index for Sustainability report 2009 (continued)
11.1 Global Reporting Initiative Index 139 for Sustainability report 2009
Page 146Nokia sustainability report2009
Navigation bar
Contents 21.0 CEO’s Message 3 2.0 Nokia in 2009 63.0 About the report 94.0 Employees 29 5.0 Supply chain 54 6.0 Corporate social investment 64 7.0 Environment 718.0 Operation 999.0 Key data 2009 11310.0 Independent Assurance 13311.0 Global Reporting Initiative Index 2009 138
11.0GRI Index for 2009
11.1GRI Index for Sustainability report 2009 (continued)
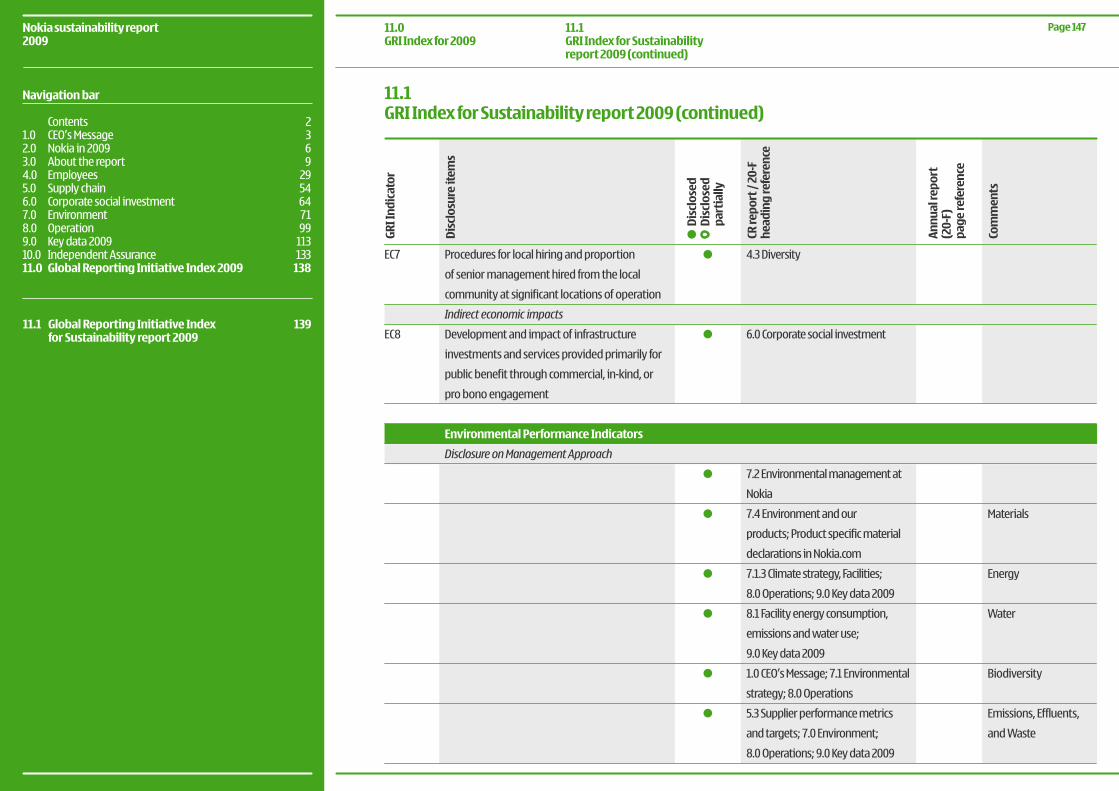
EC7
EC8
4.3 Diversity
6.0 Corporate social investment
7.2 Environmental management at
Nokia
7.4 Environment and our
products;Productspecificmaterial
declarations in Nokia.com
7.1.3Climatestrategy,Facilities;
8.0Operations;9.0Keydata2009
8.1 Facility energy consumption,
emissionsandwateruse;
9.0 Key data 2009
1.0CEO’sMessage;7.1Environmental
strategy;8.0Operations
5.3 Supplier performance metrics
andtargets;7.0Environment;
8.0Operations;9.0Keydata2009
Materials
Energy
Water
Biodiversity
Emissions, Effluents,
and Waste
CR re
port
/ 20
-F
head
ing
refe
renc
e
Annu
al re
port
(2
0-F)
pa
ge re
fere
nce
Com
men
ts
Dis
clos
ure
item
s
GRI I
ndic
ator
Dis
clos
ed
Dis
clos
ed
part
ially
Procedures for local hiring and proportion
of senior management hired from the local
community at significant locations of operation
Indirect economic impacts
Development and impact of infrastructure
investments and services provided primarily for
public benefit through commercial, in-kind, or
pro bono engagement
Environmental Performance Indicators
Disclosure on Management Approach
11.1GRI Index for Sustainability report 2009 (continued)
11.1 Global Reporting Initiative Index 139 for Sustainability report 2009
Page 147Nokia sustainability report2009
Navigation bar
Contents 21.0 CEO’s Message 3 2.0 Nokia in 2009 63.0 About the report 94.0 Employees 29 5.0 Supply chain 54 6.0 Corporate social investment 64 7.0 Environment 718.0 Operation 999.0 Key data 2009 11310.0 Independent Assurance 13311.0 Global Reporting Initiative Index 2009 138
11.0GRI Index for 2009
11.1GRI Index for Sustainability report 2009 (continued)
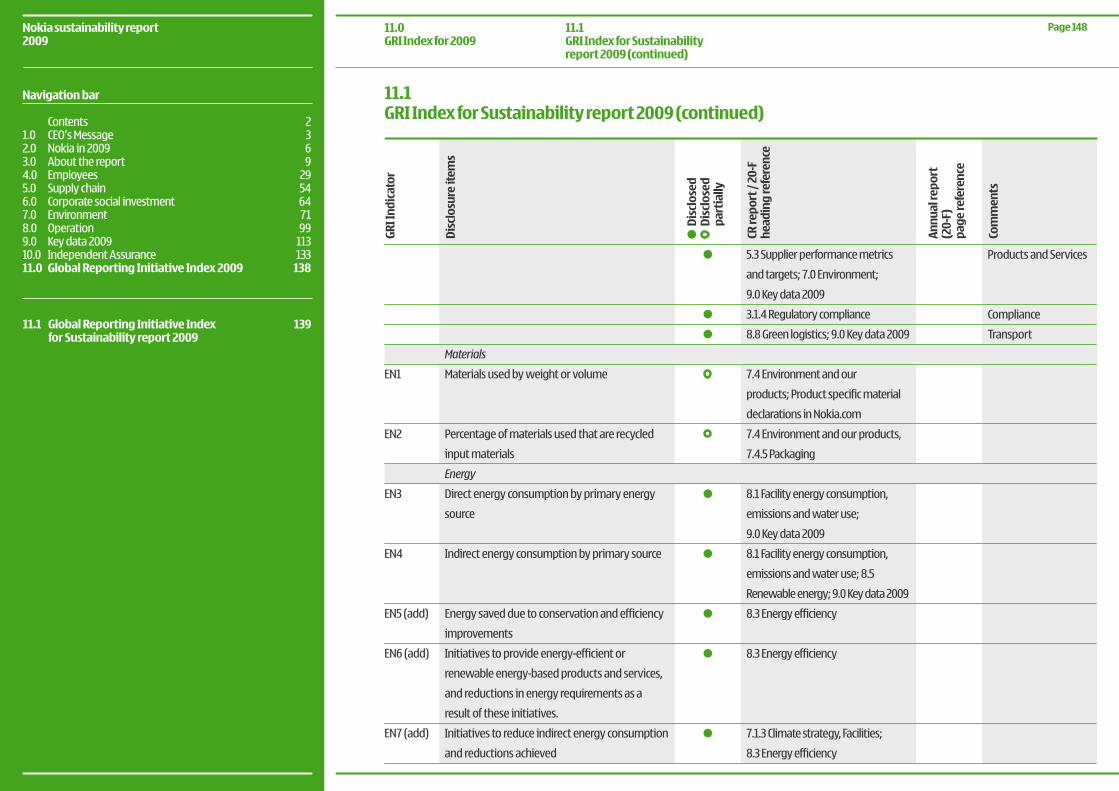
EN1
EN2
EN3
EN4
EN5 (add)
EN6 (add)
EN7 (add)
Materials
Materials used by weight or volume
Percentage of materials used that are recycled
input materials
Energy
Direct energy consumption by primary energy
source
Indirect energy consumption by primary source
Energy saved due to conservation and efficiency
improvements
Initiatives to provide energy-efficient or
renewable energy-based products and services,
and reductions in energy requirements as a
result of these initiatives.
Initiatives to reduce indirect energy consumption
and reductions achieved
5.3 Supplier performance metrics
andtargets;7.0Environment;
9.0 Key data 2009
3.1.4 Regulatory compliance
8.8Greenlogistics;9.0Keydata2009
7.4 Environment and our
products;Productspecificmaterial
declarations in Nokia.com
7.4 Environment and our products,
7.4.5 Packaging
8.1 Facility energy consumption,
emissionsandwateruse;
9.0 Key data 2009
8.1 Facility energy consumption,
emissionsandwateruse;8.5
Renewableenergy;9.0Keydata2009
8.3 Energy efficiency
8.3 Energy efficiency
7.1.3Climatestrategy,Facilities;
8.3 Energy efficiency
Products and Services
Compliance
Transport
CR re
port
/ 20
-F
head
ing
refe
renc
e
Annu
al re
port
(2
0-F)
pa
ge re
fere
nce
Com
men
ts
Dis
clos
ure
item
s
GRI I
ndic
ator
Dis
clos
ed
Dis
clos
ed
part
ially
11.1GRI Index for Sustainability report 2009 (continued)
11.1 Global Reporting Initiative Index 139 for Sustainability report 2009
Page 148Nokia sustainability report2009
Navigation bar
Contents 21.0 CEO’s Message 3 2.0 Nokia in 2009 63.0 About the report 94.0 Employees 29 5.0 Supply chain 54 6.0 Corporate social investment 64 7.0 Environment 718.0 Operation 999.0 Key data 2009 11310.0 Independent Assurance 13311.0 Global Reporting Initiative Index 2009 138
11.0GRI Index for 2009
11.1GRI Index for Sustainability report 2009 (continued)
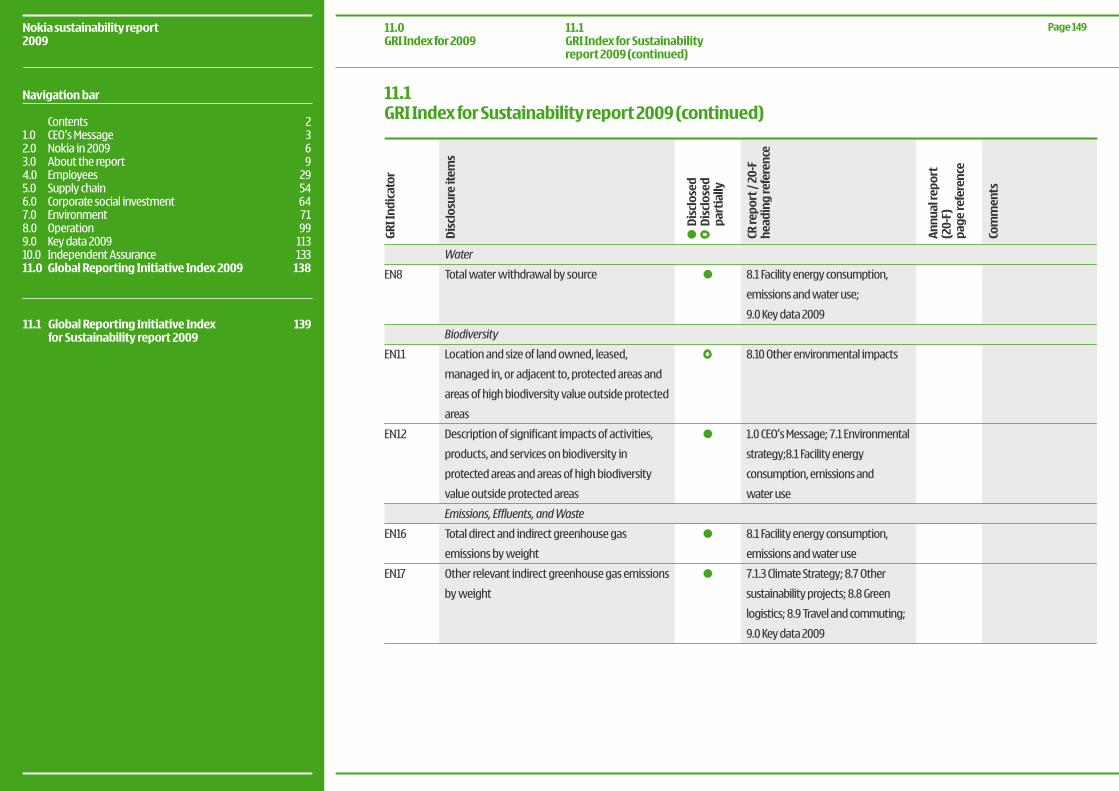
EN8
EN11
EN12
EN16
EN17
Water
Total water withdrawal by source
Biodiversity
Location and size of land owned, leased,
managed in, or adjacent to, protected areas and
areas of high biodiversity value outside protected
areas
Description of significant impacts of activities,
products, and services on biodiversity in
protected areas and areas of high biodiversity
value outside protected areas
Emissions, Effluents, and Waste
Total direct and indirect greenhouse gas
emissions by weight
Other relevant indirect greenhouse gas emissions
by weight
8.1 Facility energy consumption,
emissionsandwateruse;
9.0 Key data 2009
8.10 Other environmental impacts
1.0CEO’sMessage;7.1Environmental
strategy;8.1Facilityenergy
consumption, emissions and
water use
8.1 Facility energy consumption,
emissions and water use
7.1.3ClimateStrategy;8.7Other
sustainabilityprojects;8.8Green
logistics;8.9Travelandcommuting;
9.0 Key data 2009
CR re
port
/ 20
-F
head
ing
refe
renc
e
Annu
al re
port
(2
0-F)
pa
ge re
fere
nce
Com
men
ts
Dis
clos
ure
item
s
GRI I
ndic
ator
Dis
clos
ed
Dis
clos
ed
part
ially
11.1GRI Index for Sustainability report 2009 (continued)
11.1 Global Reporting Initiative Index 139 for Sustainability report 2009
Page 149Nokia sustainability report2009
Navigation bar
Contents 21.0 CEO’s Message 3 2.0 Nokia in 2009 63.0 About the report 94.0 Employees 29 5.0 Supply chain 54 6.0 Corporate social investment 64 7.0 Environment 718.0 Operation 999.0 Key data 2009 11310.0 Independent Assurance 13311.0 Global Reporting Initiative Index 2009 138
11.0GRI Index for 2009
11.1GRI Index for Sustainability report 2009 (continued)
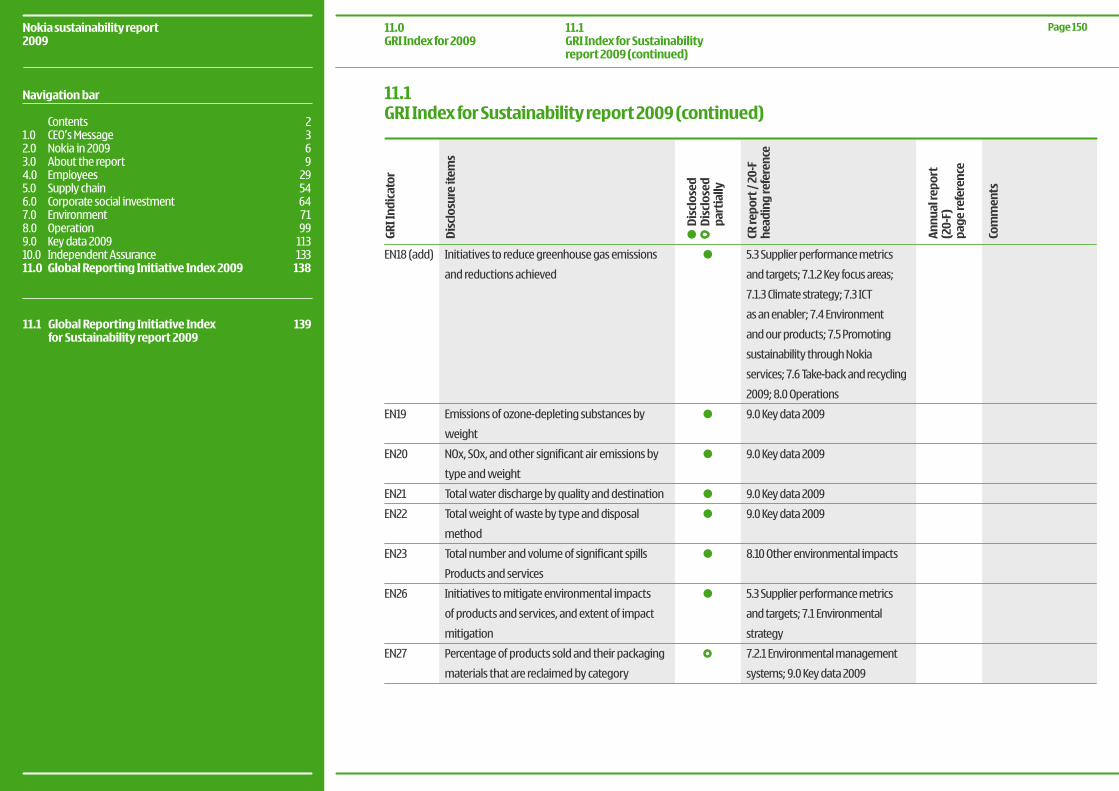
EN18 (add)
EN19
EN20
EN21
EN22
EN23
EN26
EN27
Initiatives to reduce greenhouse gas emissions
and reductions achieved
Emissions of ozone-depleting substances by
weight
NOx, SOx, and other significant air emissions by
type and weight
Total water discharge by quality and destination
Total weight of waste by type and disposal
method
Total number and volume of significant spills
Products and services
Initiatives to mitigate environmental impacts
of products and services, and extent of impact
mitigation
Percentage of products sold and their packaging
materials that are reclaimed by category
5.3 Supplier performance metrics
andtargets;7.1.2Keyfocusareas;
7.1.3Climatestrategy;7.3ICT
asanenabler;7.4Environment
andourproducts;7.5Promoting
sustainability through Nokia
services;7.6Take-backandrecycling
2009;8.0Operations
9.0 Key data 2009
9.0 Key data 2009
9.0 Key data 2009
9.0 Key data 2009
8.10 Other environmental impacts
5.3 Supplier performance metrics
andtargets;7.1Environmental
strategy
7.2.1 Environmental management
systems;9.0Keydata2009
CR re
port
/ 20
-F
head
ing
refe
renc
e
Annu
al re
port
(2
0-F)
pa
ge re
fere
nce
Com
men
ts
Dis
clos
ure
item
s
GRI I
ndic
ator
Dis
clos
ed
Dis
clos
ed
part
ially
11.1GRI Index for Sustainability report 2009 (continued)
11.1 Global Reporting Initiative Index 139 for Sustainability report 2009
Page 150Nokia sustainability report2009
Navigation bar
Contents 21.0 CEO’s Message 3 2.0 Nokia in 2009 63.0 About the report 94.0 Employees 29 5.0 Supply chain 54 6.0 Corporate social investment 64 7.0 Environment 718.0 Operation 999.0 Key data 2009 11310.0 Independent Assurance 13311.0 Global Reporting Initiative Index 2009 138
11.0GRI Index for 2009
11.1GRI Index for Sustainability report 2009 (continued)
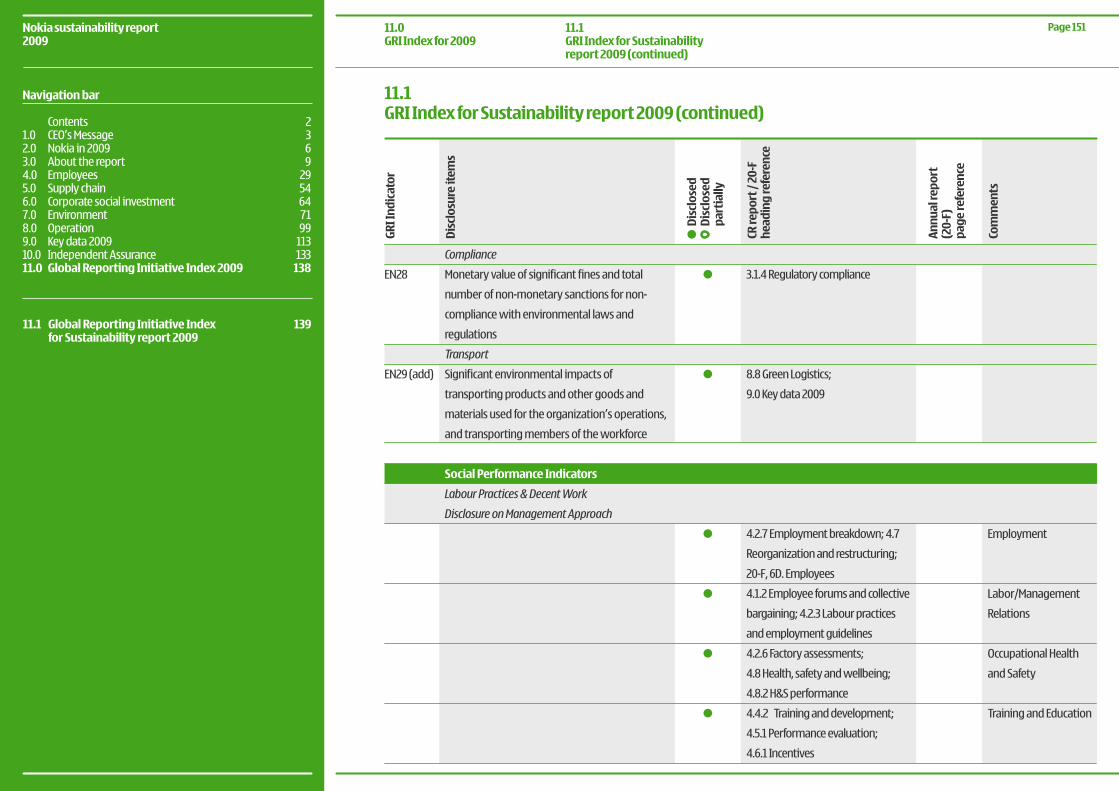
EN28
EN29 (add)
3.1.4 Regulatory compliance
8.8GreenLogistics;
9.0 Key data 2009
4.2.7Employmentbreakdown;4.7
Reorganizationandrestructuring;
20-F, 6D. Employees
4.1.2 Employee forums and collective
bargaining;4.2.3Labourpractices
and employment guidelines
4.2.6Factoryassessments;
4.8Health,safetyandwellbeing;
4.8.2 H&S performance
4.4.2 Traininganddevelopment;
4.5.1Performanceevaluation;
4.6.1 Incentives
Employment
Labor/Management
Relations
Occupational Health
and Safety
Training and Education
CR re
port
/ 20
-F
head
ing
refe
renc
e
Annu
al re
port
(2
0-F)
pa
ge re
fere
nce
Com
men
ts
Dis
clos
ure
item
s
GRI I
ndic
ator
Dis
clos
ed
Dis
clos
ed
part
ially
Compliance
Monetary value of significant fines and total
number of non-monetary sanctions for non-
compliance with environmental laws and
regulations
Transport
Significant environmental impacts of
transporting products and other goods and
materials used for the organization’s operations,
and transporting members of the workforce
Social Performance Indicators
Labour Practices & Decent Work
Disclosure on Management Approach
11.1GRI Index for Sustainability report 2009 (continued)
11.1 Global Reporting Initiative Index 139 for Sustainability report 2009
Page 151Nokia sustainability report2009
Navigation bar
Contents 21.0 CEO’s Message 3 2.0 Nokia in 2009 63.0 About the report 94.0 Employees 29 5.0 Supply chain 54 6.0 Corporate social investment 64 7.0 Environment 718.0 Operation 999.0 Key data 2009 11310.0 Independent Assurance 13311.0 Global Reporting Initiative Index 2009 138
11.0GRI Index for 2009
11.1GRI Index for Sustainability report 2009 (continued)
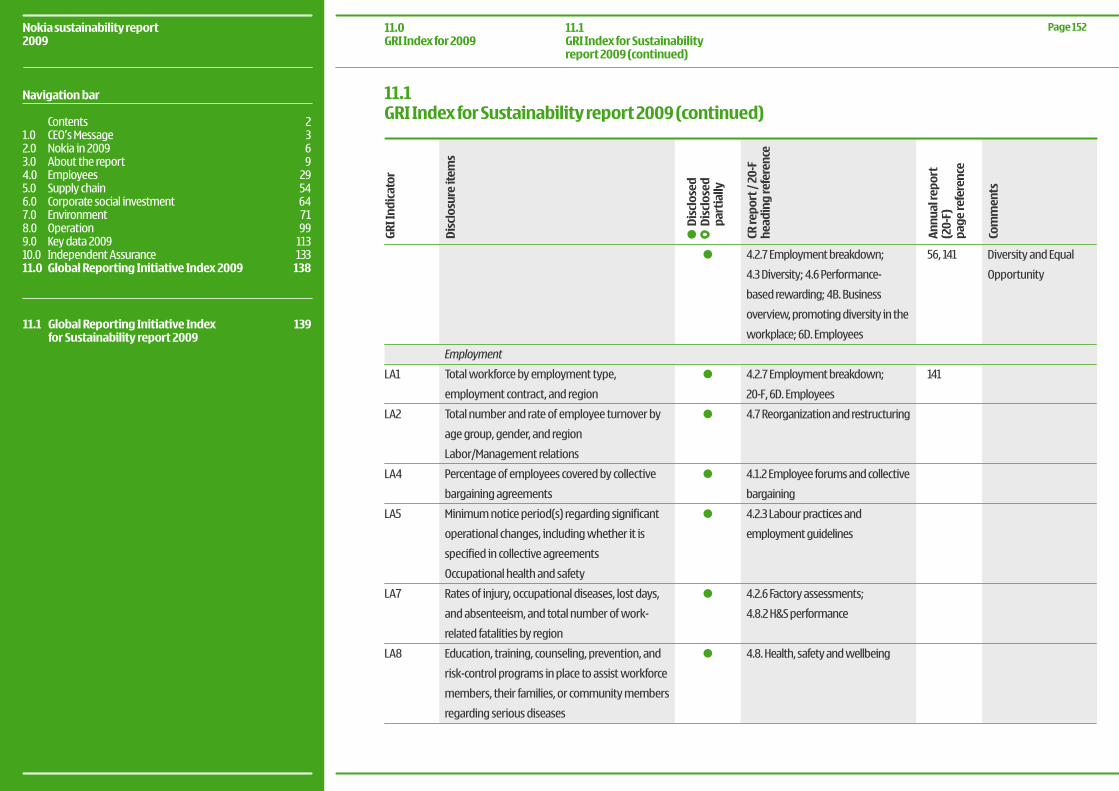
LA1
LA2
LA4
LA5
LA7
LA8
56, 141
141
Employment
Total workforce by employment type,
employment contract, and region
Total number and rate of employee turnover by
age group, gender, and region
Labor/Management relations
Percentage of employees covered by collective
bargaining agreements
Minimum notice period(s) regarding significant
operational changes, including whether it is
specified in collective agreements
Occupational health and safety
Rates of injury, occupational diseases, lost days,
and absenteeism, and total number of work-
related fatalities by region
Education, training, counseling, prevention, and
risk-control programs in place to assist workforce
members, their families, or community members
regarding serious diseases
4.2.7Employmentbreakdown;
4.3Diversity;4.6Performance-
basedrewarding;4B.Business
overview, promoting diversity in the
workplace;6D.Employees
4.2.7Employmentbreakdown;
20-F, 6D. Employees
4.7 Reorganization and restructuring
4.1.2 Employee forums and collective
bargaining
4.2.3 Labour practices and
employment guidelines
4.2.6Factoryassessments;
4.8.2 H&S performance
4.8. Health, safety and wellbeing
Diversity and Equal
Opportunity
CR re
port
/ 20
-F
head
ing
refe
renc
e
Annu
al re
port
(2
0-F)
pa
ge re
fere
nce
Com
men
ts
Dis
clos
ure
item
s
GRI I
ndic
ator
Dis
clos
ed
Dis
clos
ed
part
ially
11.1 Global Reporting Initiative Index 139 for Sustainability report 2009
Page 152Nokia sustainability report2009
Navigation bar
Contents 21.0 CEO’s Message 3 2.0 Nokia in 2009 63.0 About the report 94.0 Employees 29 5.0 Supply chain 54 6.0 Corporate social investment 64 7.0 Environment 718.0 Operation 999.0 Key data 2009 11310.0 Independent Assurance 13311.0 Global Reporting Initiative Index 2009 138
11.1GRI Index for Sustainability report 2009 (continued)
11.0GRI Index for 2009
11.1GRI Index for Sustainability report 2009 (continued)
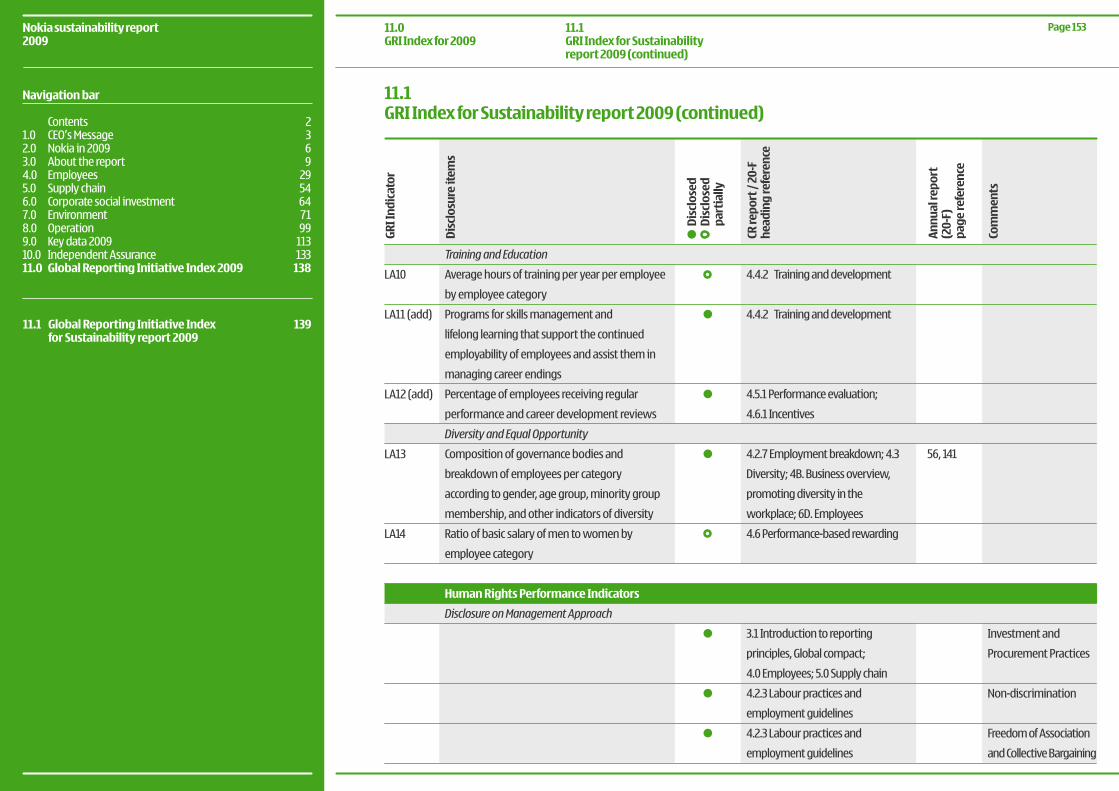
56, 141
4.4.2 Training and development
4.4.2 Training and development
4.5.1Performanceevaluation;
4.6.1 Incentives
4.2.7Employmentbreakdown;4.3
Diversity;4B.Businessoverview,
promoting diversity in the
workplace;6D.Employees
4.6 Performance-based rewarding
3.1 Introduction to reporting
principles,Globalcompact;
4.0Employees;5.0Supplychain
4.2.3 Labour practices and
employment guidelines
4.2.3 Labour practices and
employment guidelines
Investment and
Procurement Practices
Non-discrimination
Freedom of Association
and Collective BargainingCR
repo
rt /
20-F
he
adin
g re
fere
nce
Annu
al re
port
(2
0-F)
pa
ge re
fere
nce
Com
men
ts
Dis
clos
ure
item
s
GRI I
ndic
ator
Dis
clos
ed
Dis
clos
ed
part
ially
Training and Education
Average hours of training per year per employee
by employee category
Programs for skills management and
lifelong learning that support the continued
employability of employees and assist them in
managing career endings
Percentage of employees receiving regular
performance and career development reviews
Diversity and Equal Opportunity
Composition of governance bodies and
breakdown of employees per category
according to gender, age group, minority group
membership, and other indicators of diversity
Ratio of basic salary of men to women by
employee category
Human Rights Performance Indicators
Disclosure on Management Approach
LA10
LA11 (add)
LA12 (add)
LA13
LA14
11.1 Global Reporting Initiative Index 139 for Sustainability report 2009
Page 153Nokia sustainability report2009
Navigation bar
Contents 21.0 CEO’s Message 3 2.0 Nokia in 2009 63.0 About the report 94.0 Employees 29 5.0 Supply chain 54 6.0 Corporate social investment 64 7.0 Environment 718.0 Operation 999.0 Key data 2009 11310.0 Independent Assurance 13311.0 Global Reporting Initiative Index 2009 138
11.1GRI Index for Sustainability report 2009 (continued)
11.0GRI Index for 2009
11.1GRI Index for Sustainability report 2009 (continued)
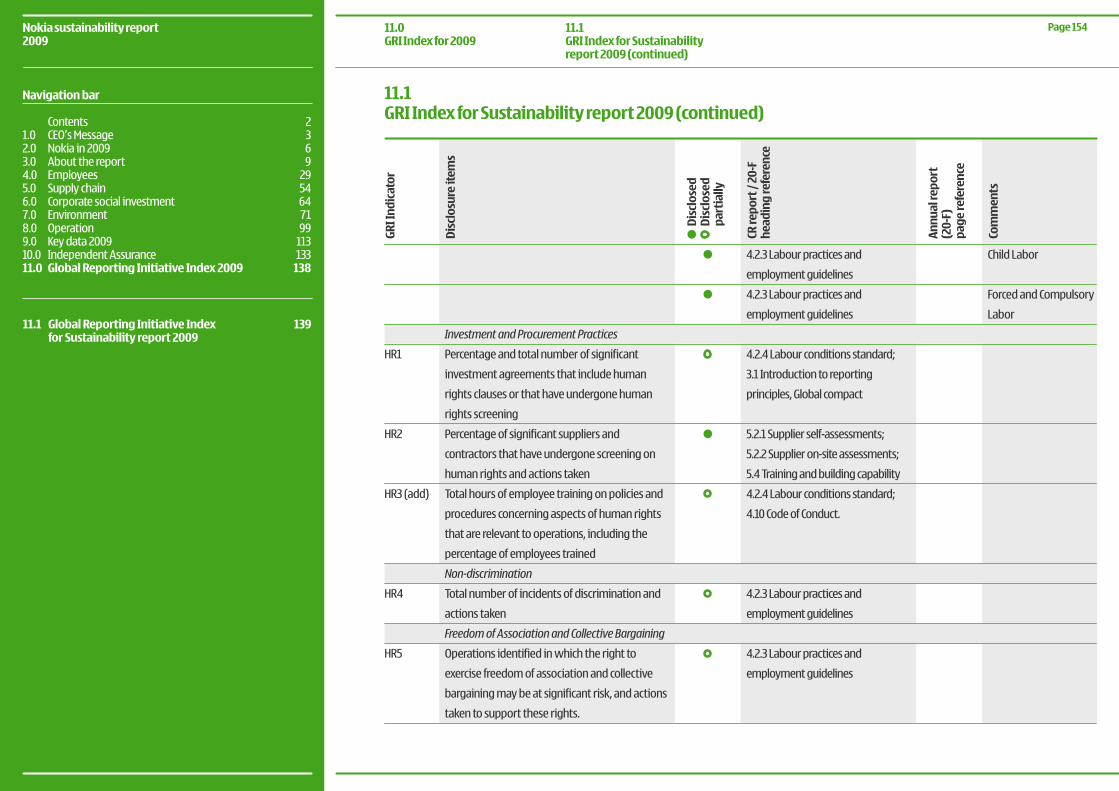
HR1
HR2
HR3 (add)
HR4
HR5
Investment and Procurement Practices
Percentage and total number of significant
investment agreements that include human
rights clauses or that have undergone human
rights screening
Percentage of significant suppliers and
contractors that have undergone screening on
human rights and actions taken
Total hours of employee training on policies and
procedures concerning aspects of human rights
that are relevant to operations, including the
percentage of employees trained
Non-discrimination
Total number of incidents of discrimination and
actions taken
Freedom of Association and Collective Bargaining
Operations identified in which the right to
exercise freedom of association and collective
bargaining may be at significant risk, and actions
taken to support these rights.
4.2.3 Labour practices and
employment guidelines
4.2.3 Labour practices and
employment guidelines
4.2.4Labourconditionsstandard;
3.1 Introduction to reporting
principles, Global compact
5.2.1Supplierself-assessments;
5.2.2Supplieron-siteassessments;
5.4 Training and building capability
4.2.4Labourconditionsstandard;
4.10 Code of Conduct.
4.2.3 Labour practices and
employment guidelines
4.2.3 Labour practices and
employment guidelines
Child Labor
Forced and Compulsory
Labor
CR re
port
/ 20
-F
head
ing
refe
renc
e
Annu
al re
port
(2
0-F)
pa
ge re
fere
nce
Com
men
ts
Dis
clos
ure
item
s
GRI I
ndic
ator
Dis
clos
ed
Dis
clos
ed
part
ially
11.1GRI Index for Sustainability report 2009 (continued)
11.1 Global Reporting Initiative Index 139 for Sustainability report 2009
11.0GRI Index for 2009
11.1GRI Index for Sustainability report 2009 (continued)
Page 154Nokia sustainability report2009
Navigation bar
Contents 21.0 CEO’s Message 3 2.0 Nokia in 2009 63.0 About the report 94.0 Employees 29 5.0 Supply chain 54 6.0 Corporate social investment 64 7.0 Environment 718.0 Operation 999.0 Key data 2009 11310.0 Independent Assurance 13311.0 Global Reporting Initiative Index 2009 138
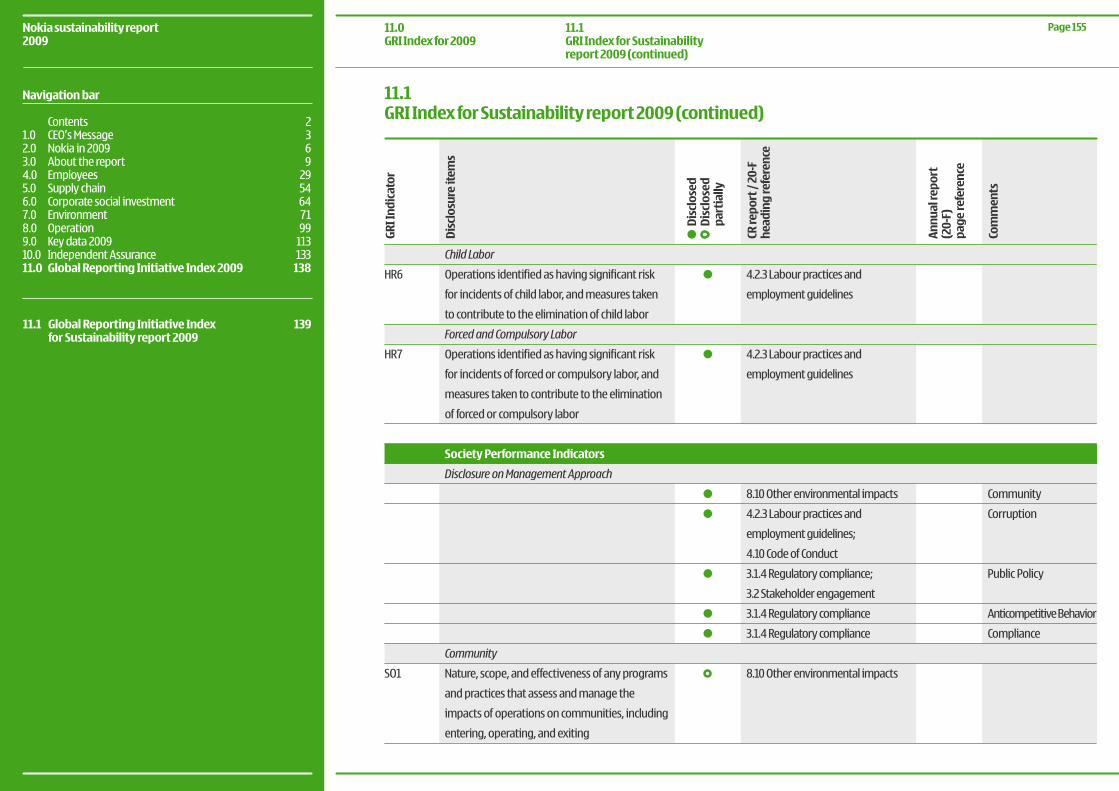
11.1 Global Reporting Initiative Index 139 for Sustainability report 2009
HR6
HR7
SO1
4.2.3 Labour practices and
employment guidelines
4.2.3 Labour practices and
employment guidelines
8.10 Other environmental impacts
4.2.3 Labour practices and
employmentguidelines;
4.10 Code of Conduct
3.1.4Regulatorycompliance;
3.2 Stakeholder engagement
3.1.4 Regulatory compliance
3.1.4 Regulatory compliance
8.10 Other environmental impacts
Community
Corruption
Public Policy
Anticompetitive Behavior
Compliance
CR re
port
/ 20
-F
head
ing
refe
renc
e
Annu
al re
port
(2
0-F)
pa
ge re
fere
nce
Com
men
ts
Dis
clos
ure
item
s
GRI I
ndic
ator
Dis
clos
ed
Dis
clos
ed
part
ially
Child Labor
Operations identified as having significant risk
for incidents of child labor, and measures taken
to contribute to the elimination of child labor
Forced and Compulsory Labor
Operations identified as having significant risk
for incidents of forced or compulsory labor, and
measures taken to contribute to the elimination
of forced or compulsory labor
Society Performance Indicators
Disclosure on Management Approach
Community
Nature, scope, and effectiveness of any programs
and practices that assess and manage the
impacts of operations on communities, including
entering, operating, and exiting
11.1GRI Index for Sustainability report 2009 (continued)
11.0GRI Index for 2009
11.1GRI Index for Sustainability report 2009 (continued)
Page 155Nokia sustainability report2009
Navigation bar
Contents 21.0 CEO’s Message 3 2.0 Nokia in 2009 63.0 About the report 94.0 Employees 29 5.0 Supply chain 54 6.0 Corporate social investment 64 7.0 Environment 718.0 Operation 999.0 Key data 2009 11310.0 Independent Assurance 13311.0 Global Reporting Initiative Index 2009 138
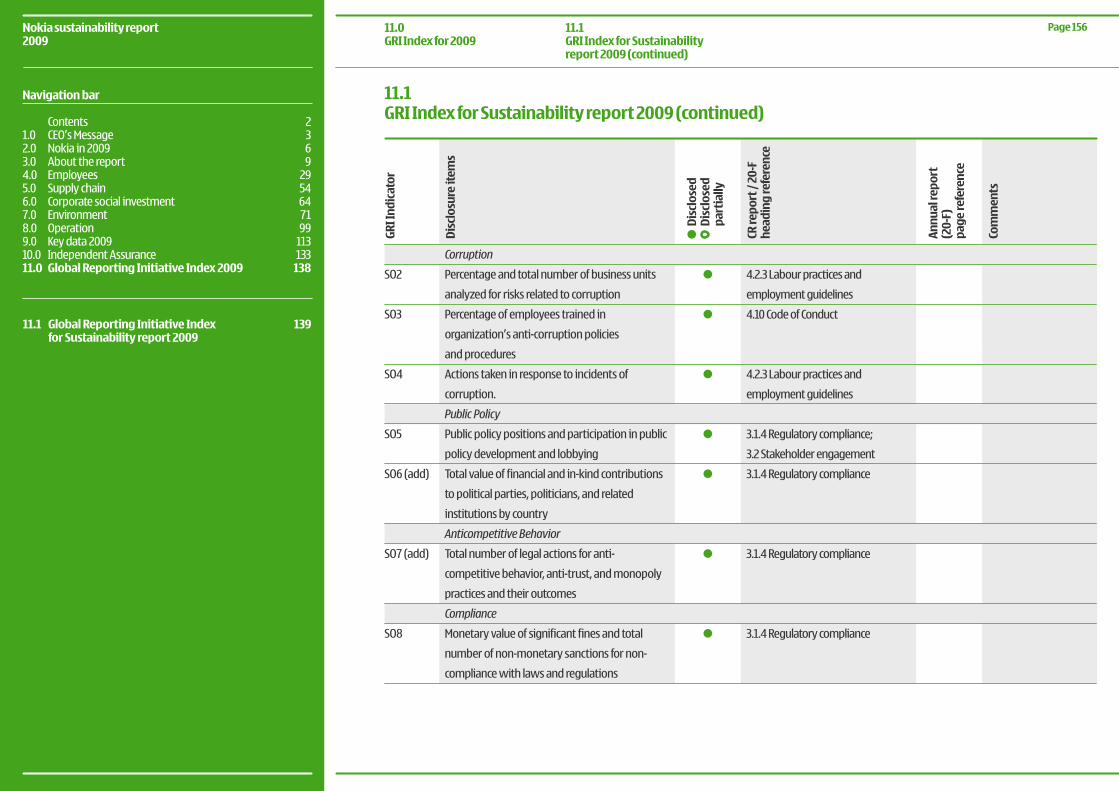
SO2
SO3
SO4
SO5
SO6 (add)
SO7 (add)
SO8
Corruption
Percentage and total number of business units
analyzed for risks related to corruption
Percentage of employees trained in
organization’s anti-corruption policies
and procedures
Actions taken in response to incidents of
corruption.
Public Policy
Public policy positions and participation in public
policy development and lobbying
Total value of financial and in-kind contributions
to political parties, politicians, and related
institutions by country
Anticompetitive Behavior
Total number of legal actions for anti-
competitive behavior, anti-trust, and monopoly
practices and their outcomes
Compliance
Monetary value of significant fines and total
number of non-monetary sanctions for non-
compliance with laws and regulations
4.2.3 Labour practices and
employment guidelines
4.10 Code of Conduct
4.2.3 Labour practices and
employment guidelines
3.1.4Regulatorycompliance;
3.2 Stakeholder engagement
3.1.4 Regulatory compliance
3.1.4 Regulatory compliance
3.1.4 Regulatory compliance
CR re
port
/ 20
-F
head
ing
refe
renc
e
Annu
al re
port
(2
0-F)
pa
ge re
fere
nce
Com
men
ts
Dis
clos
ure
item
s
GRI I
ndic
ator
Dis
clos
ed
Dis
clos
ed
part
ially
11.1 Global Reporting Initiative Index 139 for Sustainability report 2009
Page 156Nokia sustainability report2009
Navigation bar
Contents 21.0 CEO’s Message 3 2.0 Nokia in 2009 63.0 About the report 94.0 Employees 29 5.0 Supply chain 54 6.0 Corporate social investment 64 7.0 Environment 718.0 Operation 999.0 Key data 2009 11310.0 Independent Assurance 13311.0 Global Reporting Initiative Index 2009 138
11.1GRI Index for Sustainability report 2009 (continued)
11.0GRI Index for 2009
11.1GRI Index for Sustainability report 2009 (continued)
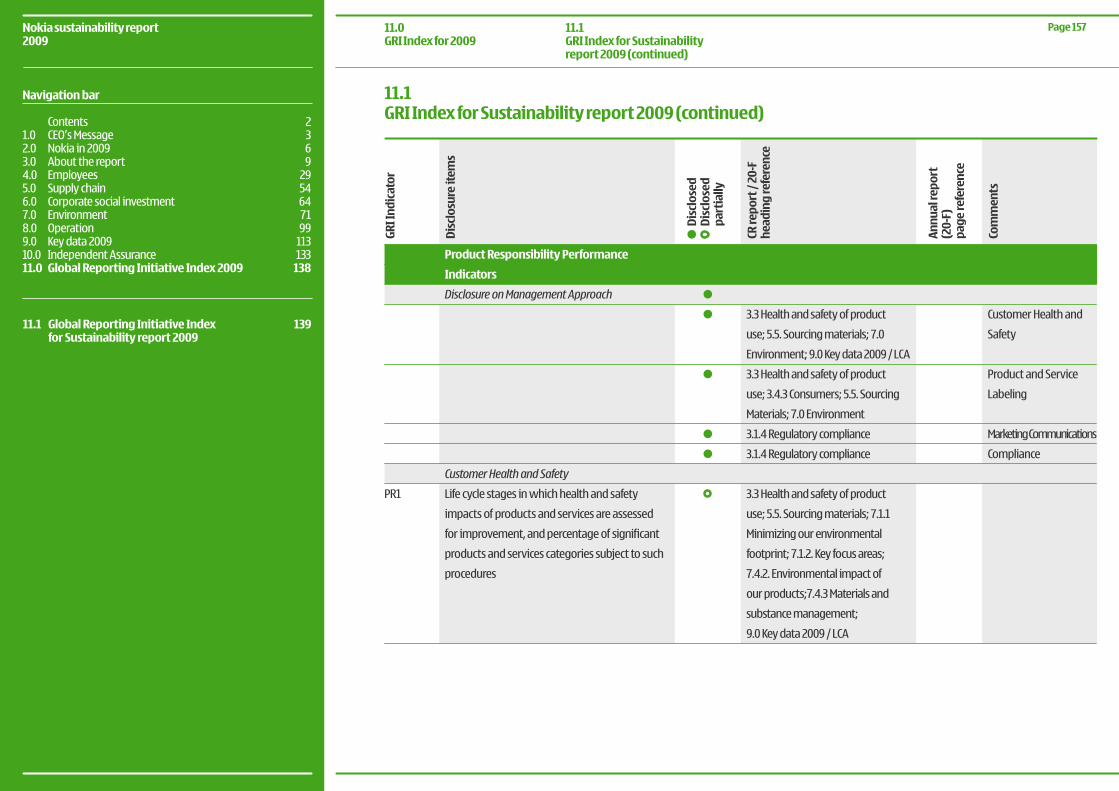
PR1
Customer Health and
Safety
Product and Service
Labeling
Marketing Communications
Compliance
CR re
port
/ 20
-F
head
ing
refe
renc
e
Annu
al re
port
(2
0-F)
pa
ge re
fere
nce
Com
men
ts
Dis
clos
ure
item
s
GRI I
ndic
ator
Dis
clos
ed
Dis
clos
ed
part
ially
Product Responsibility Performance
Indicators
Disclosure on Management Approach
Customer Health and Safety
Life cycle stages in which health and safety
impacts of products and services are assessed
for improvement, and percentage of significant
products and services categories subject to such
procedures
3.3 Health and safety of product
use;5.5.Sourcingmaterials;7.0
Environment;9.0Keydata2009/LCA
3.3 Health and safety of product
use;3.4.3Consumers;5.5.Sourcing
Materials;7.0Environment
3.1.4 Regulatory compliance
3.1.4 Regulatory compliance
3.3 Health and safety of product
use;5.5.Sourcingmaterials;7.1.1
Minimizing our environmental
footprint;7.1.2.Keyfocusareas;
7.4.2. Environmental impact of
ourproducts;7.4.3Materialsand
substancemanagement;
9.0 Key data 2009 / LCA
11.1GRI Index for Sustainability report 2009 (continued)
11.1 Global Reporting Initiative Index 139 for Sustainability report 2009
11.0GRI Index for 2009
11.1GRI Index for Sustainability report 2009 (continued)
Page 157Nokia sustainability report2009
Navigation bar
Contents 21.0 CEO’s Message 3 2.0 Nokia in 2009 63.0 About the report 94.0 Employees 29 5.0 Supply chain 54 6.0 Corporate social investment 64 7.0 Environment 718.0 Operation 999.0 Key data 2009 11310.0 Independent Assurance 13311.0 Global Reporting Initiative Index 2009 138
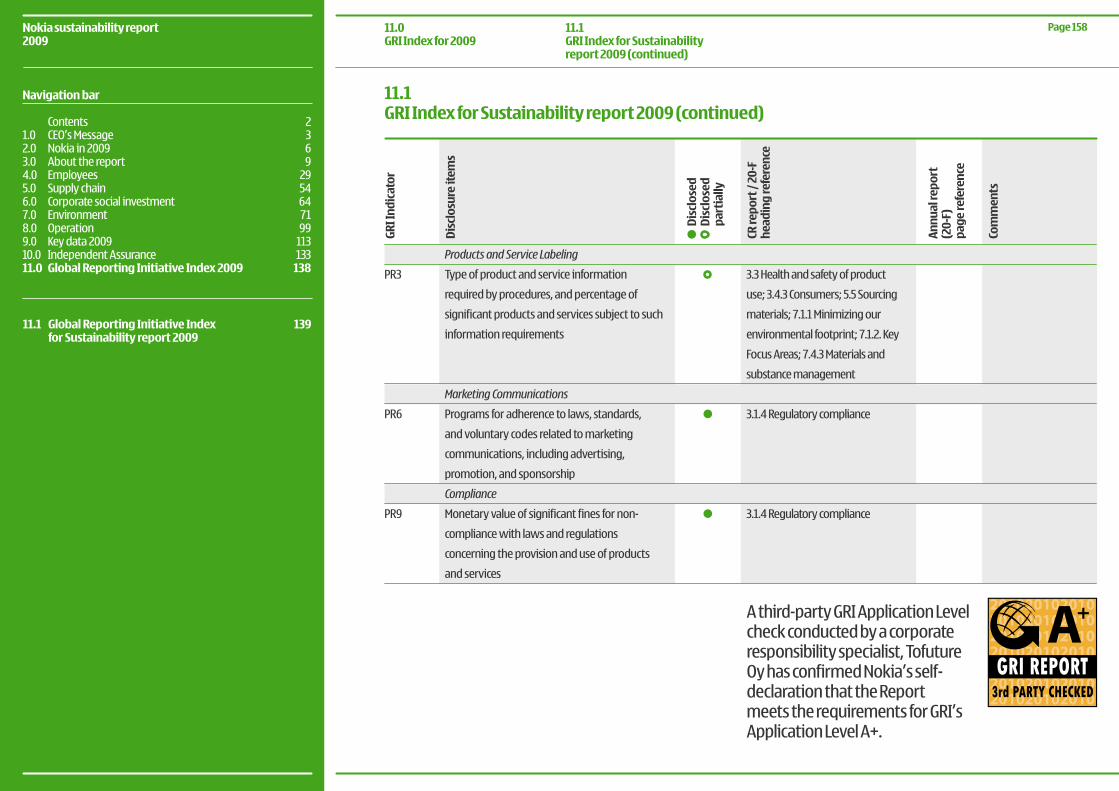
PR3
PR6
PR9
Products and Service Labeling
Type of product and service information
required by procedures, and percentage of
significant products and services subject to such
information requirements
Marketing Communications
Programs for adherence to laws, standards,
and voluntary codes related to marketing
communications, including advertising,
promotion, and sponsorship
Compliance
Monetary value of significant fines for non-
compliance with laws and regulations
concerning the provision and use of products
and services
3.3 Health and safety of product
use;3.4.3Consumers;5.5Sourcing
materials;7.1.1Minimizingour
environmentalfootprint;7.1.2.Key
FocusAreas;7.4.3Materialsand
substance management
3.1.4 Regulatory compliance
3.1.4 Regulatory compliance
CR re
port
/ 20
-F
head
ing
refe
renc
e
Annu
al re
port
(2
0-F)
pa
ge re
fere
nce
Com
men
ts
Dis
clos
ure
item
s
GRI I
ndic
ator
Dis
clos
ed
Dis
clos
ed
part
ially
11.1GRI Index for Sustainability report 2009 (continued)
11.1 Global Reporting Initiative Index 139 for Sustainability report 2009
11.0GRI Index for 2009
11.1GRI Index for Sustainability report 2009 (continued)
A third-party GRI Application Level check conducted by a corporate responsibility specialist, Tofuture Oy has confirmed Nokia’s self-declaration that the Report meets the requirements for GRI’s Application Level A+.
Page 158Nokia sustainability report2009
Navigation bar
Contents 21.0 CEO’s Message 3 2.0 Nokia in 2009 63.0 About the report 94.0 Employees 29 5.0 Supply chain 54 6.0 Corporate social investment 64 7.0 Environment 718.0 Operation 999.0 Key data 2009 11310.0 Independent Assurance 13311.0 Global Reporting Initiative Index 2009 138